


Abstract
Pasture ecosystems are a key component of livestock production in arid and semi-arid regions, where forage availability and nutritive value are often associated with animal performance under grazing conditions. This study aimed to provide an exploratory assessment of pasture productivity, forage nutritive value, and beef cattle productivity across contrasting natural–climatic settings in Kazakhstan. The study was conducted under commercial production conditions on five farms representing different grazing environments during the 2024–2025 grazing seasons. Because each zone was represented by a single farm, the study should be interpreted as an observational assessment of farm-level patterns rather than as a fully replicated experimental comparison. Pasture productivity and forage chemical composition, including crude protein, fiber, and dry matter content, varied among farms and seasons. Average daily gain ranged from 316.7 to 900 g day−1 depending on the study site and year of observation. Exploratory statistical analyses indicated variability among the studied systems; however, pairwise comparisons did not reveal statistically significant differences in animal productivity among farms (p > 0.05). Correlation analyses revealed moderate positive associations between average daily gain, crude protein content, and pasture yield, although these relationships were not statistically significant after adjustment for multiple comparisons. Similarly, linear models incorporating forage nutritive value indicators and study site did not identify statistically significant predictors of animal productivity within the current dataset. Overall, the results describe patterns of variation in pasture characteristics and animal productivity observed under extensive grazing conditions in continental environments. Given the observational design and limited replication at the farm level, the findings should be interpreted cautiously and regarded as preliminary. The study provides baseline information for future investigations of pasture–livestock interactions in arid and semi-arid grazing environments.
1. Introduction
Pasture ecosystems play a fundamental role in supporting livestock production in regions with extensive natural landscapes, where grazing systems remain the primary source of feed. In Kazakhstan, pastures occupy a substantial proportion of the land fund and form the basis of beef cattle farms. Under arid and sharply continental climatic conditions, variability in pasture productivity and forage nutritive value represents an important challenge associated with animal performance and the sustainability of livestock production [1,2,3,4,5].
Kazakhstan represents a unique natural–climatic gradient, including desert, semi-desert, steppe, forest-steppe, and mountain environments, characterized by strong differences in precipitation, temperature regimes, vegetation structure, and length of the growing season. This diversity provides a suitable framework for examining variation in pasture characteristics and animal productivity across different natural–climatic conditions under real production settings. In particular, gradients in moisture availability and vegetation composition across zones are associated with substantial variation in both forage quantity and nutritive value [6,7,8,9,10].
However, pasture biomass alone does not fully reflect its feeding value. Animal productivity under grazing conditions depends not only on total herbage availability but also on forage nutritive value, intake, and grazing selectivity. Nutritional components such as crude protein and fiber influence digestibility and voluntary intake, thereby affecting energy and nutrient supply to animals [11,12,13,14]. In low-quality pastures, insufficient crude protein may limit rumen microbial activity, reducing microbial protein synthesis and feed utilization efficiency, ultimately constraining animal growth [7,15].
Seasonal dynamics may further influence these relationships, as forage nutritive value and availability change throughout the grazing period. While biomass may increase during certain stages of vegetation development, nutritive value often declines with plant maturation due to increasing fiber concentration and decreasing protein availability. As a result, the relationship between pasture characteristics and animal productivity is complex and influenced by both environmental conditions and temporal variation [7,14,16,17].
Despite extensive research on pasture ecosystems, there remains a need to better understand how variation in forage quantity and quality is associated with livestock performance under real production conditions. In particular, studies that simultaneously evaluate pasture characteristics and animal productivity across multiple natural–climatic settings using a consistent dataset remain limited. Addressing this issue is important for improving pasture management strategies in arid and semi-arid grazing systems.
Therefore, the aim of this study was to assess variation in pasture productivity and forage nutritive value among farms located across contrasting grazing environments of Kazakhstan and to explore their potential association with beef cattle live weight gain during the grazing period.
We explored whether variation in environmental conditions and seasonal dynamics was associated with differences in herbage productivity and chemical composition, and whether animal performance showed closer associations with forage nutritive value indicators, particularly crude protein content, than with total pasture biomass.
2. Materials and Methods
2.1. Study Areas and Pasture Characteristics
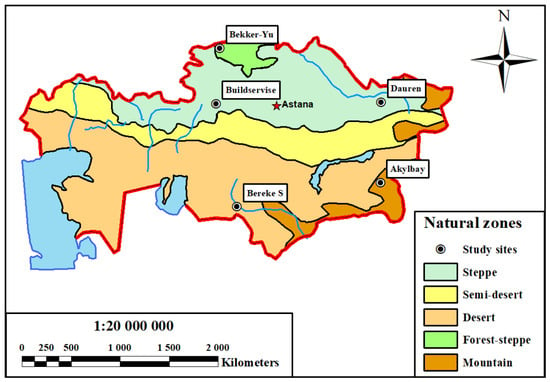
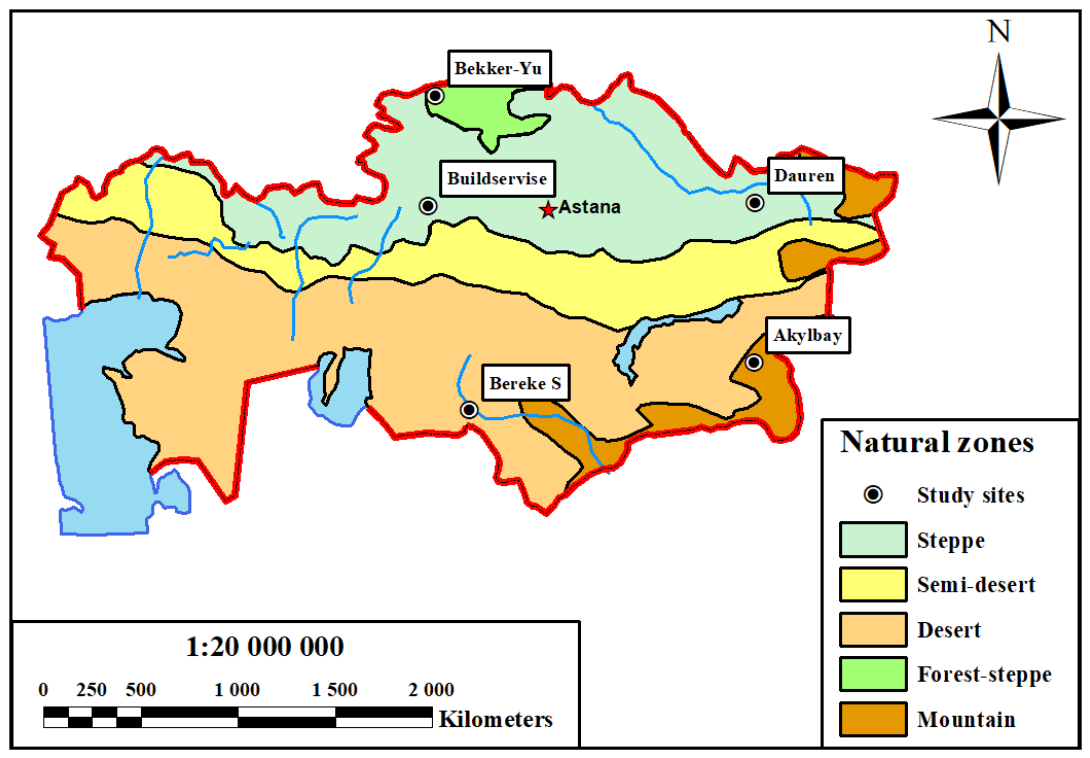
The study was conducted during the 2024–2025 grazing seasons on privately owned farms located across contrasting grazing environments of Kazakhstan. Five study sites representing contrasting natural–climatic zones were included: the desert zone (Bereke S farm), semi-desert zone (Dauren farm), steppe zone (Buildservice farm), forest-steppe zone (Bekker Yu. farm), and mountain zone (Akylbay farm). The geographic locations and main characteristics of the study sites are presented in Figure 1 and Table 1.
Figure 1.
Location of the study sites across the natural–climatic zones of Kazakhstan. Blue lines indicate major rivers, and blue polygons represent lakes and other water bodies.
Table 1.
Geographic location and main characteristics of the study sites.
Pasture vegetation varied markedly across zones, reflecting a gradient of moisture availability and ecological conditions. In the desert zone, vegetation was dominated by Alhagi spp., Tamarix spp., Artemisia spp., and Salsola spp., forming typical shrub–semi-shrub communities. In the semi-desert and steppe zones, vegetation was dominated by grasses and wormwood species, including Stipa spp. and Festuca spp., with increasing participation of forbs. In the forest-steppe and mountain zones, vegetation was characterized by grass–legume–forb communities, with a higher proportion of mesophytic species such as Medicago sativa, Trifolium spp., and Dactylis glomerata. Scientific nomenclature was verified using the Plants of the World Online database (POWO) [18].
The climate of the study regions is sharply continental, characterized by pronounced seasonal variability in temperature and precipitation. According to NASA POWER climate data [19], precipitation (IMERG) during the grazing period varied substantially among the study sites. In the desert zone, precipitation ranged from 0.03 to 1.23 mm day−1, in the semi-desert zone from 0.80 to 2.10 mm day−1, in the steppe zone from 0.85 to 2.87 mm day−1, in the forest-steppe zone from 0.72 to 2.70 mm day−1, and in the mountain zone from 0.98 to 1.88 mm day−1.
Mean air temperature (T2M) exhibited pronounced spatial and seasonal variability. The desert zone exhibited the highest temperatures (12.05–29.80 °C), followed by the semi-desert zone (3.68–22.83 °C). Temperatures in the steppe and forest-steppe zones ranged from 2.39–19.79 °C and 2.39–19.70 °C, respectively, whereas the mountain zone remained comparatively cooler, with values ranging from 6.20 to 20.60 °C. Seasonal minimum temperatures ranged from −9.80 °C in the semi-desert zone to 17.60 °C in the desert zone, highlighting the substantial climatic differences among the study sites. Soil moisture (GWETTOP) varied among study sites, ranging from 0.20–0.50 in the desert zone, 0.39–0.66 in the semi-desert zone, 0.60–0.76 in the steppe zone, 0.59–0.84 in the forest-steppe zone, and 0.33–0.55 in the mountain zone.
2.2. Study Design
The study was conducted as an observational field study within operating pasture farms without artificial standardization of zootechnical and management factors. This design allowed pasture productivity, forage nutritive value, and animal productivity to be assessed under real grazing conditions; however, it did not allow complete separation of environmental influences from farm-specific management and genetic factors.
Each farm represented a study site located within a distinct natural–climatic zone and managed under local grazing conditions. Because only one farm was included within each zone, the study did not constitute a fully replicated comparison of natural–climatic zones. Consequently, the findings should be interpreted as an exploratory assessment of patterns observed among the studied farms and grazing environments rather than as independent treatment effects attributable solely to climatic conditions.
During each year of the study, vegetation sampling was conducted three times during the grazing season: in May–June (early season), July–August (mid-season), and September (late season). Sampling was performed across all study sites in both 2024 and 2025 to assess pasture productivity and forage nutritive value.
2.3. Assessment of Pasture Productivity and Forage Chemical Composition
Pasture herbage yield was assessed using the clipping method with ten 1 m2 quadrats randomly distributed within each pasture. Sampling was conducted once per season at each site. Vegetation was cut at a height of 2–3 cm above the soil surface, weighed, and recalculated per unit area (kg ha−1). Vegetation cover was estimated visually within each 1 m2 quadrat as the percentage of ground surface occupied by the vertical projection of aboveground vegetation. Mean values were calculated from all quadrat observations [20,21].
Forage chemical composition was determined using standard gravimetric procedures. The following parameters were measured: dry matter (DM) and moisture fractions, including total moisture (TM), hygroscopic moisture (HM), and initial moisture (IM). Dry matter and moisture fractions were determined according to AOAC procedures [22]. Fresh forage samples were weighed after collection and dried to constant mass under laboratory conditions. Dry matter content was calculated from the dry residue, whereas total moisture, hygroscopic moisture, and initial moisture were determined following the standard calculations described by AOAC [22]. These indicators were included to characterize plant water status and its potential influence on nutrient availability.
Crude protein (CP) content was determined using the Kjeldahl method based on total nitrogen and a conversion factor of 6.25 [9,22]. Crude fiber, ether extract (fat), ash, and nitrogen-free extract (NFE) were analysed according to standard forage evaluation procedures [23].
All laboratory analyses were performed at the Laboratory of Feed and Milk Quality Analysis, Kazakh Research Institute of Livestock and Fodder Production, using standardized and internationally accepted analytical protocols to ensure comparability across sites and years.
2.4. Animal Productivity Assessment
Different breeds and crossbreeds of cattle were maintained at each farm. At the Bereke S farm, crossbreeds of the Kalmyk breed were used; at the Dauren and Bildservice farms, the Kazakh White-headed breed was raised; and at the Bekker- Yu. and Akylbay farms, the Auliekol breed was used. These breed differences represent an additional source of variation in animal productivity and were not standardized within the study design. Detailed information on the number of animals, age, sex, breed composition, and grazing period duration for each farm is presented in Table 2.
Table 2.
Characteristics of farms and animal groups used for productivity assessment across natural–climatic zones.
For productivity assessment, 10 heifers were selected from each farm using an analogue (matching) method based on age, initial live weight, and body condition. The selected animals represented the predominant replacement heifer groups maintained under routine farm management conditions. Mean age of the study animals ranged from 10 ± 2 to 18 ± 2 months (Table 2), while initial live weight ranged from 179.7 ± 3.8 to 365.0 ± 4.6 kg depending on the study site and year.
All selected animals were managed as a single group within each farm under uniform grazing conditions.
Animal productivity was evaluated based on live weight gain during the grazing period. Animals were weighed at the beginning and at the end of the grazing season under comparable conditions (morning weighing before feeding). Live weight gain per animal was calculated as the difference between final and initial body weight.
Average daily gain (g day−1) was calculated by dividing total weight gain by the duration of the grazing period [11].
Since weight gain represents cumulative performance over the entire grazing period, the seasonal factor was not included in the statistical analysis of animal productivity. However, seasonal variation was considered when analyzing pasture productivity and forage chemical composition.
To assess the relationship between forage resources and animal productivity, weighted mean values of pasture yield, crude protein content, and fiber content were calculated for the entire grazing period. Weighting was performed based on the duration of each season relative to the total grazing period and was applied consistently across all farms and years.
2.5. Statistical Analysis
Statistical analyses were performed using R software (version 4.5.2; R Core Team, R Foundation for Statistical Computing, Vienna, Austria).
The normality of quantitative variables was assessed using the Shapiro–Wilk test. For several variables, including fiber and dry matter content, deviations from normal distribution were detected (p < 0.05). Therefore, the effects of natural–climatic zone, season, and year on pasture productivity and the chemical composition of herbage were evaluated using permutation analysis of variance (permutation ANOVA) implemented in the lmPerm package [24].
Permutation procedures were applied to seasonal observations pooled across farms while accounting for the structure of repeated measurements within each study site.
The influence of pasture forage nutritive value on average daily weight gain was explored using a two-factor linear model (Type II ANOVA), including study site and weighted mean crude protein content as factors. Because each natural–climatic zone was represented by a single farm and independent replication at the zonal level was not available, the results of this analysis were interpreted as exploratory assessments of patterns within the observational dataset rather than as formal tests of treatment effects or zonal differences.
Multivariate differences in forage structure across study sites and seasons were analyzed using principal coordinates analysis (PCoA) based on Bray–Curtis dissimilarity [25]. The significance of multivariate patterns within the observational dataset was evaluated using PERMANOVA (adonis2 function, vegan package) with 9999 permutations [26,27].
Prior to analysis, variables were normalized using min–max transformation to scale all indicators to a comparable range (0–1), thereby reducing the influence of differences in measurement units. Homogeneity of multivariate dispersion was evaluated using the betadisper test [28].
Correlations between pasture forage nutritive value indicators and animal productivity were assessed using Spearman’s rank correlation coefficient with Benjamini–Hochberg false discovery rate correction for multiple comparisons [29]. Given the limited effective sample size, correlation results were interpreted cautiously.
In the statistical analysis, the farm was considered the experimental unit. Mean values of animal productivity and pasture characteristics were calculated for each study site, and variability among the studied systems was evaluated at the farm level (n = 5). Because each natural–climatic zone was represented by a single farm, the effects of zone cannot be fully separated from farm-specific management and genetic factors. Therefore, the results should be interpreted as comparisons among the studied farms rather than strictly independent zonal effects.
This design limits inferential robustness and increases the risk of overinterpreting statistical significance. Accordingly, the interpretation of results focused on effect direction, consistency across years, and ecological plausibility rather than solely on p-values.
3. Results
3.1. Pasture Productivity and Chemical Composition of Herbage
The botanical composition of pasture vegetation differed across the study sites located in contrasting natural–climatic zones. Dominant species and their relative contributions to total vegetation cover are summarized in Table 3.
Table 3.
Botanical composition and relative species proportions across natural–climatic zones.
The analysis of pasture productivity and herbage chemical composition averaged over the grazing period revealed variability among the study sites (Table 4). The highest mean herbage yield was observed in the forest-steppe zone (882.8 ± 237.6 kg ha−1), whereas the lowest values were recorded in the steppe zone (569.9 ± 234.0 kg ha−1). The desert and mountain zones showed comparable yield levels (845.5 ± 197.5 and 850.2 ± 207.2 kg ha−1, respectively), while the semi-desert zone exhibited intermediate values (721.8 ± 139.3 kg ha−1). Relatively large standard deviations indicate substantial within-zone variability.
Table 4.
Yield and chemical composition of herbage (mean ± SD).
Crude protein content ranged from 8.3 ± 1.5% in the semi-desert zone to 10.6 ± 1.9% in the forest-steppe zone. Intermediate values were observed in the steppe (9.6 ± 1.8%), mountain (9.4 ± 1.6%), and desert (9.3 ± 1.4%) zones. In contrast, crude fat content showed relatively limited variation among zones, ranging from 2.9 ± 0.9% in the steppe zone to 3.5 ± 1.2% in the forest-steppe and mountain zones.
Fiber content varied from 31.9 ± 8.6% in the steppe zone to 33.9 ± 9.4% in the desert zone. Nitrogen-free extract (NFE) content was generally higher in the steppe (40.1 ± 6.6%) and semi-desert (39.8 ± 6.9%) zones, while lower values were observed in the forest-steppe zone (37.5 ± 6.2%).
Ash content was highest in the semi-desert zone (9.1 ± 2.9%), whereas the lowest values were recorded in the forest-steppe zone (7.4 ± 1.3%). Dry matter and total moisture content showed substantial variability across the study sites, likely reflecting seasonal differences in plant development and water content.
Exploratory permutation analyses suggested structured variability in pasture productivity and forage nutritive value indicators across the studied sites, seasons, and years within the observational dataset (Table 5). However, because one farm represented each climatic zone, these analyses should be interpreted cautiously as exploratory assessments of farm-level patterns rather than as evidence of fully replicated treatment effects.
Table 5.
Results of permutation analysis assessing variability in pasture productivity and forage nutritive value indicators associated with study site, season, and year.
Seasonal variation was associated with the largest proportion of observed variability across most forage indicators. Yield and crude protein content showed structured variation associated with season, study site, and year within the dataset, whereas fiber content showed variability primarily associated with seasonal dynamics. These patterns should be interpreted descriptively due to the limited number of independently replicated study sites.
Relatively high standard deviation values observed for several indicators, particularly dry matter and total moisture content, are likely related to the aggregation of data across the entire grazing period, which encompasses substantial seasonal variability in the physiological state of the herbage.
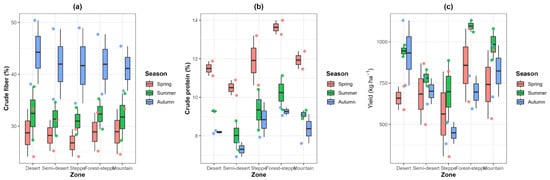
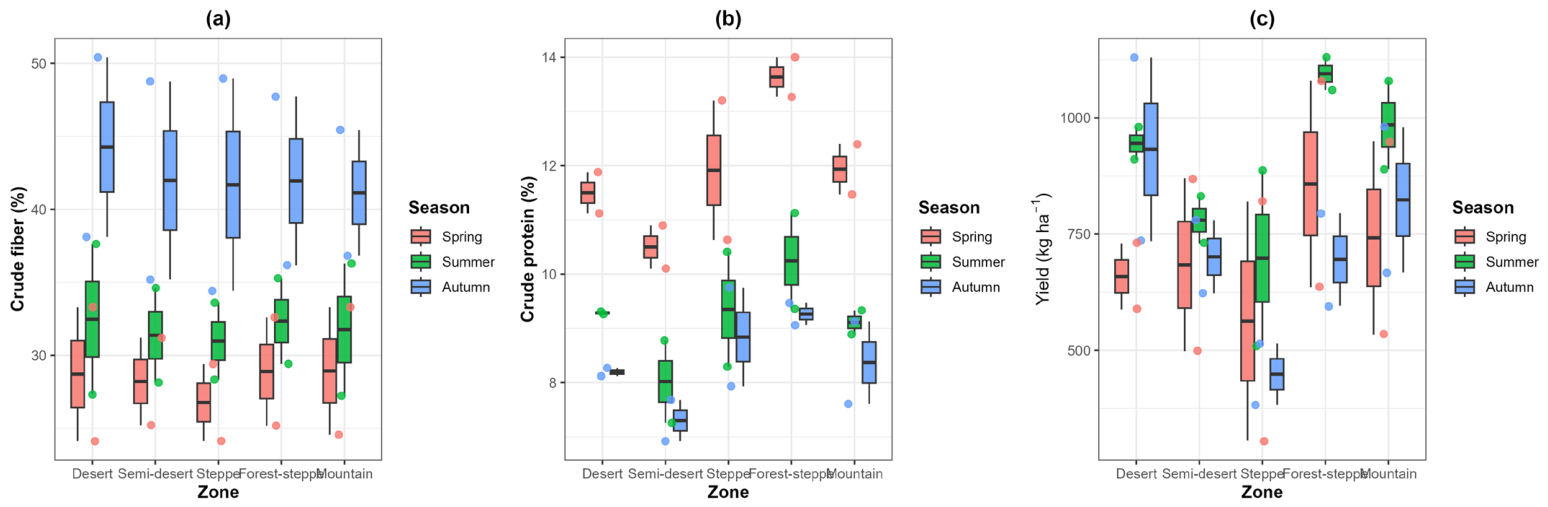
The graphical representation of seasonal changes in pasture productivity and forage nutritive value is consistent with the results of permutation ANOVA (Figure 2a–c).
Figure 2.
Boxplots showing crude fiber content (%) (a), crude protein content (%) (b), and pasture vegetation yield (kg ha−1) (c) across study sites in Kazakhstan. Colored dots represent individual observations.
Pasture yield and crude protein content exhibited pronounced seasonal dynamics, with higher values generally observed during the spring and early summer periods, followed by a decline toward late summer and autumn.
In contrast, crude fiber content showed an increasing tendency over the course of the growing season, consistent with progressive plant maturation and lignification. Differences among the studied farms were present but less pronounced than seasonal variation, indicating that temporal (phenological) changes play a dominant role in shaping forage characteristics during the grazing period.
3.2. Seasonal Use of Pastures and Animal Productivity
Seasonal use of pastures and animal productivity differed across the studied grazing environments and between years (Table 6). Pronounced differences in both initial and final live weights, as well as in weight gain and average daily gain (ADG), were observed among the studied farms and years.
Table 6.
Animal productivity during the grazing period in different natural–climatic zones (2024–2025) (mean ± SD).
Higher average daily gain (ADG) values were recorded in the farms representing forest-steppe and steppe grazing environments. In the forest-steppe farm, ADG reached 616.7 ± 204.4 g day−1 in 2024 and increased to 900 ± 23 g day−1 in 2025. Comparatively lower ADG values were observed in farms located in desert and semi-desert grazing environments, particularly in 2024, where values ranged from 316.7 ± 23.8 to 337.5 ± 52.9 g day−1. However, given the observational design and the lack of full replication at the zonal level, these observations should be interpreted as descriptive farm-level patterns within the studied sites rather than as strictly independent zonal effects.
Exploratory permutation analyses indicated variability in animal productivity indicators across the studied grazing environments and years. Live weight gain per head varied within the observational dataset according to study site (p = 0.004) and year (p = 0.003). Similarly, average daily gain (ADG) showed structured variability associated with study site (p = 0.003) and year (p = 0.004) (Table 7).
Table 7.
Exploratory permutation analysis of variability in animal productivity indicators.
Because the number of independently replicated study sites was limited, these statistical results should be interpreted primarily as exploratory assessments of patterns within the dataset rather than as evidence of independent zonal effects. The comparatively higher productivity values observed in 2025 indicate interannual variability within the observational dataset.
At the same time, substantial variability remained within the observational dataset, potentially reflecting differences in pasture composition, grazing intensity, interannual environmental variability, and farm-specific management practices. These observations indicate that no single factor evaluated in the present study was sufficient to explain the observed variability in animal productivity.
Pairwise comparisons among natural–climatic zones using the Benjamini–Hochberg correction did not reveal statistically significant differences for either live weight gain or average daily gain (p > 0.05). Given that one farm represented each natural–climatic zone, the observed patterns should be interpreted as farm-level patterns rather than strictly zonal effects.
Although exploratory analyses suggested variability associated with study site and year, post hoc comparisons did not reveal consistent pairwise differences among individual systems. These observations may indicate gradual variability in productivity across the studied grazing environments rather than sharply defined contrasts among discrete systems.
Such patterns indicate that animal productivity varied gradually across the studied farms and years; however, the relative contributions of environmental, management-related, and animal-related factors cannot be separated within the current study design.
3.3. Multivariate Analysis of Pasture Indicators
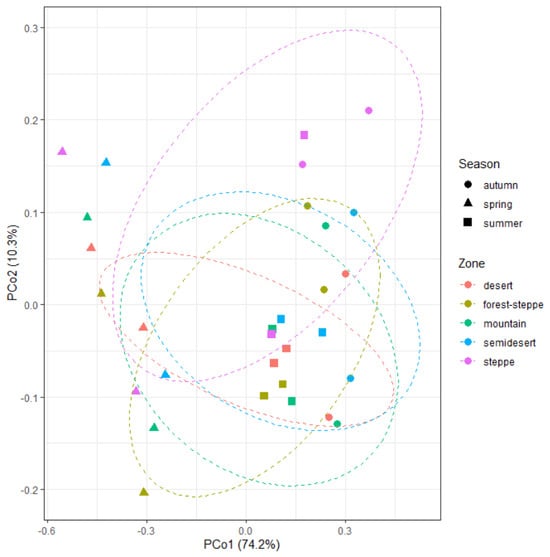
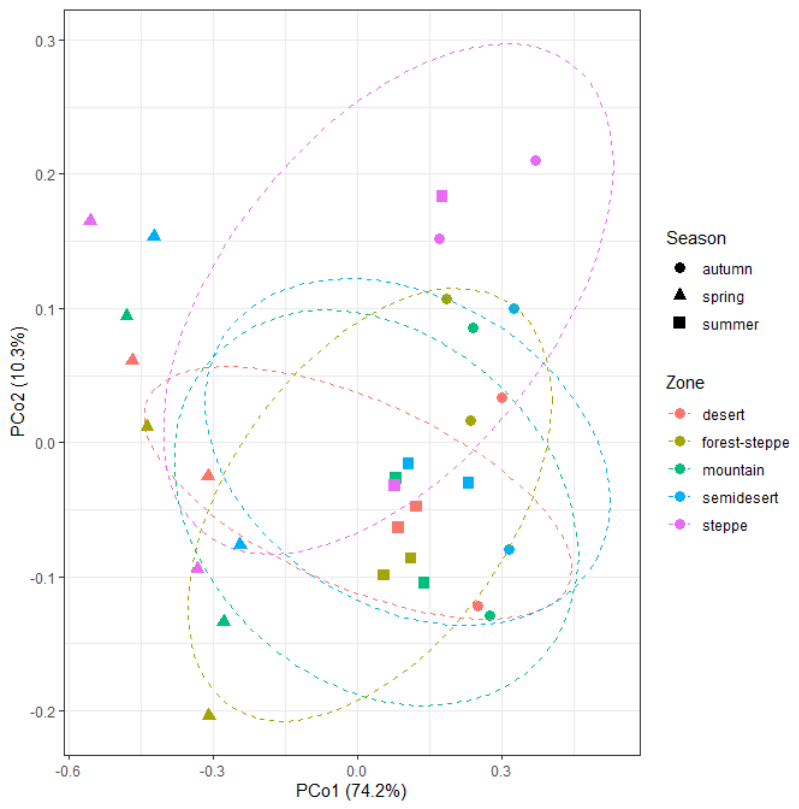
Principal coordinates analysis (PCoA), based on the Bray–Curtis dissimilarity matrix of pasture productivity and herbage chemical composition indicators, revealed differentiation of pasture ecosystems associated with study site and growing seasons (Figure 3). The first principal coordinate (PCo1) explained 74.2% of the total variation, while the second coordinate (PCo2) accounted for 10.3%.
Figure 3.
Principal coordinates analysis (PCoA) of pasture productivity and forage nutritive value indicators based on Bray–Curtis dissimilarity across study sites and seasons (2024–2025).
The ordination pattern showed a clear separation of observations primarily along the seasonal gradient. Spring samples were distinctly separated from summer and autumn samples, indicating substantial seasonal shifts in forage productivity and chemical composition. In contrast, differences among natural–climatic zones were less pronounced and followed a more gradual pattern within the ordination space.
Multivariate exploratory analyses (PERMANOVA) indicated structured variability in pasture productivity and forage nutritive value indicators associated with season (R2 = 0.848, p = 0.0001), study site (R2 = 0.044, p = 0.004), and year (R2 = 0.052, p = 0.0002). Among the evaluated variables, seasonal variation accounted for the largest proportion of variability within the observational dataset, consistent with expected changes in vegetation phenology during the grazing period.
Testing the homogeneity of multivariate dispersion did not detect statistically significant differences among the studied farms (p > 0.05), suggesting that the observed multivariate patterns were associated primarily with variation in forage structure and composition rather than with unequal dispersion within groups.
Overall, the multivariate exploratory analyses suggested that seasonal dynamics were associated with substantial variability in pasture productivity and forage nutritive value among the studied systems. Nevertheless, these patterns should be interpreted as descriptive relationships within the observational dataset due to the limited number of independently replicated study sites.
3.4. Relationship Between Pasture Forage Nutritive Value and Animal Productivity
Spearman correlation analysis between average daily gain (ADG) and pasture productivity and chemical composition indicators weighted by grazing duration revealed no statistically significant relationships (p > 0.05). Moderate positive correlations were observed between ADG and crude protein content (ρ = 0.48), pasture yield (ρ = 0.35), and ash content (ρ = 0.52). In contrast, nitrogen-free extract (NFE) showed a moderate negative association with ADG (ρ = −0.49). Fiber content exhibited only a weak positive association with ADG (ρ = 0.12). However, none of these relationships remained statistically significant after adjustment for multiple comparisons.
The relatively weak statistical relationships observed in the present study may also reflect the limited number of independently replicated study sites, which restricts statistical power.
A linear model including study site and protein content did not reveal statistically significant effects on ADG (p > 0.05 for all predictors), which was confirmed by Type II ANOVA (Table 8).
Table 8.
Results of exploratory Type II ANOVA evaluating associations between forage nutritive value indicators and average daily gain.
These results indicate that no individual forage nutritive value indicator examined in the present study showed a statistically significant association with animal productivity.
Although protein content showed a moderate positive association with ADG, this relationship should be interpreted cautiously due to the limited sample size, observational study design, and lack of statistical significance.
4. Discussion
The present study provided an exploratory observational assessment of pasture productivity, forage nutritive value, and cattle productivity under contrasting grazing conditions in different climatic zones in Kazakhstan. Variability in herbage yield and chemical composition was observed among farms and seasons. Because environmental and management-related factors varied simultaneously among study sites, the observed patterns cannot be attributed to any single factor. Similar descriptive patterns in pasture ecosystems have previously been reported for arid and semi-arid regions [20]. However, due to the observational nature of the current study, these patterns should be interpreted as descriptive associations rather than as evidence of independent causal effects.
Seasonal variation was associated with differences in forage productivity and chemical composition. Higher pasture productivity and protein content were generally observed during earlier stages of vegetation development, whereas later stages were associated with increased dry matter and fiber concentrations. Similar tendencies have been described in pasture systems of Inner Mongolia [30] and Australia [31], where seasonal changes in forage maturity coincided with differences in forage nutritive value under moisture-limited grazing conditions.
Moderate positive associations were observed between crude protein content and average daily gain (ρ = 0.48), as well as between pasture yield and average daily gain (ρ = 0.35). However, these relationships were not statistically significant after adjustment for multiple comparisons. Therefore, the observed patterns should not be interpreted as evidence of direct causal relationships between individual forage nutritive value indicators and animal productivity within the current dataset.
The linear model and Type II ANOVA similarly did not identify statistically significant effects of forage nutritive value indicators or study sites on average daily gain. Collectively, these results indicate that no individual variable examined in the present dataset showed a statistically significant association with animal productivity. Similar challenges in identifying individual predictors of animal performance under grazing conditions have been reported previously [32].
The observed associations involving crude protein may nevertheless be considered biologically plausible within the general framework of ruminant nutrition. Adequate protein supply is important for maintaining rumen microbial activity and supporting the digestion of structural carbohydrates [11,13]. Previous grazing studies have also reported associations between forage nutritive value characteristics and average daily gain under pasture conditions, although these relationships are often influenced by forage availability, grazing behavior, and management conditions [33]. In the present study, crude protein concentrations generally remained within ranges considered sufficient for maintaining microbial function, which may partly explain the relatively weak statistical relationships observed between protein concentration and productivity indicators. However, these mechanisms were not directly evaluated and therefore remain interpretative.
In contrast, fiber content did not show a statistically significant association with animal productivity. Fiber concentrations in the studied systems remained within ranges generally characteristic of moderately mature pasture vegetation. Previous studies have demonstrated that the effects of fiber on intake and digestibility are context-dependent and may interact with forage structure, protein availability, and grazing selectivity [23,34]. Consequently, the absence of a clear relationship in the present study should not be generalized beyond the observed production conditions.
The multivariate analyses indicated that seasonal variation was associated with a substantial proportion of the observed variability in pasture structure and forage nutritive value among the studied systems. However, the relatively high explanatory values associated with season should also be interpreted cautiously, as correlated environmental variables and the structure of the observational dataset may have contributed to these patterns.
From a practical perspective, the observed patterns are consistent with the general importance of maintaining adequate forage nutritive value within grazing systems. In particular, increasing the proportion of legumes and other nutritionally valuable species may represent a potentially useful management direction. However, such implications should be regarded as exploratory interpretations consistent with the observed field patterns rather than as recommendations directly tested within the current study.
Study Limitations
Several limitations should be considered when interpreting the results of this study. First, each grazing environment was represented by a single farm, limiting independent replication at the study-site level. Second, differences among farms in breed composition, herd structure, initial body weight, grazing duration, and management practices could not be separated from environmental variation. Third, the observational design did not allow experimental control of potentially confounding variables. Finally, the study covered only two grazing seasons and therefore does not capture longer-term temporal variability. Consequently, the findings should be regarded as descriptive and exploratory and interpreted with appropriate caution.
Nevertheless, the study provides field-based observational data collected under real grazing conditions across contrasting grazing environments in Kazakhstan. Region-specific quantitative information integrating pasture productivity, forage nutritive value, and livestock performance remains limited for continental dryland environments. In this context, the present study contributes descriptive information that may support future investigations involving larger sample sizes and more fully replicated experimental designs.
5. Conclusions
The present study documented variability in pasture vegetation composition, forage nutritive value, pasture productivity, and cattle performance among study sites located in contrasting natural–climatic zones of Kazakhstan. The investigated sites differed in vegetation cover, dominant plant species, grazing duration, herd characteristics, and environmental conditions, illustrating the complexity of pasture-based livestock production systems under continental climatic conditions.
Moderate positive associations between crude protein content and average daily gain were observed; however, these relationships were not statistically significant within the current dataset. Similarly, indicators related to the structural components of plant biomass similarly did not show clear associations with animal productivity.
The observed patterns highlight the challenges of interpreting pasture–livestock relationships under field conditions, where environmental, management, and animal-related factors vary simultaneously among study sites. Given the observational study design and limited replication at the farm level, the findings should be interpreted as descriptive and exploratory rather than as evidence of causal relationships.
Overall, the study provides field-based information on pasture vegetation characteristics, forage nutritive value, and cattle productivity across contrasting grazing environments in Kazakhstan. The dataset may serve as a foundation for future studies involving larger numbers of independently replicated study sites, additional environmental variables, and longer-term observations to improve understanding of pasture–livestock interactions in arid and semi-arid grazing systems.
Author Contributions
Conceptualization, K.K. and M.T.; methodology, K.K.; formal analysis, M.T.; investigation, K.K., A.S., K.S. and E.K.; field data collection, K.K., A.S., K.S. and E.K.; data curation, M.T.; writing—original draft preparation, M.T.; writing—review and editing, A.T. and T.K.; visualization, M.T.; supervision, A.T. and T.K. All authors have read and agreed to the published version of the manuscript.
Funding
This research was funded by the the Ministry of Agriculture of the Republic of Kazakhstan under research program BR22885686 “Development of a System for the Genetic Improvement of Beef Cattle Breeds Using Innovative Methods of Molecular Genetics, Breeding, and Digital Technologies” of the Ministry of Agriculture of Kazakhstan.
Institutional Review Board Statement
Ethical review and approval were waived for this study, as it involved non-invasive observations of animals under routine farm management conditions without any experimental manipulation. All procedures were conducted in accordance with internationally accepted guidelines for the care and use of animals in research.
Data Availability Statement
The datasets generated and analyzed during the current study are available from the corresponding author upon reasonable request.
Acknowledgments
The authors thank the staff of the participating farms for their assistance during field data collection. The authors used ChatGPT (GPT-5.5 Thinking, OpenAI, San Francisco, CA, USA) for minor language editing and improvement of English expression. The AI tool was not used for data analysis, interpretation, or generation of scientific results. All scientific content and conclusions were developed and verified by the authors, who take full responsibility for the content of the manuscript.
Conflicts of Interest
The authors declare no conflicts of interest. The funding body had no role in the design of the study; in the collection, analysis, or interpretation of data; in the writing of the manuscript; or in the decision to submit the manuscript for publication.
Abbreviations
The following abbreviations are used in this manuscript:
| CP | Crude protein |
| GWETTOP | topsoil moisture (dimensionless index) |
| HM | Hygroscopic moisture |
| IM | Initial moisture |
| IMERG_PRECTOT | precipitation (mm day−1) |
| NFE | Nitrogen-free extract |
| PCoA | Principal coordinates analysis |
| TM | Total moisture |
| T2M | mean air temperature at 2 m (°C) |
| T2M_MAX | maximum air temperature at 2 m (°C) |
| T2M_MIN | minimum air temperature at 2 m (°C) |
References
- Li, W.; Luo, Q.; Chen, Z.; Liu, Y.; Li, Z.; Wang, W. Assessment of Grassland Carrying Capacity and Grass–Livestock Balance in the Three River Headwaters Region Under Different Scenarios. Biology 2025, 14, 978. [Google Scholar] [CrossRef] [Scilit] [PubMed]
- Andrade, B.O.; Shropshire, A.; Johnson, J.R.; Redden, M.D.; Semerad, T.; Soper, J.M.; Beckman, B.; Milby, J.; Eskridge, K.M.; Volesky, J.D.; et al. Vegetation and animal performance responses to stocking density grazing systems. Rangel. Ecol. Manag. 2022, 82, 86–96. [Google Scholar] [CrossRef] [Scilit]
- Lazareva, V.G.; Bananova, V.A.; Van Zung, N. Dynamics of modern vegetation for pasture use in the northwestern Pre-Caspian region. Arid Ecosyst. 2020, 10, 276–283. [Google Scholar] [CrossRef] [Scilit]
- Kemp, D.R.; Behrendt, K.; Badgery, W.B.; Han, G.D.; Li, P.; Zhang, Y.; Wu, J.; Hou, F.J. Chinese degraded grasslands—Pathways for sustainability. Rangel. J. 2020, 42, 339–346. [Google Scholar] [CrossRef] [Scilit]
- Mayel, S.; Jarrah, M.; Kuka, K. How does grassland management affect physical and biochemical properties of temperate grassland soils? A review study. Grass Forage Sci. 2021, 76, 215–244. [Google Scholar] [CrossRef] [Scilit]
- Tieubou, L.T.; Lemoufouet, J.; Meutchieye, F.; Nounamo, L.; Kondo, C.N.; Raphaël, K.J.; Feudjio, B.A. Nutritive value of forages consumed by ruminants during the dry season in the western highlands of Cameroon. Grassl. Res. 2023, 2, 112–119. [Google Scholar] [CrossRef] [Scilit]
- Hou, L.; Xin, X.; Shen, B.; Qin, Q.; Altome, A.I.A.; Hamed, Y.M.Z.; Yan, R.; Nurlan, S.; Adilbek, N.; Balzhan, A.; et al. Effects of Long-Term Grazing on Feed Intake and Digestibility of Cattle in Meadow Steppe. Agronomy 2023, 13, 1760. [Google Scholar] [CrossRef] [Scilit]
- Teague, W.R.; Dowhower, S.L.; Baker, S.A.; Haile, N.; DeLaune, P.B.; Conover, D.M. Grazing management impacts on vegetation, soil biota and soil chemical, physical and hydrological properties. Agric. Ecosyst. Environ. 2011, 141, 310–322. [Google Scholar] [CrossRef] [Scilit]
- O’Mara, F.P. The role of grasslands in food security and climate change. Ann. Bot. 2012, 110, 1263–1270. [Google Scholar] [CrossRef] [Scilit] [PubMed]
- Lee, M.A. A global comparison of the nutritive values of forage plants grown in contrasting environments. J. Plant Res. 2018, 131, 641–654. [Google Scholar] [CrossRef] [Scilit] [PubMed]
- Van Soest, P.J. Nutritional Ecology of the Ruminant, 2nd ed.; Cornell University Press: Ithaca, NY, USA, 1994. [Google Scholar]
- Provenza, F.D.; Balph, D.F. Diet learning by domestic ruminants: Theory, evidence and practical implications. Appl. Anim. Behav. Sci. 1987, 18, 211–232. [Google Scholar] [CrossRef] [Scilit]
- Poppi, D.P.; McLennan, S.R. Protein and energy utilization by ruminants at pasture. J. Anim. Sci. 1995, 73, 278–290. [Google Scholar] [CrossRef] [Scilit] [PubMed]
- Wróbel, B.; Zielińska, K.; Kaczmarek, A. Improving forage quality from Permanent Grasslands to Increase Livestock Productivity. Agriculture 2025, 15, 1438. [Google Scholar] [CrossRef] [Scilit]
- Dias, M.R.; Moraes, K.A.K.d.; Oliveira, A.S.d.; Batista, E.D.; Salomão, A.M.R.; Zambenedetti, A.; Petrenko, N.B.; Sousa, J.N.; Ortelam, J.C.; Ickert, A.; et al. Nutritional Performance of Grazing Beef Cattle Supplemented with High-Protein Distillers’ Dried Grain. Animals 2024, 14, 1209. [Google Scholar] [CrossRef] [Scilit] [PubMed]
- Briske, D.D. Rangeland Systems: Processes, Management and Challenges; Springer: Cham, Switzerland, 2017. [Google Scholar] [CrossRef] [Scilit]
- Molle, G.; Decandia, M.; Cabiddu, A.; Landau, S.Y.; Cannas, A. An update on the nutrition of dairy sheep grazing Mediterranean pastures. Small Rumin. Res. 2008, 77, 93–112. [Google Scholar] [CrossRef] [Scilit]
- Royal Botanic Gardens, Kew. Plants of the World Online. Available online: https://powo.science.kew.org/ (accessed on 20 February 2026).
- Sparks, A.H. nasapower: A NASA POWER Global Meteorology, Surface Solar Energy and Climatology Data Client for R. J. Open Source Softw. 2018, 3, 1035. [Google Scholar] [CrossRef] [Scilit]
- Holechek, J.L.; Pieper, R.D.; Herbel, C.H. Range Management: Principles and Practices, 6th ed.; Pearson: Upper Saddle River, NJ, USA, 2011. [Google Scholar]
- Cook, C.W.; Stubbendieck, J. Range Research: Basic Problems and Techniques; Society for Range Management: Denver, CO, USA, 1986. [Google Scholar]
- AOAC. Official Methods of Analysis of AOAC International, 20th ed.; AOAC International: Washington, DC, USA, 2016. [Google Scholar]
- Minson, D.J. Forage in Ruminant Nutrition; Academic Press: San Diego, CA, USA, 1990; 483p. [Google Scholar] [CrossRef] [Scilit]
- Wheeler, B.; Torchiano, M. lmPerm: Permutation Tests for Linear Models; R Package Version 2.1.0; R Foundation for Statistical Computing: Vienna, Austria, 2016; Available online: https://CRAN.R-project.org/package=lmPerm (accessed on 20 February 2026).
- Legendre, P.; Legendre, L. Numerical Ecology, 3rd ed.; Elsevier: Amsterdam, The Netherlands, 2012. [Google Scholar]
- Anderson, M.J. A new method for non-parametric multivariate analysis of variance. Austral Ecol. 2001, 26, 32–46. [Google Scholar] [CrossRef] [Scilit]
- Oksanen, J.; Simpson, G.L.; Blanchet, F.G.; Kindt, R.; Legendre, P.; Minchin, P.R.; O’Hara, R.B.; Solymos, P.; Stevens, M.H.H.; Szoecs, E.; et al. vegan: Community Ecology Package; R Package Version 2.6-4; R Foundation for Statistical Computing: Vienna, Austria, 2022; Available online: https://CRAN.R-project.org/package=vegan (accessed on 20 February 2026).
- Anderson, M.J.; Ellingsen, K.E.; McArdle, B.H. Multivariate dispersion as a measure of beta diversity. Ecol. Lett. 2006, 9, 683–693. [Google Scholar] [CrossRef] [Scilit] [PubMed]
- Benjamini, Y.; Hochberg, Y. Controlling the false discovery rate: A practical and powerful approach to multiple testing. J. R. Stat. Soc. B 1995, 57, 289–300. [Google Scholar] [CrossRef] [Scilit]
- Liang, Y.; Han, G.; Zhou, H.; Zhao, M.; Snyman, H.A.; Shan, D.; Havstad, K.M. Grazing Intensity on Vegetation Dynamics of a Typical Steppe in Northeast Inner Mongolia. Rangel. Ecol. Manag. 2009, 62, 328–336. [Google Scholar] [CrossRef] [Scilit]
- Dixon, R.M.; Coates, D.B. Review: Near infrared spectroscopy of faeces to evaluate the nutrition and physiology of herbivores. J. Near Infrared Spectrosc. 2009, 17, 1–31. [Google Scholar] [CrossRef] [Scilit]
- Ponnampalam, E.N.; Jairath, G.; Alves, S.P.; Gadzama, I.U.; Santhiravel, S.; Mapiye, C.; Holman, B.W.B. Sustainable livestock production by utilising forages, supplements, and agricultural by-products: Enhancing productivity, muscle gain, and meat quality—A review. Meat Sci. 2025, 229, 109921. [Google Scholar] [CrossRef] [Scilit] [PubMed]
- Clayton, E.H.; Fahey, H.; Tyndall, P.; Lowrie, R.; Xu, B.; Ataollahi, F.; Norton, M.R. Average daily gain in lambs grazing mixed annual forage species compared with single species and relationship to feed on offer. Anim. Prod. Sci. 2024, 64, AN24102. [Google Scholar] [CrossRef] [Scilit]
- Mertens, D.R. Creating a system for meeting the fiber requirements of dairy cows. J. Dairy Sci. 1997, 80, 1463–1481. [Google Scholar] [CrossRef] [Scilit] [PubMed]

Disclaimer/Publisher’s Note: The statements, opinions and data contained in all publications are solely those of the individual author(s) and contributor(s) and not of MDPI and/or the editor(s). MDPI and/or the editor(s) disclaim responsibility for any injury to people or property resulting from any ideas, methods, instructions or products referred to in the content. |
© 2026 by the authors. Licensee MDPI, Basel, Switzerland. This article is an open access article distributed under the terms and conditions of the Creative Commons Attribution (CC BY) license.