
Depth-Related Changes in Soil P-Acquiring Enzyme Activities and Microbial Biomass—The Effect of Agricultural Land Use/Plant Cover and Pedogenic Processes

Abstract
:1. Introduction
2. Materials and Methods
2.1. Study Area and Soil Collection
2.2. Laboratory Assays
2.2.1. Soil Physicochemical Properties Assessment
2.2.2. Determination of Enzyme Activities and Microbial Biomass
2.2.3. Determination of Root Biomass and Morphology
2.2.4. Data Analyses
3. Results
3.1. Physico-Chemical Properties throughout the Soil Profiles
3.2. Soil Phosphorus, Carbon and Nitrogen Forms along the Soil Profiles
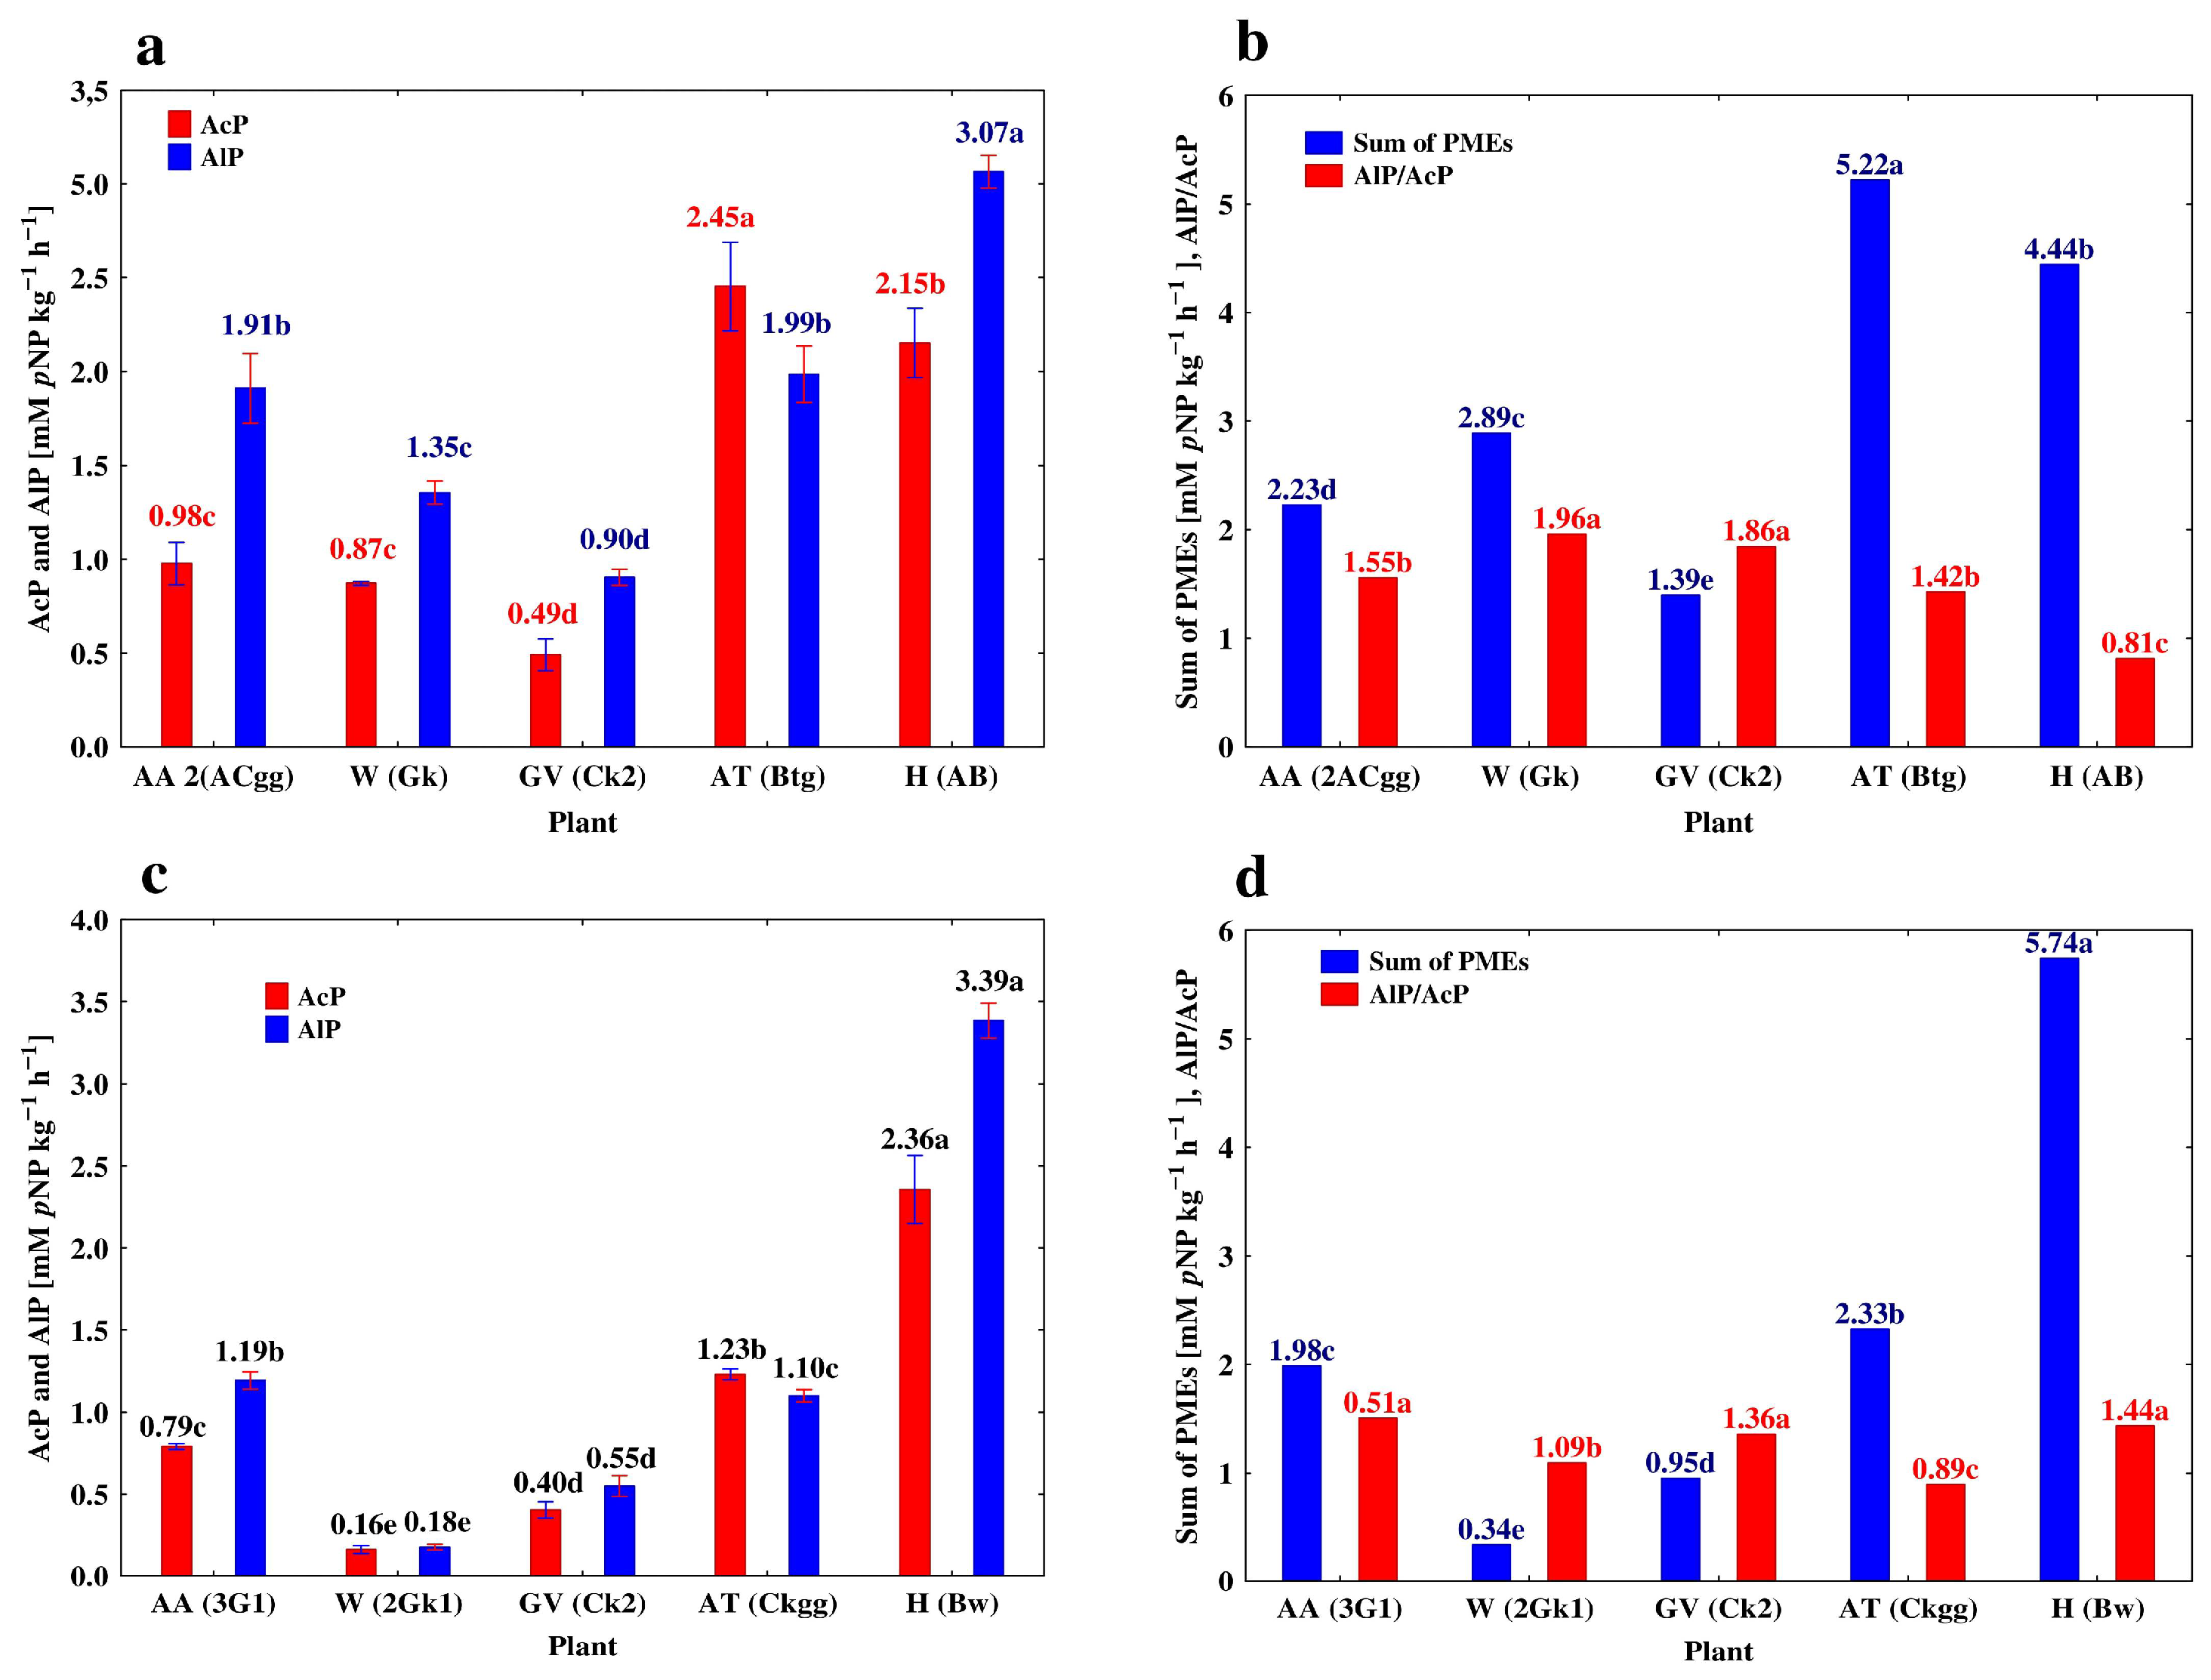
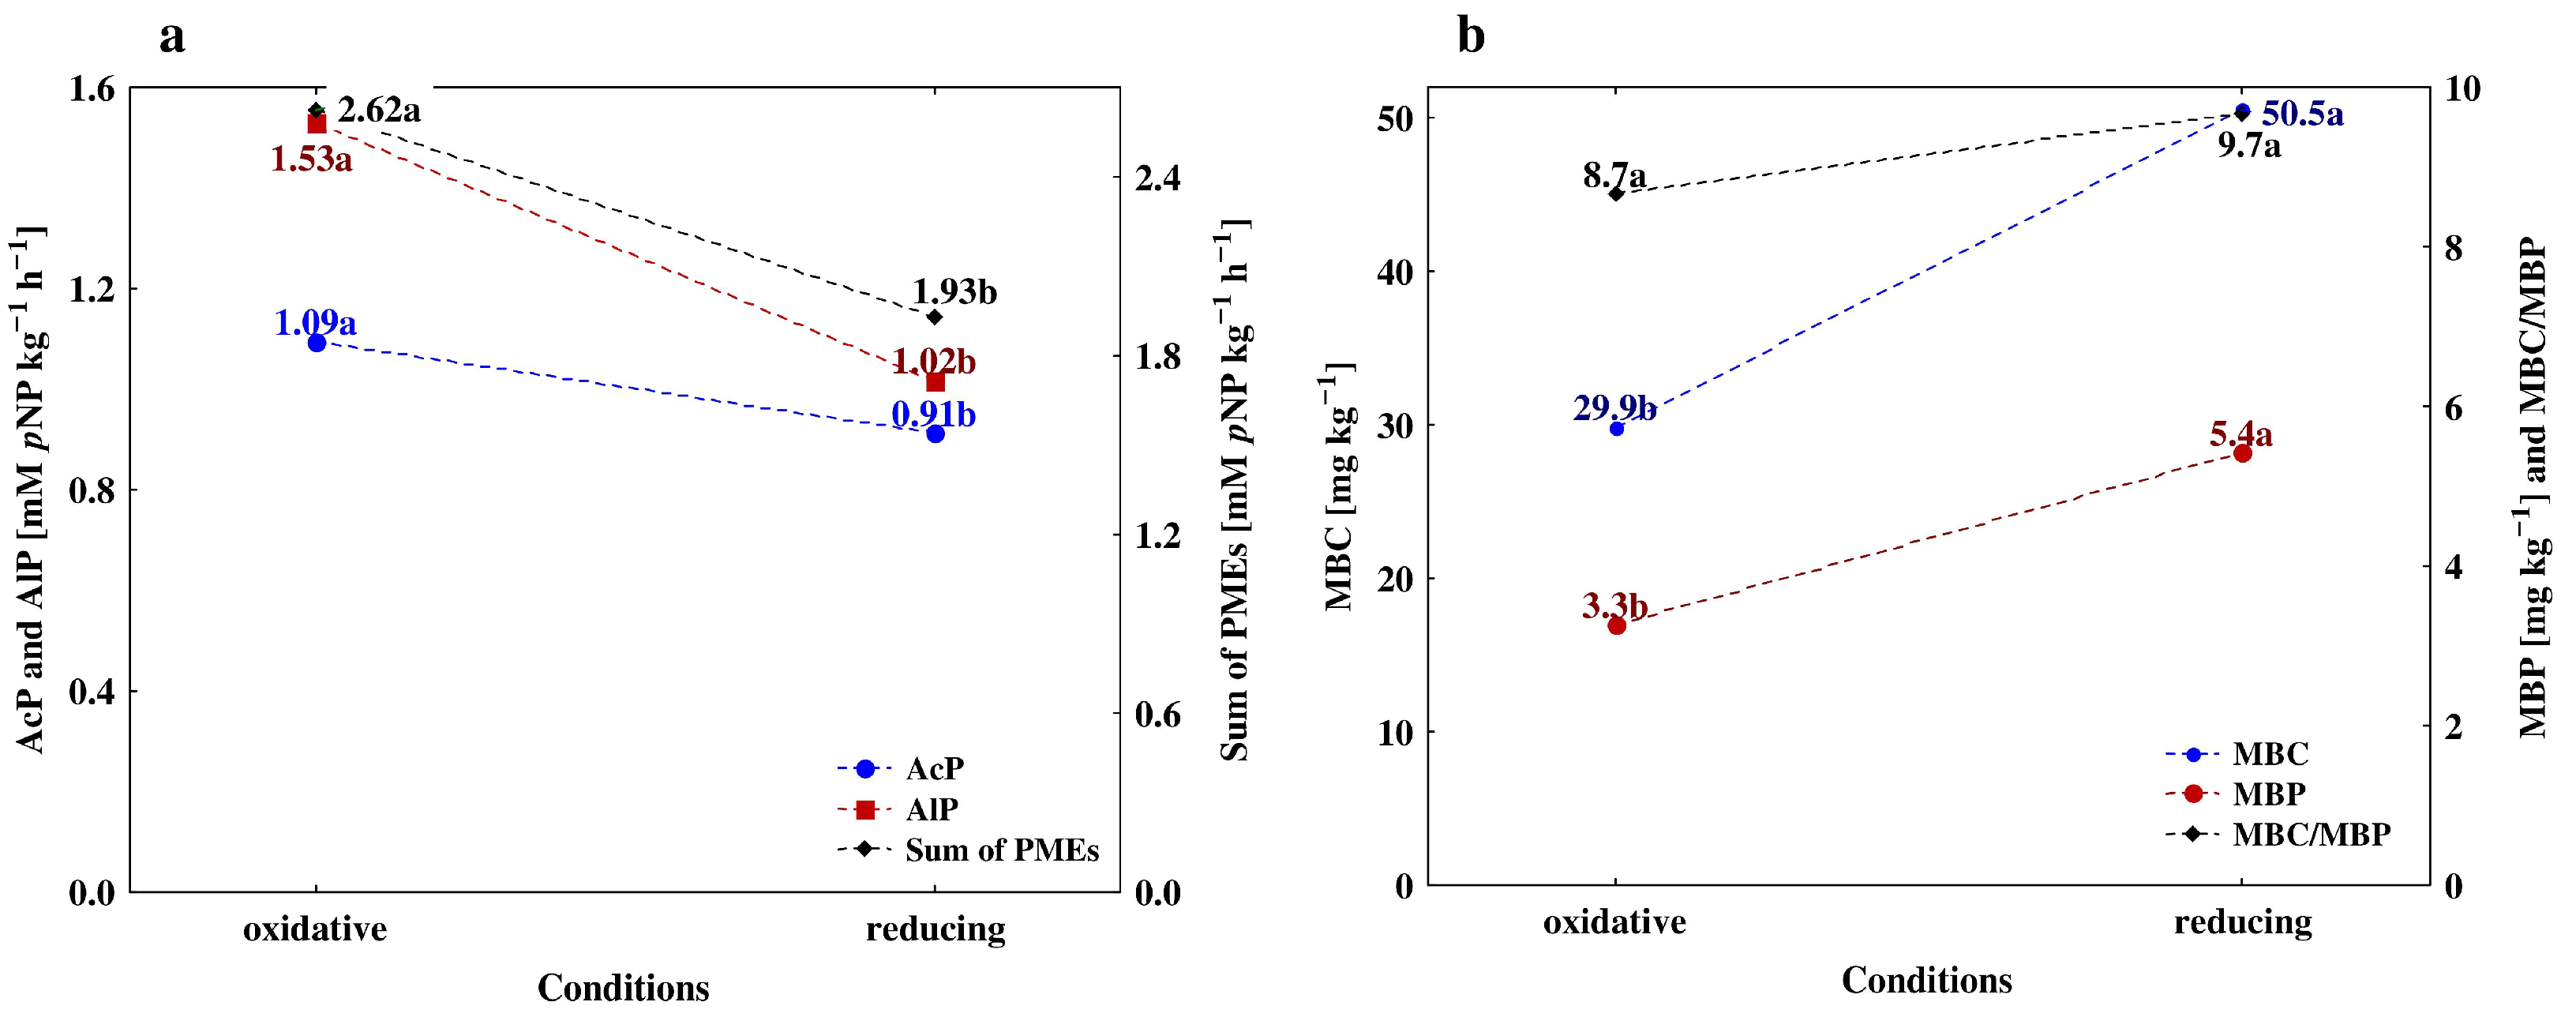
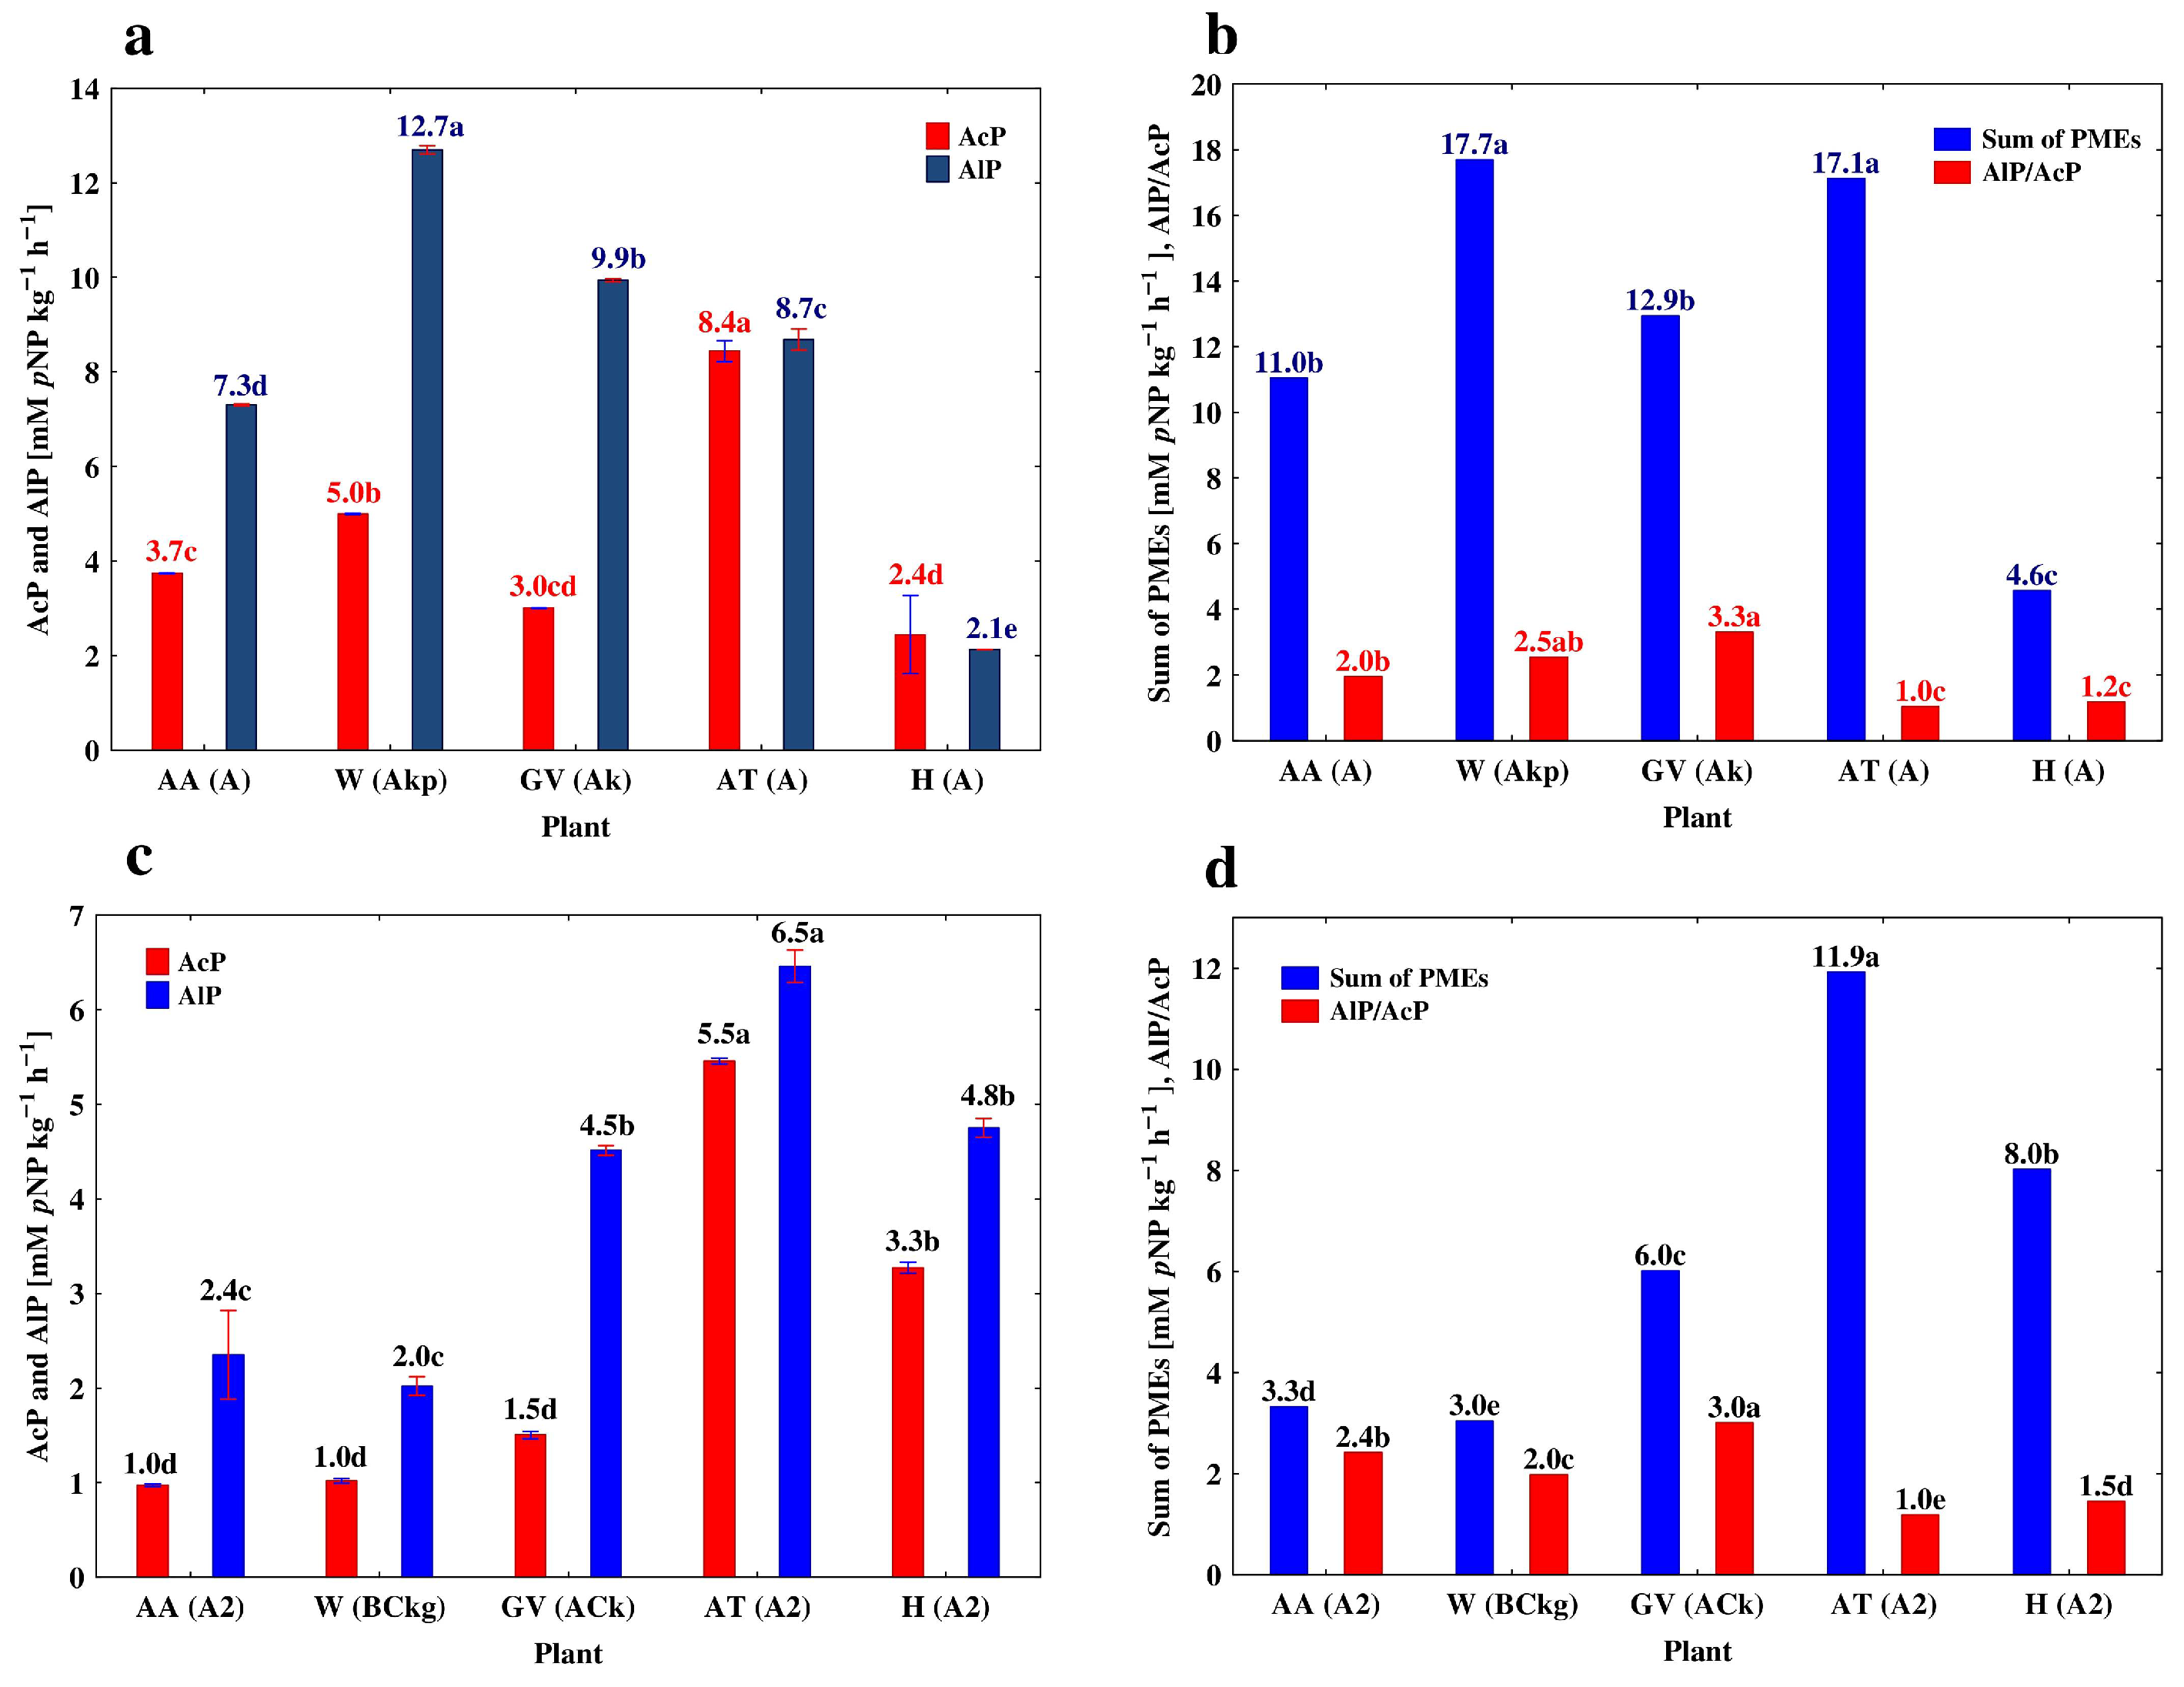
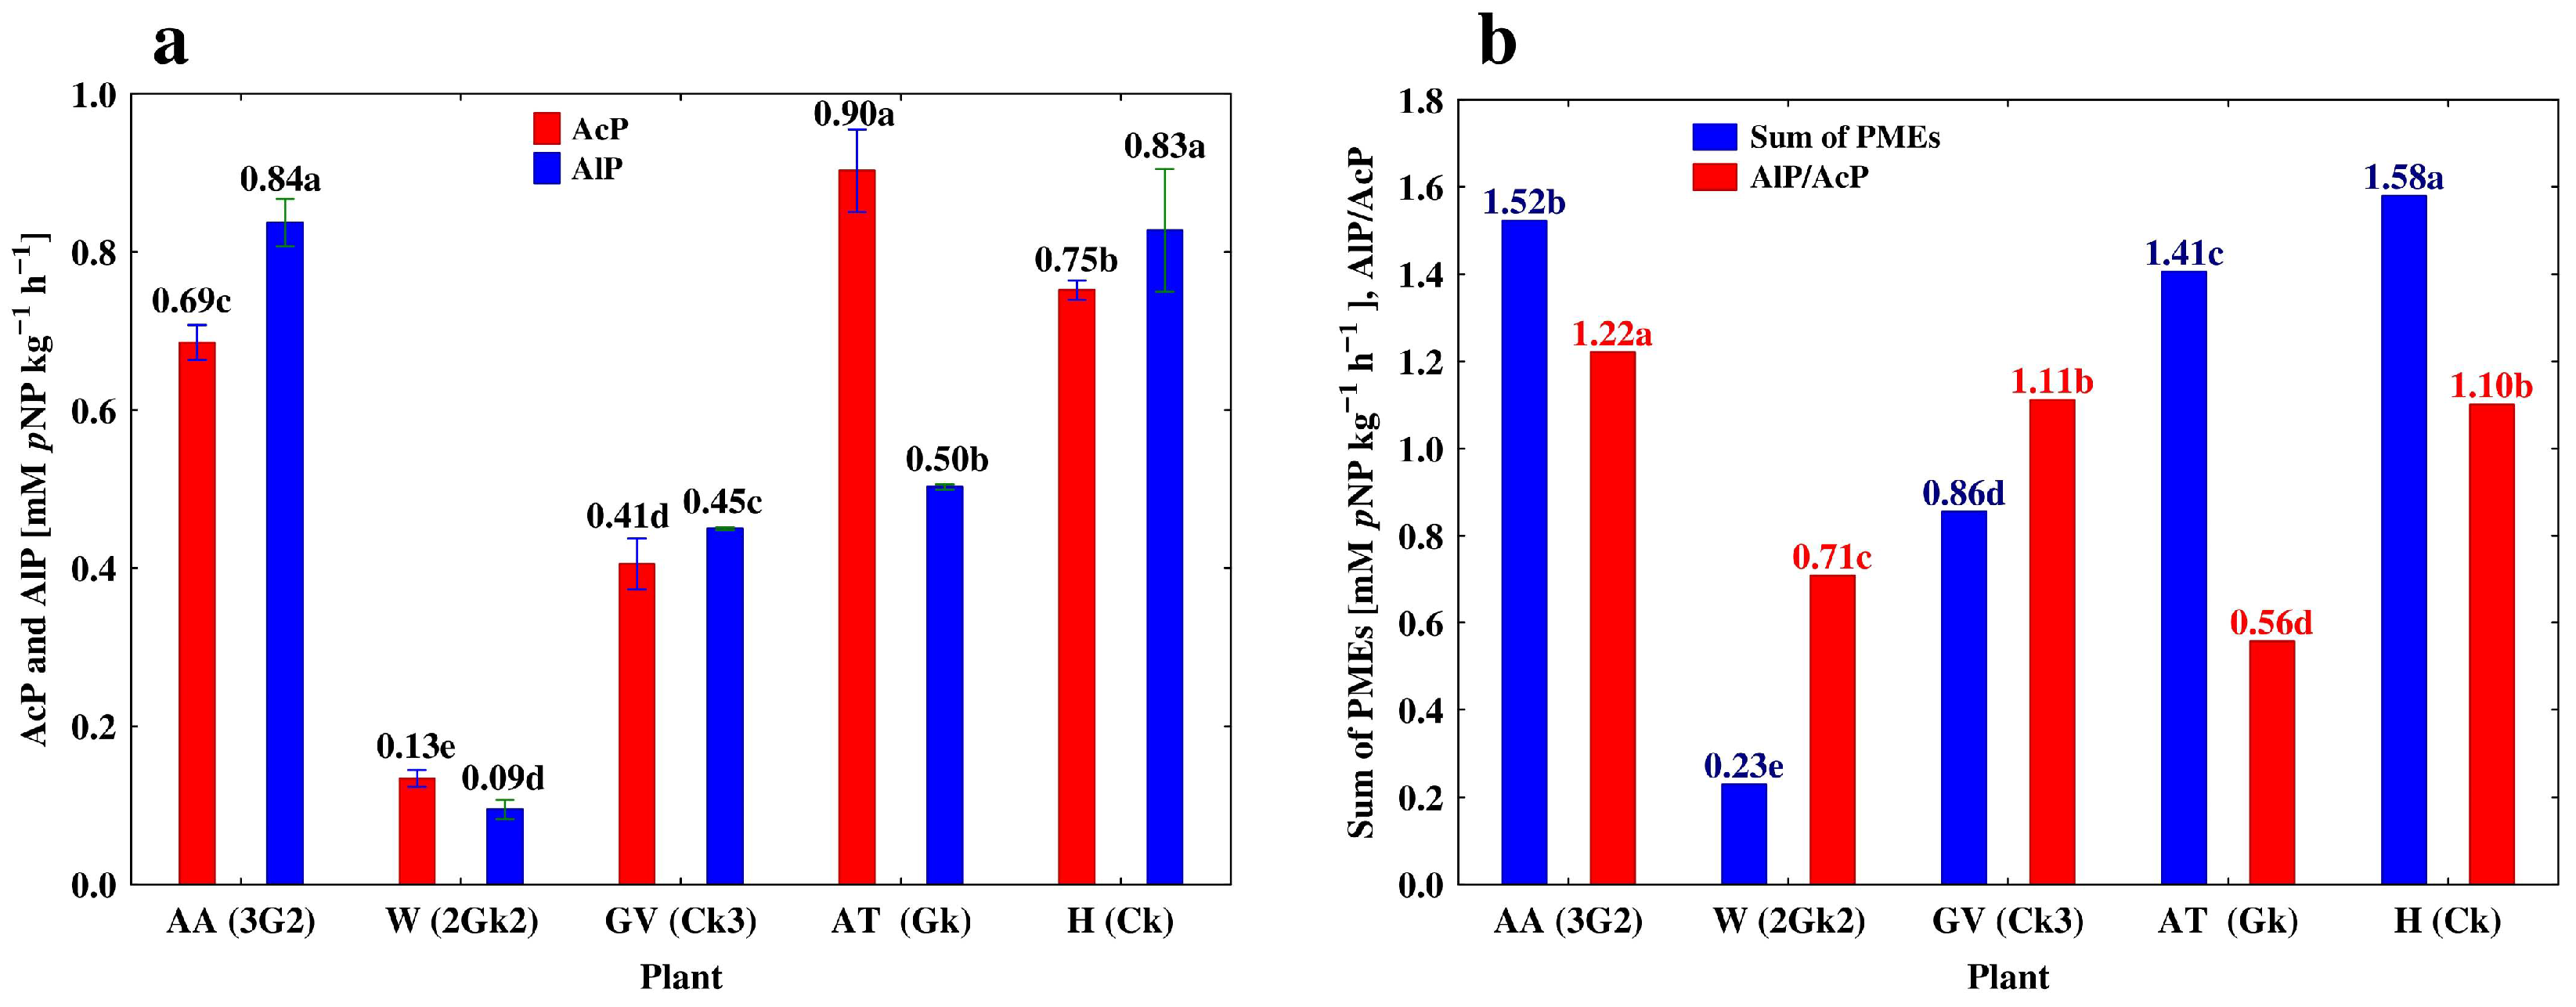
3.3. Depth-Related Changes in the Activities of P-Acquiring Enzymes
3.4. Root Biomass and Morphology
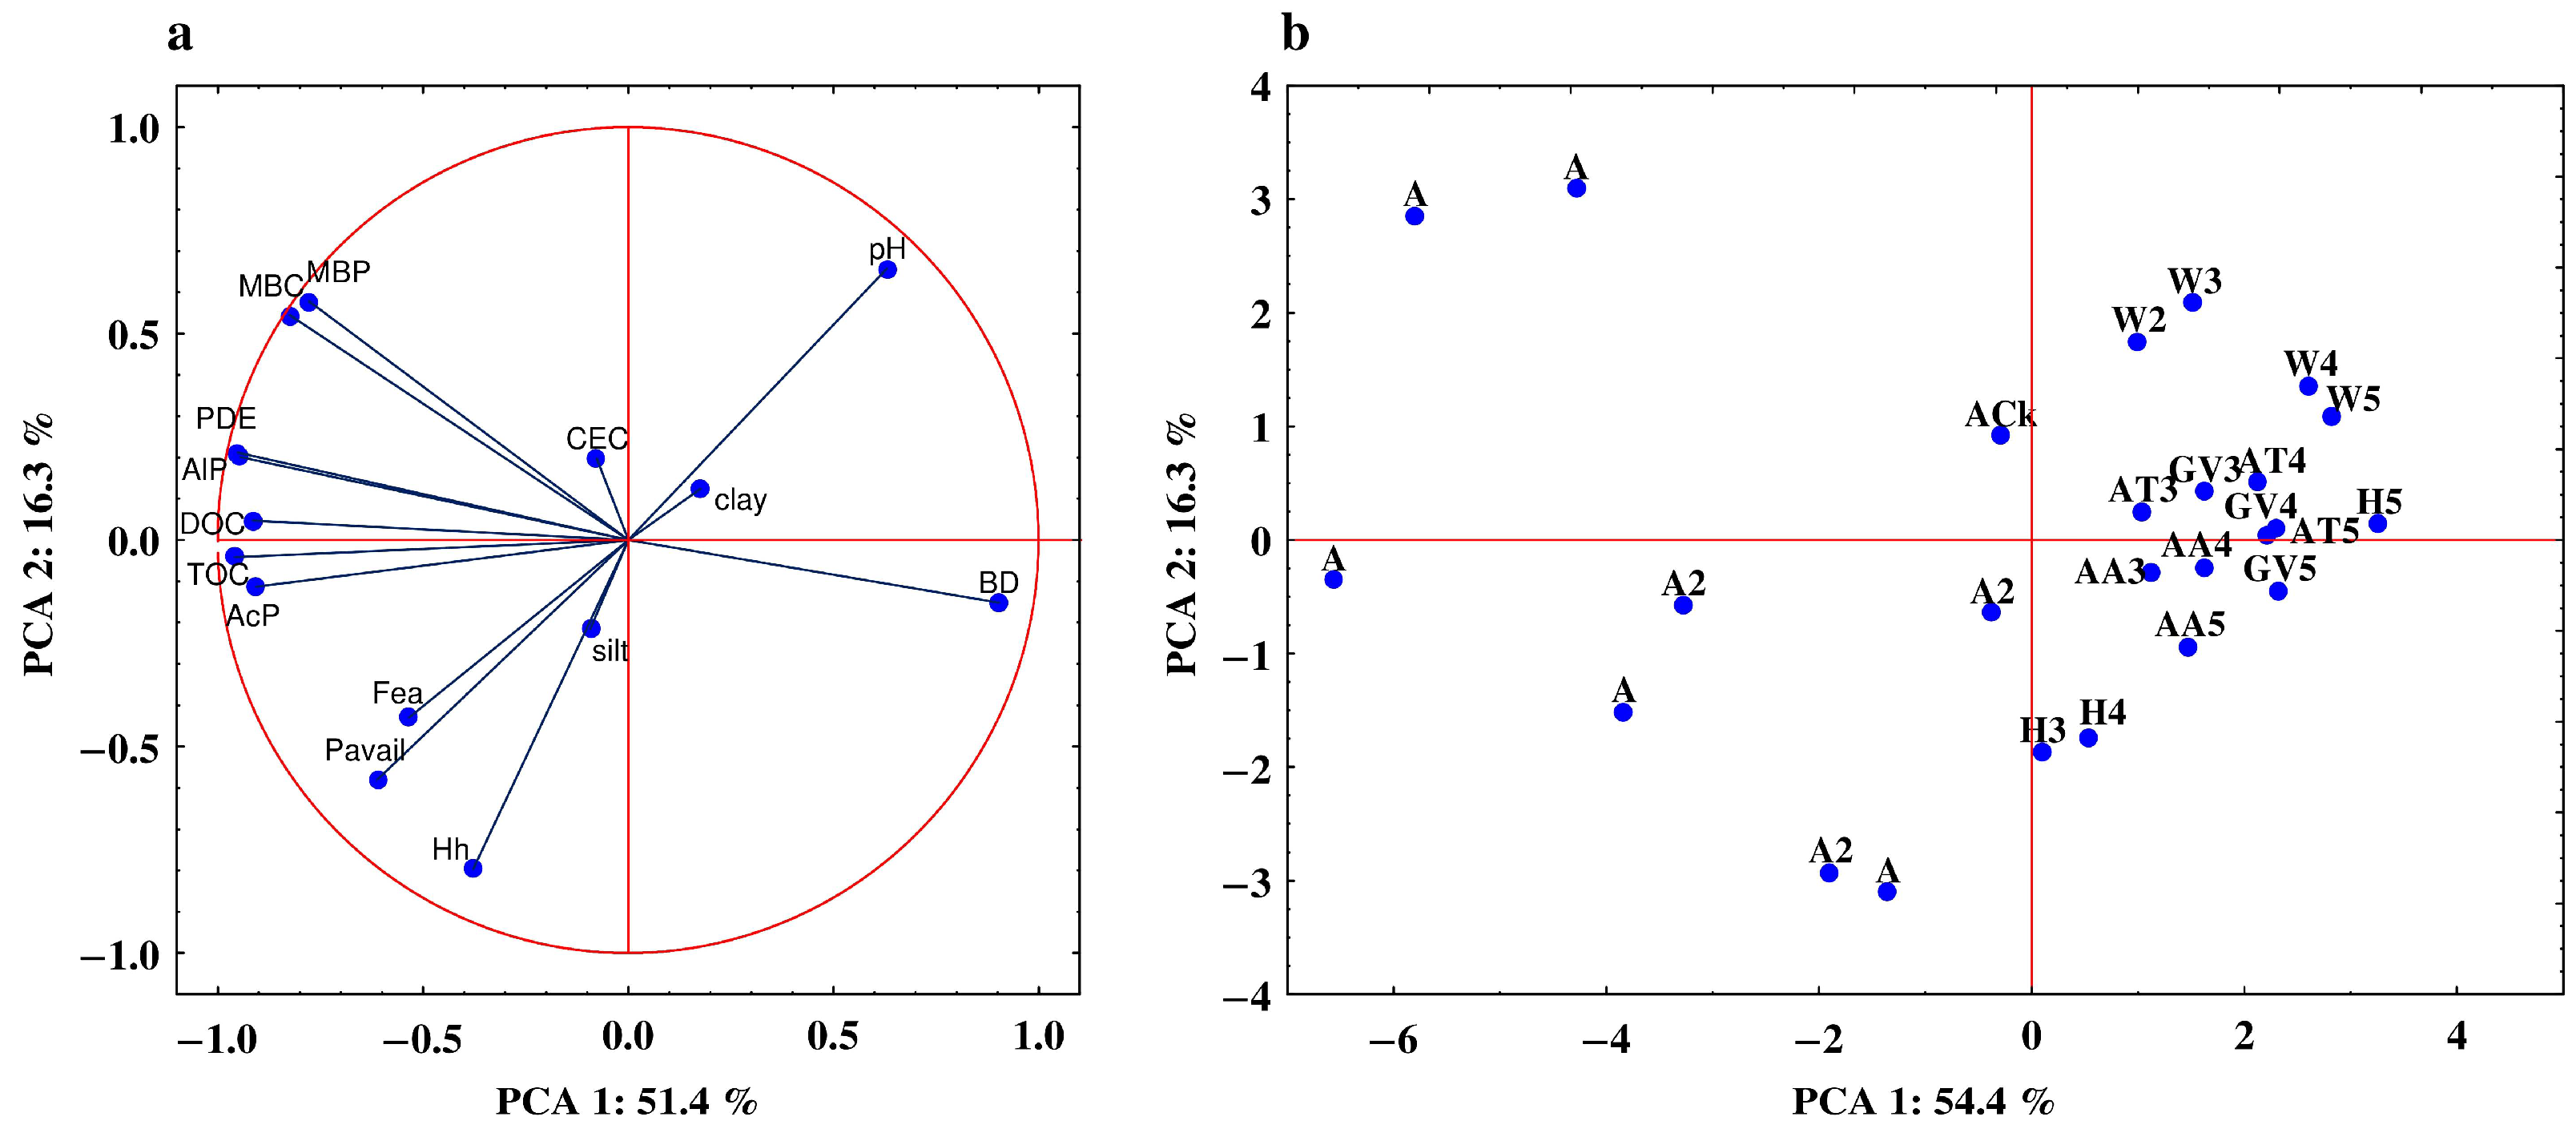
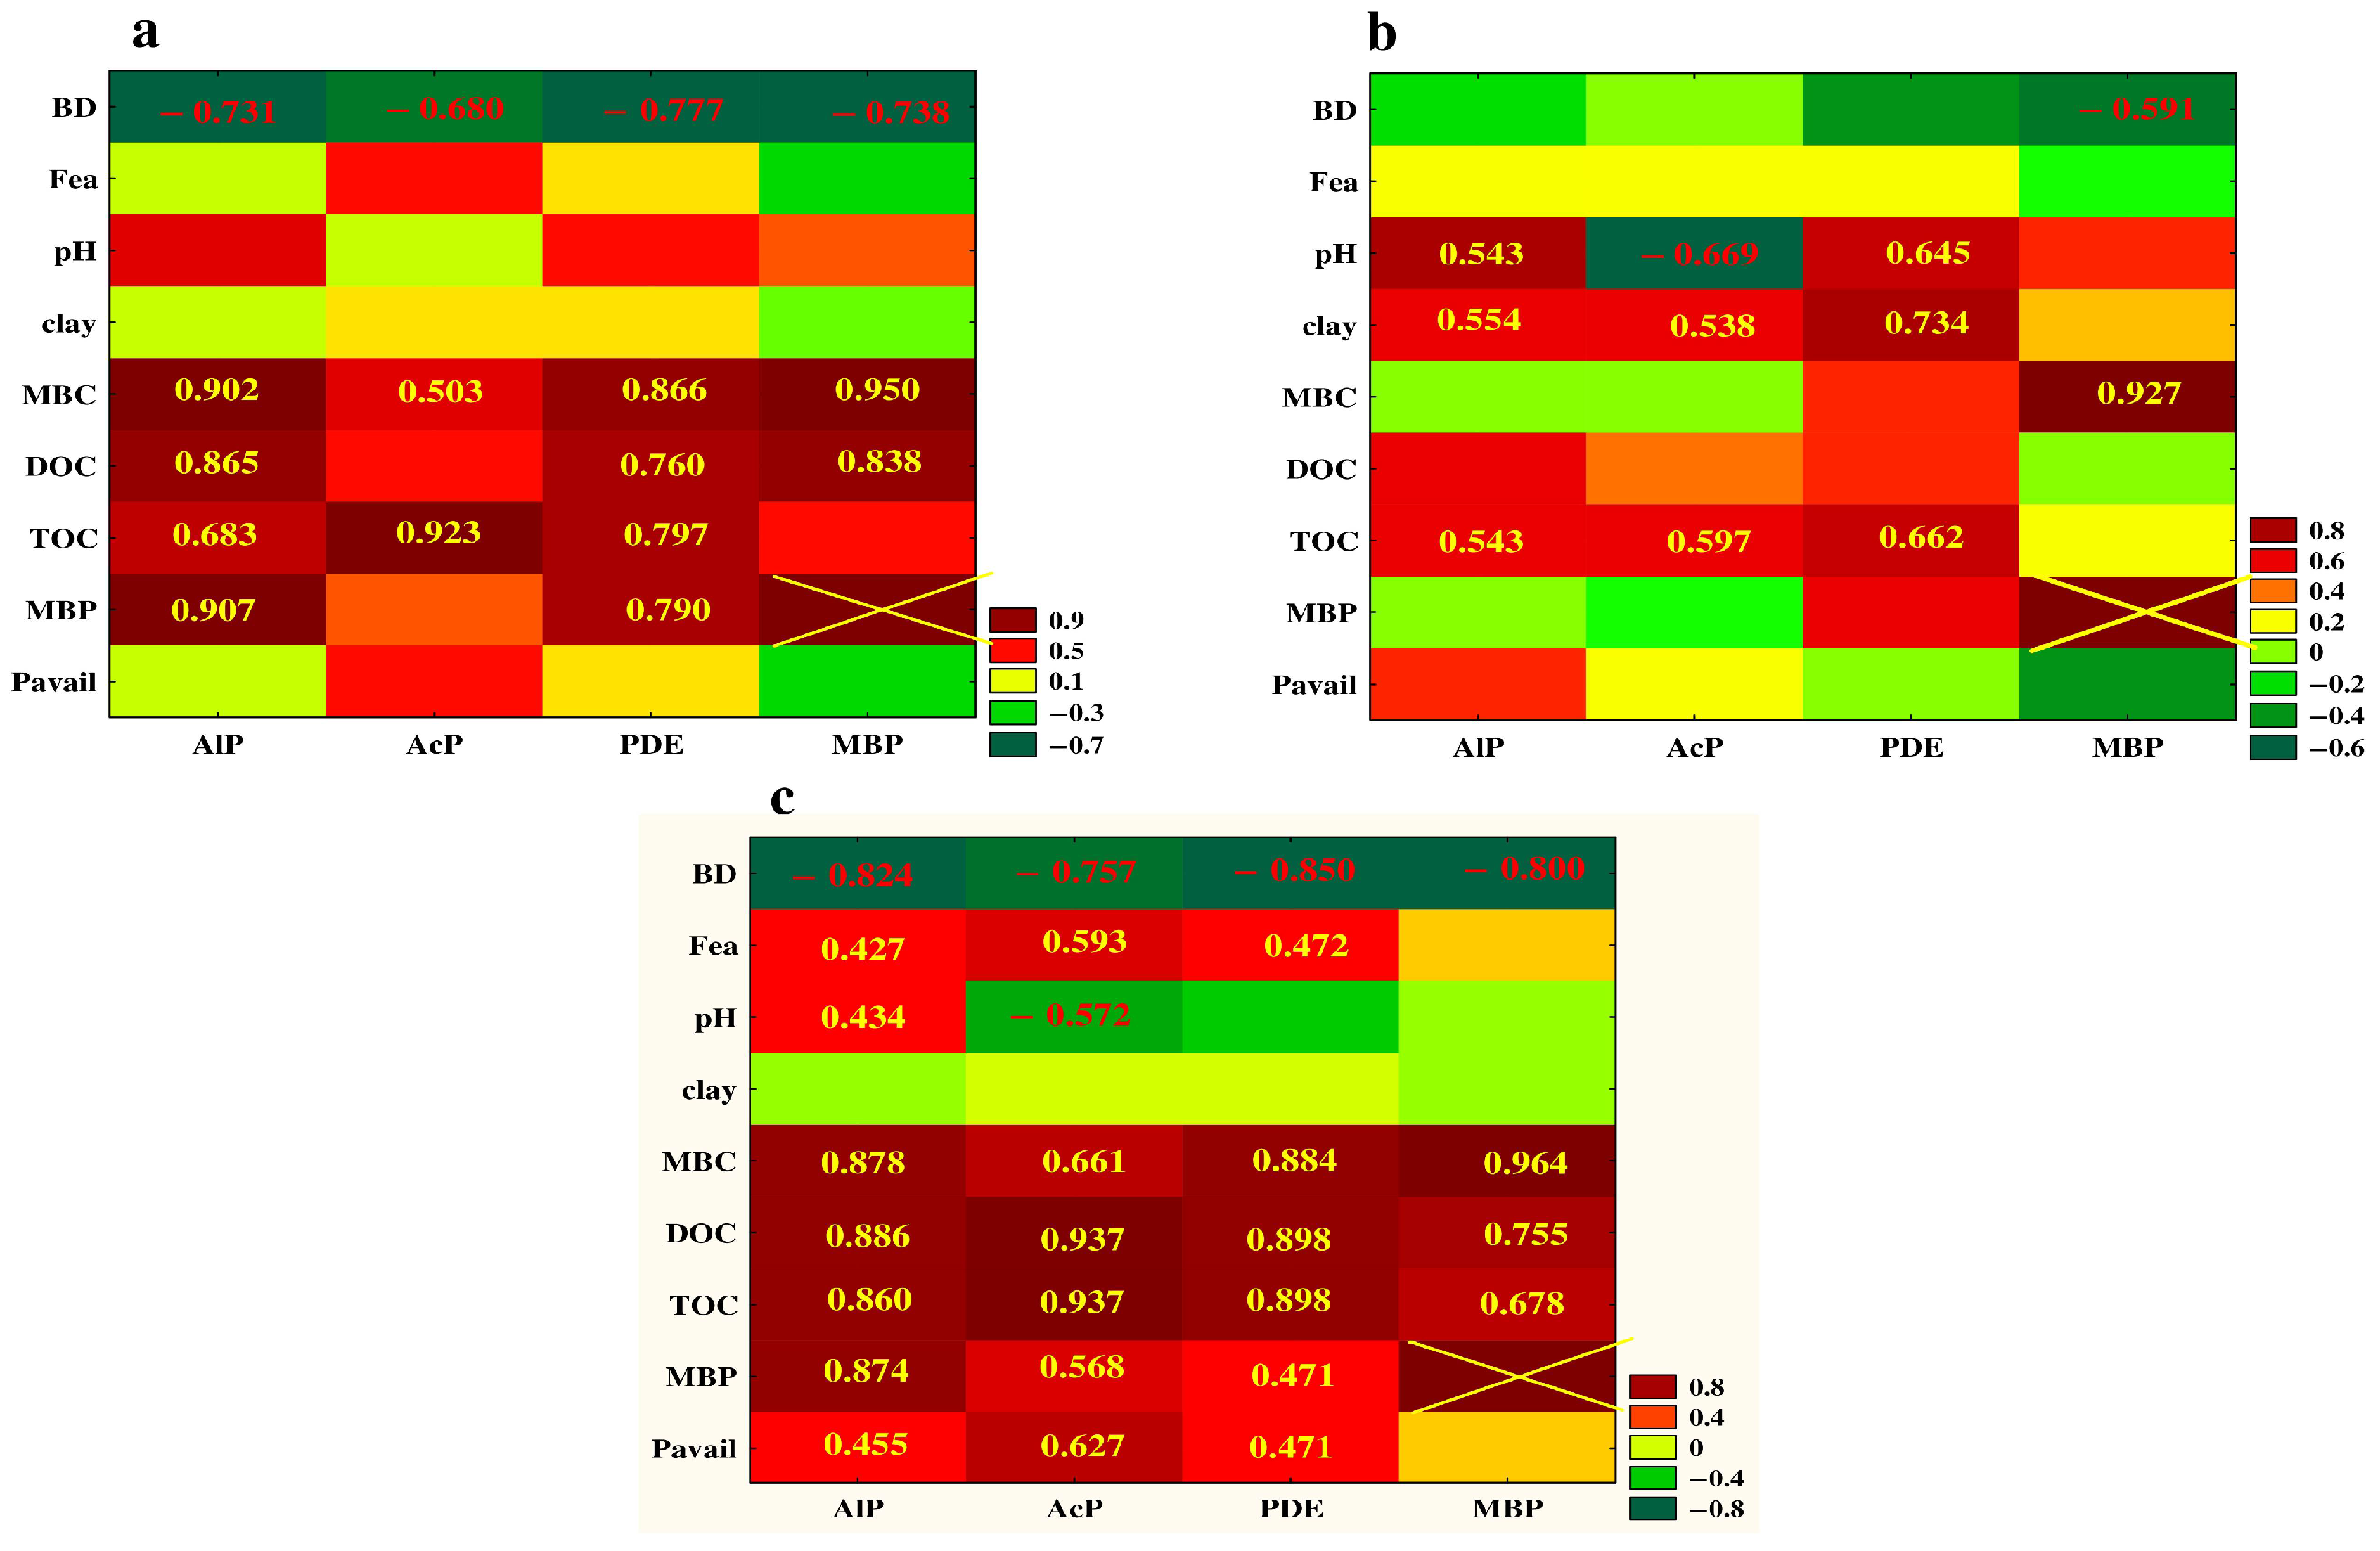
3.5. Relationship between the Studied Properties—Analysis of Correlation and PCA
4. Discussion
4.1. Vertical Differentiation in Soil Enzyme Activities—The Effect of Different Agricultural Land Use
4.2. The Effect of Soil Depth and Pedogenic Processes on the Studeod Properties
5. Conclusions
Author Contributions
Funding
Institutional Review Board Statement
Data Availability Statement
Acknowledgments
Conflicts of Interest
References
- Condron, L.M.; Turner, B.L.; Cade-Menun, B.J. Chemistry and dynamics of soil organic phosphorus. In Phosphorus: Agriculture and the Environment, Agronomy Monograph; Sims, J.T., Sharpley, A.N., Eds.; Soil Science Society of America: Madison, WI, USA, 2005; Volume 46, pp. 87–121. [Google Scholar]
- Cade-Menun, B.J. Characterizing phosphorus forms in cropland soils with solution 31P-NMR: Past studies and future research needs. Chem.Biol. Technol. Agric. 2017, 4, 19. [Google Scholar] [CrossRef]
- Oliveiro, A.M.; Bisset, A.; McGuire, K.; Saltonstall, K.; Turner, B.J.; Fierer, N. The Role of phosphorus limitation in shaping soil bacterial communities and their metabolic capabilities. mBio 2020, 11, e01718-20. [Google Scholar] [CrossRef] [PubMed]
- Kehler, A.; Haygarth, P.; Tamburini, F.; Blackwell, M. Cycling of reduced phosphorus compounds in soil and potential impacts of climate change. Eur. J. Soil Sci. 2021, 72, 2517–2537. [Google Scholar] [CrossRef]
- Nowak, B. Environmental chemistry of phosphonates. Water Res. 2003, 37, 2533–2546. [Google Scholar] [CrossRef]
- Ternan, N.M.G.; McMullan, J.; Quinn, J. Review: Organophosphonates: Occurrence, synthesis and biodegradation by microorganisms. World J. Microbiol. Biotechnol. 1998, 14, 635–647. [Google Scholar] [CrossRef]
- Darcy, J.L.; Schmidt, S.K.; Knelman, J.E.; Cleveland, C.C.; Castele, S.C.; Nemergut, D.R. Phosphorus, not nitrogen, limits plants and microbial primary producers following glacial retreat. Sci. Adv. 2018, 4, eaaq0942. [Google Scholar] [CrossRef] [Green Version]
- Vitousek, P.M.; Porder, S.; Houlton, B.Z.; Chadwick, O.A. Terrestrial phosphorus limitation: Mechanisms, implications, and nitrogenphosphorus interactions. Ecol. Appl. 2010, 20, 5–15. [Google Scholar] [CrossRef] [Green Version]
- Cui, Y.; Wang, X.; Zhang, X.; Ju, W.; Duan, C.; Guo, X.; Wang, Y.; Fang, L. Soil moisture mediates microbial carbon and phosphorus metabolism during vegetation succession in a semiarid region. Soil Biol. Biochem. 2020, 147, 107814. [Google Scholar] [CrossRef]
- Liu, J.; Chen, J.; Chen, G.; Guo, J.; Li, Y. Enzyme stoichiometry indicates the variation of microbial nutrient requirements at different soil depths in subtropical forests. PLoS ONE 2020, 15, e0220599. [Google Scholar] [CrossRef] [Green Version]
- Fujita, K.; Kunito, T.; Moro, H.; Toda, H.; Otsuka, S.; Nagaoka, K. Microbial resource allocation for phosphatase synthesis reflects the availability of inorganic phosphorus across various soils. Biogeochemistry 2017, 136, 325–339. [Google Scholar] [CrossRef]
- Araujo, A.S.F.; Bonifacio, A.; Pereira, A.P.d.A.; Medeiros, E.V.; Araujo, F.F.; Mendes, L.W. Enzymatic Stoichiometry in Soils from Physiognomies of Brazilian Cerrado. J. Soil Sci. Plant Nutr. 2022, 22, 2735–2742. [Google Scholar] [CrossRef]
- Herold, N.; Schöning, I.; Berner, D.; Haslwimmer, H.; Kandeler, E.; Michalyik, B.; Schrumpf, M. Vertical gradient of potential enzymes activities in soil profiles of European beech, Norwaz spruce and Scots pine dominated forest sites. Pedobiol. J. Soil Ecol. 2014, 57, 181–189. [Google Scholar] [CrossRef]
- Guilbeault-Mayers, X.; Turner, B.J.; Laliberté, E. Greater root phosphatase activity of tropical trees at low phosphorus despite strong variation among species. Ecology 2020, 101, e03090. [Google Scholar] [CrossRef]
- Nannipieri, P.; Giagnoni, L.; Landi, L.; Renella, G. Role of Phosphatase Enzymes in Soil. In Soil Biology, 26. Phosphorus in Action; Bünemann, E., Oberson, A., Frossard, A.E., Eds.; Springer-Verlag: Berlin/Heidelberg, Germany, 2011; pp. 230–243. [Google Scholar]
- Orczewska, A.; Piotrowska, A.; Lemanowicz, J. Soil acid phosphomonoesterase activity and phosphorus forms in ancient and post-agricultural black alder [Alnus glutinosa (L.) Gaertn.] woodlands. Acta Soc. Bot. Pol. 2012, 81, 81–86. [Google Scholar] [CrossRef]
- Rejšek, K.; Vranová, V.; Pavelka, M.; Formánek, P. Acid phosphomonoesterase (E.C. 3.1.3.2) location in soil. J. Plant Nutr. Soil Sci. 2012, 175, 196–211. [Google Scholar] [CrossRef]
- Acuña, J.J.; Durán, P.; Lagos, L.; Ogram, A.; Luz Mora, M. Bacterial alkaline phosphomonoesterase in the rhizospheres of plants grown in Chilean extreme environments. Biol. Fertil. Soils 2016, 52, 763–773. [Google Scholar] [CrossRef]
- Margalef, O.; Sardans, J.; Fernández-Martínez, M.; Molowny-Horas, R.; Janssens, I.A.; Ciais, P.; Goll, D.; Richter, A.; Obersteiner, M.; Asensio, D.; et al. Global patterns of phosphatase activity in natural soils. Sci. Rep. 2017, 7, 1–13. [Google Scholar] [CrossRef] [Green Version]
- Sirová, D.; Rejmánková, E.; Carlson, E.; Vrba, J. Current standard assays using artificial substrates overestimate phosphodiesterase activity. Soil Biol. Biochem. 2012, 56, 75–79. [Google Scholar] [CrossRef]
- Makarov, M.; Haumaier, L.; Zech, W. The nature and origins of diester phosphates in soils: A 31 P-NMR study. Biol. Fertil. Soils 2002, 35, 136–146. [Google Scholar]
- Turner, B.L.; Newman, S. Phosphorus cycling in wetland soils: The importance of phosphate diesters. J. Environ. Qual. 2005, 34, 1921–1929. [Google Scholar] [CrossRef] [Green Version]
- Hui, D.; Mayes, M.; Wang, G. Kinetic parameters of phosphatase: A quantitative synthesis. Soil Biol. Biochem. 2013, 65, 105–113. [Google Scholar] [CrossRef]
- Gu, C.; Dam, T.; Hart, S.C.; Turner, B.L.; Chadwick, O.A.; Berhe, A.A.; Hu, Y.; Zhu, M. Quantifying uncertainties in sequential chemical extraction of soil phosphorus using XANES spectroscopy. Environ. Sci. Technol. 2020, 54, 2257–2267. [Google Scholar] [CrossRef] [PubMed]
- Jorquera, M.A.; Hernandez, M.T.; Rengel, Z.; Marschner, P.; de la Luz Mora, M. Isolation of culturable phosphobacteria with both phytatemineralization and phosphate-solubilization activity from the rhizosphere of plants grown in a volcanic soil. Biol. Fertil. Soils 2008, 44, 1025–1034. [Google Scholar] [CrossRef]
- Richardson, A.E.; Barea, J.; McNeill, A.M.; Prigent-Combaret, C. Acquisition of phosphorus and nitrogen in the rhizosphere and plant growth promotion by microorganisms. Plant Soil 2009, 321, 305–339. [Google Scholar] [CrossRef]
- Wu, J.; Huang, M.; Xiao, H.; Su, Y.; Tong, C.; Huang, D. Dynamics in microbial immobilization and transformations of phosphorus in highly weathered subtropical soil following organic amendments. Plant Soil 2007, 290, 333–342. [Google Scholar] [CrossRef]
- Richardson, A.E.; Simpson, R.J. Soil microorganisms mediating phosphorus availability update on microbial phosphorus. Plant Physiol. 2011, 156, 989–996. [Google Scholar] [CrossRef] [Green Version]
- Turner, B.L.; Lambers, H.; Condron, L.M.; Cramer, M.D.; Leake, J.R.; Richardson, A.E.; Smith, S.E. Soil microbial biomass and the fate of phosphorus during long-term ecosystem development. Plant Soil 2013, 367, 225–234. [Google Scholar] [CrossRef]
- Sugito, T.; Yoshida, K.; Takebe, M.; Shinano, T.; Toyota, K. Soil microbial biomass phosphorus as an indicator of phosphorus availability in a Gleyic Andosol. Soil Sci. Plant Nutr. 2010, 56, 390–398. [Google Scholar] [CrossRef]
- Sun, T.; Wang, Y.; Lucas-Borja, M.E.; Jing, X.; Feng, W. Divergent vertical distributions of microbial biomass with depth among groups and land uses. J. Environ. Manag. 2021, 292, 112755. [Google Scholar] [CrossRef]
- Dove, N.C.; Arogyaswamy, K.; Billings, S.A.; Botthoff, J.K.; Carey, C.J.; Cisco, C.; DeForest, J.L.; Fairbanks, D.; Fierer, N.; Gallery, R.E.; et al. Continental-scale patterns of extracellular enzyme activity in the subsoil: An overlooked reservoir of microbial activity. Environ. Res. Lett. 2020, 15, 1040a1. [Google Scholar] [CrossRef]
- Marinari, S.; Marabottini, R.; Falsone, G.; Vianello, G.; Vittori Antisari, L.; Agnelli, A.; Massaccesi, L.; Cocco, S.; Cardelli, V.; Serrani, D.; et al. Mineral weathering and lessivage affect microbial community and enzyme activity in mountain soils. Appl. Soil Ecol. 2021, 167, 104024. [Google Scholar] [CrossRef]
- Senga, Y.; Hiroki, M.; Nakamura, Y.; Watarasi, Y.; Watanabe, Y.; Nohara, S. Vertical profiles of DIN, DOC, and microbial activities in the wetland soil of Kushiro Mire, northeastern Japan. Limnology 2011, 12, 17–23. [Google Scholar] [CrossRef]
- Jing, X.; Chen, X.; Tang, M.; Ding, Z.; Jiang, L.; Li, P.; Tian, D.; Xu, L.; Zhu, J.; Ji, C.; et al. Nitrogen deposition has minor effect on soil extracellular enzyme activities in six Chinese forests. Sci. Total Environ. 2017, 607–608, 806–815. [Google Scholar] [CrossRef] [PubMed]
- Salome, C.; Nunan, N.; Pouteau, V.; Lerch, T.Z.; Chenu, C. Carbon dynamics in topsoil and in subsoil may be controlled by different regulatory mechanisms. Glob. Chang. Biol. 2010, 16, 416–426. [Google Scholar] [CrossRef]
- Brewer, T.E.; Aronson, E.L.; Arogyaswamy, K.; Billings, S.A.; Botthoff, J.K.; Campbell, A.N.; Dove, N.C.; Fairbanks, D.; Gallery, R.E.; Hart, S.C.; et al. Ecological and genomic attributes of novel bacterial taxa that thrive in subsurface soil horizons. mBio 2019, 10, e1318-19. [Google Scholar] [CrossRef] [PubMed] [Green Version]
- Brassard, B.W.; Chen, H.Y.H.; Cavard, X.; Laganiére, J.; Reich, P.B.; Bergeron, Y.; Paré, D.; Yuan, Z.Y. Tree species diversity increases fine root productivity through increased soil volume filling. J. Ecol. 2013, 101, 210–219. [Google Scholar] [CrossRef]
- Xiong, Q.; Hu, J.; Wei, H.; Zhang, H.; Zhu, J. Relationship between plant roots, rhizosphere microorganisms, and nitrogen and its special focus on rice. Agriculture 2021, 11, 234. [Google Scholar] [CrossRef]
- Kompała-Bąba, A.; Bierza, W.; Sierka, E.; Błońska, A.; Besenyei, L.; Woźniak, G. The role of plants and soil properties in the enzyme activities of substrates on hard coal mine spoil heaps. Sci. Rep. 2021, 11, 5155. [Google Scholar] [CrossRef]
- Stone, M.M.; De Forest, J.L.; Plante, A.F. Changes in extracellular enzyme activity and microbial community structure with soil depth at the Luquillo Critical Zone Observatory. Soil Biol. Biochem. 2014, 75, 237–247. [Google Scholar] [CrossRef]
- Piotrowska-Długosz, A.; Długosz, J.; Gryta, A.; Frac, M. Responses of N-cycling enzyme activities and functional diversity of soil microorganisms to soil depth, pedogenic processes and cultivated plants. Agronomy 2022, 12, 264. [Google Scholar] [CrossRef]
- Weldmichael, T.G.; Michéli, E.; Fodor, H.; Simon, B. The influence of depth on soil chemical properties and microbial respiration in the upper soil horizons. Eur. Soil. Sci. 2020, 53, 780–786. [Google Scholar] [CrossRef]
- Jackson, C.R.; Thomson, J.A.; Kolka, R.K. Wetland Soils, Hydrology, and Geomorphology. In Ecology of Freshwater and Estuarine Wetlands Soil; Batzer, D., Sharitz, R., Eds.; University of California Press: Berkeley, CA, USA, 2014; pp. 23–60. [Google Scholar]
- Quénard, L.; Samouëlian, A.; Larche, B.; Cornu, S. Lessivage as a major process of soil formation: A revisitation of existing data. Geoderma 2011, 167–168, 135–147. [Google Scholar] [CrossRef]
- Cornu, S.; Quénard, L.; Cousin, I.; Samouëlian, A. Experimental approach of lessivage: Quantification and mechanisms. Geoderma 2014, 213, 357–370. [Google Scholar] [CrossRef]
- Świtoniak, M.; Mroczek, P.; Bednarek, R. Luvisols or Cambisols? Micromorphological study of soil truncation in Young morainic landscapes—Case study: Brodnica and Chełmno Lake Districts (North Poland). Catena 2016, 137, 583–595. [Google Scholar] [CrossRef]
- Olagoke, K.F.; Kalbitz, K.; Vogel, C. Control of soil extracellular enzyme activities by clay minerals-perspectives on microbial responses. Soil Syst. 2019, 3, 64. [Google Scholar] [CrossRef] [Green Version]
- Zimmerman, A.R.; Ahn, M.Y. Organo-Mineral–Enzyme Interaction and Soil Enzyme Activity. In Soil Enzymology; Shukla, G., Varma, A., Eds.; Springer Berlin Heidelberg: Berlin/Heidelberg, Germany, 2011; pp. 271–292. [Google Scholar]
- Polish Norm PN-ISO 11277; Soil Quality—Determination of Particle Size Distribution in Mineral Soil Material—Method by Sieving and Sedimentation. Polish Committee for Standardization: Warsaw, Poland, 2005.
- Polish Norm PN-ISO 10390; Soil Quality—Determination of Soil pH. Polish Committee for Standardization: Warsaw, Poland, 1997.
- Egnér, H.; Riehm, H.; Domingo, W.R. Studies concerning the chemical analysis of soils as background for soil nutrient assessment II: Chemical extracting methods to determinate the phosphorous and potassium content of soil. Kungl. Lantbr. Ann. 1960, 26, 199–215. (In German) [Google Scholar]
- Schlichting, E.; Blume, H.P. Art und ausmass der veränderung des bestandes mobile oxide in böden aus jungpleistozänem geschiebemergel und ihren horizonten. Z. Pflanz. Bodenkd. 1962, 96, 144–156. [Google Scholar] [CrossRef]
- Soil Survey Staff. Kellogg Soil Survay Laboratory Methods Manual. In Soil Survey Investigations Report; No. 42, version 5.0; Burt, R., Soil Survey Staff, Eds.; U.S. Department of Agriculture, Natural Resources Conservation Service: Washington, DC, USA, 2014. [Google Scholar]
- Tabatabai, M.A.; Bremner, J.M. Use of p-nitrophenyl phosphate for assay of soil phosphatase activity. Soil Biol. Biochem. 1969, 1, 301–307. [Google Scholar] [CrossRef]
- Browman, M.G.; Tabatabai, M.A. Phosphodiesterase activity of soils. Soil Sci. Soc. Am. J. 1978, 42, 284–290. [Google Scholar] [CrossRef]
- Brookes, P.C.; Landman, A.; Pruden, G.; Jenkinson, D.S. Chloroform fumigation and the release of soil nitrogen: A rapid direct extraction method for measuring microbial biomass in soil. Soil Biol. Biochem. 1985, 17, 837–842. [Google Scholar] [CrossRef]
- Vance, E.D.; Brookes, P.C.; Jenkinsen, D.S. An extraction method for measuring soil microbial biomass C. Soil Biol. Biochem. 1987, 19, 703–707. [Google Scholar] [CrossRef]
- Olsen, S.R.; Sommers, L.E. Phosphorus. In Methods of Soil Analysis. Part 2. Chemical and Microbiological Properties; Page, A.L., Ed.; American Society of Agronomy, Soil Science Society of America: Madison, WI, USA, 1982; pp. 403–430. [Google Scholar]
- Arsenault, J.L.; Poulcur, S.; Messier, C.; Guay, R. WIN-RHIZO a root-measuring system with a unique overlap correction method. Hort. Sci. 1995, 30, 906. [Google Scholar]
- TIBCO Statistica Inc. Statistica for Windows; (Statistica v 13.3.); TIBCO Statistica Inc.: Tulsa, OK, USA, 1984–2017. [Google Scholar]
- Bais, H.P.; Park, S.W.; Weir, T.L.; Callaway, R.M.; Vivanco, J.M. How plants communicate using the underground information superhighway. Trends Plant Sci. 2004, 9, 26–32. [Google Scholar] [CrossRef] [PubMed]
- Turner, B.L.; Haygarth, P. Phosphatase activity in temperate pasture soils: Potential regulation of labile organic phosphorus turnover by phosphodiesterase activity. Sci. Total Environ. 2005, 344, 27–36. [Google Scholar] [CrossRef] [PubMed]
- Brook, D.D.; Twieg, B.D.; Grayston, S.J.; Jones, M.D. Physical extent, frequency, and intensity of phosphatase activity varies on soil profiles across a Douglas-fir chronosequence. Soil Biol. Biochem. 2013, 64, 1–8. [Google Scholar] [CrossRef]
- Margalef, O.; Sardans, J.; Maspons, J.; Molowny-Horas, R.; Fernández-Martínez, M.; Janssens, I.; Richter, A.; Ciais, p.; Obersteiner, M.; Peñuelas, J. The effect of global change on soil phosphatase activity. Glob. Chang. Biol. 2021, 27, 5989–6003. [Google Scholar] [CrossRef]
- Loeppmann, S.; Forbush, K.; Chend, W.; Pasuch, J. Subsoil biogeochemical properties induce shift in carbon allocation pattern and soil C dynamics in wheat. Plant Soil 2019, 442, 369–383. [Google Scholar] [CrossRef]
- Fageria, N.K.; Moreira, A. The role of mineral nutrition on root growth of crop plants. Adv. Agron. 2011, 110, 251–331. [Google Scholar]
- Cabugao, K.G.; Timm, C.M.; Carrell, A.A.; Childs, J.; Lu, T.Y.S.; Pelletier, D.A.; Weston, D.J.; Norby, R.J. Root and rhizosphere bacterial phosphatase activity varies with tree species and soil phosphorus availability in Puerto Rico tropical forest. Front. Plant Sci. 2017, 8, 1–14. [Google Scholar] [CrossRef] [Green Version]
- Cabugao, K.G.; Yaffar, D.; Stenson, N.; Childs, J.; Phillips, J.; Mayes, M.A.; Yang, X.; Weston, D.J.; Norby, R.J. Bringing function to structure: Root-soil interactions shaping phosphatase activity throughout a soil profile in Puerto Rico. Ecol. Evol. 2021, 11, 1150–1164. [Google Scholar] [CrossRef]
- Dick, W.A.; Cheng, L.; Wang, P. Soil acid and alkaline phosphatase activity as pH adjustment indicators. Soil Biol. Biochem. 2000, 32, 1915–1919. [Google Scholar] [CrossRef]
- Lemanowicz, J.; Siwik-Ziomek, A.; Koper, J. Effect of spring barley nitrogen fertilisation on the changes in the content of phosphorus and the activity of alkaline and acid phosphatase in soil. Ecol. Chem. Eng. A 2012, 19, 1497–1507. [Google Scholar]
- Parvin, S.; Blagodatskaya, E.; Becker, J.N.; Kuzyakov, Y.; Uddin, S.; Dorodnikov, M. Depth rather than microrelief controls microbial biomass and kinetics of C-, N-, P- and S-cycle enzymes in peatland. Geoderma 2018, 324, 67–76. [Google Scholar] [CrossRef]
- Hallama, M.; Pekrun, C.; Pilz, S.; Jarosch, K.A.; Frąc, M.; Uksa, M.; Marhan, S.; Kandeler, E. Interactions between cover crops and soil microorganisms increase phosphorus availability in conservation agriculture. Plant Soil 2021, 463, 307–328. [Google Scholar] [CrossRef]
- Piotrowska-Długosz, A.; Kobierski, M.; Długosz, J. Enzymatic activity and physico-chemical properties of soil profiles of Luvisols. Materials 2021, 14, 6364. [Google Scholar] [CrossRef]
- Waring, B.G.; Weintraub, S.R.; Sinsabaugh, R.L. Ecoenzymatic stoichiometry of microbial nutrient acquisition in tropical soils. Biogeochemistry 2014, 117, 101–113. [Google Scholar] [CrossRef]
- Guber, A.; Blogodatskaya, E.; Kravchenko, A. Are enzymes transported in soils by water fluxes? Soil Biol. Biochem. 2022, 168, 108633. [Google Scholar] [CrossRef]
- Hsiao, C.J.; Sassenrath, G.F.; Zeglin, L.H.; Hettiarachchi, G.M.; Rice, C.W. Vertical changes of soil microbial properties in claypan soils. Soil Biol. Biochem. 2018, 121, 154–164. [Google Scholar] [CrossRef]
- Chacon, N.; Flores, S.; Gonzalez, A. Implications of iron solubilization on soil phosphorus release in seasonally flooded forests of the lower Orinoco River, Venezuela. Soil Biol. Biochem. 2006, 38, 1494–1499. [Google Scholar] [CrossRef]
- Olander, L.P.; Vitousek, P.M. Regulation of soil phosphatase and chitinase activity by N and P availability. Biogeochemistry 2000, 49, 175–191. [Google Scholar] [CrossRef]
- Kang, H.; Kang, S.; Lee, D. Variations of soil enzyme activities in a temperate forest soil. Ecol. Res. 2009, 24, 1137–1143. [Google Scholar] [CrossRef]
- Reith, F.; Drake, H.L.; Küsel, K. Anaerobic activities of bacteria and fungi in moderately acidic conifer and deciduous leaf litter. FEMS Microbiol. Ecol. 2002, 41, 27–35. [Google Scholar] [CrossRef] [PubMed]
- Burns, R.G.; DeForest, J.L.; Marxsen, J.; Sinsabaugh, R.L.; Stromberger, M.E.; Wallenstein, M.D.; Weintraub, M.N.; Zoppini, A. Soil enzymes in a changing environment: Current knowledge and future directions. Soil Biol. Biochem. 2013, 58, 216–234. [Google Scholar] [CrossRef]
- Bayan, M.R.; Eivazi, F. Selected enzyme activities as affected by free iron oxides and clay particle size. Commun. Soil Sci. Plant Anal. 1999, 30, 1561–1571. [Google Scholar] [CrossRef]
- Vincent, A.G.; Turner, B.L.; Tanner, E.V.J. Soil organic phosphorus dynamics following perturbation of litter cycling in a tropical moist forest. Eur. J. Soil Sci. 2010, 61, 48–57. [Google Scholar] [CrossRef]
- Chao, S.J.; Kim, M.H.; Lee, Y.O. Effect of pH on soil bacterial diversity. J. Ecol. Environ. 2016, 40, 10. [Google Scholar] [CrossRef] [Green Version]
- Rojo, M.J.; Carcedo, S.G.; Mateos, M.P. Distribution and characterization of phosphatase and organic phosphorus in soil fractions. Soil Biol. Biochem. 1990, 22, 169–174. [Google Scholar] [CrossRef]


| Plant | Genetic Horizon | Depth (cm) | Clay | Silt | pH | Hh | CEC | CaCO3 | Fea |
|---|---|---|---|---|---|---|---|---|---|
| (%) | (mmol kg−1) | (%) | (g kg−1) | ||||||
| Profile 1. Mollic Stagnic Gleyosol (MSG) | |||||||||
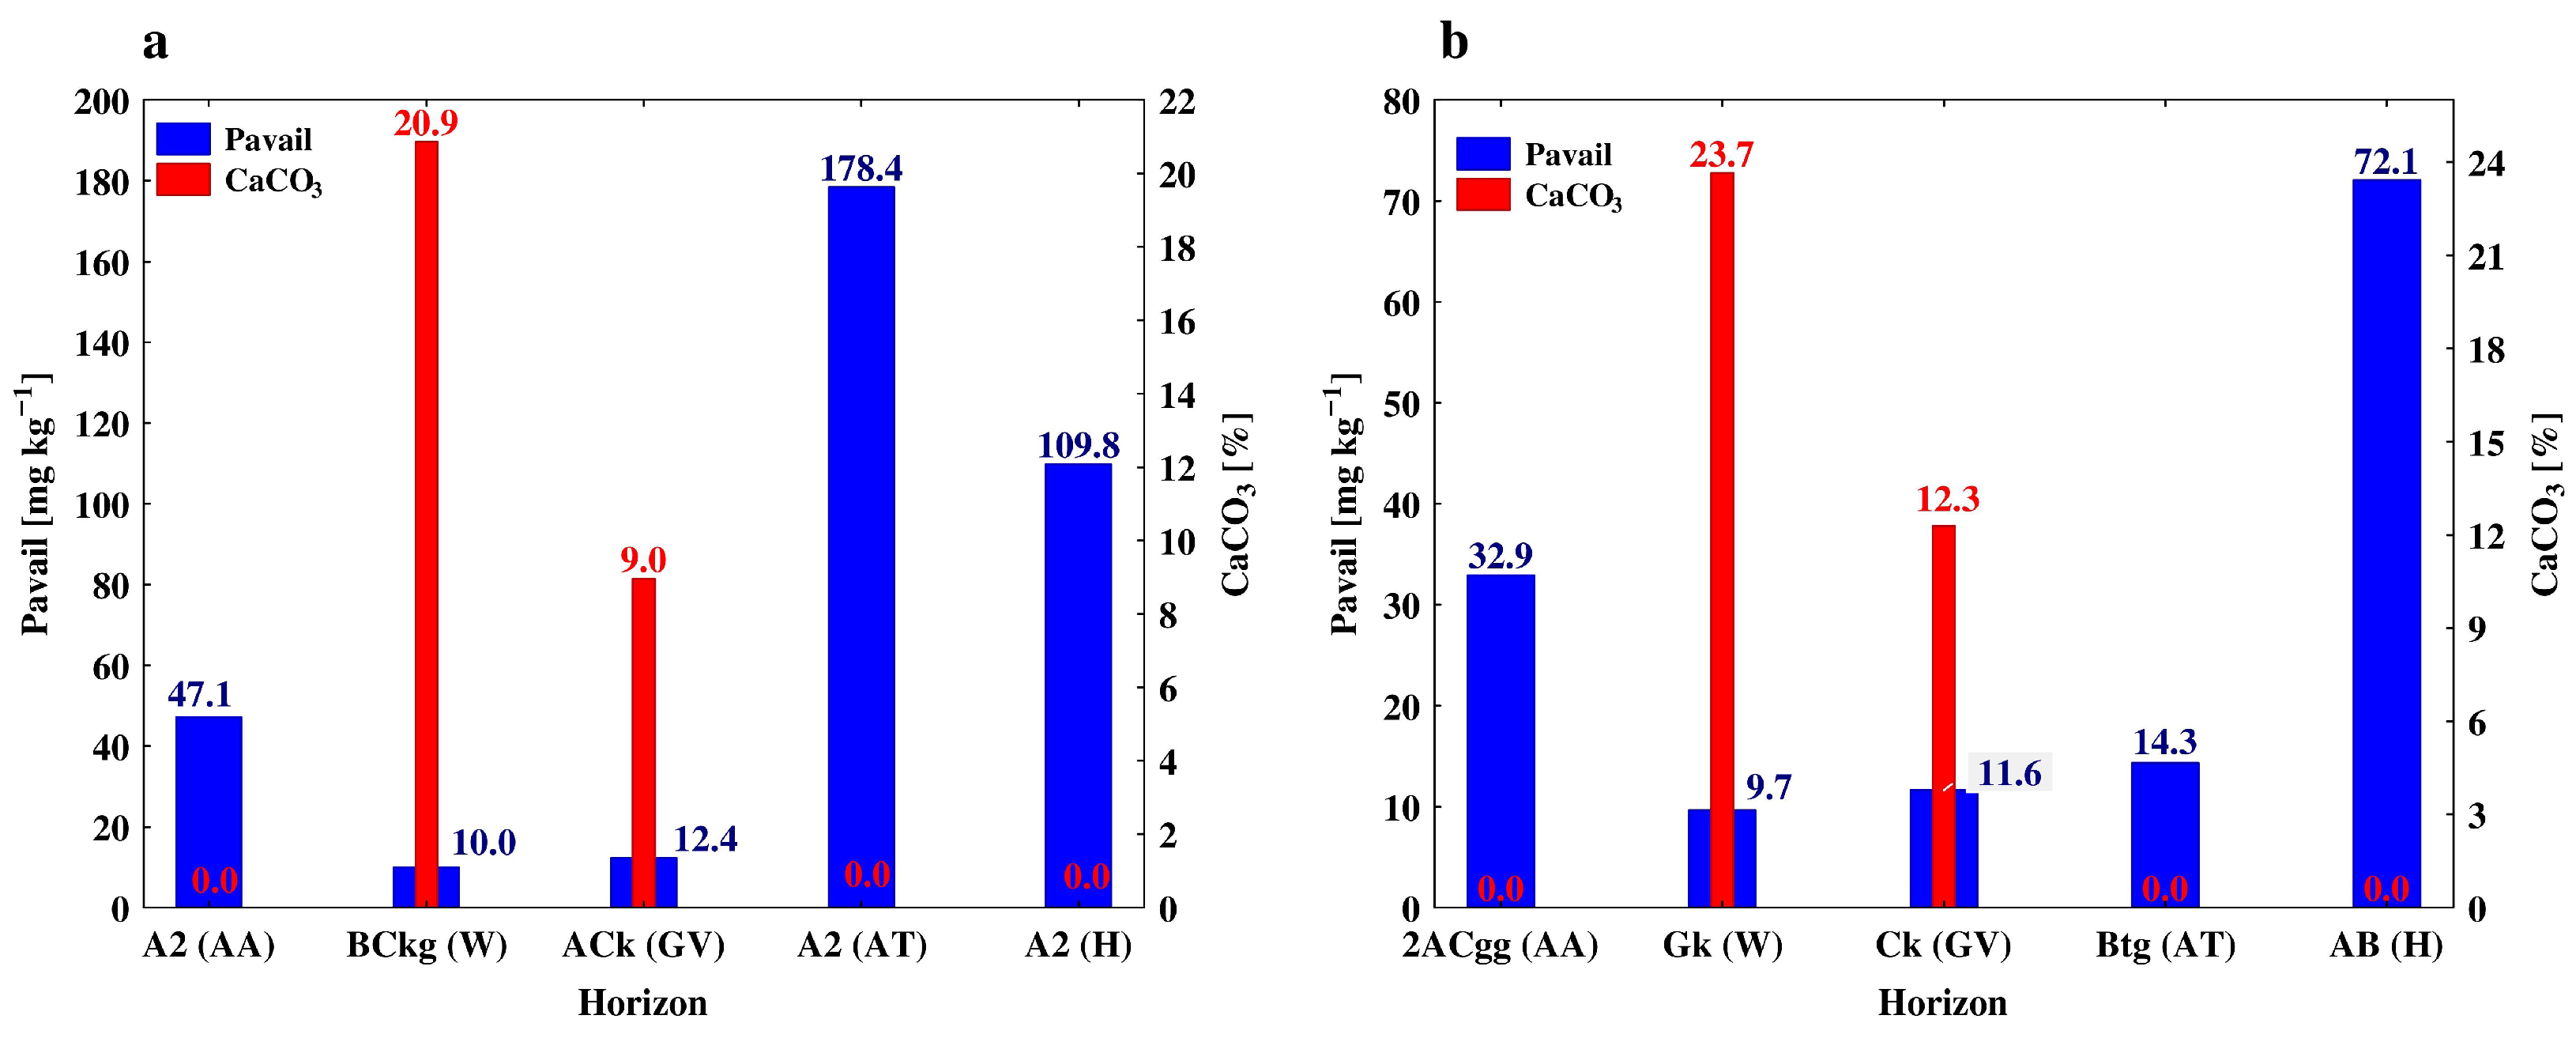
| Alfalfa (AA) | Ap | 0–30 | 10 c * | 45 a | 6.87 a | 3.72 a | 141.3 a | 0.0 | 1.58 a |
| A2 | 30–53 | 12 bc | 45 a | 6.76 a | 3.66 a | 127.8 b | 0.0 | 0.69 b | |
| 2ACgg | 53–70 | 25 a | 41 b | 7.01 a | 2.60 b | 139.3 a | 0.0 | 0.54 c | |
| 3G1 | 70–110 | 14 b | 33 d | 7.16 a | 1.09 c | 97.6 c | 0.0 | 0.30 d | |
| 3G2 | 110–150 | 14 b | 38 c | 7.31 a | 3.43 a | 91.9 c | 0.0 | 0.27 d | |
| Profile 2. Cambic Stagnic Phaeozem (CSP) | |||||||||
| Winer wheat (W) | Akp | 0–35 | 9 c | 33 c | 7.41 a | 2.23 a | 286.5 c | 5.3 c | 1.01 a |
| BCkg | 35–67 | 21 b | 39 a | 7.82 a | 0.79 b | 498.7 b | 20.9 a | 0.79 b | |
| Ck | 67–90 | 24 a | 36 b | 7.71 a | 0.20 c | 576.0 a | 23.7 a | 0.58 c | |
| 2Ck1 | 90–123 | 7 d | 33 c | 8.36 a | 0.09 d | 156.4 d | 9.2 b | 0.21 d | |
| 2Ck2 | 123–150 | 2 e | 20 d | 8.19 a | 0.10 d | 60.7 e | 4.0 d | 0.20 d | |
| Profile 3. Eutric Loamic Regosol (ELR) | |||||||||
| Grapevine (GV) | Ak | 0–18 | 14 b | 46 bc | 7.19 b | 0.75 b | 138.3 c | 8.6 b | 0.92 c |
| ACk | 18–40 | 13 b | 43 c | 7.26 b | 0.74 b | 137.2 c | 8.9 b | 0.97 c | |
| Ck | 40–82 | 17 a | 42 c | 7.63 a | 0.74 b | 206.3 a | 12.3 a | 1.53 a | |
| Ck2 | 82–120 | 14 b | 49 ab | 7.66 a | 0.76 b | 159.8 b | 11.1 a | 1.29 b | |
| Ck3 | 120–150 | 18 a | 52 a | 7.62 a | 1.12 a | 121.4 d | 8.0 b | 1.64 a | |
| Profile 4. Stagnic Luvic Phaeozem (SLP) | |||||||||
| Apple trees (AT) | A | 0–18 | 14 b | 49 a | 6.67 c | 4.00 a | 225.4 a | 0.0 | 1.82 a |
| A2 | 18–40 | 15 b | 47 b | 7.04 b | 1.00 c | 130.8 b | 0.0 | 1.91 a | |
| Btg | 40–82 | 25 a | 44 c | 7.35 a | 1.00 c | 91.5 d | 0.0 | 0.97 b | |
| Ckgg | 82–120 | 15 b | 50 a | 7.64 a | 1.00 c | 139.9 b | 16.1 a | 0.51 c | |
| Gk | 120–150 | 13.b | 46 b | 7.66 a | 2.00 b | 111.9 c | 14.5 b | 0.50 c | |
| Profile 5. Cambic Phaeozem (CP) | |||||||||
| Hop (H) | A | 0–34 | 7 e | 36 d | 6.29 c | 8.34 a | 117.1 d | 0.0 | 0.94 d |
| A2 | 34–66 | 12 c | 42 c | 6.57 c | 7.78 a | 353.3 a | 0.0 | 2.17 a | |
| AB | 66–88 | 16 a | 44 bc | 6.87 b | 4.77 b | 254.0 bc | 0.0 | 1.84 b | |
| Bw | 88–114 | 15.b | 47 b | 6.70 b | 4.49 b | 237.9 c | 0.0 | 1.18 c | |
| Ck | 114–150 | 10.d | 51 a | 7.83 a | 1.10 c | 288.4 b | 11.7 | 0.51 e | |
| Plant | Genetic Horizon | Depth (cm) | Pavail | MBP | TOC | TN | DOC | MBC |
|---|---|---|---|---|---|---|---|---|
| (mg kg−1) | (g kg−1) | (mg kg−1) | ||||||
| Profile 1. Mollic Stagnic Gleyosol (MSG) | ||||||||
| Alfalfa (AA) | A | 0–30 | 231.7 ± 2.2 a* | 13.82 ± 0.17 a | 17.7 ± 1.54 a | 1.96 ± 0.34 a | 124.6 ± 5.5 a | 145.6 ± 5.9 a |
| A2 | 30–53 | 47.1 ± 0.6 d | 10.19 ± 0.04 b | 9.66 ± 0.87 b | 0.90 ± 0.11 b | 86.5 ± 2.1 b | 113.6 ± 5.4 b | |
| 2ACgg | 53–70 | 32.9 ± 0.45 e | 3.49 ± 0.21 c | 4.02 ± 0.35 c | 0.42 ± 0.09 c | 78.4 ± 2.5 bc | 53.1 ± 4.4 c | |
| 3G1 | 70–110 | 86.2 ± 0.61c | 3.11 ± 0.02 cd | 2.34 ± 0.25 d | 0.37 ± 0.09 c | 63.7 ± 1.5 cd | 25.6 ± 3.4 d | |
| 3G2 | 110–150 | 110.8 ± 0.2 b | 2.63 ± 0.08 d | 2.13 ± 0.33 d | 0.29 ± 0.05 d | 54.5 ± 2.6 d | 16.5 ± 1.0 b | |
| Profile 2 Cambic Stagnic Phaeozem (CSP) | ||||||||
| Winter wheat (W) | Akp | 0–35 | 65.8 ± 0.2 a | 40.47 ± 0.44 a | 19.1 ± 0.21 a | 2.43 ± 0.06 a | 142.7 ± 1.6 a | 302.1 ± 9.6 a |
| BkCg | 35–67 | 9.9 ± 0.2 c | 11.51 ± 0.04 b | 2.97 ± 0.03 b | 0.36 ± 0.01 b | 45.2 ± 1.7 b | 106.1 ± 6.0 b | |
| Gk | 67–90 | 9.7 ± 0.1 c | 12.53 ± 0.09 b | 2.28 ± 0.05 b | 0.36 ± 0.02 b | 43.3 ± 1.4 b | 88.8 ± 3.4 c | |
| 2Gk1 | 90–123 | 9.7 ± 0.3 c | 7.13 ± 0.07 c | 0.68 ± 0.02 c | 0.08 ± 0.01 c | 29.2 ± 1.0 c | 74.3 ± 2.0 c | |
| 2Gk2 | 123–150 | 17.7 ± 0.4 b | 5.69 ± 0.08 c | 0.32 ± 0.05 c | 0.08 ± 0.01 c | 29.2 ± 0.2 c | 46.7 ± 1.6 e | |
| Profile 3. Eutric Loamic Regosol (ELR) | ||||||||
| Grapevine (GV) | Ak | 0–18 | 13.5 ± 0.3 a | 38.09 ± 1.06 a | 12.11 ± 0.14 a | 1.31 ± 0.02 a | 118.3 ± 2.0 a | 288.8 ± 4.2 a |
| ACk | 18–40 | 12.3 ± 0.1 b | 12.51 ± 0.12 b | 6.42 ± 0.25 b | 0.76 ± 0.03 b | 94.7 ± 2.5 b | 119.9 ± 4.6 b | |
| Ck | 40–82 | 11.6 ± 0.3 b | 6.79 ± 0.04 c | 2.14 ± 0.07 c | 0.25 ± 0.01 c | 57.4 ± 1.3 c | 64.2 ± 2.1c | |
| Ck2 | 82–120 | 12.1 ± 0.1 b | 3.20 ± 0.04 d | 1.59 ± 0.06 d | 0.19 ± 0.01 c | 38.2 ± 1.1 d | 35.9 ± 1.2 d | |
| Ck3 | 120–150 | 12.4 ± 0.4 b | 2.41 ± 0.01 d | 1.27 ± 0.04 d | 0.21 ± 0.01 c | 41.1 ±1.0 d | 17.9 ± 0.6 e | |
| Profile 4. Stagnic Luvic Phaeozem (SLP) | ||||||||
| Apple trees (AT) | A | 0–18 | 134.8 ± 1.6 b | 20.38 ± 0.22 a | 27.64 ± 0.44 a | 2.41 ± 0.03 a | 115.1 ± 2.7 a | 233.5 ± 4.0 a |
| A2 | 18–40 | 178.4 ± 3.8 a | 13.14 ± 0.08 b | 15.20 ± 0.23 b | 1.64 ± 0.06 b | 88.9 ± 3.0 b | 145.7 ± 3.8 b | |
| Btg | 40–82 | 14.3 ± 0.1 c | 4.81 ± 0.07 d | 3.80 ± 0.07 c | 0.54 ± 0.02 c | 60.9 ± 2.5 c | 51.2 ± 1.2 c | |
| Ckgg | 82–120 | 12.3 ± 0.1 c | 5.33 ± 0.04 c | 3.71 ± 0.05 c | 0.27 ± 0.01 d | 41.0 ± 0.9 d | 62.1 ± 1.7 c | |
| Gk | 120–150 | 13.7 ± 0.3 c | 4.04 ± 0.05 e | 2.51 ± 0.09 c | 0.16 ± 0.01 d | 47.9 ± 1.2 d | 36.0 ± 0.8 d | |
| Profile 5. Cambic Phaeozem | ||||||||
| Hop (H) | A | 0–34 | 146.4 ± 0.6 a | 7.09 ± 0.02 a | 8.87 ± 0.13 b | 0.85 ± 0.03 b | 80.8 ± 1.2 a | 43.58 ± 2.77 a |
| A2 | 34–66 | 109.8 ± 0.7 b | 6.10 ± 0.17 a | 10.40 ± 0.31 a | 0.93 ± 0.03 a | 76.9 ± 2.3 a | 18.07 ± 0.52 c | |
| AB | 66–88 | 72.0 ± 1.1 c | 3.01 ± 0.01 b | 4.35 ± 0.10 c | 0.41 ± 0.01 c | 51.9 ± 1.2 b | 36.02 ± 1.62 b | |
| Bw | 88–114 | 55.2 ± 0.9 d | 2.18 ± 0.04 b | 2.18 ± 0.06 d | 0.24 ± 0.01 d | 53.8 ± 1.6 b | 18.13 ± 0.36 c | |
| Ck | 114–150 | 24.7 ± 0.1 e | 1.99 ± 0.01 b | 0.09 ± 0.01 e | 0.04 ± 0.01 e | 5.8 ± 0.09 c | 7.09 ± 0.23 d | |
| Plant | Genetic Horizon | Depth (cm) | TOC/TN | DOC/TOC (%) | MBC/TOC (%) | MBC/DOC | MBC/MBP |
|---|---|---|---|---|---|---|---|
| Profile 1. Mollic Stagnic Gleyosol (MSG) | |||||||
| Alfalfa (AA) | A | 0–30 | 9.0 ± 0.4 a* | 0.74 ± 0.04 c | 0.82 ± 0.09 c | 1.17 ± 0.08 a | 10.5 ± 0.38 b |
| A2 | 30–53 | 10.7 ± 0.2 a | 0.93 ± 0.03 c | 1.18 ± 0.15 ab | 1.30 ± 0.04 a | 11.0 ± 0.22 b | |
| 2ACgg | 53–70 | 9.6 ± 0.2 ab | 2.01 ± 0.08 b | 1.32 ± 0.14 a | 0.68 ± 0.03 b | 15.4 ± 0.82 a | |
| 3G1 | 70–110 | 6.3 ± 0.1 c | 2.79 ± 0.09 a | 1.09 ± 0.12 b | 0.40 ± 0.01 c | 8.25 ± 0.10 c | |
| 3G2 | 110–150 | 7.3 ± 0.3 c | 2.67 ± 0.17 a | 0.78 ± 0.14 c | 0.30 ± 0.02 c | 6.32 ± 0.24 c | |
| Profile 2. Cambic Stagnic Phaeozem (CSP) | |||||||
| Winter wheat (W) | Ap | 0–35 | 7.9 ± 0.4 b | 0.75 ± 0.03 d | 1.58 ± 0.03 d | 2.11 ± 0.09 b | 7.74 ± 0.28 c |
| BCkg | 35–67 | 8.3 ± 0.1 ab | 1.52 ± 0.05 c | 3.57 ± 0.18 c | 2.34 ± 0.04 a | 9.22 ± 0.51 ab | |
| Gk | 67–90 | 6.3 ± 0.2 c | 1.91 ± 0.10 c | 3.90 ± 0.07 c | 2.06 ± 0.14 b | 7.09 ± 0.30 c | |
| 2Gk1 | 90–123 | 8.9 ± 0.3 a | 4.21 ± 0.02 b | 10.8 ± 0.61 b | 2.55 ± 0.15 a | 10.4 ± 0.38 a | |
| 2Gk2 | 123–150 | 4.2 ± 0.3 d | 9.14 ± 0.60 a | 14.6 ± 0.37 a | 1.60 ± 0.06 c | 8.22 ± 0.21 b | |
| Profile 3. Eutric Loamic Regosol (ELR) | |||||||
| Grapevine (GV) | Ak | 0–18 | 9.2 ± 0.3a | 0.98 ± 0.01 e | 2.38 ± 0.01 b | 2.44 ± 0.01 a | 7.59 ± 0.17 c |
| ACk | 18–40 | 8.4 ± 0.1 b | 1.48 ± 0.02 d | 1.87 ± 0.02 d | 1.26 ± 0.02 b | 9.58 ± 0.34 b | |
| Ck | 40–82 | 8.7 ± 0.1 ab | 2.68 ± 0.03 c | 3.00 ± 0.01 a | 1.12 ± 0.01 c | 9.47 ± 0.31 b | |
| Ck2 | 82–120 | 8.3 ± 0.1 b | 2.41 ± 0.04 b | 2.26 ± 0.01 c | 0.93 ± 0.02 d | 11.2 ± 0.31 a | |
| Ck3 | 120–150 | 6.1 ± 0.1 c | 3.24 ± 0.04 a | 1.40 ± 0.01 e | 0.43 ± 0.5 e | 7.41 ± 0.27 c | |
| Profile 4. Stagnic Luvic Phaeozem (SLP) | |||||||
| Apple trees (AT) | A | 0–18 | 11.9 ± 0.1 bc | 0.40 ± 0.00 e | 0.82 ± 0.01 d | 2.03 ± 0.02 a | 11.5 ± 0.17 a |
| A2 | 18–40 | 9.4 ± 0.1 c | 0.58 ± 0.00 d | 0.95 ± 0.01 c | 1.64 ± 0.02 b | 11.1 ± 0.27 a | |
| Btg | 40–82 | 6.9 ± 0.1 d | 1.62 ± 0.00 c | 1.36 ± 0.02 b | 0.84 ± 0.01 d | 10.7 ± 0.22 a | |
| Ckgg | 82–120 | 13.9 ± 0.1 b | 1.10 ± 0.01 b | 1.66 ± 0.02 a | 1.52 ± 0.01 c | 11.7 ± 0.32 a | |
| Gk | 120–150 | 16.3 ± 0.1 a | 1.86 ± 0.01 a | 1.40 ± 0.01 b | 0.75 ± 0.00 e | 8.92 ± 0.20 b | |
| Profile 5. Cambic Phaeozem (CP) | |||||||
| Hop (H) | A | 0–34 | 10.4 ± 0.2 ab | 0.91 ± 0.02 d | 0.49 ± 0.02 c | 0.54 ± 0.00 v | 6.18 ± 0.12 c |
| A2 | 34–66 | 11.2 ± 0.3 a | 0.74 ± 0.03 d | 0.17 ± 0.01 d | 0.23 ± 0.01 d | 3.21 ± 0.66 d | |
| AB | 66–88 | 10.6 ± 0.3 a | 1.19 ± 0.01 c | 0.83 ± 0.01 b | 0.69 ± 0.00 b | 12.0 ± 0.22 a | |
| Bw | 88–114 | 9.1 ± 0.3 b | 2.47 ± 0.03 a | 0.83 ± 0.02 b | 0.23 ± 0.01 d | 8.32 ± 0.12 b | |
| Ck | 114–150 | 6.2 ± 2.8 c | 1.79 ± 0.35 b | 8.72 ± 1.65 a | 4.90 ± 0.24 a | 3.57 ± 0.07 d | |
| Plant | Genetic Horizon | Depth (cm) | AcP | AlP | PDE | AlP/AcP |
|---|---|---|---|---|---|---|
| Profile 1. Mollic Stagnic Gleyosol (MSG) | ||||||
| Alfalfa (AA) | A | 0–30 | 3.74 ± 0.016 a* | 7.30 ± 0.078 a | 1.15 ± 0.011 a | 1.95 ± 0.023 b |
| A2 | 30–53 | 0.97 ± 0.003 b | 2.35 ± 0.109 b | 0.30 ± 0.004 b | 2.42 ± 0.014 a | |
| 2ACgg | 53–70 | 0.86 ± 0.026 b | 1.91 ± 0.043 c | 0.26 ± 0.001 b | 1.79 ± 0.011 b | |
| 3G1 | 70–110 | 0.79 ± 0.004 c | 1.19 ± 0 012 d | 0.18 ± 0.001c | 1.51 ± 0.015 c | |
| 3G2 | 110–150 | 0.69 ± 0.005 d | 0.84 ± 0.007 e | 0.19 ± 0.002 c | 1.22 ± 0.013 d | |
| Profile 2. Cambic Stagnic Phaeozem (CSP) | ||||||
| Winter wheat (W) | Akp | 0–35 | 4.99 ± 0.022 a | 12.70 ± 0.095 a | 1.734 ± 0.031 a | 2.55 ± 0.013 a |
| BCkg | 35–67 | 1.02 ± 0.006 b | 2.01 ± 0.023 b | 0.55 ± 0.002 b | 1.98 ± 0.013 b | |
| Gk | 67–90 | 0.87 ± 0.012 c | 1.34 ± 0.014 c | 0.55 ± 0.006 b | 1.56 ± 0.012 c | |
| 2Gk1 | 90–123 | 0.16 ± 0.006 d | 0.18 ± 0.004 d | 0.06 ± 0.002 c | 1.13 ± 0.015 d | |
| 2Gk2 | 123–150 | 0.13 ± 0.002 d | 0.10 ± 0.003 d | 0.03 ± 0.001 c | 0.77 ± 0.026 e | |
| Profile 3. Eutric Loamic Regosol (ELR) | ||||||
| Grapevine (GV) | Ak | 0–18 | 3.00 ± 0.010 a | 9.94 ± 0.031 a | 1.69 ± 0.009 a | 3.31 ± 0.033 a |
| ACk | 18–40 | 1.50 ± 0.009 b | 4.51 ± 0.012 b | 0.76 ± 0.002 b | 3.01 ± 0.029 a | |
| Ck | 40–82 | 0.49 ± 0.020 c | 0.90 ± 0.010 c | 0.17 ± 0.010 c | 1.84 ± 0.015 b | |
| Ck2 | 82–120 | 0.41 ± 0.011 d | 0.55 ± 0.014 d | 0.09 ± 0.006 d | 1.34 ± 0.019 bc | |
| Ck3 | 120–150 | 0.41 ± 0.007 d | 0.45 ± 0.001 e | 0.08 ± 0.010 d | 1.10 ± 0.012 c | |
| Profile 4. Stagnic Luvic Phaeozem (SLP) | ||||||
| Apple trees (AT) | A | 0–18 | 8.44 ± 0.219 a | 8.69 ± 0.225 a | 1.85 ± 0.026 a | 1.03 ± 0.013 a |
| A2 | 18–40 | 5.46 ± 0.008 b | 6.46 ± 0.039 b | 1.48 ± 0.009 b | 1.18 ± 0.016 a | |
| Btg | 40–82 | 2.45 ± 0.055 c | 1.99 ± 0.035 c | 0.53 ± 0.012 c | 0.81 ± 0.018 b | |
| Ckgg | 82–120 | 1.23 ± 0.008 d | 1.10 ± 0.009 d | 0.32 ± 0.002 d | 0.89 ± 0.013 b | |
| Gk | 120–150 | 0.90 ± 0.012 d | 0.50 ± 0.001 e | 0.17 ± 0.008 e | 0.56 ± 0.011 c | |
| Profile 5. Cambic Phaeozem (CP) | ||||||
| Hop (H) | A | 0–18 | 2.44 ± 0.829 b | 2.13 ± 0.004 d | 0.48 ± 0.006 b | 0.87 ± 0.012 b |
| A2 | 18–40 | 3.27 ± 0.014 a | 4.75 ± 0.023 a | 0.68 ± 0.030 a | 1.45 ± 0.011 a | |
| AB | 40–82 | 2.15 ± 0.043 b | 3.07 ± 0.020 c | 0.51 ± 0.020 b | 1.43 ± 0.020 a | |
| Bw | 82–120 | 2.36 ± 0.048 b | 3.39 ± 0.025 b | 0.50 ± 0.016 b | 1.44 ± 0.015 c | |
| Ck | 120–150 | 0.75 ± 0.003 c | 0.83 ± 0.018 e | 0.06 ± 0.001 c | 1.11 ± 0.007 d | |
| Plant | Horizons | Depth (cm) | Root Mass (g dm–3) | Root Length (mm dm–3) | Root Surface (mm–2 dm–3) | ||
|---|---|---|---|---|---|---|---|
| All | ^ Ø < 0.5 mm | All | Ø < 0.5 mm | ||||
| Profile 1. Mollic Stagnic Gleyosol (MSG) | |||||||
| Alfalfa (AA) | Ap | 0–30 | 14.2 a* | 3138 a | 2265 a | 688a | 164 a |
| A2 | 30–53 | 1.20 b | 181 d | 91.0 d | 78.6 b | 7.8 c | |
| 2ACgg | 53–70 | 0.74 c | 215 c | 112.4 c | 64.5 b | 10.8 b | |
| 3G1 | 70–110 | 0.20 d | 249 b | 164 b | 42.4 c | 12.7 b | |
| 3G2 | 110–150 | 0.04 d | 83.1 e | 52.1 e | 12.2 d | 5.1 d | |
| Profile 2. Cambic Stagnic Phaeozem (CSP) | |||||||
| Winter wheat (W) | Akp | 0–35 | 1.91 a | 2680 a | 2221 a | 292 a | 143 a |
| BCkg | 35–67 | 1.01 b | 1750 b | 1540 b | 175 b | 115 b | |
| Gk | 67–90 | 1.02 b | 1278 c | 1092 c | 141.1 c | 84.5 c | |
| 2Gk1 | 90–123 | 0.41 c | 603 d | 363 d | 36.5 d | 23.4 d | |
| 2Gk2 | 123–150 | 0.32 c | 207 e | 172 e | 22.6 e | 12.2 e | |
| Profile 3. Eutric Loamic Regosol (ELR) | |||||||
| Grapevine (GV) | Ak | 0–18 | 10.0 c | 1530 a | 820 a | 513 a | 57.9 a |
| ACk | 18–40 | 12.9 b | 686 b | 325 b | 277 b | 24.0 b | |
| Ck | 40–82 | 11.9 b | 738 b | 352 b | 285 b | 26.0 b | |
| Ck2 | 82–120 | 14.5 a | 385 c | 161 c | 257 c | 10.9 c | |
| Ck3 | 120–150 | 2.97 d | 237 c | 116 d | 58.6 d | 9.91 c | |
| Profile 4. Stagnic Luvic Phaeozem (SLP) | |||||||
| Apple trees (AT) | A | 0–18 | 4.40 b | 1634 a | 955 a | 329 b | 75.8 a |
| A2 | 18–40 | 16.8a | 1771 a | 741 b | 691 a | 58.7 b | |
| Btg | 40–82 | 1.91 c | 482 c | 214 d | 143 c | 19.8 d | |
| Ckgg | 82–120 | 1.40 d | 643 b | 276 c | 158 c | 25.3 c | |
| Gk | 120–150 | 0.85 e | 174 d | 44.6 e | 58.8 d | 3.71 e | |
| Profile 5. Cambic Phaeozem (CP) | |||||||
| Hop (H) | A | 0–34 | 3.98 c | 1438 b | 395 c | 765 b | 35.6 c |
| A2 | 34–66 | 11.7 a | 2119 a | 765 a | 979 a | 71.2 a | |
| AB | 66–88 | 9.69 b | 1046 c | 470 b | 348 c | 34.6 d | |
| Bw | 88–114 | 9.86 b | 1104 c | 762 a | 161 d | 55.7 b | |
| Ck | 114–150 | 2.11 d | 215 d | 104 d | 54.9 e | 8.02 e | |
| Property | PC1 | PC2 | Property | PC1 | PC2 |
|---|---|---|---|---|---|
| AcP | −0.906 | −0.113 | clay | 0.176 | 0.124 |
| AlP | −0.945 | 0.201 | silt | −0.092 | −0.214 |
| PDE | −0.951 | 0.217 | BD | 0.903 | −0.152 |
| Pavail | −0.612 | −0.580 | CEC | −0.077 | 0.197 |
| MBP | −0.777 | 0.578 | Hh | −0.378 | −0.797 |
| MBC | −0.854 | 0.545 | pH | 0.630 | 0.667 |
| TOC | −0.959 | −0.042 | Fea | −0.535 | −0.430 |
| DOC | −0.914 | 0.047 |
Publisher’s Note: MDPI stays neutral with regard to jurisdictional claims in published maps and institutional affiliations. |
© 2022 by the authors. Licensee MDPI, Basel, Switzerland. This article is an open access article distributed under the terms and conditions of the Creative Commons Attribution (CC BY) license (https://creativecommons.org/licenses/by/4.0/).
Share and Cite
Długosz, J.; Piotrowska-Długosz, A.; Siwik-Ziomek, A.; Figas, A. Depth-Related Changes in Soil P-Acquiring Enzyme Activities and Microbial Biomass—The Effect of Agricultural Land Use/Plant Cover and Pedogenic Processes. Agriculture 2022, 12, 2079. https://doi.org/10.3390/agriculture12122079
Długosz J, Piotrowska-Długosz A, Siwik-Ziomek A, Figas A. Depth-Related Changes in Soil P-Acquiring Enzyme Activities and Microbial Biomass—The Effect of Agricultural Land Use/Plant Cover and Pedogenic Processes. Agriculture. 2022; 12(12):2079. https://doi.org/10.3390/agriculture12122079
Chicago/Turabian StyleDługosz, Jacek, Anna Piotrowska-Długosz, Anetta Siwik-Ziomek, and Anna Figas. 2022. "Depth-Related Changes in Soil P-Acquiring Enzyme Activities and Microbial Biomass—The Effect of Agricultural Land Use/Plant Cover and Pedogenic Processes" Agriculture 12, no. 12: 2079. https://doi.org/10.3390/agriculture12122079