
Sedimentary Nutrient Dynamics in Homestead Fishpond Systems from a Subtropical Coastal Area

 ,
,  ,
,  ,
, 
Abstract
:1. Introduction
2. Methodology
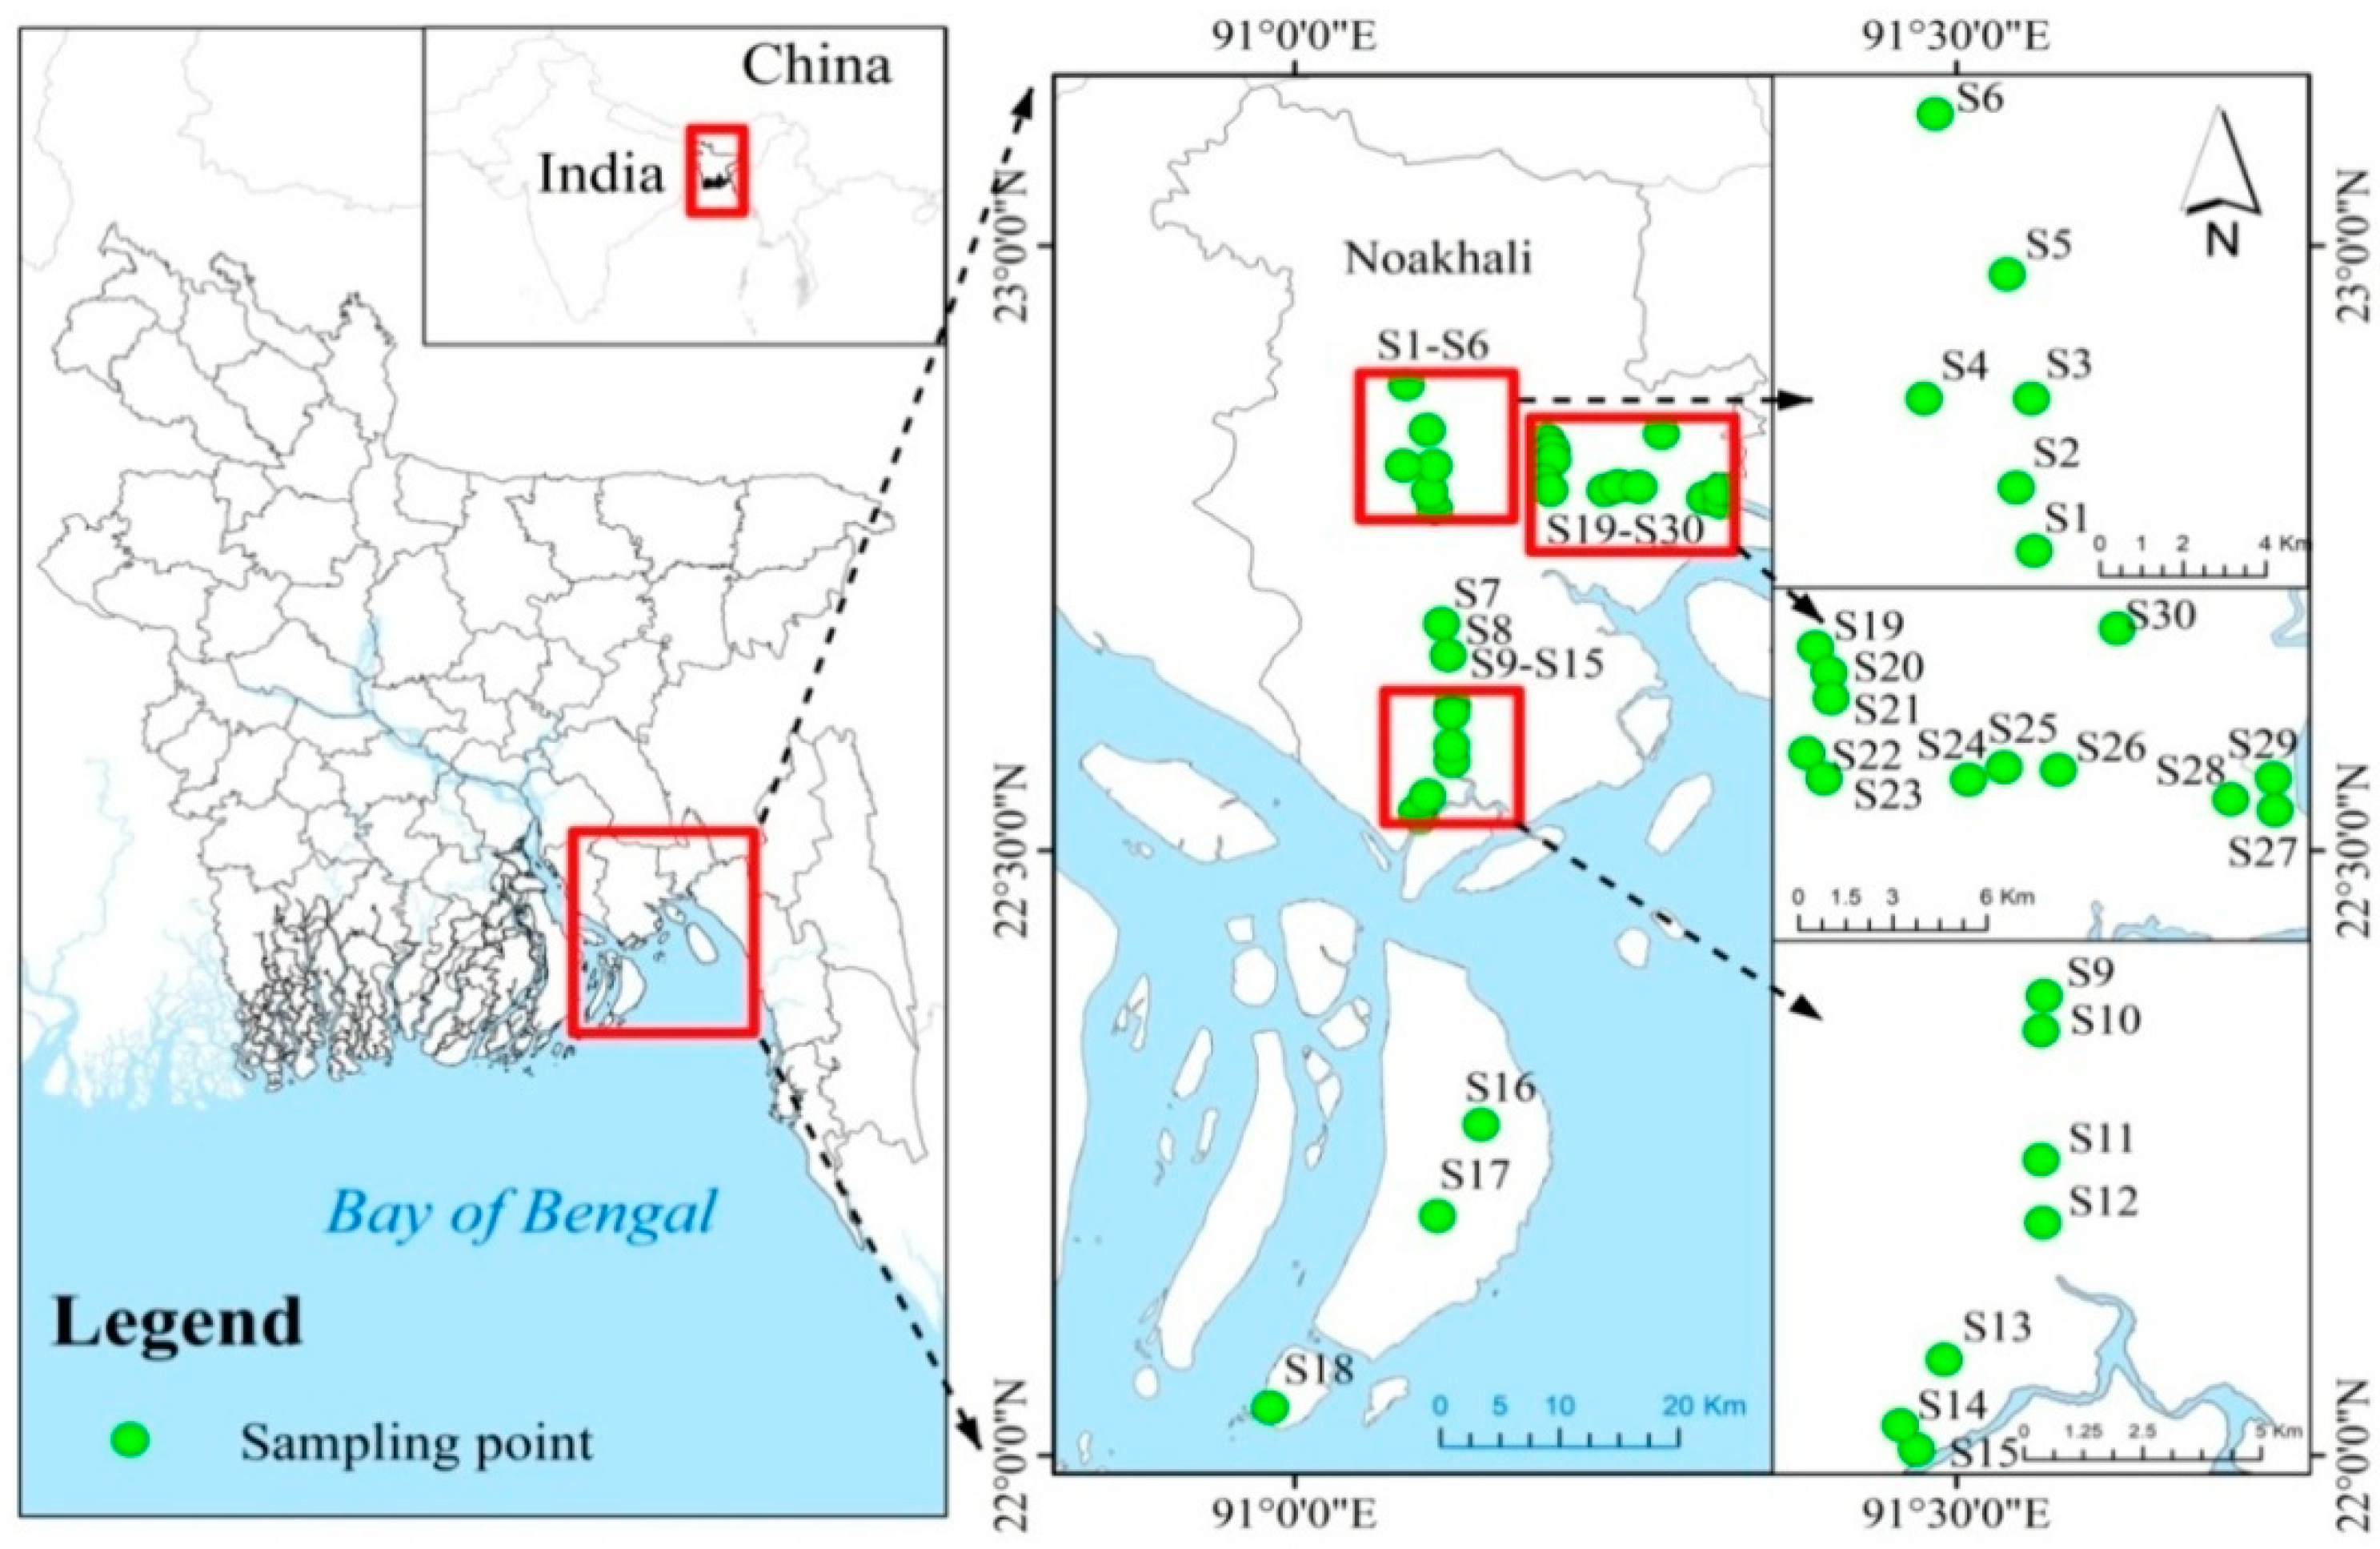
2.1. Study Site and Sampling Protocol
2.2. Sediment Analysis
2.3. Statistical Analysis
3. Results and Discussion
3.1. Physical Parameters and Nutrient Concentrations
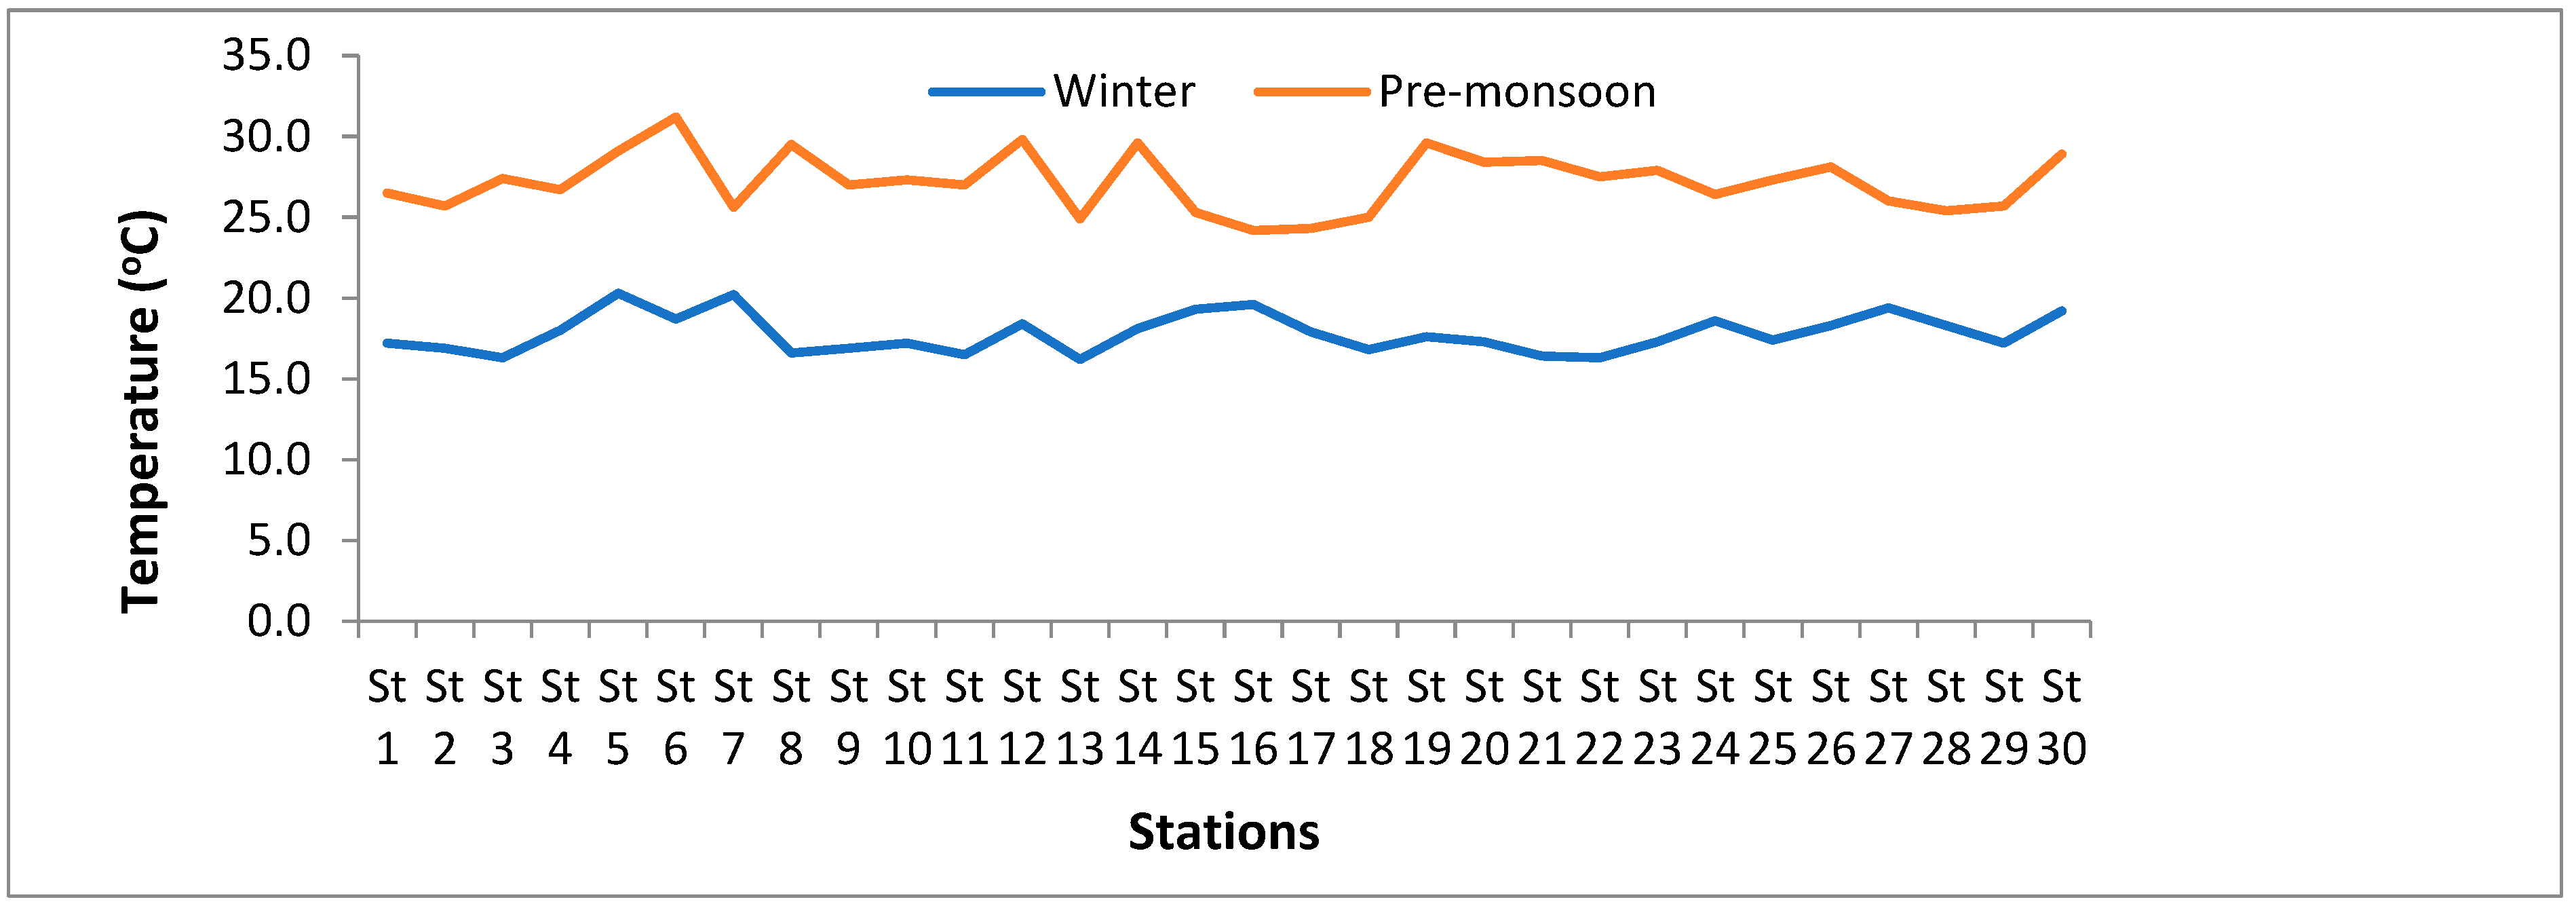
3.1.1. Temperature (°C)
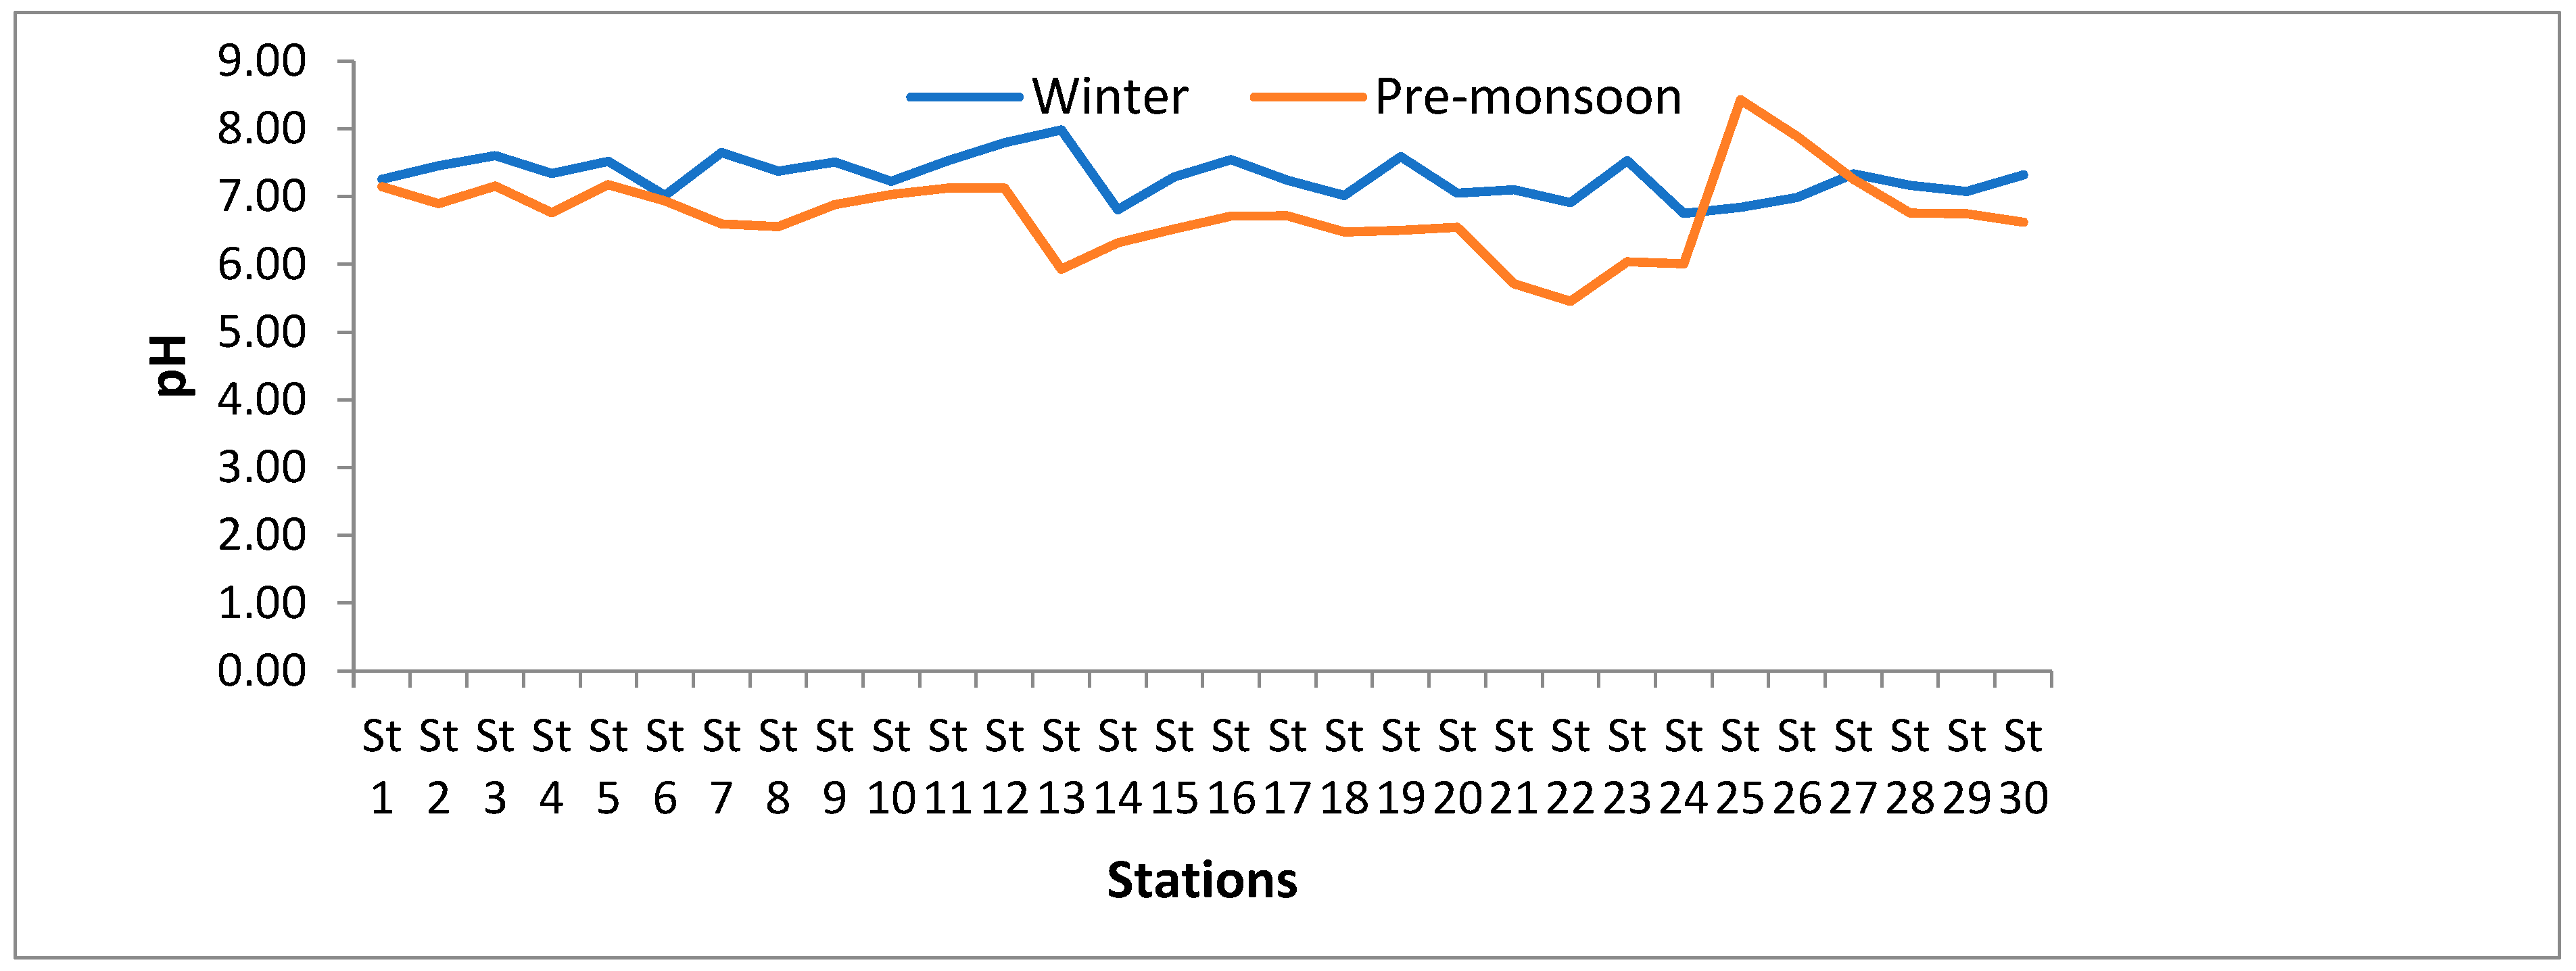
3.1.2. pH
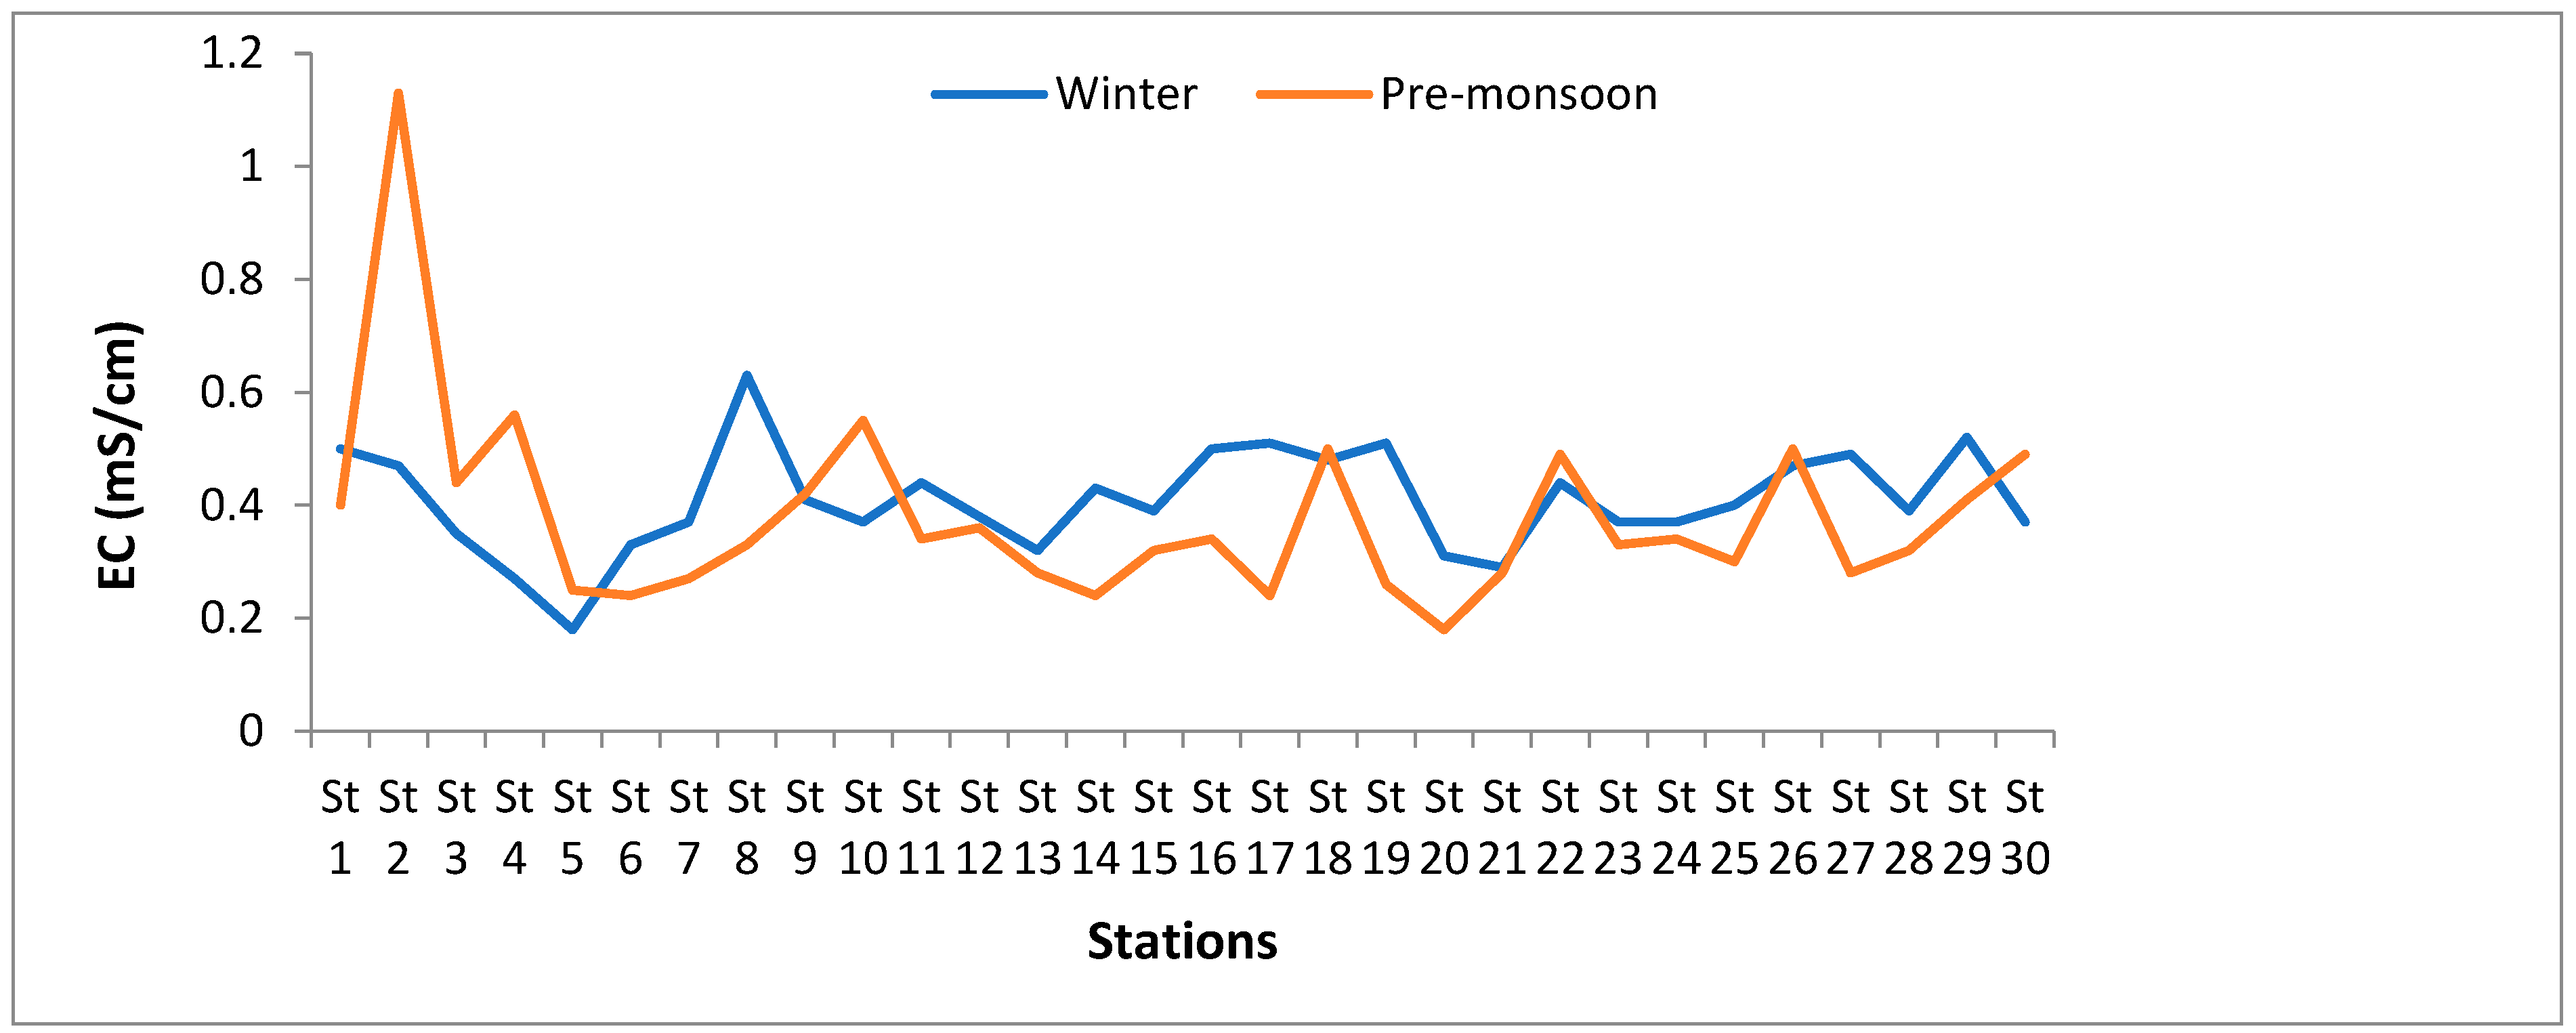
3.1.3. Electrical Conductivity
3.1.4. Organic Matter and Organic Carbon
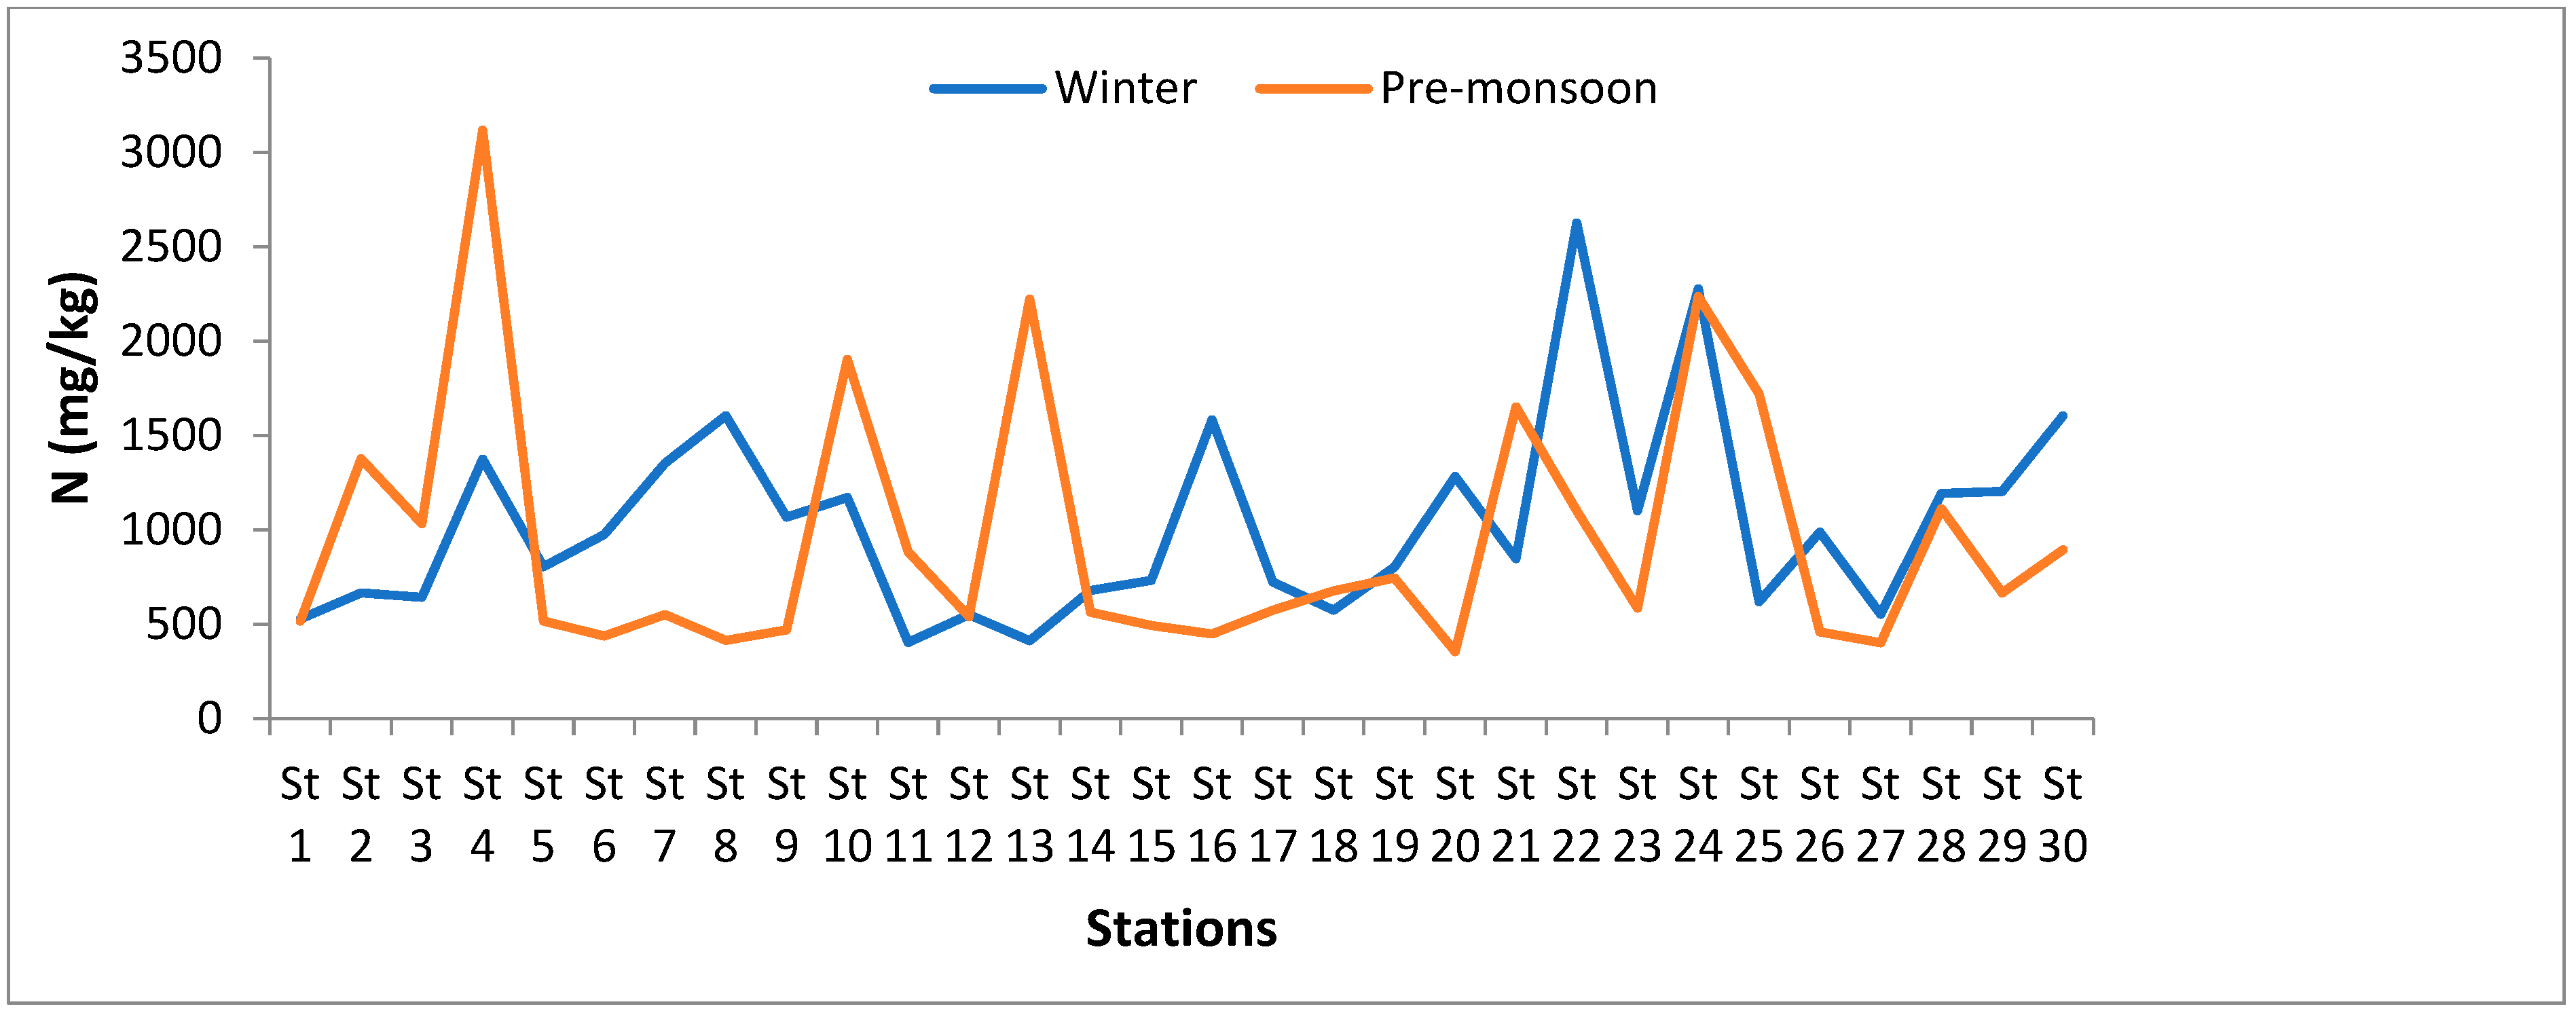
3.1.5. Nitrogen
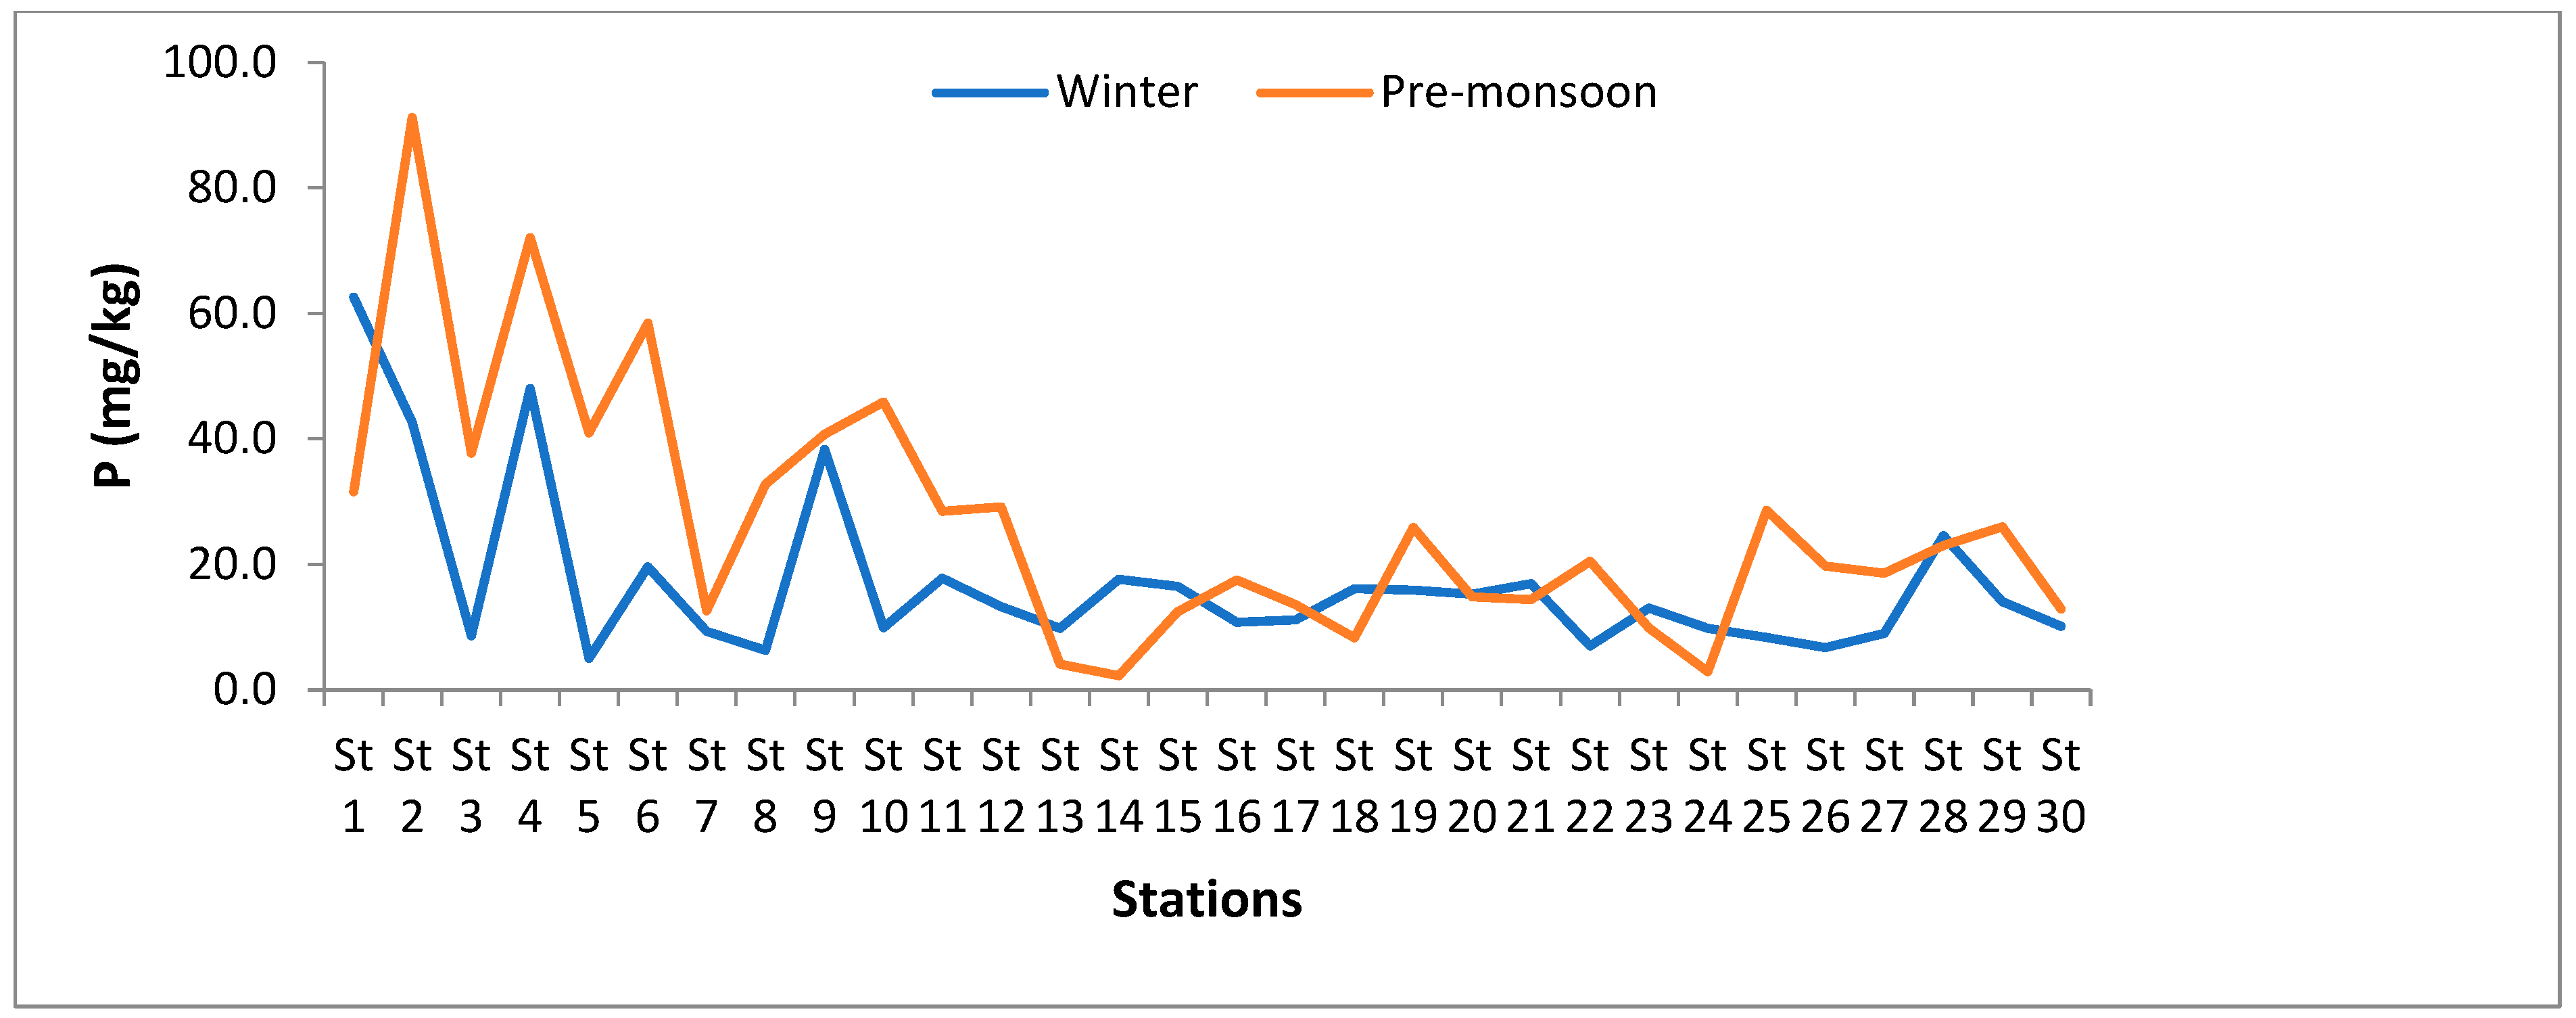
3.1.6. Phosphorus
3.1.7. Sulphur
3.2. Relationship between Nutrients and Physical Parameters
4. Conclusions
Author Contributions
Funding
Institutional Review Board Statement
Data Availability Statement
Acknowledgments
Conflicts of Interest
References
- Gupta, B.P.; Krishnani, K.K.; Joseph, K.O.; Muralidhar, M.; Ali, S.A.; Gopal, C. Soil and water characteristics and growth of Penaeus monodon fed with formulated feed in experimental tanks. Indian J. Fish. 2001, 48, 345–351. [Google Scholar]
- Habib, M.A.B.; Haque, I.; Ali, M.M. Multiple regression analysis of some bottom soil properties on the growth of benthos in nursery ponds. Indian J. Fish. 1991, 38, 237–241. [Google Scholar]
- Das, S.K.; Sahoo, J.K.; Saksena, D.N. Sediment characteristics and benthic biomass in relation to growth of Penaeus monodon Fabricius in low saline confined pond. Indian J. Fish. 2001, 48, 55–61. [Google Scholar]
- Antunes, M.; Antunes, M.T.; Fernandes, A.N.; da Silva Crespo, J.; Giovanela, M. Nutrient contents in bottom sediment samples from a southern Brazilian microbasin. Environ. Earth Sci. 2013, 69, 959–968. [Google Scholar] [CrossRef]
- Ghosh, P.B.; Choudhury, A. The nutrient status of the sediments of Hooghly estuary. Mahasagar 1989, 22, 37–41. [Google Scholar]
- Tennore, K.R. Organic nitrogen and calorific content of detritus. I. Util. By Depos. Feed. Polycheate Copetellacopetella. Estua. Coastshelf Sci. 1981, 12, 39–47. [Google Scholar]
- Agemian, H. Determination of nutrients in aquatic sediments. In Manual of Physicochemical Analysis of Aquatic Sediments; Mudroch, A., Azcue, J.M., Mudroch, P., Eds.; CRC: New York, NY, USA, 1997; pp. 175–213. [Google Scholar]
- Vicente, I.D.; López, R.; Pozo, I.; Green, A.J. Nutrient and sediment dynamics in a Mediterranean shallow lake in southwest Spain. Limnetica 2012, 31, 231–250. [Google Scholar]
- Mozeto, A.A.; Soares, A. ProjetoQualised—Determinacão de Fluxos de Nutrientes e OutrasEspéciesQuímicasna Interface Sedimento-Água de AmbientesAquáticosLênticos e Límnicos; São Carlos: Brasilia, Brazil, 2006. [Google Scholar]
- Pomero, L.R.; Smith, E.E.; Grant, C.M. The Exchange Of Phosphate Between Estuarine Water And Sediments 1. Limnol. Oceanogr. 1965, 10, 167–172. [Google Scholar] [CrossRef]
- Ramachandra, U.; Gupta, T.R.C.; Katti, R.J. Macrobenthos and sediment characteristics of Mulki estuary, west coast of India. Indian J. Marine Sci. 1984, 13, 109–112. [Google Scholar]
- Boström, B.; Andersen, J.M.; Fleischer, S.; Jansson, M. Exchange of phosphorus across the sediment-water interface. In Phosphorus in Freshwater Ecosystems; Springer: Dordrecht, The Netherlands, 1988; pp. 229–244. [Google Scholar]
- Ryding, S.O. Chemical and microbiological processes as regulators of the exchange of substances between sediments and water in shallow eutrophic lakes. Int. Rev. Der Gesamten Hydrobiol. Und Hydrogr. 1985, 70, 657–702. [Google Scholar] [CrossRef]
- Reddy, H.V.; Hariharan, V. Distribution of nutrients in the sediments of the Netravathi-Gurupur estuary, Mangalore. Indian J. Fish 1986, 33, 123–126. [Google Scholar]
- Belton, B.; Karim, M.; Thilsted, S.; Collis, W.; Phillips, M. Review of aquaculture and fish consumption in Bangladesh. Food Nutr. 2011, 21, 482–487. [Google Scholar]
- Chowdhury, A.H.; Chowdhury, F.J.; Rahman, L. Marketing system of Tilapia fish in some selected areas of Bangladesh. Imp. Interdiscip. Res. 2017, 3, 447–452. [Google Scholar]
- Belton, B.; Azad, A. The characteristics and status of pond aquaculture in Bangladesh. Aquaculture 2012, 358, 196–204. [Google Scholar] [CrossRef]
- Sultana, P.; Thompson, P. Gender and local floodplain management institutions: A case study from Bangladesh. J. Int. Dev. 2008, 20, 53–68. [Google Scholar] [CrossRef] [Green Version]
- Akter, S.; Rahman, M.M.; Faruk, A.; Bhuiyan, M.N.M.; Hossain, A.; Asif, A.A. Qualitative and quantitative analysis of phytoplankton in culture pond of Noakhali district, Bangladesh. Int. J. Fish. Aquat. Stud. 2018, 6, 371–375. [Google Scholar]
- Telesh, I.V. Plankton of the Baltic estuarine ecosystems with emphasis on Neva Estuary: A review of present knowledge and research perspectives. Mar. Pollut. Bull. 2004, 49, 206–219. [Google Scholar] [CrossRef]
- Biggs, J.; Williams, P.; Whitfield, M.; Nicolet, P.; Weatherby, A. 15 years of pond assessment in Britain: Results and lessons learned from the work of Pond Conservation. Aquat. Conserv. Mar. Freshw. Ecosyst. 2005, 15, 693–714. [Google Scholar] [CrossRef]
- Hubert, W.A.; Lavoic, J.; Debray, L.D. Densities and substrate associations of macro invertebrates in riffles of a small high plains stream. J. Freshw. Ecol. 1996, 11, 21–26. [Google Scholar] [CrossRef]
- Alam, T.; Hussain, A.; Sultana, S.; Hasan, T.; Simon, K.D.; Mazlan, A.G.; Mazumder, S.K. Sediment properties of two important beels of Rajshahi, Bangladesh. Aquac. Aquar. Conserv. Legis. 2014, 7, 51–61. [Google Scholar]
- Sayeed, M.A.; Hossain, M.A.R.; Wahab, M.A.; Hasan, M.T.; Simon, K.D.; Mazumder, S.K. Water and sediment quality parameters in the ChalanBeel, the largest wetland of Bangladesh. Chin. J. Oceanol. Limnol. 2015, 33, 895–904. [Google Scholar] [CrossRef]
- Tapader, M.M.A.; Hasan, M.M.; Sarker, B.S.; Rana, M.E.U.; Bhowmik, S. Comparison of soil nutrients, pH and electrical conductivity among fish ponds of different ages in Noakhali, Bangladesh. Korean J. Agric. Sci. 2017, 44, 16–22. [Google Scholar]
- Hoque, M.E.; Islam, M.; Karmakar, S.; Rahman, M.A.; Bhuyan, M.S. Sediment organic matter and physicochemical properties of a multipurpose artificial lake to assess catchment land use: A case study of Kaptai lake, Bangladesh. Environ. Chall. 2021, 3, 100070. [Google Scholar] [CrossRef]
- Adeyemo, O.K.; Adedokun, O.A.; Yusuf, R.K.; Abeleye, E.A. Seasonal changes in physico-chemical parameters and nutrient load of river sediments in Ibadan city, Nigeria. Glob. Nest. Int. J. 2008, 10, 326–336. [Google Scholar]
- Santiago, S.; Thomas, R.L.; Larbaigt, G.; Corvi, C.; Rossel, D.; Tarradellas, J.; Vernet, J.P. Nutrient, heavy metal and organic pollutant composition of suspended and bed sediments in the Rhone River. Aquat. Sci. 1994, 56, 220–242. [Google Scholar] [CrossRef]
- Shaha, M.K.; Kibria, K.Q.; Datta, D.K. Assessing the water, sediment and soil quality of Mayurriver, Khulna, Bangladesh. Water Secur. Peri-Urban S. Asia Saciwaters IDRC-CRDI 2013, 39. [Google Scholar]
- Chau, K.W. Field measurements of SOD and sediment nutrient fluxes in a land-locked embayment in Hong Kong. Adv. Environ. Res. 2002, 6, 135–142. [Google Scholar] [CrossRef]
- Bragadeeswaran, S.; Rajasegar, M.; Srinivasan, M.; Rajan, U.K. Sediment texture and nutrients of Arasalar estuary, Karaikkal, south-east coast of India. J. Environ. Biol. 2007, 28, 237–240. [Google Scholar]
- Climate Change Knowledge Portal. Available online: https://climateknowledgeportal.worldbank.org/country/bangladesh/climate-data-historical (accessed on 3 December 2021).
- Jackson, M.L. Soil Chemical Analysis; Prentice Hall: New Jersey, NJ, USA, 1958; p. 30. [Google Scholar]
- Ghosh, A.B.; Bajaj, J.C.; Hassan, R.; Singh, D. Soil and Water Testing Methods: A Laboratory Manual Division of Soil Science and Agricultural Chemistry; TARL: New Delhi, India, 1983; Volume 110012, pp. 36–45. [Google Scholar]
- Piper, C.S. Soil and Plant Analysis: A Laboratory Manual of Methods for the Examination of Soils and the Determination of the Inorganic Constituents of Plants; Adelaide Univ. Press: Australia, Adelaide, 1950; p. 368. [Google Scholar]
- Jackson, M.L. Soil Chemical Analysis; Constable and Co. Ltd.: London, UK, 1962; p. 497. [Google Scholar]
- Olsen, S.R. Estimation of Available Phosphorus in Soils by Extraction with Sodium Bicarbonate; United States Department of Agriculture: New York, NY, USA, 1954; p. 939.
- Bray, R.H.; Kurtz, L.T. Determination of total, organic, and available forms of phosphorus in soils. Soil Sci. 1945, 59, 39–46. [Google Scholar] [CrossRef]
- Fox, R.L.; Olson, R.A.; Rhoades, H.F. Evaluating the sulfur status of soils by plant and soil tests. Soil Sci. Soc. Am. J. 1964, 28, 243–246. [Google Scholar] [CrossRef]
- Underwood, N.; Navaretta, C. Towards a standard for the creation of lexica. In EAGLES and ELM Specification Recommendation for Lexica; Center for Sprogteknologi: Njalsgade, Denmark, 1997; Available online: https://elda.org/media/filer_public/2013/12/04/standard_lexica.pdf (accessed on 12 March 2021).
- Akter, L.; Ullah, M.A.; Hossain, M.B.; Karmaker, A.R.; Hossain, M.S.; Albeshr, M.F.; Arai, T. Diversity and Assemblage of Harmful Algae in Homestead Fish Ponds in a Tropical Coastal Area. Biology 2022, 11, 1335. [Google Scholar] [CrossRef] [PubMed]
- Hossain, M.S.; Hossain, M.B.; Rakib, M.R.J.; Jolly, Y.N.; Ullah, M.A.; Elliott, M. Ecological and human health risk evaluation using pollution indices: A case study of the largest mangrove ecosystem of Bangladesh. Reg. Stud. Mar. Sci. 2021, 47, 101913. [Google Scholar] [CrossRef]
- BARC (Bangladesh Agricultural Research Council). Fertilizer Recommendation Guide-2005; Miah, M.M.U., Farid, M.T.M., Miah, M.A.M., Jahiruddin, M., Rahman, S.M.K., Quayyum, M.A., Eds.; Peoples Press & Publications: Dhaka, Bangladesh, 2005; p. 260. [Google Scholar]
- Trussell, R.P. The Percent Un-Ionized Ammonia in Aqueous Ammonia Solutions at Different pH Levels and Temperatures. J. Fish. Board Can. 1972, 29, 1505–1507. [Google Scholar] [CrossRef]
- Banerjea, S.M. Water quality and soil condition of fish ponds in some states of India in relation to fish production. Indian J. Fish 1967, 14, 115–144. [Google Scholar]
- Jhingran, A.G. Recent advances in reservoir fisheries management in India. In Reservoir Fisheries of Asia, Proceedings of the 2nd Asian Reservoir Fisheries Workshop; IDRC-Ottawa: Ontario, OA, Canada, 1992; pp. 158–175. [Google Scholar]
- Boyd, C.E.; Tucker, C.S. Pond Aquaculture Water Quality Management; Kluwer Academic Publishers: Boston, MA, USA, 1998. [Google Scholar]
- Gul, N.; Mussaa, B.; Masood, Z.; Rehman, H.; Ullah, A.; Majeed, A. Study of some physiochemical properties of soil in fish pond at circuit house; district Sibi of province Balochistan, Pakistan. Glob. Vet. 2015, 14, 362–365. [Google Scholar]
- Haque, M.E.; Aktar, S.; Uddin, M.J.; Islam, M.S.; Kabir, M.F. Study the effects of stocking density on growth survival and yield of Amblypharyngodon mola in rice fields. Bangladesh J. Progress. Sci. Technol. 2009, 7, 133–136. [Google Scholar]
- Kumar, B.M.; Katti, R.J.; Moorthy, K.S.V.; Souza, R.K.D. Macrobenthos in relation to sediment characteristics of nearshore waters of Chitrapur, West coast of India receiving industrial effluents. Asian Fish. Sci. 2004, 17, 21–28. [Google Scholar]
- Sugunan, V.V.; Vinci, G.K.; Bhattacharjya, B.K.; Hassan, M.A. Ecology and fisheries of beels in West Bengal. Bull 2000, 103, 1–53. [Google Scholar]
- Singh, R.P.; Mishra, S.K. Available macro nutrients (N, P, K and S) in the soils of Chiraigaon block of district Varanasi (UP) in relation to soil characteristics. Indian J. Sci. Res. 2012, 9, 97–101. [Google Scholar]
- Reddy, K.R.; Fisher, M.M.; Ivanoff, D. Resuspension and diffusive flux of nitrogen and phosphorus in a hypereutrophic lake. J. Environ. Qual. 1999, 25, 363–371. [Google Scholar] [CrossRef]
- Rajasegar, M. Physico-chemical characteristics of the Vellar estuary in relation to shrimp farming. J. Environ. Biol. 2003, 24, 95–101. [Google Scholar] [PubMed]
- Soil Survey Staff. Keys to Soil Taxonomy, 6th ed.; United States Department of Agriculture, Soil Conservation Service: Washington, DC, USA, 1994.
- Dent, D.L. Acid sulphate soils: A baseline for research and development. ILRI 1986, 39, 204. [Google Scholar]
- Singh, S.P. Different forms of sulphur in soils of Udham Singh Nagar district, Uttarakhand and their relationship with soil properties. Agropedology 2009, 19, 68–74. [Google Scholar]


| Variables | Source of Variation | Winter | Pre-Monsoon | ||||
|---|---|---|---|---|---|---|---|
| df | x2 | p | df | x2 | p | ||
| Temperature (°C) | Stations | 29 | 0.0054 | 1 | 29 | 0.0049 | 1 |
| pH | Stations | 29 | 0.0021 | 1 | 29 | 0.01 | 1 |
| EC (mS/cm) | Stations | 29 | 0.0709 | 1 | 29 | 0.2737 | 0.9996 |
| OM (mg/kg) | Stations | 29 | 0.4859 | 0.9724 | 29 | 0.9612 | 0.5416 |
| OC (mg/kg) | Stations | 29 | 0.4853 | 0.9726 | 29 | 0.9609 | 0.542 |
| N (mg/kg) | Stations | 29 | 0.4855 | 0.9725 | 29 | 0.9609 | 0.542 |
| P (mg/kg) | Stations | 29 | 4.728 | 2.96 × 10⁻⁵ | 29 | 0.6309 | 0.8908 |
| S (mg/kg) | Stations | 29 | 0.4312 | 0.987 | 29 | 0.5817 | 0.9259 |
| T | pH | EC | OM | OC | N | P | S | ||
|---|---|---|---|---|---|---|---|---|---|
| Winter | T | ||||||||
| pH | 0.03 | ||||||||
| EC | −0.22 | −0.09 | |||||||
| OM | −0.31 | −0.42 | 0.12 | ||||||
| OC | −0.31 | −0.42 | 0.12 | 1.00 | |||||
| N | 0.11 | −0.33 | 0.02 | 0.59 | 0.59 | ||||
| P | −0.19 | 0.06 | 0.03 | 0.14 | 0.14 | −0.20 | |||
| S | −0.03 | −0.51 | 0.09 | 0.42 | 0.42 | 0.06 | 0.37 | ||
| Pre-monsoon | T | ||||||||
| pH | 0.06 | ||||||||
| EC | −0.21 | 0.09 | |||||||
| OM | −0.36 | −0.34 | 0.19 | ||||||
| OC | −0.36 | −0.34 | 0.19 | 1.00 | |||||
| N | −0.19 | −0.15 | 0.29 | 0.71 | 0.72 | ||||
| P | 0.15 | 0.35 | 0.65 | 0.13 | 0.13 | 0.25 | |||
| S | −0.27 | 0.04 | 0.56 | 0.55 | 0.55 | 0.38 | 0.56 |
Publisher’s Note: MDPI stays neutral with regard to jurisdictional claims in published maps and institutional affiliations. |
© 2022 by the authors. Licensee MDPI, Basel, Switzerland. This article is an open access article distributed under the terms and conditions of the Creative Commons Attribution (CC BY) license (https://creativecommons.org/licenses/by/4.0/).
Share and Cite
Karmakar, A.R.; Ullah, M.A.; Hasan, M.M.; Akter, L.; Sarker, M.M.; Arai, T.; Sikder, M.N.A.; Albeshr, M.F.; Hossain, M.B. Sedimentary Nutrient Dynamics in Homestead Fishpond Systems from a Subtropical Coastal Area. Agriculture 2022, 12, 2077. https://doi.org/10.3390/agriculture12122077
Karmakar AR, Ullah MA, Hasan MM, Akter L, Sarker MM, Arai T, Sikder MNA, Albeshr MF, Hossain MB. Sedimentary Nutrient Dynamics in Homestead Fishpond Systems from a Subtropical Coastal Area. Agriculture. 2022; 12(12):2077. https://doi.org/10.3390/agriculture12122077
Chicago/Turabian StyleKarmakar, Anu Rani, Md. Akram Ullah, Md. Monjurul Hasan, Liza Akter, Md. Milon Sarker, Takaomi Arai, Mohammad Nurul Azim Sikder, Mohammed Fahad Albeshr, and Mohammad Belal Hossain. 2022. "Sedimentary Nutrient Dynamics in Homestead Fishpond Systems from a Subtropical Coastal Area" Agriculture 12, no. 12: 2077. https://doi.org/10.3390/agriculture12122077
APA StyleKarmakar, A. R., Ullah, M. A., Hasan, M. M., Akter, L., Sarker, M. M., Arai, T., Sikder, M. N. A., Albeshr, M. F., & Hossain, M. B. (2022). Sedimentary Nutrient Dynamics in Homestead Fishpond Systems from a Subtropical Coastal Area. Agriculture, 12(12), 2077. https://doi.org/10.3390/agriculture12122077