


Abstract
Poly(vinylidene fluoride) (PVDF) membranes require both suitable morphology and mechanical integrity, but changes in nanoscale geometry do not necessarily improve all loading responses. Atomistic molecular dynamics simulations were used to compare pristine PVDF and graphene/PVDF membrane models constructed from five-repeat-unit oligomers. A force-driven sedimentation procedure was used to examine the effects of lateral cell size and polymer-chain number on deposited morphology. The structural indicator was a two-dimensional projected void-area fraction. Increasing polymer-chain number reduced the projected void fraction, whereas increasing lateral cell size produced thinner deposits with greater uncovered area. Graphene-containing structures showed greater projected coverage under corresponding construction conditions. Separately prepared mechanical specimens were subjected to tensile and shear loading using identical PVDF parameters within the mechanical comparisons. The reported mean apparent tensile secant modulus was approximately 14.6% higher for the composite, a descriptive finite-rate comparison. Its peak stress averaged over three independent runs was 122.46 ± 32.57 MPa (mean ± sample standard deviation), whereas the peak of its average curve was 109.38 MPa. These results distinguish the reported initial-slope difference from peak-response variability and clarify the statistical meaning of peak load resistance. They provide an atomistic basis for discussing membrane-skeleton geometry and loading-dependent response, without constituting a prediction of water permeability, selectivity, or antifouling performance.
1. Introduction
Membrane-based separation is an important technology for water purification, wastewater reclamation, and advanced treatment of complex aqueous streams [1,2,3,4]. In addition to separation performance, membrane materials must retain sufficient structural integrity during handling and operation. Fouling and repeated cleaning introduce further operational demands [5,6,7,8], while the preparation route determines the pore morphology and polymer structure on which membrane performance depends [9]. This makes the relationship between membrane construction, nanoscale structure, and mechanical response relevant to the design of durable polymer membranes.
Poly(vinylidene fluoride) (PVDF) is widely used for microfiltration and ultrafiltration because of its chemical resistance, thermal stability, and membrane-forming ability [10,11]. Its properties depend on both polymer chemistry and the morphology produced during membrane formation. A larger void fraction may provide more space for transport. Membrane thickness, void geometry, and deformation resistance should therefore be characterized separately rather than inferred from a single structural descriptor.
Graphene-based additives have been investigated as modifiers of PVDF membranes, but pristine graphene and graphene oxide (GO) must be distinguished. GO contains oxygen-bearing functional groups that modify its surface chemistry [12,13], whereas the present study concerns carbon-only graphene flakes embedded in PVDF. Experimental GO/PVDF studies have examined blending and filler concentration [14,15], chemically functionalized additives [16], membrane-bioreactor operation and natural-organic-matter removal [17,18], and coagulation- and electrospinning-based preparation [19,20]. Additional functional components and improved GO dispersion have also been investigated [21,22,23]. These studies demonstrate preparation-dependent changes in graphene-containing membranes [24]; their transport and antifouling results should not be transferred directly to an unfunctionalized graphene/PVDF model.
Recent work further illustrates why chemistry, morphology, and performance must be separated. Sun et al. examined the influence of GO dispersion in PVDF ultrafiltration membranes [23]. Alemdar and Pekel Bayramgil compared oxygen-functionalized graphene/PVDF nanofiber mats and solvent-evaporated films, linking surface chemistry and preparation route to separation behavior [25]. Huang et al. used nonsolvent-induced phase separation to prepare PVDF/graphene piezocatalytic membranes and investigated crystalline-phase organization and pollutant degradation [26]. These studies involve functional chemistry or operating mechanisms absent from the present dry, fixed-topology model. Here, unoxidized graphene is selected to study carbon-sheet incorporation without also varying oxygen content and functional-group distribution. This is a controlled choice of chemical model.
An additive can influence polymer packing and load transfer even when no improvement in wettability is assumed. Consequently, changes in surface chemistry and filtration behavior should be distinguished from changes in the load-bearing polymer assembly. For the present unoxidized graphene/PVDF system, the immediate mechanical question is whether an increase in the initial tensile slope is accompanied by an increase in peak resistance. This question also avoids using one favorable mechanical indicator to stand for all aspects of membrane integrity.
The mechanics of graphene composites depends on filler arrangement and polymer–filler interactions [27]. Raman measurements on a model graphene/polymer composite demonstrated stress transfer to graphene and a finite interfacial load-bearing capacity [28]. Simulations of PVDF containing single-wall carbon nanotubes also showed that stiffness changes depend on loading direction and nanotube spacing [29]. These studies motivate separating initial stiffening from the maximum tensile resistance of the assembly, while recognizing that different carbon-filler geometries create different interfaces.
Molecular dynamics (MD) provides access to local configurations and interactions that complement membrane-scale measurements. Previous membrane simulations have addressed adsorption and interfacial processes [30,31], as well as the effects of ions, surface chemistry, and roughness [32,33]. For a mechanical study, atomistic models allow construction history, molecular arrangement, and loading protocol to be specified explicitly. Güryel et al. examined the organization of polymer oligomers, including PVDF, near graphene [34]. Yang et al. investigated the effects of temperature, poling, and stretching on the conformation of a longer-chain PVDF model [35]. Bystrov et al. studied polarization switching in PVDF/graphene layered structures using a semi-empirical molecular-dynamics approach [36]. These studies address different observables and parameterizations; they motivate examining local structure and loading response without treating an oligomer model as a complete representation of a long-chain semicrystalline membrane.
The present study asks how lateral confinement and polymer loading regulate deposited geometry, and whether adding graphene produces the same change in initial stiffness and peak tensile resistance. Structural scans use a common force-driven construction procedure to compare film morphology, projected coverage, and a geometric void-size descriptor. Separately prepared mechanical specimens are used to compare tensile and shear responses under a common force-field framework. The contribution is this model-specific comparison of construction geometry and distinct mechanical observables, rather than a reconstruction of experimental phase inversion or a complete structure–mechanics–transport relationship. The structural and mechanical datasets are therefore interpreted as related, but not as a one-to-one series of identical specimens.
2. Materials and Methods
2.1. Atomistic Models and Structural Characterization
Atomistic models of pristine PVDF and graphene/PVDF were prepared as two separate families. PVDF chains were represented by five-repeat-unit oligomers with CH3 and CF3 termini (C10H11F11). The structural composite systems contained 15 carbon-only C54 flakes. The mechanical composites used the same flake specification and count. Each mechanical specimen contained 150 PVDF chains (4800 polymer atoms). The composite therefore contained 810 graphene atoms and 5610 atoms in total. Graphene accounted for approximately 16.013 wt% of the combined polymer and graphene mass and 14.439% of all atoms. Initial mechanical boxes were approximately 4.5 × 4.5 × 2.97785 nm3 for PVDF and 4.5 × 4.5 × 3.2 nm3 for graphene/PVDF, with periodic boundaries in all directions. Structural models varied the lateral cell-size-to-initial-chain-length ratio, Λ = L/l, or chain number n: the Λ series varied L at n = 150, and the n series varied n at L = 6.8 nm. Their z extent was 14.0 nm, with x/y periodic and z nonperiodic boundaries, a bottom wall, and a constant deposition force at 300 K. Limited relaxation and NVT pre-equilibration preceded 20 ps of deposition. These deposited layers are not replicas of commercial filtration membranes. The projected void-area fraction, φ2D, was evaluated by projecting atomic van der Waals disks onto the membrane plane on a 0.10 nm grid:
Here, Nvoid and Ntotal are the numbers of uncovered and total grid points, respectively. A grid point is occupied if it lies within at least one projected atomic disk; overlapping disks do not contribute multiple counts. Equation (1) gives a dimensionless fraction, whereas φ2D as a percentage of area. The van der Waals radii of C, H, and F were 0.170, 0.120, and 0.147 nm, respectively [37]. Geometric size distributions were obtained using a periodic Voronoi-based analysis. The output is referred to as a geometric void-size descriptor, sV, rather than a hydraulic pore diameter. A Voronoi descriptor, a maximum empty-circle radius in a projected image, and a three-dimensional probe-accessible pore size are different geometric quantities unless their definitions are demonstrated to coincide. The 0.10 nm spacing specifies the projection-grid resolution; it is not taken as evidence that a grid-convergence test or a three-dimensional connectivity analysis has been completed.
The use of five-repeat-unit oligomers (degree of polymerization, DP = 5) defines the scope of the mechanical comparison. Both mechanical systems contain 150 DP = 5 chains; this controls chain length within that comparison but does not establish chain-length convergence or robustness of the graphene-associated difference at higher molecular weight. Changing L/l or chain number in the structural scans is not a chain-length test. Both model families use C54 graphene flakes, but their charge assignments, boundary conditions, and preparation protocols differ. They are not matched specimen by specimen, and a structural projected-coverage result is not assigned as the cause of a response in a separately prepared mechanical specimen. The assemblies were constructed without prescribing a PVDF crystal lattice; this preparation choice does not itself determine crystallinity.
A projected gap and a three-dimensional cavity answer different questions. Three-dimensional void volume and probe-center-accessible volume are distinct geometric quantities defined within a membrane-only domain that excludes external vacuum.
2.2. Molecular Dynamics Simulations and Mechanical Loading
Molecular dynamics simulations were performed using LAMMPS [38]. The mechanical models used a common fixed-topology OPLS-AA framework [39]: PVDF bonded, torsional, Lennard–Jones (LJ), and charge assignments were identical between pristine and graphene-containing specimens for tensile and shear loading. In contrast, the structural-construction models used zero atomic charges. Bond stretching and angle bending were harmonic, and torsions used the OPLS Fourier form. In the mechanical models, long-range electrostatics were treated with PPPM, and 1–4 LJ and Coulomb interactions were scaled by 0.5. Graphene–PVDF LJ cross coefficients used geometric mixing for both ε and σ, without an additional empirical attraction. The OPLS-AA and fluorocarbon studies provide parameter-development context [39,40,41]; the independently developed PVDF potential of Byutner and Smith [42] is a separate parameterization. The present mechanical comparison is confined to the adopted models and parameters, rather than a validated prediction of bulk membrane properties. The integration time step was 0.5 fs, and OVITO was used for visualization [43]. Fixed topology describes deformation and rearrangement, not reactive bond breaking.
The LJ self-parameters (ε in kcal mol−1; σ in Å) were 0.066/3.50 for PVDF carbon, 0.030/2.50 for hydrogen, 0.060/2.90 for fluorine, and 0.070/3.55 for graphene carbon. In the mechanical models, the charges of CH3, CH2, CF2, and CF3 carbon sites were −0.18, −0.12, +0.24, and +0.36 e, respectively; H and F carried +0.06 and −0.12 e. Each capped PVDF chain was neutral, and graphene carbon had zero charge. Thus, direct graphene–PVDF pairwise Coulomb interactions vanish in this fixed-charge model, while polymer electrostatics remain active. Unlike the partial-charge mechanical models, the structural models assigned zero charge to every atom.
Density definitions depend on the model domain. The full-cell density is M/Vcell, whereas an envelope-based apparent density is M/(Axy hm), with hm denoting the deposited-film thickness under a specified geometric convention. A layer-resolved mass density is defined as the mass in a layer divided by AxyΔz. These definitions are distinct from the intrinsic density of a uniform bulk polymer when external or internal voids are present. The initial box dimensions are not identified with an equilibrated membrane thickness. The preparation durations below specify the loading history rather than a quantitative convergence criterion for density or energy.
Tensile preparation comprised 10 ps of NVE/limit plus Langevin relaxation, 50 ps NVT, 100 ps NPT at 300 K and 0 atm, 50 ps of preloading transverse-pressure relaxation, and 50 ps of baseline recording. The periodic box was then elongated along x at the engineering rate 1 × 10⁻⁴ fs−1 (1 × 10¹¹ s−1) for 20,000 steps (10 ps), with y/z pressure maintained at 0 atm and temperature at 300 K. Output was recorded every 500 steps (0.25 ps). Initial-velocity seeds were 12,345, 22,445, and 32,345. True strain is ε = ln[Lx(t)/Lx(0)], distinct from engineering strain e = Lx(t)/Lx(0) − 1. Apparent true stress is obtained from the baseline-corrected −pxx using the instantaneous full-cell volume; 1 atm corresponds to 0.101325 MPa. For composite peak statistics, the maximum of each run was evaluated before calculating its mean and sample standard deviation; the peak of the average curve is a separate statistic. Time points within one trajectory are not independent simulation replicates [44].
Shear preparation comprised 500 ps NPT at 300 K and 1 atm, 100 ps NVT, 1.5 ps of grip-region relaxation, and 5 ps of baseline sampling. The top region moved along x at 0.002 Å fs−1 for 50,000 steps (25 ps), giving a commanded displacement of 50 Å. Shear strain was obtained from the change in unwrapped top–bottom relative x displacement divided by the initial separation of their centers of mass for each run. Shear stress was the baseline-corrected interaction force between the top region and the rest of the system divided by LxLγ. Stress and strain were time-averaged into 1000-step (0.5 ps) output intervals. Seeds were 12,345, 20,156, and 7418. The three shear curves were interpolated to a common grid within their shared strain interval before averaging, rather than averaged at equal time indices. These are finite-rate loading protocols; no rate-independent or fully equilibrated long-chain response is inferred from their duration alone.
Graphene contact statistics were evaluated at the loading-start configuration of each of the three composite tensile runs, each containing 150 PVDF chains and 15 C54 flakes. Orthorhombic minimum-image atom-center distances were used. A PVDF atom was counted as contacting graphene if its distance to at least one graphene atom was ≤4.0 Å. A chain was counted once if any of its atoms met that criterion. Two different flakes were counted as a near-contact pair when their minimum interatomic distance was ≤4.0 Å; each unordered pair was counted once. Atom fractions were normalized by 4800 PVDF atoms, chain fractions by 150 chains, and flake-pair counts refer to 105 possible pairs. These statistics describe three initial configurations, not a time-averaged interface-strength measurement.
3. Results and Discussion
3.1. Construction of PVDF and Graphene/PVDF Membrane Models
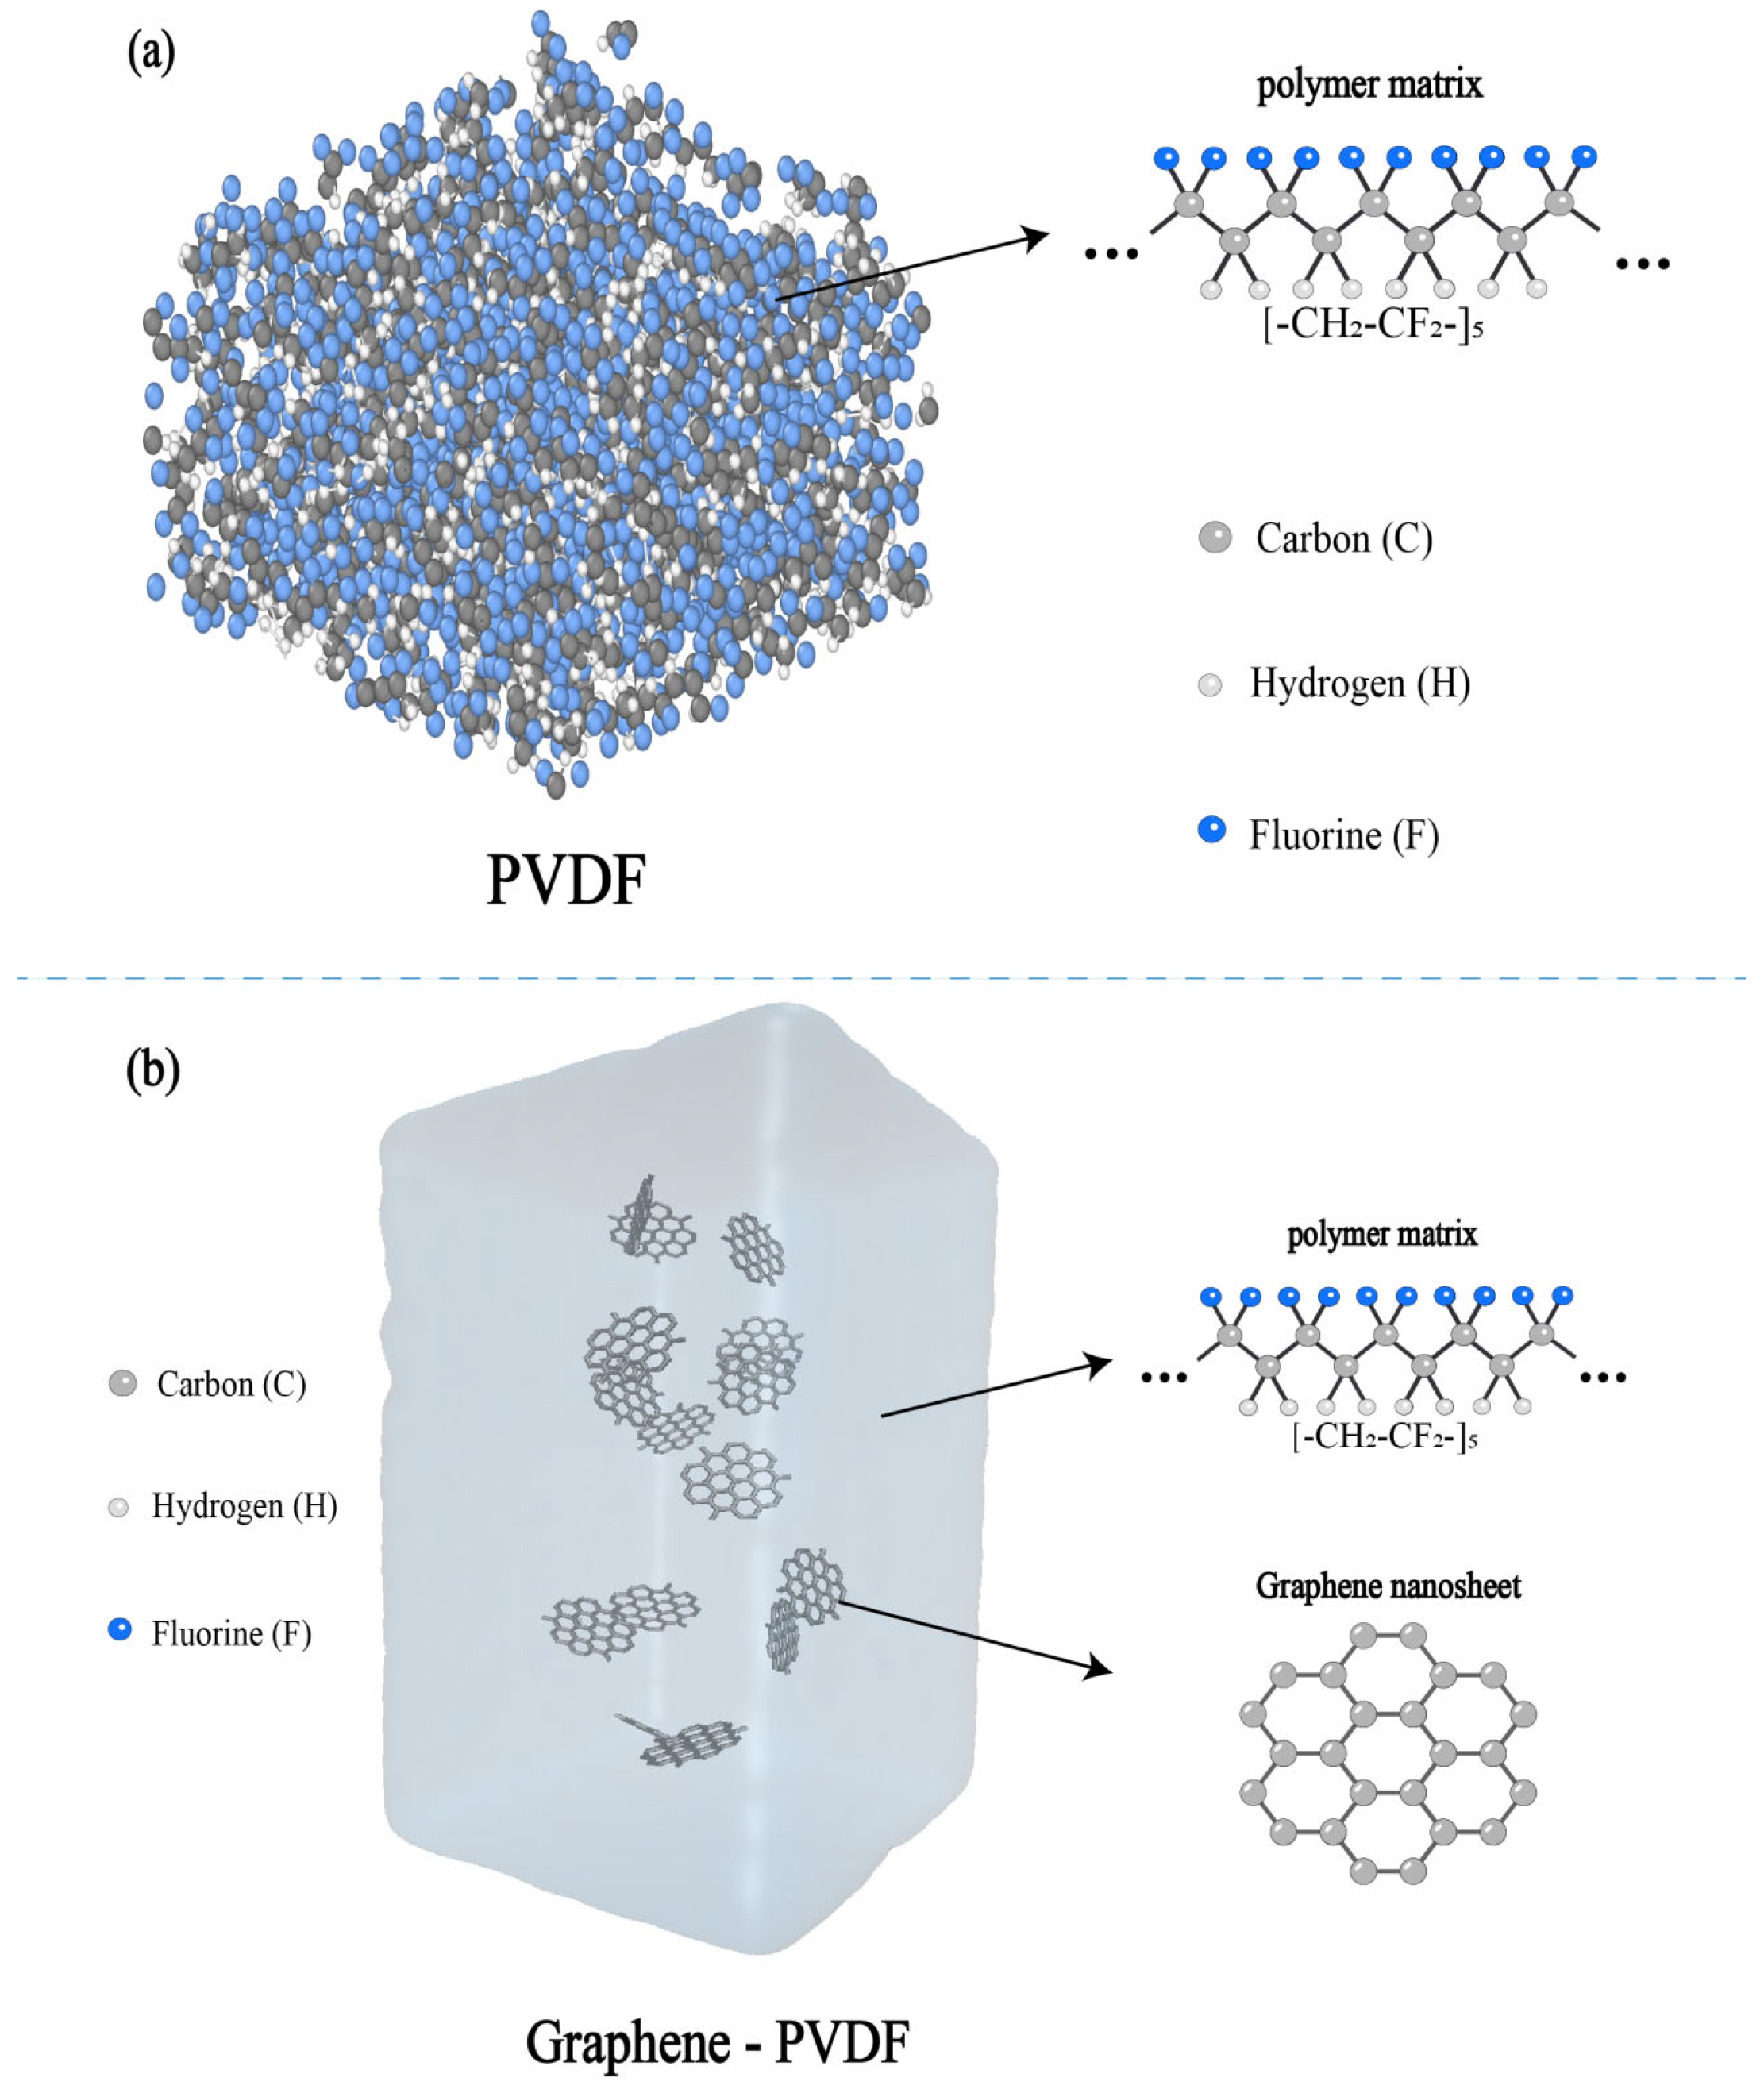
Figure 1 introduces the model components and their organization. PVDF is represented by C10H11F11 oligomers, and carbon-only C54 flakes are embedded in both composite model families. Figure 1b is a schematic, not a quantitative map of equilibrated flake positions or a scale drawing. The different charge assignments, boundary conditions, and preparation protocols of the model families are specified in Section 2.1 and Section 2.2.
Figure 1.
Components and model architectures of PVDF and graphene/PVDF. (a) PVDF molecular assembly and repeat-unit representation. (b) Schematic of graphene flakes embedded in a PVDF matrix. Panel (b) illustrates composition and embedding only; flake count, position, and scale in this schematic do not specify an analyzed simulation cell.
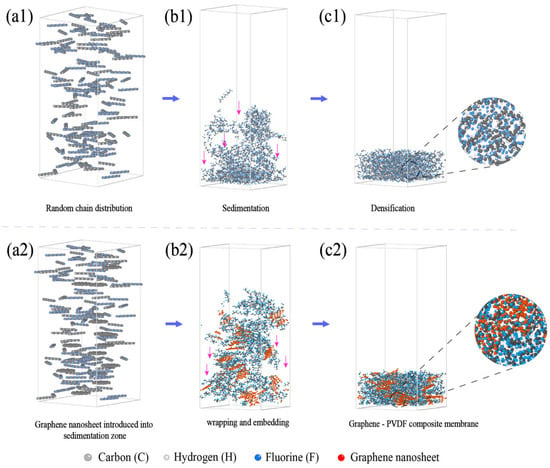
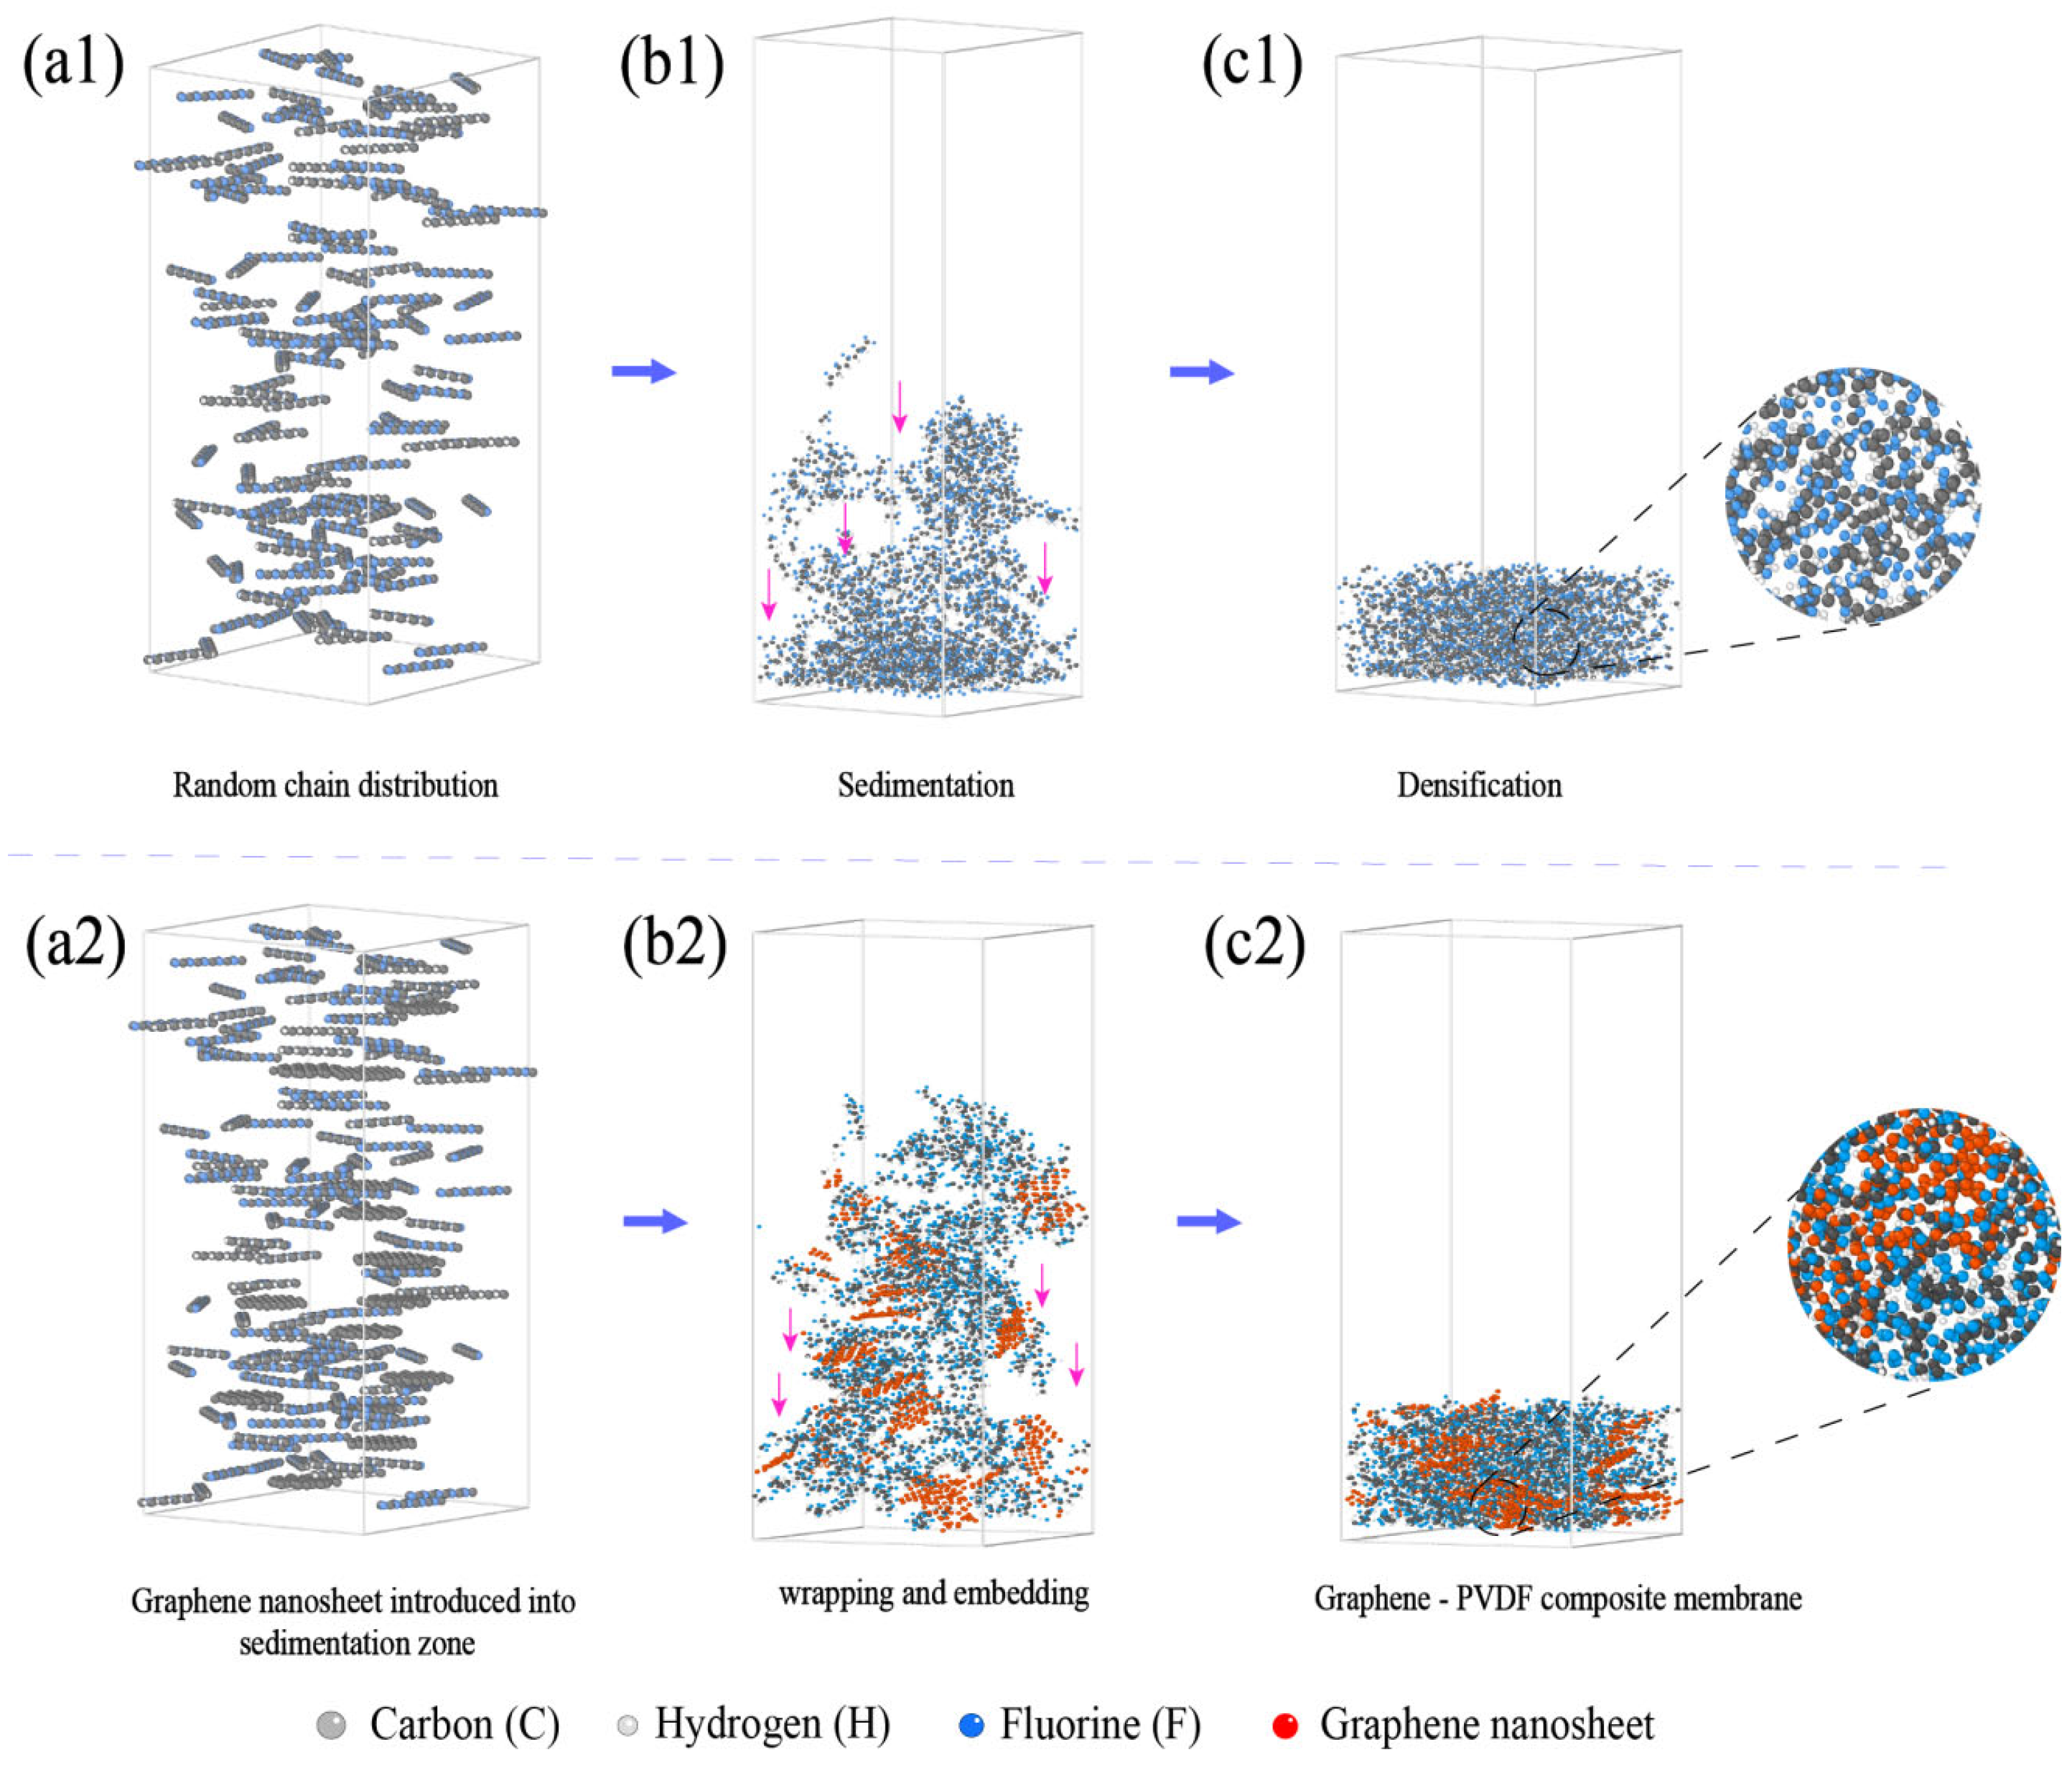
Figure 2 presents the sedimentation-based construction process of the membrane models. Initially dispersed PVDF chains were deposited toward the lower region of the simulation cell under a uniform external driving force applied to all atoms. In the graphene/PVDF systems, graphene flakes experienced the same deposition process together with the surrounding polymer chains. During deposition, PVDF chains gradually rearranged around the graphene surfaces, generating composite architectures with embedded graphene domains and interconnected polymer regions.
Figure 2.
Force-driven construction of the membrane models. (a1–c1) Initially dispersed PVDF segments, deposition toward the lower wall, and the resulting assembly. (a2–c2) Corresponding stages for graphene/PVDF. A constant downward force acts on all atoms.
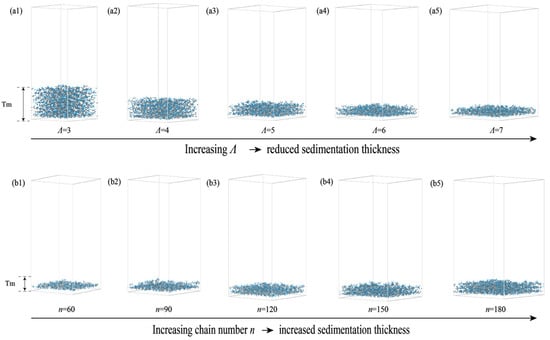
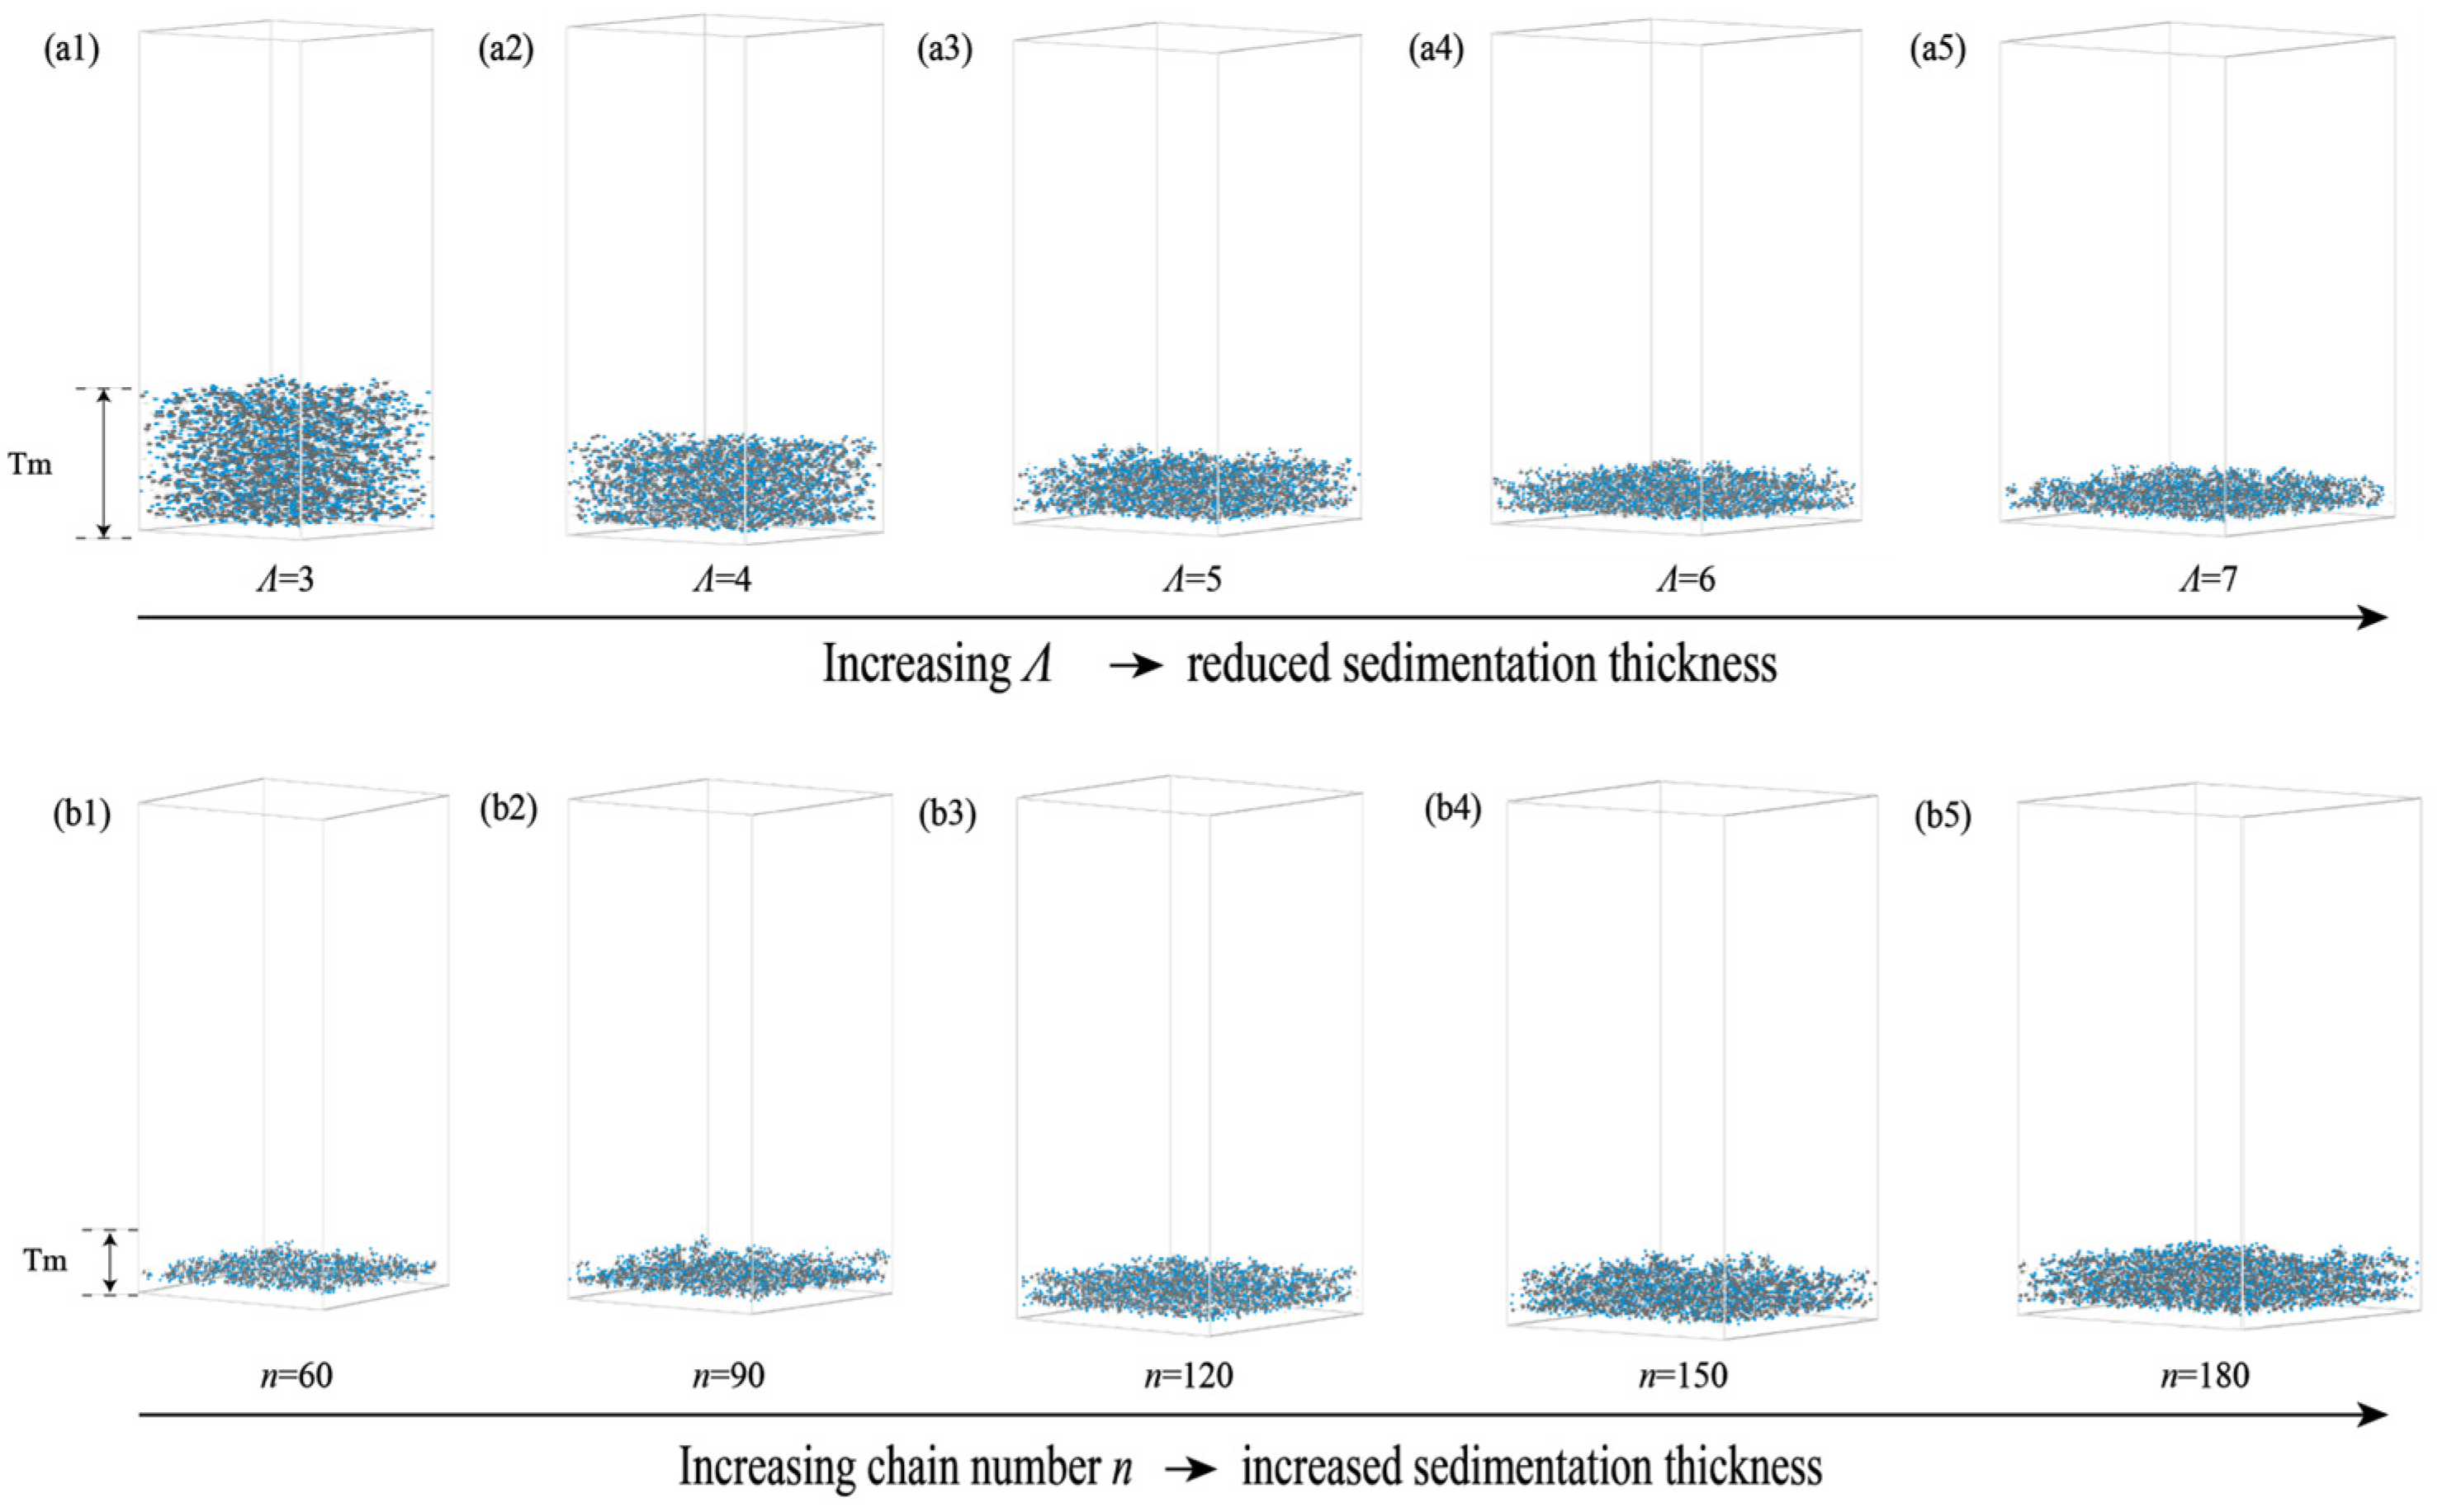
Membrane morphology was regulated by the lateral geometric ratio Λ and polymer-chain number n (Figure 3). At fixed n = 150 and fixed individual chain length, increasing L from 3.4 to 8.0 nm increased the available deposition area and reduced the thickness of the deposited layer. Increasing n at fixed L = 6.8 nm instead increased the amount of deposited polymer and produced thicker structures. Thus, this Λ series changes areal loading as well as lateral confinement; it is a construction scan, not a finite-size convergence test at constant density. Likewise, changing chain number is distinct from changing the number of repeat units in each chain.
Figure 3.
Effects of lateral cell size and polymer-chain number on deposited membrane morphology. (a1–a5) Configurations at a fixed chain number of n = 150 and Λ values of 3–7, corresponding to lateral cell widths of L = 3.4, 4.5, 5.7, 6.8, and 8.0 nm. (b1–b5) Configurations with n = 60, 90, 120, 150, and 180, at a fixed lateral cell width of L = 6.8 nm (Λ = 6). Λ denotes the ratio of the lateral cell width to the initial chain length, and Tm indicates the deposited film thickness.
Figure 4 quantifies these differences through φ2D. At n = 150, increasing lateral cell size enlarged the projected analysis area and reduced polymer coverage, increasing the uncovered projected regions. At L = 6.8 nm, adding polymer chains increased the projected atomic coverage and reduced φ2D. Since all heights are projected onto the same plane, the descriptor includes overlap between atoms located at different z positions. A small projected void fraction is therefore compatible with internal free volume or a tortuous three-dimensional void path; conversely, the projected image alone cannot establish probe accessibility or water permeation.
Graphene/PVDF models exhibited lower projected void-area fractions under corresponding construction conditions. This reflects both direct projection of the carbon flakes and changes in surrounding PVDF organization during deposition. For 15 C54 flakes, the graphene mass fraction is defined relative to the combined graphene and PVDF mass. It decreases from 32.28% at n = 60 through approximately 24.11%, 19.25%, and 16.01% at n = 90, 120, and 150, respectively, to 13.71% at n = 180. The n series therefore varies polymer loading and composite composition together. Its trends are not interpreted as a pure chain-number effect at constant filler concentration, nor as an isolated concentration–mechanical-property relationship. The Λ series at n = 150 maintains the same nominal composition.
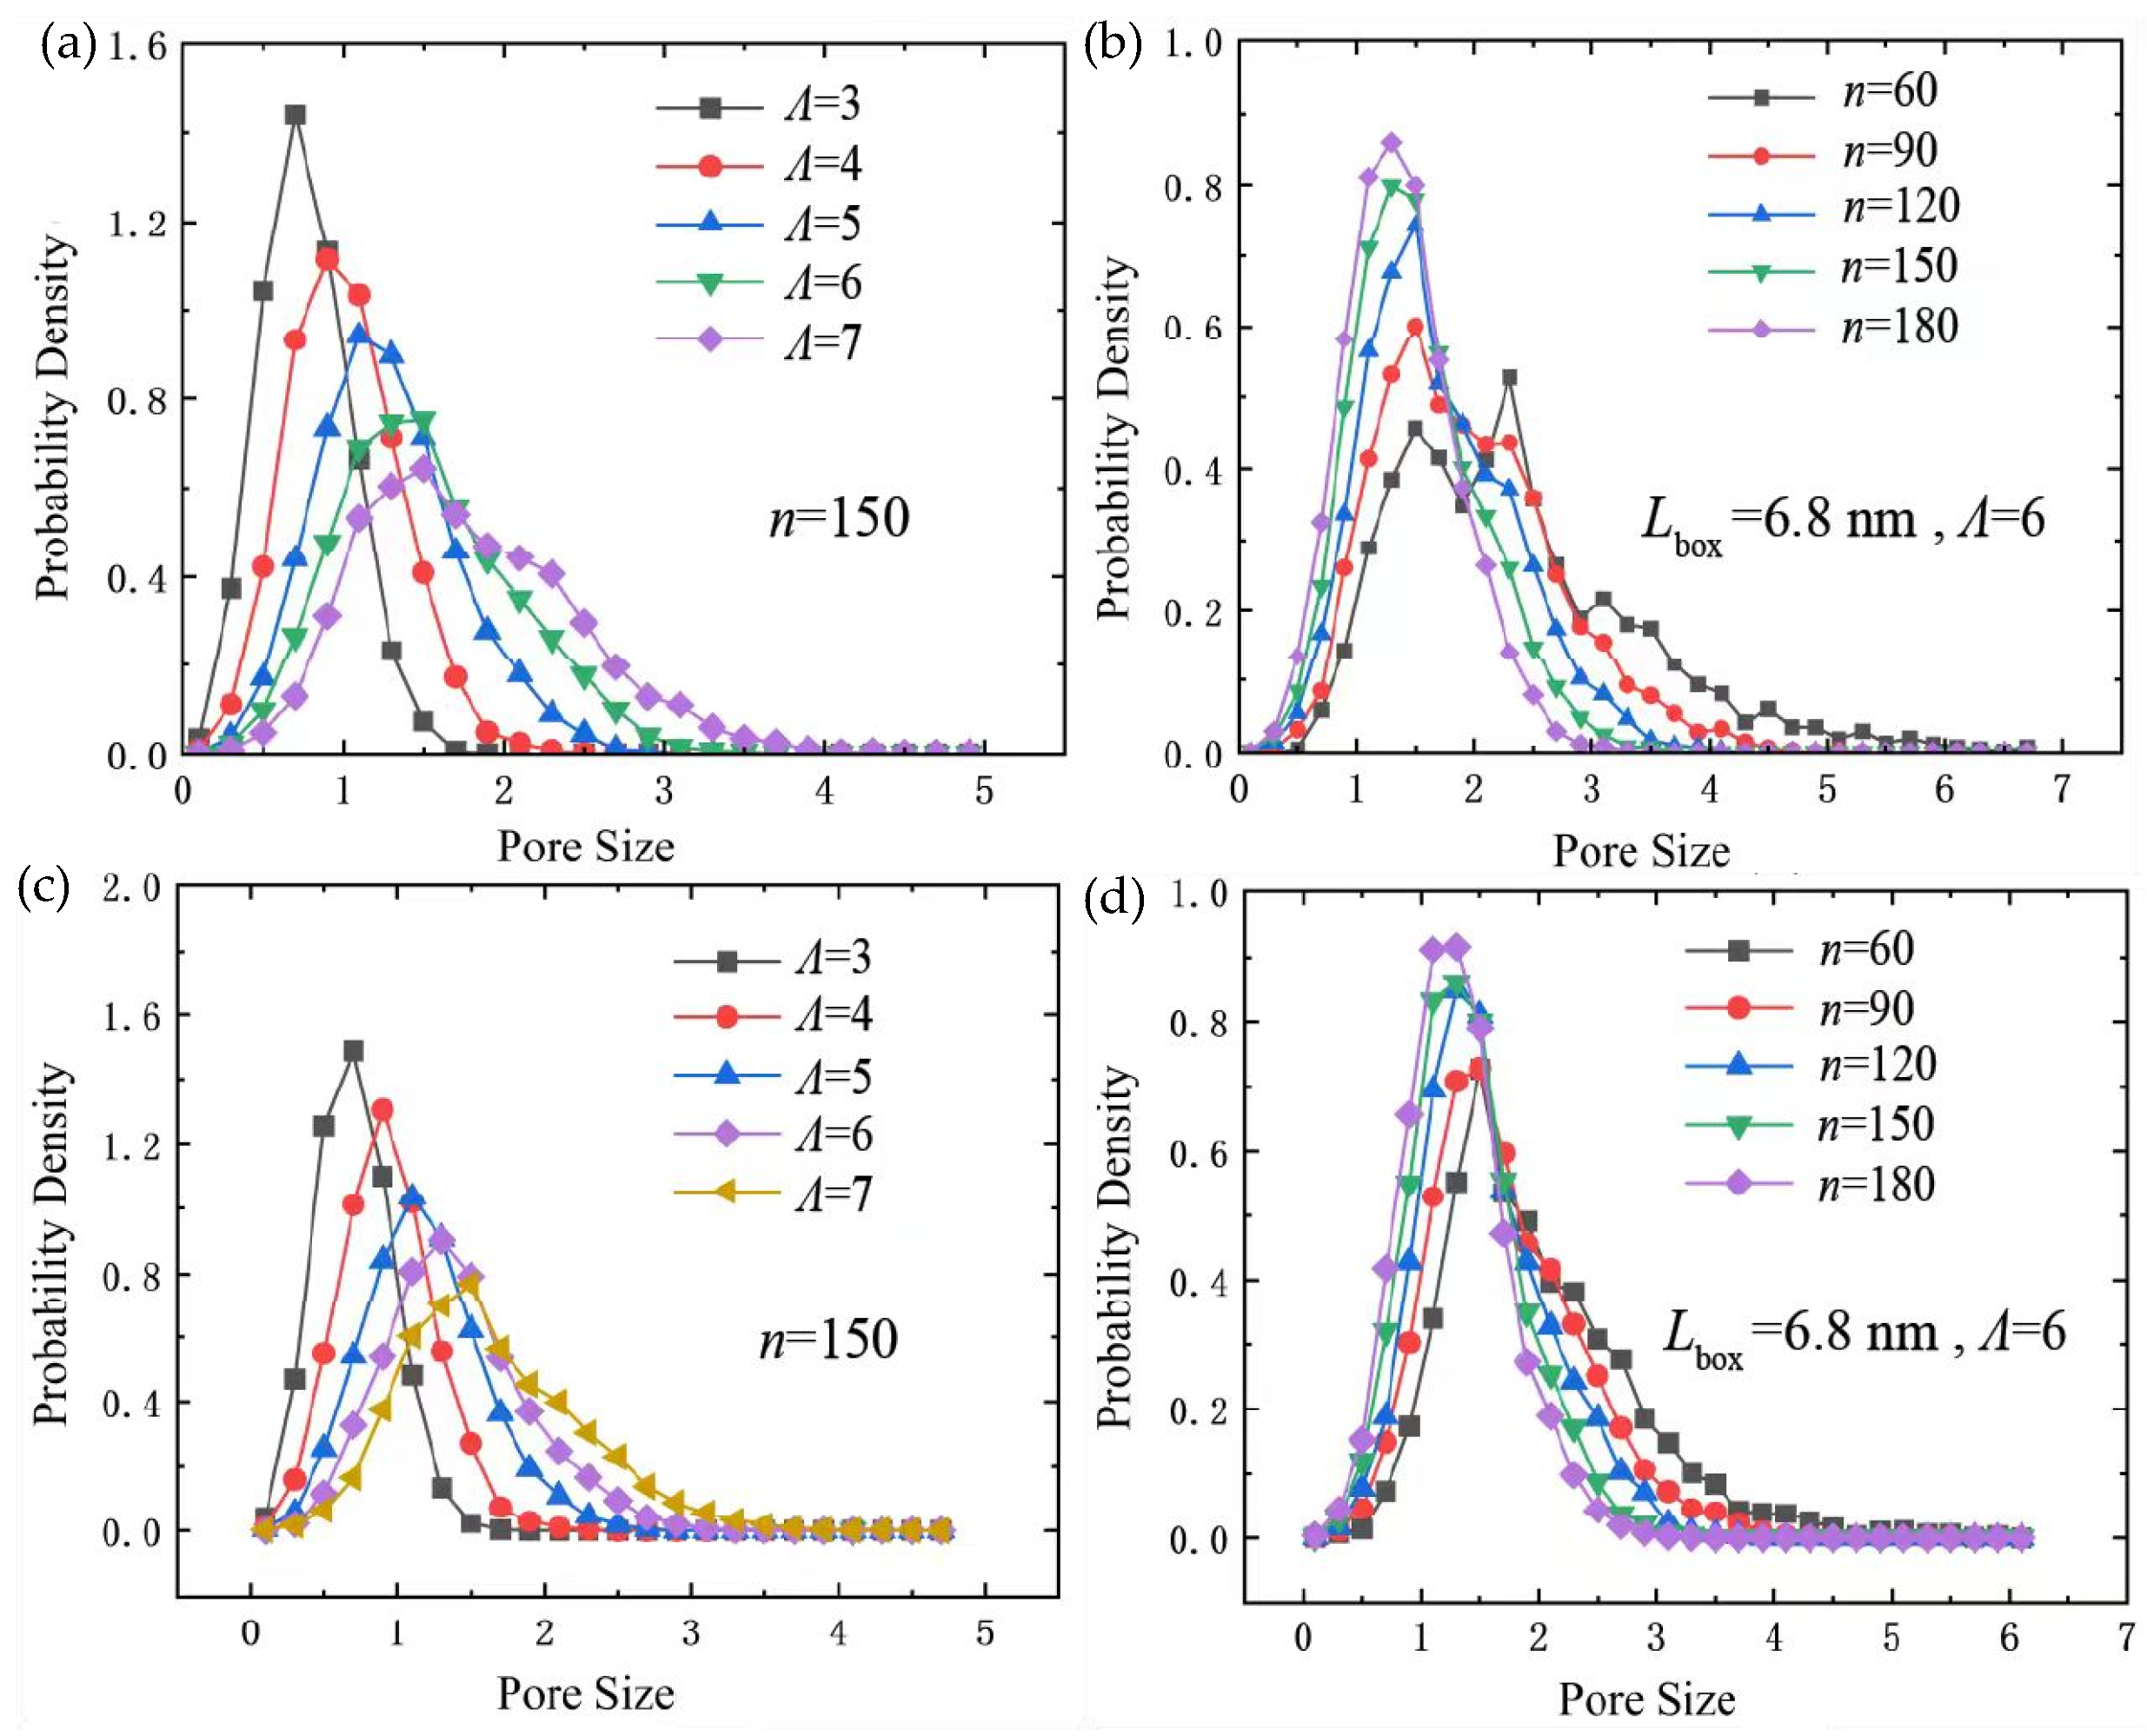
Figure 5 reports the distributions of sV. At n = 150, increasing Λ shifts the distributions toward larger geometric scales and broadens them. At L = 6.8 nm, increasing n suppresses the large-size tail, consistent with greater projected coverage. These distributions characterize the reported geometric analysis; they should not be equated with experimentally measured filtration-pore distributions. Three-dimensional geometric accessibility depends on atomic exclusion radii, probe size, the membrane-domain boundaries, and connectivity, as discussed in established geometric-analysis methods [45,46].
Figure 4.
Two-dimensional projected void-area fraction for PVDF and graphene/PVDF models: (a) PVDF across the Λ at (n = 150); (b) PVDF as a function of n at Lbox = 6.8 nm (Λ = 6); (c) graphene/PVDF across the Λ at (n = 150); (d) graphene/PVDF as a function of n at Lbox = 6.8 nm (Λ = 6).
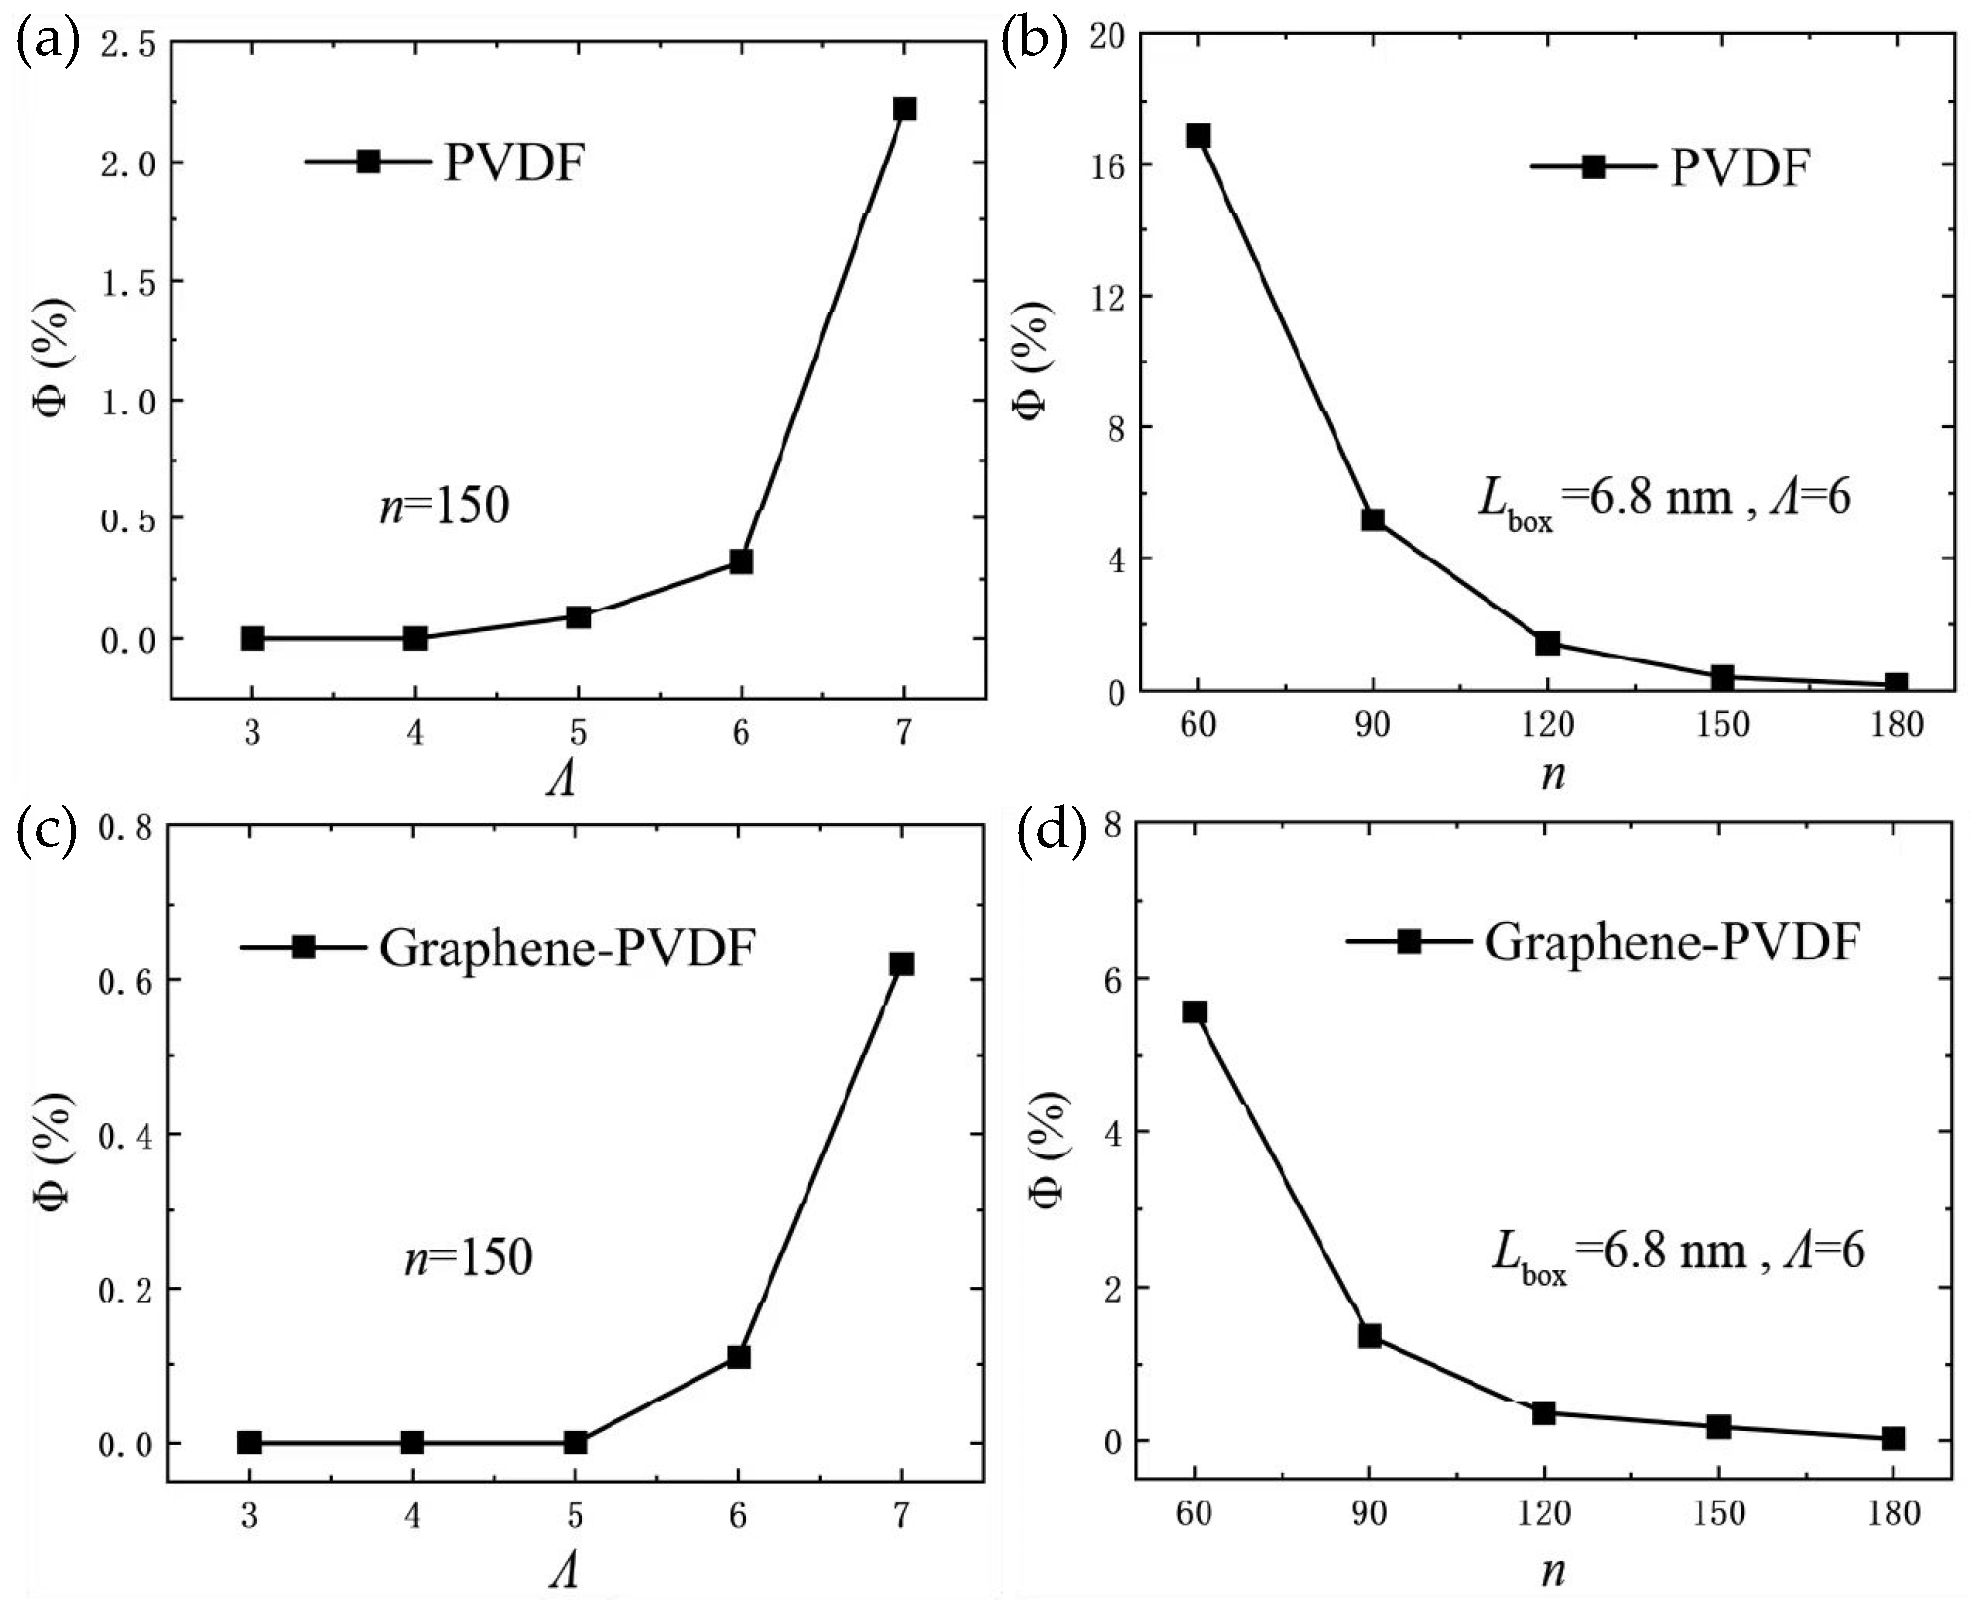
Figure 5.
Distributions of the geometric void-size descriptor sV for PVDF (a,b) and graphene/PVDF (c,d). Left panels compare nominal Λ = 3–7 at n = 150; right panels compare n = 60–180 at L = 6.8 nm. The horizontal-axis label “Pore Size” denotes the Voronoi-based geometric output, not a calibrated hydraulic pore diameter. The panels are used for relative shifts and distribution shapes within each scan, not absolute pore-size calibration or quantitative comparison of ordinate amplitudes between materials. Distribution width describes heterogeneity of the descriptor, not between-run statistical uncertainty.
3.2. Tensile and Shear Deformation
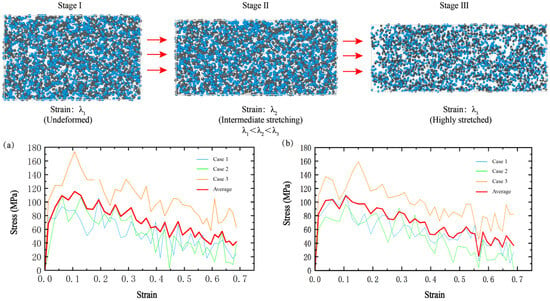
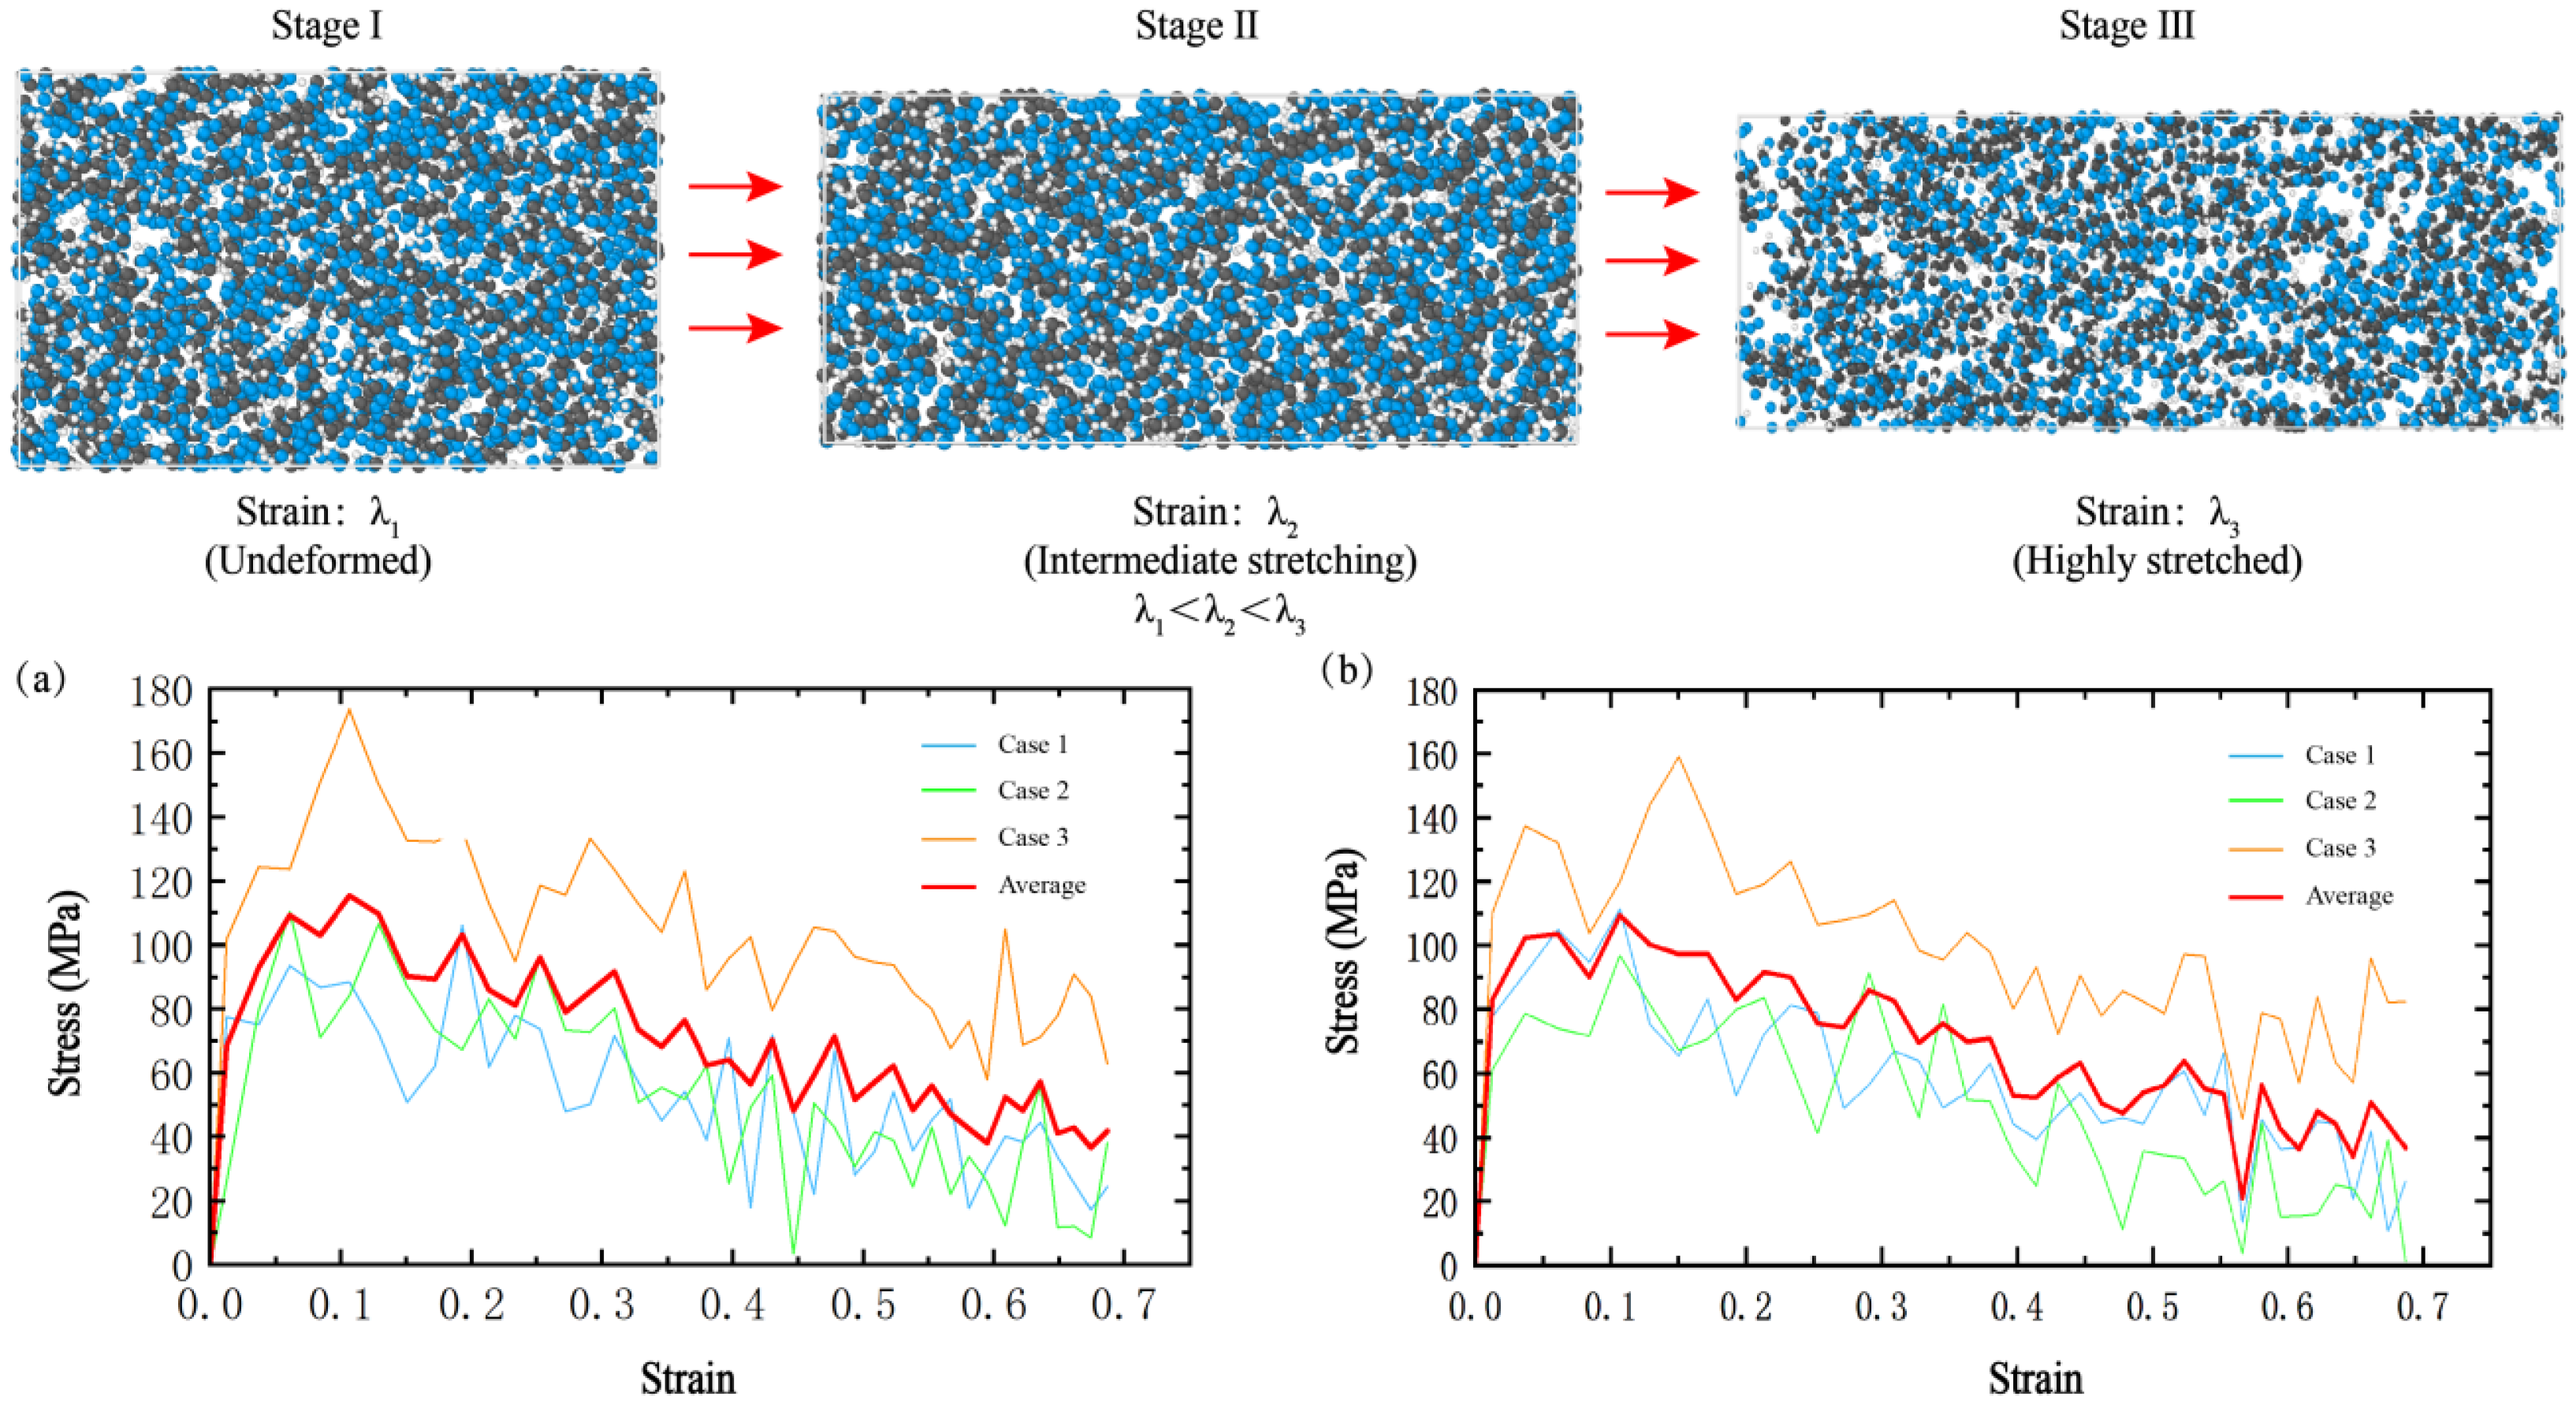
Figure 6 presents representative tensile deformation configurations and the corresponding stress–strain responses. Tensile deformation was applied by continuously elongating the periodic simulation cell along the x direction while allowing transverse relaxation in the y and z directions. Over the displayed strain interval, the stress increases, reaches a maximum, and subsequently decreases. The curves therefore distinguish an initial loading regime from post-peak softening.
Figure 6.
Tensile deformation stages and stress–strain responses of PVDF and graphene/PVDF membrane models. Stages I–III show increasing deformation of the assembly. (a) PVDF. (b) Graphene/PVDF. Cases 1–3 are individual repeated simulations and “Average” is the averaged curve. The displayed post-peak response does not identify a covalent-bond-breaking strain.
The tensile stress is the baseline-corrected global axial pressure expressed as an apparent true stress using the instantaneous full-cell volume. This differs from normalization by a polymer-only volume or an experimentally determined net load-bearing area. The periodic-cell protocol does not impose a measured force through physical grips. An equivalent axial resultant can be defined as Feq(t) = σapp(t)Ly(t)Lz(t); its maximum is the maximum of this product, not the product of the maximum stress and the initial area. Continued post-peak stress represents residual load support by the deforming short-chain assembly, not evidence for covalent-chain scission.
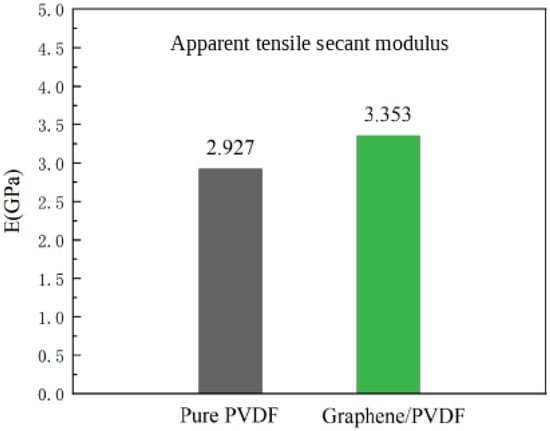
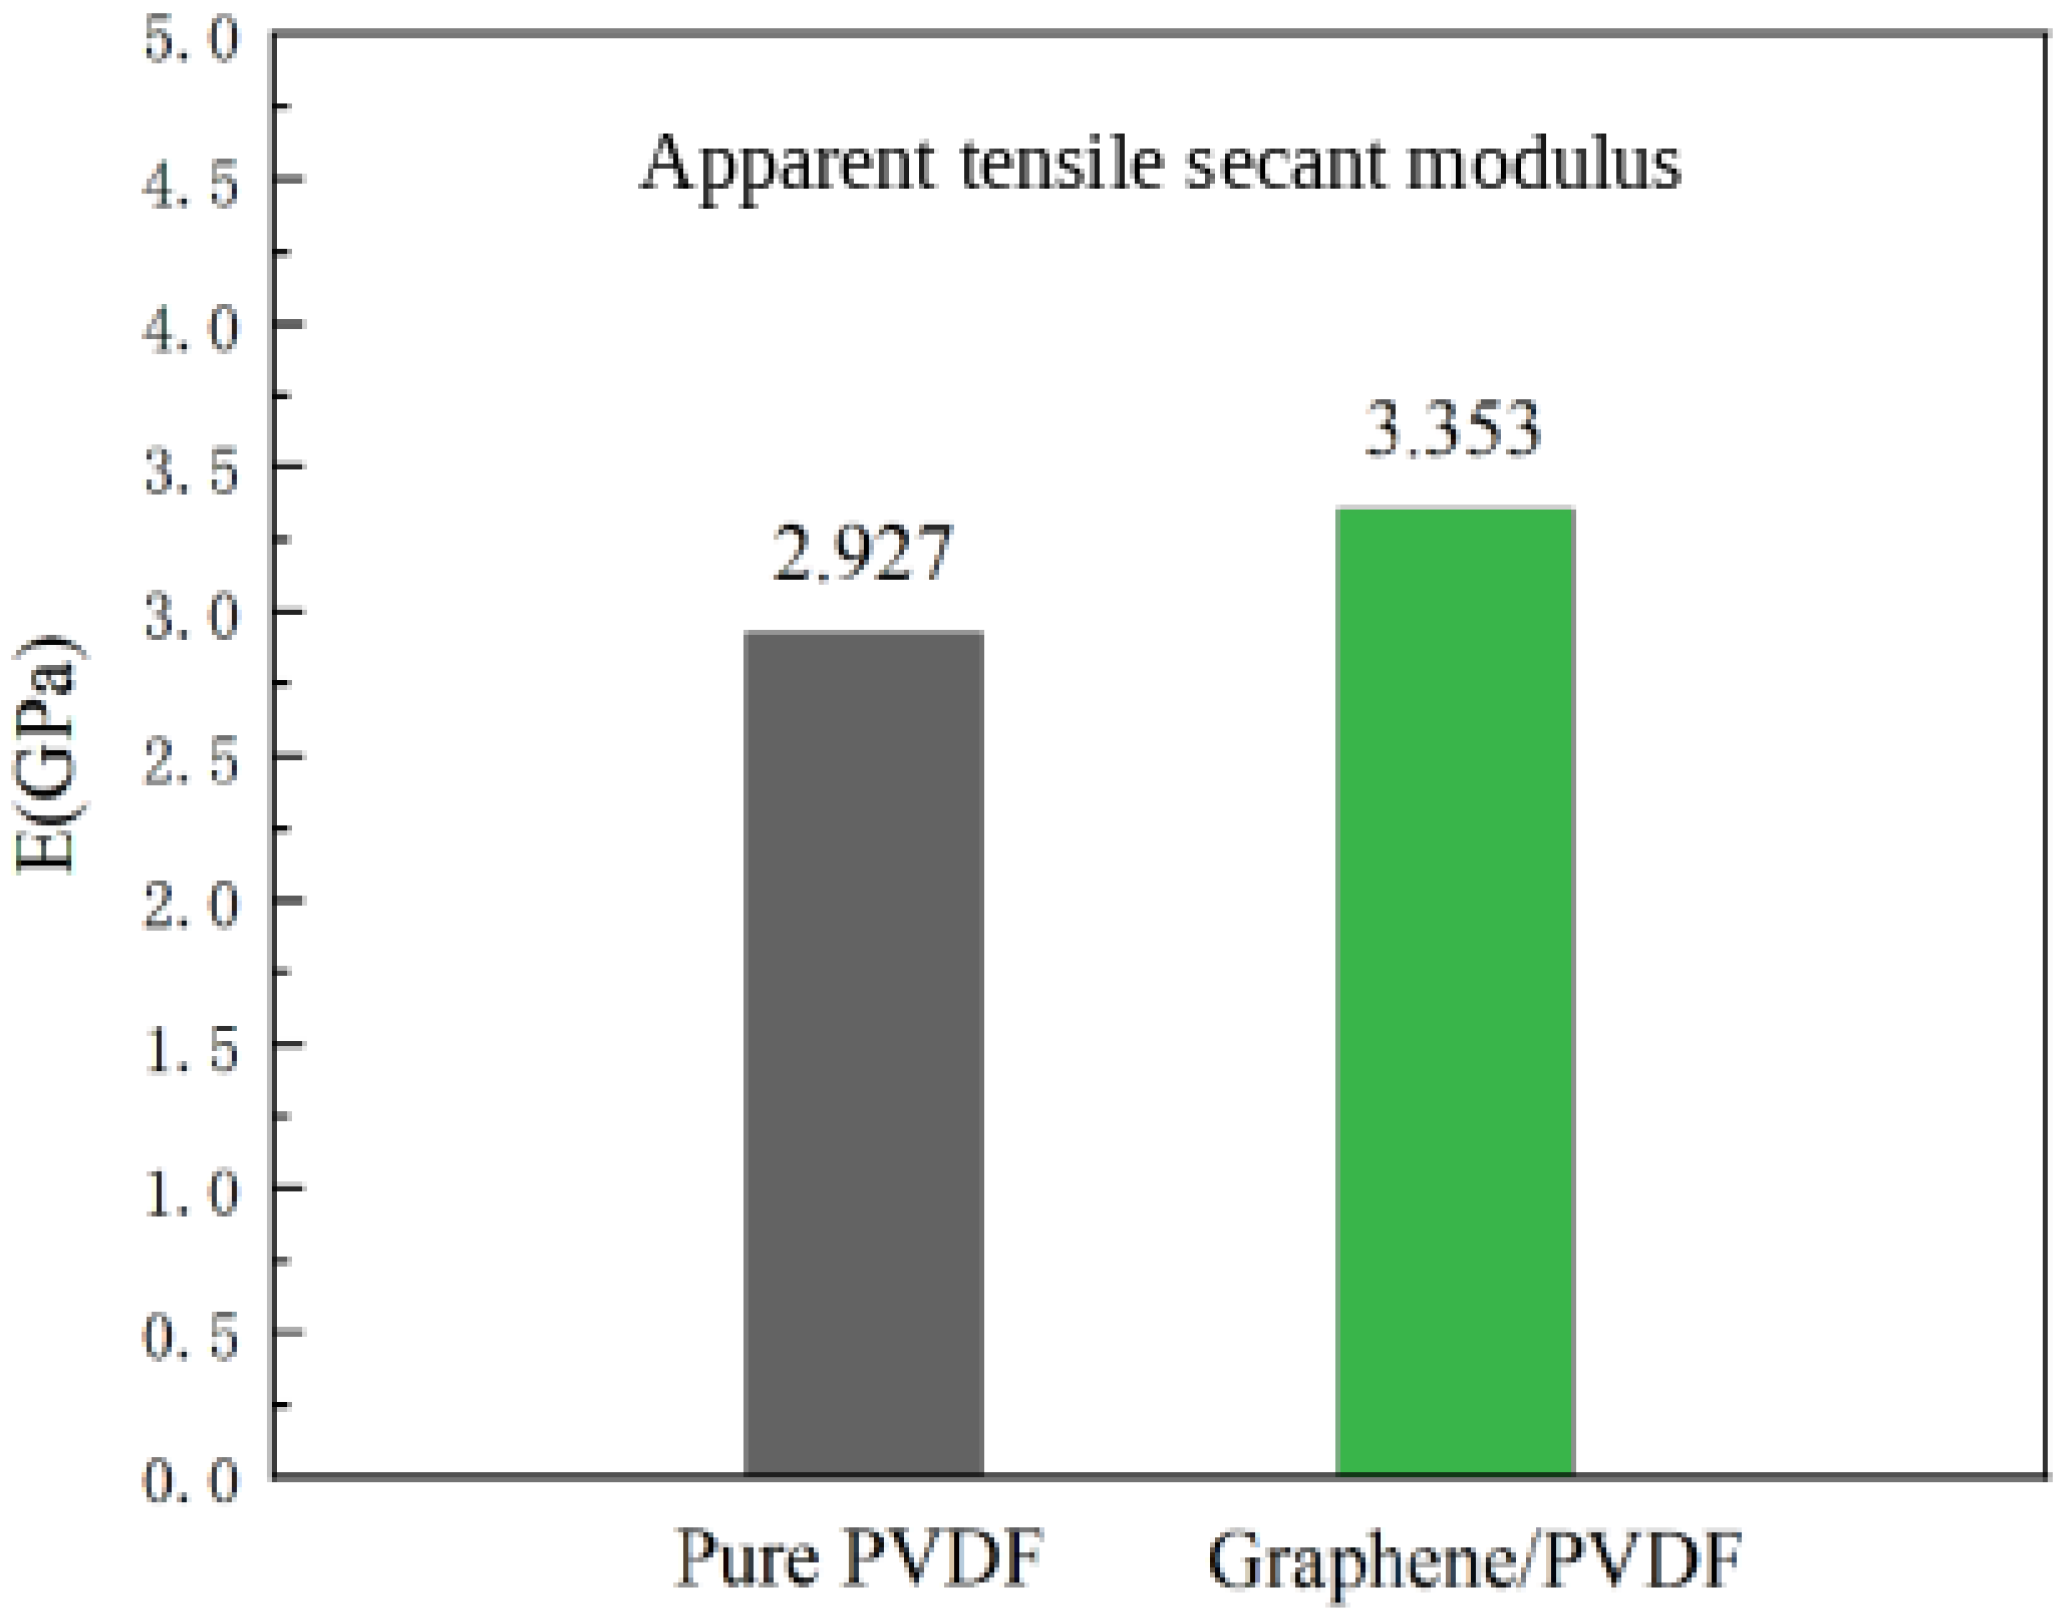
The reported mean run-level apparent tensile secant moduli were 2.9270 GPa for pristine PVDF and 3.3530 GPa for graphene/PVDF, corresponding to a descriptive difference of approximately 14.6% (Figure 7). These finite-interval summaries are subject to the endpoint-resolution limitation described in Section 2.2. For graphene/PVDF, the individual peak true stresses were 111.4527, 96.8164, and 159.1100 MPa; their mean and sample standard deviation were 122.4597 ± 32.5728 MPa (n = 3). The peak of the average stress–strain curve was 109.3834 MPa, which is distinct from the mean of the individual maxima. The sample standard deviation characterizes composite peak variability, not the uncertainty of the modulus difference between materials. The reported means therefore do not establish a statistically significant modulus increase, statistical equivalence, or an overall strengthening effect. Initial stiffness and peak resistance are evaluated separately, without assigning a between-system peak reduction from different estimators.
Figure 7.
Reported mean apparent tensile secant modulus of PVDF and graphene/PVDF mechanical models. Each bar denotes the arithmetic mean of three run-level secant estimates over 1–2% shifted true strain under full-cell stress normalization. The values are descriptive processed-curve summaries subject to the resolution limitation in Section 2.2; they do not represent a statistical-significance test. Composite peak stresses and their sample standard deviation are reported separately in Section 3.2.
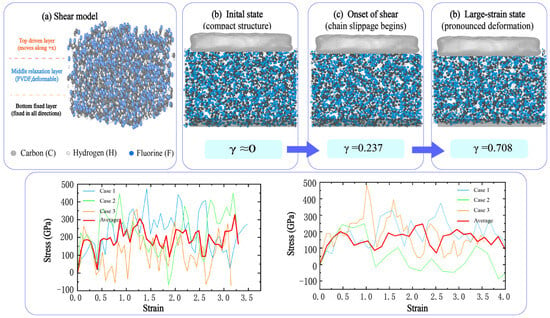
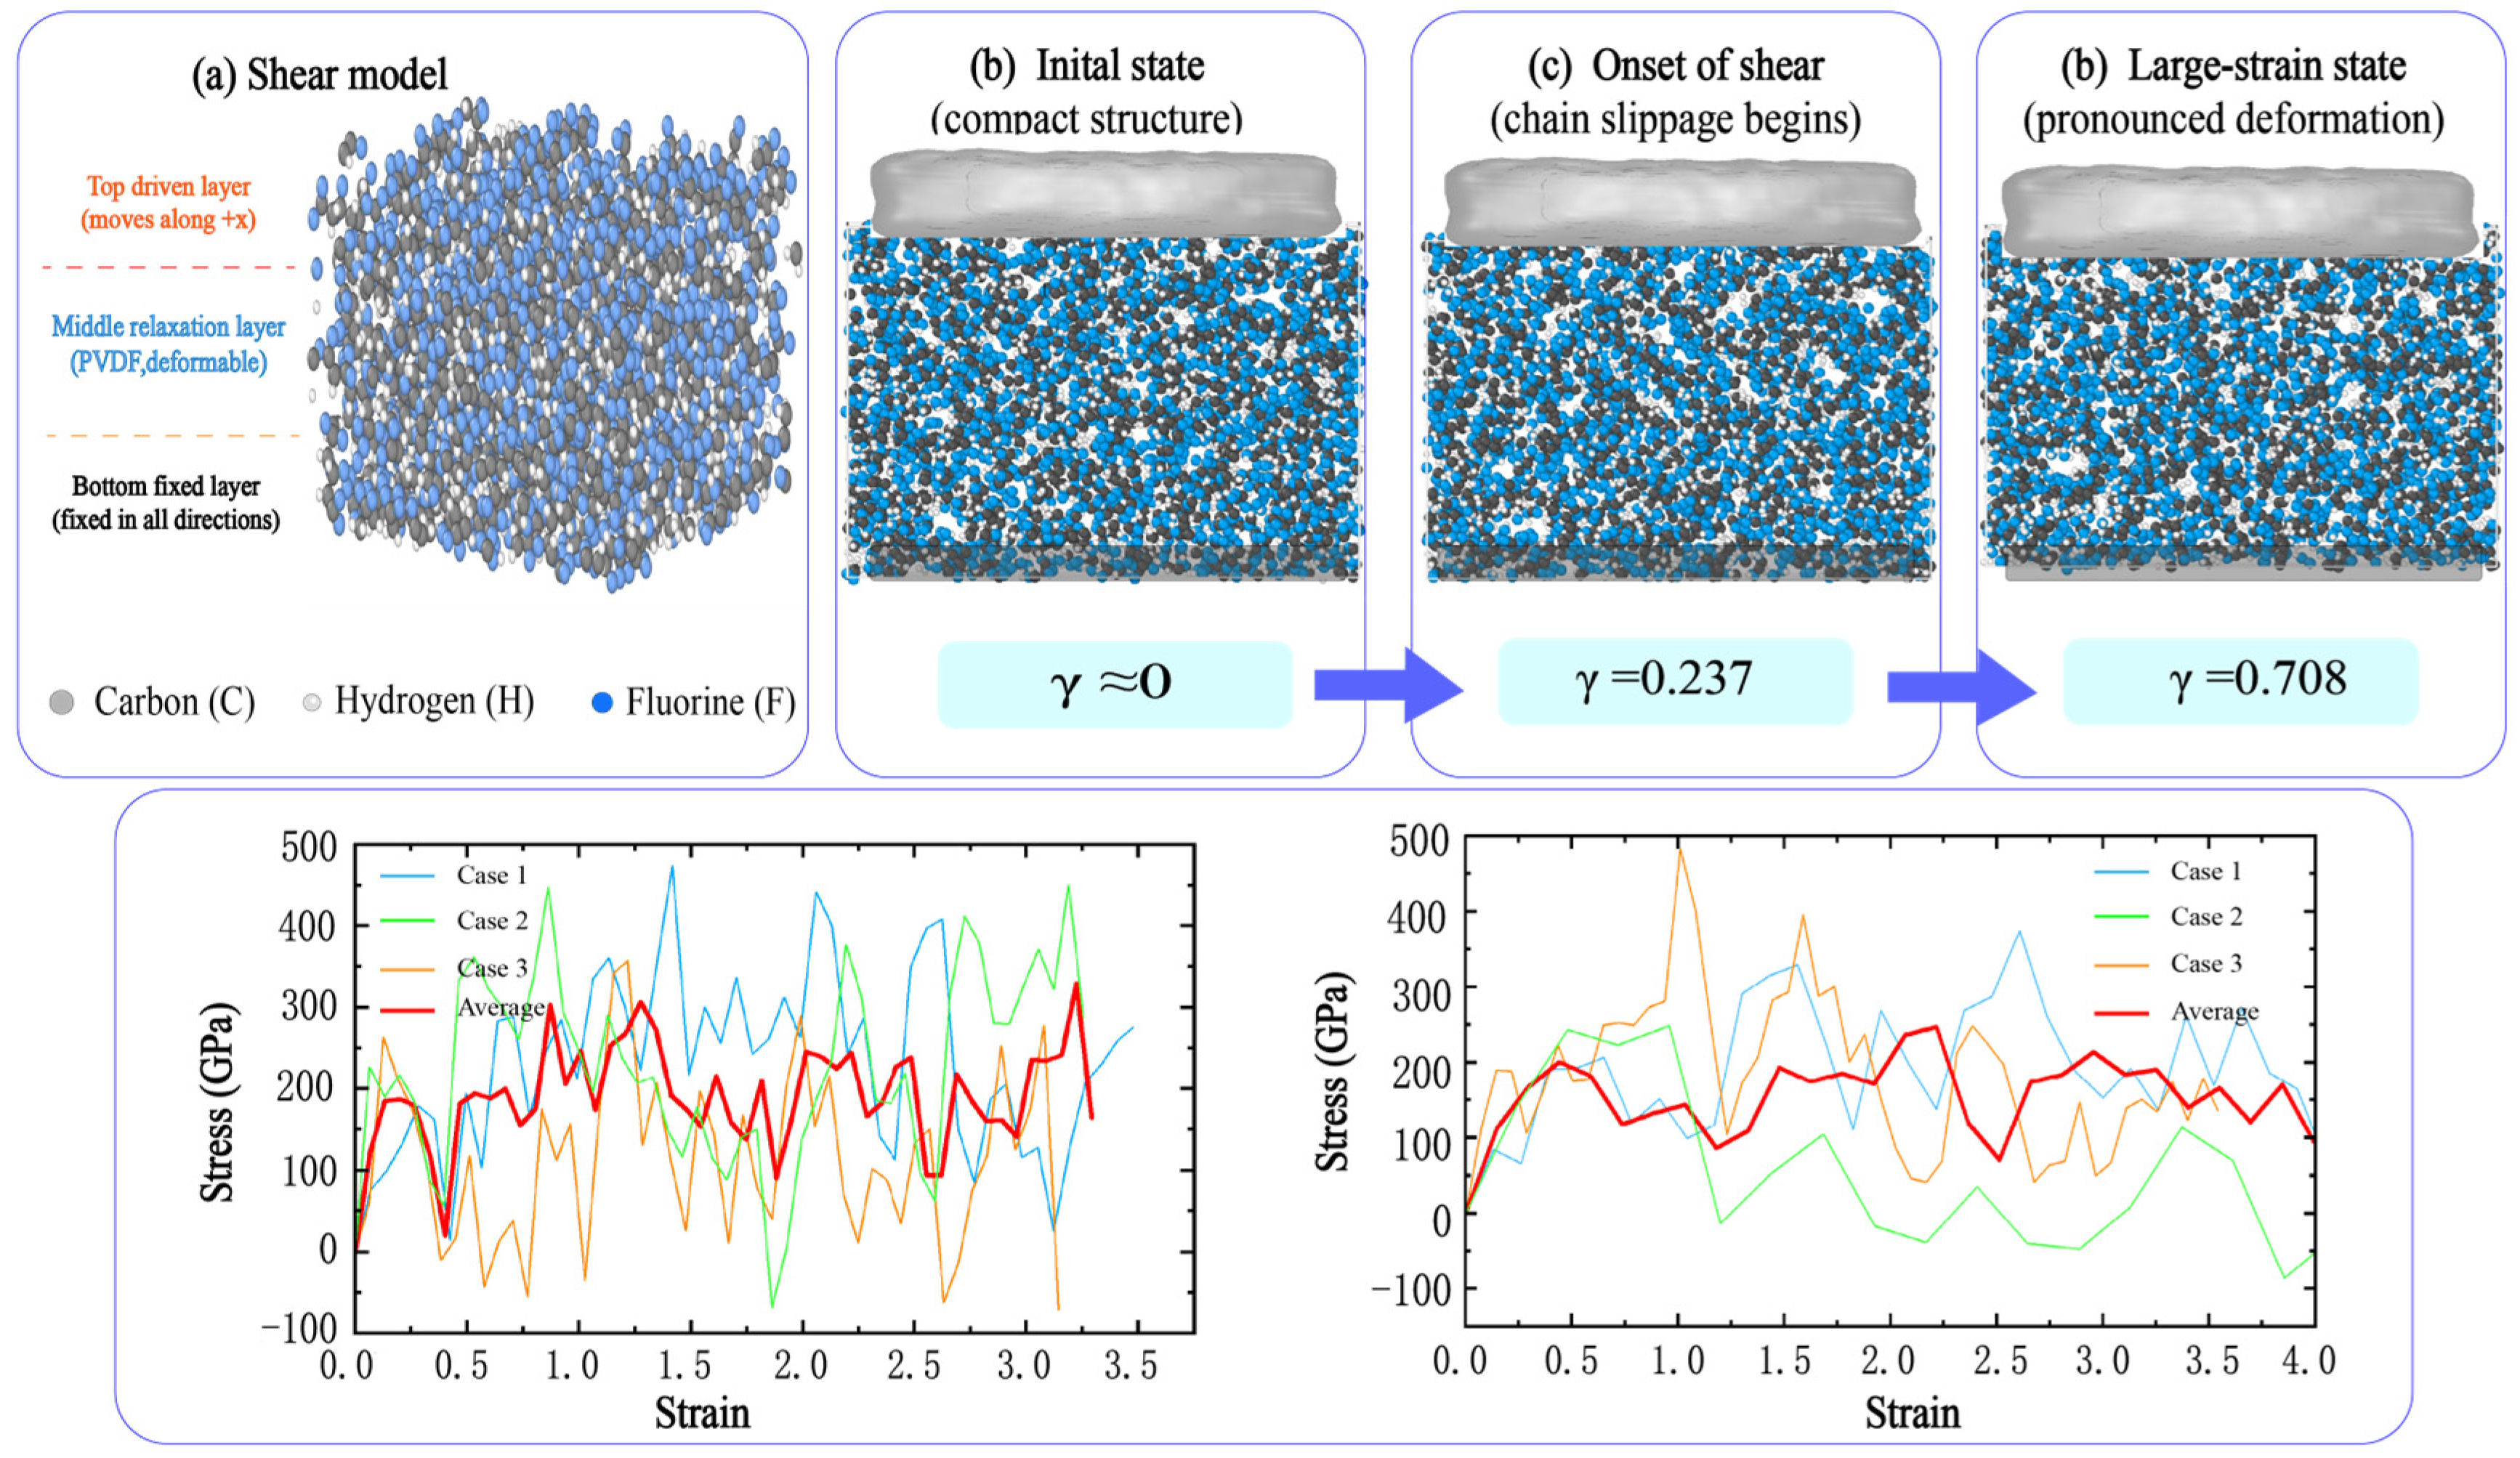
Figure 8 presents shear deformation and the associated responses. Top-surface molecules were integrated as a rigid body and the bottom region was elastically anchored. The primary shear stress is the interaction force between the driven top region and the remaining system, normalized by the xy area and baseline corrected; global Pxz is a separate diagnostic. Relative displacement uses the unwrapped top and bottom centers of mass, including motion of both regions and periodic crossings. Both mechanical systems use the same PVDF OPLS-AA coefficients. Their nonlinear stress–strain curves characterize loading-dependent deformation rather than a single linear shear modulus or generalized reinforcement.
Figure 8.
Shear deformation configurations and shear responses of PVDF and graphene/PVDF membrane models. The bottom region is elastically anchored; the relative-displacement definition includes any motion of that region. Representative configurations illustrate structural evolution during shear, and the curves characterize the response under the specified loading protocol.
Initial tensile stiffness, peak tensile resistance, and shear response describe different deformation regimes. At tensile-loading onset, 19.78 ± 1.81% of PVDF atoms contacted graphene, 116.3 ± 7.4 of 150 chains contained at least one contacting atom, and 11.0 ± 3.6 of 105 possible flake pairs had a minimum interatomic separation of 4.0 Å or less (mean ± sample standard deviation across three configurations). These measurements establish local contact and flake proximity, not uniform dispersion, adhesion energy, or interfacial strength. Constraints on chain rearrangement, relative slip, and load redistribution remain possible explanations for the mechanical response. Interfacial stress-transfer experiments [28] and oligomer-interface simulations [34] provide physical context but do not identify a unique mechanism in the present system. The structural and mechanical model families remain separate; projected coverage is not assigned as the cause of an individual mechanical response.
3.3. Relation to Published Studies and Model Scope
Published experimental studies place the present comparison in a material-specific context. Moradi et al. studied electrospun PVDF/graphene fibrous films [47]; Raji et al. compared graphene nanosheets and GO in melt-processed PVDF [48]; Wu et al. investigated the concentration dependence of nanographene/PVDF composite-film mechanics [49]; and Lee et al. examined drawn PVDF/GO fibers [50]. Differences in porosity, drawing, filler chemistry, and concentration make these distinct benchmarks, not interchangeable validation specimens. Their relevance is that filler incorporation can alter initial stiffness in a manner dependent on composition and structure. As a computational benchmark, the 400-monomer-per-chain PCFF model of Yang et al. at 300 K gave a density of 1.59 g cm−3 and a Young’s modulus of 5.6 ± 1.4 GPa [35].
Chain conformation provides a further distinction between models. Gauche/trans descriptors characterize local backbone states, whereas an experimental crystalline fraction also depends on intermolecular order and phase assignment. Yang et al. used several conformation descriptors rather than treating a trans-related indicator as a unique β-phase fraction [35]. Similarly, polarization switching in the PVDF/graphene models of Bystrov et al. [36] is a different observable from the apparent tensile response measured here. The models were assembled without prescribing a crystalline PVDF lattice; this construction choice is distinct from a quantitative determination of crystallinity or local order. The time scale of atomistic loading can limit chain rearrangement relative to a laboratory test. Polymer-glass simulations demonstrate that yielding and flow response can depend on temperature and strain rate [51]. Experimental separation or piezocatalytic results, including the recent PVDF/graphene study of Huang et al. [26], require explicit operating conditions and cannot be inferred from the present stiffness or projected-coverage trends.
4. Conclusions
Atomistic simulations were used to compare deposited geometry and mechanical response in pristine PVDF and graphene/PVDF short-chain membrane models. Increasing polymer-chain number produced thicker deposits with lower projected void-area fractions, whereas increasing lateral cell size at fixed polymer amount produced thinner deposits with greater uncovered area. Graphene-containing structures exhibited greater projected coverage under corresponding construction conditions. In the separately prepared DP = 5 mechanical models, the reported mean run-level 1–2% tensile secant modulus was approximately 14.6% higher for the composite; this descriptive comparison remains subject to the curve-resolution and sampling limitations. Its mean peak stress over three runs was 122.46 ± 32.57 MPa (mean ± sample standard deviation), whereas its average-curve peak was 109.38 MPa. Initial stiffness and peak response therefore require separate estimators and uncertainty statements. Contact statistics quantify polymer–graphene proximity at loading onset without establishing a unique load-transfer mechanism. The same PVDF parameters support the within-mechanical-family comparison. Both families use C54 flakes, while structural deposition differs in charge assignment, boundary conditions, and preparation protocol. These results do not establish chain length or rate independence, a causal specimen-level structure–mechanics relation, or quantitative water transport, selectivity, and antifouling performance.
Author Contributions
Conceptualization, J.R. and M.P.; methodology, J.R.; software, J.R. and M.P.; validation, J.R. and M.P.; formal analysis, J.R.; investigation, J.R.; resources, J.R. and M.P.; data curation, J.R.; writing—original draft preparation, J.R.; writing—review and editing, J.R. and M.P.; visualization, J.R. and M.P. All authors have read and agreed to the published version of the manuscript.
Funding
This research received no external funding.
Institutional Review Board Statement
Not applicable.
Informed Consent Statement
Not applicable.
Data Availability Statement
The data that support the findings of this study are available from the first author, Juan Ren, upon reasonable request.
Conflicts of Interest
The authors, Juan Ren and Mingliang Pang, are employees of PowerChina Chengdu Engineering Corporation Limited. The paper reflects the views of the scientists and not the company.
References
- Shannon, M.A.; Bohn, P.W.; Elimelech, M.; Georgiadis, J.G.; Mariñas, B.J.; Mayes, A.M. Science and technology for water purification in the coming decades. Nature 2008, 452, 301–310. [Google Scholar] [CrossRef] [Scilit] [PubMed]
- Elimelech, M.; Phillip, W.A. The future of seawater desalination: Energy, technology, and the environment. Science 2011, 333, 712–717. [Google Scholar] [CrossRef] [Scilit] [PubMed]
- Werber, J.R.; Osuji, C.O.; Elimelech, M. Materials for next-generation desalination and water purification membranes. Nat. Rev. Mater. 2016, 1, 16018, Erratum in Nat. Rev. Mater. 2016, 1, 16037. https://doi.org/10.1038/natrevmats.2016.37. [Google Scholar] [CrossRef] [Scilit]
- Lee, A.; Elam, J.W.; Darling, S.B. Membrane materials for water purification: Design, development, and application. Environ. Sci. Water Res. Technol. 2016, 2, 17–42. [Google Scholar] [CrossRef] [Scilit]
- Guo, W.; Ngo, H.-H.; Li, J. A mini-review on membrane fouling. Bioresour. Technol. 2012, 122, 27–34. [Google Scholar] [CrossRef] [Scilit] [PubMed]
- Le-Clech, P.; Chen, V.; Fane, T.A.G. Fouling in membrane bioreactors used in wastewater treatment. J. Membr. Sci. 2006, 284, 17–53. [Google Scholar] [CrossRef] [Scilit]
- Zularisam, A.W.; Ismail, A.F.; Salim, R. Behaviours of natural organic matter in membrane filtration for surface water treatment—A review. Desalination 2006, 194, 211–231. [Google Scholar] [CrossRef] [Scilit]
- Shi, X.; Tal, G.; Hankins, N.P.; Gitis, V. Fouling and cleaning of ultrafiltration membranes: A review. J. Water Process Eng. 2014, 1, 121–138. [Google Scholar] [CrossRef] [Scilit]
- Lalia, B.S.; Kochkodan, V.; Hashaikeh, R.; Hilal, N. A review on membrane fabrication: Structure, properties and performance relationship. Desalination 2013, 326, 77–95. [Google Scholar] [CrossRef] [Scilit]
- Liu, F.; Hashim, N.A.; Liu, Y.; Abed, M.R.M.; Li, K. Progress in the production and modification of PVDF membranes. J. Membr. Sci. 2011, 375, 1–27. [Google Scholar] [CrossRef] [Scilit]
- Kang, G.-D.; Cao, Y.-M. Application and modification of poly(vinylidene fluoride) (PVDF) membranes—A review. J. Membr. Sci. 2014, 463, 145–165. [Google Scholar] [CrossRef] [Scilit]
- Dreyer, D.R.; Park, S.; Bielawski, C.W.; Ruoff, R.S. The chemistry of graphene oxide. Chem. Soc. Rev. 2010, 39, 228–240. [Google Scholar] [CrossRef] [Scilit] [PubMed]
- Compton, O.C.; Nguyen, S.T. Graphene oxide, highly reduced graphene oxide, and graphene: Versatile building blocks for carbon-based materials. Small 2010, 6, 711–723. [Google Scholar] [CrossRef] [Scilit] [PubMed]
- Wang, Z.; Yu, H.; Xia, J.; Zhang, F.; Li, F.; Xia, Y.; Li, Y. Novel GO-blended PVDF ultrafiltration membranes. Desalination 2012, 299, 50–54. [Google Scholar] [CrossRef] [Scilit]
- Zhao, C.; Xu, X.; Chen, J.; Yang, F. Effect of graphene oxide concentration on the morphologies and antifouling properties of PVDF ultrafiltration membranes. J. Environ. Chem. Eng. 2013, 1, 349–354. [Google Scholar] [CrossRef] [Scilit]
- Xu, Z.; Zhang, J.; Shan, M.; Li, Y.; Li, B.; Niu, J.; Zhou, B.; Qian, X. Organosilane-functionalized graphene oxide for enhanced antifouling and mechanical properties of polyvinylidene fluoride ultrafiltration membranes. J. Membr. Sci. 2014, 458, 1–13. [Google Scholar] [CrossRef] [Scilit]
- Zhao, C.; Xu, X.; Chen, J.; Wang, G.; Yang, F. Highly effective antifouling performance of PVDF/graphene oxide composite membrane in membrane bioreactor (MBR) system. Desalination 2014, 340, 59–66. [Google Scholar] [CrossRef] [Scilit]
- Xia, S.; Ni, M. Preparation of poly(vinylidene fluoride) membranes with graphene oxide addition for natural organic matter removal. J. Membr. Sci. 2015, 473, 54–62. [Google Scholar] [CrossRef] [Scilit]
- Wu, T.; Zhou, B.; Zhu, T.; Shi, J.; Xu, Z.; Hu, C.; Wang, J. Facile and low-cost approach towards a PVDF ultrafiltration membrane with enhanced hydrophilicity and antifouling performance via graphene oxide/water-bath coagulation. RSC Adv. 2015, 5, 7880–7889. [Google Scholar] [CrossRef] [Scilit]
- Jang, W.; Yun, J.; Jeon, K.; Byun, H. PVdF/graphene oxide hybrid membranes via electrospinning for water treatment applications. RSC Adv. 2015, 5, 46711–46717. [Google Scholar] [CrossRef] [Scilit]
- Ma, C.; Hu, J.; Sun, W.; Ma, Z.; Yang, W.; Wang, L.; Ran, Z.; Zhao, B.; Zhang, Z.; Zhang, H. Graphene oxide-polyethylene glycol incorporated PVDF nanocomposite ultrafiltration membrane with enhanced hydrophilicity, permeability, and antifouling performance. Chemosphere 2020, 253, 126649. [Google Scholar] [CrossRef] [Scilit] [PubMed]
- Ayyaru, S.; Dinh, T.T.L.; Ahn, Y.-H. Enhanced antifouling performance of PVDF ultrafiltration membrane by blending zinc oxide with support of graphene oxide nanoparticle. Chemosphere 2020, 241, 125068. [Google Scholar] [CrossRef] [Scilit] [PubMed]
- Sun, X.; Shiraz, H.; Wong, R.; Zhang, J.; Liu, J.; Lu, J.; Meng, N. Enhancing the performance of PVDF/GO ultrafiltration membrane via improving the dispersion of GO with homogeniser. Membranes 2022, 12, 1268. [Google Scholar] [CrossRef] [Scilit] [PubMed]
- Jiang, Y.; Biswas, P.; Fortner, J.D. A review of recent developments in graphene-enabled membranes for water treatment. Environ. Sci. Water Res. Technol. 2016, 2, 915–922. [Google Scholar] [CrossRef] [Scilit]
- Alemdar, S.; Pekel Bayramgil, N. Preparation and characterization of oxygen-functionalized graphene-doped polyvinylidene fluoride ultrafiltration membranes. J. Appl. Polym. Sci. 2024, 141, e56105. [Google Scholar] [CrossRef] [Scilit]
- Huang, T.-H.; Espino, F.K.C.; Tian, X.-Y.; Widakdo, J.; Austria, H.F.M.; Setiawan, O.; Hung, W.-S.; Pamintuan, K.R.S.; Leron, R.B.; Chang, C.-Y.; et al. Piezocatalytic property of PVDF/Graphene self-assembling piezoelectric membrane for environmental remediation. Chem. Eng. J. 2024, 487, 150569. [Google Scholar] [CrossRef] [Scilit]
- Young, R.J.; Kinloch, I.A.; Gong, L.; Novoselov, K.S. The mechanics of graphene nanocomposites: A review. Compos. Sci. Technol. 2012, 72, 1459–1476. [Google Scholar] [CrossRef] [Scilit]
- Gong, L.; Kinloch, I.A.; Young, R.J.; Riaz, I.; Jalil, R.; Novoselov, K.S. Interfacial stress transfer in a graphene monolayer nanocomposite. Adv. Mater. 2010, 22, 2694–2697. [Google Scholar] [CrossRef] [Scilit] [PubMed]
- Bohlén, M.; Bolton, K. Molecular dynamics studies of the influence of single wall carbon nanotubes on the mechanical properties of Poly(vinylidene fluoride). Comput. Mater. Sci. 2013, 68, 73–80. [Google Scholar] [CrossRef] [Scilit]
- Ma, Y.; Chew, J.W. Investigation of membrane fouling phenomenon using molecular dynamics simulations: A review. J. Membr. Sci. 2022, 661, 120874. [Google Scholar] [CrossRef] [Scilit]
- Shaikh, A.R.; Karkhanechi, H.; Yoshioka, T.; Matsuyama, H.; Takaba, H.; Wang, D.-M. Adsorption of bovine serum albumin on poly(vinylidene fluoride) surfaces in the presence of ions: A molecular dynamics simulation. J. Phys. Chem. B 2018, 122, 1919–1928. [Google Scholar] [CrossRef] [Scilit] [PubMed]
- Tiwari, S.; Gogoi, A.; Anki Reddy, K. Effect of an ionic environment on membrane fouling: A molecular dynamics study. Phys. Chem. Chem. Phys. 2021, 23, 5001–5011. [Google Scholar] [CrossRef] [Scilit] [PubMed]
- Wang, M.; Wang, J.; Jiang, J. Membrane fouling: Microscopic insights into the effects of surface chemistry and roughness. Adv. Theory Simul. 2022, 5, 2100395. [Google Scholar] [CrossRef] [Scilit]
- Güryel, S.; Walker, M.; Geerlings, P.; De Proft, F.; Wilson, M.R. Molecular dynamics simulations of the structure and the morphology of graphene/polymer nanocomposites. Phys. Chem. Chem. Phys. 2017, 19, 12959–12969. [Google Scholar] [CrossRef] [Scilit] [PubMed]
- Yang, J.; Yao, X.; Meng, Z. Investigation of molecular mechanisms of polyvinylidene fluoride under the effects of temperature, electric poling, and mechanical stretching using molecular dynamics simulations. Polymer 2022, 245, 124691. [Google Scholar] [CrossRef] [Scilit] [PubMed]
- Bystrov, V.; Paramonova, E.; Meng, X.; Shen, H.; Wang, J.; Lin, T.; Fridkin, V. Ferroelectric thin films and composites based on polyvinylidene fluoride and graphene layers: Molecular dynamics study. Coatings 2024, 14, 356. [Google Scholar] [CrossRef] [Scilit]
- Bondi, A. van der Waals volumes and radii. J. Phys. Chem. 1964, 68, 441–451. [Google Scholar] [CrossRef] [Scilit]
- Thompson, A.P.; Aktulga, H.M.; Berger, R.; Bolintineanu, D.S.; Brown, W.M.; Crozier, P.S.; in ’t Veld, P.J.; Kohlmeyer, A.; Moore, S.G.; Nguyen, T.D.; et al. LAMMPS—A flexible simulation tool for particle-based materials modeling at the atomic, meso, and continuum scales. Comput. Phys. Commun. 2022, 271, 108171. [Google Scholar] [CrossRef] [Scilit]
- Jorgensen, W.L.; Maxwell, D.S.; Tirado-Rives, J. Development and testing of the OPLS all-atom force field on conformational energetics and properties of organic liquids. J. Am. Chem. Soc. 1996, 118, 11225–11236. [Google Scholar] [CrossRef] [Scilit]
- Watkins, E.K.; Jorgensen, W.L. Perfluoroalkanes: Conformational Analysis and Liquid-State Properties from ab Initio and Monte Carlo Calculations. J. Phys. Chem. A 2001, 105, 4118–4125. [Google Scholar] [CrossRef] [Scilit]
- Pádua, A.A.H. Torsion Energy Profiles and Force Fields Derived from Ab Initio Calculations for Simulations of Hydrocarbon–Fluorocarbon Diblocks and Perfluoroalkylbromides. J. Phys. Chem. A 2002, 106, 10116–10123. [Google Scholar] [CrossRef] [Scilit]
- Byutner, O.G.; Smith, G.D. Quantum Chemistry Based Force Field for Simulations of Poly(vinylidene fluoride). Macromolecules 2000, 33, 4264–4270. [Google Scholar] [CrossRef] [Scilit]
- Stukowski, A. Visualization and analysis of atomistic simulation data with OVITO—The Open Visualization Tool. Model. Simul. Mater. Sci. Eng. 2010, 18, 015012. [Google Scholar] [CrossRef] [Scilit]
- Flyvbjerg, H.; Petersen, H.G. Error estimates on averages of correlated data. J. Chem. Phys. 1989, 91, 461–466. [Google Scholar] [CrossRef] [Scilit]
- Willems, T.F.; Rycroft, C.H.; Kazi, M.; Meza, J.C.; Haranczyk, M. Algorithms and tools for high-throughput geometry-based analysis of crystalline porous materials. Microporous Mesoporous Mater. 2012, 149, 134–141. [Google Scholar] [CrossRef] [Scilit]
- Pinheiro, M.; Martin, R.L.; Rycroft, C.H.; Haranczyk, M. High accuracy geometric analysis of crystalline porous materials. CrystEngComm 2013, 15, 7531–7538. [Google Scholar] [CrossRef] [Scilit]
- Moradi, R.; Karimi-Sabet, J.; Shariaty-Niassar, M.; Koochaki, M.A. Preparation and characterization of polyvinylidene fluoride/graphene superhydrophobic fibrous films. Polymers 2015, 7, 1444–1463. [Google Scholar] [CrossRef] [Scilit]
- Raji, M.; Essabir, H.; Rodrigue, D.; Bouhfid, R.; Qaiss, A.E.K. Influence of graphene oxide and graphene nanosheet on the properties of polyvinylidene fluoride nanocomposites. Polym. Compos. 2018, 39, 2932–2941. [Google Scholar] [CrossRef] [Scilit]
- Wu, Q.; Xie, D.-J.; Zhang, Y.-D.; Jia, Z.-M.; Zhang, H.-Z. Mechanical properties and simulation of nanographene/polyvinylidene fluoride composite films. Compos. Part B Eng. 2019, 156, 148–155. [Google Scholar] [CrossRef] [Scilit]
- Lee, J.-E.; Eom, Y.; Shin, Y.-E.; Hwang, S.-H.; Ko, H.; Chae, H.G. Effect of interfacial interaction on the conformational variation of poly(vinylidene fluoride) (PVDF) chains in PVDF/graphene oxide (GO) nanocomposite fibers and corresponding mechanical properties. ACS Appl. Mater. Interfaces 2019, 11, 13665–13675. [Google Scholar] [CrossRef] [Scilit] [PubMed]
- Rottler, J.; Robbins, M.O. Shear yielding of amorphous glassy solids: Effect of temperature and strain rate. Phys. Rev. E 2003, 68, 011507. [Google Scholar] [CrossRef] [Scilit] [PubMed]
Disclaimer/Publisher’s Note: The statements, opinions and data contained in all publications are solely those of the individual author(s) and contributor(s) and not of MDPI and/or the editor(s). MDPI and/or the editor(s) disclaim responsibility for any injury to people or property resulting from any ideas, methods, instructions or products referred to in the content. |
© 2026 by the authors. Licensee MDPI, Basel, Switzerland. This article is an open access article distributed under the terms and conditions of the Creative Commons Attribution (CC BY) license.