


Abstract
Wastewater treatment plants (WWTPs) are being reconceived as biorefineries that recover water, nutrients and energy, and membrane processes are central to this transition. This critical review examines how artificial intelligence (AI), and in particular, its data-driven subset machine learning (ML), is applied across membrane-integrated wastewater biorefineries: aeration control, membrane bioreactor fouling prediction, membrane-based nutrient recovery (membrane contactors, forward osmosis, electrodialysis, membrane distillation), struvite crystallisation, biohydrogen production by dark fermentation and microbial electrolysis, thermochemical sludge conversion, and hydrogen purification by gas-separation membranes. Reported model accuracies are high (coefficients of determination, R2, above 0.9 for several resource-recovery tasks), but they measure model fit rather than reactor performance and were obtained mostly on small laboratory or literature-compiled datasets (municipal, industrial, mixed or synthetic wastewaters and other organic feedstocks) with heterogeneous validation schemes and are, therefore, not directly comparable. Documented full-scale evidence is concentrated in aeration control (19.8% lower total operating cost than fuzzy-logic (knowledge-based AI) control at one plant; 26–30% lower aeration energy in a vendor-reported case) and membrane fouling forecasting. Validation practice, cross-plant transferability, the gap between explainable-AI attribution and mechanistic understanding, and the scarcity of techno-economic evidence are identified as the main barriers. A research agenda based on hybrid mechanistic–ML models, federated learning and a proposed plant-wide “resource ledger” is outlined for pilot-scale validation.
1. Introduction
The global water–energy–nutrient nexus is under unprecedented strain. Municipal and industrial wastewater treatment plants (WWTPs) are energy-intensive—domestic wastewater treatment alone has been estimated to use about 3% of the electrical energy load of the United States [1]—while discharging nitrogen, phosphorus and organic carbon that could otherwise be recovered as fertiliser, biogas or biohydrogen [2,3]. The conventional “treat-and-discharge” paradigm is increasingly being replaced by the wastewater biorefinery concept, in which the WWTP is reconceived as a multi-output facility that produces reclaimed water, recovered nutrients, biofuels and bioplastics alongside its core sanitation function [2,3]. Membrane processes—membrane bioreactors (MBRs), anaerobic MBRs (AnMBRs) and membrane-based nutrient and gas separation—are key enabling technologies for this transition, because they deliver reuse-grade water and concentrate the streams from which resources are recovered [4,5].
In this review, artificial intelligence (AI) is used as the umbrella term for computational systems that perform tasks normally requiring human reasoning, including rule-based and fuzzy-logic systems, metaheuristic optimisers and learning algorithms, whereas machine learning (ML) refers specifically to the subset of AI in which models learn input–output relationships from data (e.g., artificial neural networks, ANNs; support vector machine, SVM; random forest, RF; extreme gradient boosting, XGBoost; long short-term memory networks, LSTMs); deep learning (DL) denotes multilayer neural-network ML models. The terms are used consistently in this sense throughout. Accordingly, rule-based and fuzzy-logic controllers are treated as knowledge-based (non-learning) forms of AI, not as non-AI control. Where AI-based operation is compared with “conventional” operation, “conventional” denotes proportional–integral–derivative (PID) loops, fixed set-points and fixed schedules; comparisons between data-driven ML and fuzzy-logic control are identified explicitly as comparisons between two forms of AI. AI has rapidly become an operational backbone of the biorefinery transition. Diverse architectures, including ANN, SVM, decision tree (DT), RF, XGBoost, LSTM and adaptive neuro-fuzzy inference systems (ANFISs), have demonstrated strong predictive performance across water-quality monitoring, process optimisation, fault diagnosis, membrane fouling prediction and resource-recovery modelling [6,7,8]. Reviews compiling pollutant-removal prediction studies report R2 values from 0.64 to 1.00 [9,10], although these values derive from different datasets and validation schemes (Section 6.1), and recent primary studies [11,12] and reviews [13] document AI’s growing role in biohydrogen production from wastewater streams.
Several recent reviews have addressed parts of this field: AI for wastewater treatment in general [7,8,9,14,15], AI-based membrane fouling prediction [16,17,18] and AI for biohydrogen [13]. Alvi et al. [7] critically appraise deep learning for treatment-process modelling; Sun et al. [9] and Zamfir et al. [15] survey treatment-performance prediction and process optimisation; Niu et al. [16], Abuwatfa et al. [17] and Shi et al. [18] focus on fouling prediction in individual membrane processes; and Muthukumar et al. [13] focus on bio-hydrogen. These reviews treat each unit operation largely in isolation; none examines how AI models for aeration, membrane separation, nutrient recovery and hydrogen production interact within one plant or how membrane units link these resource streams. This review addresses that gap. It is structured to (1) map the AI methods landscape across the biorefinery value chain, with emphasis on membrane-based processes; (2) critically evaluate reported performance while making wastewater type, scale, dataset size and validation scheme explicit; (3) present conceptual schematic designs of AI-integrated WWTP layouts; and (4) interrogate the translational, techno-economic and governance barriers that remain unresolved.
2. Review Methodology
This article is a critical (narrative) review rather than a systematic review and does not follow the full PRISMA protocol. To make the selection of the literature transparent and reproducible, the procedure was, nevertheless, structured as follows.
Sources and period: Peer-reviewed journal articles, review articles and book chapters published between January 2016 and 9 October 2026 (the date of the final search) were retrieved from the publisher full-text platforms ScienceDirect (Elsevier), SpringerLink and Nature Portfolio (Springer Nature), MDPI, Wiley Online Library, ACS Publications and IWA Publishing. These platforms host Scopus-indexed journals but are not bibliographic databases in the sense of Scopus or Web of Science; the absence of a single bibliographic database is acknowledged as a limitation of coverage. Vendor case studies (grey literature) were consulted only to document full-scale deployments and are identified as such wherever they are cited.
Search strategy: The search string combined an AI block and an application block: (“artificial intelligence” OR “machine learning” OR “deep learning” OR “neural network”) AND (“wastewater” OR “sewage” OR “sludge”) AND (“resource recovery” OR “struvite” OR “biohydrogen” OR “dark fermentation” OR “microbial electrolysis cell” OR “membrane fouling” OR “membrane bioreactor” OR “digital twin”). To capture membrane-based recovery, hydrogen purification and thermochemical routes, the application block also included “membrane contactor”, “forward osmosis”, “electrodialysis”, “membrane distillation”, “gas separation membrane”, “hydrothermal liquefaction”, “pyrolysis”, “gasification”, “federated learning” and “hybrid model”.
Inclusion and exclusion criteria: Studies were included if they (i) were peer-reviewed and written in English; (ii) applied AI/ML to wastewater, sewage sludge or a wastewater-derived stream within the biorefinery framework or to a process directly applicable to such streams (e.g., gas-separation membranes, thermochemical conversion); and (iii) reported a quantitative performance measure (R2; root-mean-square error, RMSE; mean absolute error, MAE; mean absolute percentage error, MAPE; classification accuracy; or percentage change in energy, cost or emissions). Studies without quantitative evaluation, conference abstracts and duplicate reports of the same dataset were excluded. Review articles and methodological papers (e.g., on validation, explainability or federated learning) were retained for context but were not used as sources of quantitative performance values wherever the original study could be identified; where a value is available only from a review, it is labelled “review-reported”.
Screening and data extraction: Titles and abstracts were screened first, followed by full texts. For every primary study cited for a quantitative claim, the wastewater or feed type, scale (laboratory, pilot or full scale), dataset size, input variables, AI model, validation scheme and reported metric were extracted; these data are summarised in the comparative tables of Section 4.4 and Section 5, which also compare conventional (non-AI), knowledge-based AI (rule-based and fuzzy-logic) and data-driven (ML-based) control from a techno-economic perspective. Because the publisher platforms return relevance-ranked results that overlap strongly, record counts at the identification and title/abstract stages were not logged in a form that can be reported reliably; the selection is, therefore, documented at the level of included sources. Full texts were excluded when they reported no quantitative performance measure, did not apply to wastewater-derived streams, or duplicated a dataset already included. For every primary study summarised in Section 4.4, dataset size, input variables and validation scheme were extracted from the original publication rather than from secondary reviews; where an item is not stated in the source, this is indicated. Where the full text could not be accessed and an item is not reported in the published abstract, the entry is marked “not reported (abstract only)” rather than inferred. Two terms are kept distinct throughout: model validation denotes the assessment of a model’s predictive accuracy on data not used for its training (hold-out, cross-validation, chronological or independent test sets), whereas experimental verification denotes a separate laboratory or plant experiment run at a model-predicted optimum to confirm that the predicted performance is actually achieved. A model may be well validated while its predicted optimum remains unverified, and an experimentally verified optimum does not by itself establish the model’s accuracy outside the tested conditions. In total, 69 sources are cited, comprising 33 primary research studies (21 of which report quantitative AI performance and are summarised in Section 4.4), 27 review or perspective articles and 9 methodological papers, books or grey-literature reports.
3. The AI Methods Landscape in Wastewater Biorefineries
3.1. Process Monitoring, Control and Fault Diagnosis
ANN-based models remain the dominant architecture for predicting effluent quality parameters, including chemical oxygen demand (COD), biochemical oxygen demand (BOD), total suspended solids (TSS), pH and turbidity. A recent review compiled reported R2 values ranging from 0.64 to 1.00 across diverse plant configurations [9]. Because the underlying studies differ in plant type (municipal or industrial), dataset size, prediction horizon and validation scheme (random hold-out, cross-validation or chronological test sets), this range indicates the attainable fit rather than a comparable level of performance [19,20]. Beyond prediction, AI is increasingly used for closed-loop control. Aeration is typically the largest single energy consumer in activated-sludge plants [21], which explains why the most mature full-scale AI deployments target this unit. At a full-scale urban (municipal) WWTP, a multimodal ML framework that combined 16 SCADA variables with images of the aeration-tank surface (8832 samples at 15 min intervals over 92 days at a modified A2O plant in Shandong, China) predicted aeration demand with R2 = 0.948 (MAPE 4.4%) on a held-out test set and, when applied to aeration control, reduced total operating costs by 19.8% compared with the plant’s fuzzy-logic controller [6]. Because fuzzy logic is itself a knowledge-based form of AI (Section 1), this result compares data-driven ML with rule-based AI control rather than AI with non-AI control, and the 19.8% refers to total operating cost, not to aeration energy alone. For greenhouse gas (GHG) emissions, deep-learning models trained on 746,760 measurements recorded at 5 min intervals over about 14 months at the full-scale Avedøre WWTP (Denmark) described nitrous oxide (N2O) emissions from influent flow, airflow, temperature, ammonium, nitrate and dissolved oxygen (DNN test R2 = 0.81–0.87) and forecast them one day ahead with an LSTM (R2 ≈ 0.94) [22]. This is a forecasting result; emission reductions achieved by AI-guided control have not been quantified in the primary studies screened for this review, and AI-driven strategies for emission mitigation are reviewed more broadly by Zhang et al. [23]. At full scale, a vendor case study from the municipal Cuxhaven WWTP (Germany) reports 26–30% lower aeration energy after deployment of an AI system that predicts aerator set-points from the plant’s existing supervisory control and data acquisition (SCADA) data [24]; the integration of such IoT-based AI systems with biological treatment is reviewed in [25]; as grey literature, this result has not been peer reviewed. Further ML-based aeration studies are compiled by Zamfir et al. [15]. ML-enhanced SCADA has also been tested for five-day-ahead BOD5 forecasting and organic-load control of a laboratory-scale (11 L) aerobic granular sludge reactor fed with synthetic wastewater (N-BEATS, R2 = 0.901 on an 80/20 train–test split) [26]; this is a laboratory demonstration rather than a full-scale deployment.
Relevance to membrane-integrated plants: In MBR-based biorefineries, the air supply that AI aeration controllers manipulate serves two purposes: biological (process) aeration in the bioreactor and coarse-bubble air scouring of the membranes, which together account for a large share of MBR energy demand [27]. Aeration models (this section) and fouling models (Section 3.2) therefore act on the same blowers and should be co-optimised: lowering biological aeration saves energy but changes the sludge properties that drive fouling, whereas lowering scouring air saves energy at the cost of a faster rise in TMP. Effluent-quality predictors developed for conventional activated-sludge plants are transferable to MBRs only if they include permeate-specific targets and membrane operating variables (flux, TMP and cleaning events). Few of the AI aeration studies reviewed here state whether the plant used membrane separation, which limits their direct transfer to membrane-integrated biorefineries.
3.2. Membrane Fouling Prediction, Cleaning and Digital Twins
MBRs and AnMBRs are central to compact biorefinery configurations because they produce reuse-quality permeate and retain slow-growing biomass, but fouling increases the energy demand for air scouring and requires periodic chemical cleaning [16,18]. ML fouling models are typically trained to predict transmembrane pressure (TMP), permeability or flux decline from operating variables (flux, mixed-liquor suspended solids, temperature, aeration intensity and influent quality) and are used for early warning and for scheduling relaxation, backwashing and chemical cleaning [16,17].
At a full-scale municipal MBR, Kovacs et al. [28] compared RF, ANN and LSTM models trained on four years of high-resolution operating data to predict TMP at different stages of the production cycle, quantified the prediction uncertainty, and found RF to be the most accurate. Zhu et al. [29] developed an ML application (MBR-Net) trained on denoised operating data from a full-scale submerged-MBR plant and reported one-day-ahead forecasts of irreversible fouling (permeability) under different fluxes, cleaning and feed-water conditions, with MAPE below 6.45%, MAE below 3.71 LMH bar−1 and R2 above 0.87 on two independent test sets. For anaerobic systems, Cámara Nebreda et al. [30] combined static feed-forward and dynamic LSTM networks for a pilot-scale anaerobic filter MBR treating slaughterhouse wastewater using filtration and backwash times and fluxes as inputs, and extended the fouling forecast horizon from 25 to 75 filtration cycles, provided the networks were retrained every 25 cycles—an illustration that fouling models degrade as operating conditions change. The contrast between fit and forecast is instructive: the modelling networks reproduced membrane resistance and TMP with R2 = 0.93–0.99 on a random data split, whereas the 75-cycle sliding-window forecast of membrane resistance reached only R2 = 0.56. ANFIS has also been used to forecast TMP in an AnMBR–sequencing batch reactor system during biohydrogen production [31] (Section 4.1).
These fouling predictors are the building blocks of membrane “digital twins”, in which a virtual plant model is continuously updated from sensor data to anticipate maintenance needs and optimise cleaning schedules and the trade-off between scouring energy, cleaning-chemical use and membrane life [2,32]. A limitation shared by most published fouling models is that they are trained and tested at a single plant or on a single membrane module type; cross-plant validation is rarely reported [16].
3.3. AI for Membrane-Based Nutrient Recovery and Hydrogen Purification
Beyond MBRs, several membrane processes recover resources directly from wastewater streams [4]: (i) hollow-fibre membrane contactors (gas-permeable or liquid–liquid) strip free ammonia from digestate or reject water into an acid to produce ammonium salts [33]; (ii) forward osmosis (FO) concentrates nutrients and organics at low hydraulic pressure, often as a pre-concentration step before anaerobic treatment or struvite recovery [5]; (iii) electrodialysis (ED) concentrates ammonium, potassium and phosphate into fertiliser-grade streams and has been operated at pilot scale on wastewater [34]; and (iv) membrane distillation (MD) recovers ammonia or water from warm, high-strength streams and can use low-grade heat available from digesters or thermochemical units [4].
AI applications in these processes are far less developed than for MBR fouling. Ammonia recovery in a liquid–liquid membrane contactor has recently been predicted with a resistance-in-series mass-transfer model calibrated on experiments [35], but data-driven (ML) models of membrane contactors operating on real wastewater were not found in the literature screened for this review; ML models of permeate flux and fouling exist for FO and MD, mainly under desalination conditions [16]. For ED, scaling during nutrient recovery from digester reject water has, so far, been predicted with mechanistic precipitation models rather than ML [36], which makes ED a clear candidate for hybrid mechanistic–ML modelling (Section 7.2). AI-supported operation of these processes on real wastewater—for example, adjusting contactor pH and flow, FO draw concentration or ED current density in response to influent variability—remains largely unreported and represents an opportunity specific to membrane-integrated biorefineries.
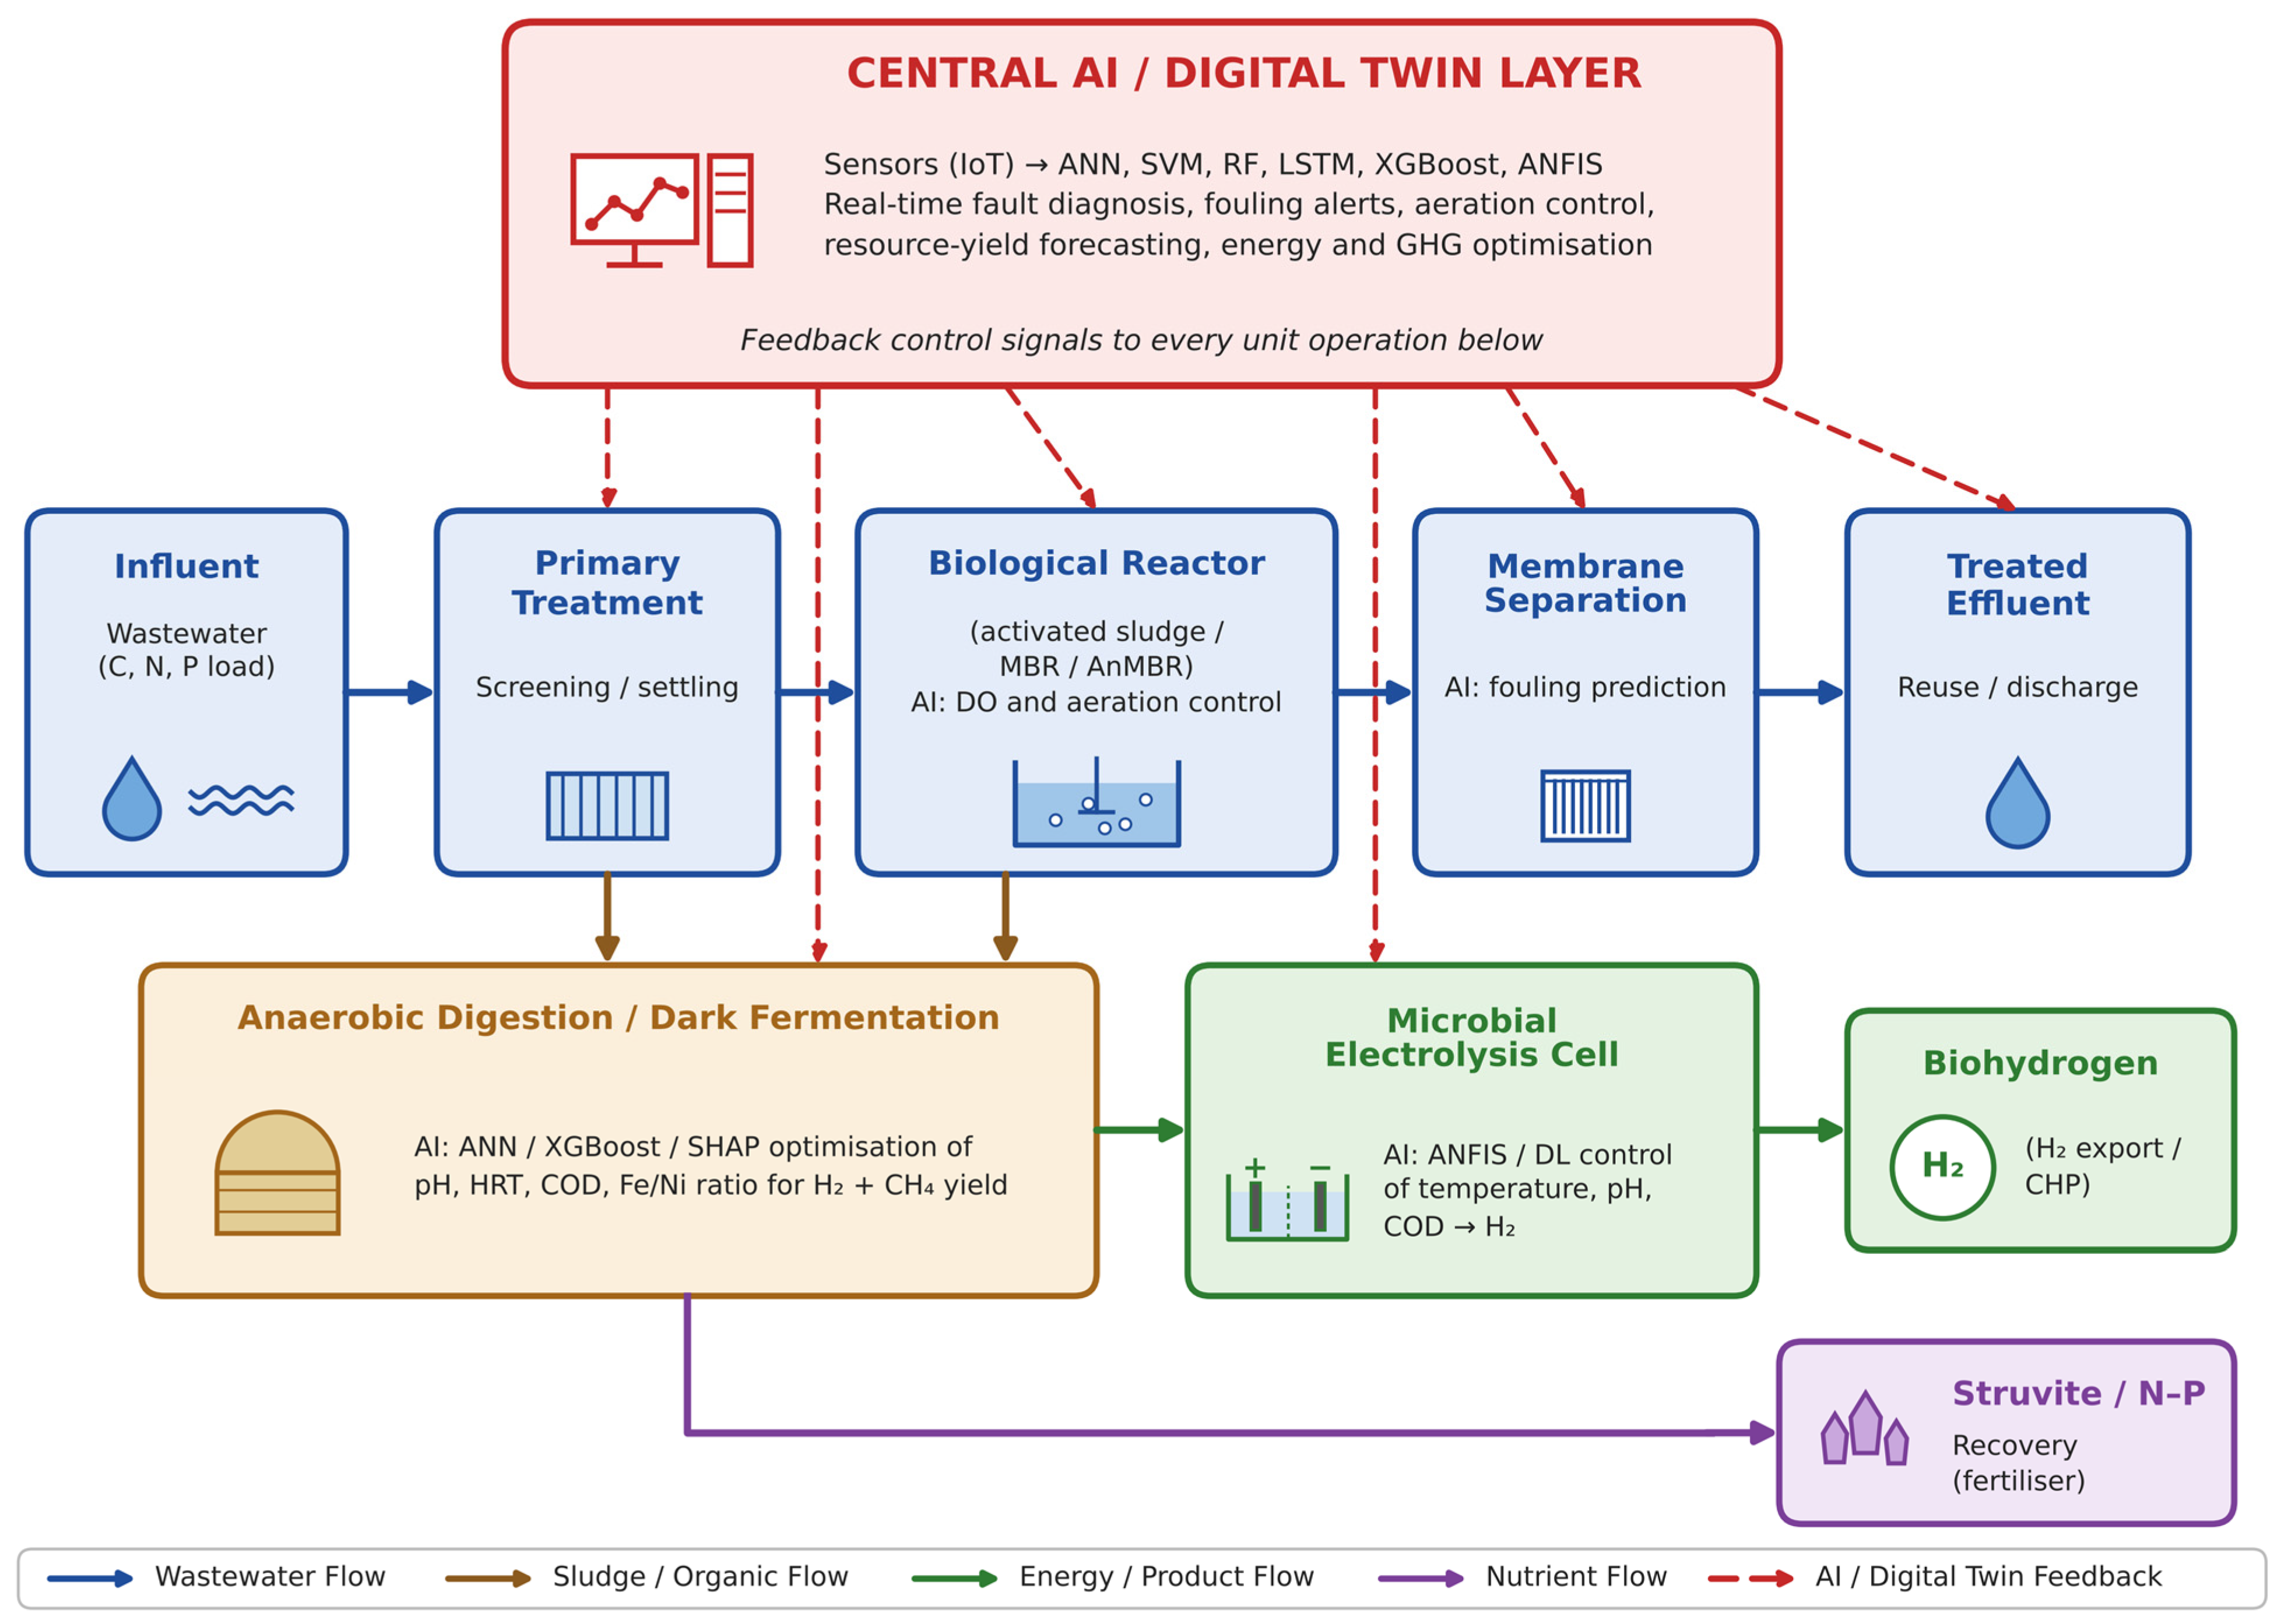
Biohydrogen produced by dark fermentation or microbial electrolysis leaves the reactor mixed with CO2, water vapour and traces of H2S and must be upgraded before use. Non-porous polymeric, porous and ionic-liquid-based gas-separation membranes have been evaluated for this purpose, with performance depending strongly on gas composition, humidity and temperature [37]. ML has been used to screen and design polymer gas-separation membranes from large permeability databases [38], but coupling such models with the variable composition of fermentative hydrogen streams has not been reported in the literature screened for this review. Figure 1 shows how these membrane units sit within an AI-driven biorefinery: membrane separation appears both as the MBR stage of the treatment train and as the recovery step for nutrients and hydrogen.
3.4. AI-Enabled Nutrient Recovery: Struvite Crystallisation
Phosphorus recovery as struvite (MgNH4PO4·6H2O) is one of the most mature resource-recovery technologies in the wastewater biorefinery portfolio, addressing both eutrophication risk and the long-term scarcity of mineable phosphate rock [39]. ML models, including linear and polynomial regression, RF and XGBoost, have been used to predict struvite recovery efficiency from process parameters such as pH, temperature and Mg:P:N molar ratios, with XGBoost achieving R2 values of 0.9683 (phosphate) and 0.9483 (ammonium) on a dataset compiled from published struvite studies covering several wastewater sources with ten process inputs (including pH, temperature, phosphate, ammonium and magnesium concentrations, stirring speed and reaction time), and the model predictions were then checked in new laboratory experiments [40]. This experimental verification is distinct from validation of the model’s predictive accuracy on held-out data (Section 2), which the study reports through a training–testing split whose ratio is not stated in the accessible text. A different strategy was adopted by Zhang et al. [41], who compiled 1036 experimental records reported in 51 earlier struvite studies (i.e., 51 data sources used by those authors, not the number of studies included in the present review) and found that RF and XGBoost performed best for recovery efficiency and product purity, respectively, addressing a previously neglected gap between recovery quantity and product quality.
The two studies are not directly comparable. Both pool results from earlier publications, but the first does not report the number of records in its abstract or accessible text and adds its own verification experiments, whereas the second states its size (1036 records) and spans many wastewater types, reactor geometries and analytical protocols, which widens coverage but introduces between-study heterogeneity that a random train–test split cannot separate from genuine process effects (Section 6.1). Neither reports validation on an independent full-scale crystalliser. Complementary materials-based innovations, such as nanostructured struvite–hydrogel composites that recover ammonium and phosphate [42], suggest fertile ground for coupling AI-guided process control with novel sorbent and crystallisation media. Membrane pre-concentration by FO or ED upstream of crystallisation (Section 3.3) would add a further manipulated variable for AI-based control of struvite yield and purity.
Figure 1.
Conceptual design of an AI-driven, membrane-integrated wastewater biorefinery showing the central AI/digital-twin layer providing feedback control for primary treatment, the bioreactor train, membrane separation, anaerobic digestion/dark fermentation, microbial electrolysis cells and nutrient recovery. Representative AI methods per unit are discussed in Section 3 and Section 4 (e.g., aeration control [6]; dark-fermentation modelling [11]; MEC optimisation [43,44]). Box colours group the units by function: blue, main water line; orange, anaerobic digestion/dark fermentation; green, bioelectrochemical and hydrogen units; purple, nutrient recovery; red, central AI/digital-twin layer. Arrow types are defined in the legend. Abbreviations in the figure: AnMBR = anaerobic membrane bioreactor; ANFIS = adaptive neuro-fuzzy inference system; ANN = artificial neural network; CHP = combined heat and power; COD = chemical oxygen demand; DL = deep learning; DO = dissolved oxygen; GHG = greenhouse gas; HRT = hydraulic retention time; IoT = Internet of Things; LSTM = long short-term memory network; MBR = membrane bioreactor; RF = random forest; SHAP = SHapley Additive exPlanations; SVM = support vector machine; XGBoost = extreme gradient boosting.
4. AI-Enhanced Biohydrogen Production and Thermochemical Sludge Conversion
4.1. Dark Fermentation
Dark fermentation is widely regarded as the most readily scalable biological hydrogen pathway because it operates without light input, tolerates diverse organic substrates and proceeds under near-ambient temperature and pressure [45]. Mahata et al. [46] found that SVM outperformed ANN and response surface methodology (RSM) for hydrogen production from starchy wastewater supplemented with groundnut de-oiled cake using acidogenic mixed consortia in laboratory experiments designed by Taguchi and central-composite methods (inputs: pH, substrate concentration and temperature; R2 = 0.988; RMSE = 0.0103); a confirmation run at the predicted optimum provided experimental verification of that optimum, whereas the model-validation scheme behind the reported R2 is not stated in a comparable form. A multilayer perceptron ANN trained on 180 literature data points from 35 dark-fermentation studies of organic waste biomass (inputs: substrate type, inoculum type, substrate concentration, pH and temperature) predicted hydrogen yield with R2 = 0.8381 and RMSE = 0.3838 [12]. Earlier ANN-based work similarly demonstrated strong correlations between predicted and experimental hydrogen production in an anaerobic migrating blanket reactor treating synthetic wastewater [47] and in a continuous reactor treating confectionery (industrial) wastewater [48]. ANFIS-based TMP forecasting has been used to manage an AnMBR–sequencing batch reactor system during biohydrogen production [31]. More recently, Mougari et al. [49] combined Modified-Gompertz kinetic descriptors of each substrate with temperature, pH, residence time and substrate concentration in a Bayesian-optimised ANN trained on a literature-compiled database and evaluated by five-fold cross-validation (R2 = 0.998); SHapley Additive exPlanations (SHAP) highlighted the kinetic descriptors as influential inputs, illustrating how mechanistic information can be embedded in ML inputs.
Liu et al. [11] addressed the small-data problem directly by expanding a dataset of 210 wastewater dark-fermentation samples to 1050 instances with a generative-adversarial-network-inspired augmentation strategy and training a histogram-based gradient boosting model, the best of nine algorithms tested (test set R2 ≈ 0.95; RMSE < 0.06); accumulated local effects (ALE) analysis was then used to define favourable operating windows (Fe/Ni ratio ≈ 1:3; hydraulic retention time 4–5 h; pH ≈ 4.9; COD < 25 g L−1). Such interpretable outputs represent a step toward operator-trusted AI, but, as discussed in Section 6.2, they describe the behaviour of the trained model rather than proven process mechanisms. For methanogenic anaerobic digestion, which shares feedstocks and process variables with dark fermentation, ML has been used to predict biogas production at a full-scale plant digesting about 50 t d−1 of cattle and poultry manure, slaughterhouse and vegetable waste from total and volatile solids, temperature, pH, alkalinity and volatile fatty acids (random forest, R2 = 0.924 on one year of daily data with an 80/20 training–testing split) [50] and to support entropy-guided, ANN-assisted operation with uncertainty quantification at a full-scale plant treating about 30 t d−1 of organic solid waste, where an ANN classified high- versus low-yield operation with 96% accuracy (F1 = 0.95) [51].
Relevance to membrane-integrated biorefineries: Dark fermentation connects to membrane technology at three points: AnMBRs retain hydrogen-producing biomass at short hydraulic retention times [31]; the fermentation effluent, rich in volatile fatty acids, ammonium, and phosphate is the feed for the membrane-based recovery units of Section 3.3; and the product gas requires upgrading by gas-separation membranes [37]. Apart from the ANFIS TMP model of Taheri et al. [31], none of the dark-fermentation ML studies in Table 1 include membrane variables (flux, TMP, permeate quality or gas-membrane performance) as inputs or outputs. Joint models that link fermentation yield with AnMBR fouling and downstream membrane recovery are, therefore, a specific research need for membrane-integrated biorefineries.
4.2. Microbial Electrolysis Cells and Bioelectrochemical Systems
Microbial electrolysis cells (MECs) couple wastewater treatment with hydrogen generation by applying a small external voltage to drive proton reduction at the cathode while electroactive bacteria oxidise organic matter at the anode [44]. A 2021 review situates MEC technology at technology readiness level (TRL) 5, suggesting near-term commercialisation potential given its carbon-neutral profile, though it cautions that high manufacturing costs, internal resistance and methanogenesis remain limiting [52]. AI has been applied directly to MEC modelling and optimisation: using 16 laboratory MEC experiments (11 for training and 5 for testing), an ANFIS model of incubation temperature, initial pH and influent COD fitted the data better than RSM (R2 0.963 versus 0.8953; RMSE 0.0302 versus 0.1924; test set R2 0.973) [43]. This is an improvement in model fit, not in reactor performance: the optimum identified with the ANFIS model corresponds to a predicted hydrogen production rate about 6–7% above the best measured value (1.253 versus about 1.18 m3 H2 m−3 d−1), and it was not verified experimentally in that study: the five hold-out points constitute model validation, whereas experimental verification of the predicted optimum was deferred by the authors to future work. The model was trained on data from an earlier MEC study treating palm oil mill effluent, an industrial wastewater. A follow-up study combined ANFIS modelling (20 experiments; 70/30 train–test split; test set R2 0.991 for hydrogen yield) with an artificial-gorilla-troops optimiser to identify the buffer concentration, dilution factor and applied voltage expected to increase biohydrogen production and energy recovery [53]; the reported gain of about 35% in combined performance is, again, a model prediction that was not verified experimentally; the training data came from an earlier study of MECs fed with dark-fermentation effluent of water-hyacinth biomass.
Membranes are also integral to many MEC designs. Double-chamber MECs separate anode and cathode with ion-exchange membranes, which keep the hydrogen product pure but add cost, ohmic resistance and pH-gradient losses, whereas membrane-less single-chamber designs reduce cost and resistance but lose hydrogen to methanogens and other hydrogen-scavenging microorganisms [44,52]. The two ANFIS studies above varied operating conditions only [43,53]; membrane type, separator resistance and membrane fouling have not been used as inputs in the MEC ML studies screened here, although they govern both performance and cost. Including such variables, and coupling MEC models with the gas-separation membranes used for hydrogen upgrading (Section 3.3), would align MEC modelling with the membrane-integrated biorefinery concept.
Life-cycle assessment (LCA) studies provide an essential counterweight to purely performance-driven optimisation. In a comparative LCA of microbial fuel cells (MFCs), MECs, and microbial desalination cells (MDCs) for wastewater treatment, the MEC had the lowest life-cycle impact of the three, mainly because of the credit for the hydrogen peroxide it produced, whereas the MFC and MDC had relatively large impacts at currently achievable power densities [54]. Because the credited product in that study was hydrogen peroxide rather than hydrogen, the result cannot be transferred directly to hydrogen-producing MECs. No primary study screened for this review has quantified the life-cycle or techno-economic effect of AI optimisation on hydrogen-producing systems; the yield gains reported for AI-optimised MECs [43,53] are model predictions at laboratory scale.
4.3. Thermochemical Conversion of Sewage Sludge: Gasification, Liquefaction and Pyrolysis
Thermochemical routes differ fundamentally from dark fermentation: they operate at roughly 250–700 °C and, for hydrothermal processes, at elevated pressure; they convert the whole organic fraction of sludge, including non-biodegradable matter, within minutes rather than days; and their yields are governed by feedstock composition and reaction severity rather than by microbial ecology. They are, therefore, discussed separately. In supercritical water gasification (SCWG), which converts wet biomass into a hydrogen-rich gas without drying, Zhao et al. [55] developed interpretable ML models for hydrogen production and reported RF as the best-performing algorithm (R2 = 0.9782), while Khandelwal and Dalai [56] predicted individual gas yields from 166 literature data points for H2 (118 for CO, CO2 and CH4) compiled from 16 studies, with test set R2 of 0.84 for H2 (XGBoost) and 0.83–0.94 for the other gases (CatBoost) on an 80/20 split. Both datasets were compiled from lignocellulosic and other biomass rather than sewage sludge, so transfer to sludge feedstocks remains to be demonstrated.
Hydrothermal liquefaction (HTL) converts wet sludge into biocrude under subcritical conditions, and pyrolysis converts dewatered sludge into biochar, bio-oil and gas. ML is increasingly used to predict product yields from feedstock composition and operating conditions. Guirguis and Savage [57] trained decision-tree and RF models on 1144 biocrude yields from many feedstocks, including sewage sludge, and found that prediction accuracy on a 10% hold-out set (median absolute residual 4.6 wt%) was markedly lower than the fit, and that component-additivity and reaction-engineering models were more reliable for new feedstocks. Li et al. [58] used MLP and ANFIS models to predict biochar yield and composition from biomass pyrolysis. These results reinforce a theme of Section 6.1: ML fits well within its training domain but extrapolates poorly to unseen feedstocks.
Thermochemical units can close material loops in a membrane-integrated biorefinery. The nitrogen-rich HTL aqueous phase could be routed to anaerobic treatment or to membrane-based ammonia recovery (Section 3.3); sludge-derived biochar can serve as a sorbent or digester additive; and SCWG or pyrolysis gas could be upgraded with the same gas-separation membranes considered for biohydrogen. Coupling AI models of thermochemical units with those of the biological train—a parallel network in which biological and thermochemical routes compete for the same sludge—would allow sludge allocation between routes to be optimised for energy and nutrient recovery. This is proposed here as a research direction; no study implementing such joint optimisation was identified in the literature screened for this review.
4.4. Comparative Synthesis of AI Performance Across Resource-Recovery Domains
Table 1 consolidates representative quantitative outcomes drawn from the studies reviewed above and reports, for each study, the wastewater or feed type, scale, input variables, dataset size and validation scheme, as extracted from the original publications. The column “AI model(s) reported as best” refers to the best-performing model within each individual study; because the studies use different datasets, targets and validation procedures, the table does not rank models across studies. Most resource-recovery models were developed at laboratory scale on municipal, synthetic or literature-compiled data; the full-scale results concern municipal plants (aeration and MBR fouling), and industrial wastewater appears mainly in fermentative hydrogen and MEC studies (e.g., confectionery wastewater, slaughterhouse wastewater and palm oil mill effluent) and in the industrial-scale digestion study.
Origin of the data: The treatment plants and datasets behind Table 1 are not of a single type, and results should be read with this in mind. (i) Municipal (communal/domestic) wastewater includes the full-scale aeration, N2O, MBR-fouling and energy studies [6,22,24,28,59], together with the full-scale submerged-MBR study [29], whose influent type is not specified in the abstract. (ii) Industrial wastewater includes slaughterhouse wastewater in a pilot AnMBR [30], starchy wastewater with groundnut de-oiled cake [46], confectionery wastewater [48] and palm oil mill effluent in an MEC [43]. (iii) Mixed or multi-source data includes the review-compiled effluent-quality studies covering municipal and industrial plants [9,10] and the multi-source struvite datasets [40,41]. (iv) Synthetic wastewater or non-wastewater organic feedstocks include the laboratory aerobic granular sludge reactor [26]; organic waste biomass and solid wastes [12,49,51]; a full-scale digester treating manure, slaughterhouse and vegetable waste [50]; dark-fermentation effluent of plant biomass [53]; and lignocellulosic or other biomass for thermochemical conversion [55,56,57]. For the dark-fermentation dataset of Liu et al. [11], the wastewater source is not reported in the abstract. Consequently, evidence from municipal plants is largely confined to aeration, emissions and MBR fouling, whereas most resource-recovery models rest on industrial, synthetic or literature-compiled data, which limits direct transfer to municipal biorefineries.
Table 1.
Representative AI applications and reported performance across wastewater biorefinery domains (2016–2026) with wastewater type, scale, input variables, dataset size and validation scheme.
Figure 2 plots the individual study-level R2 values that underlie each task together with the reported validation scheme (marker shape and colour), the scale of the data (filled or open marker) and, where reported, the dataset size; the target, scale and validation of each point are listed in Table 2. The horizontal axis spans R2 = 0.4–1.0 so that lower values remain visible, and the review-compiled range for effluent-quality prediction (0.64–1.00 [9]) is shown as a shaded band for context only, because it is not a study-level value. Energy, cost and emission reductions and classification metrics are excluded because they are not commensurable with R2. Two patterns stand out. First, the highest values (R2 ≥ 0.97) come mostly from laboratory or literature-compiled datasets with unspecified validation or very small random hold-out sets (e.g., five test points in [43]). Second, the lowest values arise where validation was most demanding or data were most heterogeneous: the 75-cycle chronological forecast of AnMBR fouling (R2 = 0.56 [30]) and the literature-compiled dark-fermentation and SCWG models (R2 ≈ 0.84 [12,56]). Even within a task, the points are, therefore, not like-for-like comparisons.
Figure 2.
Study-level coefficients of determination (R2) reported for the best model in individual studies, grouped by task, on an axis from 0.4 to 1.0. Marker shape and colour indicate the model-validation scheme reported (independent or chronological test set, hold-out test set with random or unspecified split, k-fold cross-validation, or not specified or not reported in the abstract); filled markers denote full- or pilot-scale data and open markers laboratory or literature-compiled data; dataset sizes are printed next to the markers where reported. Horizontal lines span ranges reported within one study, arrows denote lower bounds (R2 > value), and the hatched band shows the review-compiled range for effluent-quality prediction [9], which is not a study-level value. Grey background bands only separate the task groups for readability, and horizontal lines (green or blue, as their markers) connect the lower and upper values reported within one study. Studies shown, (labelled in the figure by first author and year): [6,9,11,12,22,26,29,30,40,43,46,49,50,53,55,56]. Sources are listed in Table 2.
Table 2.
Studies underlying Figure 2 (study-level R2 of the best model with target, scale, dataset size and validation scheme).
5. AI-Integrated Plant Design, Implemented Systems and Techno-Economics
5.1. Plant-Level Architecture and Digital Twins
Translating laboratory-validated AI models into operational gains requires deliberate plant-level design. Figure 3 presents a conceptual schematic of an AI-instrumented wastewater biorefinery, illustrating how a centralised AI/SCADA control room receives data from distributed sensors across the bioreactor train, the MBR (which replaces the secondary clarifier, its permeate passing directly to disinfection and reuse), the AnMBR/dark-fermentation unit, the membrane-based recovery units (membrane contactor for ammonia, forward osmosis/electrodialysis pre-concentration), the MEC, the gas-separation membrane for hydrogen upgrading, and the struvite crystalliser and returns control signals for aeration and membrane air scouring, chemical dosing and cleaning schedules. This architecture reflects the “sustainable circularity and intelligent data-driven operations” framework proposed by Matheri et al. [2] and the multimodal control concepts demonstrated by Wang et al. [6].
Figure 3.
Schematic process layout of an AI-instrumented, membrane-integrated wastewater biorefinery, showing the integration of sensor networks, an AI/SCADA control room and downstream resource-recovery units. The MBR provides solid–liquid separation, so no secondary clarifier is used; permeate passes to disinfection and reuse. Sludge is routed to an AnMBR/dark-fermentation unit, whose effluent feeds membrane-based nutrient recovery (ammonia membrane contactor; FO/ED pre-concentration), struvite crystallisation and a microbial electrolysis cell; the hydrogen-rich gas is upgraded by a gas-separation membrane. Box and arrow colours follow the stream types defined in the legend (blue, liquid/permeate line; brown, sludge; green, gas/hydrogen; purple, nutrient-rich streams and products; red, AI/SCADA control room and control signals); teal boxes are membrane units, and red dots mark online sensors. ALE = accumulated local effects; AnMBR = anaerobic membrane bioreactor; CHP = combined heat and power; DO = dissolved oxygen; ED = electrodialysis; FO = forward osmosis; MBR = membrane bioreactor; MEC = microbial electrolysis cell; ORP = oxidation–reduction potential; SCADA = supervisory control and data acquisition; SHAP = SHapley Additive exPlanations; TMP = transmembrane pressure; UV = ultraviolet; VFA = volatile fatty acids; WAS = waste-activated sludge.
A key design implication is that digital-twin architectures are most valuable when they bridge previously siloed unit operations. For example, the same influent COD signal that an AI controller uses to optimise aeration in the bioreactor train (Section 3.1) also serves as a primary predictor of hydrogen yield in the downstream dark-fermentation unit (Section 4.1) and as a covariate in struvite crystallisation models (Section 3.4). Yet the studies reviewed here almost universally treat these as independent prediction taskstrained on separate datasets with distinct feature sets. This review argues that this represents a major missed opportunity: a genuinely integrated biorefinery digital twin would propagate a shared, plant-wide feature set across all resource-recovery modules, allowing, for instance, an aeration-control decision to be evaluated not only for its energy cost but also for its downstream effect on sludge composition and, consequently, on biohydrogen and nutrient recovery potential. In a membrane-integrated plant, this shared feature set must also carry membrane state variables (TMP, permeability, cleaning history and permeate quality), because membrane units couple the resource streams: MBR operation sets reuse-water quality and scouring energy, AnMBR operation sets the composition of the fermentation effluent, and the performance of membrane contactors, FO and ED depends on that effluent.
5.2. Implemented AI Systems: Methods, Performance and Practical Outcomes
Table 3 summarises AI systems for which implementation on or evaluation with data from operating plants has been documented, together with their methodology, application, performance, advantages and limitations. Three observations follow. First, implemented systems are concentrated in aeration and membrane-fouling management at municipal plants—the units with the largest energy or maintenance cost and the densest sensor coverage. Second, they are supervisory or advisory systems layered on existing SCADA and PID loops rather than replacements for them, which limits the consequences of model error. Third, performance is reported as before/after or model-versus-baseline comparisons at single sites; none reports a multi-site, multi-year controlled evaluation, and vendor results have not been peer reviewed.
Table 3.
AI systems implemented at or evaluated with data from operating plants: methodology, application, performance, advantages and limitations.
5.3. Techno-Economic Comparison of Data-Driven AI, Knowledge-Based AI and Conventional (Non-AI) Control
Peer-reviewed techno-economic analyses that compare AI-based and conventional (non-AI) control (as defined in Section 1) at the same plant are scarce; the comparison in Table 4 is, therefore, qualitative and identifies the cost elements that a full analysis should quantify. Consistent with Section 1, rule-based and fuzzy-logic controllers are shown in a separate column as knowledge-based AI, not as conventional control. Because aeration often dominates WWTP electricity use [21], the main economic lever is energy. For a plant with annual aeration electricity demand E (kWh yr−1), electricity price p and fractional saving s, the annual saving is s·E·p, and the simple payback time of an AI system with capital cost C and annual running cost O (licences, data infrastructure, model maintenance and retraining) is C/(s·E·p − O). Two documented full-scale figures must be kept apart. The vendor-reported 26–30% at Cuxhaven [24,25] is a reduction in aeration energy and can be used directly as s ≈ 0.26–0.30. The 19.8% reported by Wang et al. [6] is a reduction in total operating cost relative to fuzzy-logic (knowledge-based AI) control; it is not an aeration-energy fraction and would instead enter the analysis as a reduction in total annual operating cost. With s ≈ 0.26–0.30, payback is most favourable for large plants with high aeration demand and existing SCADA infrastructure, whereas for small utilities, the fixed cost of sensors, data infrastructure and skilled staff may outweigh the savings [60]. For resource-recovery units (struvite, MECs, membrane-based nutrient recovery), AI benefits act mainly through yield, product quality and avoided cleaning or chemical use, but none of the studies reviewed here monetised these effects. Commercialisation prospects therefore depend on future studies reporting cost per unit of recovered resource alongside predictive accuracy.
Table 4.
Qualitative techno-economic comparison of conventional (non-AI), knowledge-based AI (rule-based/fuzzy-logic) and data-driven AI (ML-based) operation of wastewater biorefinery units.
6. Critical Discussion: Gaps, Limitations and Contradictions
6.1. Dataset Size, Generalisability, Validation and the Reproducibility Problem
A recurring weakness across the reviewed literature is the small scale of training datasets. The struvite-recovery study reporting R2 = 0.9683 pooled published data without reporting the number of records in its abstract or accessible text [40], and the supercritical water gasification benchmarking study used only 166 data points [56]. Even the more recent struvite study that compiled 1036 records did so by pooling data from 51 separate published studies with differing experimental protocols, reactor geometries and feedstocks [41], raising legitimate questions about whether the resulting model captures a genuine underlying relationship or an artefact of cross-study heterogeneity. Models reporting R2 values above 0.95 on such datasets should, therefore, be interpreted cautiously; without independent, full-scale validation, these figures risk overstating real-world transferability.
Two distinct limitations should be separated. Dataset size limits how many parameters a model can estimate reliably and inflates the variance of performance estimates; it can be partly mitigated by data augmentation [11], simpler models or physics-informed inputs [49]. External generalisability—whether a model trained at one plant, or on pooled literature data, predicts correctly at a new plant or under new operating conditions—is a separate property that a larger dataset does not guarantee. When data from several studies are pooled, records from the same study are correlated; a random train–test split then places closely related records in both sets and overstates accuracy, whereas grouped (leave-one-study-out) or blocked cross-validation gives a more realistic estimate [61,62].
The evidential weight of an R2 value therefore depends on how it was obtained. In increasing order of rigour are (i) goodness of fit on training data; (ii) random hold-out or k-fold cross-validation on the same dataset; (iii) chronological (time-blocked) testing on later operating periods, which is essential for plant time-series data because random splits leak information between neighbouring time steps; (iv) grouped validation across studies, reactors or campaigns; and (v) external validation at an independent plant [20,62]. Most resource-recovery studies in Table 1 report level (i) or (ii) or do not state the scheme; level (v) is essentially absent. Studies should also report performance against simple baselines—persistence forecasts, linear regression or the mechanistic model already used at the plant—because a high R2 may reflect strong autocorrelation rather than model skill [20]. For these reasons, R2 values from different targets, dataset sizes and validation schemes are not ranked against each other in this review (Figure 2; Table 2).
Model validation must also be distinguished from experimental verification of a predicted optimum. Validation establishes how accurately a model predicts data it has not seen; verification tests whether the operating conditions identified by optimising the model actually deliver the predicted performance in a reactor. The two are complementary, and neither substitutes for the other. Among the studies in Table 1, the struvite study [40] reports new experiments to check its model predictions and the dark-fermentation study [46] a confirmation run at the predicted optimum, whereas the optima identified for MECs [43,53] and the operating windows derived for dark fermentation [11] remain model predictions. Conversely, a successful verification run confirms one operating point but does not establish the model’s accuracy elsewhere in the operating space, which still requires validation on independent data.
6.2. The Explainability–Performance Trade-Off and the Limits of Feature Attribution
An emerging but still partial shift toward explainable AI (XAI) is evident. SHapley Additive exPlanations (SHAP)-based attribution [63] of kinetic descriptors in a dark-fermentation model [49] and accumulated local effects (ALE)-based [64] operating-window identification in the histogram-gradient-boosting study [11] provide operators with interpretable summaries of what drives model predictions that pure ANN “black boxes” cannot. However, this XAI layer has not yet been systematically applied to the highest-stakes domains, namely, real-time aeration and N2O control, where the energy and emissions consequences of model error are largest and where operator trust is most critical for adoption [23]. This review considers this an unresolved priority: explainability should not be an afterthought applied selectively to academically convenient case studies, but a design requirement for any AI system with direct control authority over a treatment process.
It is essential, however, to distinguish feature attribution from mechanistic knowledge. SHAP and ALE quantify how a trained model’s prediction changes with each input; they describe the model, not the process. Attributions are conditional on the training data, can be distorted when inputs are correlated (e.g., COD, volatile fatty acids and pH in fermenters), and do not establish causality [20,64]. The Fe/Ni window identified by ALE [11], for instance, is consistent with the known role of these metals in hydrogenase enzymes, but it becomes mechanistic knowledge only when confirmed by designed experiments or mechanistic models. XAI outputs should, therefore, be presented to operators as model-based indications and cross-checked against process knowledge, not as explanations of the underlying biology or chemistry.
6.3. The Translational Gap Between Biohydrogen Research and Deployment
Despite more than a decade of MEC research, and AI studies in which ANFIS models described laboratory data better than RSM (R2 0.963 versus 0.8953 [43]), MEC technology was placed at TRL 5 in a 2021 assessment [52]. A higher R2 indicates a better description of the experimental data, not a better-performing reactor; in both ANFIS studies, the higher hydrogen yields at the model-identified optima were predicted rather than measured [43,53]. To date, AI has, therefore, mainly improved the modelling of laboratory reactors and the identification of candidate operating conditions rather than demonstrably improving reactor performance or enabling commercial-scale deployment. Persistent barriers, namely, manufacturing cost, internal resistance, cathode biofouling and methanogenesis, are largely materials-science and electrochemical-engineering problems that AI alone cannot resolve. This points to a structural mismatch in the literature: a disproportionate share of recent AI publications addresses incremental yield optimisation of systems that are not yet economically viable at scale, while comparatively little AI-focused work addresses the techno-economic and supply-chain barriers that life-cycle studies identify as decisive for commercialisation [52,54].
6.4. Fragmentation Versus Integration
As discussed in Section 5, the AI literature on wastewater biorefineries remains heavily fragmented along disciplinary lines: water-quality and aeration researchers, membrane-fouling researchers, struvite-recovery researchers and biohydrogen researchers each maintain largely separate modelling traditions, datasets and even separate review articles [13,14,16]. While this specialisation has enabled deep technical progress within each domain, it has also left cross-domain trade-offs—for instance, whether an aeration strategy that minimises N2O emissions might reduce the organic-carbon loading available for downstream dark fermentation—almost entirely unexamined. Closing this gap will require review articles and funding calls that explicitly reward cross-domain, whole-plant AI modelling rather than single-unit-operation optimisation. The strengths, weaknesses, opportunities and threats identified in this section are summarised in Figure 4.
7. Proposed Frameworks: Toward Federated, Explainable and Integrated AI Biorefineries
The critical gaps identified in Section 6, namely, small and non-standardised datasets, limited cross-plant validity and the persistent explainability deficit in high-stakes control loops, define the practical ceiling for how far current AI approaches can be trusted to provide autonomous control of resource-recovery infrastructure. This section proposes two architectural responses, illustrated in Figure 5 and Figure 6. Both have published precedents—federated learning has recently been applied to WWTP energy-consumption prediction [59], and hybrid mechanistic–ML models of water resource recovery facilities are an active research field [65,66,67]—but in the literature screened for this review, they have not been applied to the resource-recovery units (struvite crystallisation, dark fermentation, MECs and membrane-based recovery) of a wastewater biorefinery. They are presented as proposals that require validation, not as demonstrated technologies. The frameworks in this section, and the research directions in Section 8, are the author’s own proposals derived from the synthesis of the reviewed literature; they are not conclusions reported by the cited studies.
Figure 5.
Conceptual federated learning architecture linking municipal, industrial and decentralised wastewater treatment plants. Encrypted local model updates (not raw data) are aggregated into a global model that is returned to each site and fine-tuned locally, addressing the small-sample and external-validity limitations identified in Section 6.1. Transferability between plants with different configurations is discussed in Section 7.1. Dashed red arrows denote encrypted local model updates sent to the aggregator and solid blue arrows the improved global model returned to each plant; “→” in the global-model box means “leading to”.
Figure 6.
Proposed hybrid mechanistic–machine-learning pipeline with an embedded SHAP/ALE explainability layer combining a physically constrained mechanistic core with an ML residual learner in a serial (residual) configuration to produce operator-readable control recommendations. The explainability layer attributes the ML correction to its inputs; it does not by itself provide mechanistic insight. Solid arrows show the forward flow of information from the model components to the operator dashboard; the dashed arrow shows operator feedback and new sensor data used to retrain both the mechanistic core and the ML residual learner. SHAP = SHapley Additive exPlanations; ALE = accumulated local effects.
7.1. Federated Learning Across Multiple Plants
Federated learning [68] offers a direct response to the dataset-size problem documented in Section 6.1, where individual studies relied on as few as 166 records [56]. Rather than pooling raw operational data, which raises confidentiality concerns for utilities and industrial dischargers alike, a federated architecture (Figure 5) allows each plant to train a local model on its own sensor history and share only model parameters or gradients with a central aggregator. The aggregator returns an improved global model that benefits from the combined experience of municipal, industrial and decentralised plants without exposing any single facility’s proprietary process data. For domains such as struvite recovery, where the most robust published model still relies on pooling 1036 records extracted from 51 separate papers with inconsistent protocols [41], a federated approach trained directly on plant data could, in principle, achieve comparable sample sizes while preserving protocol consistency within each contributing site.
Federated learning does not, however, remove plant heterogeneity. Municipal, industrial and decentralised plants differ in influent composition, process configuration, sensor types and control philosophy, so their local data are not identically distributed, and a single global model averaged across such sites may perform worse than a local model at an atypical plant. Practical federated designs should, therefore, (i) restrict federation to plants with comparable unit operations (e.g., MBR trains or struvite crystallisers) or cluster plants by configuration; (ii) use the global model as an initialisation that is fine-tuned locally (personalised federated learning); (iii) harmonise variable definitions, units and sampling frequencies before training; and (iv) evaluate each site on its own held-out period before deployment. A recent vertical federated study at a Melbourne WWTP identified data heterogeneity, communication bottlenecks and convergence as the main obstacles [59]. Figure 5 should, accordingly, be read as a conceptual architecture whose benefit must be demonstrated plant by plant.
7.2. Hybrid Mechanistic–ML Pipelines with Embedded Explainability
A second architectural approach, illustrated in Figure 6, addresses the explainability–performance trade-off discussed in Section 6.2 by structurally separating a mechanistic core from an ML residual learner. The mechanistic core—for example, the Anaerobic Digestion Model No. 1 (ADM1) for the dark-fermentation and digestion units, Activated Sludge Model (ASM) or Monod-type kinetics for the bioreactor train—provides a physically constrained baseline prediction that respects mass and energy balances. An ML residual learner (XGBoost, RF or LSTM, depending on the unit operation) is then trained specifically on the difference between observed plant performance and the mechanistic prediction, capturing nonlinear effects such as microbial community shifts or feedstock variability that mechanistic models systematically miss. Because the ML component models only the residual, its predictions are smaller in magnitude and arguably easier to bound and interpret.
The mechanistic and ML components can be related in two ways. In the serial (residual) configuration shown in Figure 6, the calibrated mechanistic model is run first, the ML learner is trained on the residual between measurement and mechanistic prediction, and the hybrid prediction is the sum of the two; the mechanistic model carries the mass balances, and the ML term corrects systematic bias. In an alternative configuration, the ML model estimates slowly varying parameters of the mechanistic model (e.g., kinetic rate constants or influent fractionation) from data, so that the output still satisfies the mechanistic structure [66,67]. Hvala and Kocijan [65] demonstrated a hybrid mechanistic/Gaussian-process model for full-scale WWTP effluent prediction. In both configurations, the SHAP/ALE layer explains the ML correction only; it neither explains nor validates the mechanistic core, and the distinction between attribution and mechanism (Section 6.2) applies. The hybrid prediction is passed through this explainability layer before being surfaced to operators as recommendations on a decision dashboard, extending SHAP/ALE, which the literature currently applies mainly to offline biohydrogen-yield models, into the real-time aeration and emissions-control loops where explainability is most urgently needed [6,23].
7.3. Whole-Plant Resource Ledger: A Proposed Unifying Concept
Building on Section 5, Section 7.1 and Section 7.2, this review proposes the concept of a whole-plant “resource ledger”: a shared, continuously updated feature store in which every AI module across the biorefinery (aeration control, membrane fouling, dark fermentation, MEC and struvite crystallisation) reads from and writes to a common set of plant-wide state variables (influent COD/N/P load, sludge composition, energy balance and GHG balance). Under this concept, an aeration-control decision is evaluated not in isolation but against its propagated effect on the resource ledger, for instance, whether reducing aeration intensity to cut N2O emissions alters the COD and volatile-fatty-acid profile delivered to the digester in a way that measurably shifts biohydrogen yield.
Relation to a digital twin: A plant-wide digital twin is a virtual replica of the plant—typically, a calibrated mechanistic model coupled to live data—used to simulate and predict plant behaviour [32]. The resource ledger is not a replacement for the twin but an accounting and coordination layer above it: it (i) defines a common set of state variables and resource balances (COD, N, P, energy, GHG) to which every AI module must read and write; (ii) records, for each control decision, the predicted and subsequently observed changes in these balances; and (iii) uses these records to evaluate decisions in one unit against their downstream effects. A digital twin can exist without such cross-module accounting, and the ledger can be populated from a twin, from hybrid models or from measured data.
Time-scale mismatch: Aeration control acts over minutes, membrane fouling over hours to days, and digester or fermenter responses over days to weeks, governed by hydraulic and solids retention times. The ledger therefore requires a multi-rate structure: fast loops (aeration, membrane relaxation) operate on their own time scale within constraints set by a slow supervisory layer, which updates the ledger at daily resolution and evaluates downstream effects with lags corresponding to the residence times of the affected units. Fast decisions are thus judged by their cumulative effect over the response time of the slow unit, not instant by instant.
Validation design: To be testable, the concept should be validated in three stages: (1) in silico, using a plant-wide benchmark such as Benchmark Simulation Model No. 2 [69] extended with fermentation and struvite modules, comparing ledger-coordinated control with independent unit-level controllers on pre-defined indicators (energy per m3 treated, N and P recovered, H2/CH4 yield, effluent compliance and GHG emissions); (2) at pilot scale, with parallel-train or alternating-period experiments (ledger-coordinated versus conventional operation) long enough to cover several sludge ages; and (3) at full scale as an advisory system before any closed-loop use. The hypothesis is falsifiable: if coordinated control does not improve plant-wide indicators beyond the sum of unit-level optimisations, the added complexity is not justified. To the author’s knowledge, based on the literature screened for this review, no study has reported such a cross-domain ledger; it is presented as a proposed framework for future validation rather than as a demonstrated technology.
8. Future Research Directions
Section 7 set out the proposed frameworks; this section lists complementary research priorities that emerge from the synthesis in Section 3, Section 4, Section 5 and Section 6. These are the author’s own recommendations derived from the reviewed evidence, not conclusions reported by the cited studies; as this is a single-author review, they are stated in the third person (“this review”, “the author”) rather than as “we propose”. (1) Validation and reporting standards: studies should report wastewater type, scale, dataset size, validation scheme (preferably chronological or grouped, and external where possible) and comparisons with simple baselines (Section 6.1). (2) Membrane-specific AI: models should be developed for membrane contactors, FO, ED, MD and hydrogen-purification membranes operating on real wastewater streams, including optimisation of cleaning, co-optimisation of biological aeration and membrane air scouring in MBRs, AnMBR operation for dark fermentation, and separator selection in MECs. (3) Thermochemical–biological integration: the allocation of sludge between biological and thermochemical routes should be optimised jointly (Section 4.3). (4) Techno-economic and life-cycle assessment: AI studies should report capital and operating cost per unit of recovered resource and life-cycle greenhouse gas (GHG) balances [13,54], using the elements listed in Table 4. (5) Scale-up: laboratory and pilot models should be re-evaluated on full-scale data before deployment readiness is claimed.
9. Conclusions
AI, predominantly ML, has improved the predictive accuracy of process models across pollutant removal, membrane operation, nutrient recovery and biohydrogen production, and has reduced energy use or operating cost at a small number of full-scale plants; higher model accuracy, however, should not be equated with improved reactor performance. Documented full-scale gains are concentrated in aeration (19.8% lower total operating cost than fuzzy-logic (knowledge-based AI) control; 26–30% lower aeration energy in a vendor-reported case) and in MBR fouling forecasting, whereas resource-recovery models with R2 above 0.9 have been developed almost exclusively on laboratory or literature-compiled datasets. Membrane-based nutrient recovery and hydrogen purification, despite their central role in the biorefinery, have received little AI attention. This review’s critical synthesis shows that the reported gains are concentrated in narrow, single-unit-operation contexts, often validated on small or heterogeneous datasets, and rarely accompanied by the explainability, techno-economic or whole-plant integration analyses needed to support large-scale investment decisions.
Transferring laboratory- or pilot-scale models to full-scale plants faces specific obstacles: full-scale influent is more variable and less controlled; online sensors are fewer, noisier and subject to drift; variables used in laboratory models (e.g., volatile-fatty-acid profiles or trace-metal concentrations) are often not measured online; and full-scale operation imposes safety and compliance constraints that limit exploration. Commercialisation additionally requires a demonstrated return on investment, integration with existing SCADA systems, cybersecurity and staff able to maintain models over the plant’s lifetime. AI deployment should also be assessed within an environmental sustainability framework that accounts for life-cycle greenhouse gas (GHG) emissions, the quantity and quality of recovered resources, and the energy and hardware footprint of the digital infrastructure itself, rather than on predictive accuracy alone.
The frameworks proposed in Section 7, namely, federated cross-plant learning, hybrid mechanistic–ML pipelines with embedded SHapley Additive exPlanations (SHAP) and accumulated local effects (ALE) explainability, and a whole-plant resource ledger, are offered as testable proposals to close these gaps. The wastewater biorefinery of the future will not be defined merely by the presence of AI, but by the degree to which AI systems are explainable, validated across plants, integrated across unit operations and explicitly linked to economic and environmental outcomes.
Funding
This research received no external funding.
Data Availability Statement
No new data were created or analysed in this study. Data sharing is not applicable to this article.
Acknowledgments
The author is grateful to Mangosuthu University of Technology and Joseph Kapuku.
Conflicts of Interest
The author declares no conflicts of interest.
Abbreviations
The following abbreviations are used in this manuscript:
| A2O | anaerobic–anoxic–oxic |
| AD | anaerobic digestion |
| ADM1 | Anaerobic Digestion Model No. 1 |
| AGS | aerobic granular sludge |
| AI | artificial intelligence |
| ALE | accumulated local effects |
| AnMBR | anaerobic membrane bioreactor |
| ANFIS | adaptive neuro-fuzzy inference system |
| ANN | artificial neural network |
| ASM | Activated Sludge Model |
| BOD | biochemical oxygen demand |
| CHP | combined heat and power |
| COD | chemical oxygen demand |
| DL | deep learning |
| DNN | deep neural network |
| DO | dissolved oxygen |
| DT | decision tree |
| ED | Electrodialysis |
| FO | forward osmosis |
| GHG | greenhouse gas |
| HRT | hydraulic retention time |
| HTL | hydrothermal liquefaction |
| IoT | Internet of Things |
| LCA | life-cycle assessment |
| LSTM | long short-term memory network |
| MAE | mean absolute error |
| MAPE | mean absolute percentage error |
| MBR | membrane bioreactor |
| MD | membrane distillation |
| MDC | microbial desalination cell |
| MEC | microbial electrolysis cell |
| MFC | microbial fuel cell |
| ML | machine learning |
| MLP | multilayer perceptron |
| PID | proportional–integral–derivative |
| R2 | coefficient of determination |
| RF | random forest |
| RMSE | root-mean-square error |
| RSM | response surface methodology |
| SCADA | supervisory control and data acquisition |
| SCWG | supercritical water gasification |
| SHAP | SHapley Additive exPlanations |
| SVM | support vector machine |
| TMP | transmembrane pressure |
| TRL | technology readiness level |
| TSS | total suspended solids |
| VFA | volatile fatty acids |
| WWTP | wastewater treatment plant |
| XAI | explainable artificial intelligence |
| XGBoost | extreme gradient boosting |
References
- McCarty, P.L.; Bae, J.; Kim, J. Domestic Wastewater Treatment as a Net Energy Producer—Can This Be Achieved? Environ. Sci. Technol. 2011, 45, 7100–7106. [Google Scholar] [CrossRef] [Scilit] [PubMed]
- Matheri, A.N.; Mohamed, B.; Ntuli, F.; Nabadda, E.; Ngila, J.C. Sustainable Circularity and Intelligent Data-Driven Operations and Control of the Wastewater Treatment Plant. Phys. Chem. Earth Parts A/B/C 2022, 126, 103152. [Google Scholar] [CrossRef] [Scilit]
- Roy, S.; Petersen, J.F.; Mueller, S.; Kondrotaite, Z.; van Loosdrecht, M.; Wintgens, T.; Nielsen, P.H. Wastewater Biorefineries: Exploring Biological Phosphorus Removal and Integrated Recovery Solutions. Curr. Opin. Biotechnol. 2025, 92, 103266. [Google Scholar] [CrossRef] [Scilit] [PubMed]
- Xie, M.; Shon, H.K.; Gray, S.R.; Elimelech, M. Membrane-Based Processes for Wastewater Nutrient Recovery: Technology, Challenges, and Future Direction. Water Res. 2016, 89, 210–221. [Google Scholar] [CrossRef] [Scilit] [PubMed]
- Ansari, A.J.; Hai, F.I.; Price, W.E.; Drewes, J.E.; Nghiem, L.D. Forward Osmosis as a Platform for Resource Recovery from Municipal Wastewater—A Critical Assessment of the Literature. J. Membr. Sci. 2017, 529, 195–206. [Google Scholar] [CrossRef] [Scilit]
- Wang, H.-C.; Wang, Y.-Q.; Wang, X.; Yin, W.-X.; Yu, T.-C.; Xue, C.-H.; Wang, A.-J. Multimodal Machine Learning Guides Low Carbon Aeration Strategies in Urban Wastewater Treatment. Engineering 2024, 36, 51–62. [Google Scholar] [CrossRef] [Scilit]
- Alvi, M.; Batstone, D.; Mbamba, C.K.; Keymer, P.; French, T.; Ward, A.; Dwyer, J.; Cardell-Oliver, R. Deep Learning in Wastewater Treatment: A Critical Review. Water Res. 2023, 245, 120518. [Google Scholar] [CrossRef] [Scilit] [PubMed]
- Altowayti, W.A.H.; Shahir, S.; Othman, N.; Eisa, T.A.E.; Yafooz, W.M.; Al-Dhaqm, A.; Soon, C.Y.; Yahya, I.B.; Che Rahim, N.A.N.B.; Abaker, M. The Role of Conventional Methods and Artificial Intelligence in the Wastewater Treatment: A Comprehensive Review. Processes 2022, 10, 1832. [Google Scholar] [CrossRef] [Scilit]
- Sun, W.; Gao, Y.; Zhou, J.; Shah, K.J.; Sun, Y. An Overview of the Latest Developments and Potential Paths for Artificial Intelligence in Wastewater Treatment Systems. Water 2025, 17, 2432. [Google Scholar] [CrossRef] [Scilit]
- Aghdam, E.; Mohandes, S.R.; Manu, P.; Cheung, C.; Yunusa-Kaltungo, A.; Zayed, T. Predicting Quality Parameters of Wastewater Treatment Plants Using Artificial Intelligence Techniques. J. Clean. Prod. 2023, 405, 137019. [Google Scholar] [CrossRef] [Scilit]
- Liu, C.; Li, F.; Zhang, P.; Balasubramanian, P. Augmented Machine Learning with Limited Data for Hydrogen Yield Prediction in Wastewater Dark Fermentation. npj Clean Water 2025, 8, 101. [Google Scholar] [CrossRef] [Scilit]
- Shomope, I.; Tawalbeh, M.; Al-Othman, A.; Almomani, F. Predicting Biohydrogen Production from Dark Fermentation of Organic Waste Biomass Using Multilayer Perceptron Artificial Neural Network (MLP–ANN). Comput. Chem. Eng. 2025, 192, 108900. [Google Scholar] [CrossRef] [Scilit]
- Muthukumar, P.; Thanikanti, S.B.; Flora, G.; Anand, R.; Aljafari, B. Advanced AI-Enabled Technologies for Sustainable Biohydrogen Production and Environmental Stewardship. Int. J. Hydrogen Energy 2025, 148, 150045. [Google Scholar] [CrossRef] [Scilit]
- Nagpal, M.; Siddique, M.A.; Sharma, K.; Sharma, N.; Mittal, A. Optimizing Wastewater Treatment through Artificial Intelligence: Recent Advances and Future Prospects. Water Sci. Technol. 2024, 90, 731–757. [Google Scholar] [CrossRef] [Scilit] [PubMed]
- Zamfir, F.-S.; Carbureanu, M.; Mihalache, S.F. Application of Machine Learning Models in Optimizing Wastewater Treatment Processes: A Review. Appl. Sci. 2025, 15, 8360. [Google Scholar] [CrossRef] [Scilit]
- Niu, C.; Li, X.; Dai, R.; Wang, Z. Artificial Intelligence-Incorporated Membrane Fouling Prediction for Membrane-Based Processes in the Past 20 Years: A Critical Review. Water Res. 2022, 216, 118299. [Google Scholar] [CrossRef] [Scilit] [PubMed]
- Abuwatfa, W.H.; Alsawaftah, N.; Darwish, N.; Pitt, W.G.; Husseini, G.A. A Review on Membrane Fouling Prediction Using Artificial Neural Networks (ANNs). Membranes 2023, 13, 685. [Google Scholar] [CrossRef] [Scilit] [PubMed]
- Shi, Y.; Wang, Z.; Du, X.; Gong, B.; Jegatheesan, V.; Haq, I.U. Recent Advances in the Prediction of Fouling in Membrane Bioreactors. Membranes 2021, 11, 381. [Google Scholar] [CrossRef] [Scilit] [PubMed]
- Newhart, K.B.; Holloway, R.W.; Hering, A.S.; Cath, T.Y. Data-Driven Performance Analyses of Wastewater Treatment Plants: A Review. Water Res. 2019, 157, 498–513. [Google Scholar] [CrossRef] [Scilit] [PubMed]
- Zhu, J.-J.; Yang, M.; Ren, Z.J. Machine Learning in Environmental Research: Common Pitfalls and Best Practices. Environ. Sci. Technol. 2023, 57, 17671–17689. [Google Scholar] [CrossRef] [Scilit] [PubMed]
- Drewnowski, J.; Remiszewska-Skwarek, A.; Duda, S.; Łagód, G. Aeration Process in Bioreactors as the Main Energy Consumer in a Wastewater Treatment Plant. Review of Solutions and Methods of Process Optimization. Processes 2019, 7, 311. [Google Scholar] [CrossRef] [Scilit]
- Hwangbo, S.; Al, R.; Chen, X.; Sin, G. Integrated Model for Understanding N2O Emissions from Wastewater Treatment Plants: A Deep Learning Approach. Environ. Sci. Technol. 2021, 55, 2143–2151. [Google Scholar] [CrossRef] [Scilit] [PubMed]
- Zhang, D.; Liu, J.; Wang, H.; Wang, Y. Advancing Carbon-Neutral Wastewater Treatment: Artificial Intelligence-Driven Strategies for Emission Mitigation and Process Optimization. Environ. Res. 2026, 290, 123449. [Google Scholar] [CrossRef] [Scilit] [PubMed]
- Xylem Inc. Wastewater Treatment Plant Uses AI to Reduce Aeration Energy Use by 30 Percent (Case Study: EWE WASSER, Cuxhaven, Germany). 2021. Available online: https://www.xylem.com/en-us/making-waves/water-utilities-news/wastewater-treatment-plant-uses-ai-to-reduce-aeration-energy-use-by-30-percent/ (accessed on 9 October 2026).
- Nair, A.M. Integration of Internet of Things with Artificial Intelligence and Biological Wastewater Treatment Plants. In Digitalization of Biological Wastewater Treatment Plants; Elsevier: Amsterdam, The Netherlands, 2026. [Google Scholar]
- Gulshin, I.; Kuzina, O. Optimization of Wastewater Treatment through Machine Learning-Enhanced Supervisory Control and Data Acquisition: A Case Study of Granular Sludge Process Stability and Predictive Control. Automation 2025, 6, 2. [Google Scholar] [CrossRef] [Scilit]
- Krzeminski, P.; Leverette, L.; Malamis, S.; Katsou, E. Membrane Bioreactors—A Review on Recent Developments in Energy Reduction, Fouling Control, Novel Configurations, LCA and Market Prospects. J. Membr. Sci. 2017, 527, 207–227. [Google Scholar] [CrossRef] [Scilit]
- Kovacs, D.J.; Li, Z.; Baetz, B.W.; Hong, Y.; Donnaz, S.; Zhao, X.; Zhou, P.; Ding, H.; Dong, Q. Membrane Fouling Prediction and Uncertainty Analysis Using Machine Learning: A Wastewater Treatment Plant Case Study. J. Membr. Sci. 2022, 660, 120817. [Google Scholar] [CrossRef] [Scilit]
- Zhu, Y.; Wang, Y.; Zhu, E.; Ma, Z.; Wang, H.; Chen, C.; Guan, J.; Waite, T.D. Predicting Membrane Fouling of Submerged Membrane Bioreactor Wastewater Treatment Plants Using Machine Learning. Environ. Sci. Technol. 2025, 59, 10010–10021. [Google Scholar] [CrossRef] [Scilit] [PubMed]
- Cámara Nebreda, J.M.; Díez Blanco, V.; Ramos Rodríguez, C. Neural Network Modelling and Prediction of an Anaerobic Filter Membrane Bioreactor. Eng. Appl. Artif. Intell. 2023, 118, 105643. [Google Scholar] [CrossRef] [Scilit]
- Taheri, E.; Amin, M.M.; Fatehizadeh, A.; Rezakazemi, M.; Aminabhavi, T.M. Artificial Intelligence Modeling to Predict Transmembrane Pressure in Anaerobic Membrane Bioreactor-Sequencing Batch Reactor during Biohydrogen Production. J. Environ. Manag. 2021, 292, 112759. [Google Scholar] [CrossRef] [Scilit] [PubMed]
- Torfs, E.; Nicolaï, N.; Daneshgar, S.; Copp, J.B.; Haimi, H.; Ikumi, D.; Johnson, B.; Plosz, B.B.; Snowling, S.; Townley, L.R.; et al. The Transition of WRRF Models to Digital Twin Applications. Water Sci. Technol. 2022, 85, 2840–2853. [Google Scholar] [CrossRef] [Scilit] [PubMed]
- Darestani, M.; Haigh, V.; Couperthwaite, S.J.; Millar, G.J.; Nghiem, L.D. Hollow Fibre Membrane Contactors for Ammonia Recovery: Current Status and Future Developments. J. Environ. Chem. Eng. 2017, 5, 1349–1359. [Google Scholar] [CrossRef] [Scilit]
- Ward, A.J.; Arola, K.; Thompson Brewster, E.; Mehta, C.M.; Batstone, D.J. Nutrient Recovery from Wastewater through Pilot Scale Electrodialysis. Water Res. 2018, 135, 57–65. [Google Scholar] [CrossRef] [Scilit] [PubMed]
- Jang, Y.; Choi, Y.; Lee, W. Parametric Investigation and Prediction of Ammonia Recovery Performance of the Liquid–Liquid Membrane Contactor. J. Environ. Chem. Eng. 2025, 13, 117736. [Google Scholar] [CrossRef] [Scilit]
- Thompson Brewster, E.; Ward, A.J.; Mehta, C.M.; Radjenovic, J.; Batstone, D.J. Predicting Scale Formation during Electrodialytic Nutrient Recovery. Water Res. 2017, 110, 202–210. [Google Scholar] [CrossRef] [Scilit] [PubMed]
- Bakonyi, P.; Nemestóthy, N.; Bélafi-Bakó, K. Biohydrogen Purification by Membranes: An Overview on the Operational Conditions Affecting the Performance of Non-Porous, Polymeric and Ionic Liquid Based Gas Separation Membranes. Int. J. Hydrogen Energy 2013, 38, 9673–9687. [Google Scholar] [CrossRef] [Scilit]
- Barnett, J.W.; Bilchak, C.R.; Wang, Y.; Benicewicz, B.C.; Murdock, L.A.; Bereau, T.; Kumar, S.K. Designing Exceptional Gas-Separation Polymer Membranes Using Machine Learning. Sci. Adv. 2020, 6, eaaz4301. [Google Scholar] [CrossRef] [Scilit] [PubMed]
- Peeva, G. Phosphorus Recovery from Wastewater in the Circular Economy: Focus on Struvite Crystallization. Biomass 2026, 6, 32. [Google Scholar] [CrossRef] [Scilit]
- Nageshwari, K.; Senthamizhan, V.; Balasubramanian, P. Sustaining Struvite Production from Wastewater through Machine Learning Based Modelling and Process Validation. Sustain. Energy Technol. Assess. 2022, 53, 102608. [Google Scholar] [CrossRef] [Scilit]
- Zhang, X.; Sun, S.; Han, X.; Shu, S. Optimizing Struvite Recovery from Wastewater Treatment: Insights from Machine Learning Models. J. Water Process Eng. 2025, 77, 108520. [Google Scholar] [CrossRef] [Scilit]
- Jung, M.; Wang, Y.; Ilavsky, J.; Tang, Y.J.; Jun, Y.-S. Molecular Insights into Novel Struvite–Hydrogel Composites for Simultaneous Ammonia and Phosphate Removal. Environ. Sci. Technol. 2025, 59, 11286–11297. [Google Scholar] [CrossRef] [Scilit] [PubMed]
- Fathy, A.; Rezk, H.; Yousri, D.; Alharbi, A.G.; Alshammari, S.; Hassan, Y.B. Maximizing Bio-Hydrogen Production from an Innovative Microbial Electrolysis Cell Using Artificial Intelligence. Sustainability 2023, 15, 3730. [Google Scholar] [CrossRef] [Scilit]
- Kadier, A.; Jain, P.; Lai, B.; Kalil, M.S.; Kondaveeti, S.; Alabbosh, K.F.S.; Abu-Reesh, I.M.; Mohanakrishna, G. Biorefinery Perspectives of Microbial Electrolysis Cells (MECs) for Hydrogen and Valuable Chemicals Production through Wastewater Treatment. Biofuel Res. J. 2020, 7, 1128–1142. [Google Scholar] [CrossRef] [Scilit]
- Ghimire, A.; Frunzo, L.; Pirozzi, F.; Trably, E.; Escudie, R.; Lens, P.N.L.; Esposito, G. A Review on Dark Fermentative Biohydrogen Production from Organic Biomass: Process Parameters and Use of By-Products. Appl. Energy 2015, 144, 73–95. [Google Scholar] [CrossRef] [Scilit]
- Mahata, C.; Ray, S.; Das, D. Optimization of Dark Fermentative Hydrogen Production from Organic Wastes Using Acidogenic Mixed Consortia. Energy Convers. Manag. 2020, 219, 113047. [Google Scholar] [CrossRef] [Scilit]
- Ghasemian, M.; Taheri, E.; Fatehizadeh, A.; Amin, M.M. Biological Hydrogen Production from Synthetic Wastewater by an Anaerobic Migrating Blanket Reactor: Artificial Neural Network (ANN) Modeling. Environ. Health Eng. Manag. J. 2019, 6, 269–276. [Google Scholar] [CrossRef] [Scilit]
- Yogeswari, K.; Dharmalingam, K.; Mullai, P. Implementation of Artificial Neural Network Model for Continuous Hydrogen Production Using Confectionery Wastewater. TERI Inf. Dig. Energy Environ. 2020, 19, 30. [Google Scholar]
- Mougari, N.E.; Ghersi, D.E.; Iachachene, F.; Largeau, J.F.; Arici, M. A Generalized Hybrid Machine Learning Framework for Predicting Biohydrogen Production via Dark Fermentation of Organic Wastes. Bioprocess Biosyst. Eng. 2026, 49, 351–372. [Google Scholar] [CrossRef] [Scilit] [PubMed]
- Yildirim, O.; Ozkaya, B. Prediction of Biogas Production of Industrial Scale Anaerobic Digestion Plant by Machine Learning Algorithms. Chemosphere 2023, 335, 138976. [Google Scholar] [CrossRef] [Scilit] [PubMed]
- Zhuang, Z.; Liu, X.; Jin, J.; Li, Z.; Liu, Y.; Tavares, A.; Li, D. Prediction, Uncertainty Quantification, and ANN-Assisted Operation of Anaerobic Digestion Guided by Entropy Using Machine Learning. Entropy 2025, 27, 1233. [Google Scholar] [CrossRef] [Scilit] [PubMed]
- Dange, P.; Pandit, S.; Jadhav, D.; Shanmugam, P.; Gupta, P.K.; Kumar, S.; Kumar, M.; Yang, Y.-H.; Bhatia, S.K. Recent Developments in Microbial Electrolysis Cell-Based Biohydrogen Production Utilizing Wastewater as a Feedstock. Sustainability 2021, 13, 8796. [Google Scholar] [CrossRef] [Scilit]
- Rezk, H.; Sayed, E.T. Increasing Bio-Hydrogen Production from Microbial Electrolysis Cell Using Artificial Gorilla Troops Optimization. Front. Energy Res. 2024, 12, 1419785. [Google Scholar] [CrossRef] [Scilit]
- Zhang, J.; Yuan, H.; Abu-Reesh, I.M.; He, Z.; Yuan, C. Life Cycle Environmental Impact Comparison of Bioelectrochemical Systems for Wastewater Treatment. Procedia CIRP 2019, 80, 382–388. [Google Scholar] [CrossRef] [Scilit]
- Zhao, S.; Li, J.; Chen, C.; Yan, B.; Tao, J.; Chen, G. Interpretable Machine Learning for Predicting and Evaluating Hydrogen Production via Supercritical Water Gasification of Biomass. J. Clean. Prod. 2021, 316, 128244. [Google Scholar] [CrossRef] [Scilit]
- Khandelwal, K.; Dalai, A.K. Prediction of Individual Gas Yields of Supercritical Water Gasification of Lignocellulosic Biomass by Machine Learning Models. Molecules 2024, 29, 2337. [Google Scholar] [CrossRef] [Scilit] [PubMed]
- Guirguis, P.M.; Savage, P.E. General Component Additivity, Reaction Engineering, and Machine Learning Models for Hydrothermal Liquefaction. RSC Sustain. 2025, 3, 1788–1799, Correction in RSC Sustain. 2026, 4, 1113. https://doi.org/10.1039/d5su90072g. [Google Scholar] [CrossRef] [Scilit]
- Li, Y.; Gupta, R.; You, S. Machine Learning Assisted Prediction of Biochar Yield and Composition via Pyrolysis of Biomass. Bioresour. Technol. 2022, 359, 127511. [Google Scholar] [CrossRef] [Scilit] [PubMed]
- Deliktaş, B.; Tariq, A.; Kurt, G.; Uygur, A. Developing a Vertical Federated Machine Learning Framework for Predicting Energy Consumption in Wastewater Treatment Plants: A Case Study of Melbourne. Int. J. Environ. Res. 2026, 20, 92. [Google Scholar] [CrossRef] [Scilit]
- Garrido-Baserba, M.; Corominas, L.; Cortés, U.; Rosso, D.; Poch, M. The Fourth-Revolution in the Water Sector Encounters the Digital Revolution. Environ. Sci. Technol. 2020, 54, 4698–4705. [Google Scholar] [CrossRef] [Scilit] [PubMed]
- Roberts, D.R.; Bahn, V.; Ciuti, S.; Boyce, M.S.; Elith, J.; Guillera-Arroita, G.; Hauenstein, S.; Lahoz-Monfort, J.J.; Schröder, B.; Thuiller, W.; et al. Cross-Validation Strategies for Data with Temporal, Spatial, Hierarchical, or Phylogenetic Structure. Ecography 2017, 40, 913–929. [Google Scholar] [CrossRef] [Scilit]
- Kapoor, S.; Narayanan, A. Leakage and the Reproducibility Crisis in Machine-Learning-Based Science. Patterns 2023, 4, 100804. [Google Scholar] [CrossRef] [Scilit] [PubMed]
- Lundberg, S.M.; Lee, S.-I. A Unified Approach to Interpreting Model Predictions. In Advances in Neural Information Processing Systems 30 (NeurIPS 2017); Curran Associates: Red Hook, NY, USA, 2017; pp. 4765–4774. [Google Scholar]
- Apley, D.W.; Zhu, J. Visualizing the Effects of Predictor Variables in Black Box Supervised Learning Models. J. R. Stat. Soc. Ser. B Stat. Methodol. 2020, 82, 1059–1086. [Google Scholar] [CrossRef] [Scilit]
- Hvala, N.; Kocijan, J. Design of a Hybrid Mechanistic/Gaussian Process Model to Predict Full-Scale Wastewater Treatment Plant Effluent. Comput. Chem. Eng. 2020, 140, 106934. [Google Scholar] [CrossRef] [Scilit]
- Quaghebeur, W.; Torfs, E.; De Baets, B.; Nopens, I. Hybrid Differential Equations: Integrating Mechanistic and Data-Driven Techniques for Modelling of Water Systems. Water Res. 2022, 213, 118166. [Google Scholar] [CrossRef] [Scilit] [PubMed]
- Schneider, M.Y.; Quaghebeur, W.; Borzooei, S.; Froemelt, A.; Li, F.; Saagi, R.; Wade, M.J.; Zhu, J.-J.; Torfs, E. Hybrid Modelling of Water Resource Recovery Facilities: Status and Opportunities. Water Sci. Technol. 2022, 85, 2503–2524. [Google Scholar] [CrossRef] [Scilit] [PubMed]
- McMahan, B.; Moore, E.; Ramage, D.; Hampson, S.; Agüera y Arcas, B. Communication-Efficient Learning of Deep Networks from Decentralized Data. In Proceedings of the 20th International Conference on Artificial Intelligence and Statistics (AISTATS), Fort Lauderdale, FL, USA, 20–22 April 2017; PMLR: Fort Lauderdale, FL, USA, 2017; Volume 54, pp. 1273–1282. [Google Scholar]
- Gernaey, K.V.; Jeppsson, U.; Vanrolleghem, P.A.; Copp, J.B. Benchmarking of Control Strategies for Wastewater Treatment Plants; Scientific and Technical Report No. 23; IWA Publishing: London, UK, 2014. [Google Scholar]
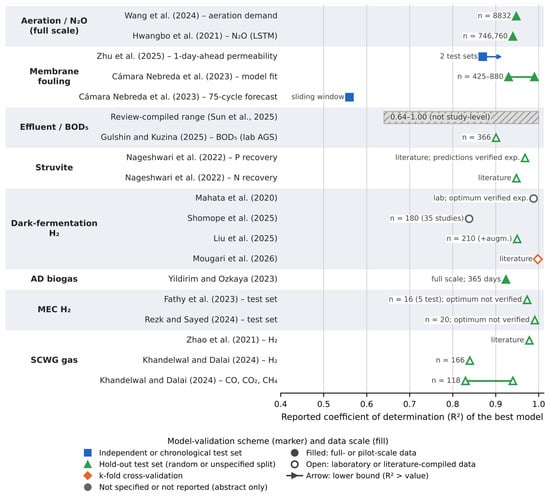
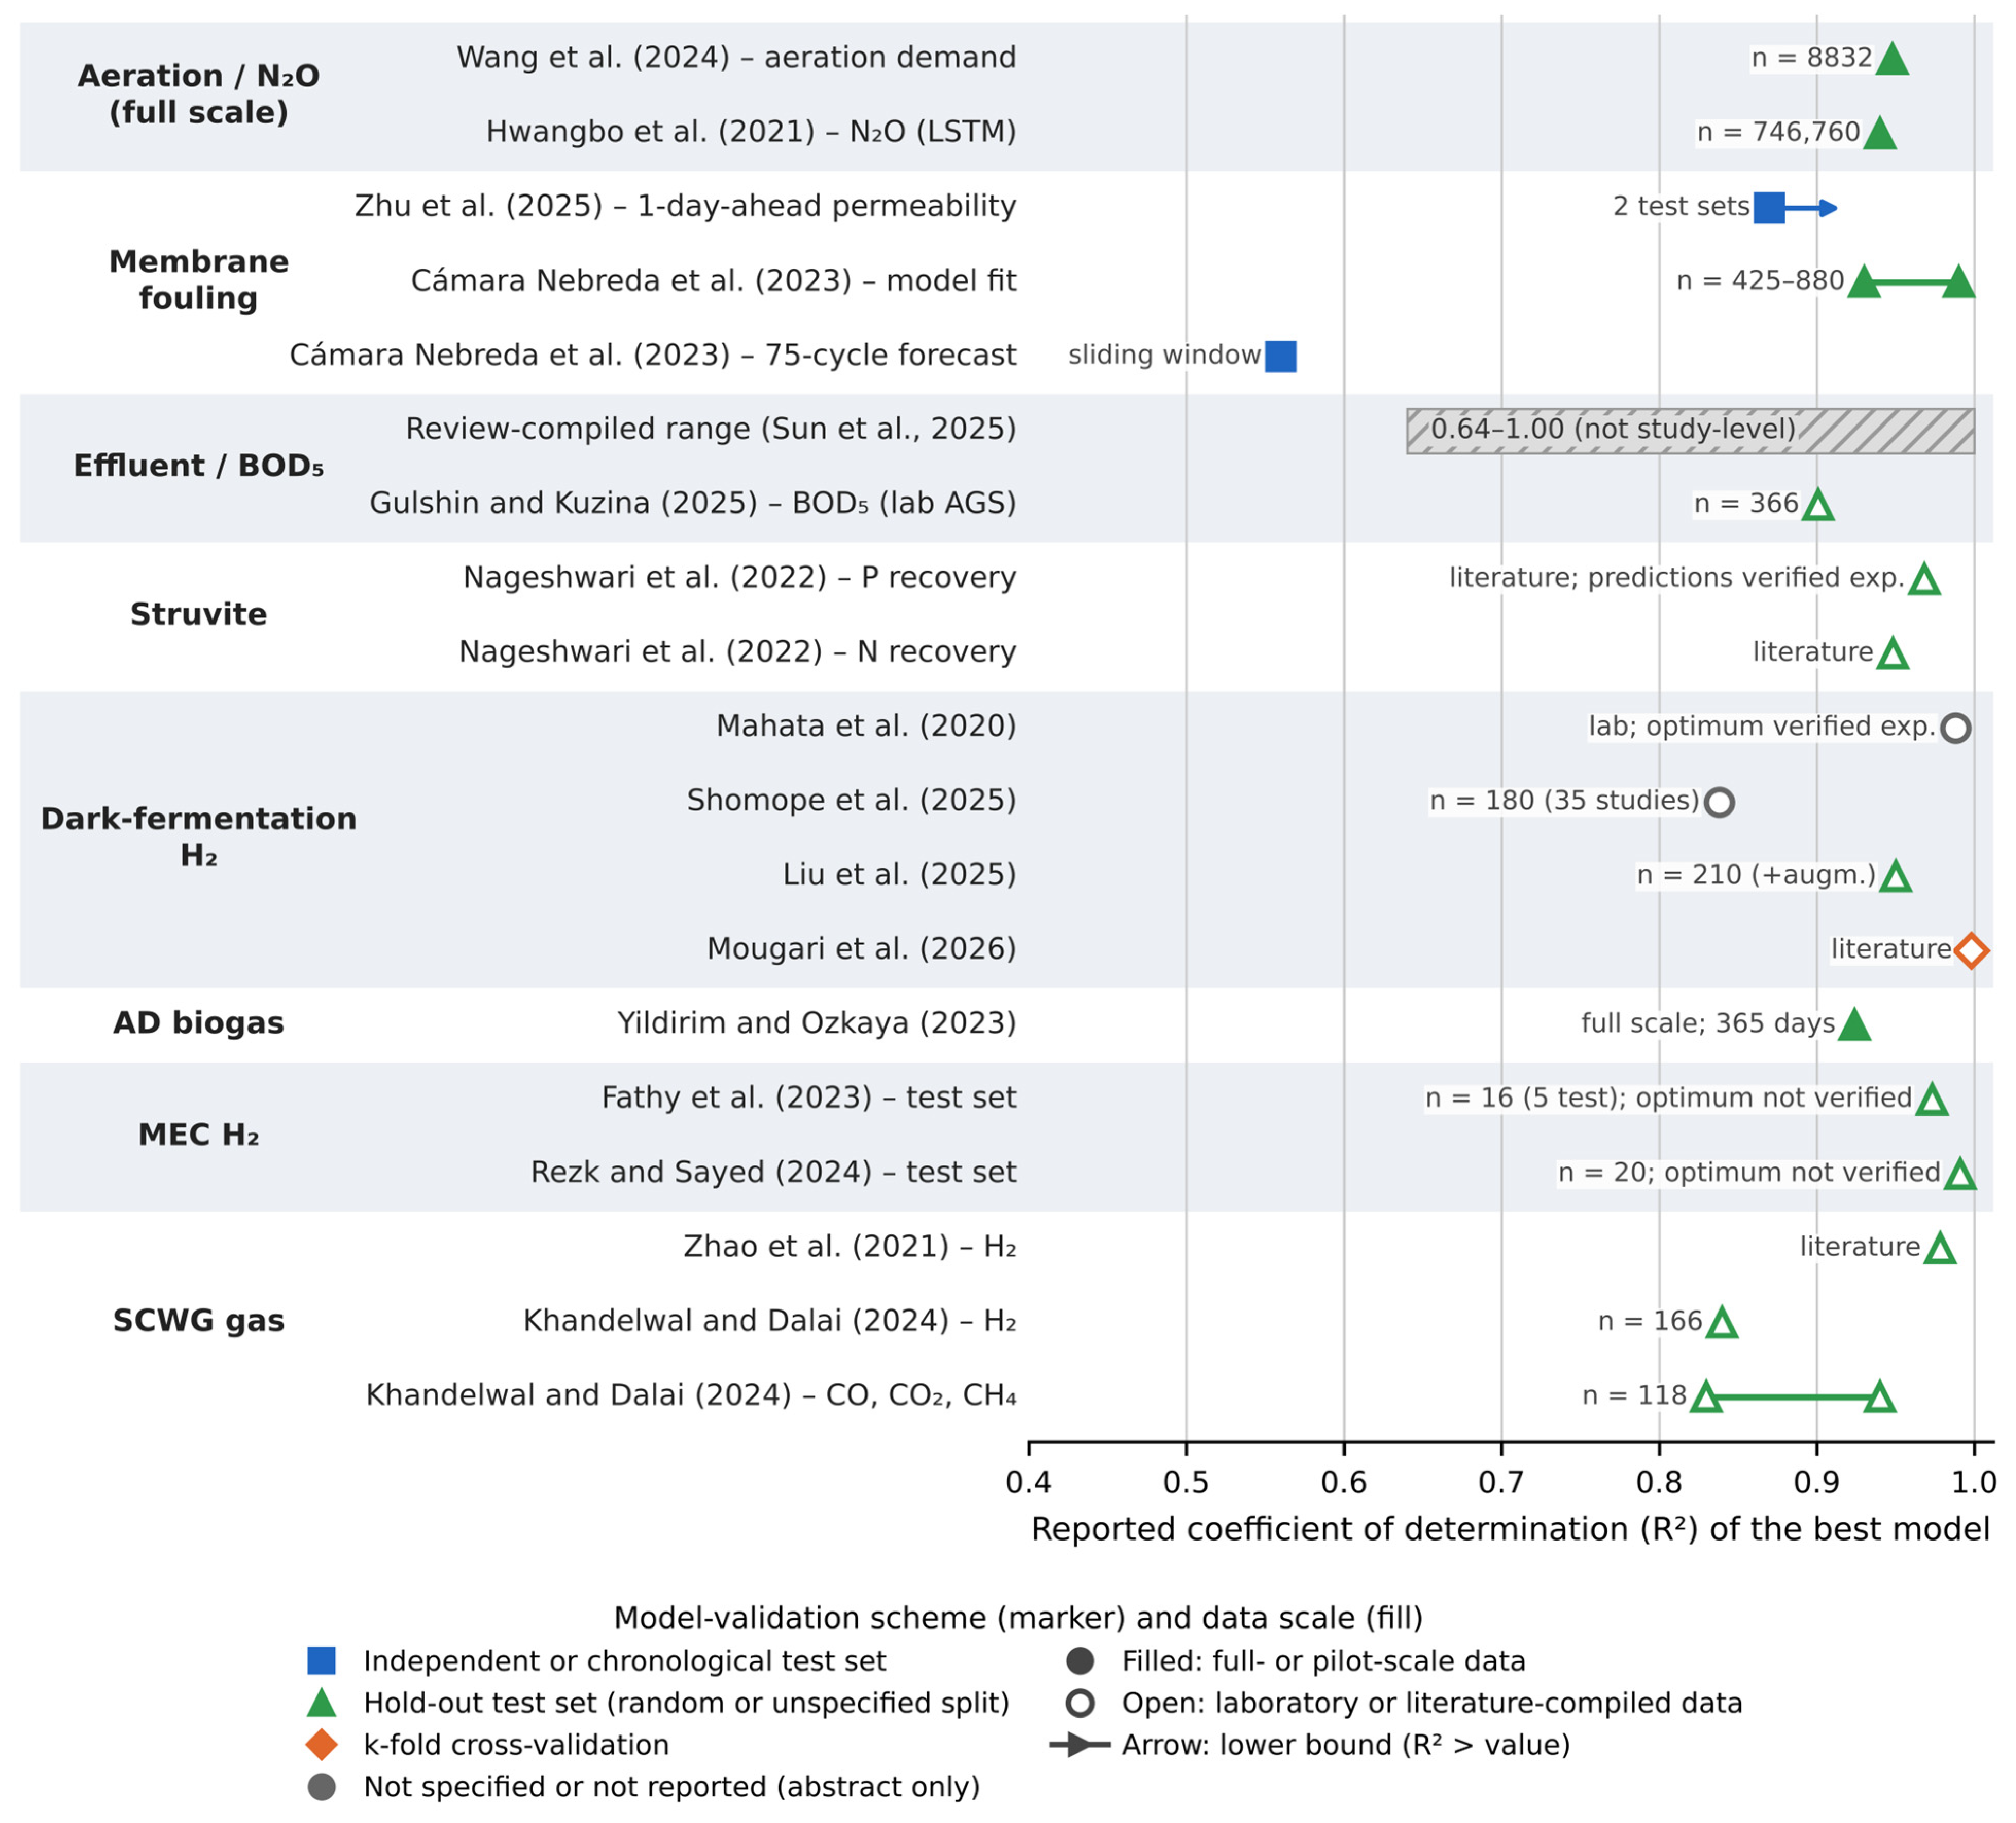
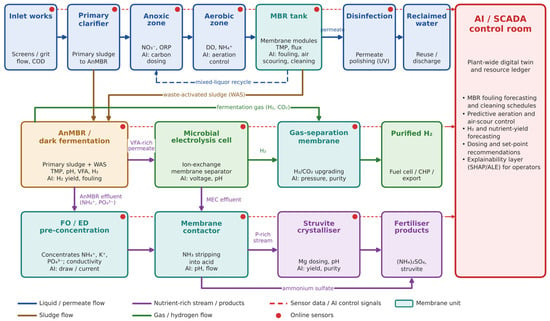
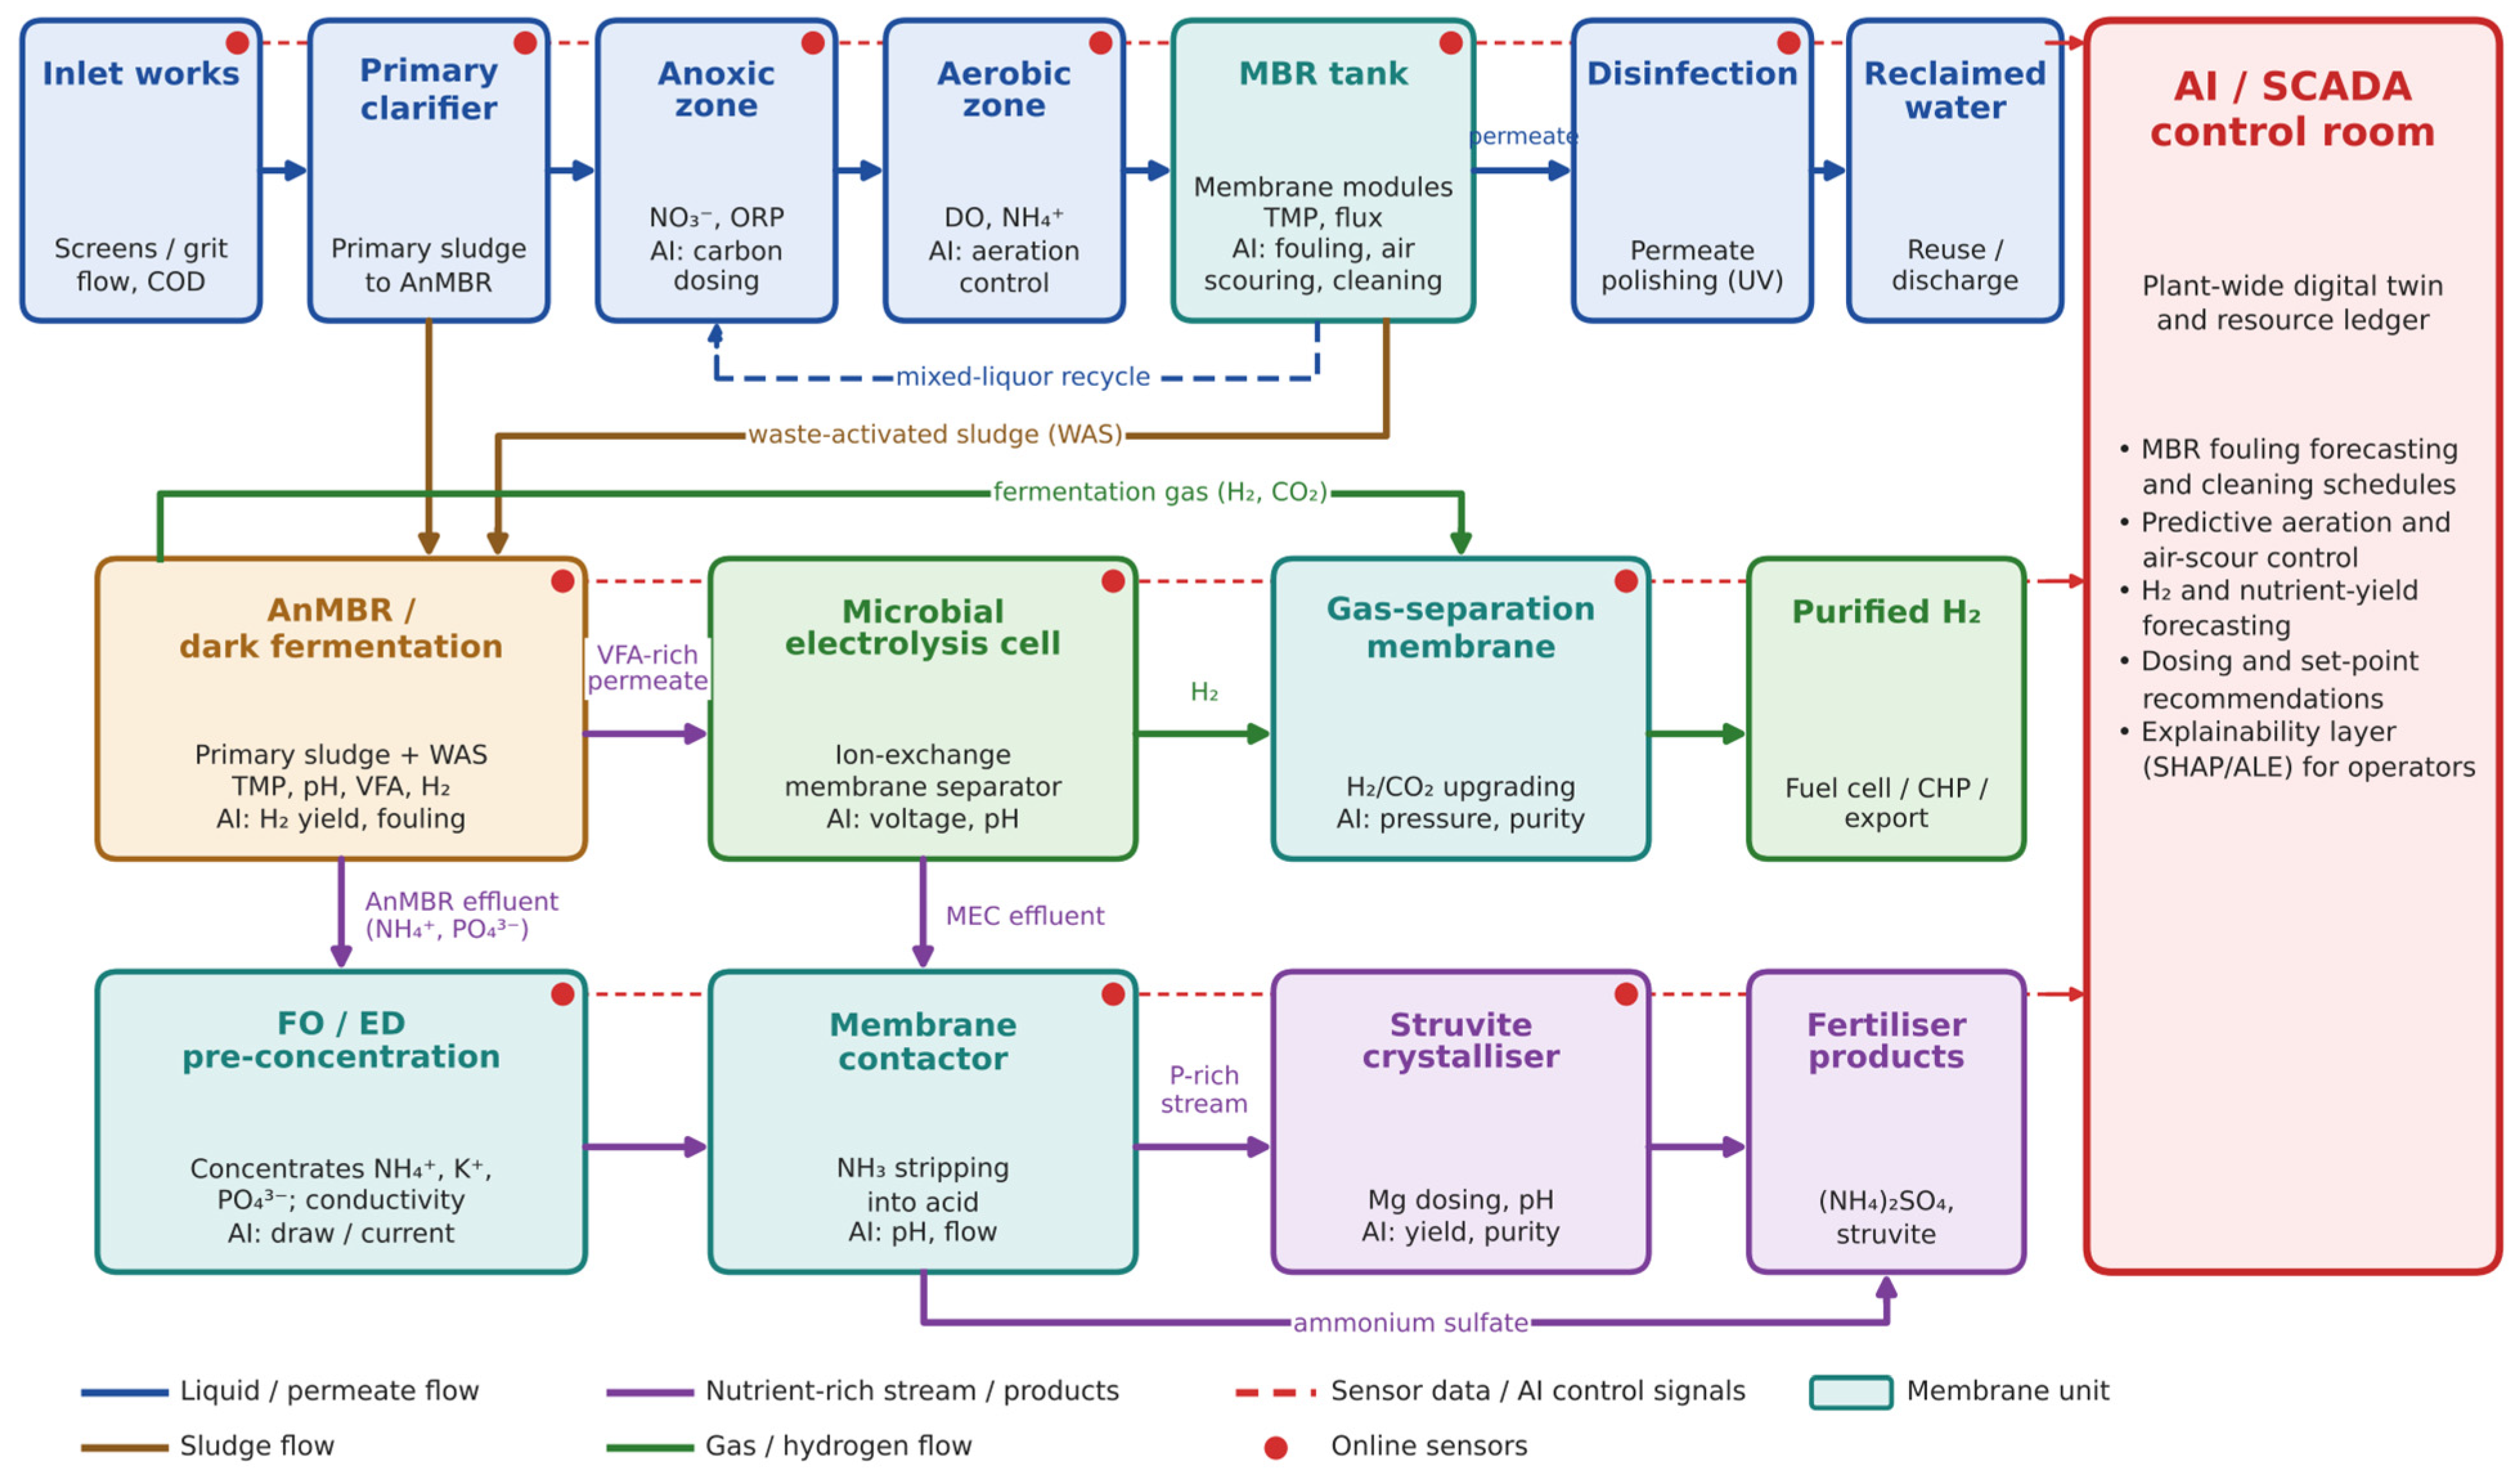
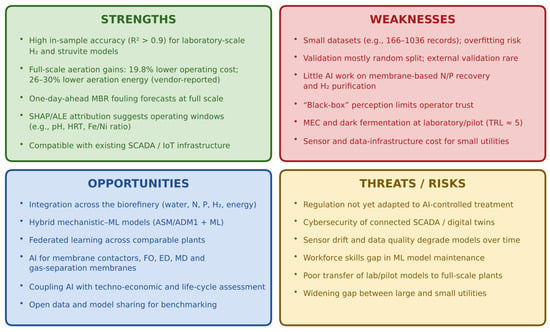
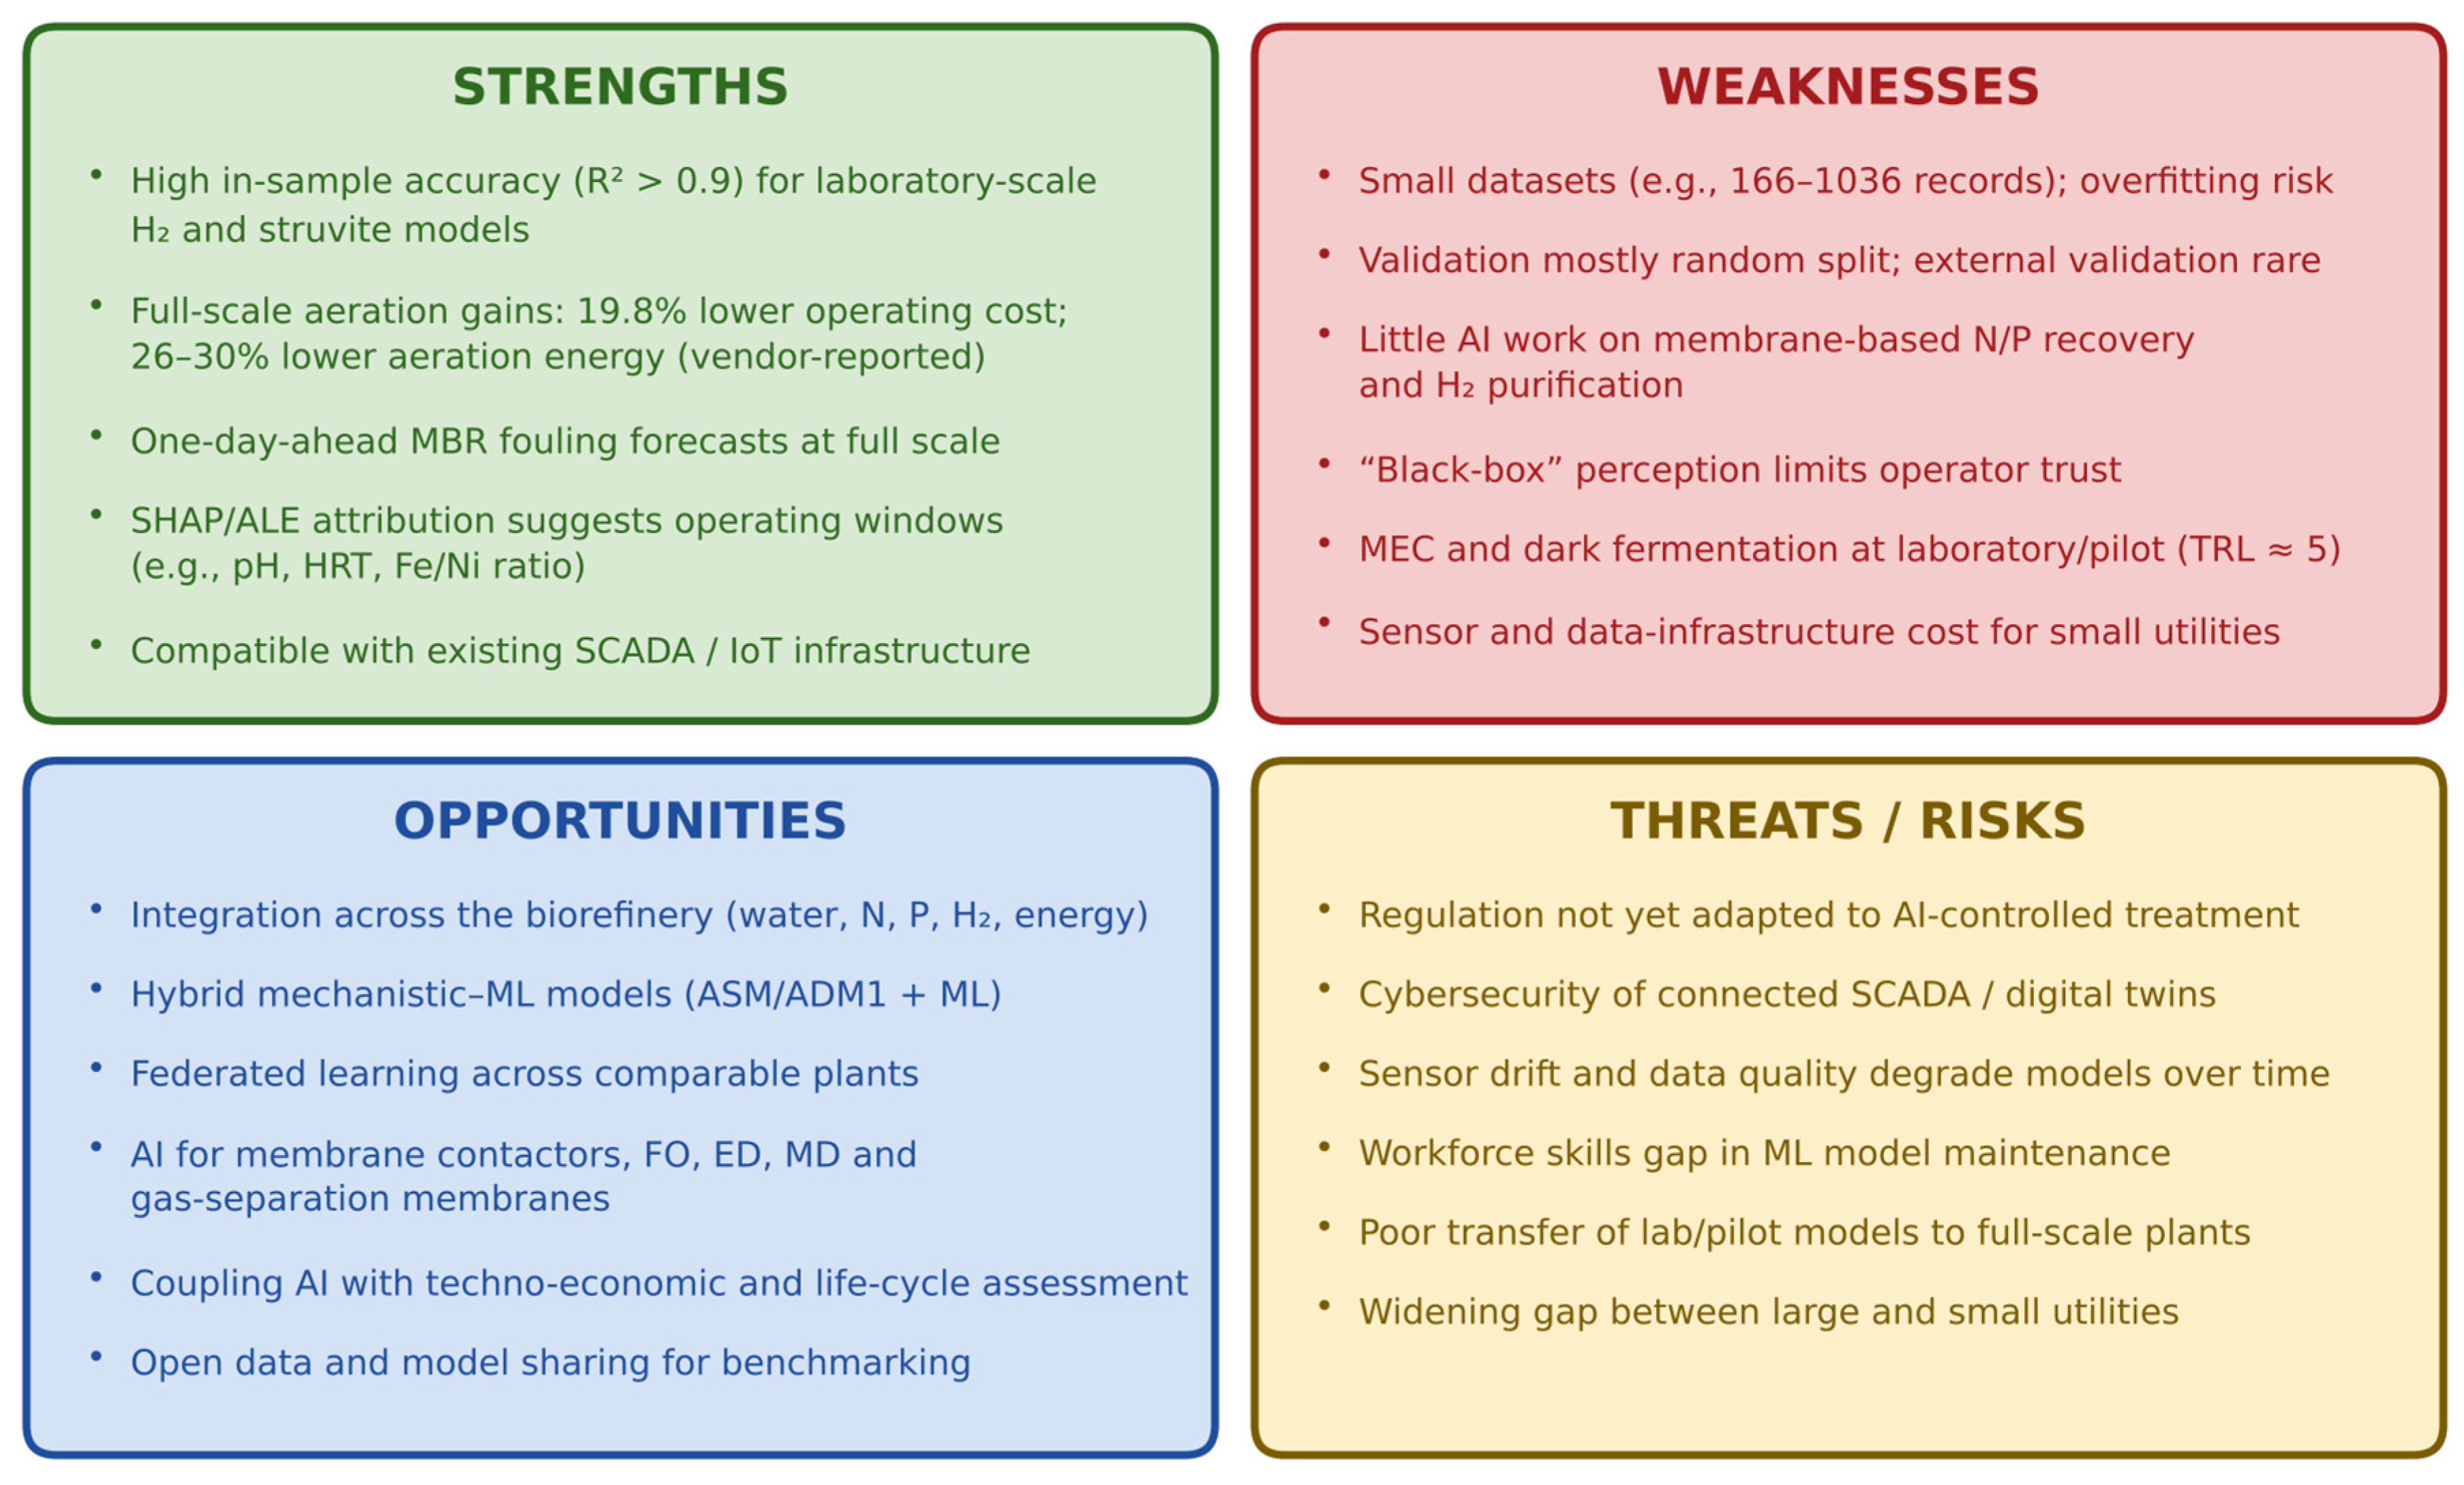
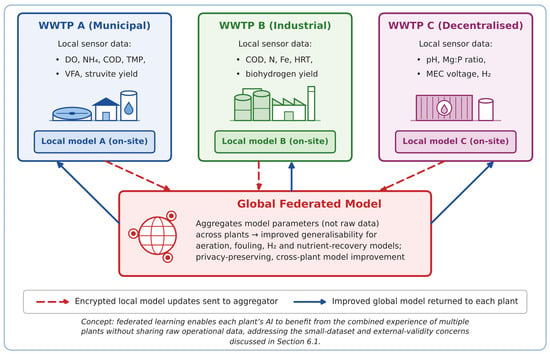
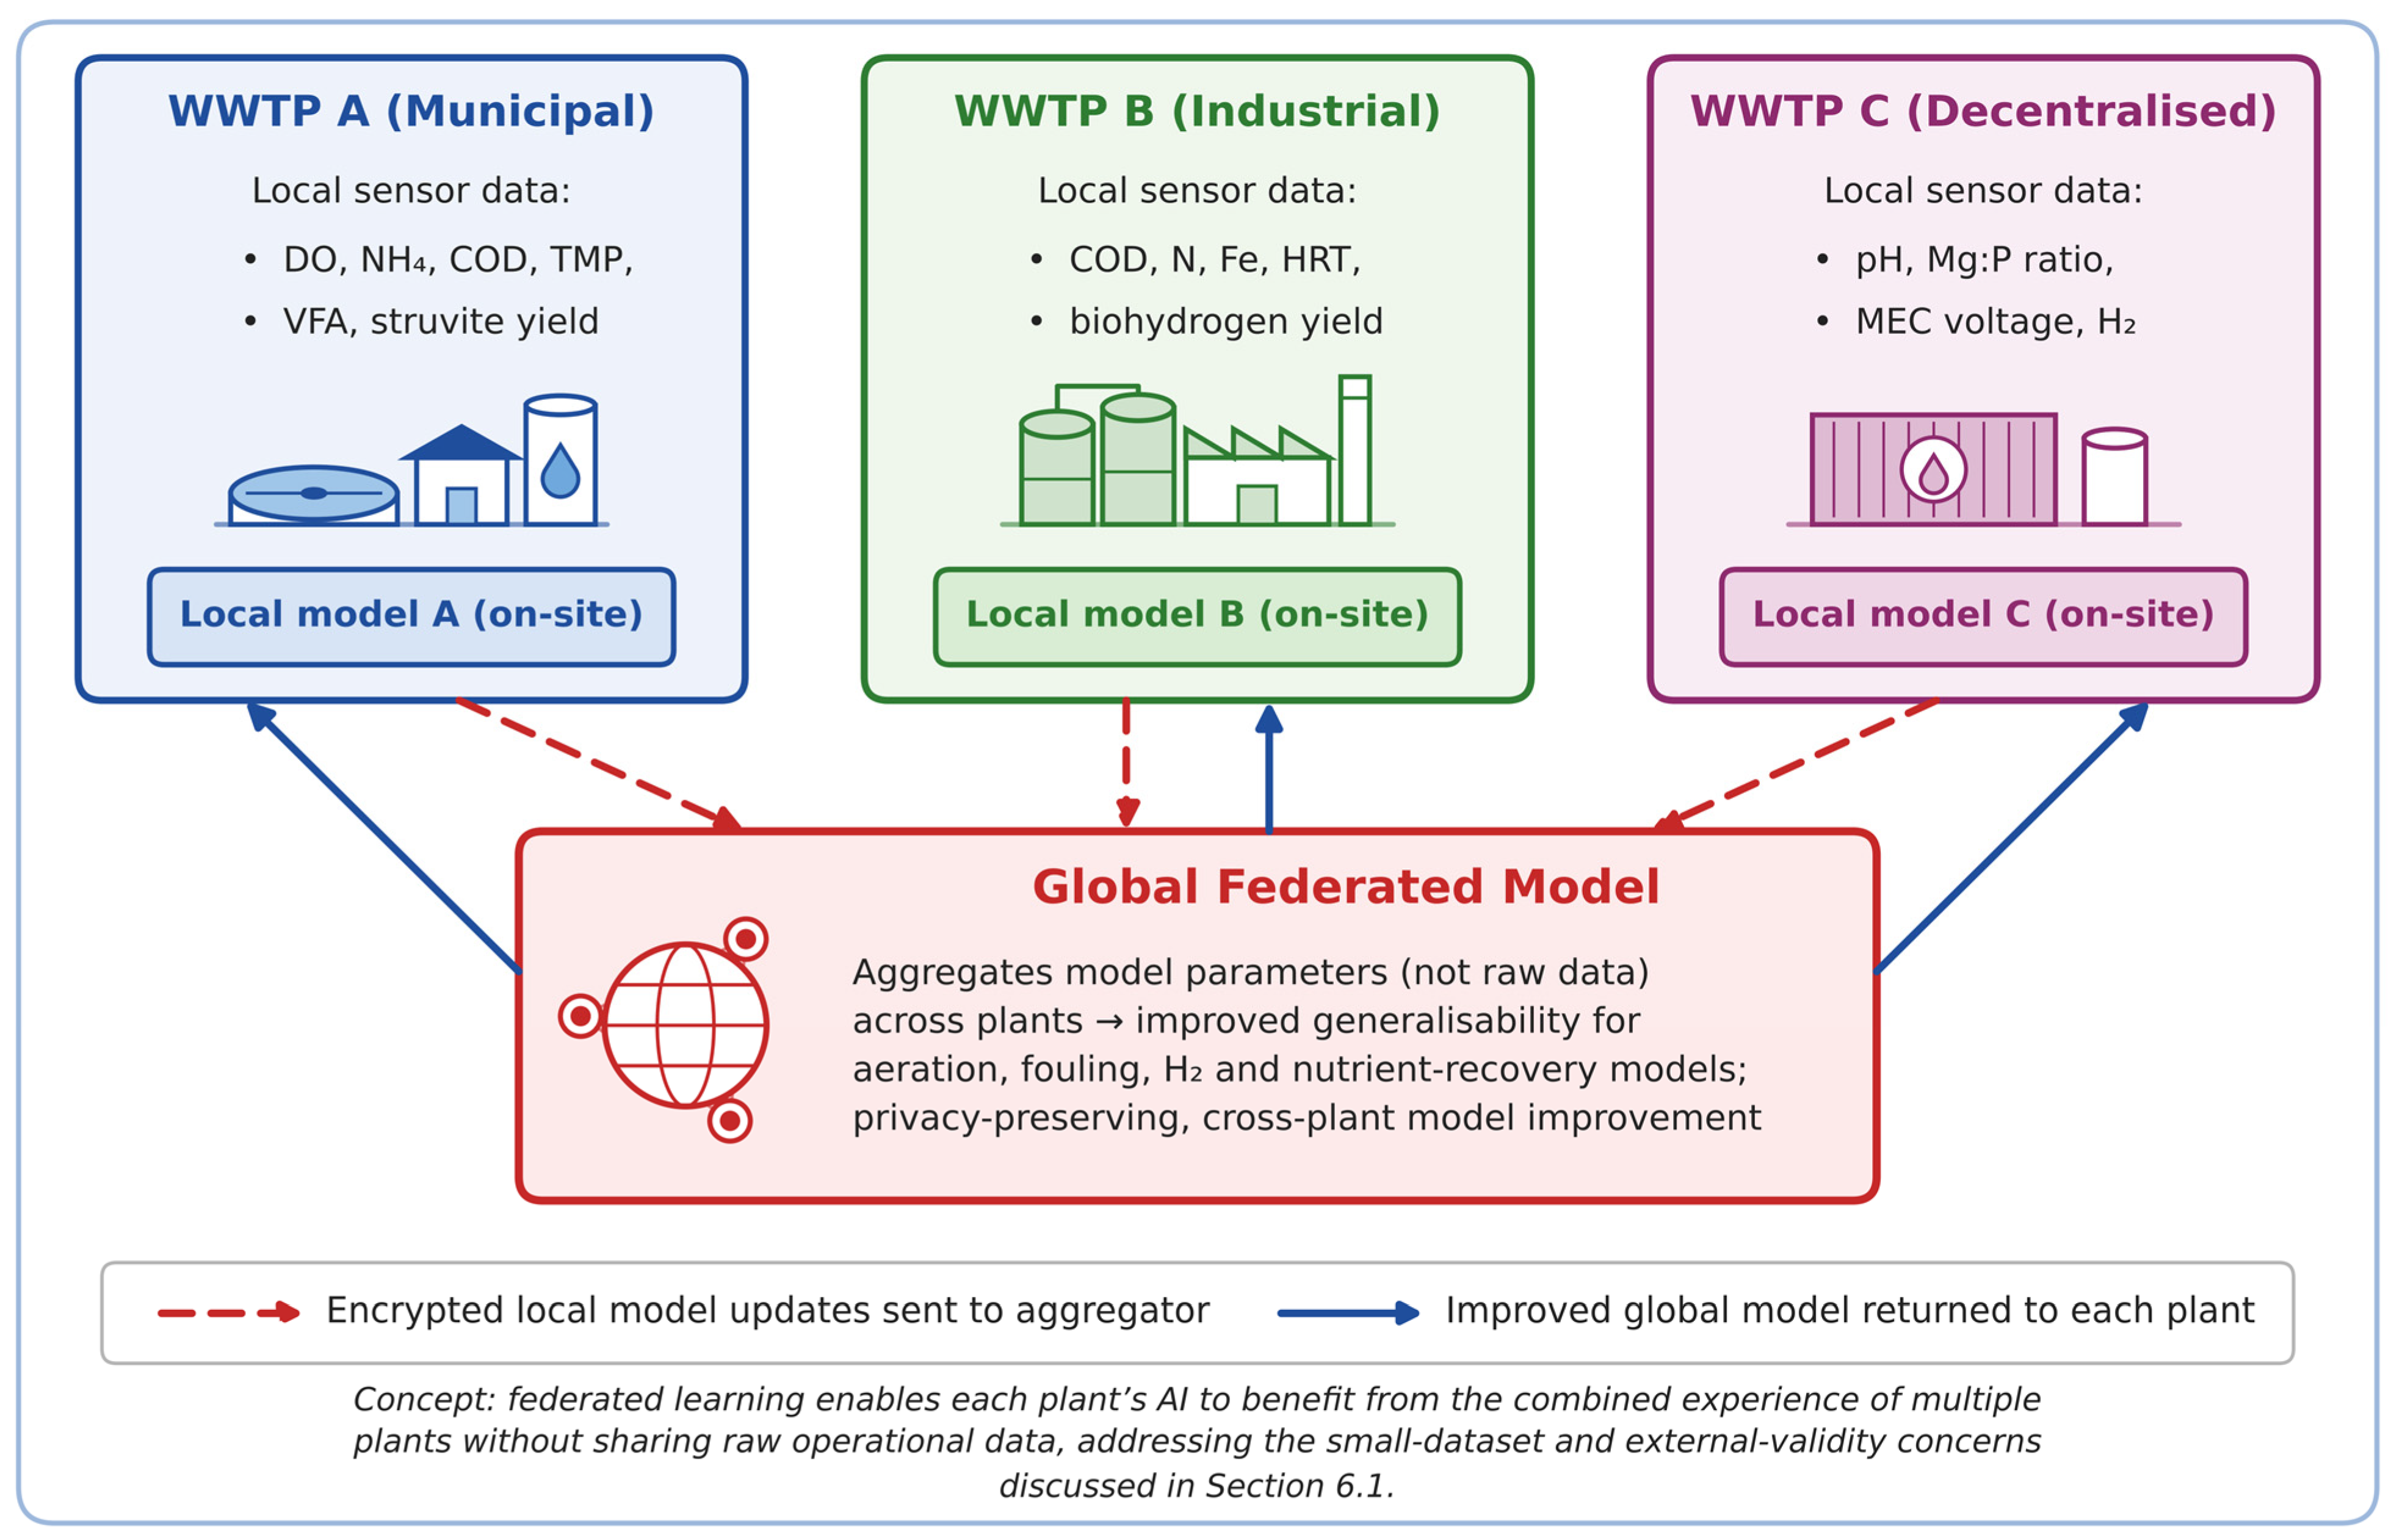
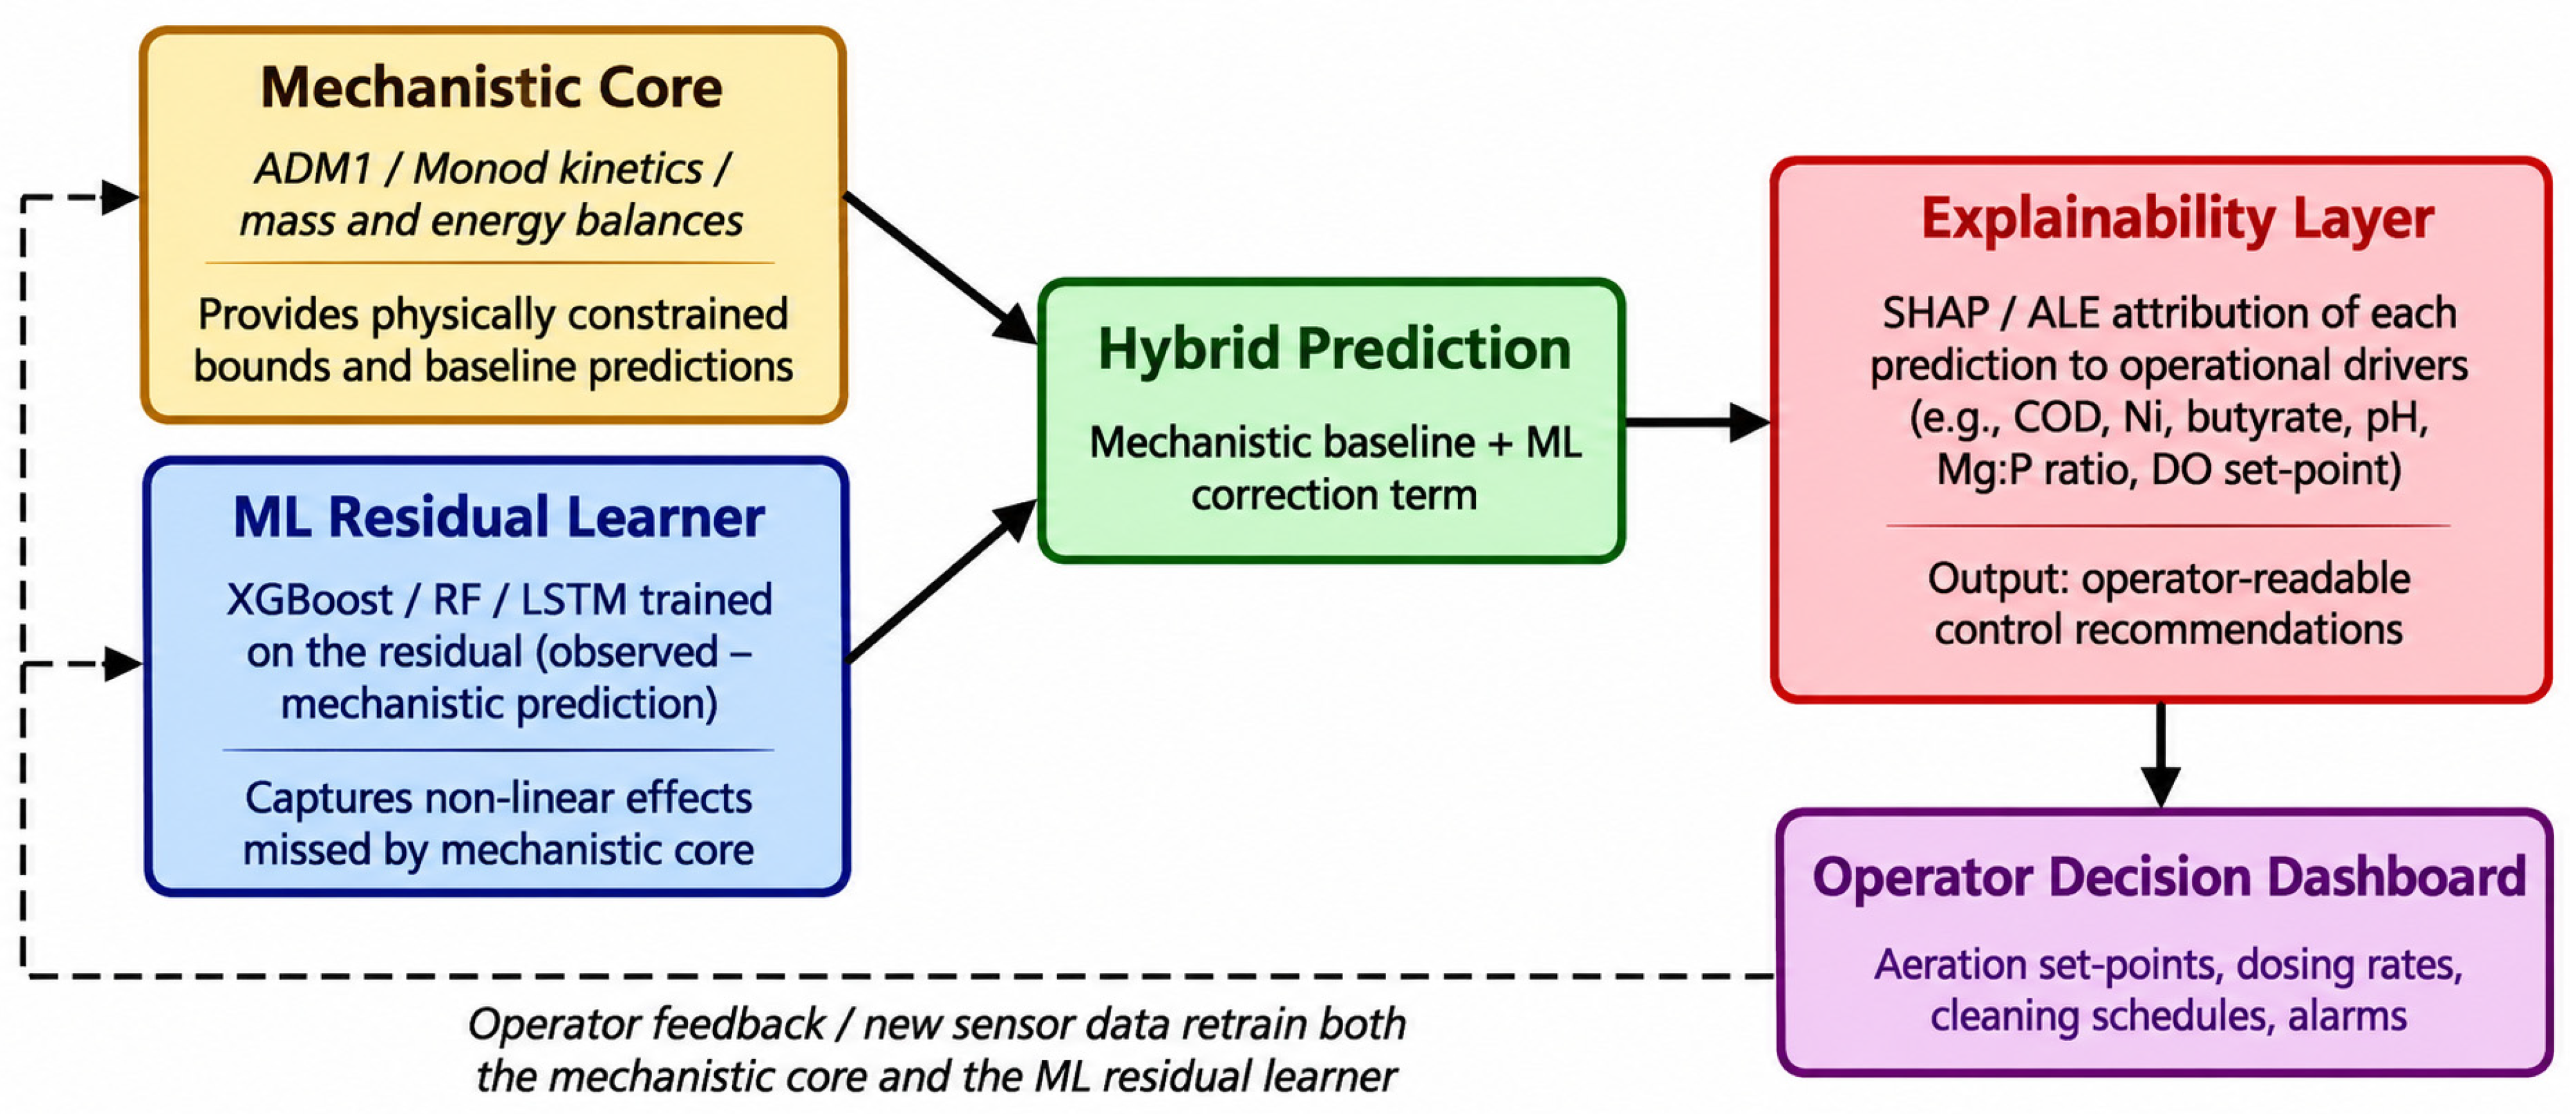

Disclaimer/Publisher’s Note: The statements, opinions and data contained in all publications are solely those of the individual author(s) and contributor(s) and not of MDPI and/or the editor(s). MDPI and/or the editor(s) disclaim responsibility for any injury to people or property resulting from any ideas, methods, instructions or products referred to in the content. |
© 2026 by the author. Licensee MDPI, Basel, Switzerland. This article is an open access article distributed under the terms and conditions of the Creative Commons Attribution (CC BY) license.