


Abstract
Capacitive micromechanical ultrasonic transducers (CMUTs), as microelectromechanical systems (MEMS) devices, have broad application prospects in ultrasonic imaging and sensing. This study investigates the influence of surface acoustic waves (SAWs) using periodically arranged CMUTs as the fundamental unit cells. We first utilize finite element analysis (FEA) to calculate and analyze the band structure and bandgap characteristics of phononic crystals under infinite periodic conditions. Subsequently, for finite periodic structures in practical applications, acoustic transmission spectra were further simulated using FEA to verify the bandgap characteristics of the structure for SAWs. Accordingly, this paper leverages a deep learning framework based on a multilayer perceptron (MLP) architecture to achieve the inverse design and optimization of CMUT geometric parameters, tailored to specific target bandgap requirements. The results demonstrate that this approach can efficiently and accurately determine the optimal structural configurations, offering a robust and novel technical paradigm for the precise control of SAWs using CMUT-based periodic arrays.
1. Introduction
The rapid advancement of MEMS technology has introduced transformative paradigms for the design of micro-sensors and actuators. Leveraging precise micro- and nano-fabrication processes, MEMS devices achieve a high degree of synergy between mechanical architectures and electronic circuitry at the micrometer scale [1]. Among these developments, CMUTs have gained significant prominence due to their exceptional performance metrics. CMUTs are amenable to large-scale array manufacturing via mature silicon-based CMOS processes, establishing a robust foundation for diverse applications ranging from medical ultrasound imaging and non-destructive testing to extensive sensor networks [2]. Research indicates that the utility of CMUTs now extends beyond simple energy conversion; their intricate membrane-cavity multilayer configurations offer a sophisticated physical platform for the precise manipulation of acoustic wave propagation at the microscale [3].
The periodic arrangement of CMUT units, adhering to specific spatial symmetries, constitutes a phononic crystal framework for SAW modulation [4,5]. Within this periodic potential, SAW propagation is governed by the band theory of solid-state physics: coherent interference leads to the formation of acoustic bandgaps, where wave transmission is effectively suppressed [6,7,8]. This control capability laid the foundation for the development of devices such as high-Q filters and ultra-sensitive mass sensors [9,10,11]. Distinct from conventional phononic crystals, the CMUT architecture incorporates a membrane suspended over a vacuum cavity. This configuration introduces a potent localized resonance mechanism, where the ultra-lightweight membrane acts as a resonator that couples strongly with substrate surface displacements. Consequently, this coupling facilitates the emergence of robust sub-wavelength bandgaps at frequencies significantly lower than those achievable by rigid structures of comparable dimensions. Furthermore, the CMOS compatibility of CMUTs enables the high-precision integration of these metamaterials onto silicon platforms, providing a versatile pathway for active and tunable SAW integrated devices.
Minute changes in the element radius, membrane thickness, and cavity height can cause drift in the bandgap center frequency or fluctuations in the bandwidth amplitude [12]. While this sensitivity provides flexibility for performance tuning, it also presents significant challenges for engineering design. In traditional design processes, researchers typically rely on FEA for iterative optimization. However, such design spaces are characterized by high dimensionality and nonlinearity, and forward simulation calculations are computationally expensive [13]. In recent years, data-driven techniques, particularly machine learning (ML) and deep learning (DL), have driven a paradigm shift in the design of periodic metamaterials, overcoming the high computational cost and tedious trial-and-error nature of traditional finite element analysis (FEA) [14,15]. A variety of neural network architectures have been successfully deployed for both the forward property prediction and the inverse geometric design of photonic and phononic crystals. For instance, recent studies have demonstrated the use of deep learning to automate the topology optimization of tunable phononic bandgaps [16] and silicon nanophotonic devices [17]. Similarly, in the acoustic domain, DL models have been utilized to inversely design plate-type phononic metamaterials, efficiently mapping target bandgaps to specific geometric parameters even with constrained datasets [18].
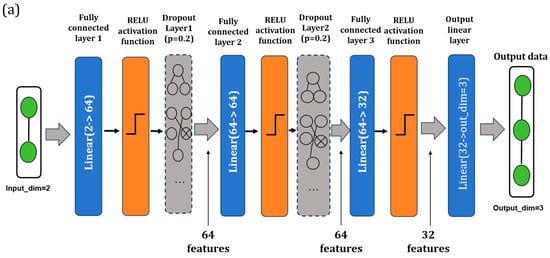
This study utilizes the diaphragm and sealed cavity of the CMUT unit as functional scatterers and arranges them periodically on a silicon substrate to form a phononic crystal. The system was characterized by multi-physics finite element simulation, and the lattice band structure and finite array transmission spectrum under infinite periodicity were evaluated. This study focuses solely on the geometric and structural modulation of the bandgap. Meanwhile, to address the problem of excessive computational cost in traditional COMSOL Multiphysics 6.1 simulations, this paper proposes a bandgap inverse design neural network architecture based on MLP, which can quickly determine the optimal structural configuration according to the target bandgap requirements. This network consists of four fully connected layers, employing ReLU activation and Dropout regularization to accurately fit the complex nonlinear relationship between geometric parameters and transmission spectral characteristics, significantly improving design efficiency. Subsequent COMSOL Multiphysics 6.1 verification showed that the proposed neural network played a role in selecting the inverse geometric parameters of the target bandgap.
2. Model Building
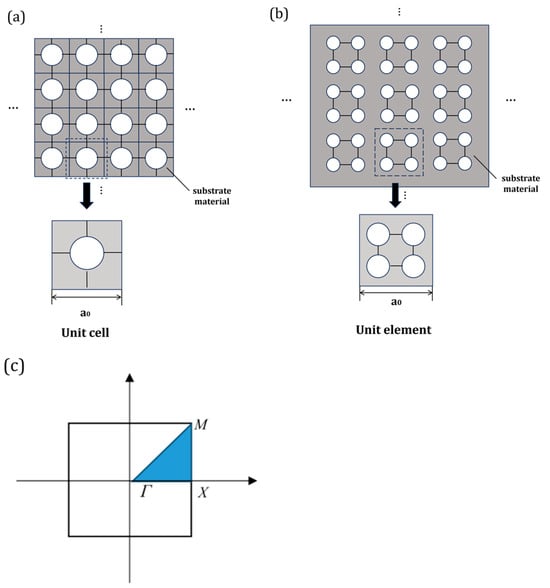
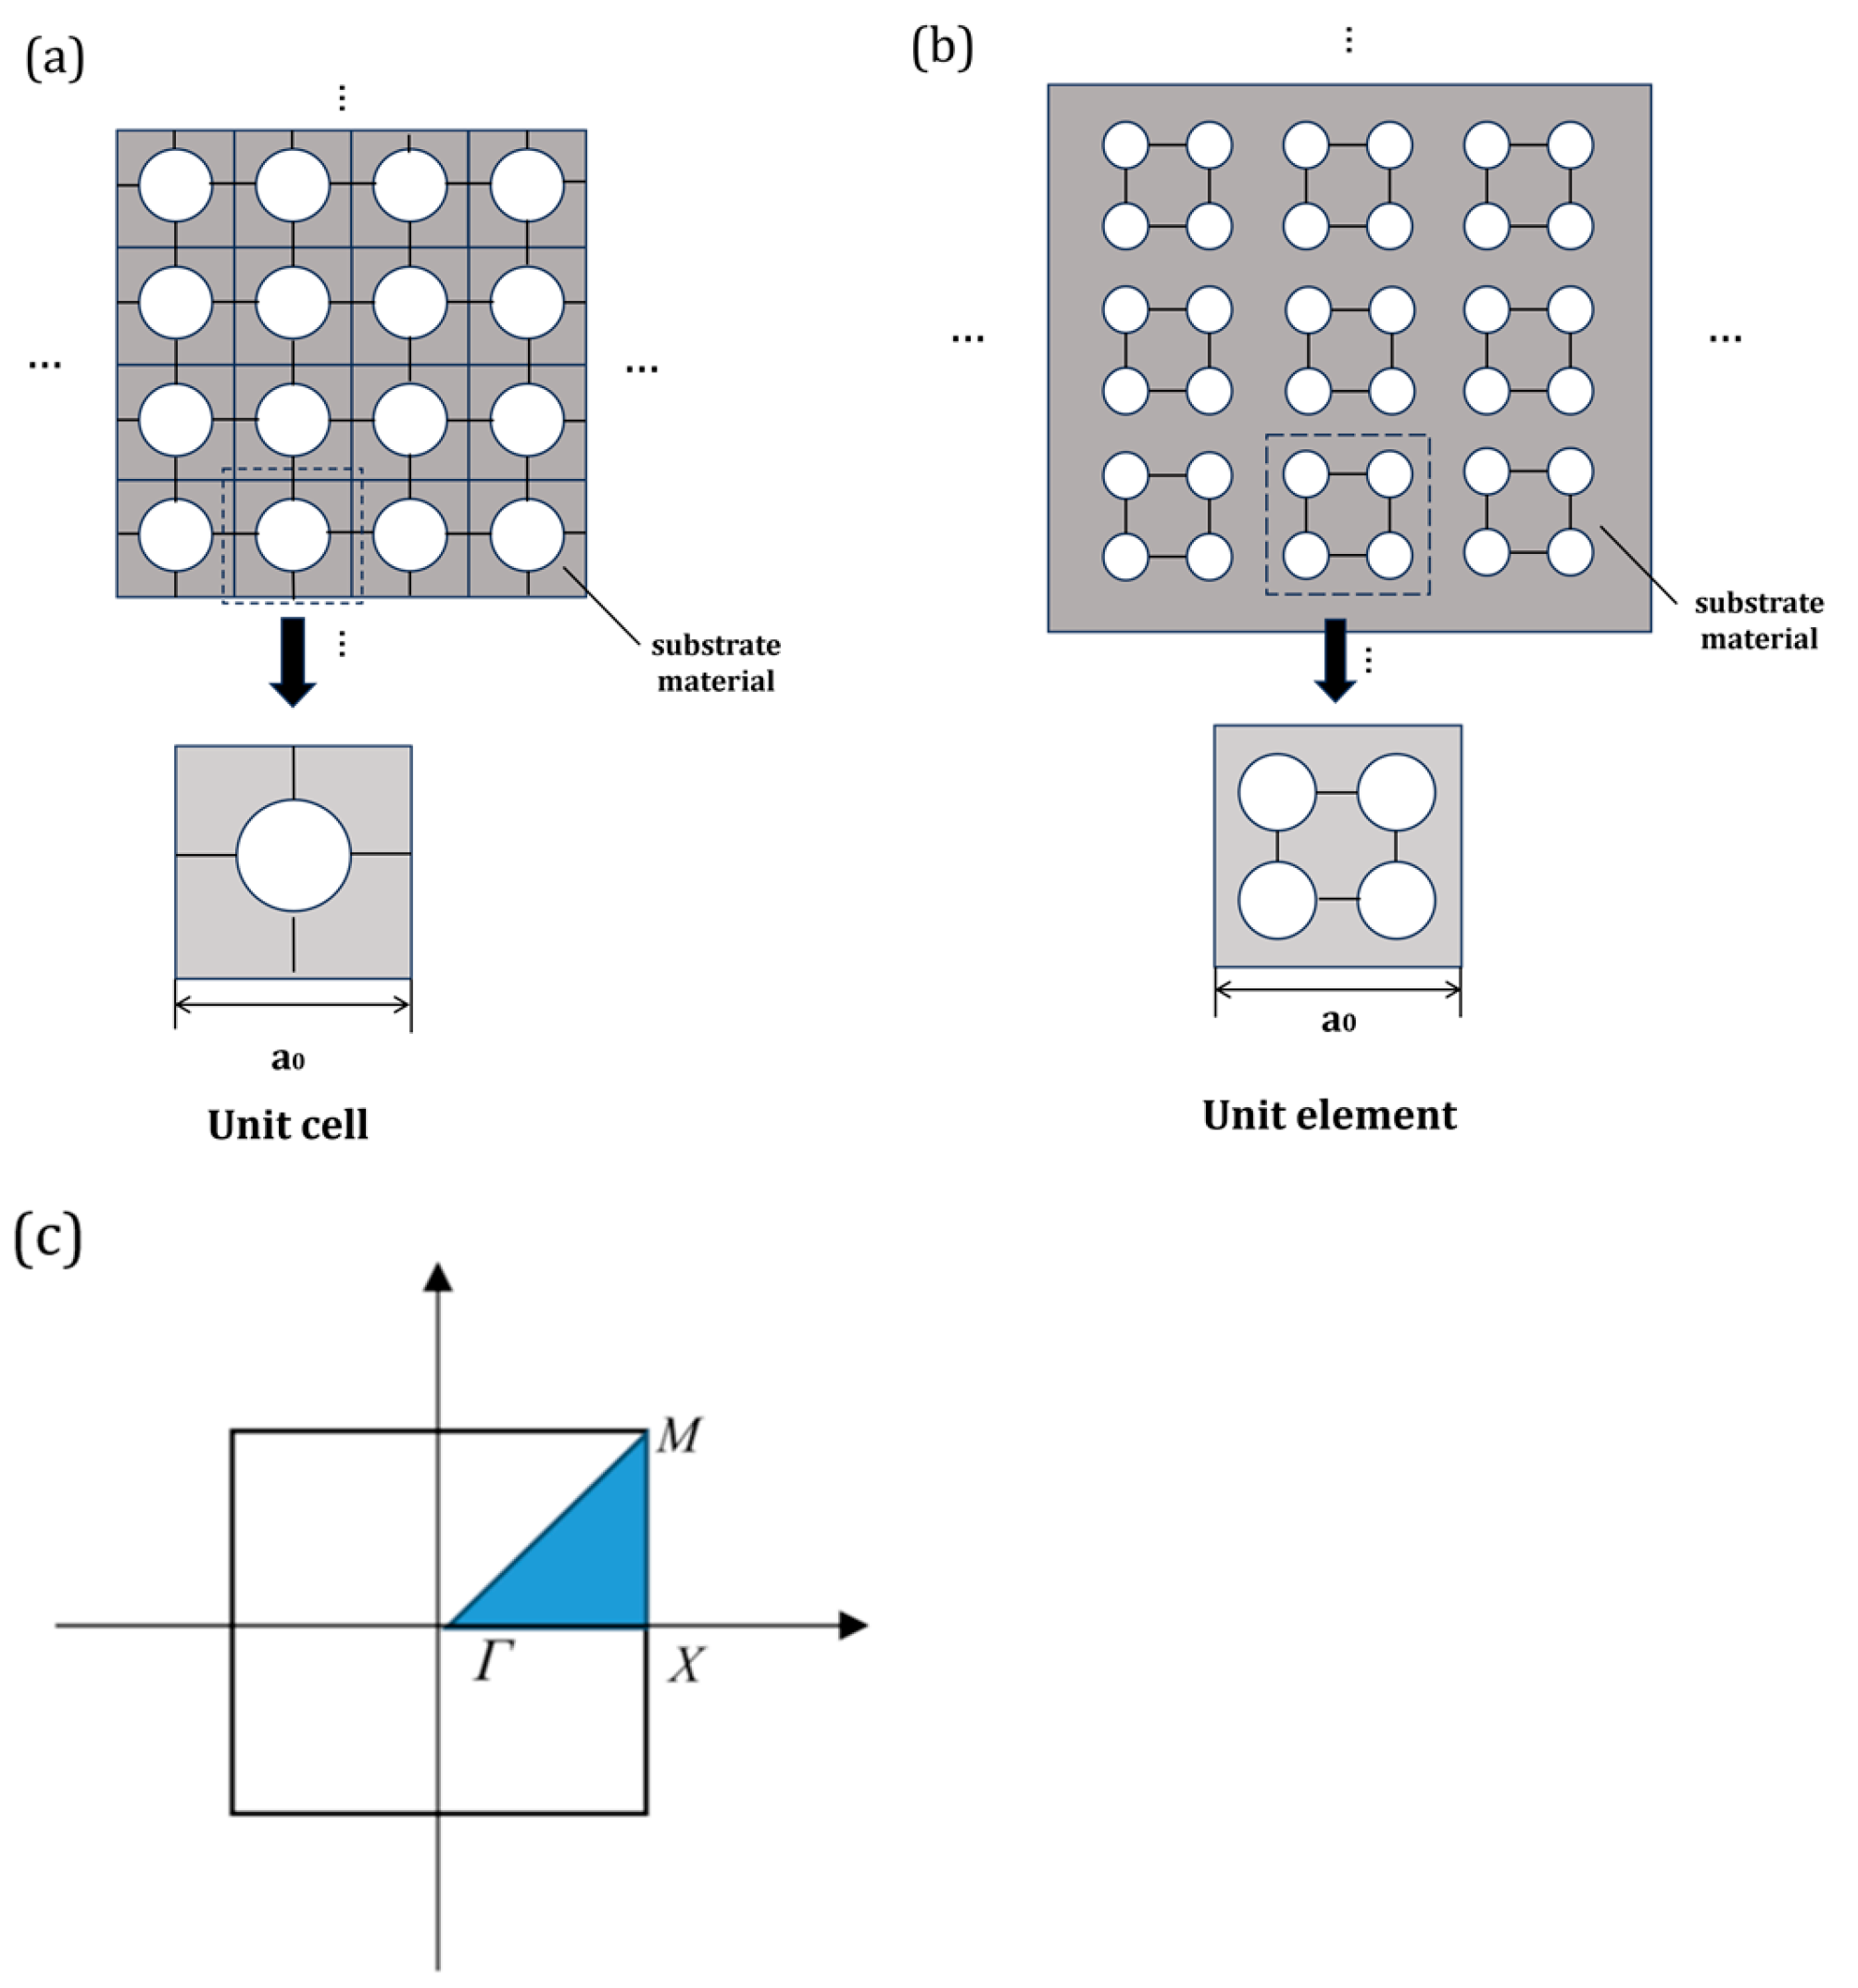
For the CMUT-based phononic crystal considered in this study, the periodicity arises from the spatial arrangement of identical membrane–cavity resonators on a silicon substrate, as illustrated in Figure 1a,b. Owing to this in-plane translational symmetry, the propagation of surface acoustic waves (SAWs) in the structure can be rigorously described by Bloch’s theorem. Specifically, the elastic displacement field u(x) within the CMUT array can be expressed as a Bloch wave:
where k is the Bloch wave vector and u(x) is a periodic modulation function sharing the same periodicity as the CMUT lattice. In the present model, this periodicity is defined by the lattice constant a0, corresponding to the spacing between adjacent CMUT unit cells. As a consequence, the originally unbounded wave propagation problem in an infinite CMUT array is reduced to an eigenvalue problem within a single unit cell, where Bloch–Floquet periodic boundary conditions are applied on the lateral boundaries. Physically, this formulation inherently incorporates the coupling between the localized membrane vibration (acting as a resonator) and the propagating substrate surface waves, which is the key mechanism governing band structure formation in this system.
Figure 1.
(a) Periodic arrangement of CMUT elements, with a magnified view of a single unit cell. (b) Periodic arrangement of CMUT array elements, with a magnified view of a single array element. (c) Schematic diagram of the least irreducible Brillouin zone of a square lattice.
In correspondence with the square lattice configuration of the CMUT array, a reciprocal lattice can be constructed, and the first Brillouin zone is defined as the Wigner–Seitz cell in reciprocal space. However, due to the geometric symmetry of the unit cell—originating from the axisymmetric membrane and its periodic arrangement along orthogonal directions—the wave solutions exhibit redundancy across the Brillouin zone. Therefore, the analysis can be restricted to the irreducible Brillouin zone, which represents the minimal set of unique wave vectors required to fully describe the dispersion characteristics. For the square CMUT lattice considered in this paper, its irreducible Brillouin zone is typically defined by high-symmetry points Γ, X, and M. By scanning the Bloch wave vector along the Γ–X–M–Γ path, the complete dispersion relation of the periodic CMUT structure can be obtained. Figure 1c shows the Brillouin zone of the square lattice. This simplified method significantly improves computational efficiency while preserving all physically relevant information, thus enabling accurate identification of the band gap associated with surface acoustic wave propagation.
Within this Bloch framework, two distinct mechanisms contribute to bandgap formation in the CMUT-based phononic crystal. First, Bragg scattering arises from the periodic modulation of mechanical impedance introduced by the spatial distribution of CMUT units, leading to bandgaps near the Brillouin zone boundaries. Second, and more importantly in the present structure, local resonance effects originate from the membrane–cavity system within each unit cell. The suspended silicon nitride membrane, together with the vacuum cavity beneath it, behaves as a compliant resonator with an effective mass–spring characteristic. When its resonance frequency couples with the propagating SAWs on the silicon substrate, strong hybridization occurs, giving rise to subwavelength bandgaps that can open near the Γ point.
Based on the above theory, the finite element implementation in COMSOL Multiphysics 6.1 directly follows the Bloch formalism by imposing Bloch–Floquet periodic boundary conditions on the unit cell boundaries along the x and y directions. The eigenfrequency problem is then solved for discrete values of the wave vector within the irreducible Brillouin zone. In this study, particular attention is given to isolating SAW modes, whose energy is strongly confined near the surface and within the CMUT resonators. This ensures that the extracted dispersion relations and bandgaps accurately reflect the surface wave modulation induced by the periodic CMUT architecture, rather than bulk wave artifacts.
3. Finite Element Simulation Using COMSOL
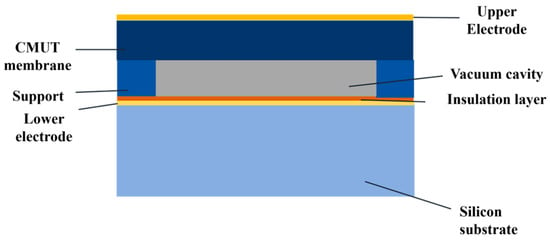
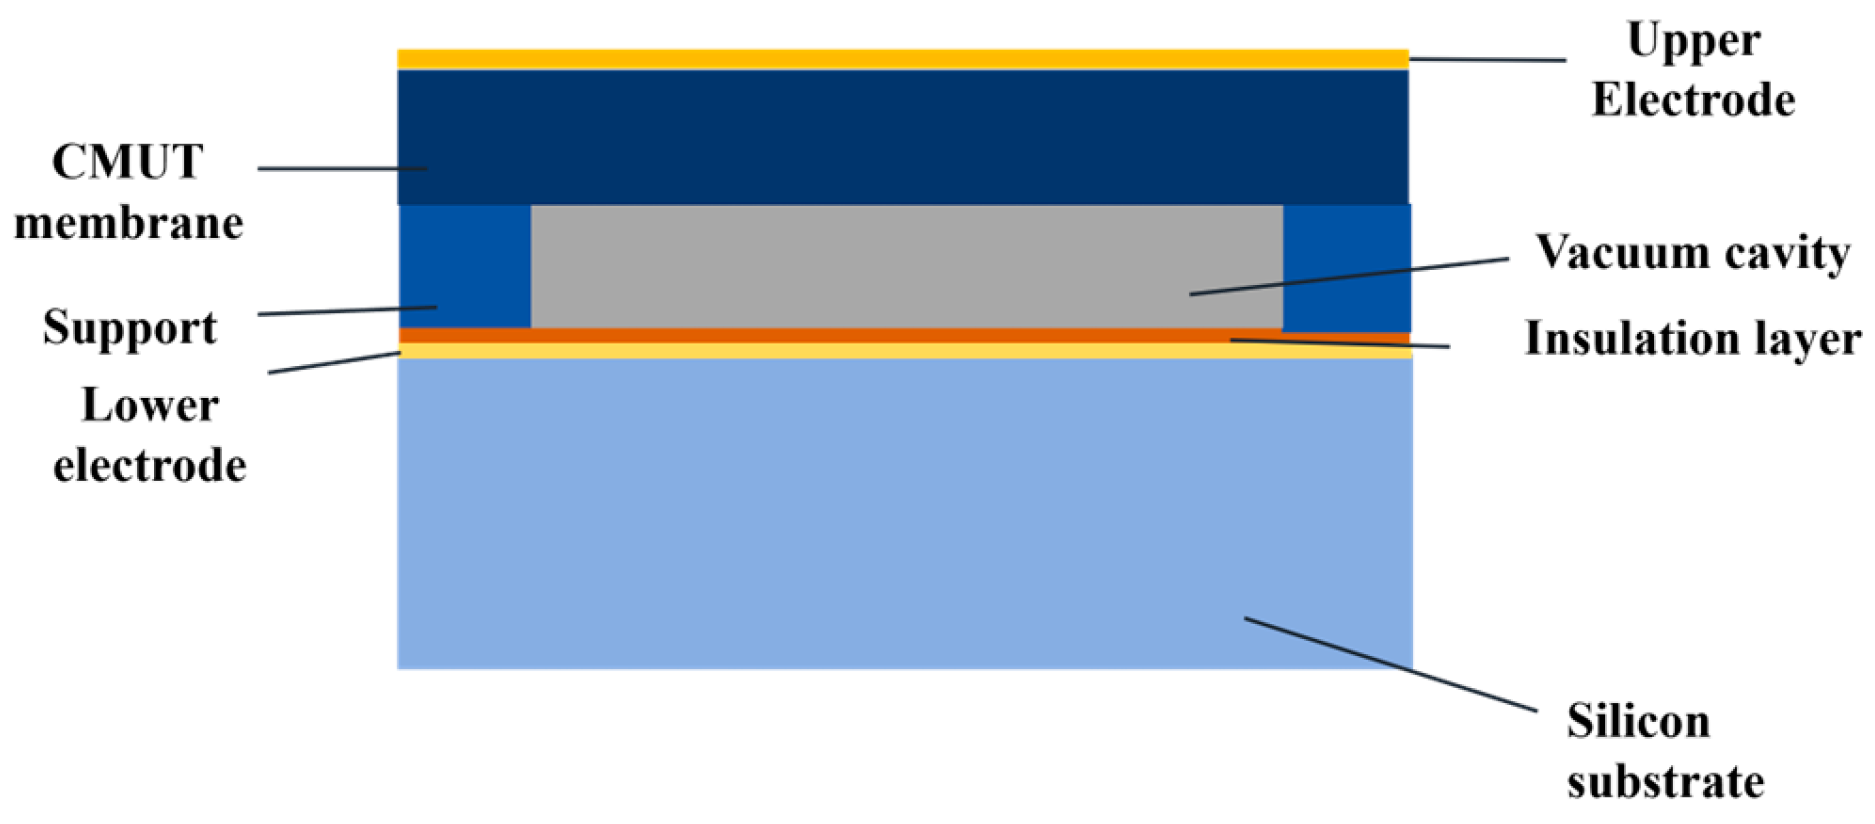
The CMUT technology integrated into this study leverages standard MEMS fabrication to construct unit cells based on established architectural designs. As depicted in the schematic in Figure 2, a typical CMUT unit comprises a single-crystal silicon substrate, an insulating layer, a vacuum cavity, and a suspended thin film integrated with top and bottom electrodes. Physically, a CMUT unit can be abstracted as a mechanical oscillator system characterized by the membrane, membrane’s structural stiffness, and a damping coefficient. The resulting equivalent acoustic impedance is thus a frequency-dependent function, providing the necessary degree of freedom for active and tunable wave modulation.
Figure 2.
Schematic diagram of a CMUT structure based on MEMS technology.
In simulations of CMUT phononic crystals, this typically involves the coupling between the thin film and the cavity. At the interface Γ between different domains, the continuity of displacement and stress must be satisfied:
where is the displacement vector, is the stress tensor, is the sound pressure, and is the normal vector.
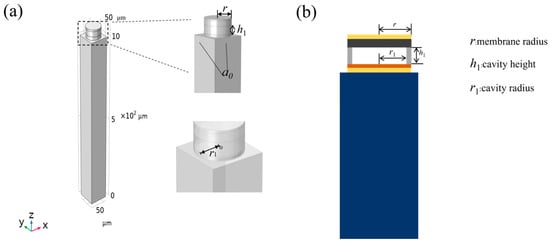
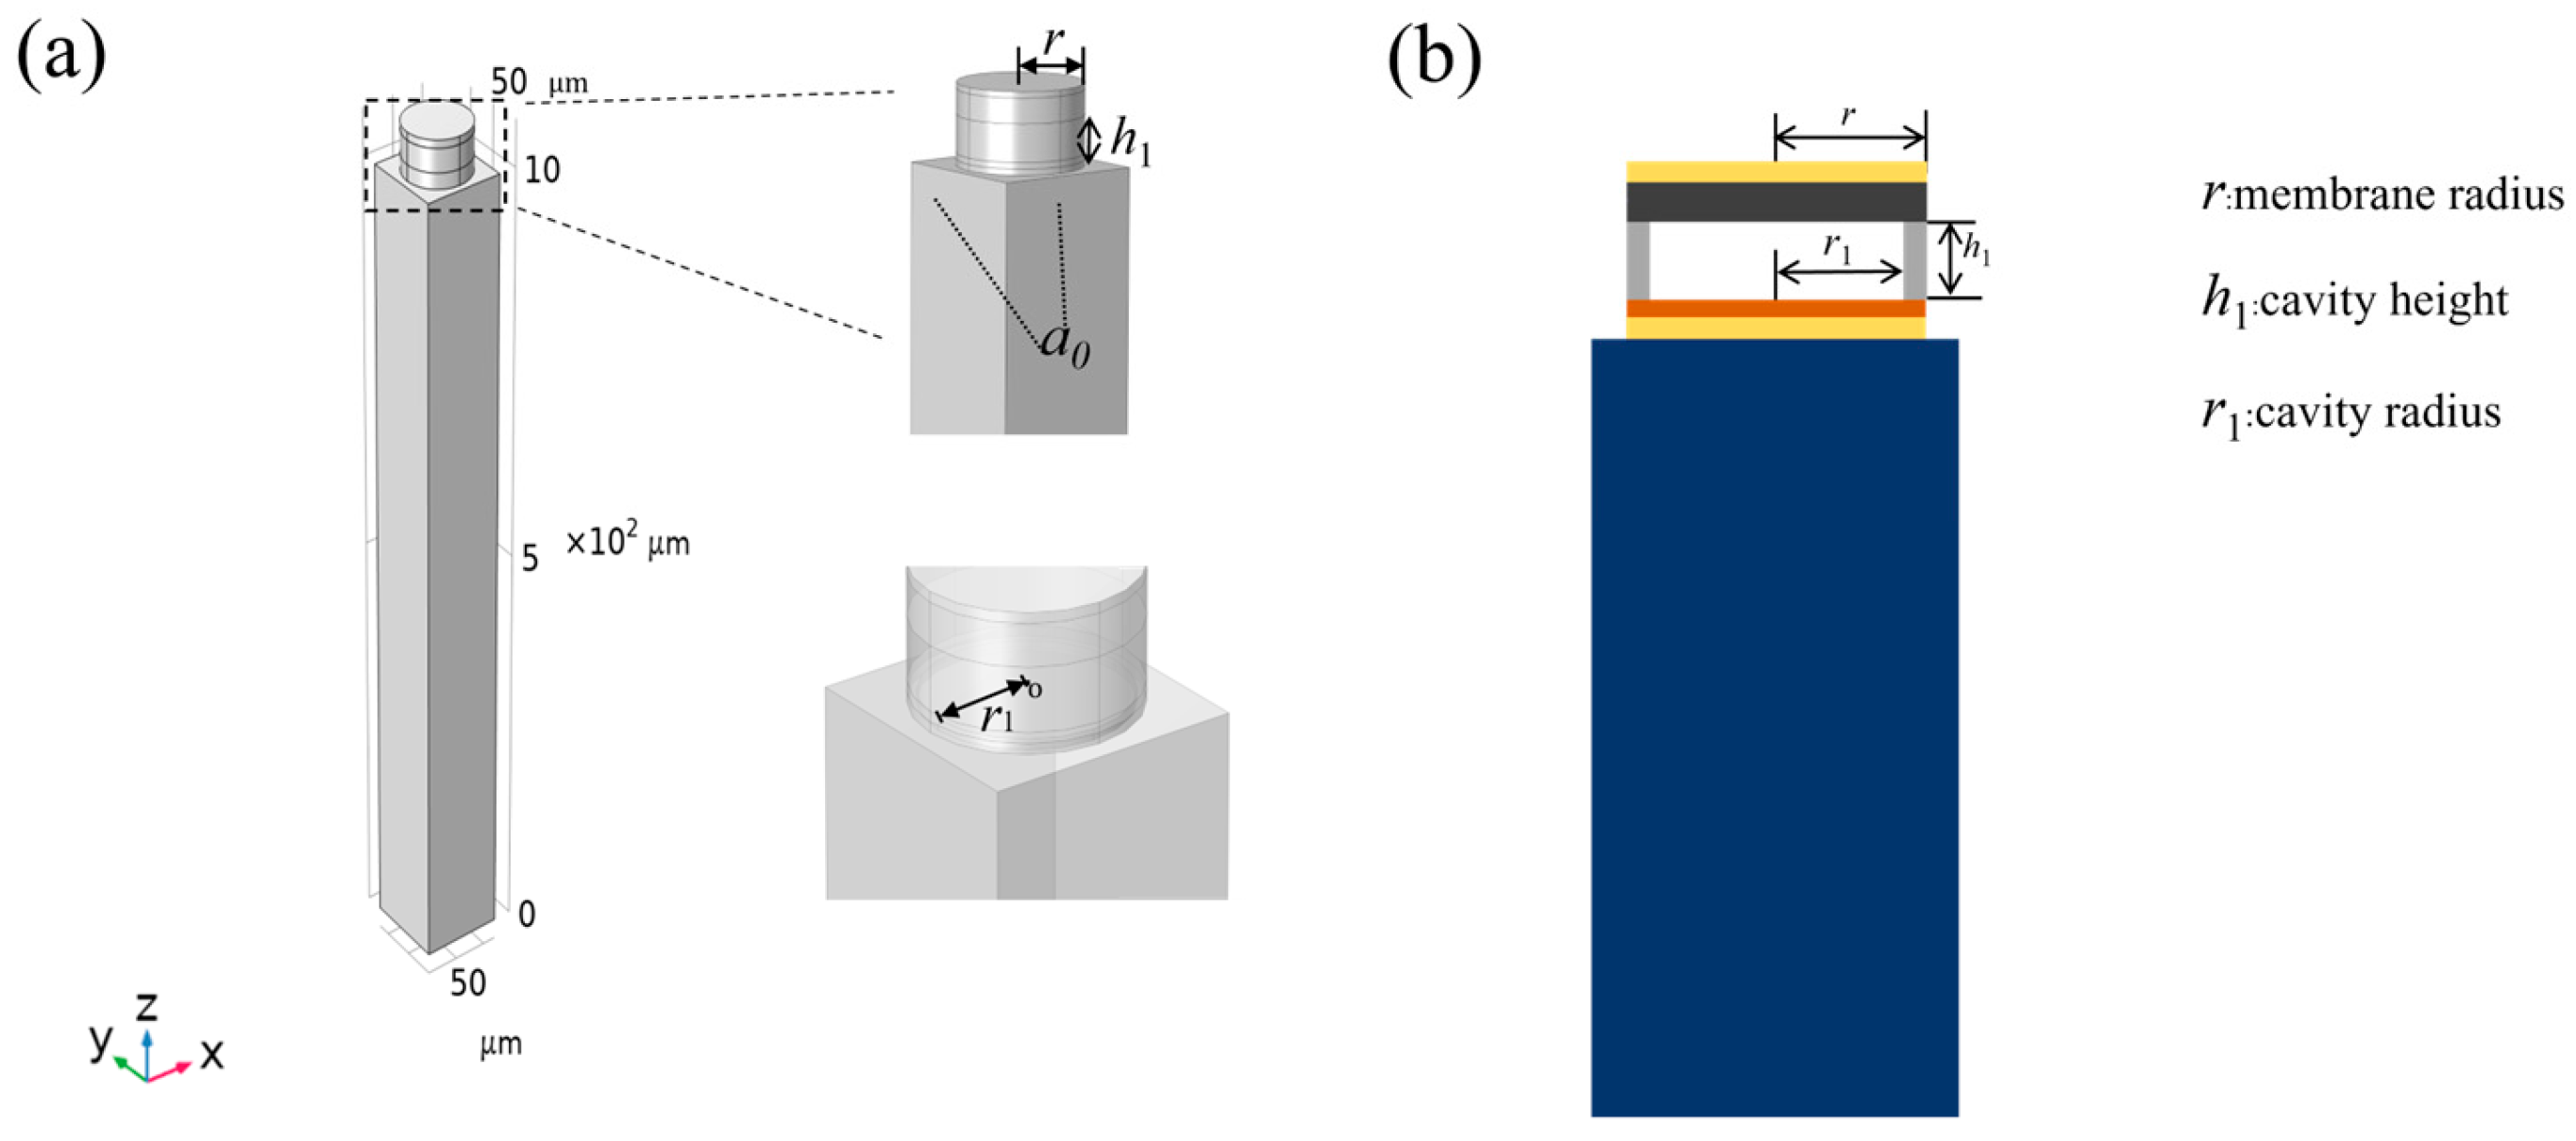
COMSOL Multiphysics 6.1 was employed to establish the numerical model. Figure 3a presents the constructed geometric model, which consists of a silicon substrate and MEMS components fabricated on its top surface. Since the circuit operates in an open-circuit state during the investigation, the upper and lower electrodes were omitted from the model. The lattice constant of the single unit cell is defined as a0, and the height of the substrate for this unit cell is set to 10 × a0. The specific geometric dimensions of the CMUT micro-element L designed by COMSOL Multiphysics 6.1 are shown in Table 1. An enlarged view of the upper region of the unit cell is provided, where Figure 3b shows the two-dimensional cross-section of the membrane support architecture on the substrate. Silicon nitride was selected as the membrane material, and silicon dioxide was adopted as the support material, with a vacuum cavity layer reserved in between. The radius of the thin film is denoted by r, and the height of the cavity is represented by h1. Regarding boundary conditions, two-dimensional Bloch–Floquet periodic boundary conditions were applied along the x and y directions on the corresponding pairs of faces of the phononic crystal unit cell. After meshing, the eigenfrequency study module was utilized, and a parametric sweep simulation was performed for the wave vector k along the high-symmetry paths of the irreducible Brillouin zone.
Figure 3.
(a) 3D simulation diagram of a single cellular unit. (b) Schematic diagram of the cross-section of the ‘film-supported’ two-dimensional structure.
Table 1.
Basic geometric parameters of CMUT cell.
The finite element simulation used the solid mechanics module. Furthermore, the frequency domain analysis employed the MUMPS direct solver. To balance solution accuracy and solution time, we used non-uniform mesh generation in different domains. Convergence analysis was also performed by monitoring the change in mesh density at the first bandgap edge. The material parameters in the COMSOL Multiphysics 6.1 simulation are shown in Table 2. The substrate is elemental silicon, the support layer is silicon dioxide, and the thin film material is silicon nitride.
Table 2.
Material parameters of surface acoustic wave devices under infinite periodicity.
To isolate the SAW modes and mitigate the interference from substrate bulk waves, a rigorous modal filtering procedure was implemented based on the characteristics of energy localization. Theoretically, the energy of a SAW mode is predominantly confined within a depth of approximately one to two wavelengths () from the upper surface. In this study, by calculating the ratio of the mechanical energy integrated within the CMUT resonator and the top surface layer relative to the total strain energy of the substrate, ‘spurious’ bulk modes—characterized by significant displacement in the deep interior of the silicon—were effectively excluded. This ensures that the identified bandgaps specifically represent the forbidden frequency ranges for surface-propagating elastic waves, rather than artifacts resulting from the finite substrate thickness.
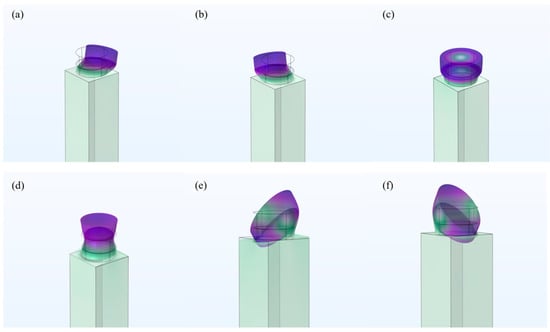
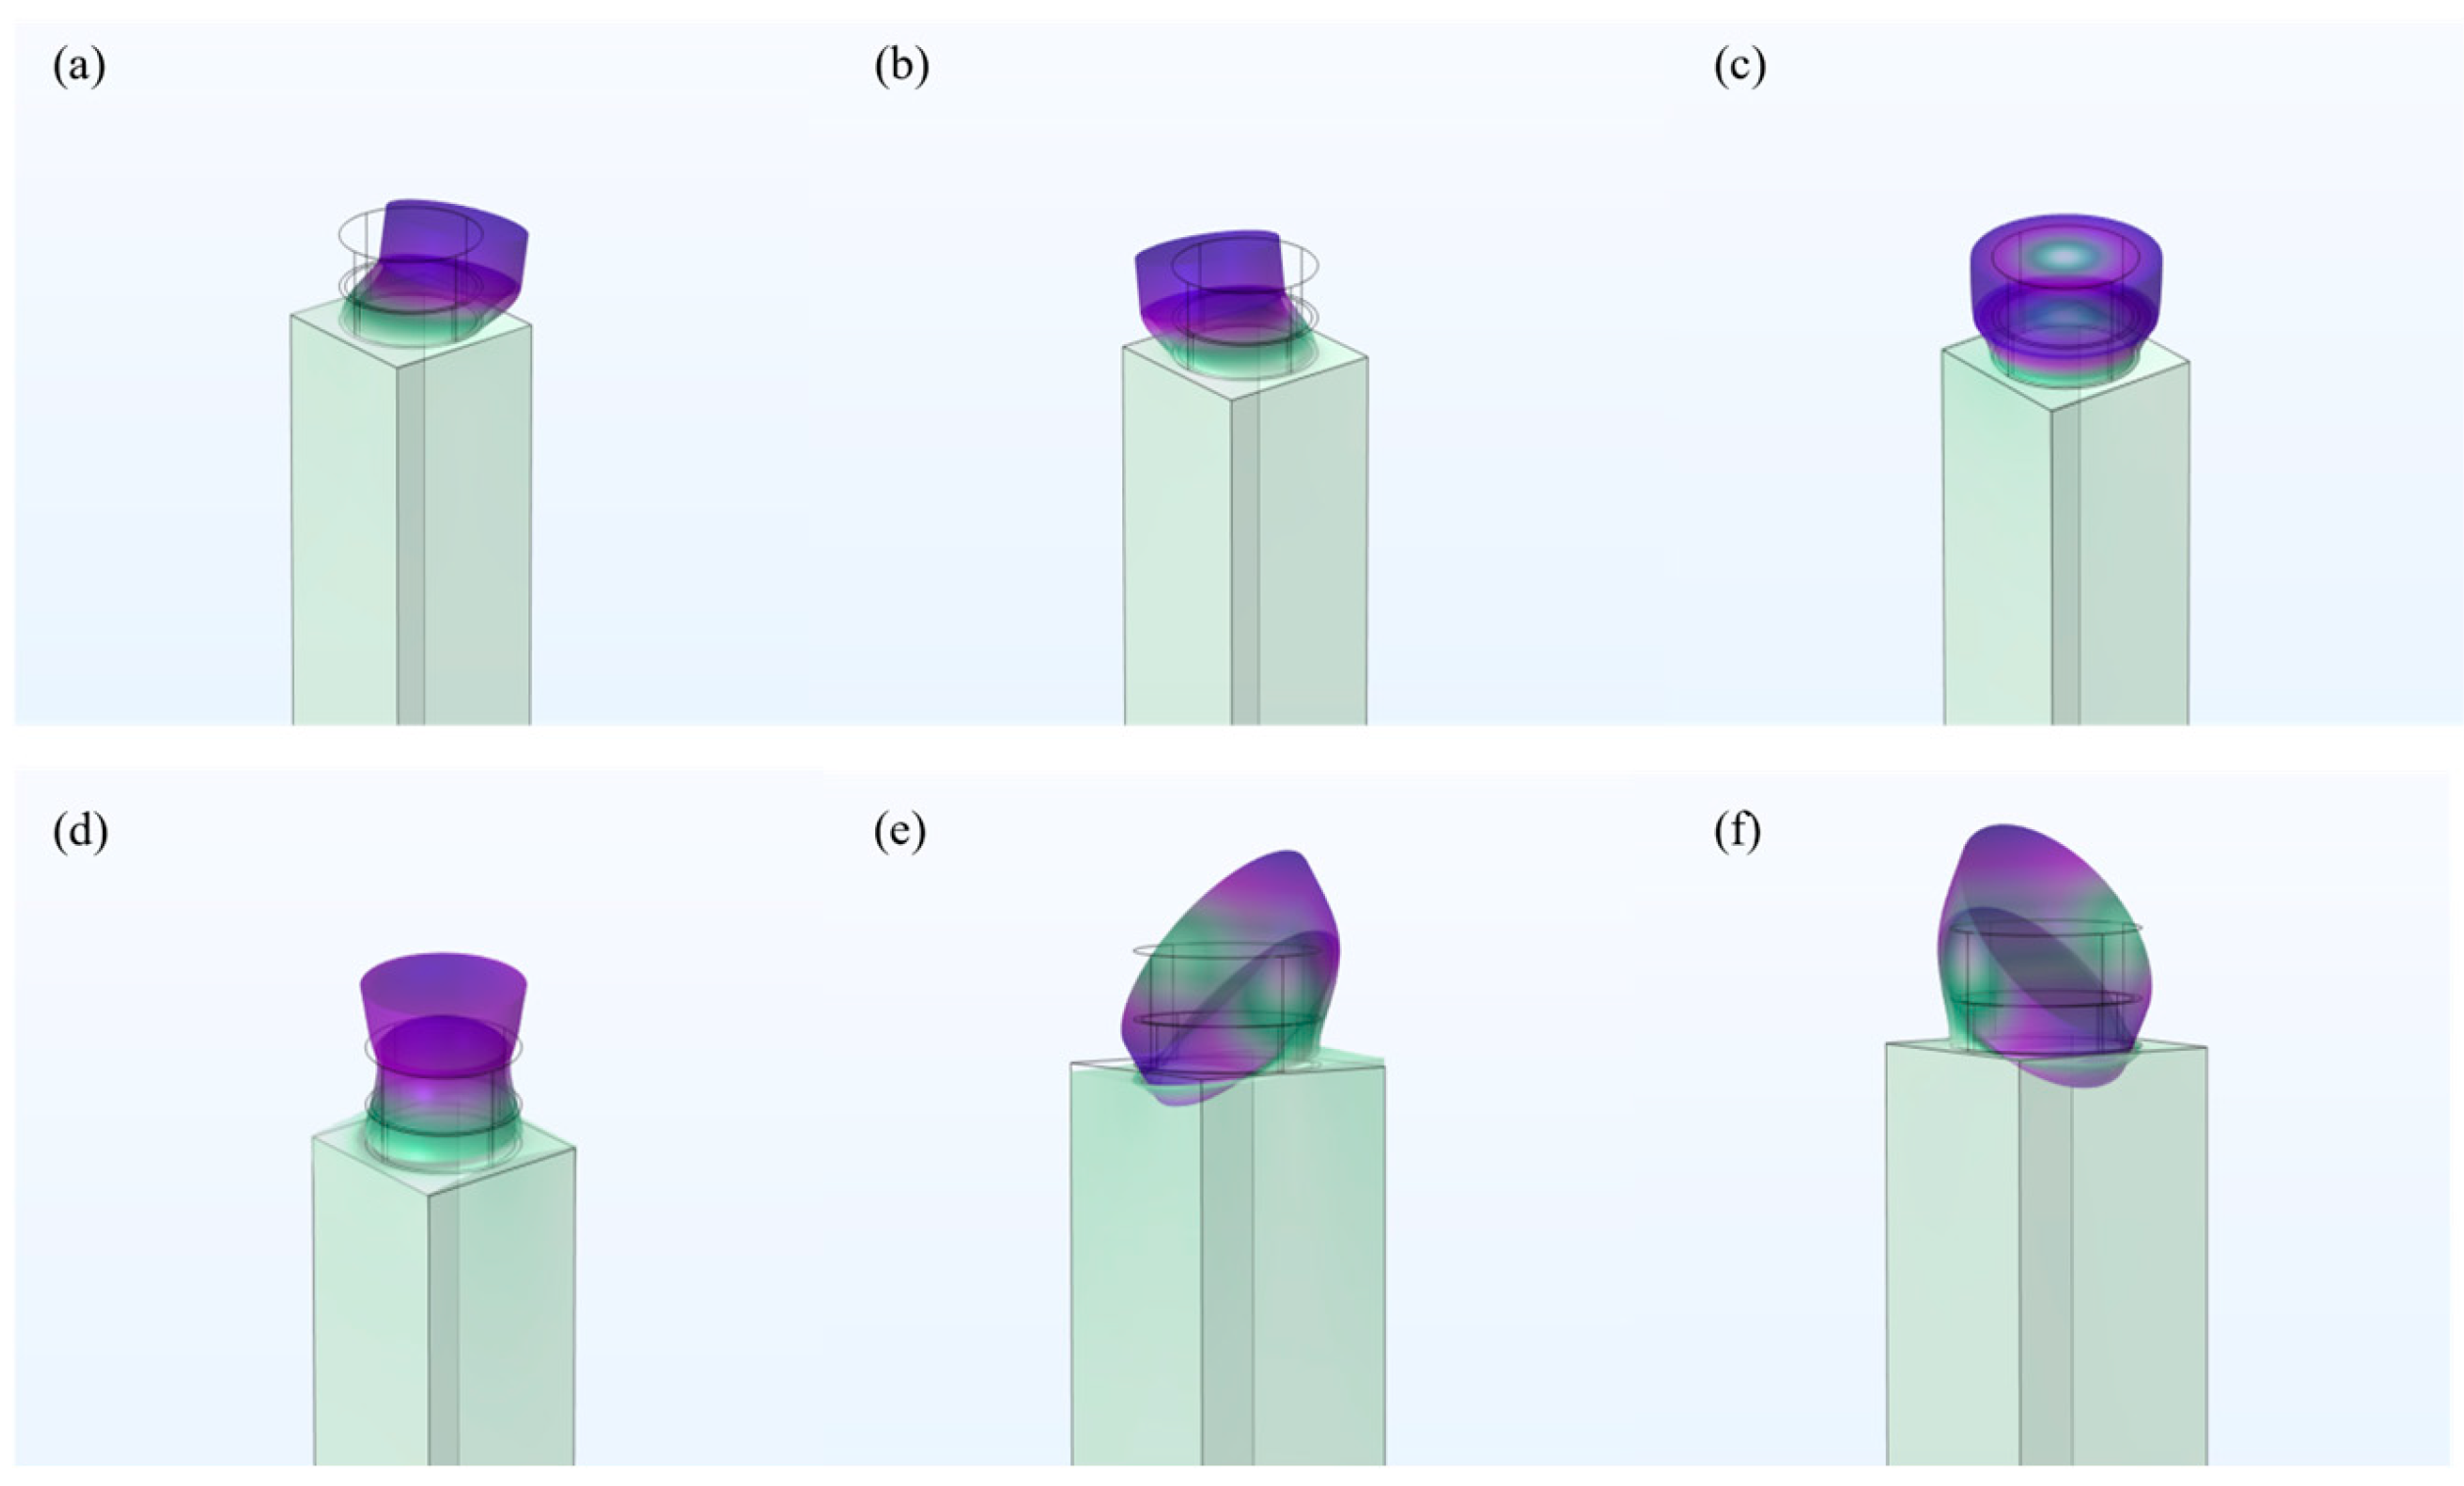
Figure 4a–f illustrate the computed mode shapes for the 1st to 6th order eigenstates of the CMUT-based phononic crystal unit cell. It is evident that across these different orders, the vibrational energy is concentrated primarily within the surface pillars (the device components), while the substrate remains substantially quiescent. Consequently, the bandgap characteristics of this unit cell are predominantly governed by the effective stiffness and effective mass of the top-surface resonators, providing a clear pathway for structural optimization.
Figure 4.
(a–f) show mode shape diagrams of a single unit cell under different modalities, mainly vibration mode diagrams dominated by surface acoustic waves. Different colors represent different relative displacements; purple indicates a larger relative amplitude of vibration, while green indicates a smaller relative amplitude of vibration.
It should be noted that the substrate material is silicon. This study uses isotropic silicon, and analysis of the material properties shows that the difference in band gap is small.
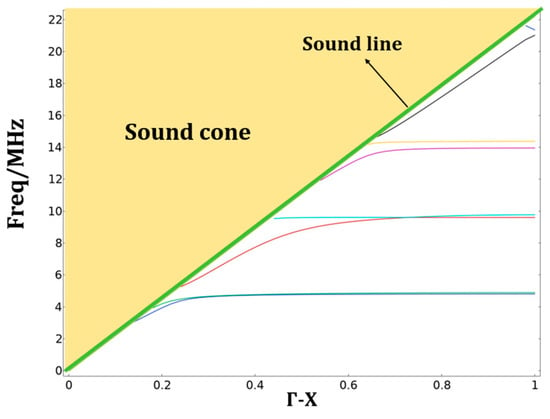
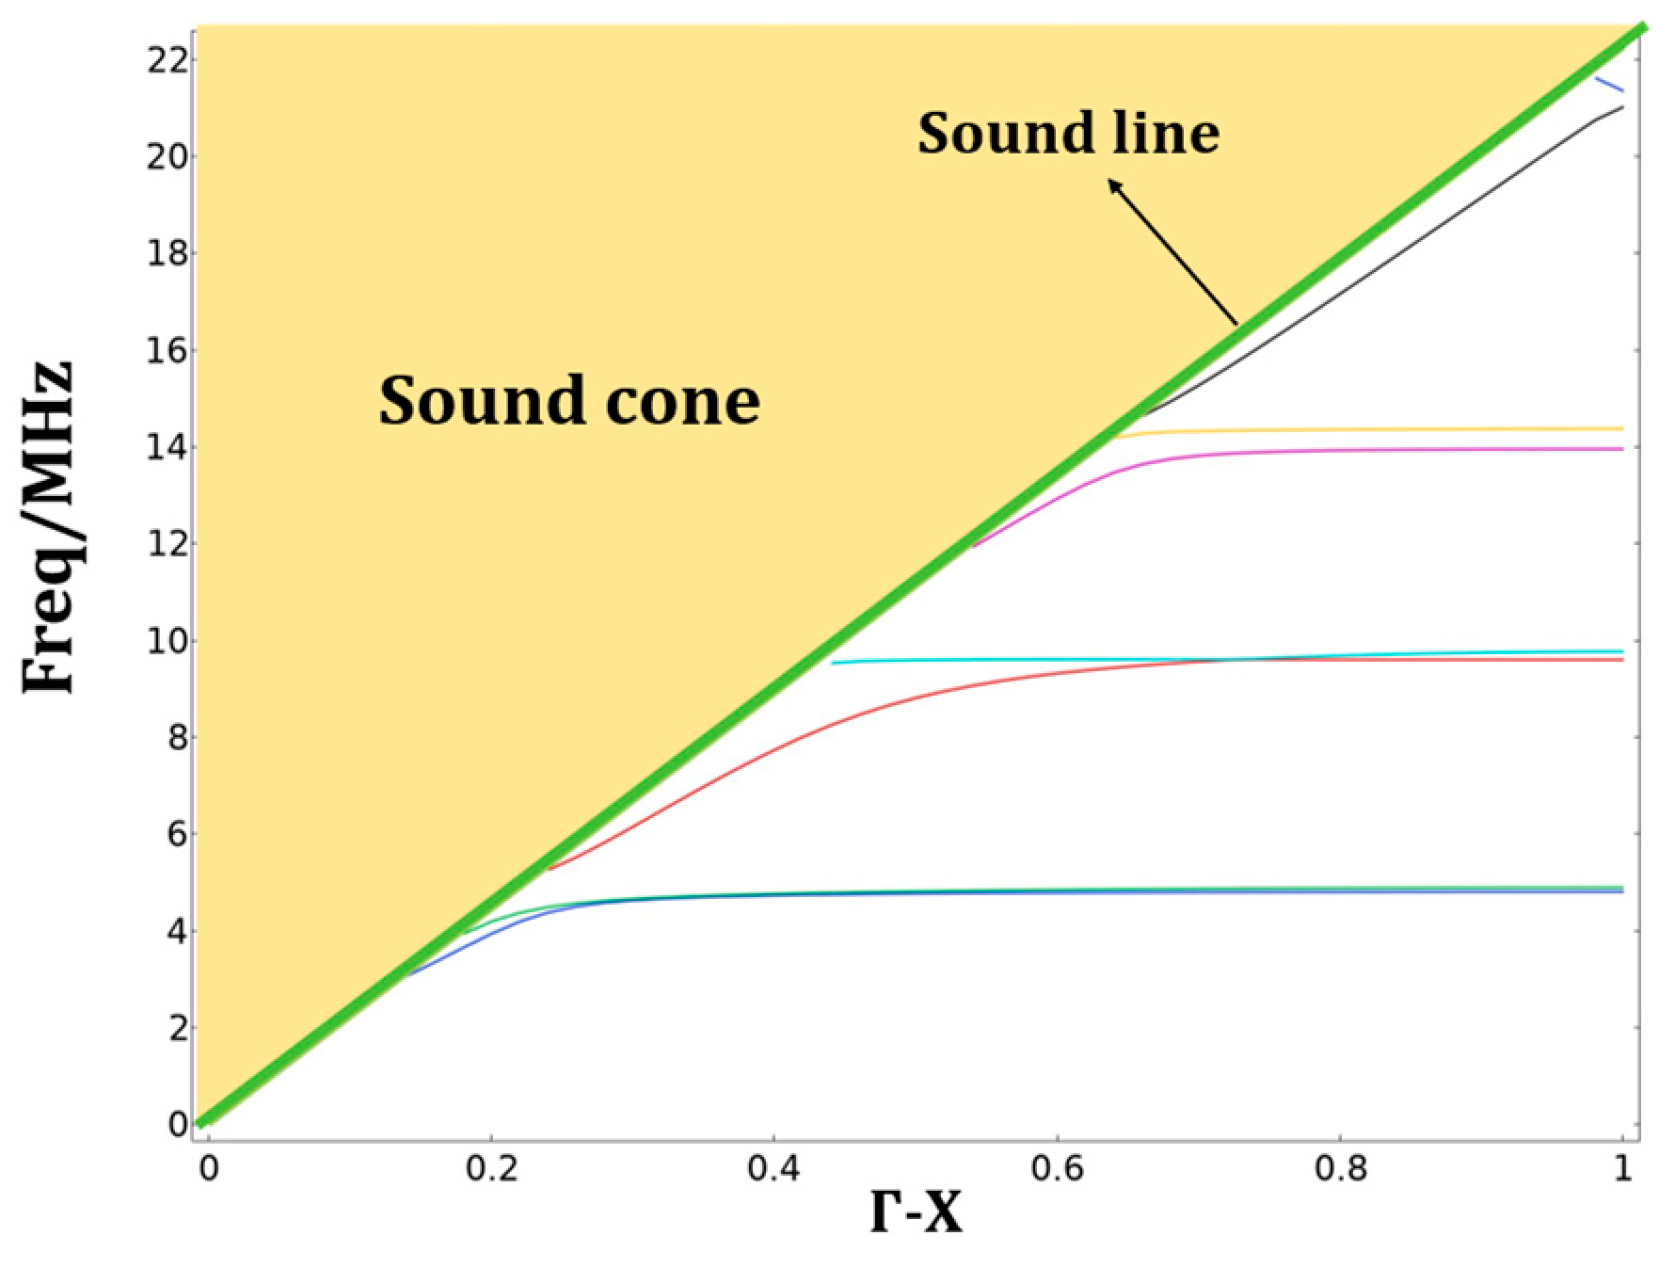
In the constructed surface device, the cavity radius is denoted as r1, the film radius as r, and the cavity height as h. Taking r = 50 μm, r1 = 46 μm, and h1 = 30 μm as an example, we can plot the phononic band gap of the unit cell of the device. Table 1 refers to the post-processing analysis of simulation results carried out after completing the geometric modeling in COMSOL Multiphysics 6.1 and setting the physical boundary conditions under infinite periodicity. It should be noted that in the vibration mode display of the simulation results, not all vibration modes are predominantly surface waves. Filtering options should be used to filter out spurious modes caused by other waves. In the post-processing stage, by utilizing a ‘Global 1D Plot’ with ‘Frequency’ as the ordinate and the normalized wave vector as the abscissa, a distinct directional bandgap is observed for this micro-device. In the resulting dispersion diagram Figure 5, the continuous yellow shaded region represents the bulk wave continuum, commonly referred to as the ‘sound cone’ [19]. The solid green line indicates the slowest bulk wave mode. Given that the phase velocity of SAWs is inherently lower than that of bulk waves, these slowest modes propagating within the silicon substrate serve as the boundary between surface-confined and bulk-radiated modes. The dispersion characteristics of the SAW phononic crystal are bounded by the sound line, which corresponds to the dispersion of the slowest bulk acoustic wave (BAW) in the substrate. As established in classic literature [20], only modes located below the sound line are strictly confined to the surface without radiating energy into the bulk. Conversely, the region above the sound line is defined as the sound cone (or radiative zone), where surface modes couple with the continuum of bulk states, leading to significant leakage loss. In this study, the bandgap analysis primarily focuses on the surface-confined modes situated below this boundary to ensure high-Q resonance and low propagation loss.
Figure 5.
Directional bandgap of infinite periodic unit cell, curves of different colors represent specific dispersion curves at different characteristic frequencies of the infinite periodic unit cell.
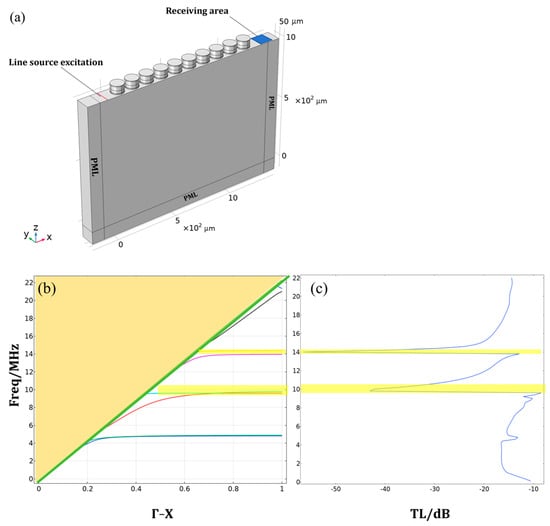
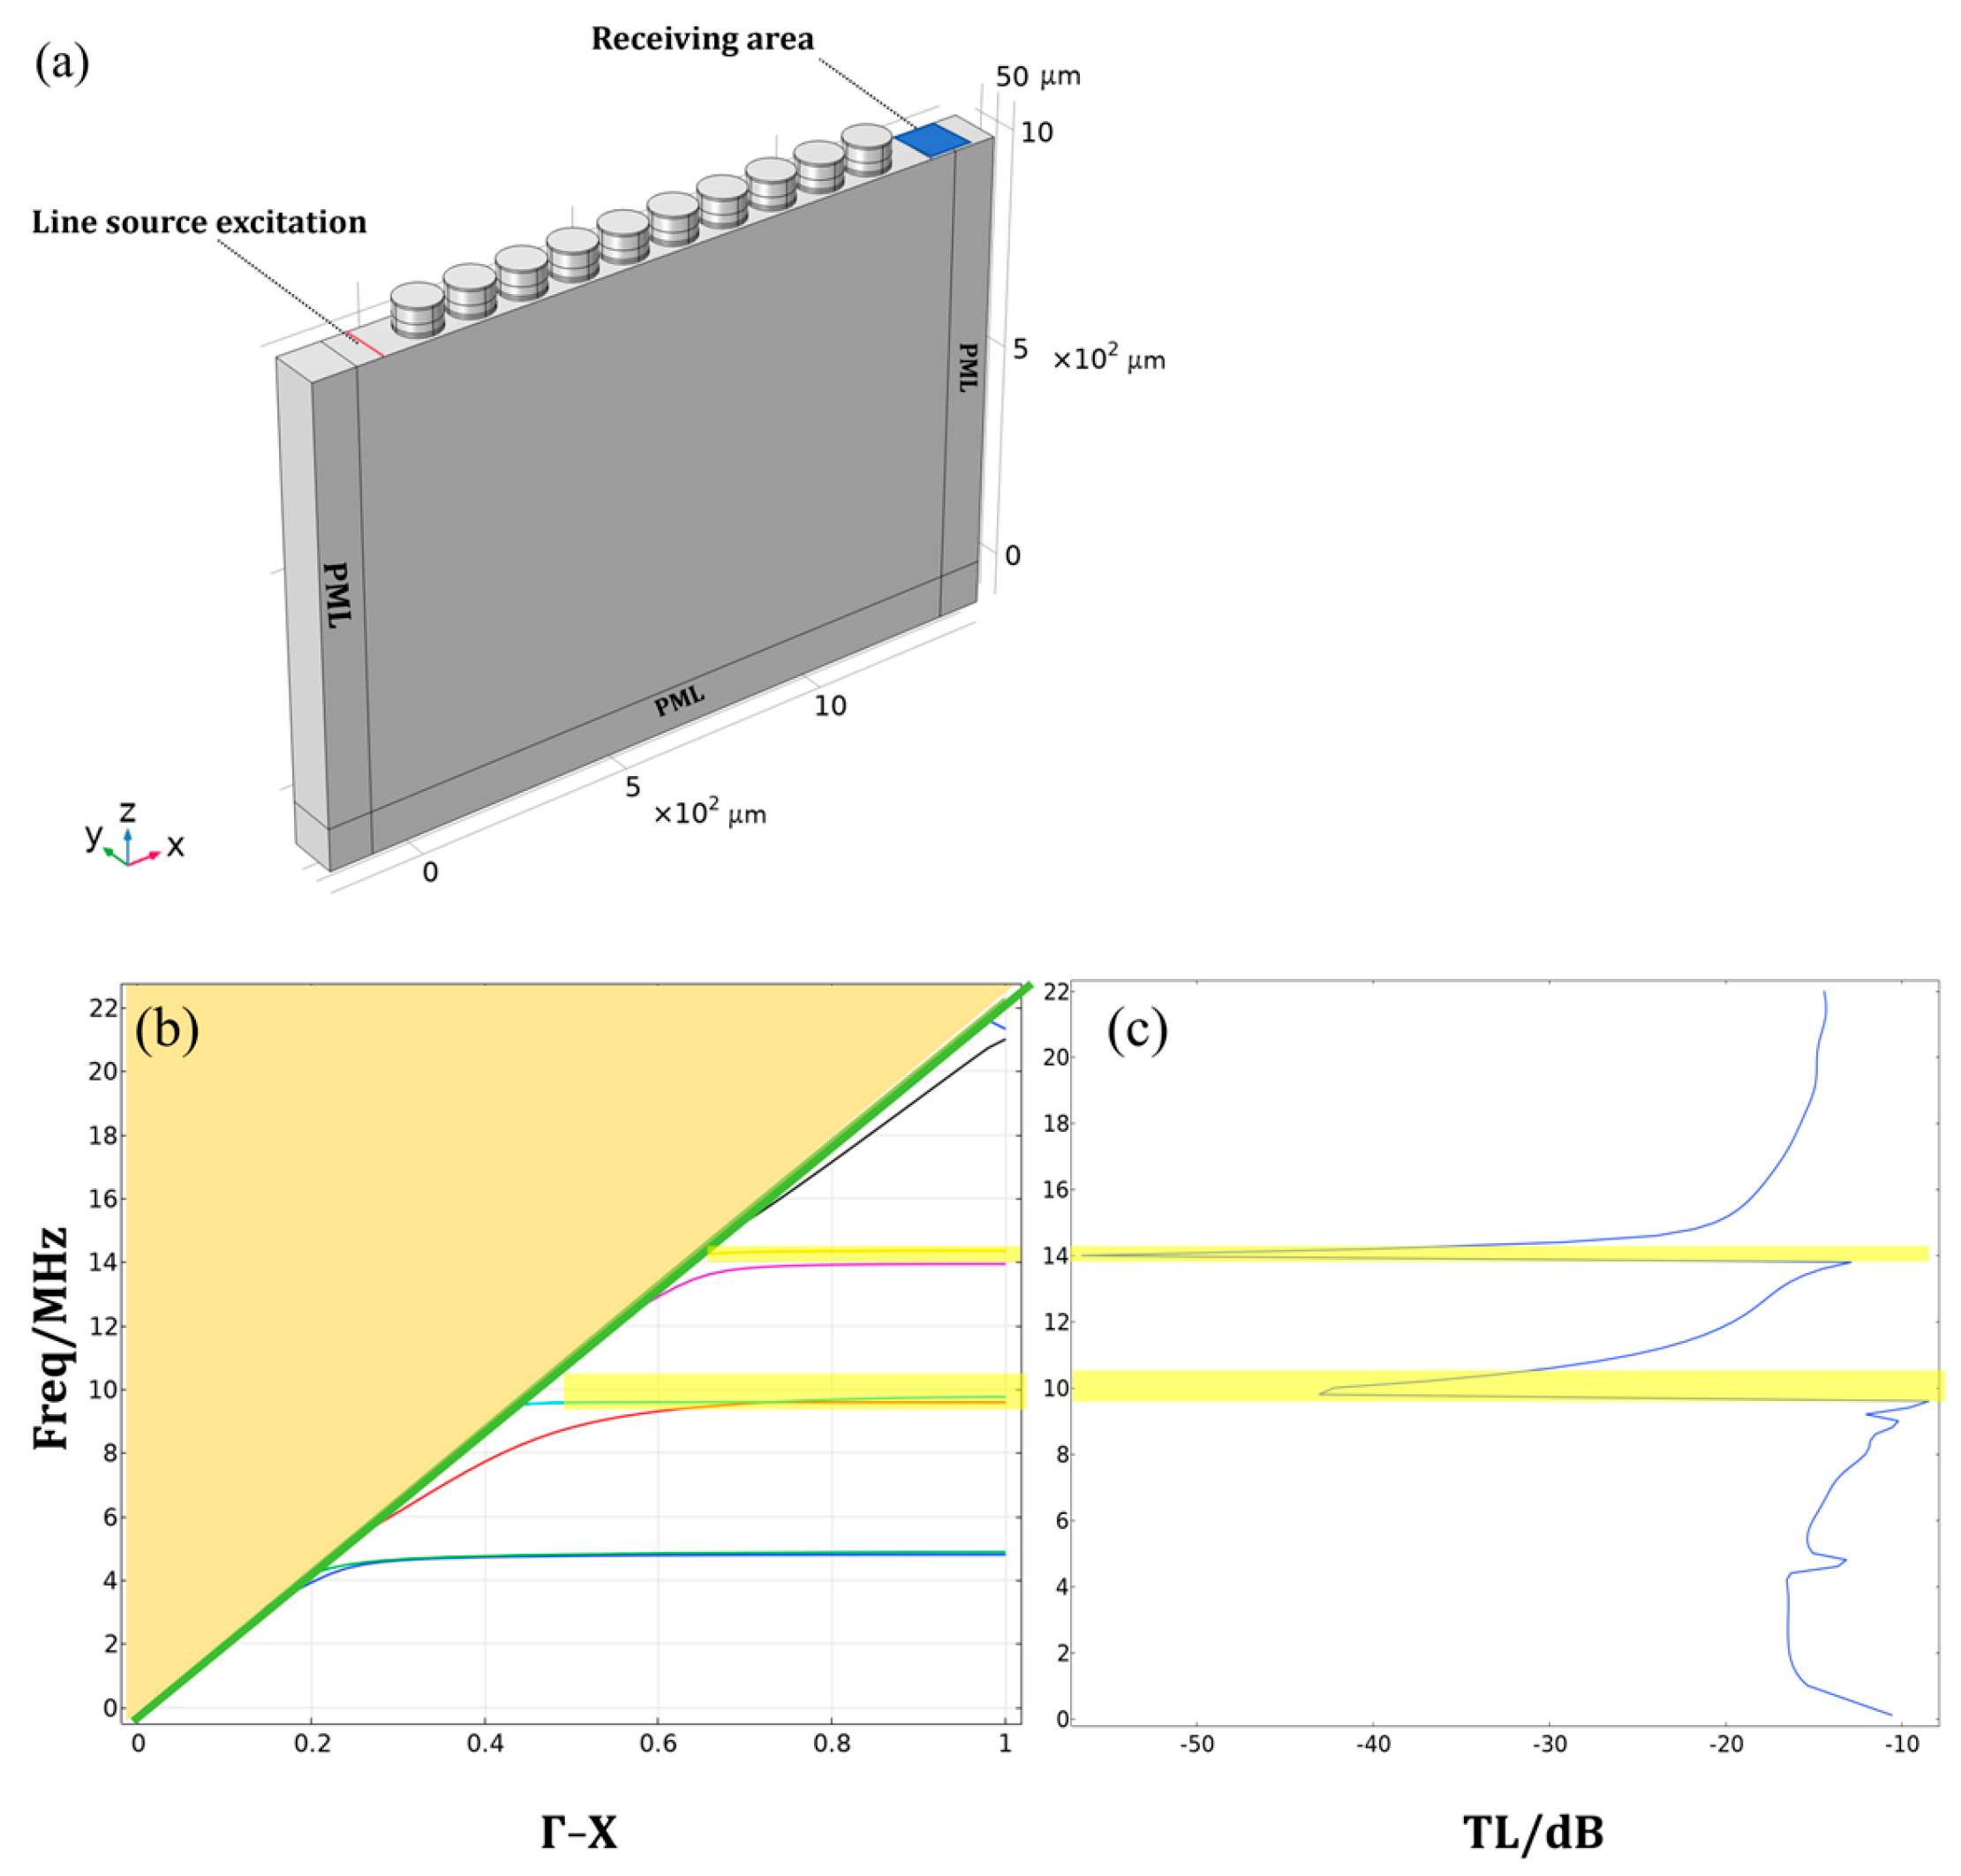
While simulations under infinite periodic conditions provide critical insights into the band structure and bandgap positions, they do not directly reflect the transmission characteristics essential for practical applications. To further characterize the device performance, a finite-period finite element model (FEM) was constructed following the initial unit-cell study, as illustrated in Figure 6a. This configuration employs a structure with ten finite periods to evaluate the actual wave attenuation. A line source is positioned on the substrate surface at the left boundary of the finite array within the y-z plane to excite incident SAWs propagating along the x-direction. By applying Bloch-Floquet periodic boundary conditions (PBCs) along the y-direction, the model effectively simulates a structure of infinite extent transverse to the propagation path. At high frequencies (i.e., short wavelengths), the vibrational displacement on the free surface is predominantly governed by SAW modes, effectively decoupling from bulk-wave interference. To ensure numerical accuracy and eliminate non-physical reflections from the geometric boundaries, Perfectly Matched Layers (PMLs) are implemented at both longitudinal ends of the FEM model. These layers serve as non-reflective sinks that absorb incident waves, thereby facilitating the accurate extraction of the acoustic transmission spectra across the defined frequency range.
Figure 6.
(a) Acoustic transmission spectrum of a finite periodic unit cell arrangement, with the number of unit cells set to 10. PMLs are added around the arrangement. A line source is placed on the left side of the top surface for excitation, and a rectangular area on the right side of the unit cell arrangement is set up to receive the signal. (b) Bandgap diagram for an infinite period where different colored lines represent different characteristic frequencies; (c) Sound transmission curve from a COMSOL Multiphysics 6.1 simulation for a finite period By comparing the two figures, it can be seen that there are directional bandgaps in the yellow regions.
Based on the infinitely periodic device unit cell model drawn earlier, the ‘Array’ option on the geometric module was selected to extend the unit cell in the x-direction, and identical PML were added at its left and right ports to reduce the impact of reflections on the model. For the excitation line source, the ‘Line Load’ in the Solid Mechanics module of the physical field was selected to excite the planar acoustic surface wave. The top surfaces at both ends of the model were set to ‘Define-Integration’ to measure the vibrational displacement at both ends. After the simulation is completed, the post-processing stage is carried out under the research module. Plotting the vibration displacement data obtained from the membrane-support structures at both ends of the device gives the device’s acoustic transmission spectrum.
In acoustics, transmission loss TL is generally defined as
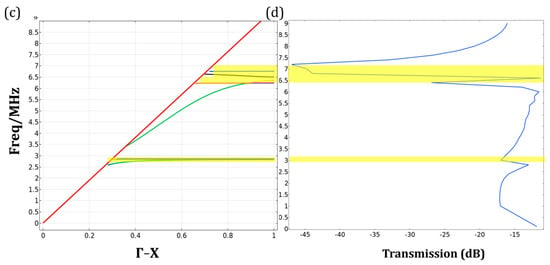
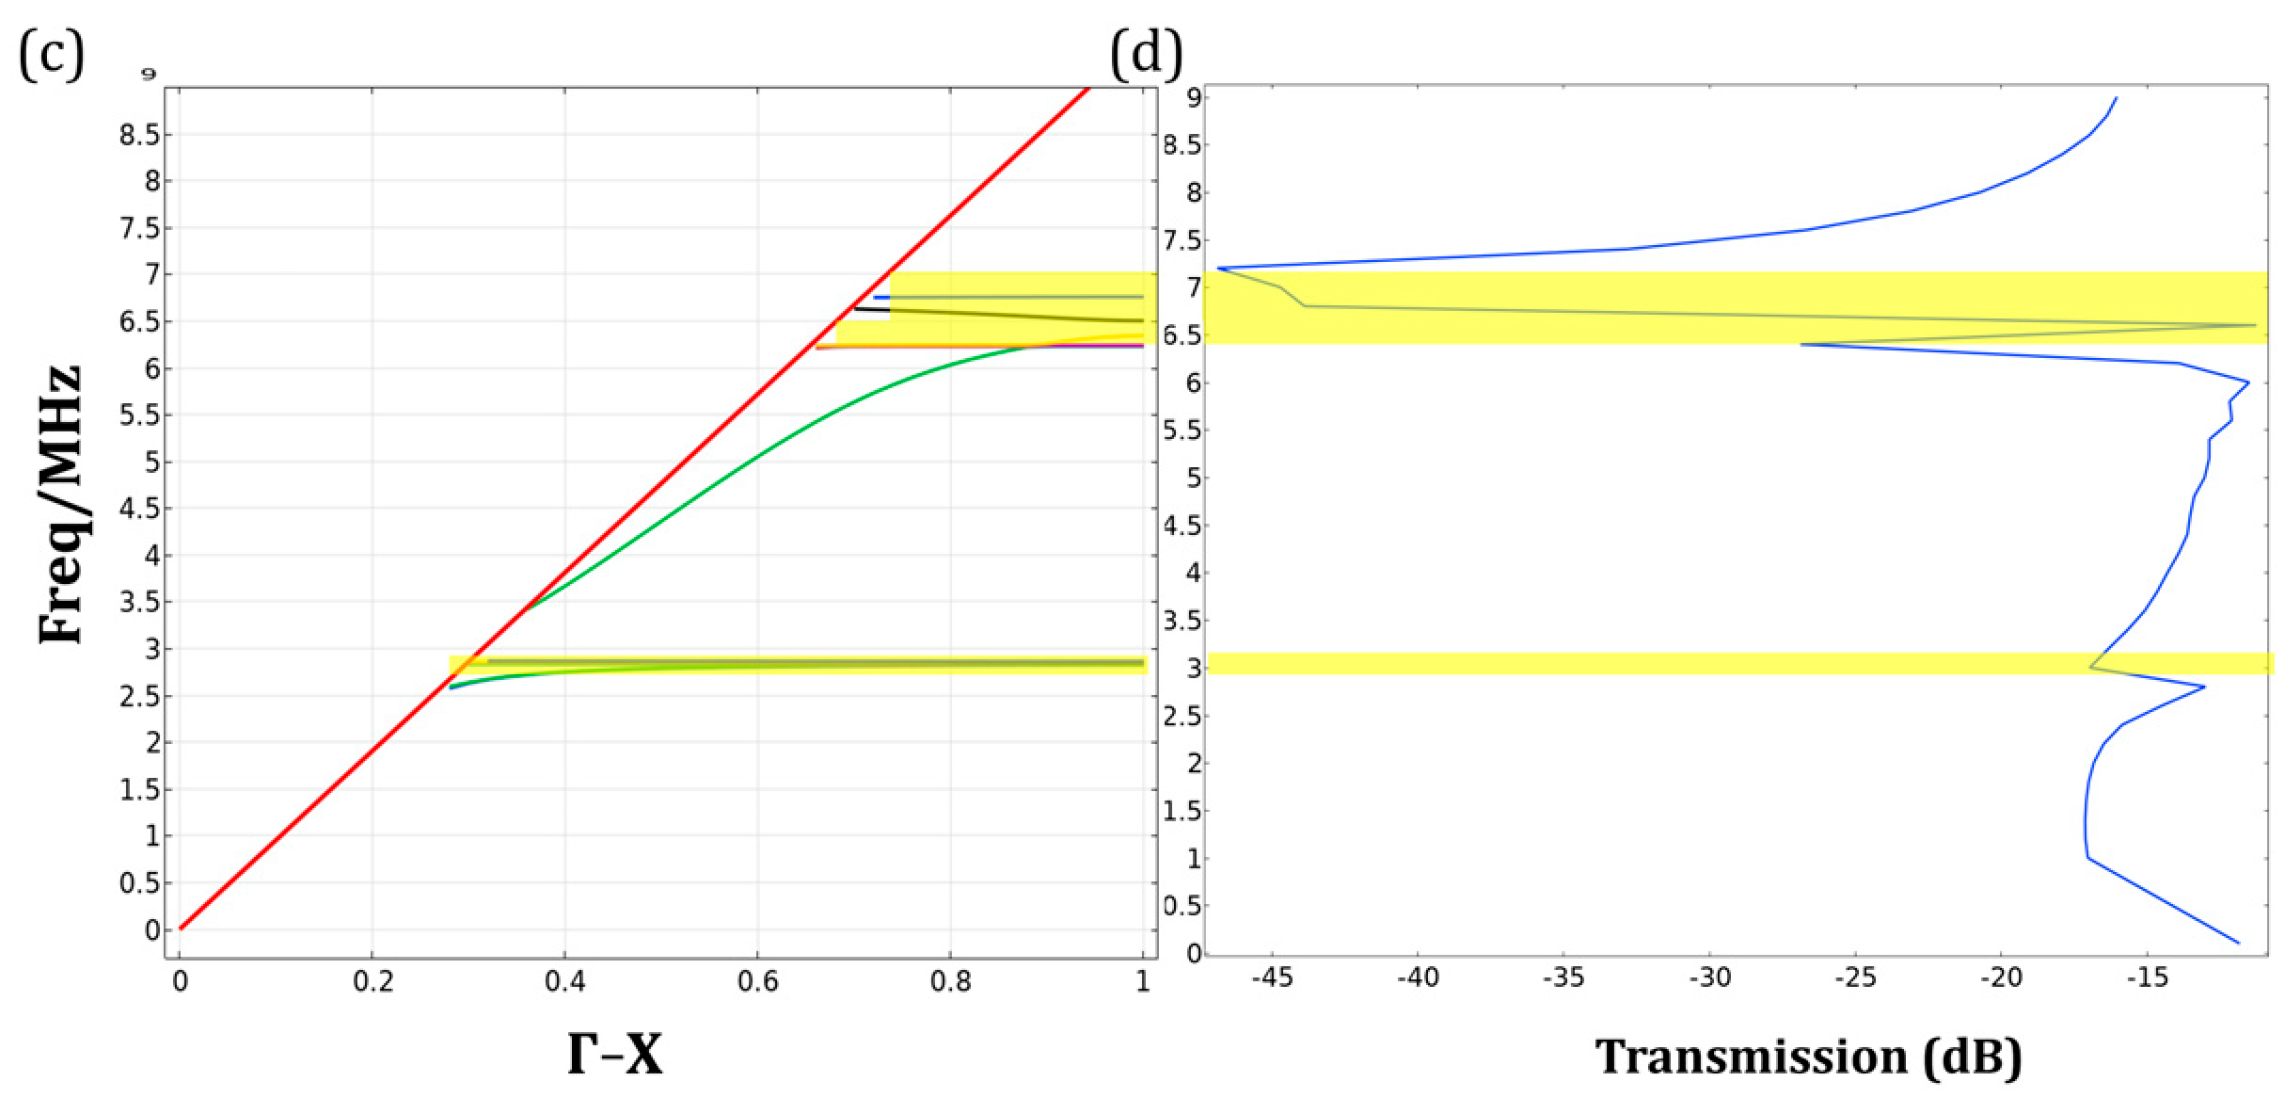
Here, Uout and Uin denote the average displacement amplitudes of the incident and transmitted surface waves, respectively, integrated over the x-y plane. As illustrated in Figure 6b,c, the pronounced attenuation zones in the transmission spectra, highlighted by the yellow-shaded regions, exhibit high consistency with the theoretical bandgaps calculated. The physical significance of this alignment lies in the wave-structure interaction: when the frequency of the Surface Acoustic Waves (SAWs) falls within the bandgap range, the periodic arrangement of the CMUT cells induces destructive interference (via Bragg scattering or local resonance). This mechanism effectively prohibits wave propagation through the lattice, resulting in a sharp drop in transmission amplitude.
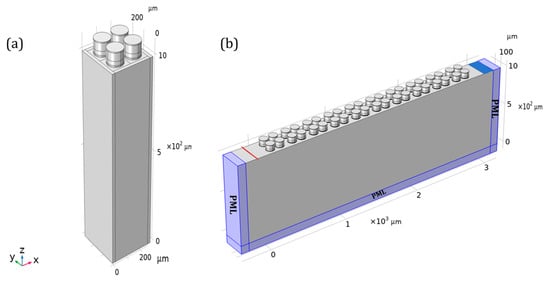
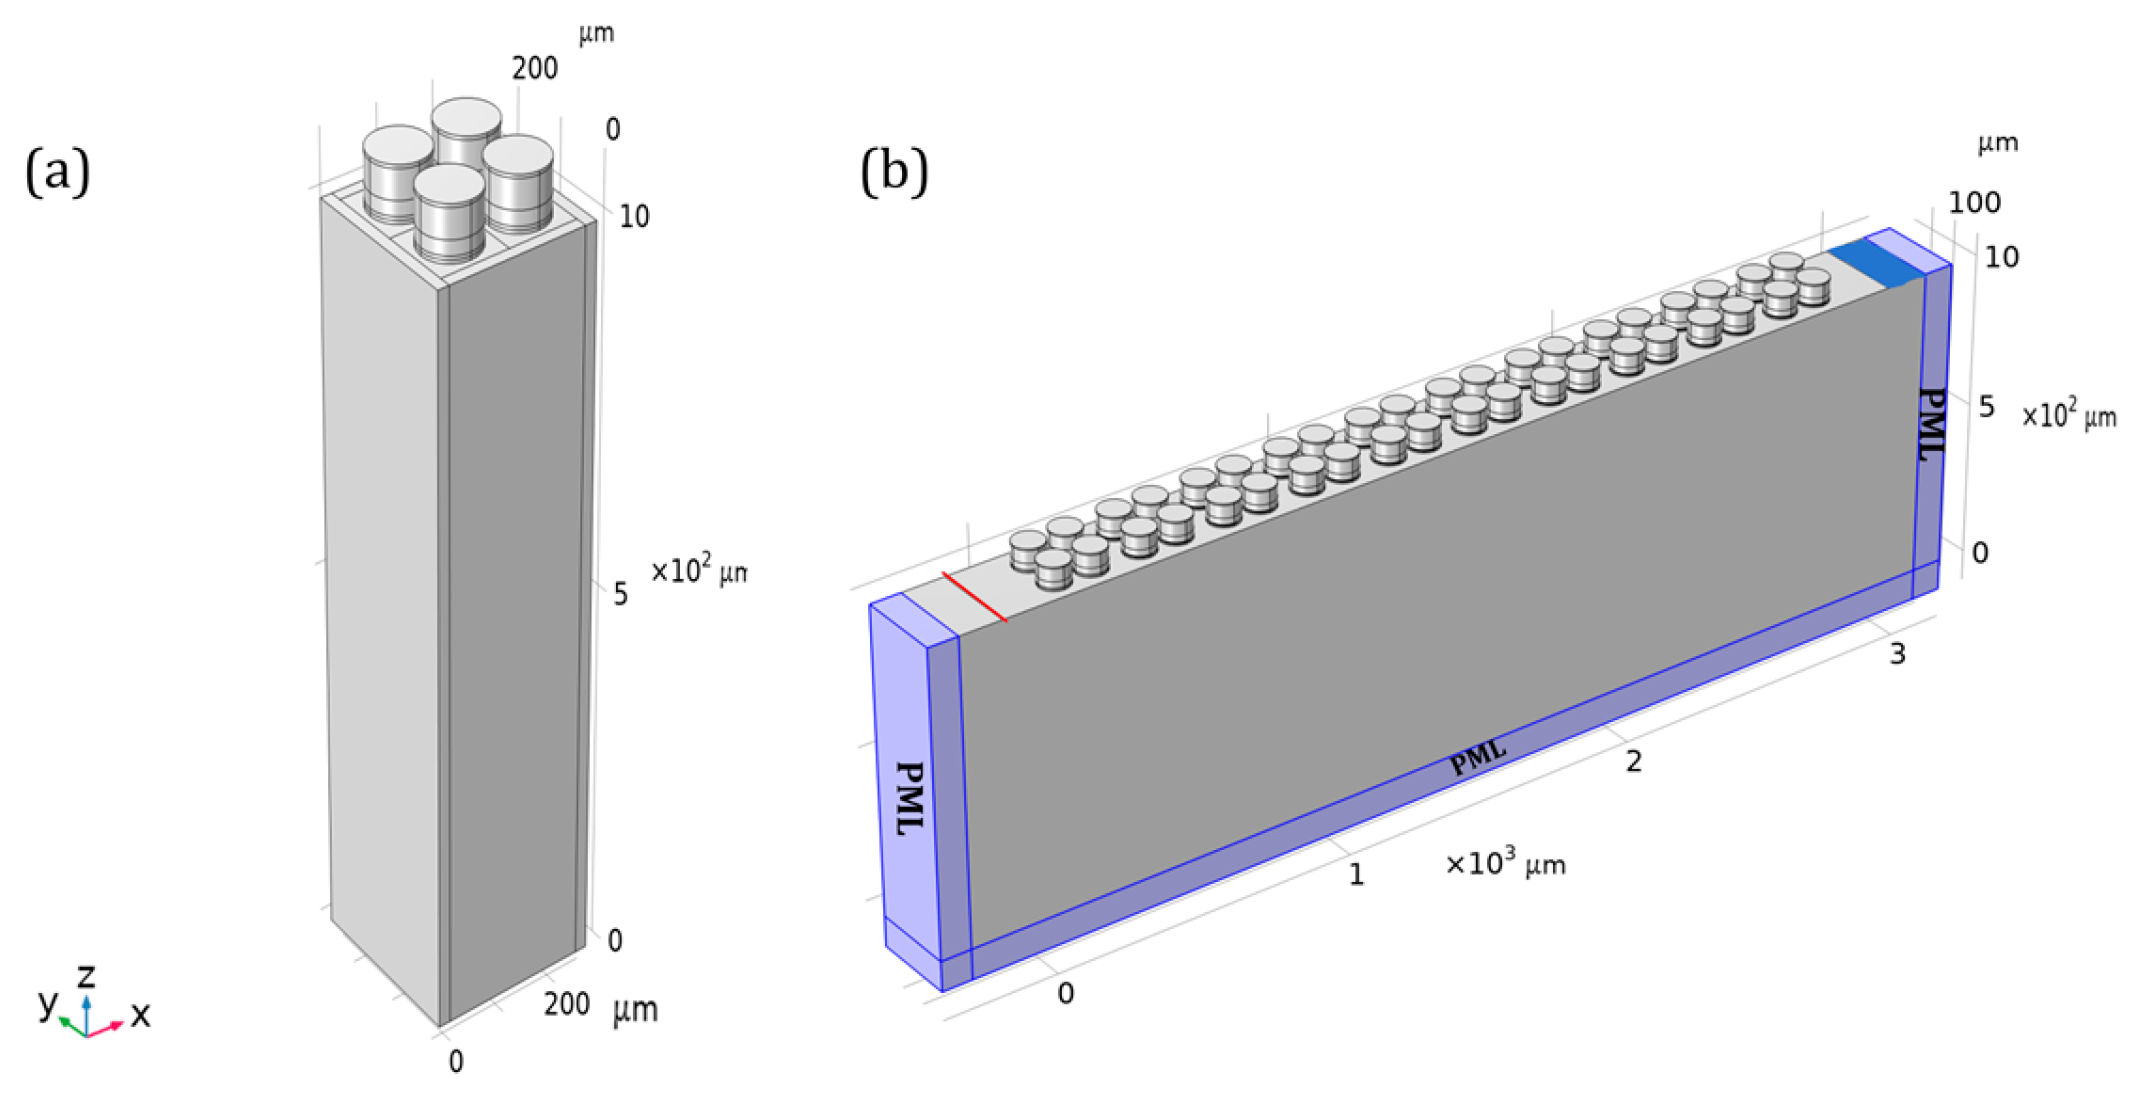
After performing COMSOL Multiphysics 6.1 simulations for both infinite and finite periods on the unit cell based on a single CMUT process, the unit cells were arranged geometrically to design a 2 × 2 array structure. The completed single cell was used as the basic building block and translated along the x and y directions in-plane with the lattice constant a0 as the period. In this way, each direction was replicated twice, resulting in 4 identical microstructure units. The geometric dimensions of the 2 × 2 array elements are shown in Table 3. The material parameters of the single cell from earlier were retained, and the geometric size of the single 2 × 2 array unit was designed to be twice the lattice constant of a single unit cell. When considering the design periodicity, a gap of a0/3 was set between array unit cells with a lattice constant of 2 × a0. In the transition from a single constitutive unit to a 2 × 2 array configuration, a specific gap of a0/3 was strategically introduced between adjacent CMUT cells. This design choice departs from a simple spatial replication and is grounded in several physical considerations. By modulating the inter-cell distance, the translational symmetry of the supercell is modified, which effectively prevents the premature flattening of dispersion branches and facilitates the formation of a more robust, continuous bandgap.
Table 3.
Basic geometric parameters of CMUT 2 × 2 array element.
Studying the transition from a single cell to a 2 × 2 array unit is very necessary. In theoretical analysis (such as Bloch’s theorem), we often assume that the structure is spatially infinitely periodic. However, practical devices inevitably have finite dimensions. This 2 × 2 array serves as a basic segment of a finite-period structure. By studying the scattering and transmission characteristics of surface acoustic waves by this segment, we can evaluate the impact of finite-size effects on the theoretically expected performance of metamaterials. The 2 × 2 array serves as a bridge connecting microscopic unit cell design with macroscopic wavefield control. Its establishment allows us to move from studying the resonant characteristics of a single structure to investigating the coupling, interference, and overall beam control functions among arrays, laying a solid structural foundation for subsequent research on dynamic control and optimization methods of surface acoustic waves. Based on the 2 × 2 unit cell, the corresponding finite periodic transmission spectrum model was established using COMSOL Multiphysics 6.1 in Figure 7b, and the bandgap diagram (Figure 7c) and the transmission spectrum under finite periodicity (Figure 7d) were obtained accordingly.
Figure 7.
(a). Geometric model construction of the array element. (b) Acoustic transmission model of the finite periodic array. (c) Dispersion curve of a 2 × 2 array element, where different colored lines represent different characteristic frequencies. The solid red line represents the vocal range. (d) Acoustic transmission spectrum corresponding to the array element, specifically the solid blue line in the above figure. (c,d) Both show the yellow area indicates that the device has a directional bandgap in this frequency range.
4. Research on Device Optimization Methods
Following an investigation into the dispersion curves and finite-period acoustic transmission characteristics of the device using COMSOL Multiphysics 6.1, which treats three distinct device parameters. The membrane radius r, the cavity radius r1, and the cavity height h1—as variables, focusing specifically on exploring the influence of a multi-parameter-constrained CMUT on surface acoustic waves [21,22,23,24].
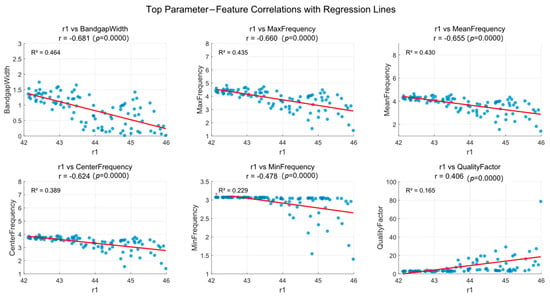
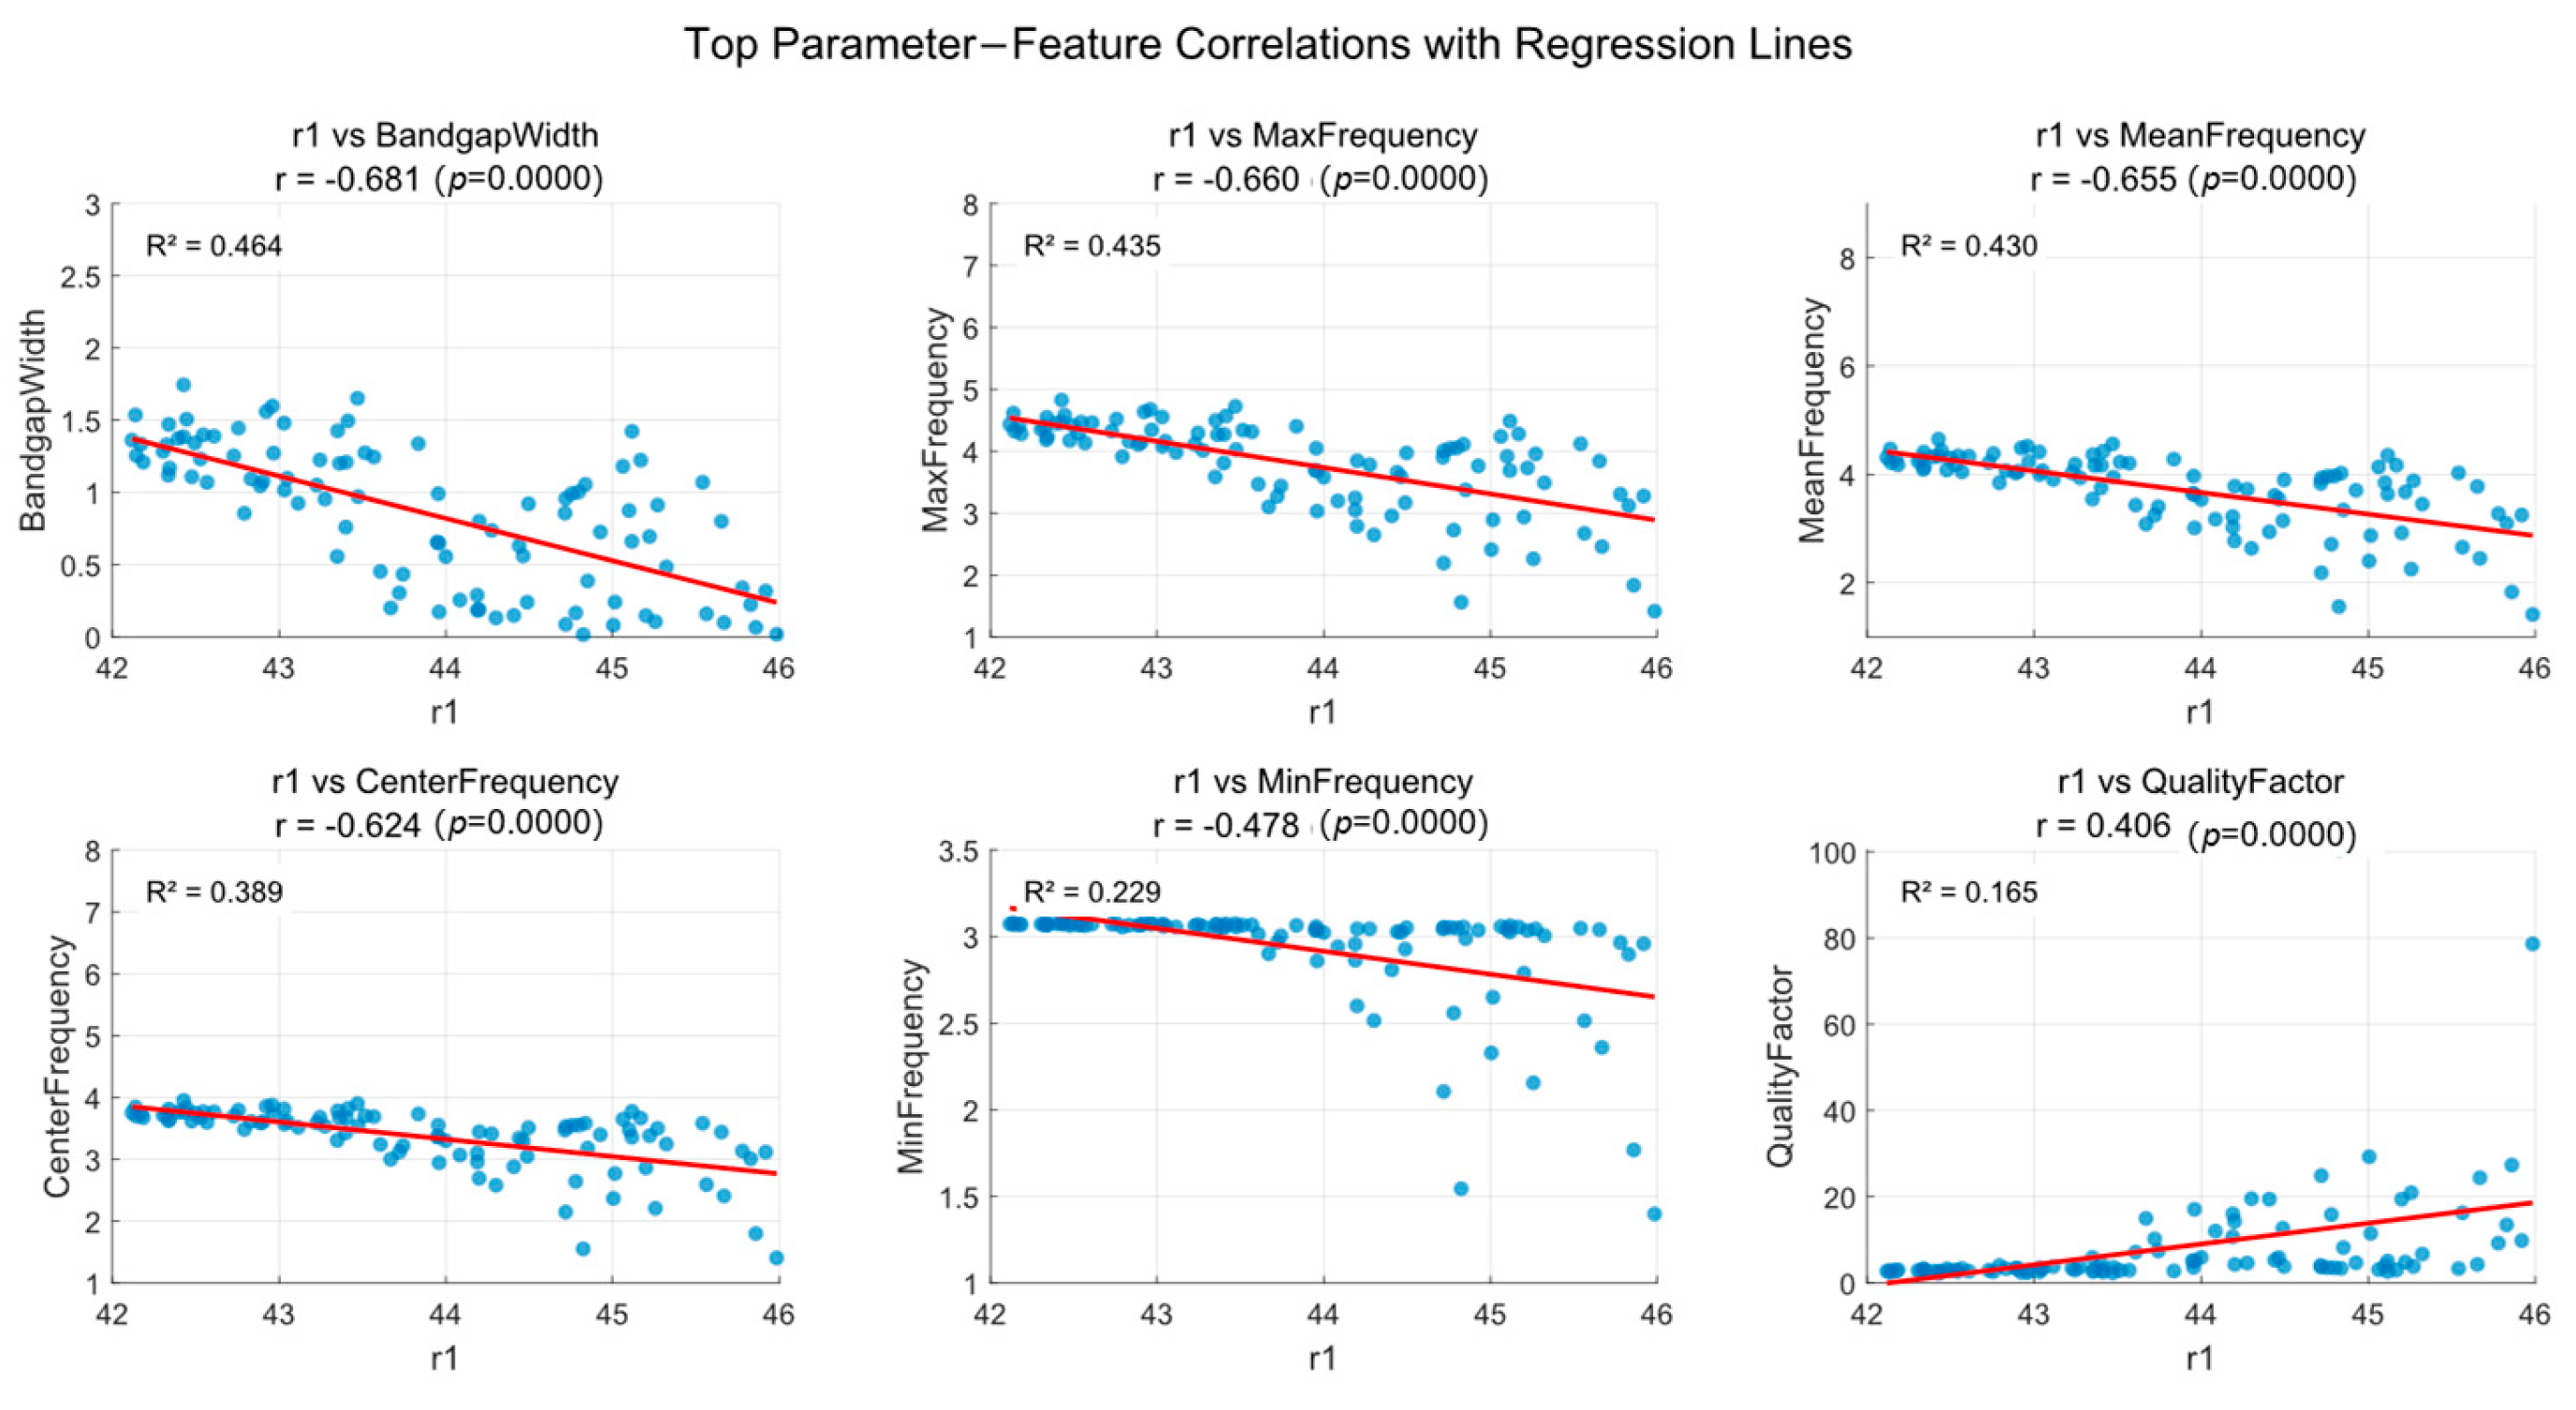
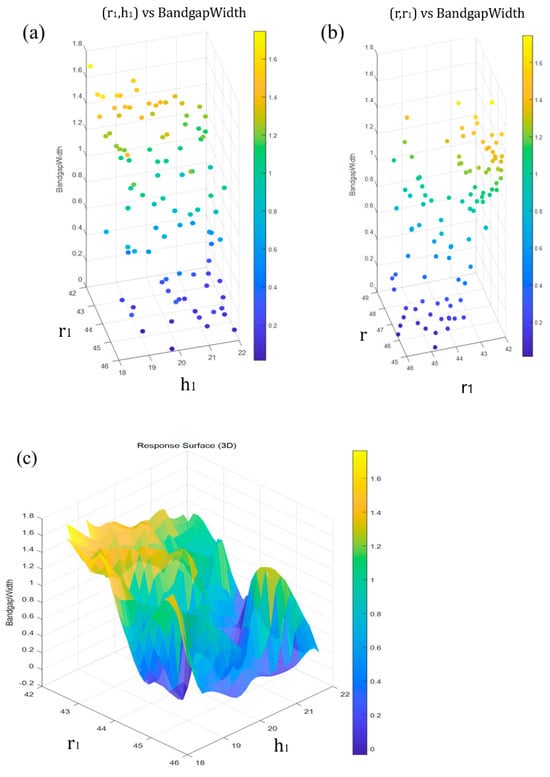
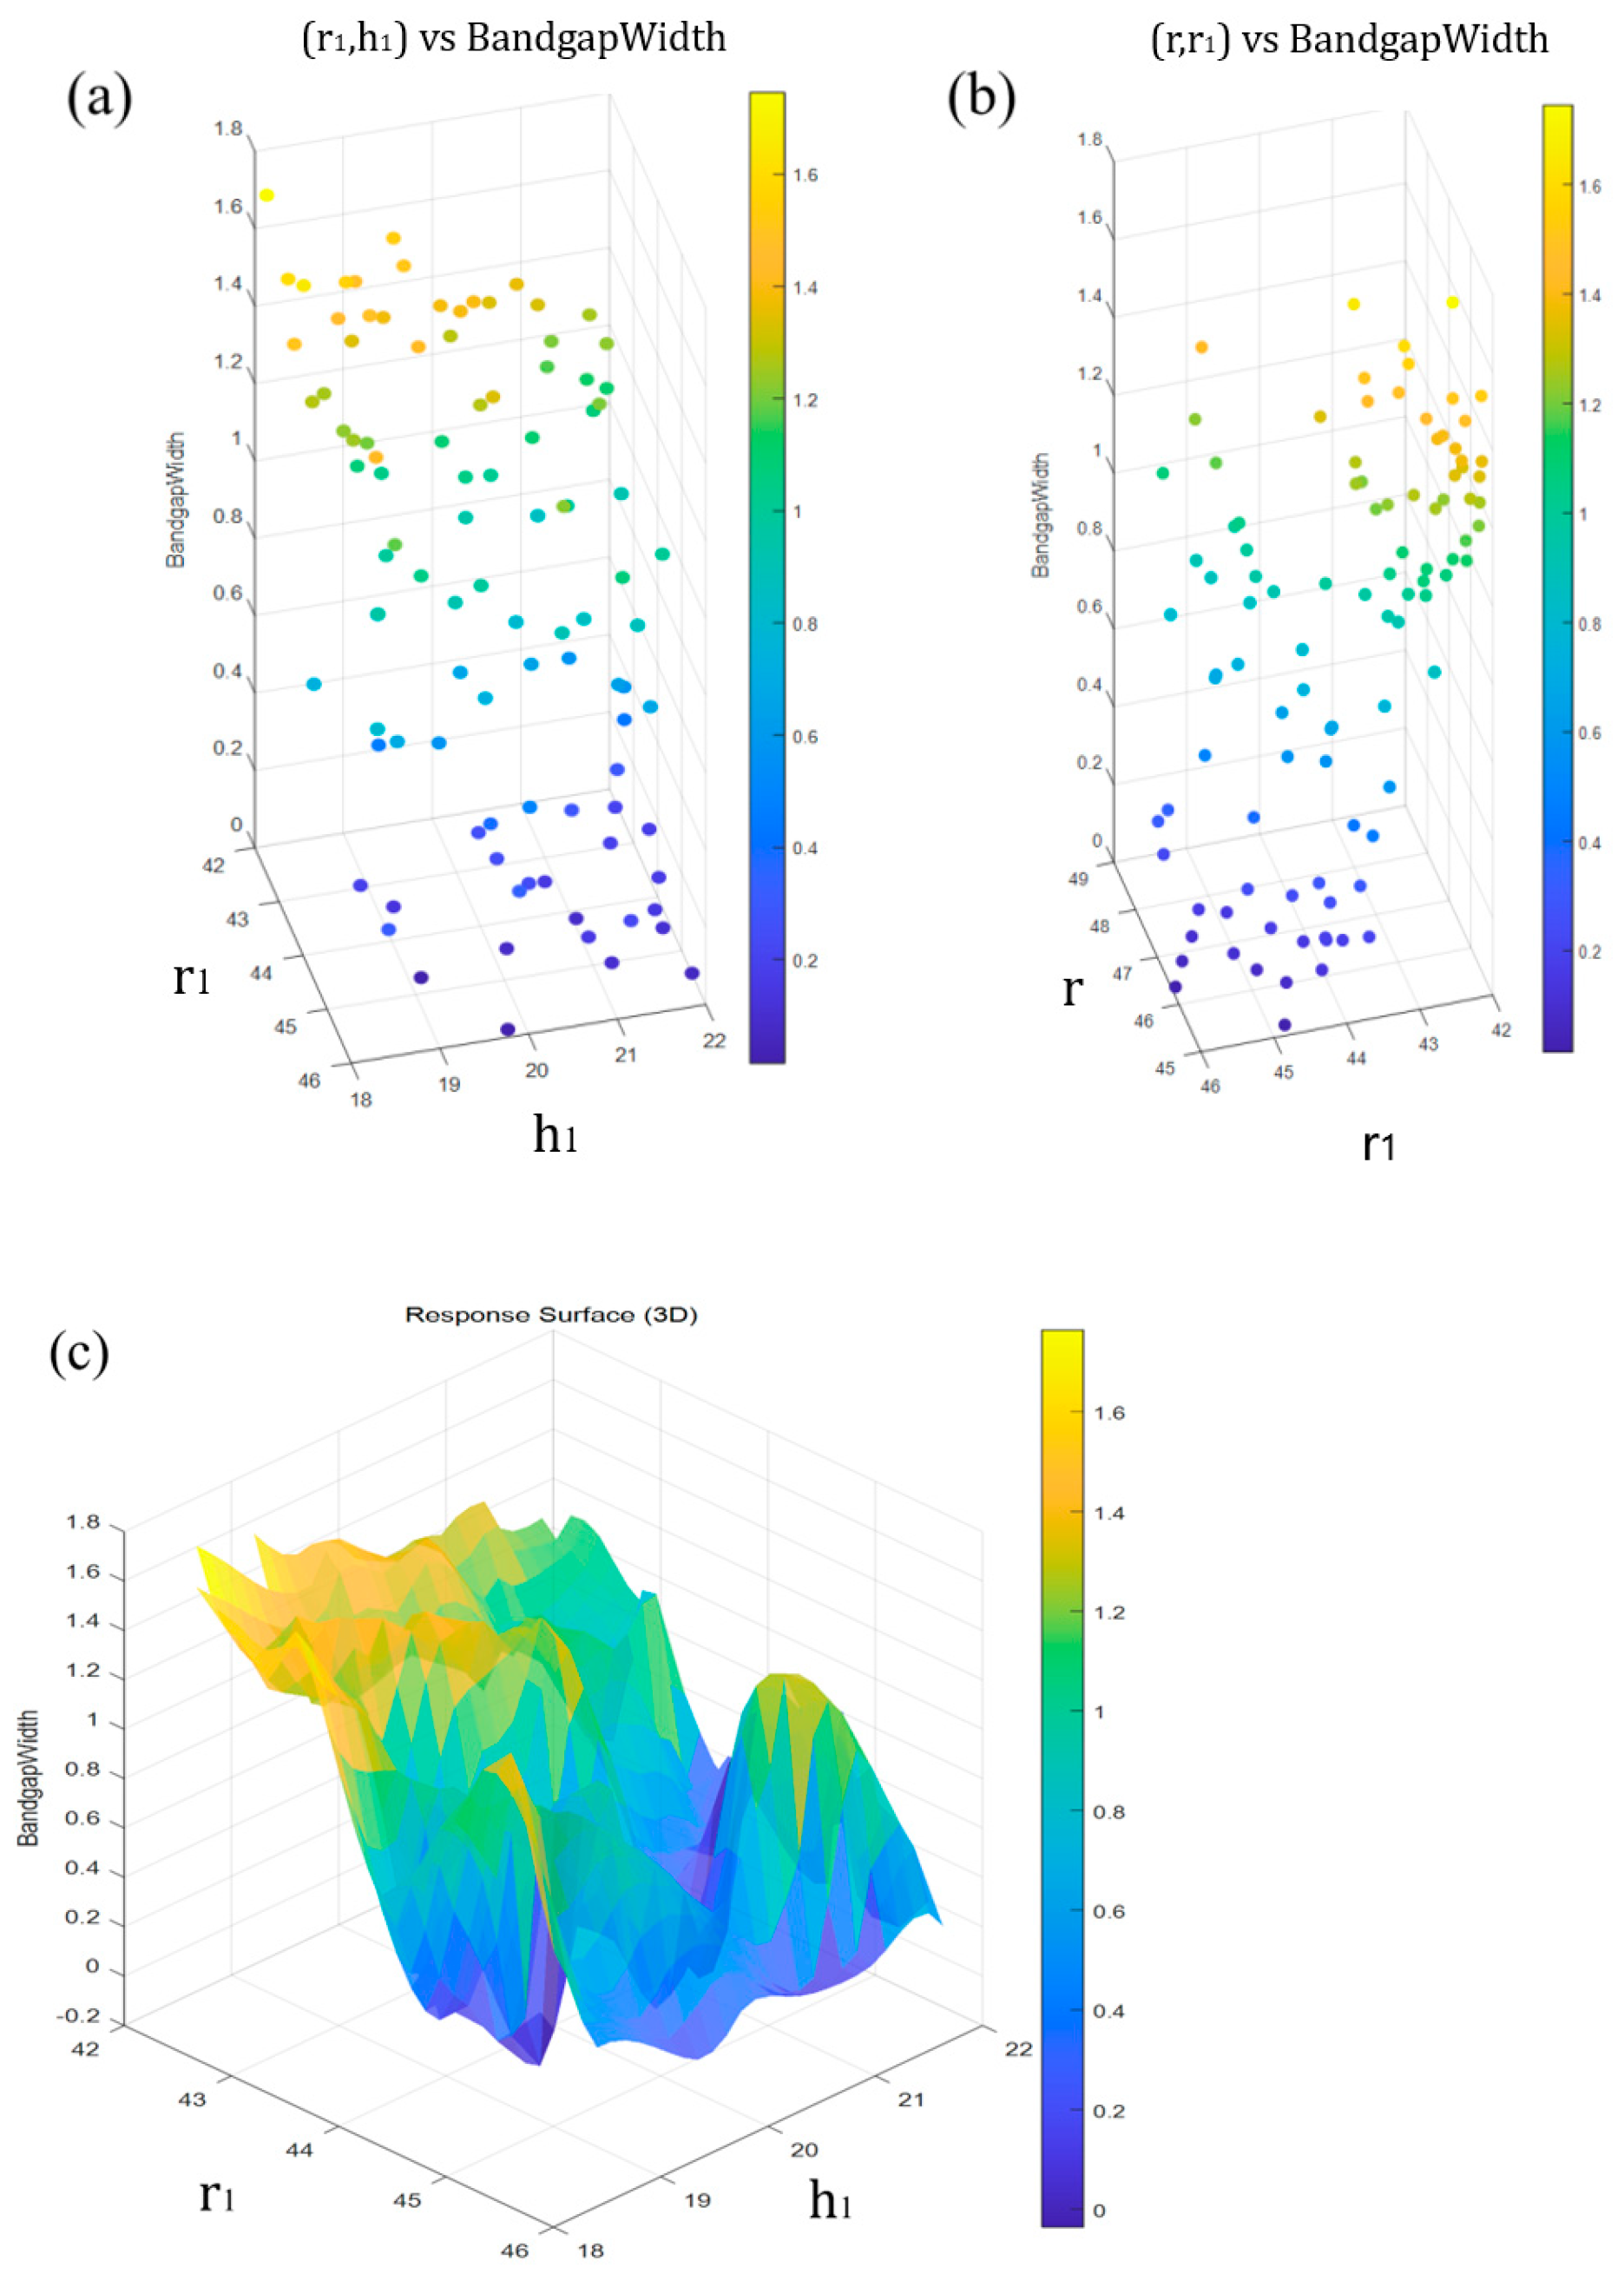
The following section examines how parameters influence characteristic values. Figure 8 presents a multivariate regression analysis, demonstrating the strongest linear correlation between parameter r1 and key parameters including bandgap width, peak frequency, and center frequency. This analysis reveals r1’s impact on six core physical properties of the system. Statistical results confirm r1 exhibits linear relationships with all parameters (p < 0.0001). The specific patterns are as follows: In terms of frequency and bandwidth, r1 exhibits with both bandgap width (Bandgap Width) and various frequencies (Max, Mean, Center, Min Frequency). This indicates that as r1 increases, the system’s effective operating frequency shifts toward lower frequencies, accompanied by a narrowing of the bandgap. Among these factors, r1 has suggests a trend of bandgap width (R2 = 0.464), confirming it as the key variable controlling bandwidth. The quality factor (Quality Factor) is the only metric that improves with increasing r1, while certain trends are statistically observable, the physical control over the quality factor is relatively weak and likely influenced by other coupled mechanisms. That statistical significance is a supportive tool for identifying trends rather than a definitive proof of deterministic physical control. Figure 9 clearly illustrates the complex relationship between parameter combinations and the resulting bandgap. In Figure 9a,b, points at different locations represent different parameter combinations, and different colors represent different bandgap widths. Figure 9c is a three-dimensional response plot, which clearly shows the complex relationship between a specific parameter combination and the bandgap. Different colors represent different bandgap widths.
Figure 8.
Top correlation multigraph regression analysis chart between phononic crystal parameters and characteristics, the linear regression chart shows the changes of parameter r1 with respect to indicators such as band gap width, maximum frequency, center frequency, and minimum frequency. The blue dots in the figure represent the structural visualization under different r1 conditions, while the red line represents the upward or downward trend of most of the blue dots within the parameter range.
Figure 9.
3D scatter plots visualizing the bandgap results for different parameter combinations. (a) shows the effect of the r and r1 parameter combination on the bandgap; (b) shows the effect of the r1 and h1 combination on the bandgap. 3D surface plot for combined parameters; (c) shows 3D surface plot for combined parameters.
Following the dataset generation and visualization via the COMSOL Multiphysics 6.1 with MATLAB interface, the subsequent optimization and predictive modeling were implemented in Python 3.10 By executing the integrated COMSOL Multiphysics 6.1 with MATLAB script, the geometric parameters r, r1 and h1 were varied within predefined ranges to generate approximately 300 data samples. Each sample contains dispersion characteristics essential for both forward performance prediction and inverse structural engineering. In the Python environment, a mapping algorithm was developed to associate each set of randomized geometric parameters with its corresponding bandgap characteristics [25].
To ensure data integrity, an automated bandgap identification protocol was introduced with a predefined threshold of 2.5 MHz. The choice of 2.5 MHz is mainly due to the constraints of the CMUT geometric parameters. A ‘valid bandgap’ is identified only if the frequency separation between adjacent dispersion branches exceeds this threshold; otherwise, the data is classified as a ‘null gap.’ This filtering process yielded a refined CSV dataset containing only effective bandgap values for model training. For the inverse design validation, twenty independent data sets were reserved for testing. The predicted geometric parameters for ten randomized target bandgaps were re-imported into the COMSOL Multiphysics 6.1 finite element environment for cross-verification. The results showed that the prediction accuracy was high.
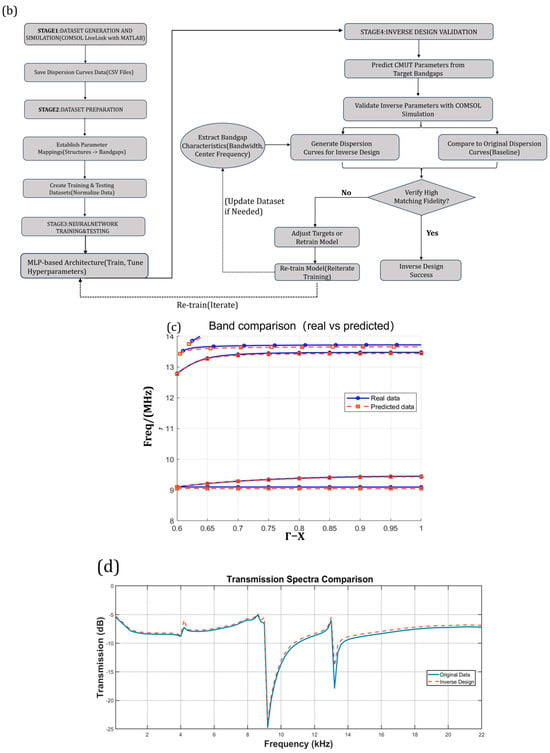
The neural network architecture employed in this study is illustrated in Figure 10a. This model consists of four fully connected layers, incorporating ReLU activation functions and Dropout regularization to accurately capture the intricate nonlinear mapping between geometric parameters and transmission spectrum features. In contrast to traditional iterative simulation methods, the trained model achieves an instantaneous inverse mapping from target bandgap specifications to structural parameters through a single forward propagation, significantly enhancing design efficiency. During the training phase, Mean Squared Error (MSE) was utilized as the loss function, complemented by the Adam optimizer and an adaptive learning rate decay strategy (ReduceLROnPlateau). The comprehensive optimization logic and multi-stage objectives are further detailed in the reverse design flowchart shown in Figure 10b.
Figure 10.
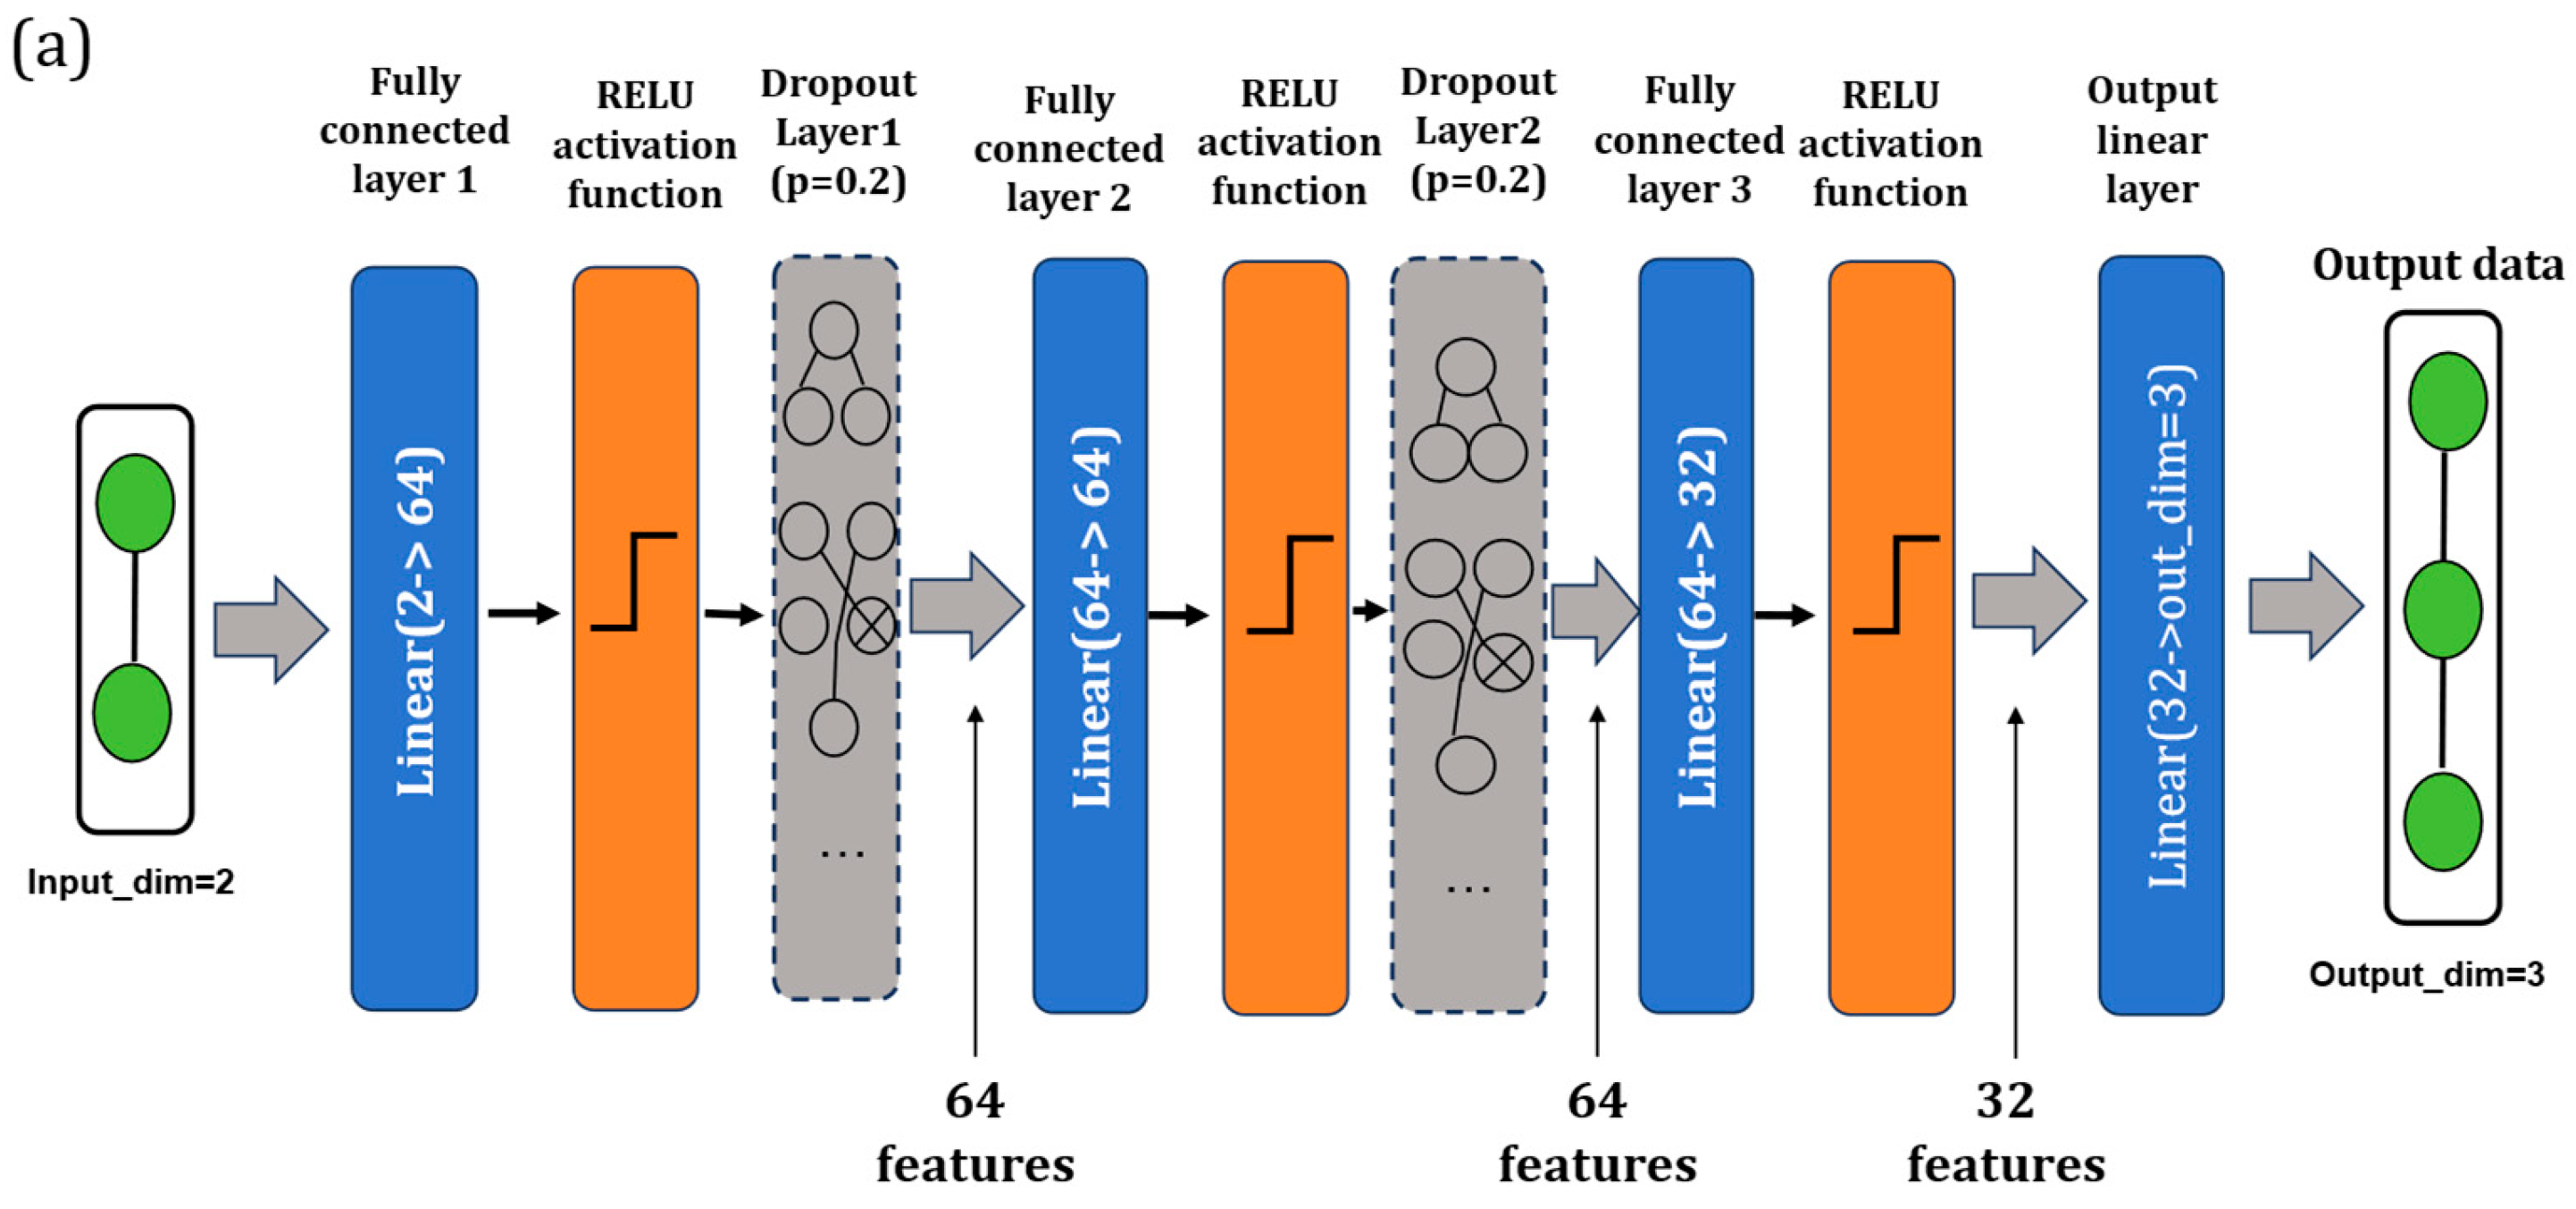
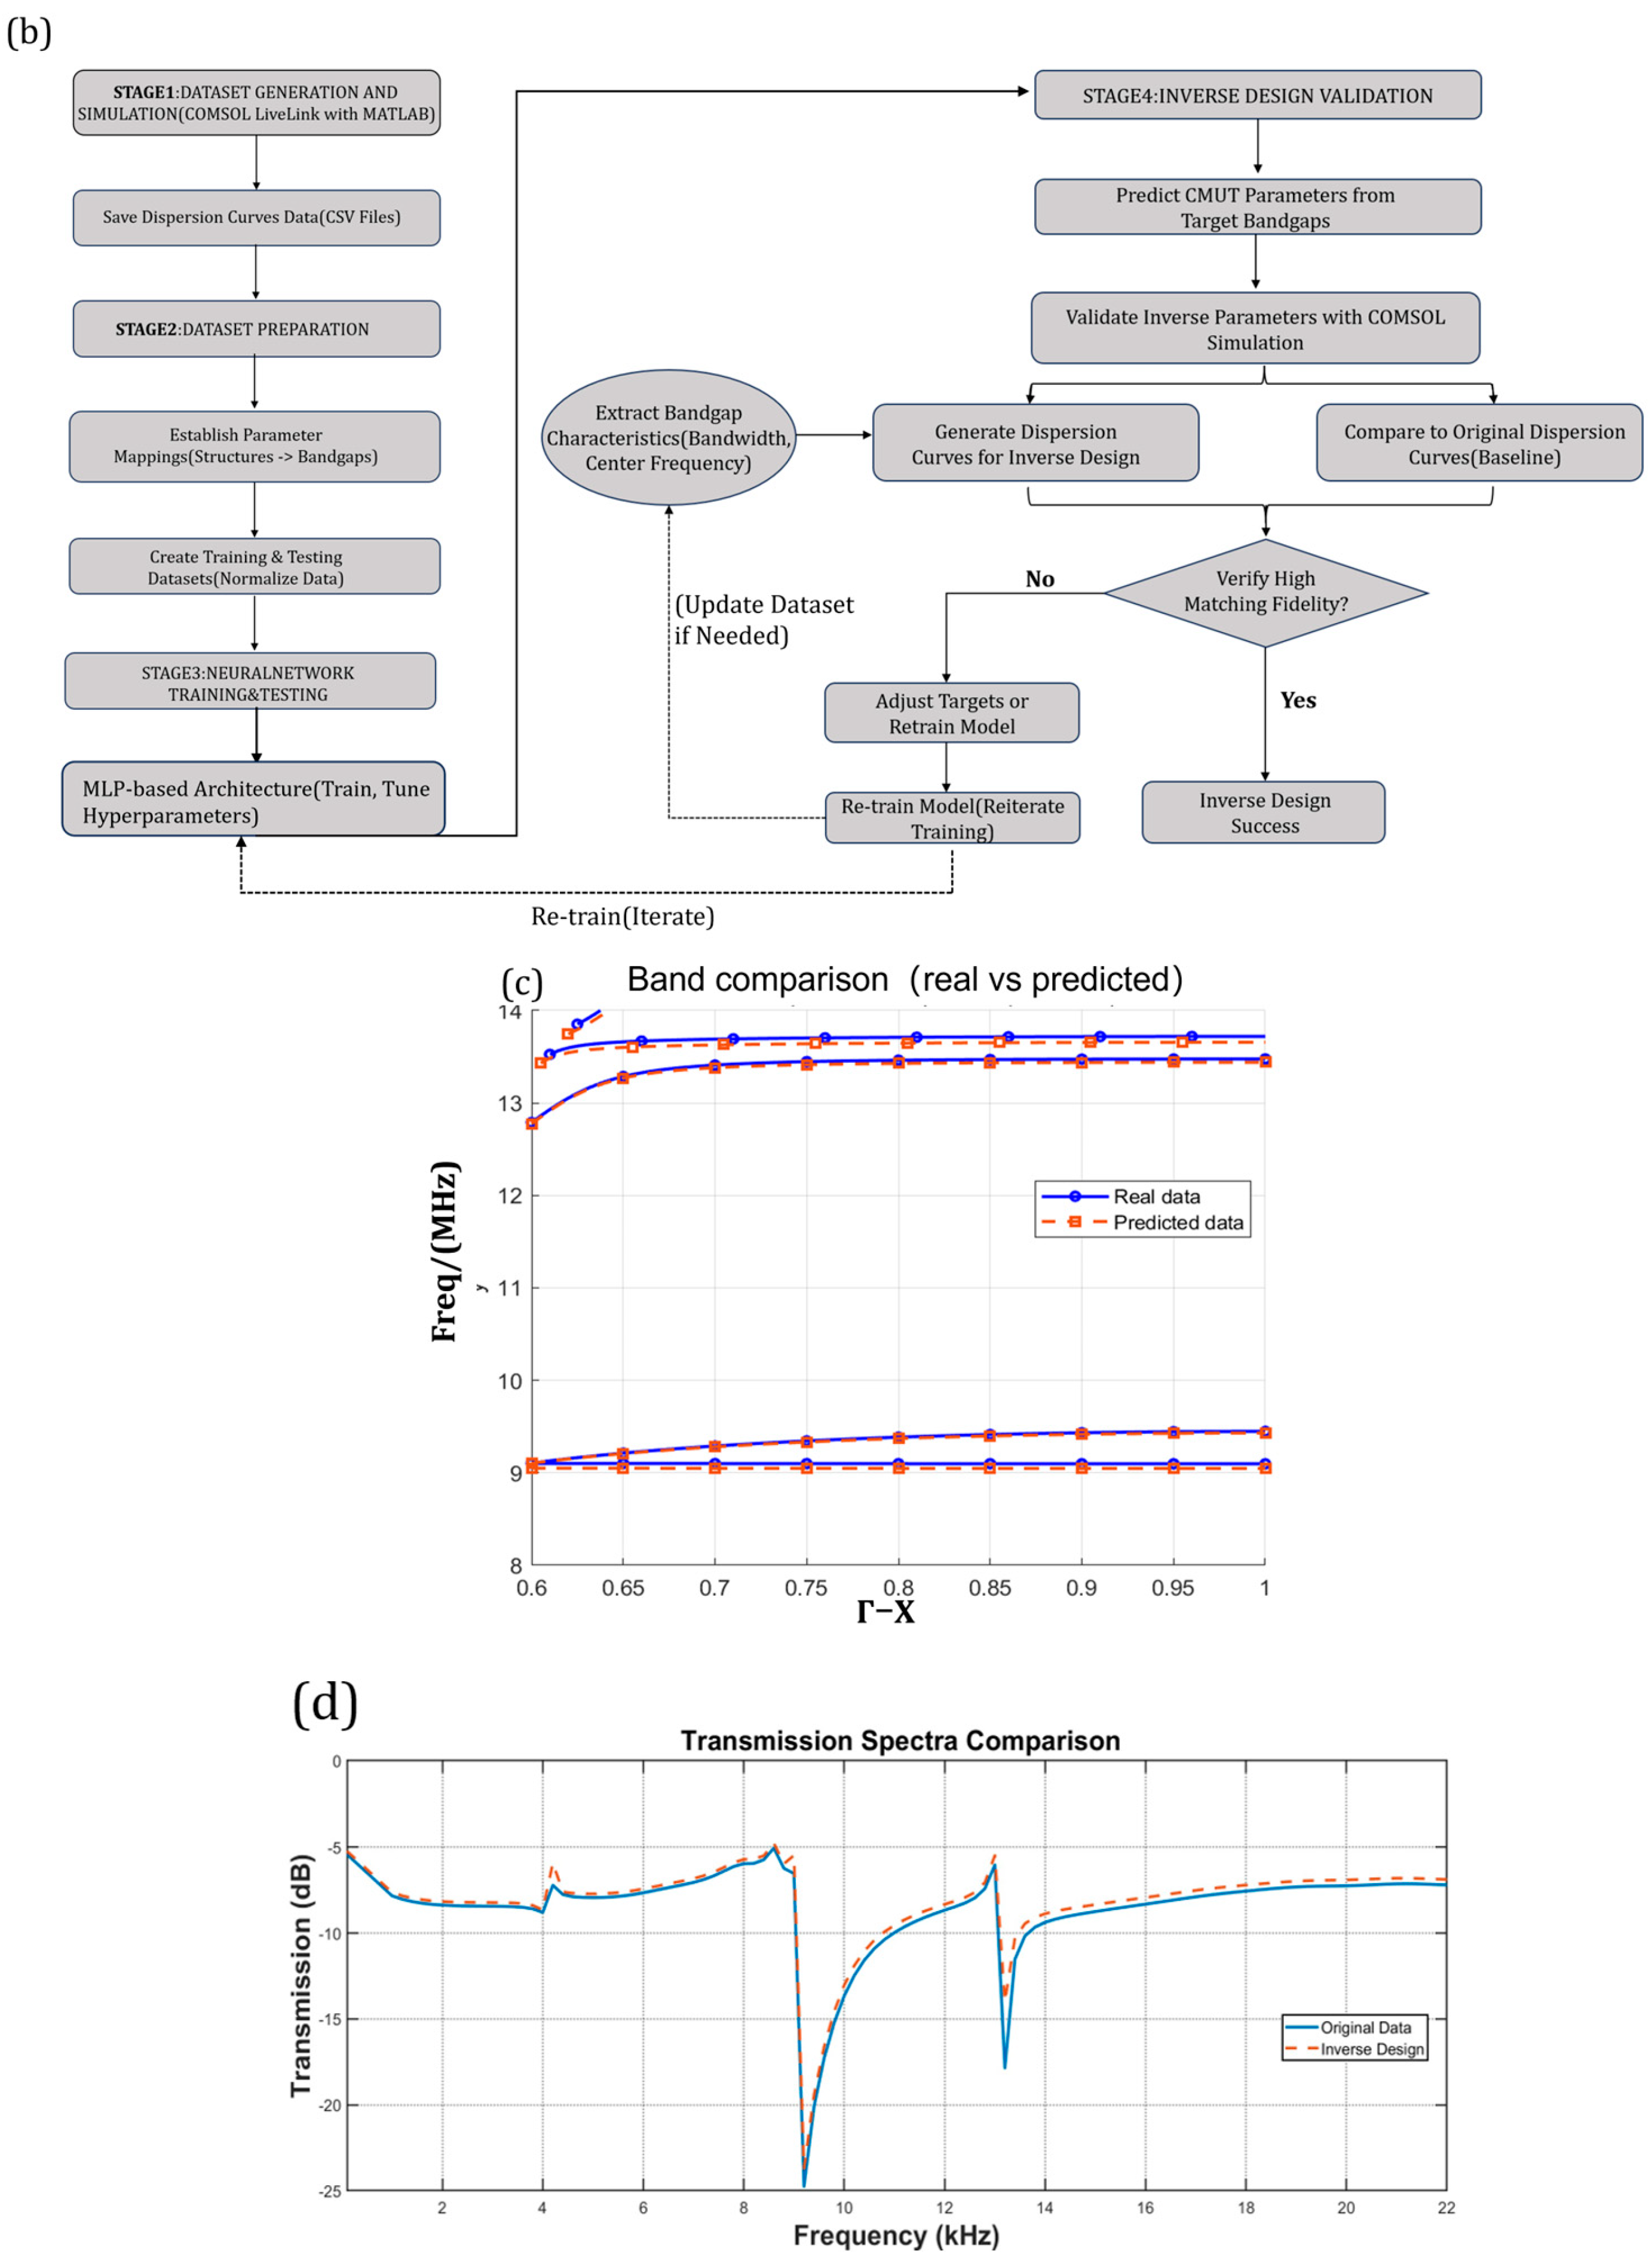
(a) Detailed schematic diagram of the neural network architecture based on MLP, The input consists of a 2-dimensional vector representing the target bandgap descriptors, specifically the lower edge frequency () and the upper edge frequency () of the desired bandgap; The output is a 3-dimensional vector corresponding to the predicted geometric parameters: membrane thickness (), cavity radius (), and lattice constant (). (b) Flowchart of the reverse design of surface acoustic wave closed loop controlled by CMUT. (c,d) Bandgap curves (blue) obtained from actual reverse design data and bandgap data curves (orange) drawn after reverse design.
The inverse design results were cross-validated using COMSOL Multiphysics 6.1 for both phononic band structures and finite transmission spectra, as presented in Figure 10c,d. To verify the model’s reliability, randomized test cases were re-simulated; for instance, using sample, both the ground-truth and the network-predicted geometric parameters were modeled. The resulting dispersion curves for infinite periodicity and the acoustic transmission spectra for finite structures were overlaid for direct comparison. The numerical results demonstrate excellent agreement between the predicted and original configurations, with a maximum discrepancy of less than 3%.
5. Conclusions
In summary, this research systematically investigates the modulation of SAWs through periodic CMUT architectures and proposes a robust deep-learning-based methodology for the inverse design of geometric parameters. The comprehensive work and contributions of this study are summarized as follows:
First, by treating the CMUT array as a phononic crystal, we established a precise FEA of the unit cell to analyze its band structure under infinite periodic conditions. This allowed for the identification of SAW bandgaps and a clear understanding of how geometric variables—such as membrane radius and thickness—physically govern wave propagation. Second, to bridge the gap between theory and application, we simulated the acoustic transmission spectra of finite periodic structures. The results confirmed the effectiveness of the predicted bandgaps, showing significant suppression of SAW propagation within the target frequency ranges. Third, to address the computational intensity and the challenge of solving the “inverse problem” in traditional design, we developed a deep learning framework based on a MLP architecture. Trained on a high-fidelity FEA-generated dataset, the MLP successfully captured the complex nonlinear mapping between target bandgap characteristics and structural parameters. Finally, this study establishes a complete research paradigm—spanning from fundamental physical modeling and FEA verification to neural-network-driven optimization. The proposed approach demonstrates high accuracy and efficiency, offering a novel technical framework for the precise control of SAWs. Future investigations will explore large-scale CMUT arrays, and the active tunability of CMUT devices to SAW in the on-state, aiming to achieve active and reconfigurable control of integrated acoustic metamaterials for advanced sensing and imaging applications.
Author Contributions
Conceptualization, S.Z. and G.C.; Methodology, S.Z.; Software, H.H.; Validation, G.C. and S.Z.; Formal Analysis, G.C.; Survey, G.C.; Resources, C.X. and G.X.; Data Preparation, G.C.; Writing, G.C.; Review and Editing, S.Z.; Visualization, G.C.; Monitoring, H.H.; Project Management, G.X. and C.X.; Fundraising, S.Z. All authors have read and agreed to the published version of the manuscript.
Funding
This work was supported in part by the National Natural Science Foundation of China under Grant No. 62271235.
Institutional Review Board Statement
Not applicable.
Informed Consent Statement
Not applicable.
Data Availability Statement
All data involved in this study are fully included within the main text and figures of the manuscript.
Conflicts of Interest
The authors declare no conflicts of interest.
References
- Jia, H.; Zhang, W.; Liu, T.; Ren, L.; Qin, S.; Yuan, J.; Zhao, L.; Li, Z.; Mu, X. A high-sensitivity capacitive micromachined ultrasonic transducer (CMUT) with stepped cavity structure. Sens. Actuators A Phys. 2025, 389, 116519. [Google Scholar] [CrossRef] [Scilit]
- Song, J.; Xue, C.; He, C.; Zhang, R.; Mu, L.; Cui, J.; Miao, J.; Liu, Y.; Zhang, W. Capacitive micromachined ultrasonic transducers (CMUTs) for underwater imaging applications. Sensors 2015, 15, 23205–23217. [Google Scholar] [CrossRef] [Scilit]
- Zhang, T.; Zhang, W.; Shao, X.; Yang, Y.; Wang, Z.; Wu, Y.; Pei, Y. A study on capacitive micromachined ultrasonic transducer periodic sparse array. Micromachines 2021, 12, 684. [Google Scholar] [CrossRef] [Scilit]
- Lani, S.W.; Rashid, M.W.; Hasler, J.; Sabra, K.G.; Degertekin, F.L. Capacitive micromachined ultrasonic transducer arrays as tunable acoustic metamaterials. Appl. Phys. Lett. 2014, 104, 051914. [Google Scholar] [CrossRef] [Scilit] [PubMed]
- Lani, S.; Sabra, K.G.; Degertekin, F.L. Modal and transient analysis of membrane acoustic metasurfaces. J. Appl. Phys. 2015, 117, 045308. [Google Scholar] [CrossRef] [Scilit]
- Yang, H.-Y.; Cheng, S.-L.; Li, X.-F.; Yan, Q.; Wang, B.; Xin, Y.-J.; Sun, Y.-T.; Ding, Q.; Yan, H.; Zhao, Q.-X. Low-frequency elastic waves and vibration control mechanism of innovative phononic crystal thin plates. Phys. B 2023, 667, 415189. [Google Scholar] [CrossRef] [Scilit]
- Yantchev, V. A transversely coupled phononic surface acoustic wave transducer. Appl. Phys. Lett. 2014, 104, 103503. [Google Scholar] [CrossRef] [Scilit]
- Muzar, E.; Stotz, J.A.H. Defect-free phononic crystal waveguides on GaAs. Crystals 2023, 13, 1540. [Google Scholar] [CrossRef] [Scilit]
- Liu, J.; Guo, H.; Wang, T. A review of acoustic metamaterials and phononic crystals. Crystals 2020, 10, 305. [Google Scholar] [CrossRef] [Scilit]
- Benchabane, S.; Ulliac, G.; Gaiffe, O.; Salut, R.; Achaoui, Y.; Laude, V. Hypersonic phononic crystal for surface acoustic waves. In Proceedings of the IEEE International Ultrasonics Symposium, 2010, San Diego, CA, USA, 11–14 October 2010; pp. 158–161. [Google Scholar] [CrossRef] [Scilit]
- Shao, L.; Maity, S.; Zheng, L.; Wu, L.; Shams-Ansari, A.; Sohn, Y.-I.; Puma, E.; Gadalla, M.N.; Zhang, M. Phononic band structure engineering for high-Q gigahertz surface acoustic wave resonators on lithium niobate. Phys. Rev. Appl. 2019, 12, 014022. [Google Scholar] [CrossRef] [Scilit]
- Wang, Y.-Z.; Li, F.-M.; Kishimoto, K.; Wang, Y.-S.; Huang, W.-H. Band gaps of elastic waves in three-dimensional piezoelectric phononic crystals with initial stress. Eur. J. Mech. A Solids 2010, 29, 182–189. [Google Scholar] [CrossRef] [Scilit]
- Liu, C.-X.; Yu, G.-L. Deep learning for the design of phononic crystals and elastic metamaterials. J. Comput. Des. Eng. 2023, 10, 602–614. [Google Scholar] [CrossRef] [Scilit]
- Muhammad, J.K.; Lim, C.W. Machine learning and deep learning in phononic crystals and metamaterials—A review. Mater. Today Commun. 2022, 33, 104606. [Google Scholar] [CrossRef] [Scilit]
- Pan, Z.; Pan, X. Deep Learning and Adjoint Method Accelerated Inverse Design in Photonics: A Review. Photonics 2023, 10, 852. [Google Scholar] [CrossRef] [Scilit]
- Li, J.; Qian, M.; Yin, J.; Lin, W.; Zhang, Z.; Liu, S. Topology Design of Soft Phononic Crystals for Tunable Band Gaps: A Deep Learning Approach. Materials 2025, 18, 377. [Google Scholar] [CrossRef] [Scilit]
- Baek, S.J.; Lee, M. Recent advances in the inverse design of silicon photonic devices and related platforms using deep generative models. PeerJ Comput. Sci. 2025, 11, e2895. [Google Scholar] [CrossRef] [Scilit]
- Liu, T.-W.; Chan, C.-T.; Wu, R.-T. Deep-Learning-Based Acoustic Metamaterial Design for Attenuating Structure-Borne Noise in Auditory Frequency Bands. Materials 2023, 16, 1879. [Google Scholar] [CrossRef] [Scilit]
- Mao, S.P.; Zhong, K.; Rochus, V.; Severi, S.; Nauwelaers, B.; Tilmans, H.A.C.; Rottenberg, X. Capacitive micromachined ultrasonic transducers for acoustic manipulation. In Proceedings of the 18th International Conference on Solid-State Sensors, Actuators and Microsystems (TRANSDUCERS), Anchorage, AK, USA, 21–25 June 2015; pp. 662–665. [Google Scholar] [CrossRef] [Scilit]
- Yudistira, D.; Boes, A.; Djafari-Rouhani, B.; Pennec, Y.; Yeo, L.Y.; Mitchell, A.; Friend, J.R. Monolithic phononic crystals with a surface acoustic band gap from surface phonon–polariton coupling. Phys. Rev. Lett. 2014, 113, 215503. [Google Scholar] [CrossRef] [Scilit]
- Srivastava, A. Inverse design and deep learning for phononic crystals. J. Acoust. Soc. Am. 2019, 146, 2828. [Google Scholar] [CrossRef] [Scilit]
- Han, S.; Han, Q.; Li, C. Deep learning-based inverse design of phononic crystals for anticipated wave attenuation. J. Appl. Phys. 2022, 132, 154901. [Google Scholar] [CrossRef] [Scilit]
- Wan, X.-H.; Zhang, Y.; Guo, Q.-H.; Zheng, L.-Y. Deep learning-based inverse design of irregular phononic crystals. Int. J. Mech. Sci. 2025, 297–298, 110335. [Google Scholar] [CrossRef] [Scilit]
- Zhao, C.; Huang, A.; Chu, F.; Zhang, T. Data-driven topology optimization design of phononic crystals for vibration control. Int. J. Mech. Sci. 2025, 297–298, 110358. [Google Scholar] [CrossRef] [Scilit]
- Sadat, S.M.; Wang, R. A machine learning-based approach for phononic crystal property discovery. J. Appl. Phys. 2020, 128, 025106. [Google Scholar] [CrossRef] [Scilit]

Disclaimer/Publisher’s Note: The statements, opinions and data contained in all publications are solely those of the individual author(s) and contributor(s) and not of MDPI and/or the editor(s). MDPI and/or the editor(s) disclaim responsibility for any injury to people or property resulting from any ideas, methods, instructions or products referred to in the content. |
© 2026 by the authors. Licensee MDPI, Basel, Switzerland. This article is an open access article distributed under the terms and conditions of the Creative Commons Attribution (CC BY) license.