Article

Addressing the Impact of Resolution Scaling on YOLO Performance for Brain Tumor Detection Through Optimized Network Depth/Width Adjustments

1
Department of Electrical Engineering and Infocommunications, Széchenyi István University, 9026 Győr, Hungary
2
College of Pharmacy, University of Basrah, Basrah 61001, Iraq
*
Authors to whom correspondence should be addressed.
Appl. Sci. 2026, 16(9), 4320; https://doi.org/10.3390/app16094320
Submission received: 9 April 2026 / Revised: 21 April 2026 / Accepted: 23 April 2026 / Published: 28 April 2026
(This article belongs to the Special Issue AI-Based Biomedical Signal and Image Processing)

Abstract

Deep learning-based object detectors, particularly You Only Look Once (YOLO) architectures, have demonstrated strong performance in automated brain tumor detection. However, the impact of resolution scaling on tumor localization accuracy remains underexplored, especially under conditions where image resolution is reduced. This study aims to investigate how lowering the input resolution from 640 × 640 to 480 × 480 affects detection performance and whether optimized depth/width scaling and hyperparameter tuning can compensate for the expected loss of spatial detail. In this work, we propose an optimized YOLO-based framework for brain tumor detection and localization in MRI scans, building upon the method “Addressing the Impact of Resolution Scaling on YOLO Performance for Brain Tumor Detection through Optimized Network Depth/Width Adjustments.” Our model, an enhanced variant of the BGF-YOLO architecture, is specifically tailored for the challenges of medical imaging. The proposed network features both architectural and training-level optimizations. We used a publicly available dataset from Kaggle that consists of 500 training images, 201 validation images, and 100 test images. Experimental analysis demonstrates that while reducing input resolution alone degrades performance, integrating targeted modifications specifically increases network depth and width. In addition, advanced training strategies such as MixUp augmentation, dropout regularization, AdamW optimization, cosine learning rate scheduling, and finely tuned learning rate ranges lead to substantial performance gains. The optimized model achieves a precision of up to 0.858, a recall of 0.943, mAP50 of 0.946, and mAP50–95 of 0.672. These results not only outperform the reduced-resolution baseline but also approach, and in some cases surpass, the original high-resolution BGF-YOLO setup.

1. Introduction

Detection of brain tumors is of great importance in clinical diagnostics and treatment planning, as early localization of neoplastic lesions directly affects prognosis and therapeutic efficacy [1]. As medical imaging data continues to increase, exploring deep learning-based detection models is encouraged for automated tumor identification [2]. Such models offer a great potential in mitigating diagnostic workload while enhancing consistency in image interpretation [3]. Among the diverse deep learning architectures, You Only Look Once (YOLO)-based models have proven effective in medical imaging due to their streamlined detection pipeline enabling real-time inference while preserving an effective trade-off between detection accuracy and computational cost [4]. Since clinical applications require rapid and reliable results, YOLO-based systems are well-suited for deployment [5]. YOLOv8 [6] is a single-stage object detection framework that provides balanced detection accuracy and computational efficiency. It is structured into three primary components: the backbone for feature extraction, the neck for multi-scale feature fusion, and the detection head for final predictions.
The backbone combines standard convolutional layers with a lightweight C2f module to extract hierarchical feature representations from the input image. To enable effective learning with minimal computational burden, the C2f design promotes efficient gradient propagation and feature reuse through dense inter-layer connections. For further capturing of contextual information at multiple receptive fields, a Spatial Pyramid Pooling Fast (SPPF) layer is incorporated at the terminal stage of the backbone, strengthening multi-scale object representation.
The neck integrates Feature Pyramid Network (FPN) [7] and Path Aggregation Network (PANet) [8] principles in the intermediate stage, combining low-level spatial details with high-level semantic information. Such bidirectional feature fusion strengthens both shallow and deep feature interactions and allows for improved localization of multi-scale objects.
The detection head employs a decoupled structure, where classification and localization are processed through separate branches, to reduce task interference and enable enhanced prediction stability. Moreover, YOLOv8 simplifies the detection process and improves adaptability to objects exhibiting varying aspect ratios through employing an anchor-free detection strategy.
YOLOv8 leverages advanced loss formulations for optimization. Classification is guided by binary cross-entropy or varifocal loss [9] that addresses class imbalance, whereas the optimization of bounding box regression is done using Distribution Focal Loss (DFL) combined with Complete IoU (CIoU) loss [10] for enhanced localization precision. Together, these components underpin the robustness and adaptability of YOLOv8 across varied detection contexts.
Recent studies have enhanced the YOLOv8 architecture to increase detection accuracy, mainly through attention mechanisms, multi-scale feature fusion, and additional detection heads [11]. In particular, BGF-YOLO [12], which is an advanced variant, has achieved state-of-the-art results on brain tumor detection benchmarks through the integration of bi-level routing attention [13], which is an efficient attention mechanism that selectively emphasizes informative, along with Generalized Feature Pyramid Networks (GFPN) [14] which enhance multi-scale feature fusion via enriched cross-level connections and extended detection heads. This architecture forms the foundation for the present work. However, existing works rely on fixed high-resolution images, often 640 × 640 pixels, and assume the necessity of higher input resolution for reliable tumor detection [15].
This assumption raises important methodological questions: first, in clinical settings, medical images suffer substantial variability in resolution, acquisition devices, and quality [16]. Second, high-resolution models have limited applicability in resource-constrained environments as increased computational cost and memory requirements become a concern [17]. Particularly for subtle tumors, the reduction of input resolution is expected to degrade the detection process [18]. Mitigation of this degradation through architectural and training-level adjustments remains insufficiently explored [19].
In YOLO-based tumor detection models, the interaction between resolution scaling and network capacity, such as depth and width, has not been systematically evaluated [20]. Although model scaling approaches are well established in natural image detection, their potential to compensate for reduced spatial detail in medical imaging applications remains insufficiently explored, as conventional architectural configurations which are successful in natural image pipelines may not directly translate to medical applications and could degrade robustness or sensitivity [21]. Under reduced-resolution conditions, the combined impact of architectural scaling and training-level optimization has not been clearly established, despite its clinical importance [22]. Consequently, a significant gap remains in understanding the robustness and adaptability of YOLO-based models in real-time medical imaging scenarios. This study addresses this gap by proposing a resolution-aware optimization framework that improves detection performance while maintaining computational efficiency.

2. Contributions

This study presents a systematic investigation of the influence of input resolution scaling on brain tumor detection using the YOLO architecture and explores the capability of architectural and training-level optimizations to compensate for reduced image resolution without compromising detection reliability.
This work provides three main contributions:
1.
It elucidates that in the absence of architectural modification, detection performance declines as the input resolution drops from 640 × 640 to 480 × 480. This observation confirms the criticality of spatial details for accurate localization of tumors, especially in medical imaging applications, where neoplastic findings may be confined to small regions.
2.
This work presents a structured exploration of architectural scaling through independent and joint modulation of the depth and width of the YOLO network. The empirical analysis demonstrates that increasing network depth predominantly improves precision, while increasing network width favors recall and mAP metrics. The proposed approach integrates these complementary effects and identifies an optimal configuration that achieves superior detection performance under constrained input resolution.
3.
The findings highlight the synergistic role of hyperparameter optimization in conjunction with architectural scaling. With systematic adjustment of data augmentation (MixUp), regularization (dropout), optimizer selection (AdamW), and learning rate scheduling, the framework effectively compensates for spatial information loss and, in some configurations, delivers performance comparable to, or exceeding, high-resolution baselines.
The proposed improvements can be categorized into two main components: (i) architectural modifications, including depth and width scaling of the YOLO network; and (ii) training-level optimizations, including MixUp augmentation, dropout regularization, and AdamW-based learning rate refinement.

3. Related Work

Due to their end-to-end detection paradigm and real-time inference capacity, YOLO-based detection models have increasingly been transitioned from natural image analysis to specialized medical domains, such as brain tumor localization [23,24]. The single-stage architecture of the YOLO series is particularly valued in clinical settings for its ability to provide rapid diagnostic feedback while capturing global contextual information from entire MRI or CT slices [24,25]. Recent studies have utilized various iterations, including YOLOv8, YOLOv9, and the newly released YOLOv11, to automate the identification of tumors with high precision [24,26,27].
In addition to performance-driven improvements, recent research trends in medical imaging have increasingly focused on enhancing model interpretability and clinical trust. Explainable artificial intelligence (XAI) techniques have been widely explored, particularly in neurodegenerative disorder analysis, to provide insight into model predictions and improve transparency in decision-making processes [28,29].
Architectural enhancements have been pivotal in addressing the unique challenges of medical imaging, such as low contrast and tumor heterogeneity. Researchers have integrated sophisticated attention mechanisms—such as the Convolutional Block Attention Module, Bi-level routing attention, and multi-head self-attention—to prioritize tumor-specific regions and mitigate background noise [12,30,31]. For instance, the BGF-YOLO architecture enhances feature representation by combining generalized feature pyramid networks with a fourth detection head specifically designed for multi-scale tumor detection [12]. Similarly, the SCC-YOLO model utilizes an SCConv module within a YOLOv9 framework to reduce spatial redundancy and improve feature learning efficiency [26].
Multi-scale feature fusion and cross-scale strategies have further improved the detection of tumors with diverse sizes and appearances [31,32]. Models like CS-YOLO utilize channel shuffling and depthwise separable convolutions to balance detection speed with the ability to recognize complex, heterogeneous targets [30].
Furthermore, advanced deep learning paradigms such as graph neural networks (GNNs) have been proposed to improve representation learning and generalization, particularly in data-limited scenarios [33]; for example, unified GNN-based approaches incorporating task-level abstraction and pooling strategies have demonstrated promising performance in few-shot learning tasks, reflecting the growing interest in adaptable and robust learning frameworks in medical imaging [34]. Despite these advancements, most existing approaches predominantly rely on fixed input resolutions often standardized at 416 × 416 or 640 × 640 pixels and frequently overlook the performance implications of resolution reduction, which can be critical when identifying micro-tumors or working under hardware constraints [35,36].
While these approaches focus on improving interpretability, representation learning, and architectural performance under standard conditions, limited attention has been given to the interaction between input resolution and model capacity in medical object detection. In particular, the ability of architectural scaling strategies to compensate for reduced spatial resolution remains insufficiently explored.
Furthermore, scaling strategies involving systematic adjustments to network depth and width have been investigated to optimize the trade-off between accuracy and computational efficiency [23,35]. In general object detection, selecting an appropriate backbone size (e.g., from YOLOv8-nano to YOLOv8-large) significantly influences the model’s capacity to extract deep features from low-light or noisy medical images [23,35]. However, the specific roles of these scaling strategies under resolution constraints remain scarcely investigated in the context of brain tumor detection, representing a significant gap in the current literature.

4. Methodology

4.1. Dataset Description

The dataset used in this study was the Br35H brain tumor detection dataset, consisting of labeled brain MRI images suitable for object detection tasks [37]. The dataset offered peritumor identification data which enabled evaluation of tumor detection and localization performance. The dataset was divided into 500 training images, 201 validation images, and 100 test images, and division was fixed across all experiments to ensure consistency and fair comparison between different configurations. Data augmentation was performed during training, as described later, and no additional augmentation or rebalancing operations were applied. Therefore, any differences in the performance observed in this study can be attributed to changes in input resolution, depth, and width; architectural adjustments; and hyperparameter optimization, rather than to changes in the dataset composition. While prior works on the Br35H dataset predominantly employ an input resolution of 640 × 640 pixels, following conventional YOLO configurations, the present study departs from this standard by utilizing a reduced resolution of 480 × 480 pixels. This design choice enables a focused evaluation of resolution-aware detection behavior under computational constraints, thereby highlighting the trade-off between efficiency and diagnostic accuracy.
Although the use of a publicly available dataset enhances reproducibility, certain limitations should be acknowledged. The Br35H dataset [37] may include variability in annotation quality and limited diversity in tumor types and imaging conditions. In addition, variations in image quality and acquisition settings may introduce uncontrolled variability. Despite these limitations, the dataset remains suitable for controlled experimental evaluation.
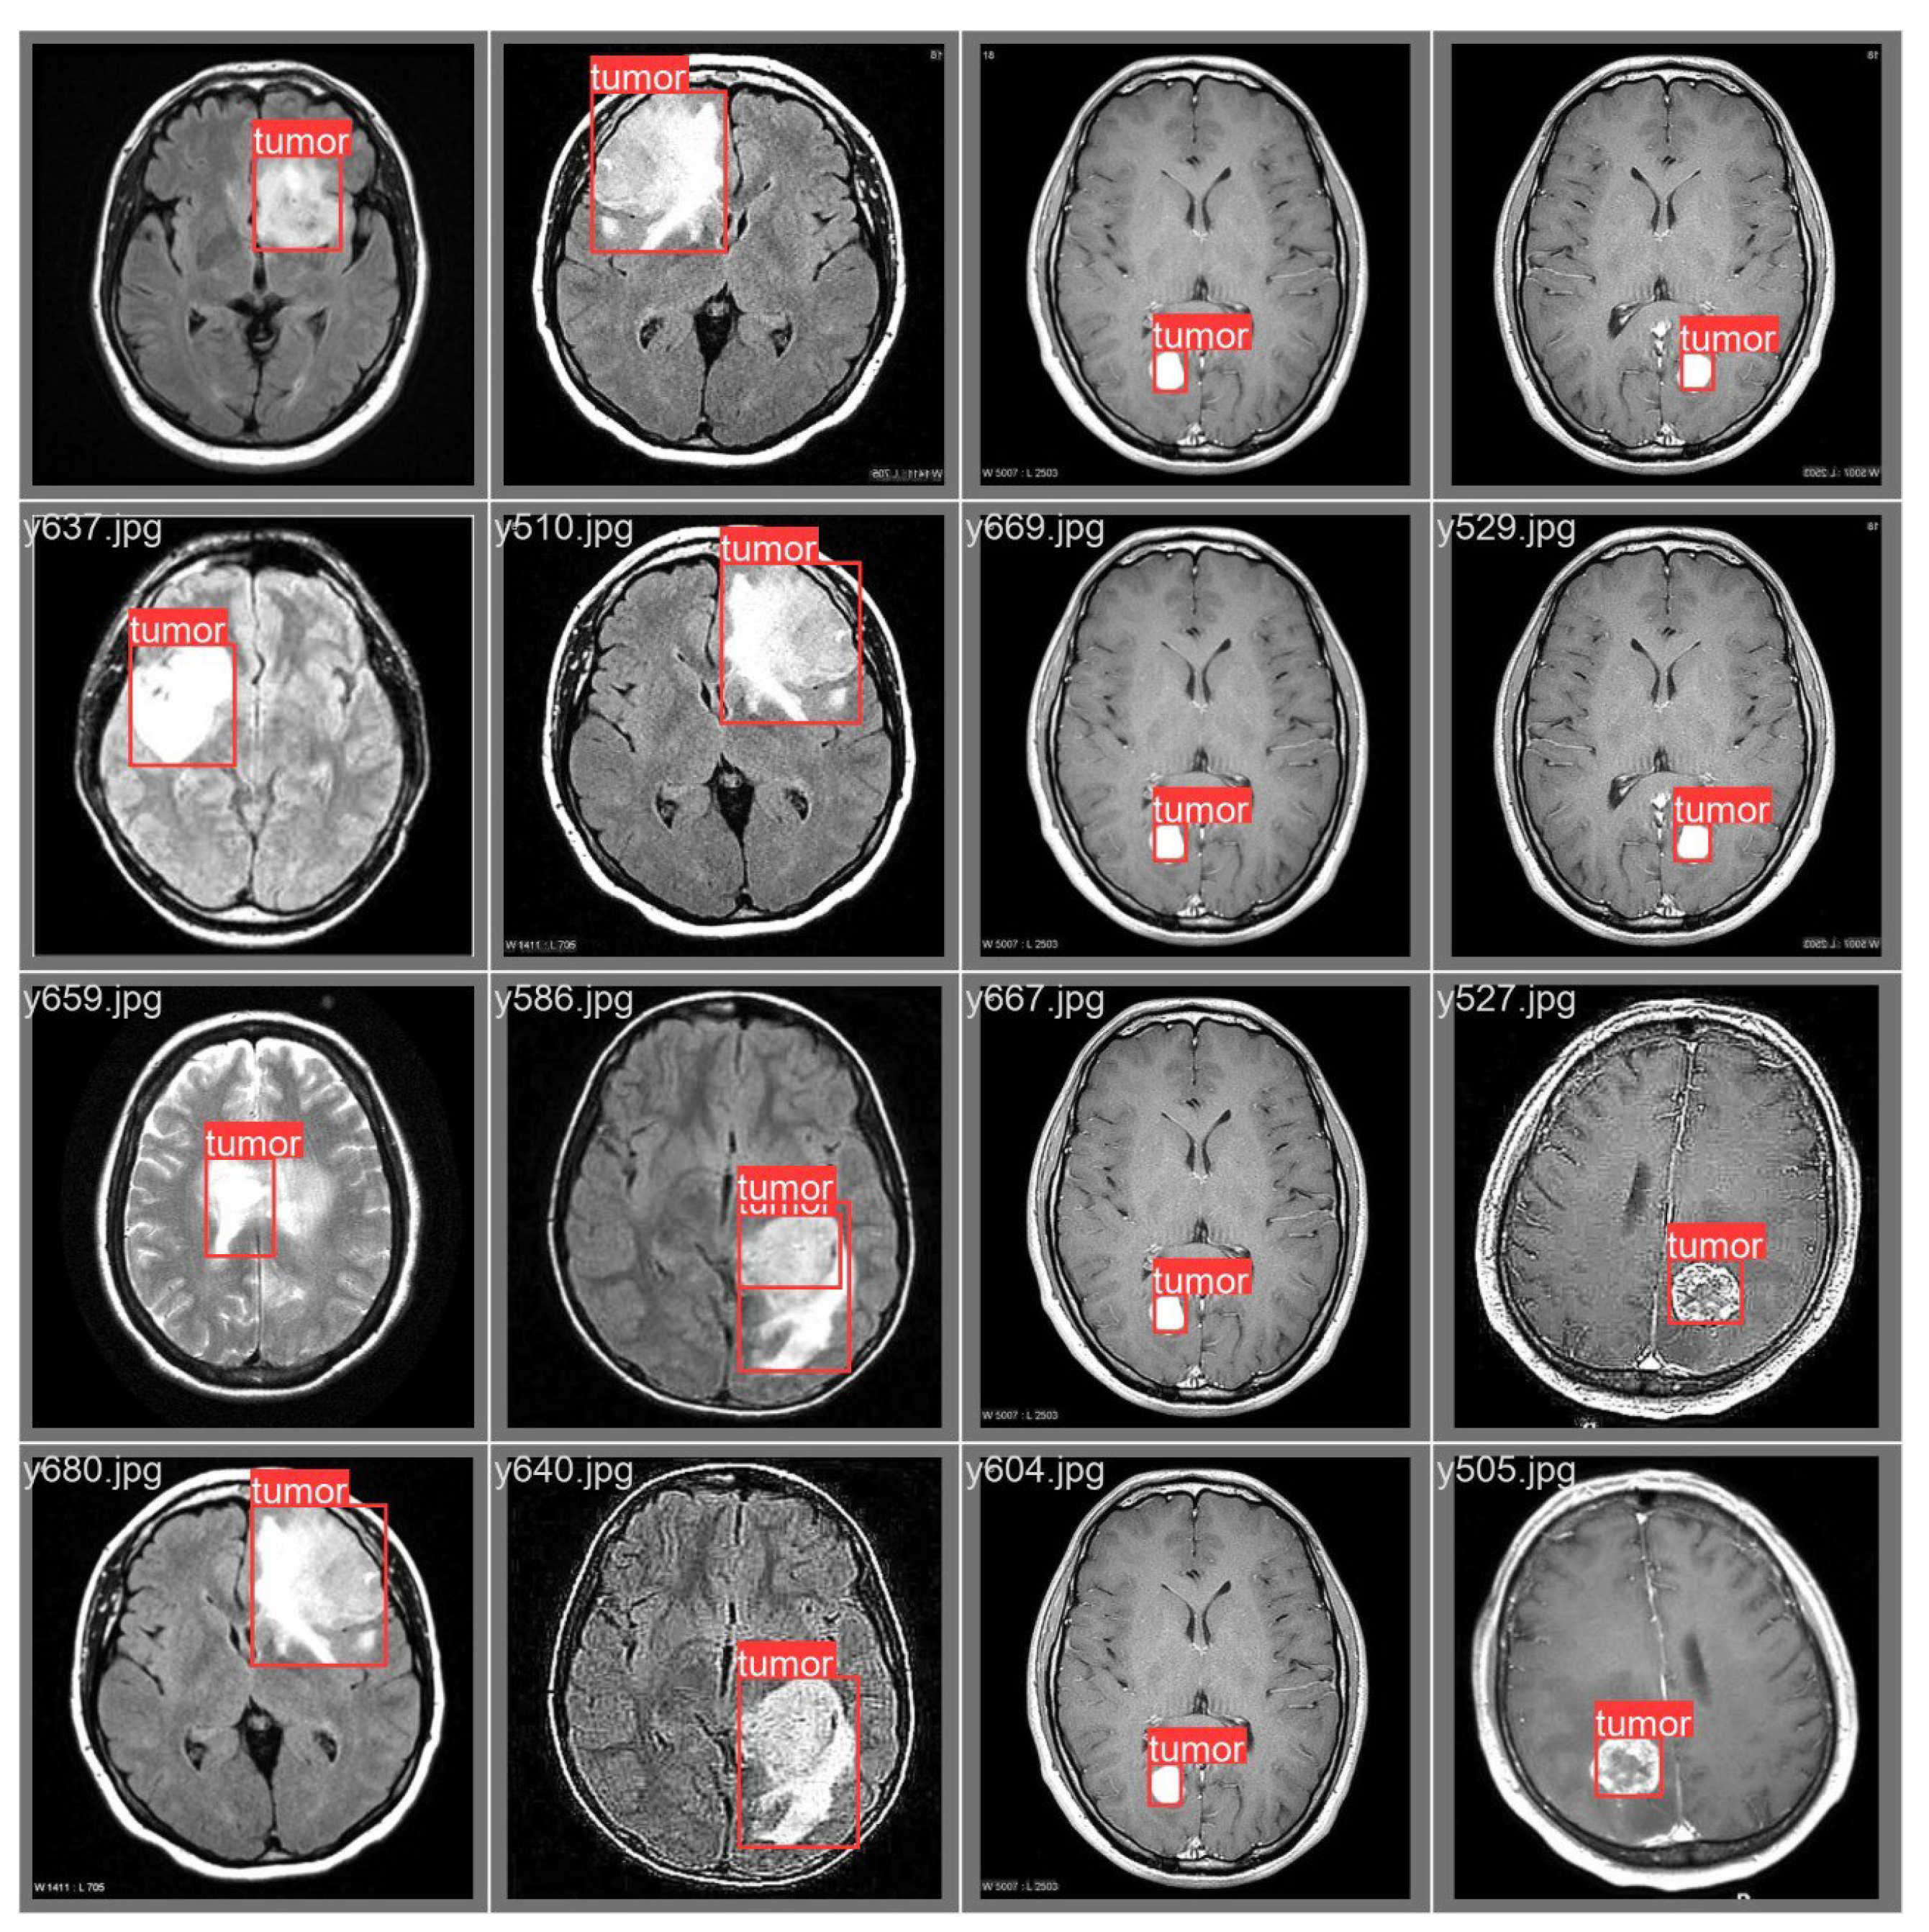
Figure 1 represents samples from the Br35H [37] dataset with bounding box annotations, demonstrating variations in tumor size, shape, and location across different brain MRI images.

4.2. Baseline YOLO Architecture

The YOLOv8 architecture represents one of the latest advancements in the YOLO family of one-stage object detectors [38]. It provides accuracy and computational efficiency in medical image analysis, attributed to its unified detection paradigm that performs feature extraction, object localization, and classification within a single end-to-end network [39].
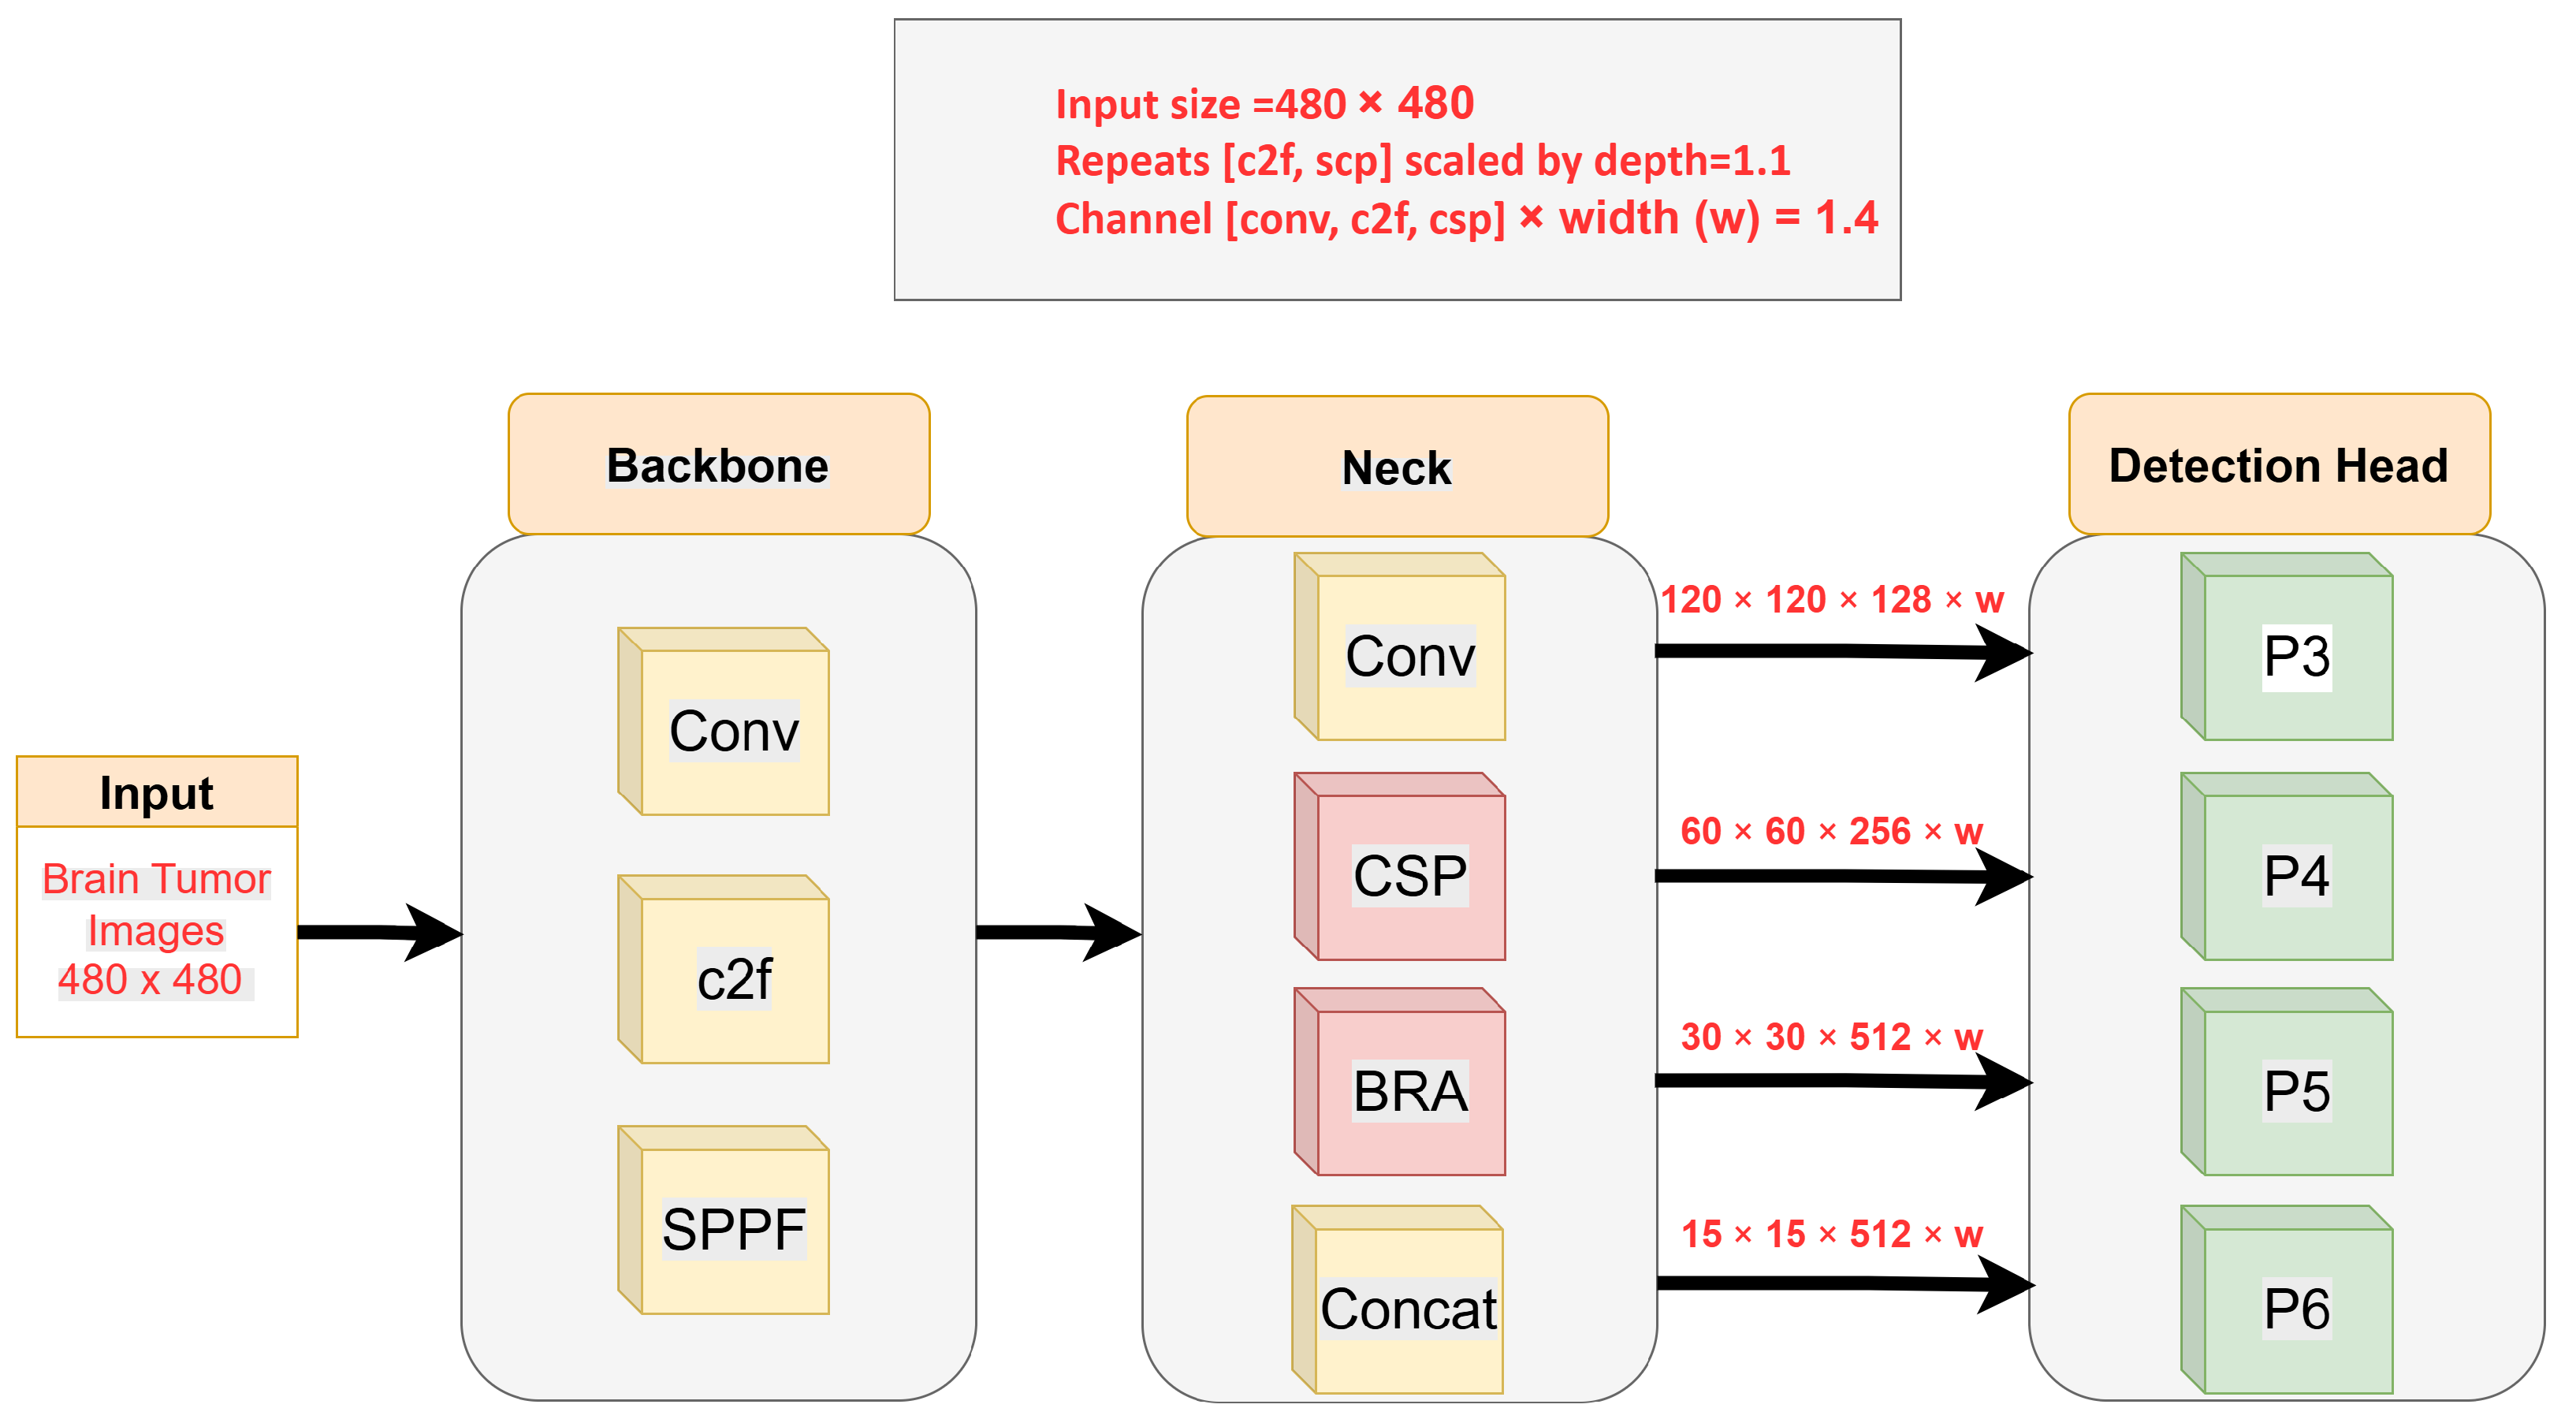
The framework proposed in this study is built on an enhanced YOLOv8-based framework (BGF-YOLO) [12]. Figure 2 demonstrates the baseline BGF-YOLO architecture, adapted from the original publication, showing the backbone, neck, and detection head modules. Additional annotations and modifications were included to reflect the resolution scaling strategy and network capacity adjustments proposed in this study.

4.3. Resolution Scaling Strategy

In this study, resolution scaling refers to resizing the input image matrix to a lower spatial resolution, which reduces computational complexity at the expense of fine spatial details. The choice of input resolutions was guided by both experimental and practical considerations. The 640 × 640 resolution has been widely adopted as a standard baseline in prior studies using the same dataset, while the reduced resolution (480 × 480) was selected to represent a substantial decrease in spatial detail, enabling a clear evaluation of performance degradation and the effectiveness of the proposed optimization strategy. To ensure a controlled comparison, the original BGF-YOLO configuration was trained and evaluated on 480 × 480 input images with a consistent architecture and training hyperparameters [12]. This setup ensured the isolation of the reduced resolution impact without interference from architectural scaling or optimization strategies. The resulting performance was then compared to that of the original high-resolution baseline to evaluate degradation caused solely by lower input resolution. Model performance was assessed using standard object detection metrics, including precision, recall, mAP50, and mAP50–95. The results of this comparison served as a baseline for subsequent architectural scaling and training optimization experiments.

4.4. Progressive Model Scaling

4.4.1. Depth Scaling

Depth scaling controls the number of layers within the backbone and neck of the YOLO architecture, enabling the model to learn increasingly abstract feature representations. To examine the effect of increasing the depth of the network under reduced-resolution conditions, depth scaling from 1.0 to 1.2 was evaluated, while maintaining the same width configuration. All other architectural components and training settings were kept unchanged to isolate the influence of depth expansion on detection performance. Increasing the depth coefficient proportionally increases the number of repeated convolutional blocks (e.g., C2f and CSP modules) across the backbone and neck stages of the architecture, as illustrated in Figure 2.

4.4.2. Width Scaling

Width scaling adjusts the number of feature channels in each convolutional layer, enhancing the model’s representational capacity and spatial feature extraction ability. Width scaling was examined as a complementary strategy to enhance detection performance. The network width (w) scaling factor was increased from 1.25 to 1.3, while keeping the depth fixed at 1.2. All other architectural and training settings were preserved to isolate the effect of width expansion.
Increasing the width coefficient proportionally increases the number of feature channels across convolutional layers (including C2f, CSP, and standard convolution modules), as illustrated in Figure 2.

4.4.3. Depth–Width Trade-Off Analysis and Motivation for Balanced Scaling

Based on the results of architectural scaling experiments, a balanced depth–width configuration was implemented to investigate the combined influence of moderate depth and width adjustments while keeping other architectural components, dataset splits, training hyperparameters, optimizer settings, and augmentation strategies preserved. Adjusting the depth coefficient proportionally alters the number of repeated convolutional blocks across the backbone and neck modules, whereas modifying the width coefficient changes the number of feature channels within convolutional layers. The resulting configuration was evaluated using the standard object detection metrics.

4.5. Hyperparameter Optimization

4.5.1. Effect of MixUp Augmentation and Dropout Regularization

After establishing the balanced architectural configuration, the first stage of hyperparameter optimization introduced regularization techniques at the training level. Specifically, MixUp data augmentation and Dropout regularization were applied while keeping the network architecture unchanged. This step aims to enhance model generalization and reduce overfitting. MixUp was implemented by linearly combining pairs of training samples and their corresponding labels according to
x ˜ = λ x 1 + ( 1 λ ) x 2 , y ˜ = λ y 1 + ( 1 λ ) y 2 , λ = 0.1 ,
where x 1 and x 2 denote two input samples, and y 1 and y 2 represent their corresponding labels. The mixing coefficient λ [ 0 , 1 ] controls the interpolation ratio. In this study, λ was fixed at 0.1.
h ˜ = r h ,
where h denotes the neuron activation vector, and r is a binary random mask that retains each neuron with a probability of p = 0.9 and deactivates with a probability of 0.1, corresponding to a dropout rate of 0.1; i.e., r i Bernoulli ( 0.9 ) .

4.5.2. Optimizer and Learning Rate Optimization (AdamW)

The optimization strategy was modified by replacing SGD with AdamW, while preserving all other previously defined training settings. This controlled setup ensures that any observed performance variations can be attributed exclusively to the optimizer and learning rate configuration.
The adaptive AdamW is particularly well-suited for brain tumor detection tasks, where accurate localization relies on learning fine-grained discriminative features while avoiding overfitting to noise or dataset-specific artifacts [40]. By decoupling weight decay from the gradient update, AdamW provides more effective regularization than conventional SGD, leading to improved generalization across diverse tumor morphologies and imaging variations. This property becomes especially important under reduced input size conditions, where the optimizer must compensate for the loss of spatial detail through stable and robust parameter updates. To further enhance optimization stability, a cosine learning rate scheduling strategy was employed. The learning rate at the training step is defined by a cosine function, which helps in gradually decreasing the learning rate from an initial maximum value to a minimum value over the training process [41]. Its formula is as follows:
α t = α min + 1 2 α max α min 1 + cos t T π
where α max denotes the initial learning rate ( lr 0 ), α min = α max · lr f denotes the final learning rate, t represents the current training iteration, and T denotes the total number of training iterations.
This cosine learning rate scheduling scheme enables a smooth and gradual decay of the learning rate, facilitating stable convergence and reducing the risk of oscillatory updates during the later stages of training.

4.6. Confidence and IoU Threshold Analysis

In object detection systems, inference time thresholds play a critical role in determining detection quality and decision reliability. Two key thresholds are systematically analyzed: the confidence threshold (conf) and the Intersection over Union (IoU) threshold. These parameters directly influence the balance between detection sensitivity and selectivity and localization accuracy. Multiple combinations of confidence and IoU thresholds are evaluated during inference, enabling a comprehensive analysis of detection behavior under different selectivity–sensitivity regimes and preventing performance bias toward a single threshold configuration. By analyzing performance trends across varying conf and IoU settings, the robustness, stability, and sensitivity of the model to threshold selection can be assessed.

4.6.1. Confidence Threshold (Conf)

The confidence threshold defines the minimum confidence score required for a predicted bounding box to be considered a valid detection [42]. Predictions with confidence scores below this threshold are discarded. Formally, a detection is accepted if:
conf τ s i
where s i is the predicted confidence score for detection i, and conf τ denotes the confidence threshold.
Adjusting conf τ is performed to find the right balance between false positives and false negatives. Lower confidence thresholds increase sensitivity (higher recall) but may introduce more false positives, whereas higher confidence thresholds improve selectivity (higher precision) at the cost of reduced recall.

4.6.2. Intersection over Union (IoU) Threshold

The Intersection over Union (IoU) threshold plays a central role in evaluating brain tumor detection performance, as it determines whether a predicted bounding box sufficiently overlaps with the ground-truth tumor annotation to be counted as a correct localization. By quantifying the spatial agreement between the detected region and the actual tumor area, IoU provides an objective measure of localization accuracy, which is particularly important in medical imaging tasks where precise delineation of tumor boundaries is critical. Intersection over Union is defined as:
IoU ( B p , B g t ) = Area ( B p B g t ) Area ( B p B g t )
where B p denotes the predicted bounding box and B g t represents the corresponding ground-truth bounding box. The numerator Area ( B p B g t ) measures the area of overlap between the predicted and ground-truth boxes, while the denominator Area ( B p B g t ) represents the total area covered by both boxes. The IoU value ranges between 0 and 1, where higher values indicate better localization accuracy.

5. Experimental Results and Discussion

The findings of this study demonstrate that the performance degradation resulting from input resolution reduction is not inevitable. Although decreasing the image size from 640 × 640 to 480 × 480 initially led to reductions in precision, recall, mAP50, and mAP50–95, this decline can be attributed to the fact that tumor regions in brain MRI scans typically occupy small and irregular areas, making accurate localization highly dependent on spatial detail.
Through progressive architectural scaling and training-level optimization, the proposed framework effectively compensated for the loss of spatial information. The final configuration evaluated on the Br35H dataset [37] achieved a recall of 0.943 and an mAP50–95 of 0.672, surpassing the original high-resolution baseline (0.926 recall and 0.653 mAP50–95), while maintaining competitive mAP50 performance (0.946). These results confirm that sensitivity and localization robustness can be preserved, and even possibly enhanced, under reduced input size conditions through principled optimization strategies.
To further assess the generalization capability of the proposed model, additional cross-dataset evaluations were conducted. The model was first trained on the primary dataset [37] and subsequently evaluated on an external dataset [43] using a randomly selected subset corresponding to approximately 10% of the available validation samples. Only images containing tumor regions were included in this subset. This step was necessary to avoid introducing domain shift factors unrelated to the learned detection task. The evaluation was performed on 53 images.
Despite the limited sample size, the model demonstrated strong performance, achieving a precision of 0.947, recall of 0.927, mAP50 of 0.958, and mAP50–95 of 0.747, further exceeding the original high-resolution baseline. These results highlight the robustness of the model and its ability to generalize to unseen data distributions.
In addition, the model was evaluated on another independent dataset [44], where a custom data split was applied due to the absence of predefined validation sets. Specifically, 75% of the training data was used for training and 25% for validation, while the provided axialtest set was used for evaluation. In this setting, the model achieved a precision of 0.840, a recall of 0.901, mAP50 of 0.867, and mAP50–95 of 0.437. Although the mAP50–95 localization performance is lower compared to the primary dataset, the model maintained high recall, indicating consistent sensitivity in different datasets with varying characteristics.
In general, these findings demonstrate that the proposed model not only compensates for reduced input size, but also maintains stable and reliable detection performance across multiple datasets. This supports the effectiveness of the proposed optimization strategy and its potential applicability in real-world clinical scenarios with heterogeneous data distributions.

5.1. Effect of Input Resolution Scaling

Table 1 presents the performance comparison between the original high-resolution configuration (640 × 640) and the low-resolution setting (480 × 480) without any architectural or training modifications. Reducing input resolution leads to a consistent decline in all evaluation metrics; in particular, recall drops from 0.926 to 0.869, indicating reduced sensitivity to tumor regions, while mAP50 and mAP50–95 decrease by approximately 5% and 3%, respectively, confirming that lower spatial resolution negatively affects both detection accuracy and localization precision. These results establish a challenging baseline and highlight the need for architectural and training-level optimizations to compensate for the loss of spatial detail.

5.2. Impact of Depth Scaling

As shown in Table 2, increasing network depth improves precision but consistently reduces recall and mAP50 compared to the reduced-resolution baseline. This behavior is attributed to the increase in the number of repeated convolutional blocks (C2f and CSP) in the backbone and neck stages of the YOLO architecture. This indicates that deeper architectures become more selective, reducing false positives but missing a larger number of tumor regions. This behavior reflects a shift toward conservative detection, which is usually undesirable when clinical priority is sensitivity.
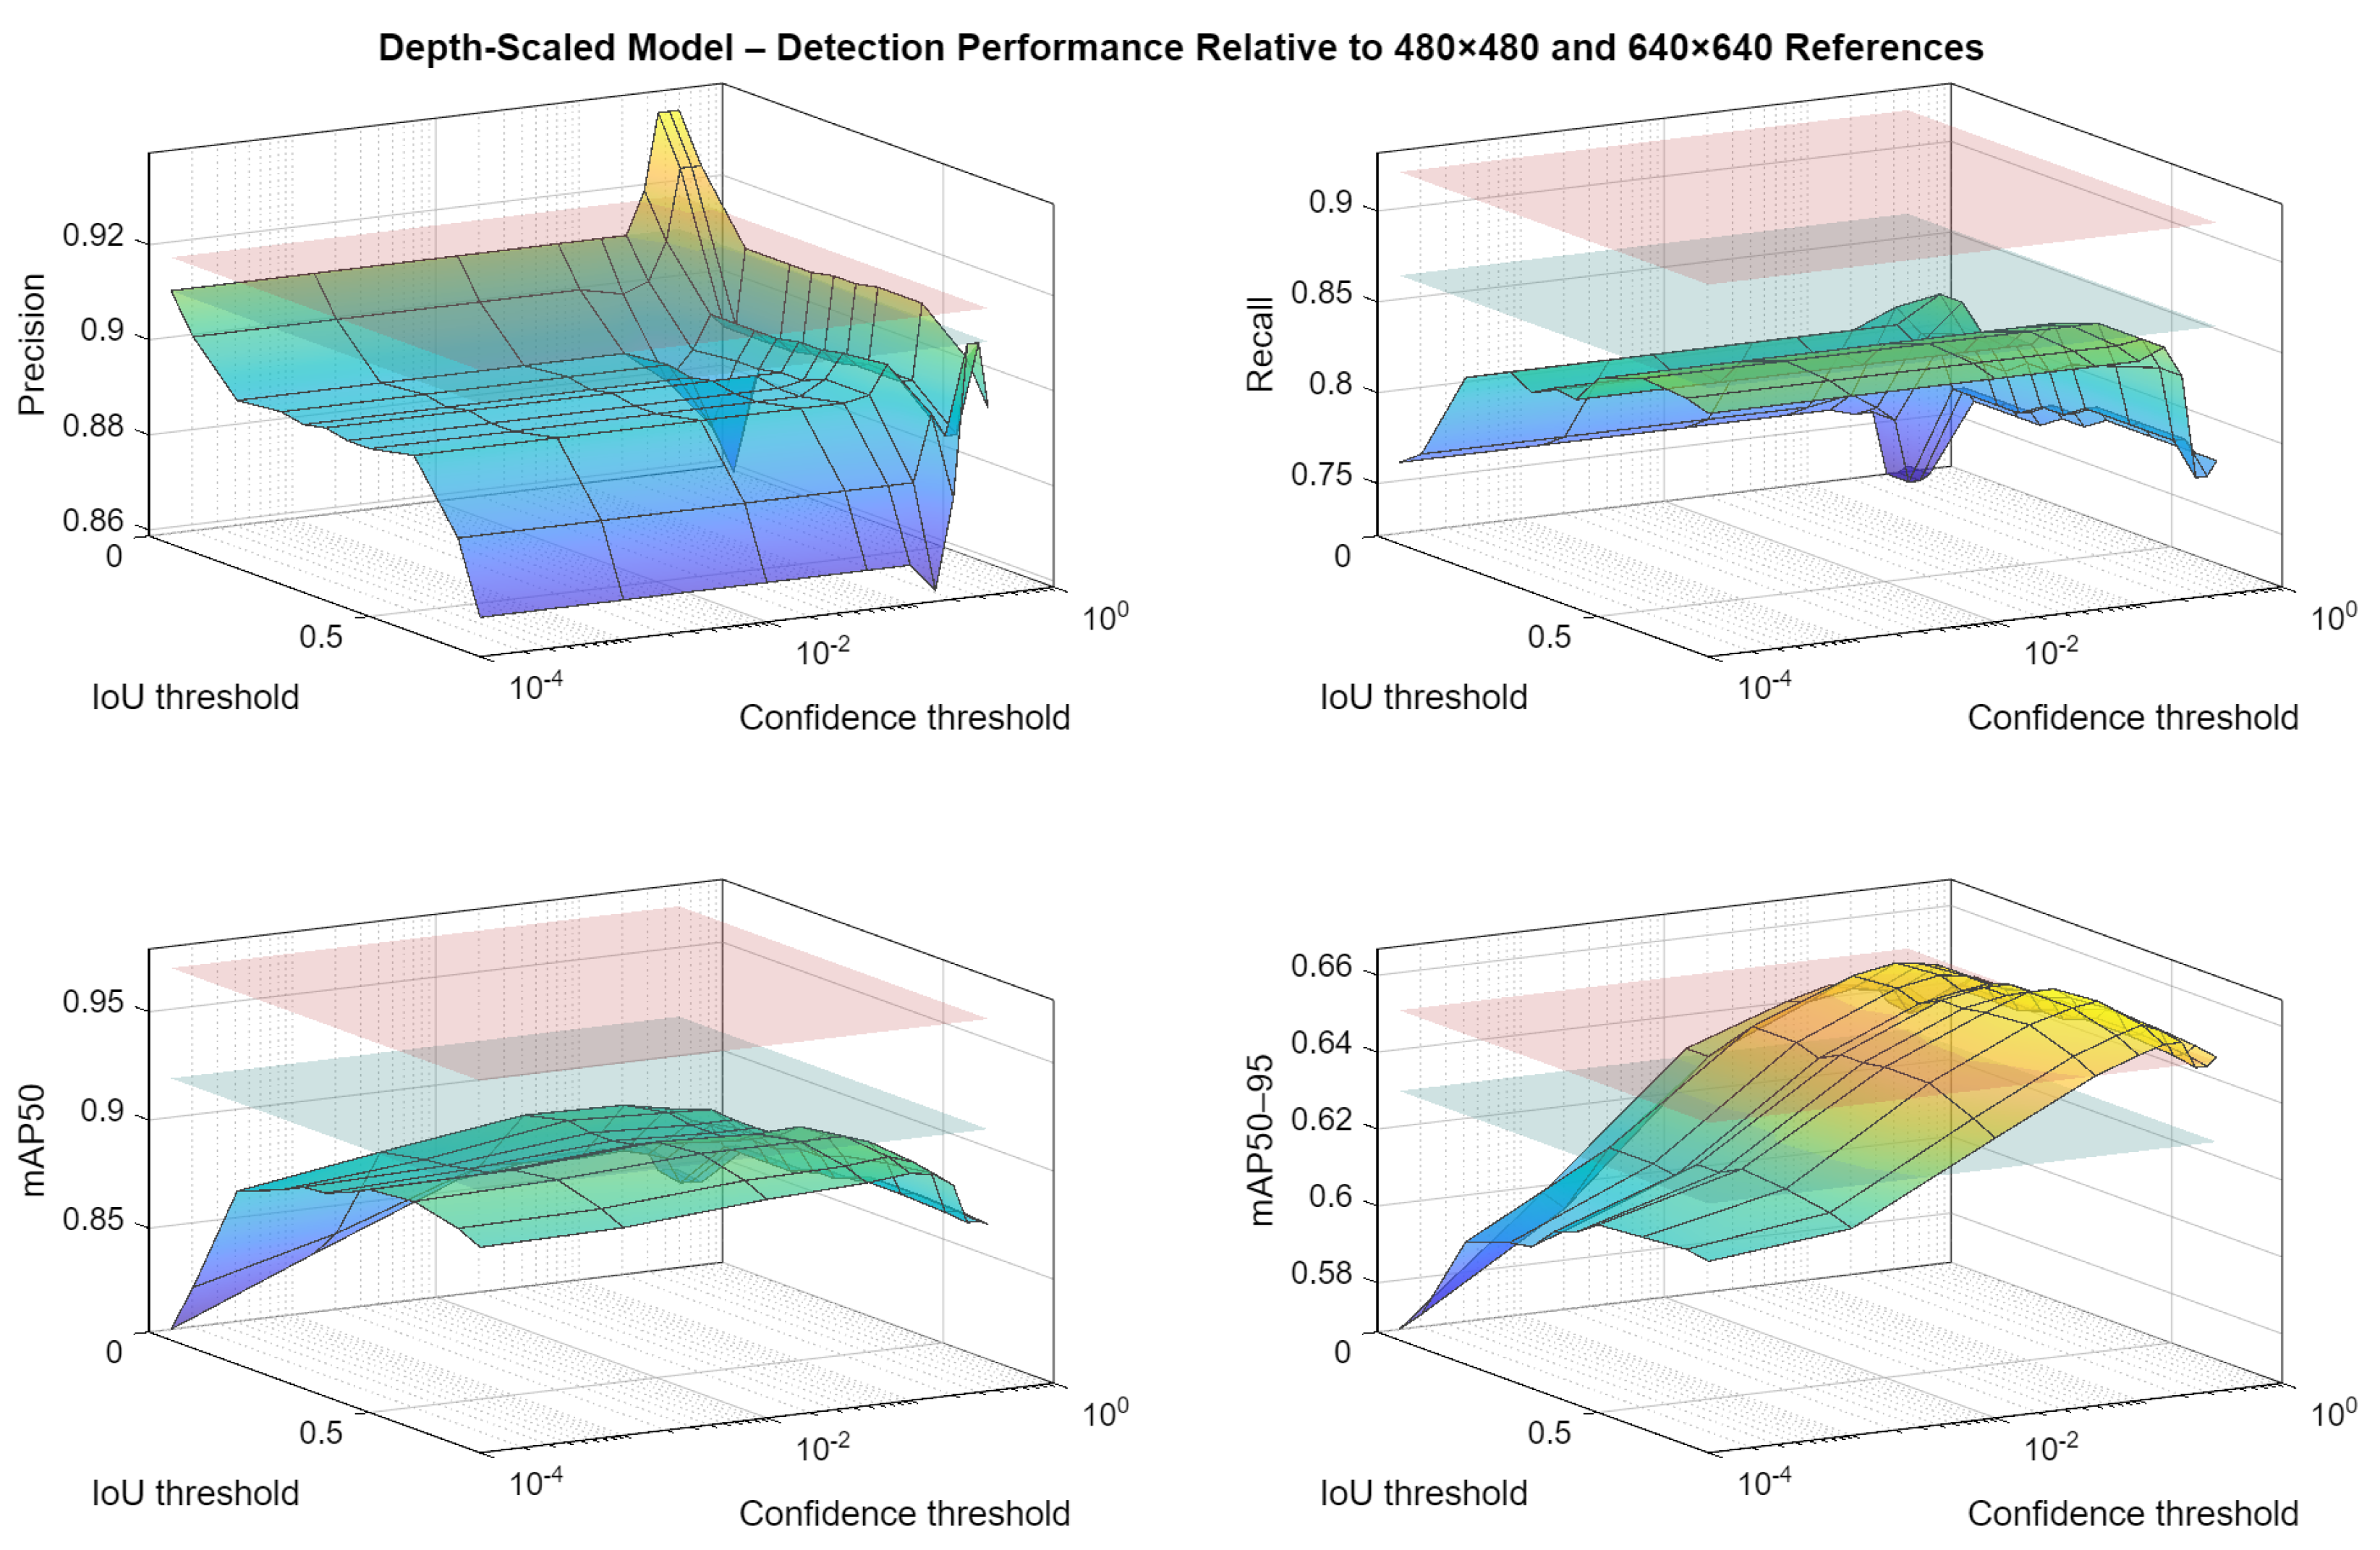
Figure 3 visualizes the response surface of the depth-scaled model across the confidence and IoU threshold combinations evaluated. The four subplots show that increasing depth primarily benefits precision, while recall and the stricter localization metric mAP50–95 remain limited over large parts of the parameter space. This confirms that depth scaling alone promotes a more selective detector but does not sufficiently recover sensitivity under reduced-resolution conditions.

5.3. Impact of Width Scaling

In object detection tasks, wider networks are generally associated with improved sensitivity to object presence, as they can better represent variations in object appearance. For brain tumor detection, this characteristic is particularly relevant, as tumor regions may exhibit heterogeneous shapes, textures, and intensities across different MRI scans. As shown in Table 3, width scaling yields improvements in recall, mAP50, and mAP50–95 (up to 0.861, 0.909, and 0.664, respectively) relative to depth-only scaling, indicating enhanced sensitivity and localization capability. Due to increased feature-channel diversity and improved spatial representation, however, precision slightly decreases, reflecting a higher rate of false positives. This demonstrates that width expansion improves detection coverage but cannot fully restore performance alone.
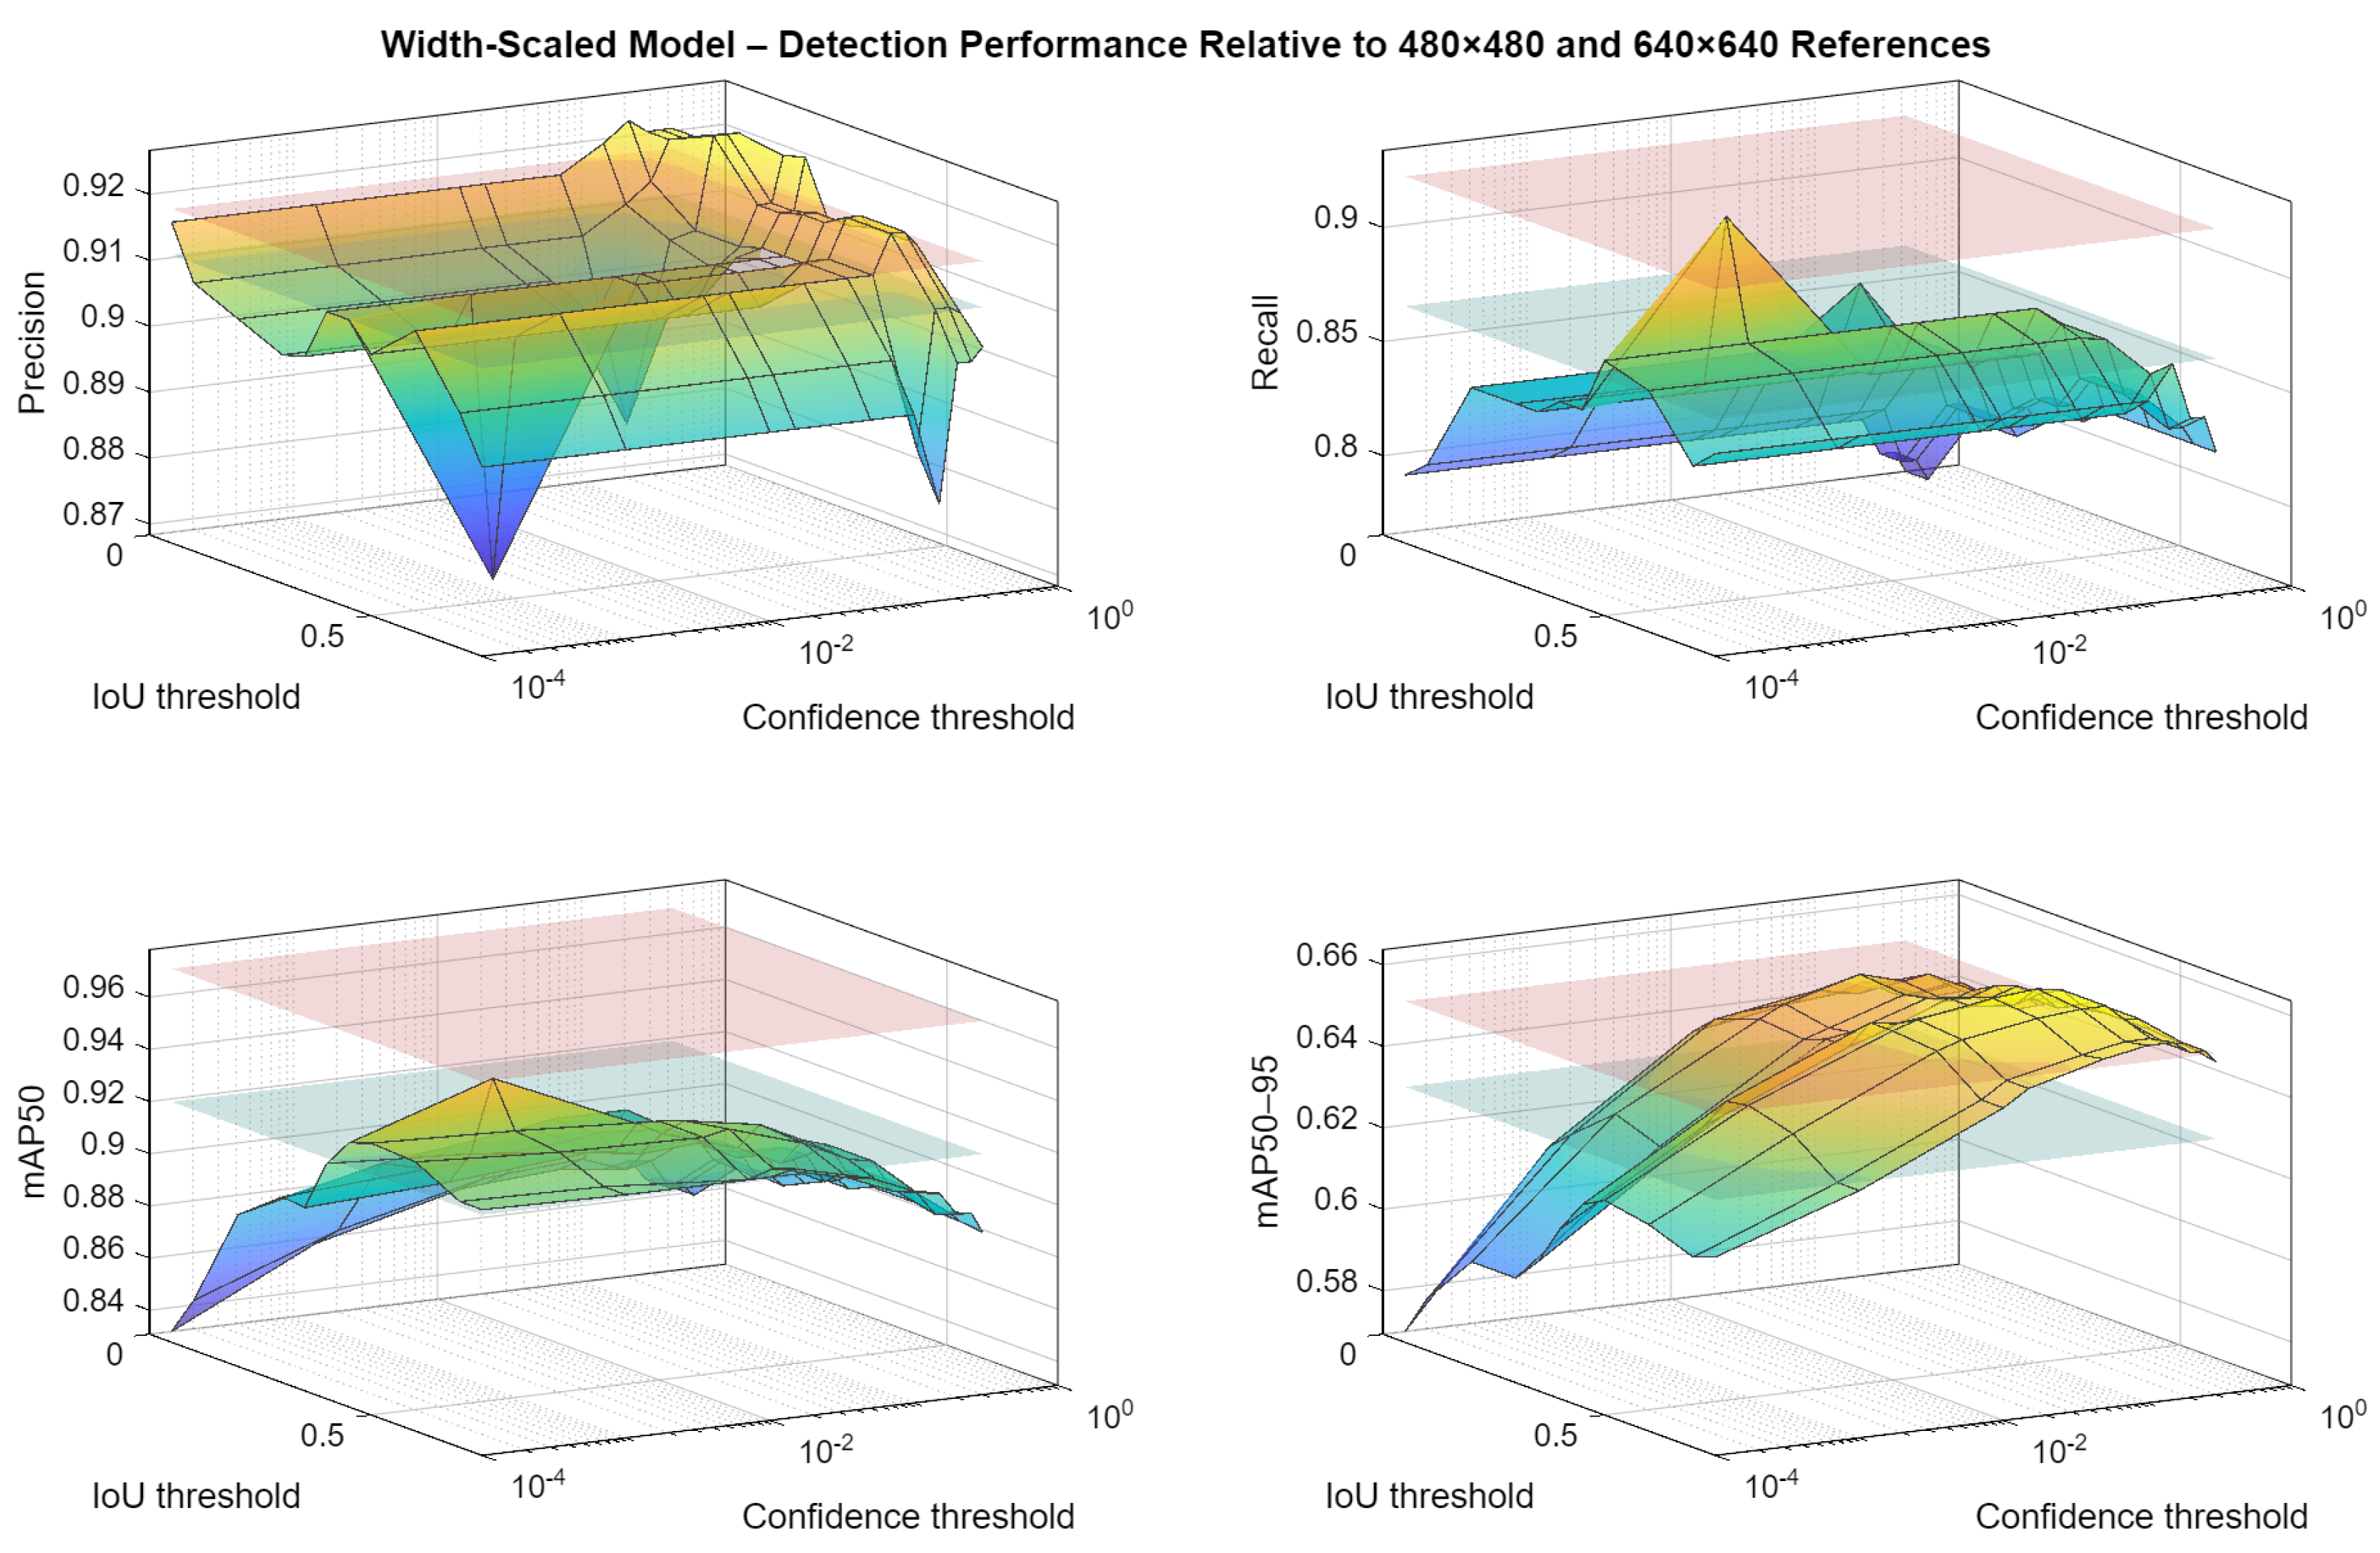
The corresponding threshold-dependent behavior is illustrated in Figure 4. Compared to the depth-scaled configuration, the width-scaled model exhibits a broader region of improved recall and mAP values, indicating better preservation of tumor-sensitive feature representations. At the same time, precision becomes less dominant, which reflects the expected trade-off between sensitivity and selectivity.

5.4. Depth–Width Balanced Configuration

Balanced scaling substantially recovers recall (0.877) while keeping precision stable (0.908). Through the results of increasing depth and width, the balanced configuration (depth = 1.1, width = 1.4) demonstrates that architectural synergy is more effective than isolated scaling. The best mAP50 (0.935) occurs with a very low conf (0.0001), and mAP50–95 (0.641) occurs with a very low conf (0.001), demonstrating the effectiveness of coordinated capacity scaling. The results are shown in Table 4.
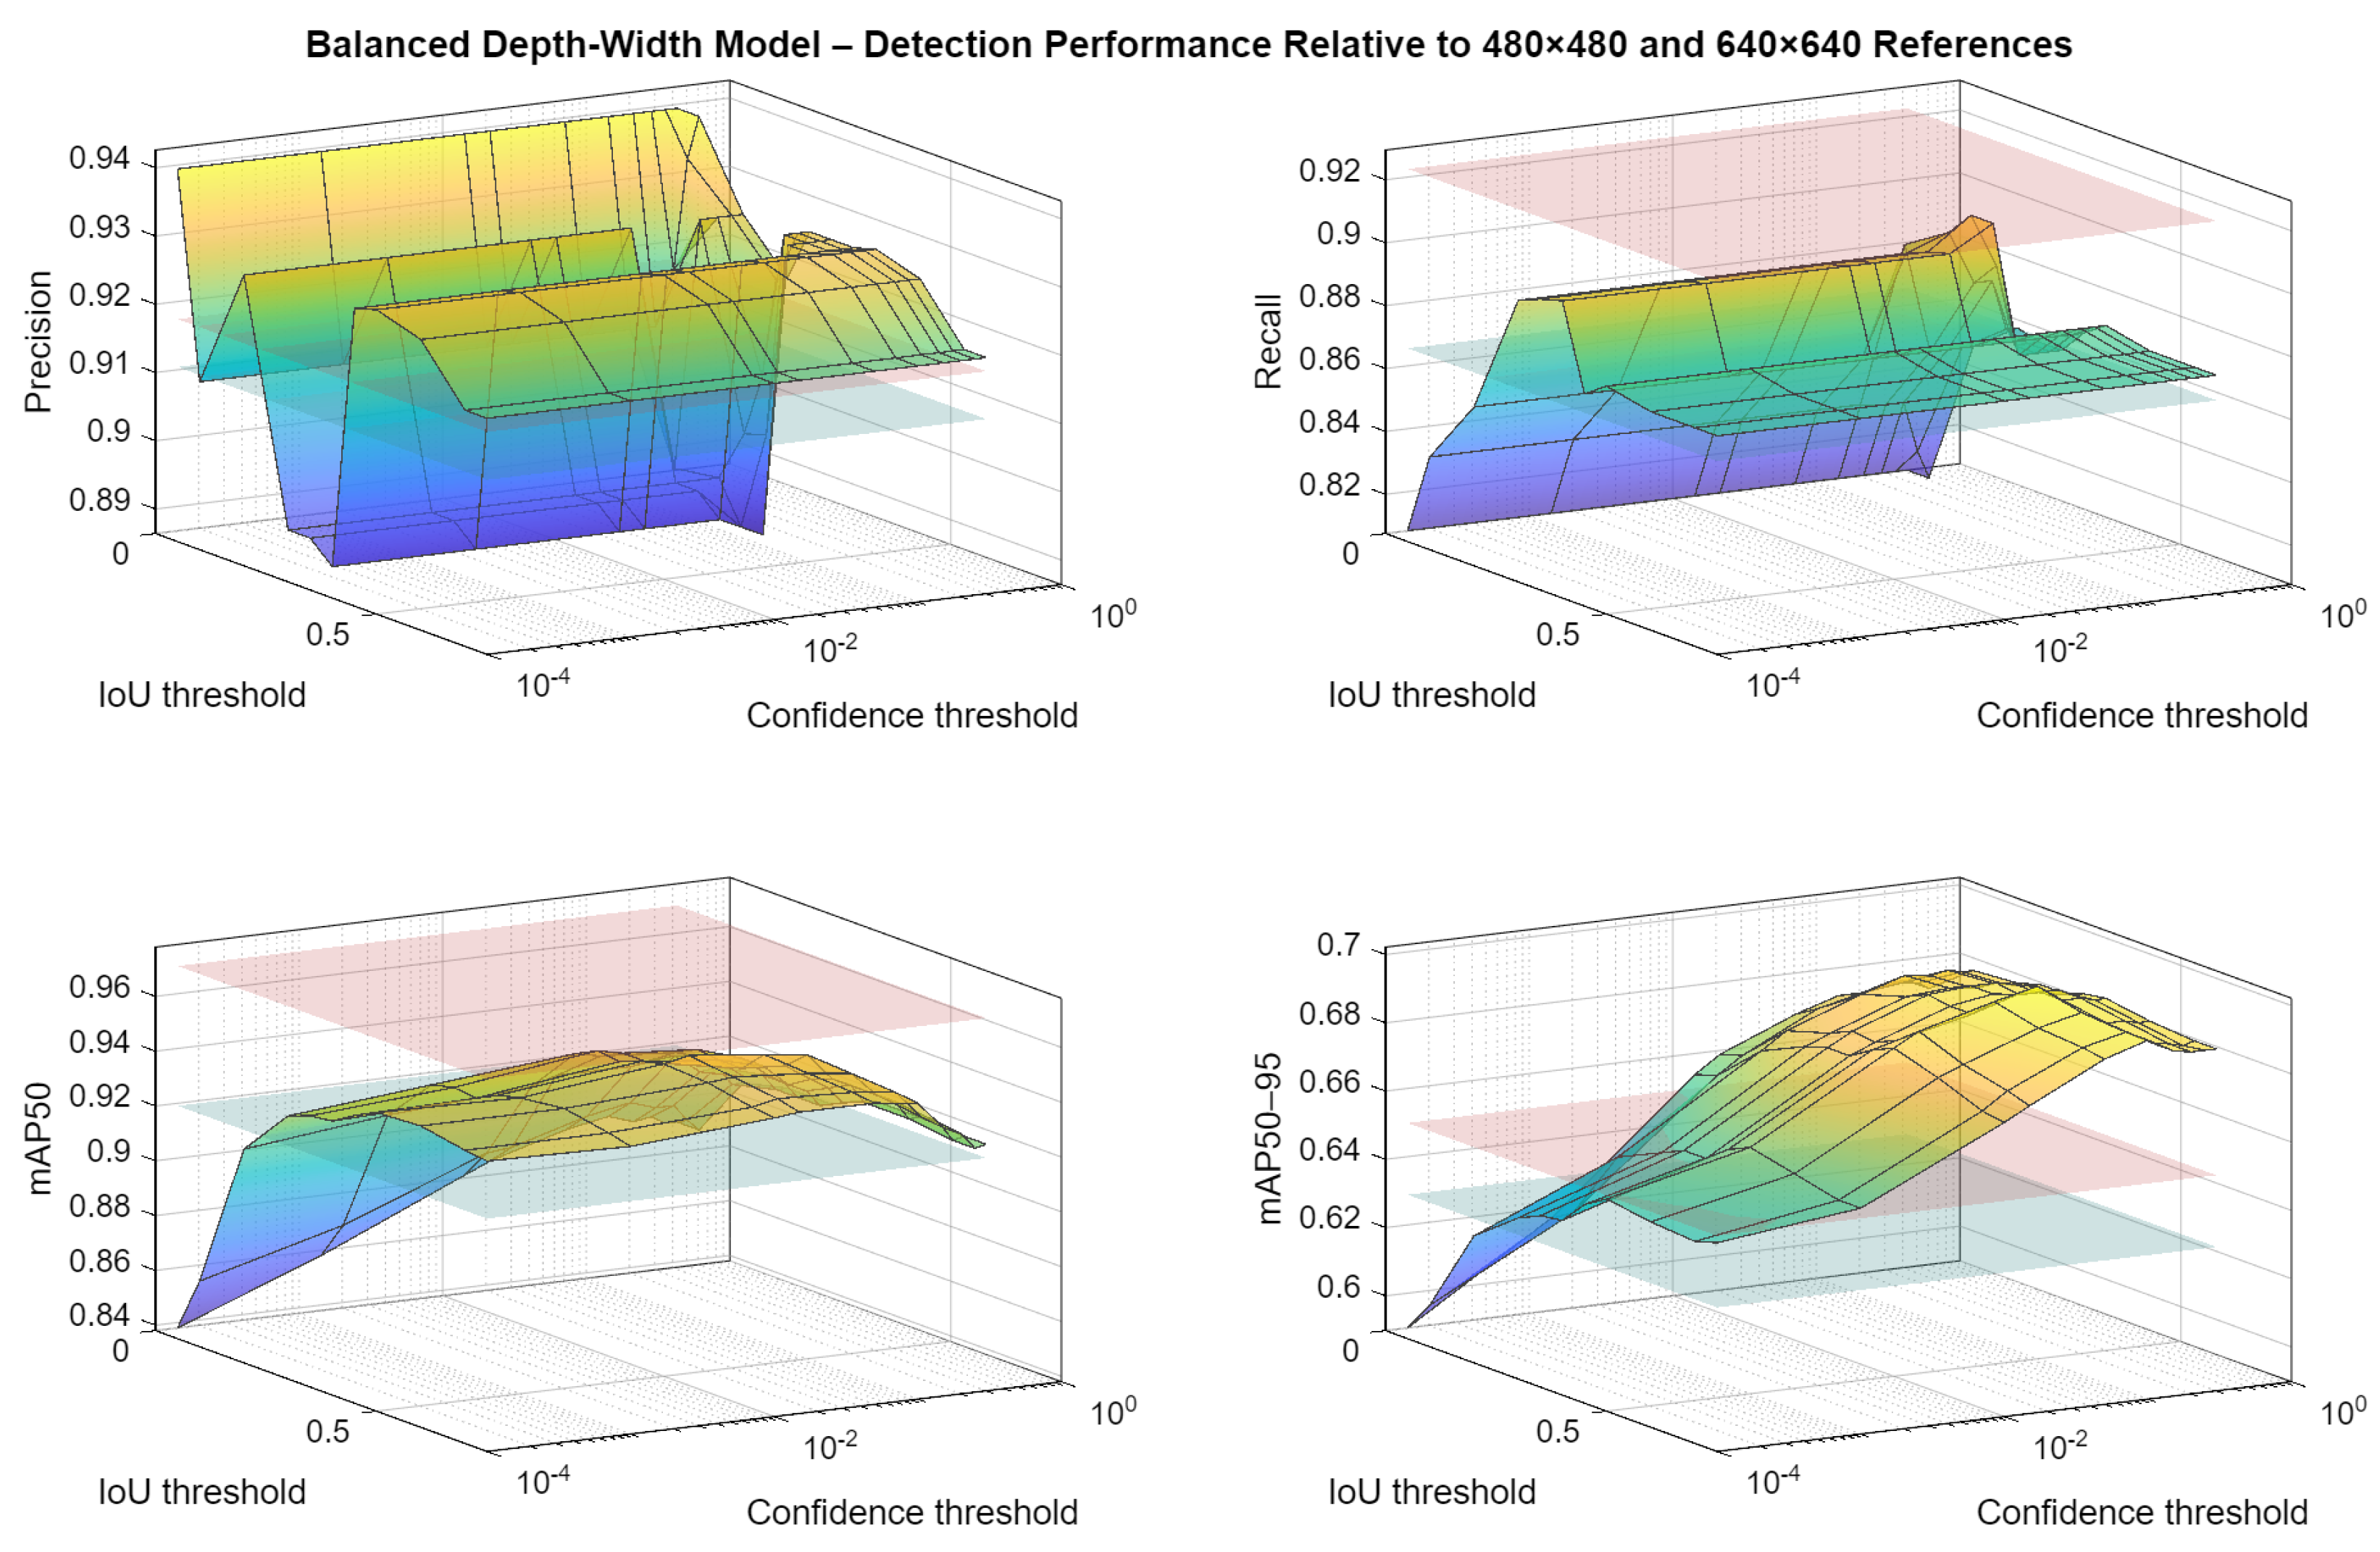
To complement the tabulated values, Figure 5 presents the performance surfaces of the balanced depth–width configuration across the investigated confidence and IoU thresholds. The figure shows a more favorable joint distribution of precision, recall, and localization metrics than the previous single-factor scaling experiments. In particular, the balanced configuration yields a wider region where recall and mAP50 remain high simultaneously, confirming that coordinated capacity scaling provides a more robust solution than isolated depth or width adjustment.
An analysis of the results presented in the depth and width scaling experiments reveals a clear trade-off between detection precision and sensitivity. As observed from the depth scaling results, increasing the network depth from 1.0 to 1.2 consistently improves precision, indicating a more selective detection behavior with reduced false-positive predictions. However, this improvement comes at the cost of a noticeable reduction in recall and mAP50, suggesting diminished sensitivity to tumor regions, particularly under reduced-resolution conditions. This behavior suggests that deeper architectures tend to favor conservative detection decisions when spatial detail is limited. Conversely, the width scaling experiments demonstrate that a moderate increase in network width leads to improvements in recall, mAP50, and mAP50–95, reflecting enhanced sensitivity and localization capability. This behavior can be attributed to the increased number of feature channels, which enables richer spatial representation and better capture of tumor-related variations. Nevertheless, this improvement is accompanied by a slight reduction in precision, although the resulting precision values remain within an acceptable and competitive range compared to earlier configurations. These observations indicate that width scaling alone improves coverage but does not fully preserve the selectivity achieved through increased depth. These complementary trends confirm that depth and width scaling affect detection performance in fundamentally different but synergistic ways. Depth scaling primarily promotes precision-oriented behaviour, whereas width scaling enhances recall and localization accuracy. Relying on either strategy independently, therefore, leads to an imbalance between selectivity and sensitivity, preventing the model from achieving optimal overall performance under reduced input size. Motivated by this trade-off, a balanced scaling strategy was implemented by moderately reducing the depth scaling factor to 1.1 while further increasing the width scaling factor to 1.4. This configuration was evaluated using the same dataset split, input resolution (480 × 480), and experimental protocol to validate whether harmonizing depth and width could jointly improve detection performance. The balanced depth–width configuration achieves a more favourable compromise between precision and sensitivity compared to isolated depth or width scaling. In particular, recall and mAP50 are improved relative to depth-only scaling, while precision remains competitive and substantially higher than that obtained through aggressive width expansion alone. These findings demonstrate that coordinated depth–width scaling is an effective strategy for mitigating resolution-induced performance degradation while maintaining a balanced detection behavior.

5.5. Effect of MixUp and Dropout

MixUp augmentation and dropout regularization refinement also played a crucial role. They result in the overall localization strictness metric mAP50–95, peaking at 0.692 with (conf = 0.1, IoU = 0.4) and delivering a strong recall of 0.910, as shown in Table 5. MixUp generates synthetic training samples by linearly combining pairs of images and their corresponding labels, encouraging smoother decision boundaries and improved generalization [45]. Dropout complements this process by randomly deactivating a fraction of neurons during training, preventing co-adaptation and promoting more generalized feature learning [46]. This step aims to enhance model generalization and reduce overfitting without altering the network architecture.
A comparative analysis between models trained with and without data augmentation showed that the inclusion of MixUp led to improved performance in terms of mAP50–95 and recall, confirming its effectiveness in enhancing model generalization. Similarly, the use of the AdamW optimizer contributed to more stable convergence and improved detection sensitivity compared to standard optimization settings.
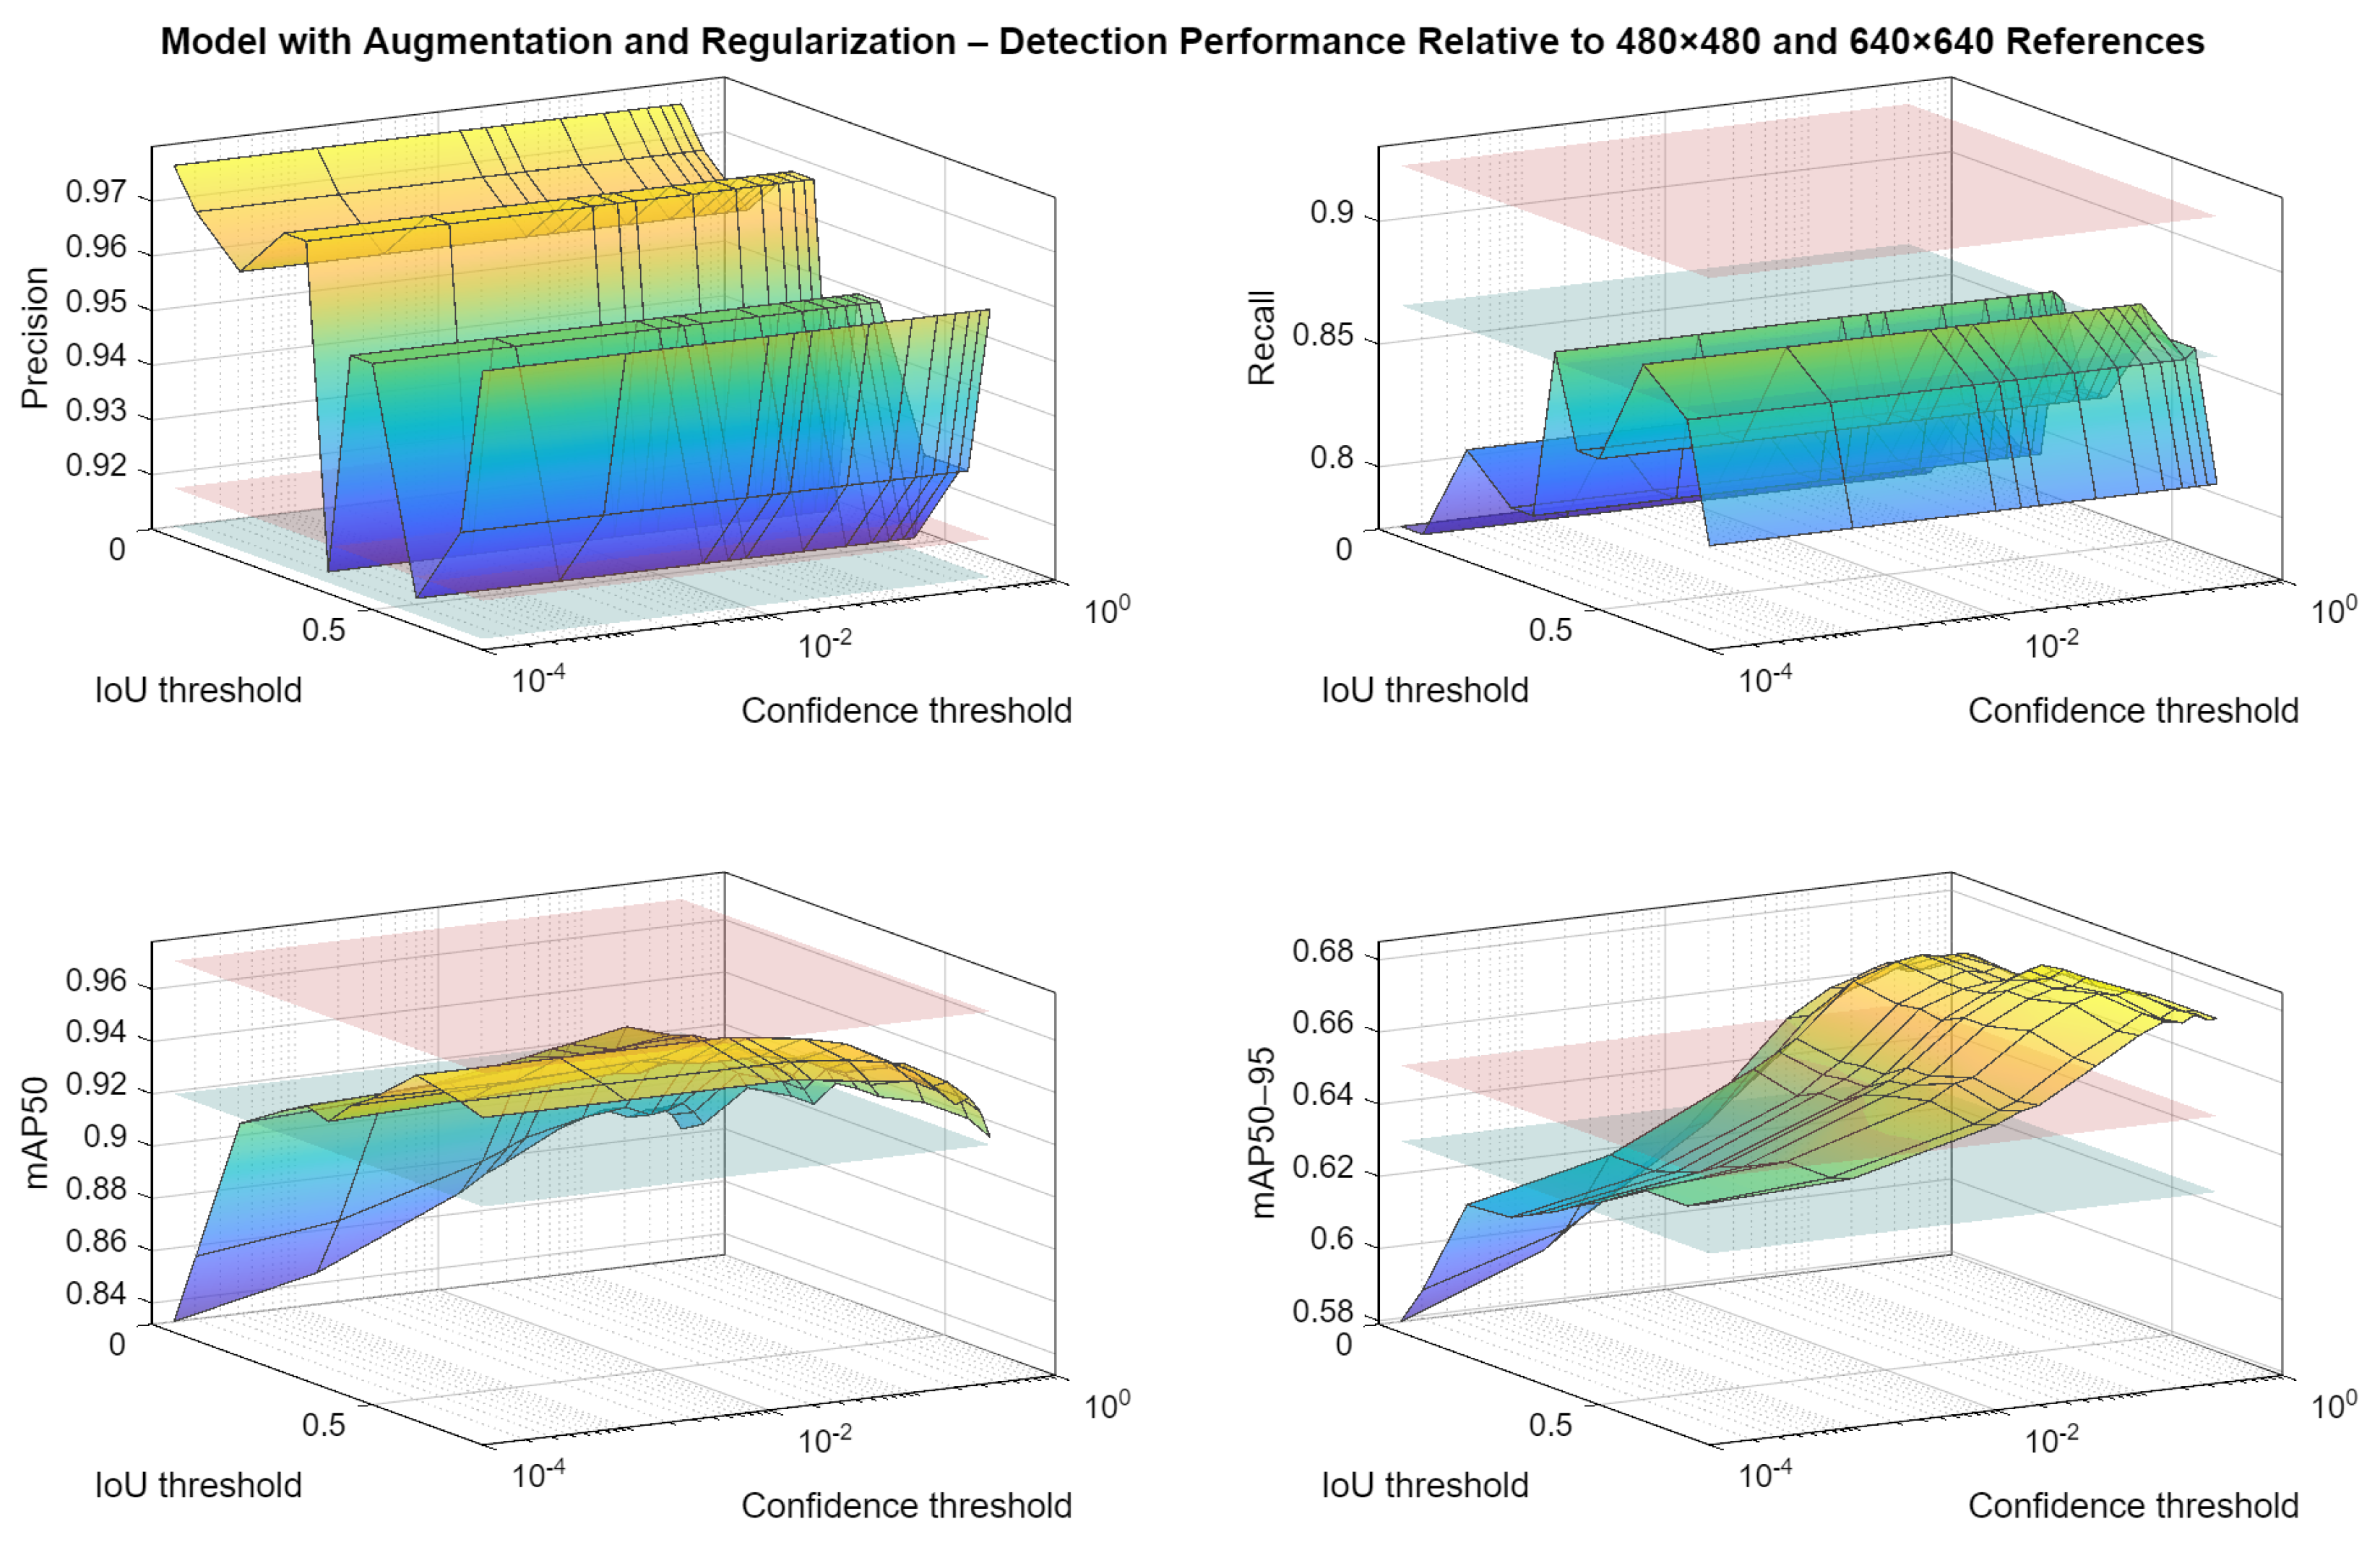
Figure 6 further illustrates the effect of MixUp augmentation and dropout regularization across the evaluated threshold pairs. Compared with the balanced architecture alone, the regularized configuration produces a more favorable mAP50–95 landscape and preserves strong recall in a wider operating region. This behavior suggests that the training-level regularization improves generalization and stabilizes localization performance under reduced-resolution conditions.

5.6. Optimizer and Learning Rate Comparison

Switching to AdamW produced the strongest recall values in the 480 × 480 study. As shown in Table 6, a higher learning rate ( r l 0 = 0.001 ) can yield higher precision (up to 0.978), but with a substantial recall penalty (0.779), which is difficult to justify when the clinical priority is sensitivity and localization accuracy. In contrast, the best overall balance was achieved at r l 0 = 0.0001 , with a maximum recall of 0.943 and mAP50–95 of 0.672, as shown in Table 7. These results suggest that detection robustness under reduced resolution depends on joint architectural and optimization strategies, rather than increased input size alone.
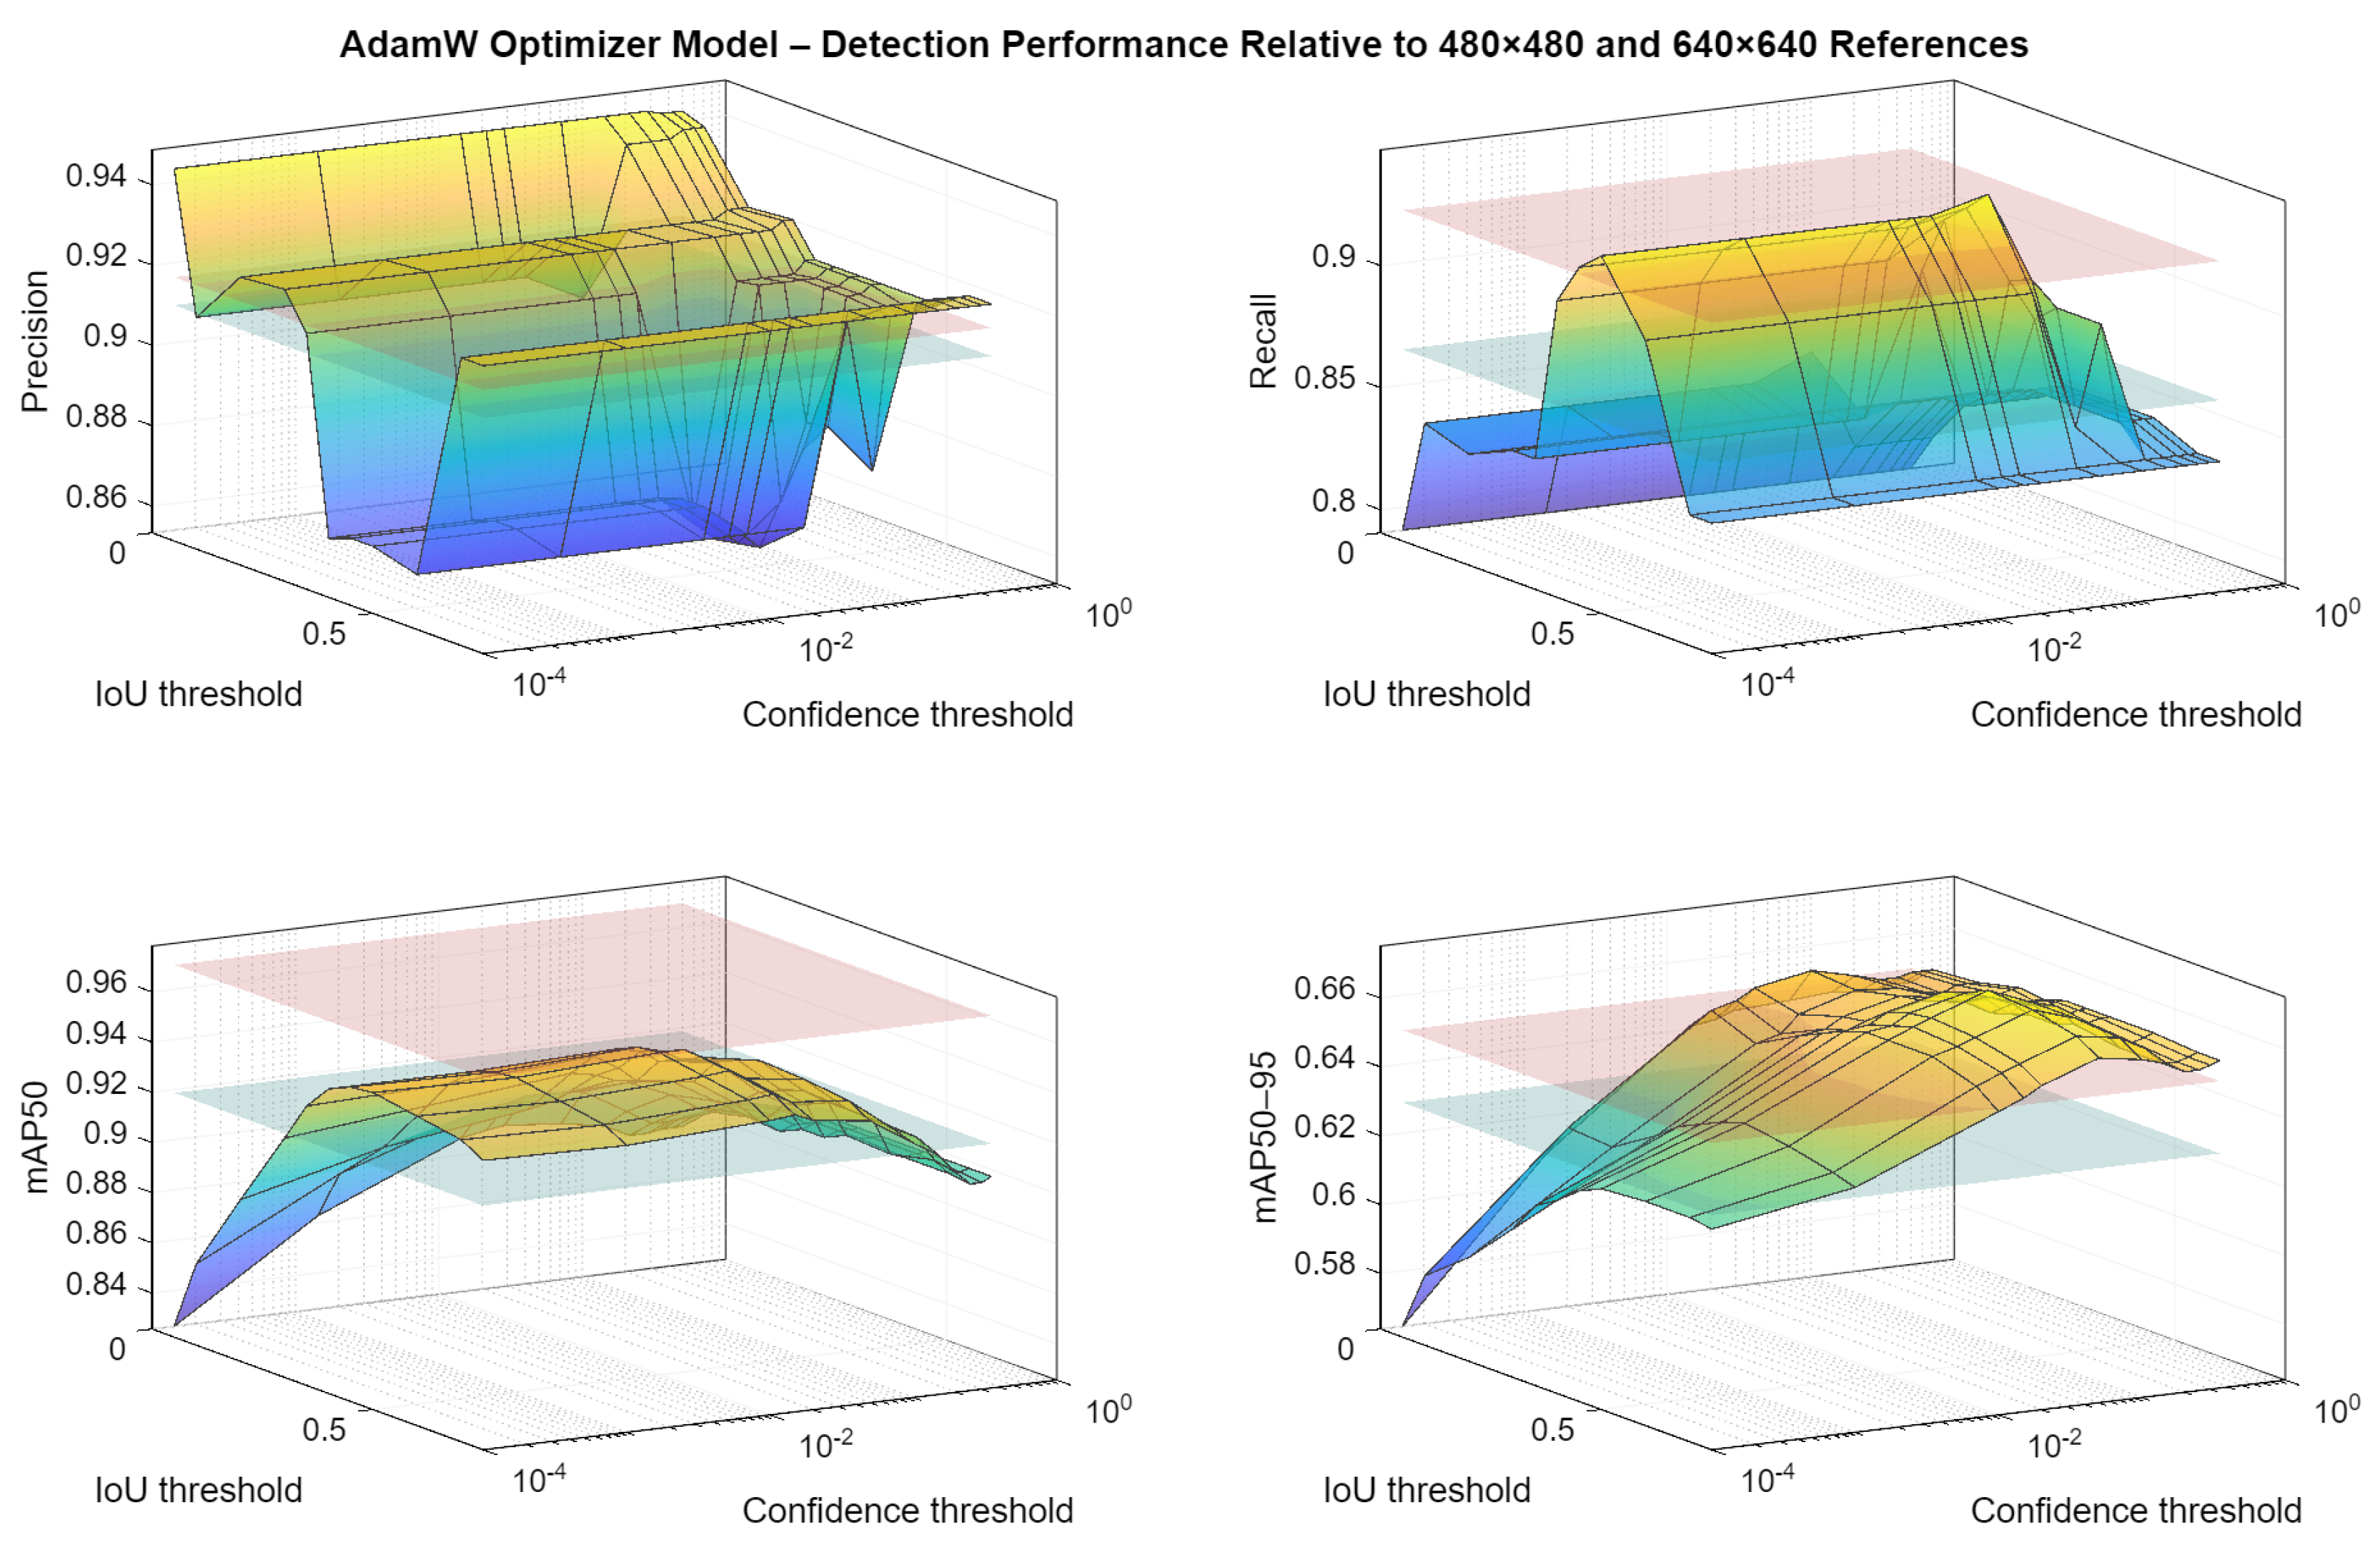
The threshold-dependent behavior of the final AdamW-based configuration is shown in Figure 7, demonstrating that the optimized training strategy produces a broad high-performing region, especially in recall and mAP50–95. These results confirm that the AdamW optimizer together with the tuned learning-rate schedule contributes substantially to the recovery of reduced-resolution performance. Notably, the best-performing region is centered around moderate IoU and confidence settings, indicating stable and clinically relevant operating conditions.

5.7. Summary of Study

Table 8 summarizes the best-performing configuration obtained at each stage of the proposed optimization pipeline and highlights the final model performance relative to the original baseline. The reference model evaluated at 640 × 640 achieves a recall of 0.926 and an mAP50–95 of 0.653. In contrast, the final optimized configuration under reduced resolution (480 × 480) attains a higher recall of 0.943 and an improved mAP50–95 of 0.672, demonstrating that the proposed optimization strategy not only compensates for the loss of spatial resolution but also surpasses the original baseline in key performance indicators. These results confirm that progressive architectural scaling, regularization, and optimizer refinement collectively enhance detection sensitivity and localization reliability. In medical imaging applications, false negatives are often more critical than false positives. The superior recall achieved by the proposed method relative to several state-of-the-art models demonstrates its potential suitability for clinical screening scenarios. Although certain transformer-based detectors report slightly higher mAP50–95 values, the proposed framework maintains competitive localization accuracy while offering enhanced sensitivity. Achieving higher recall and mAP50–95 than the original high-resolution configuration highlights the effectiveness of the proposed framework in maintaining clinical sensitivity and localization accuracy, even under reduced-resolution constraints.
To further interpret these results, an ablation-style analysis of the optimization pipeline is provided, explicitly quantifying the contribution of each component to the recovery of detection performance under reduced-resolution conditions. Starting from the reduced baseline 480 × 480, depth scaling increased precision but reduced recall, indicating a more conservative detection behavior. Width scaling partially compensated for this by improving recall and mAP-related metrics due to enhanced feature representation capacity. The introduction of balanced depth–width scaling further improved both precision and recall, demonstrating that coordinated architectural scaling is more effective than isolated adjustments. Subsequent application of MixUp augmentation and dropout regularization improved generalization and localization robustness, as reflected by increased mAP50–95 values. Finally, the use of the AdamW optimizer with a lower learning rate (lr0 = 0.0001) resulted in the most significant improvement in recall and overall detection stability. This step played a critical role in enabling the reduced-resolution model to match and, in some cases, surpass the high-resolution baseline.

5.8. Qualitative Detection Results

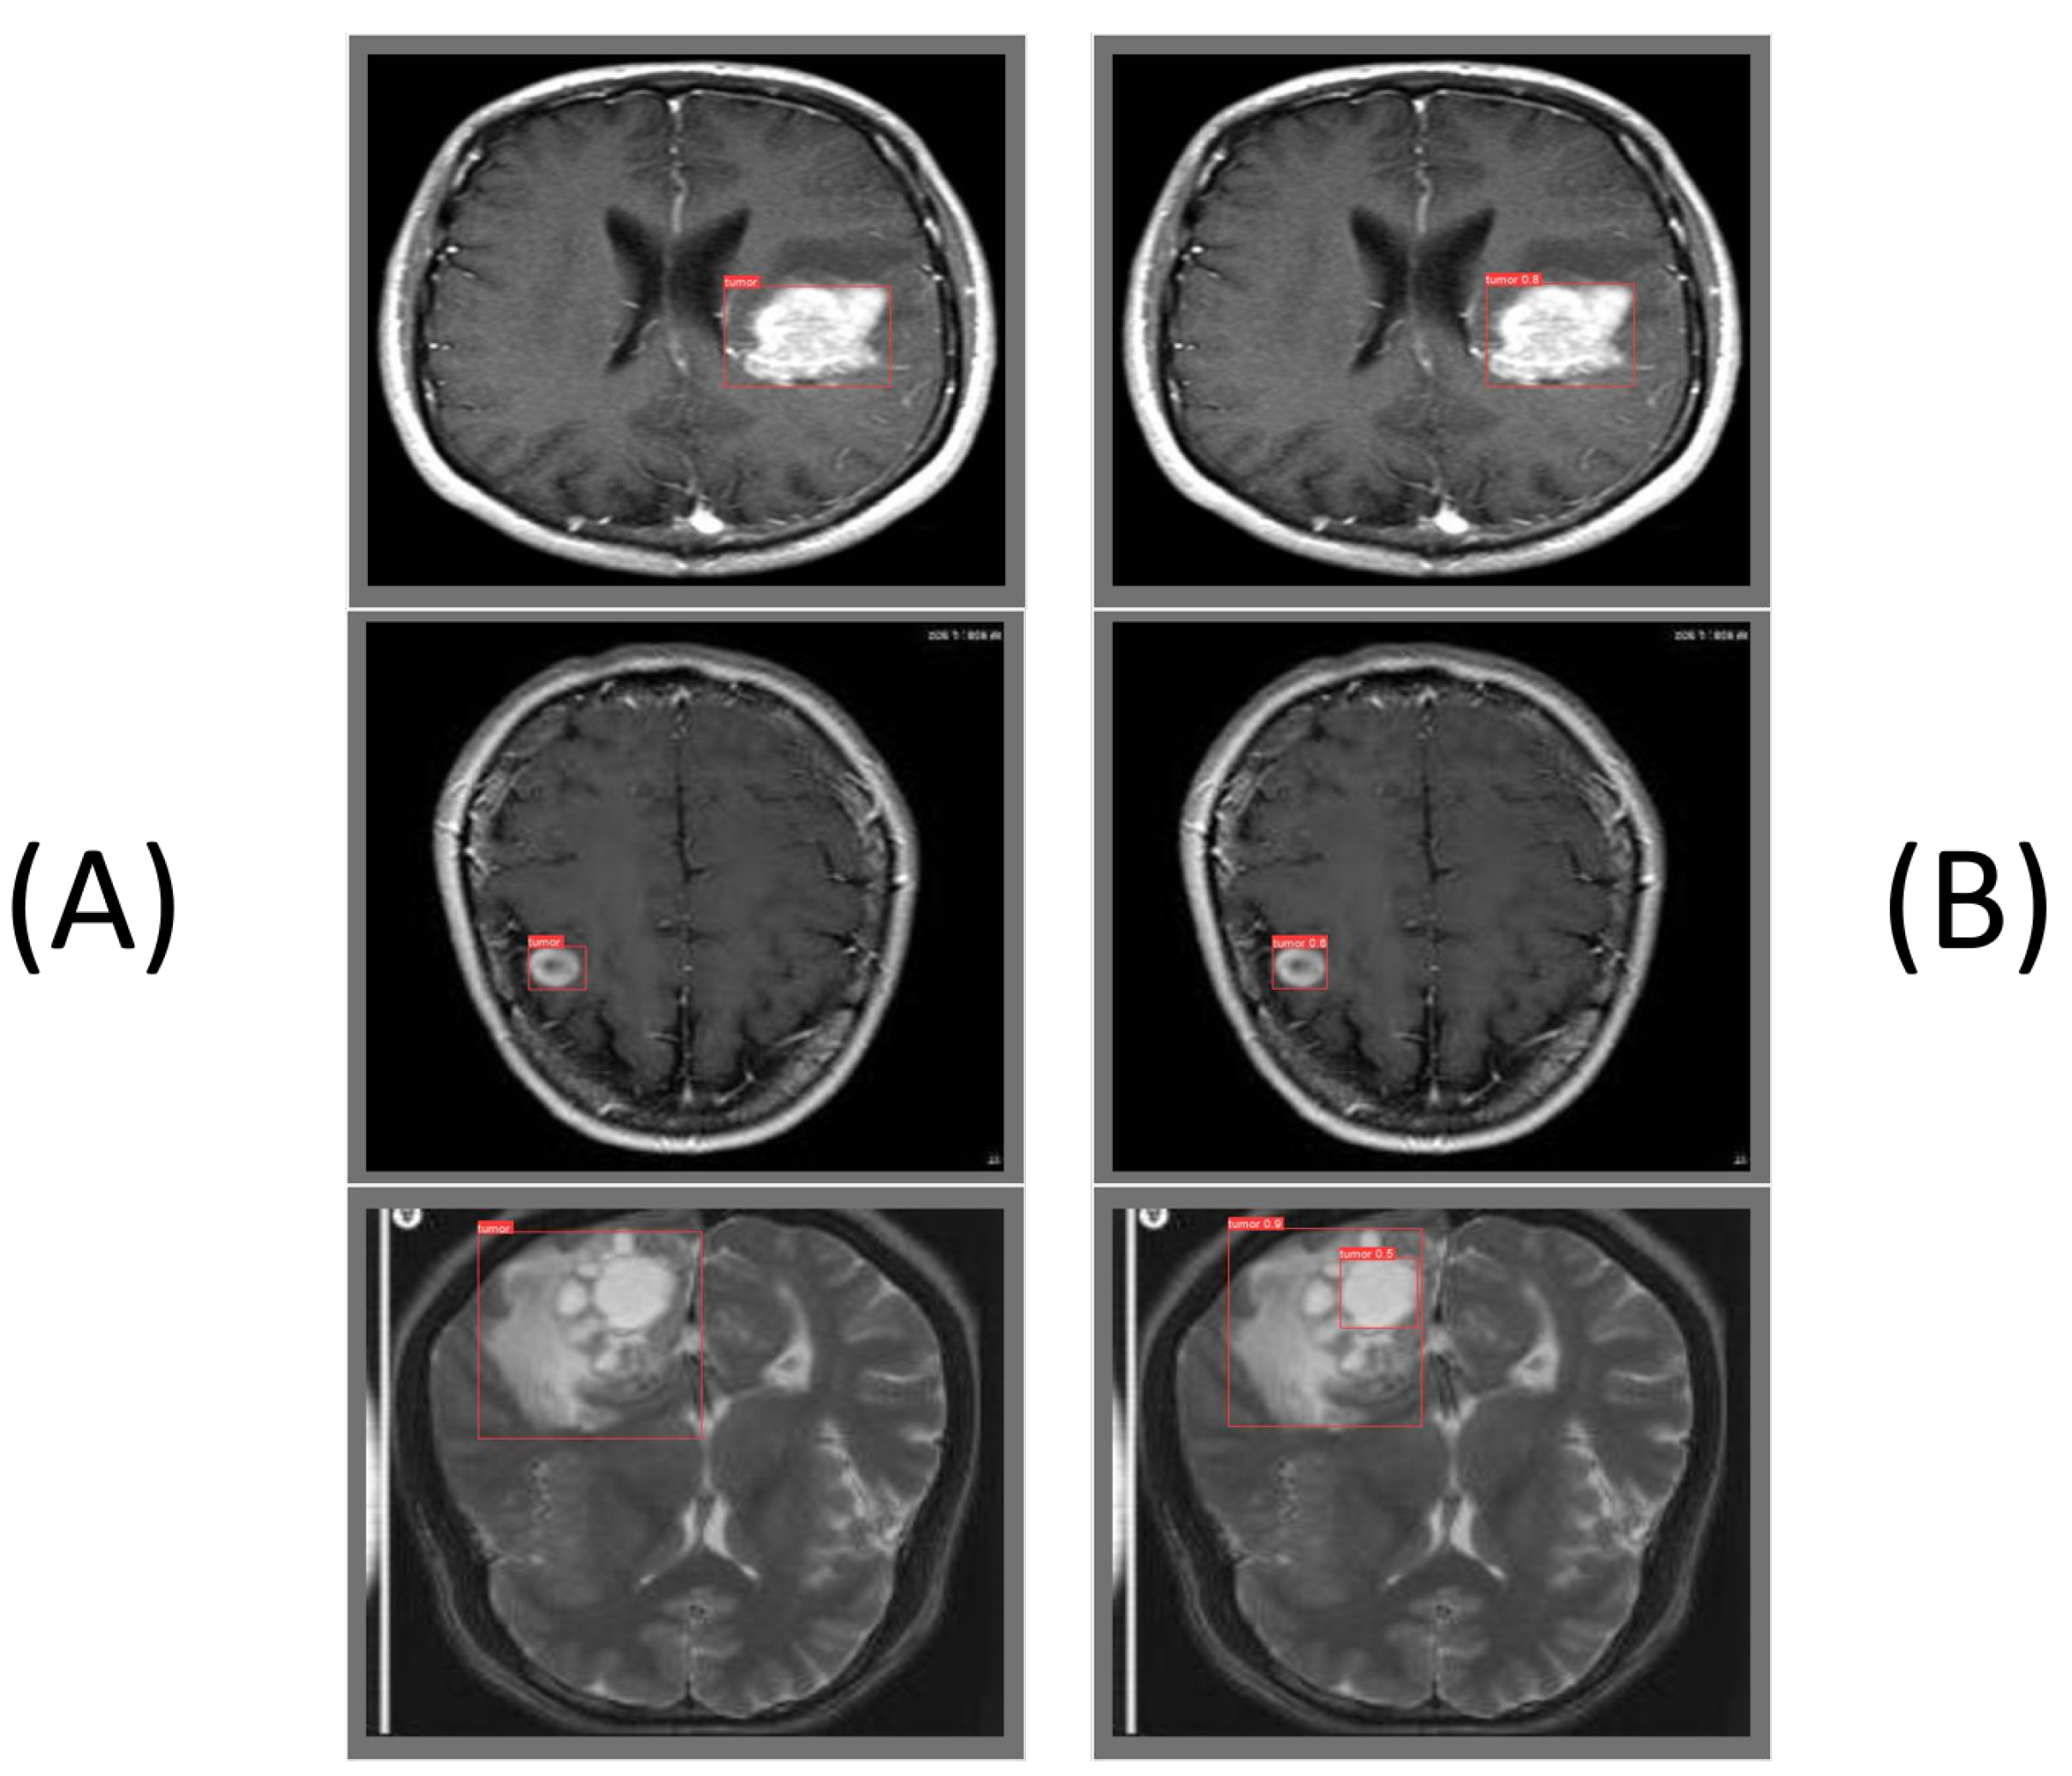
Figure 8 presents representative qualitative detection results on brain MRI images, comparing ground-truth annotations (A) with the predicted model outputs (B). The first example demonstrates accurate localization of a large, high-contrast tumor region, where the predicted bounding box closely overlaps the annotated ground-truth box ( IoU = 0.8 ), indicating reliable spatial detection.
The second example highlights the model’s sensitivity to small lesions. Despite the relatively limited tumor area, the model successfully identifies the tumor and produces a well-centered bounding box with a high confidence score ( conf = 0.6 ).
The third example illustrates performance on a complex tumor appearance, where the model detects the main tumor region and additionally captures an internal or sub-region component, reflecting robustness to heterogeneous tumor morphology and intra-tumoral structural variations. This behavior suggests effective training, as some training samples contain overlapping tumors, as illustrated in Figure 1.
In general, these examples confirm that the proposed configuration maintains accurate tumor localization across varying tumor sizes and appearance patterns.
Tumor size variation is a critical factor in brain tumor detection, particularly under reduced-resolution conditions. Small lesions are more sensitive to resolution reduction due to the loss of fine spatial details, whereas larger tumors remain more detectable due to their prominent spatial characteristics. This effect becomes more evident when comparing different input resolutions, where higher-resolution inputs (640 × 640) preserve finer details that improve the detection of small or low-contrast tumor regions, while reduced-resolution inputs (480 × 480) may lead to slight localization coarseness. Despite this limitation, the proposed optimization strategy helps to avoid performance degradation by enhancing feature representation and improving detection sensitivity, as reflected in both quantitative results and the qualitative examples shown in Figure 8. These qualitative results further indicate that, although smaller tumors are more sensitive to reduced spatial resolution, the proposed model maintains effective detection performance across different tumor sizes.

5.9. The Training Configuration

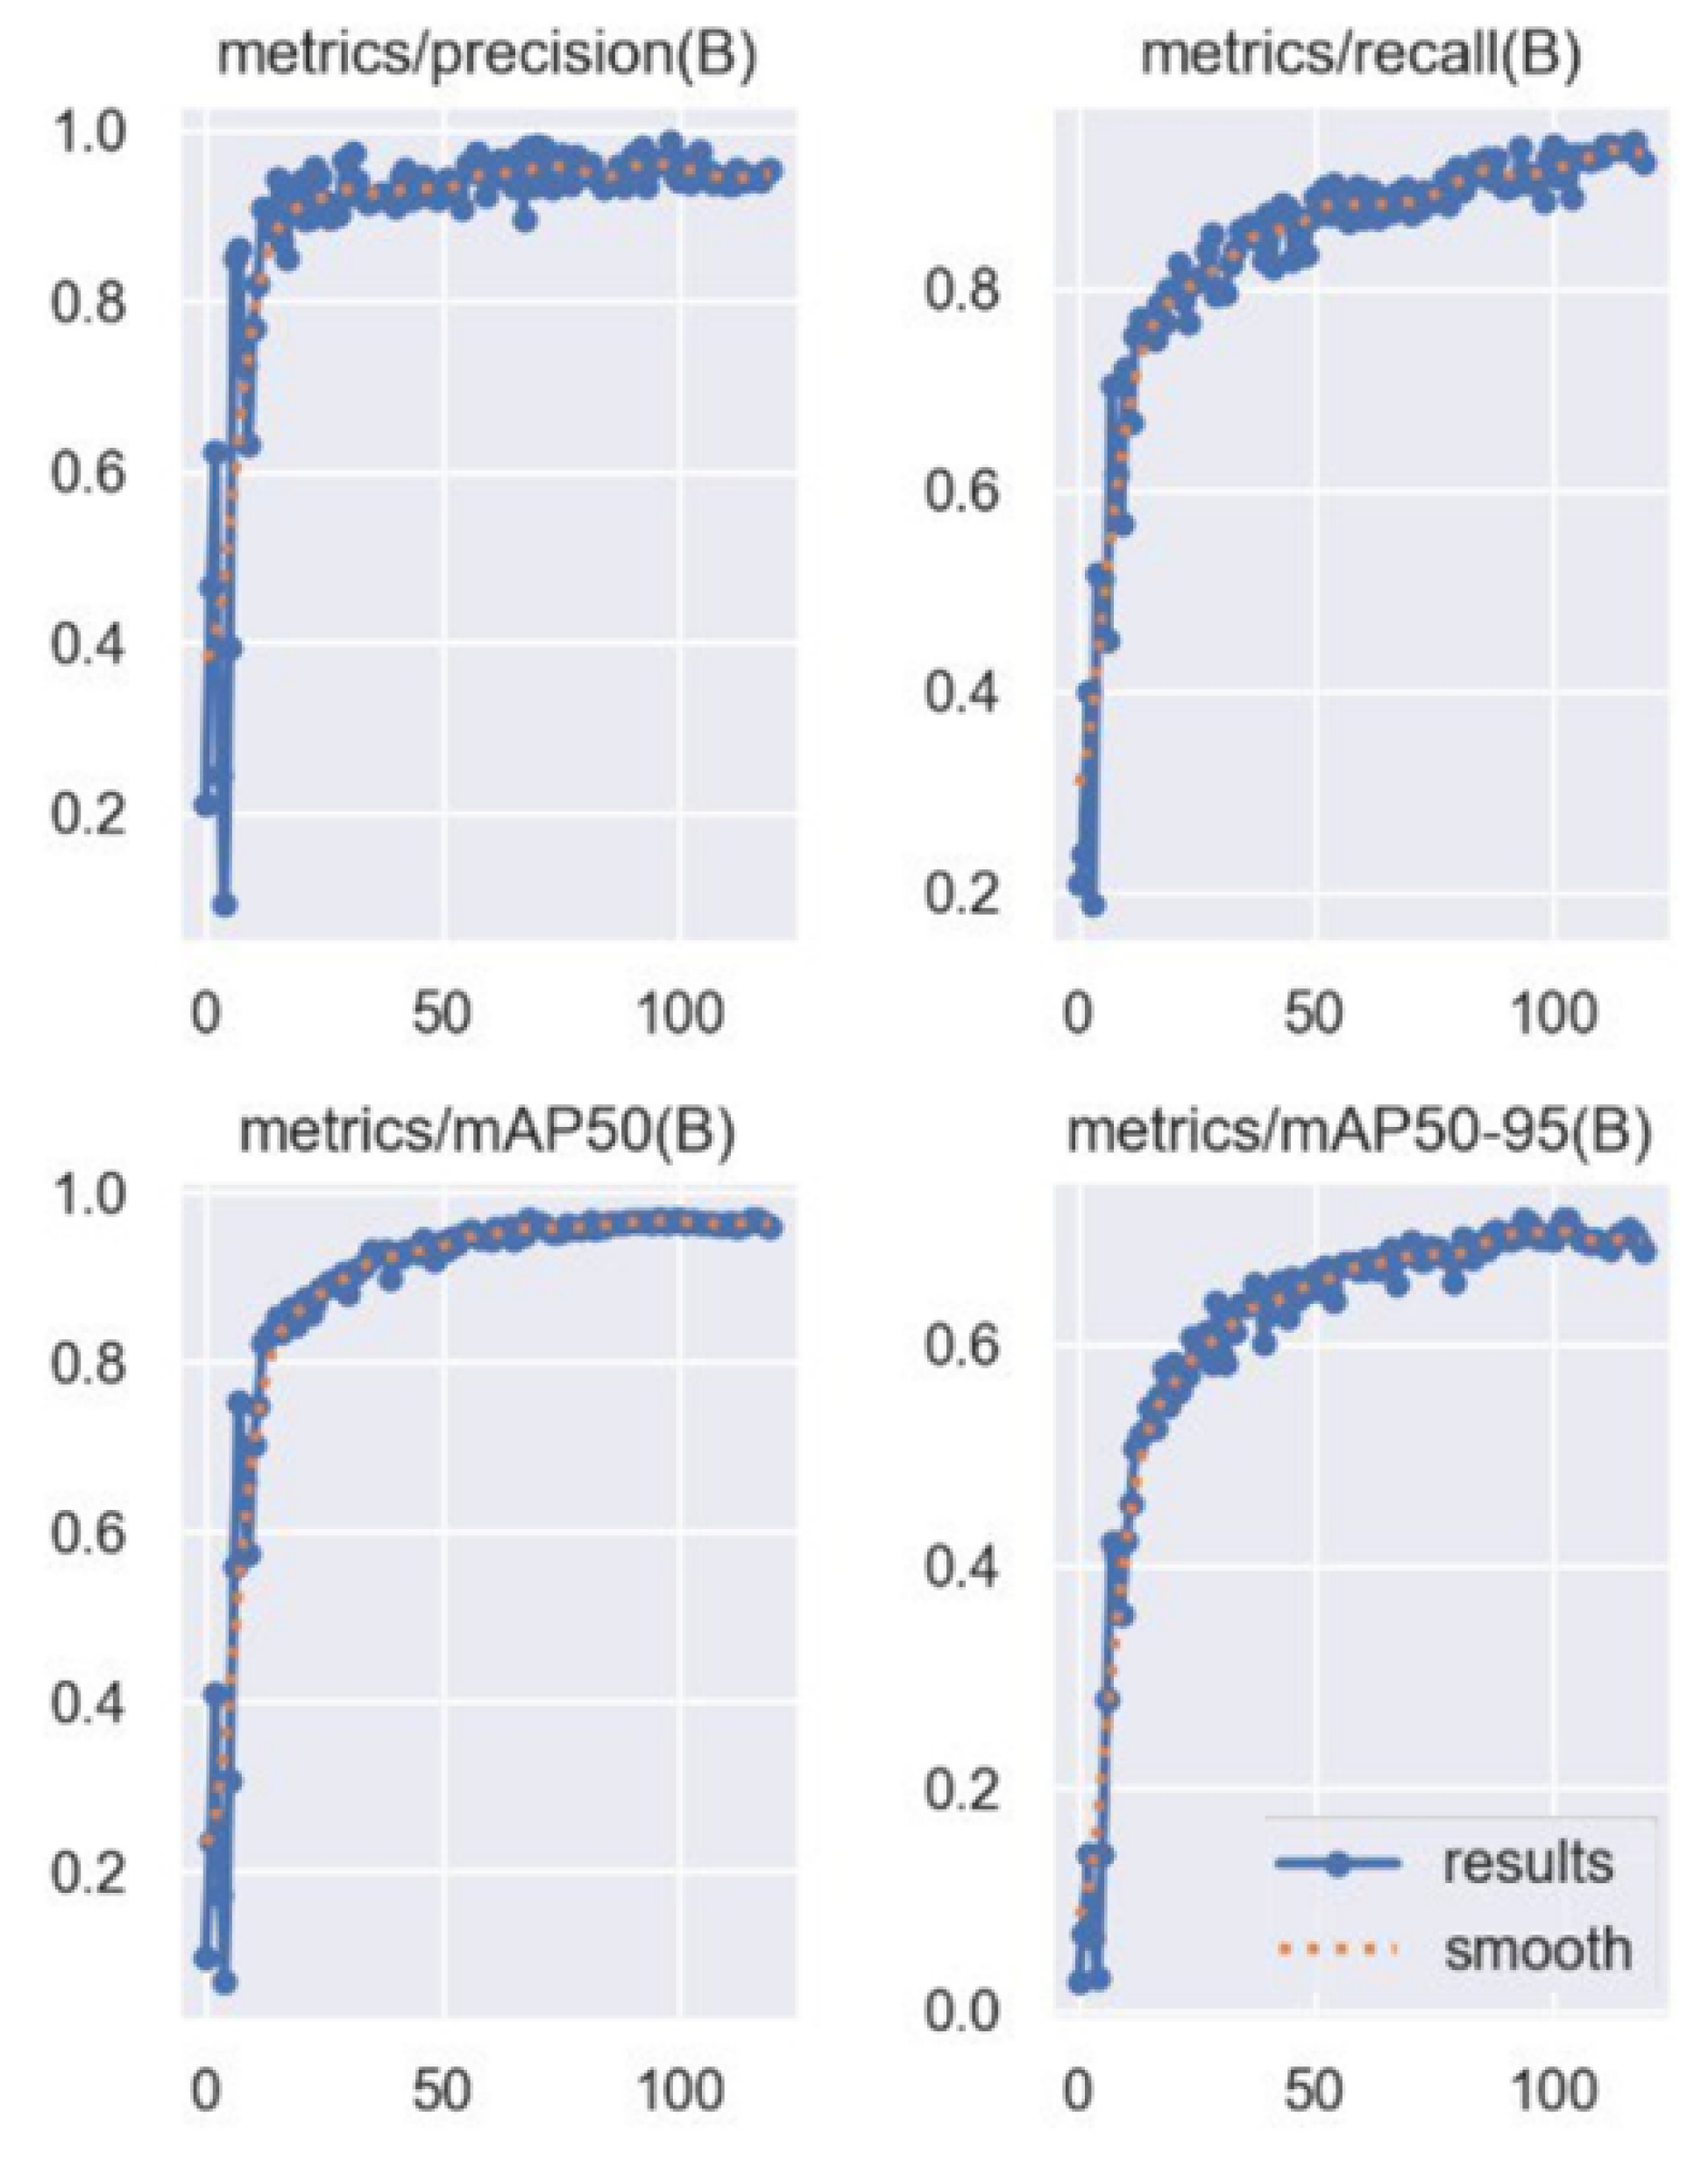
Data augmentation was applied using MixUp with a mixing ratio of 0.1 to improve generalization and robustness. This approach combines pairs of training samples to enhance feature diversity and reduce overfitting. The model was trained for 120 epochs using an NVIDIA GeForce RTX 4060 Laptop GPU. Figure 4 illustrates the progression of the model’s key performance metrics during the training process, including precision, recall, mAP50, and mAP50–95 across training epochs.
All metrics demonstrate rapid improvement during the early epochs, indicating the model’s ability to effectively learn the discriminative features of brain tumors in the initial stages of training. Subsequently, the curves gradually stabilize, reflecting convergence without significant fluctuations.
Precision increases to a high level and stabilizes toward the end of training, suggesting a reduction in false-positive detections. Recall also shows a steady upward trend, indicating that the model successfully identifies most true tumor instances.
The mAP50 achieves high values, reflecting strong detection performance under moderate IoU criteria. In contrast, mAP50–95 is comparatively lower, as expected, due to the stricter overlap requirements. Nevertheless, it exhibits a consistent upward trend, demonstrating improved tumor region localization accuracy.
Overall, the Figure 9 indicates stable convergence and robust learning behavior, with no clear signs of overfitting during the training phase.
In addition to detection performance, computational efficiency is an important factor in real-world deployment, particularly in clinical environments where rapid inference and limited hardware resources are common. Reducing the input resolution from 640 × 640 to 480 × 480 decreases the number of input pixels by approximately 44%, leading to a proportional reduction in computational cost. This reduction is expected to improve inference speed and lower GPU memory consumption, enabling faster processing and making the proposed model more suitable for real-time or resource-constrained applications.

5.10. Comparative Results

Table 9 presents a quantitative comparison between the proposed method and several recent state-of-the-art brain tumor detection models evaluated on the Br35H dataset [37]. Although the proposed framework operates at a reduced input resolution of 480 × 480 it achieves highly competitive and, in certain aspects, superior performance compared to models trained at 640 × 640 resolution.
In terms of recall, the proposed method attains 0.943, surpassing YOLOv8x (0.881), YOLOv9e (0.869), YOLOv10x (0.808), BGF-YOLO (0.926), RCS-YOLO (0.885), STAR-YOLO (0.852), YOLOv10-TL (0.927), and PK-YOLO (0.896), while remaining comparable to OS-DETR (0.942). This demonstrates enhanced sensitivity in tumor detection, a particularly important factor in clinical applications where minimizing missed tumor regions is critical.
Regarding mAP50–95, which reflects stricter localization performance across multiple IoU thresholds, the proposed method achieves 0.672, outperforming the original BGF-YOLO baseline (0.653), YOLOv8x (0.646), YOLOv9e (0.630), YOLOv10x (0.603), RCS-YOLO (0.580), and STAR-YOLO (0.642). Although OS-DETR (0.742) and YOLOv10-TL (0.739) report higher values, these models operate at higher input resolutions and increased computational capacity.
For mAP50, the proposed method achieves 0.946, outperforming YOLOv8x (0.927), YOLOv9e (0.919), YOLOv10x (0.880), and RCS-YOLO (0.878), while closely matching PK-YOLO (0.947) and remaining competitive with higher-resolution detectors. This indicates that reducing input resolution does not substantially compromise detection accuracy at the standard IoU threshold.
While precision (0.858) is slightly lower than some transformer-based or transfer-learning-enhanced models, it remains within an acceptable and competitive range, particularly considering the model’s emphasis on sensitivity.
Overall, the results indicate that the proposed optimization strategy effectively balances detection sensitivity and localization accuracy under reduced-resolution constraints. The model demonstrates superior recall and competitive mAP performance compared to several 640 × 640-based detectors, highlighting the effectiveness of progressive architectural scaling and optimizer refinement.

6. Conclusions

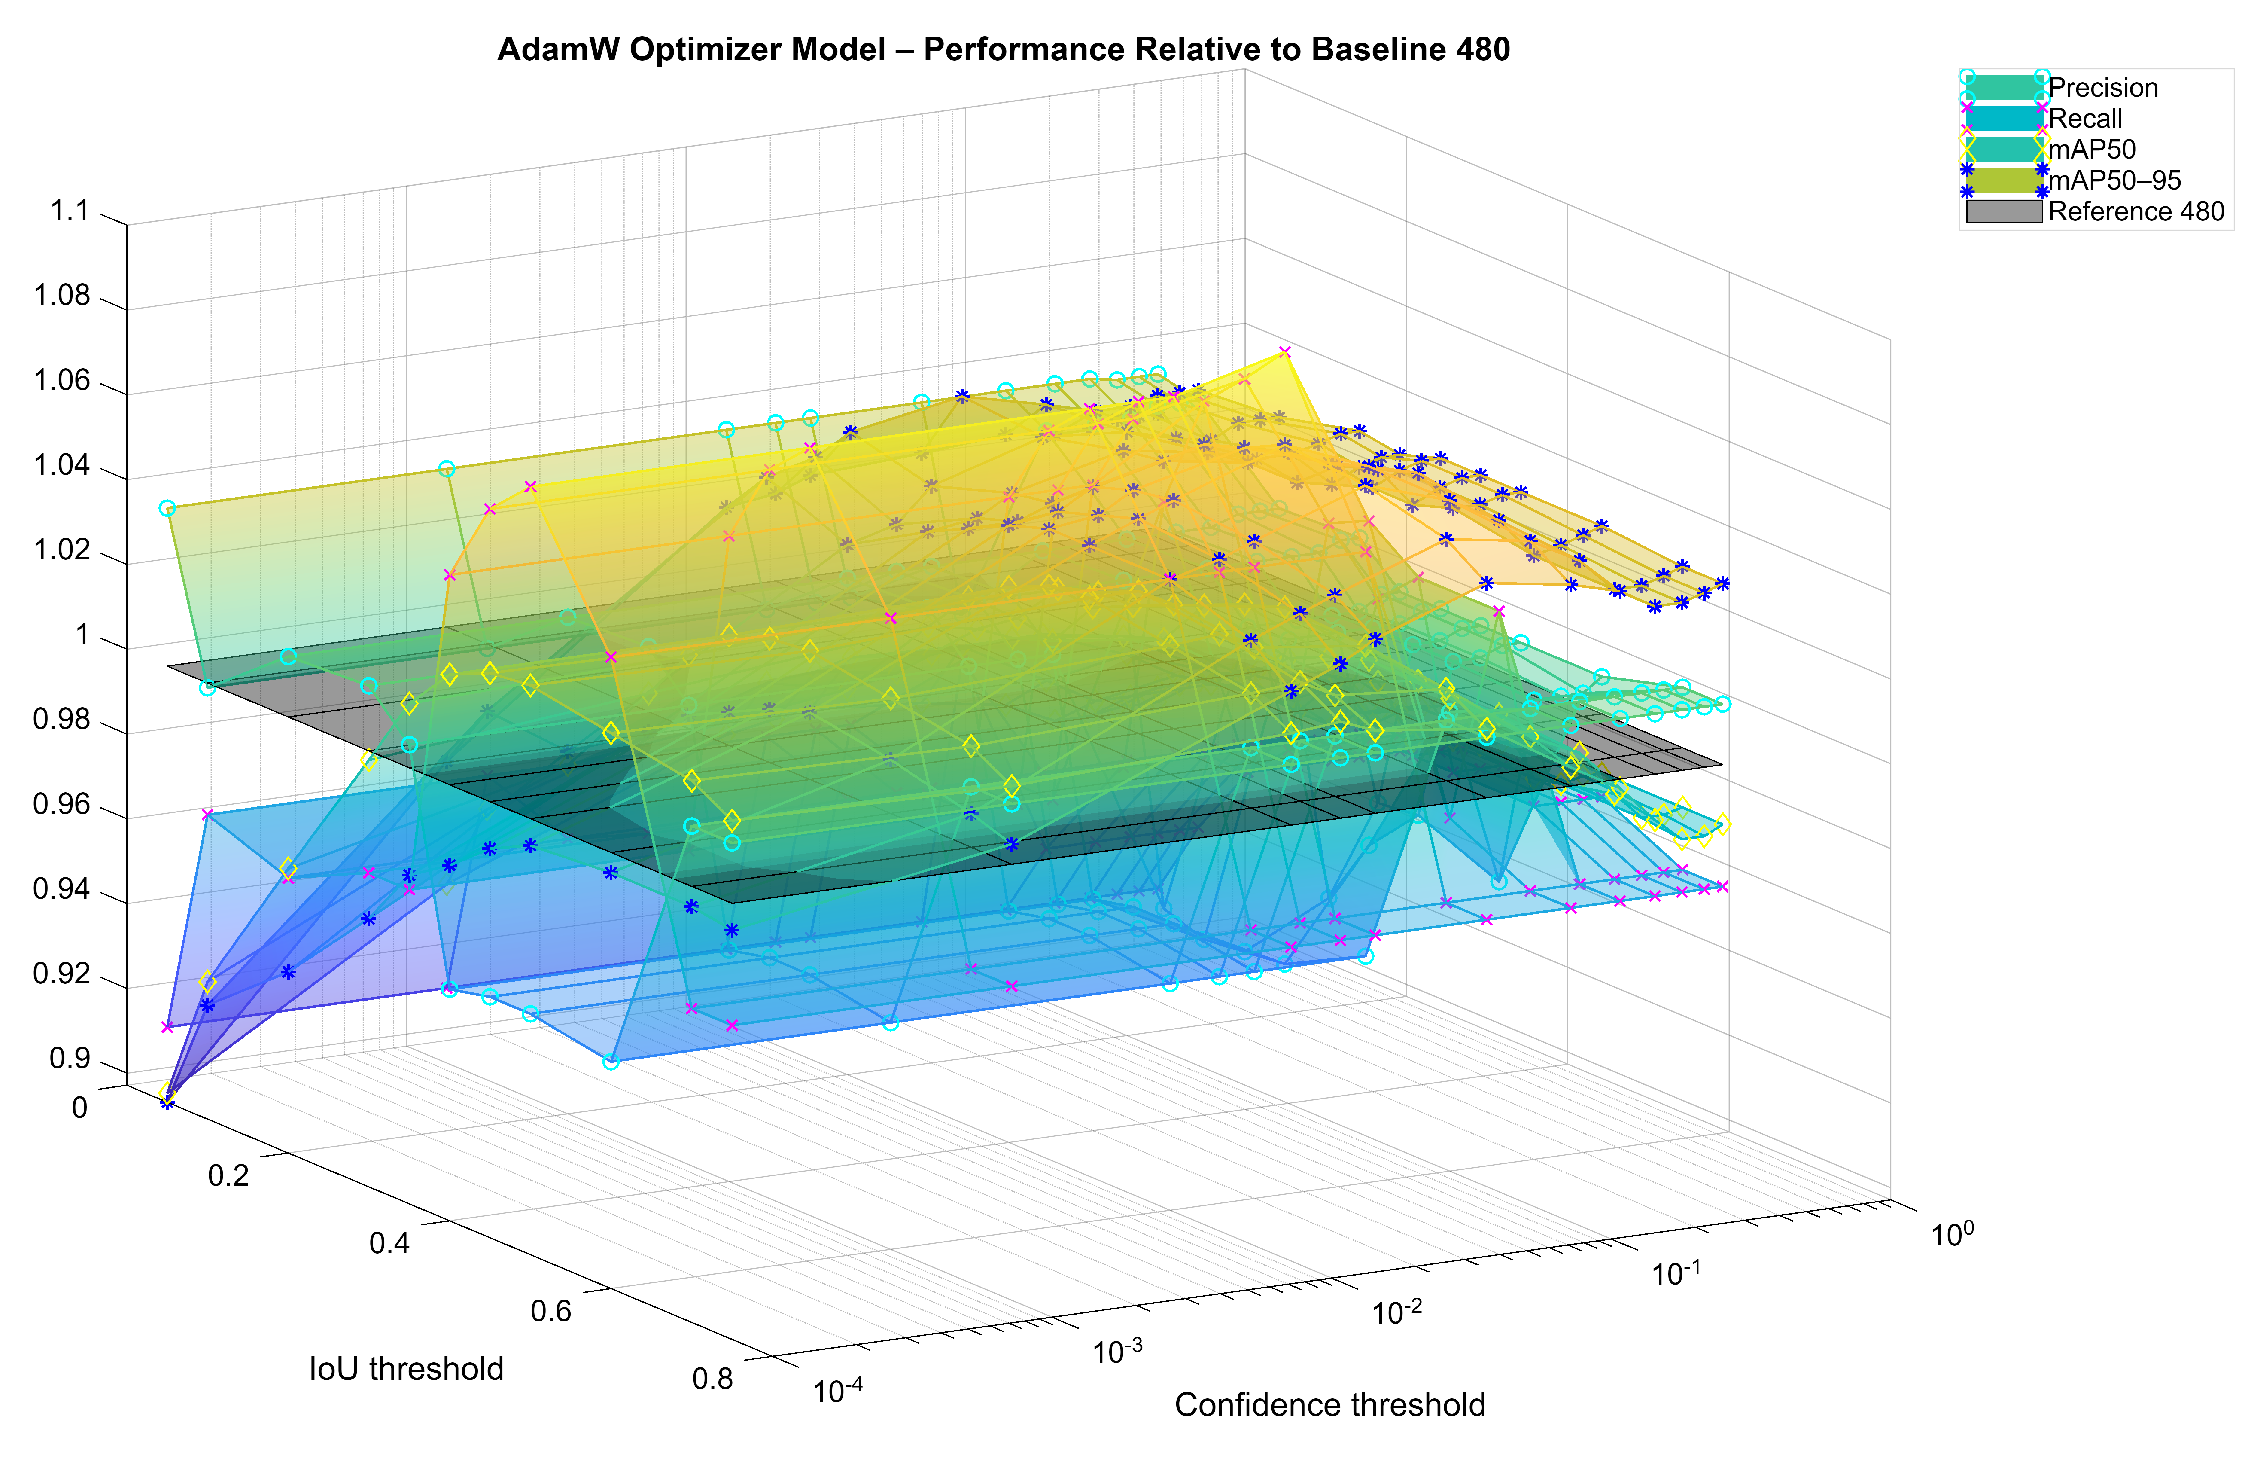
This study systematically investigated the effect of input resolution scaling on brain tumor detection performance using an optimized YOLO-based framework. Although reducing the input resolution from 640 × 640 to 480 × 480 initially led to performance degradation, the proposed progressive optimization strategy successfully compensated for the loss of spatial detail through coordinated depth–width scaling, regularization, and optimizer refinement. The normalized performance surfaces of the final AdamW-optimized model, shown in Figure A1, illustrate the relative improvement with respect to the 480 × 480 baseline, where values above 1 indicate performance gains over the reduced-resolution reference.
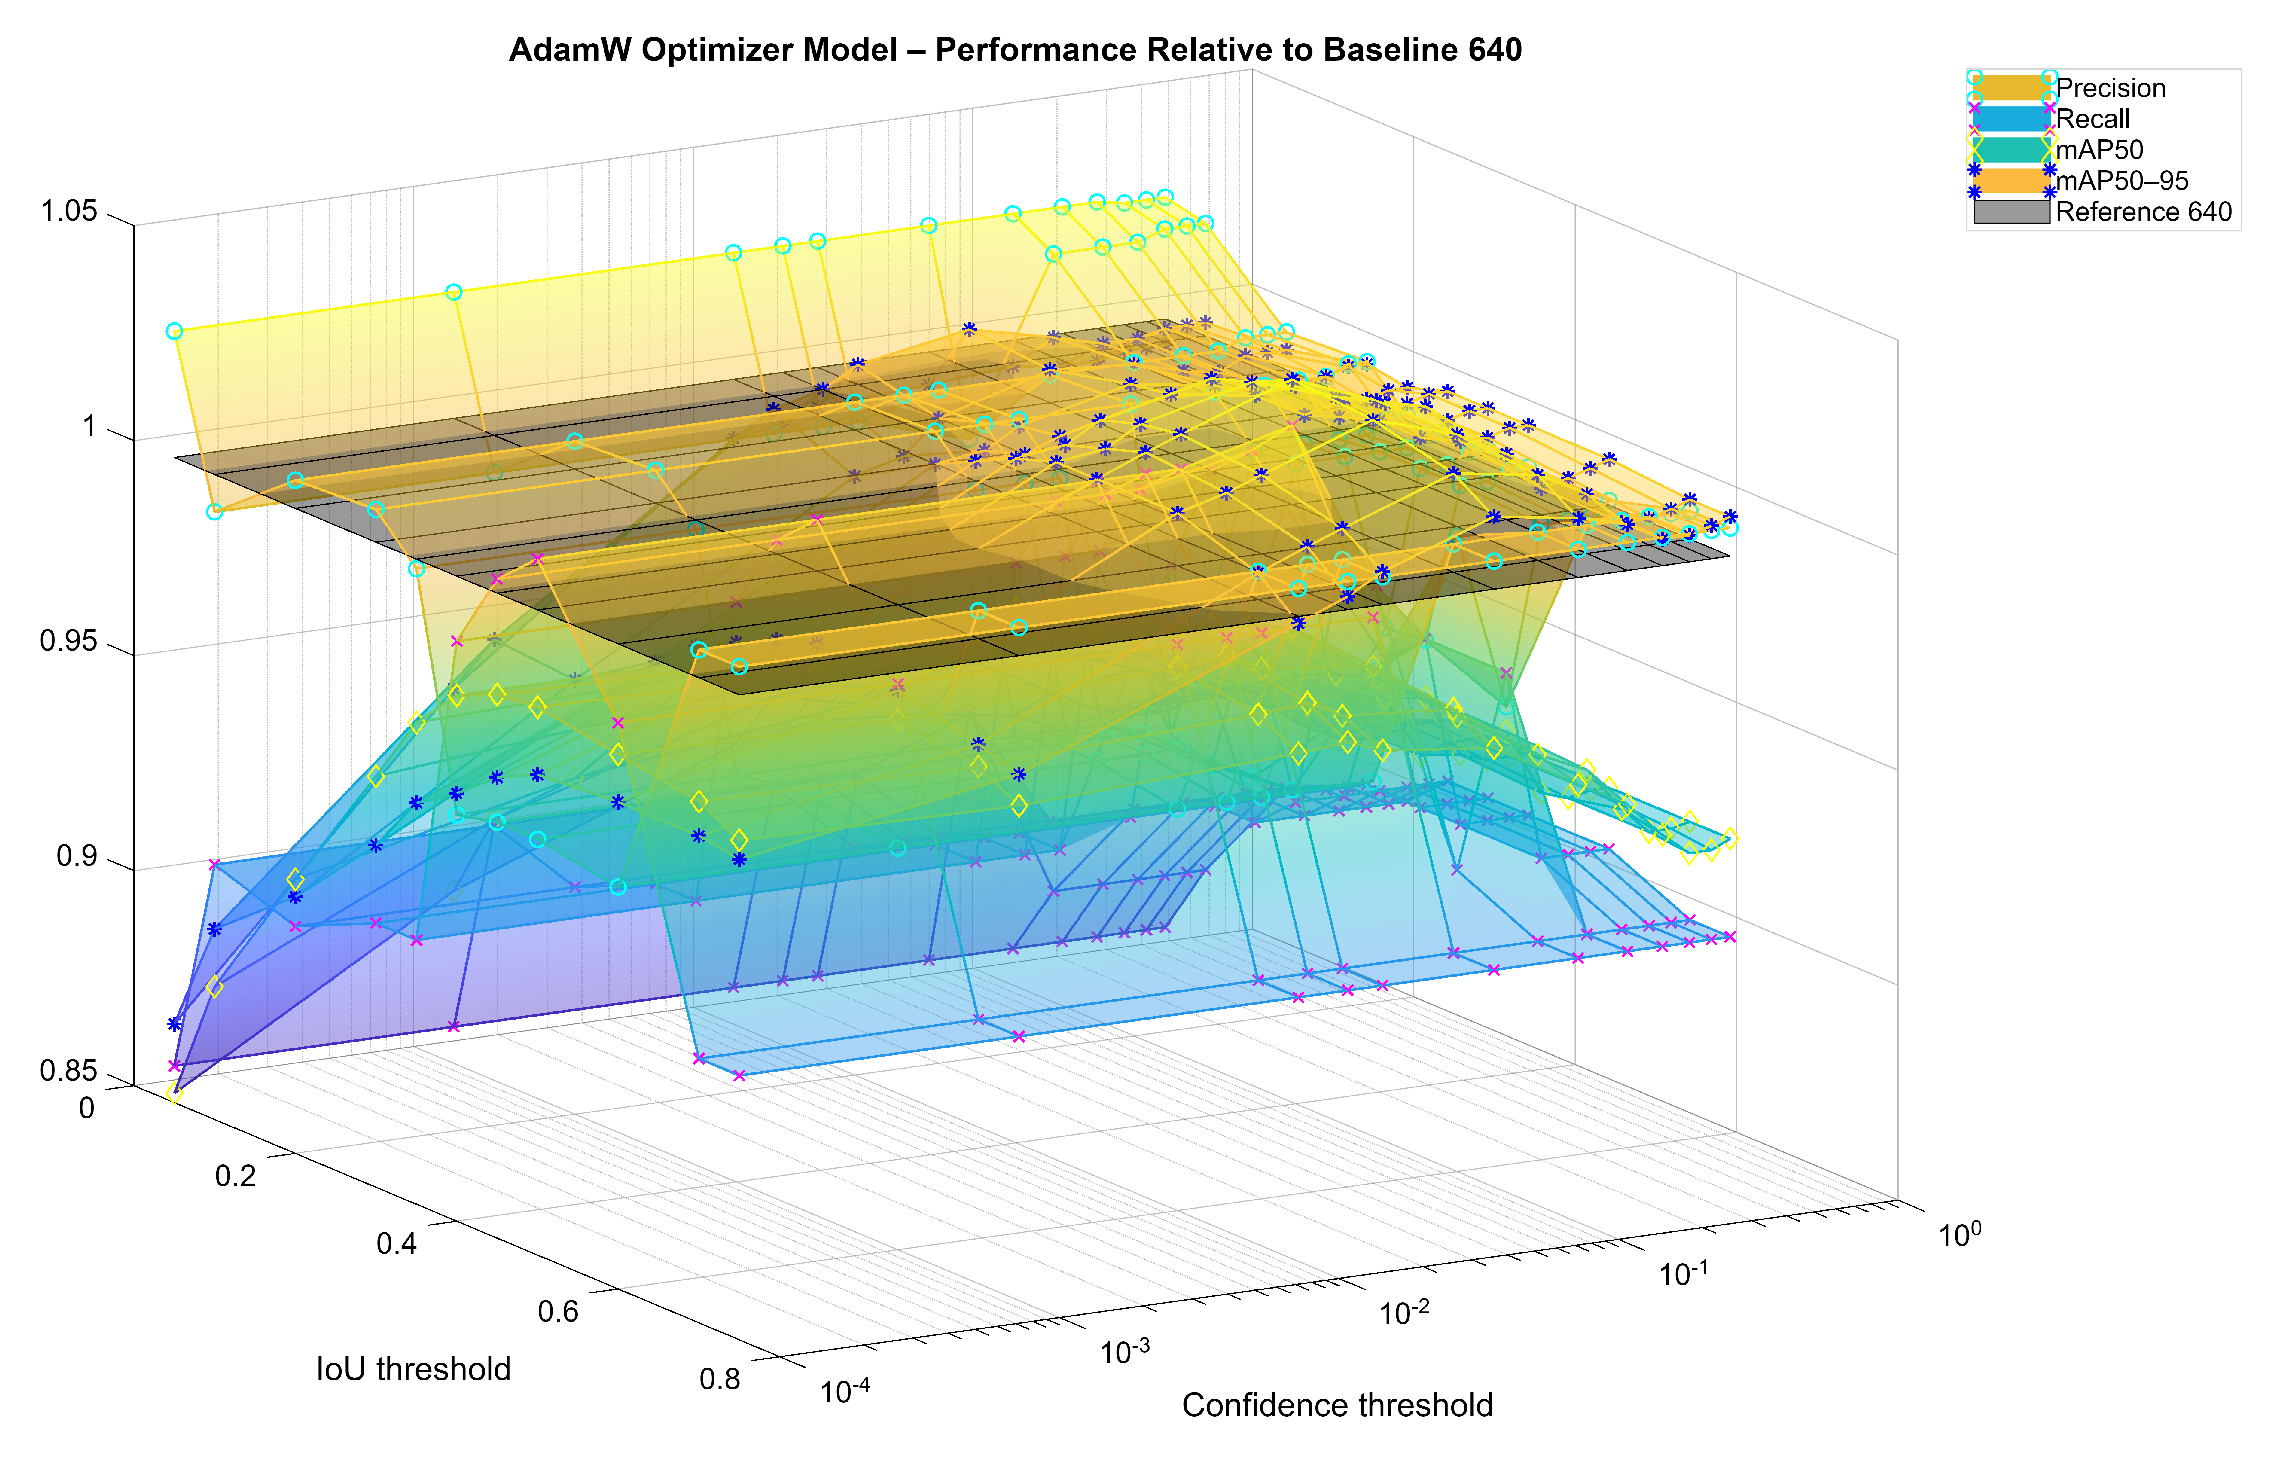
The final configuration achieved a recall of 0.943, surpassing the original high-resolution baseline (0.926) and several recent state-of-the-art detectors. Moreover, the model attained an mAP50–95 of 0.672, exceeding the original baseline (0.653) and outperforming multiple competing approaches evaluated at higher resolutions. As further illustrated in Figure A2, the normalized performance surfaces relative to the original 640 × 640 baseline demonstrate that the optimized reduced-resolution model approaches or, in some cases, exceeds the high-resolution reference, with values near or above 1 indicating comparable or improved performance.
Although the dataset size used in this study is relatively limited, the experiments were conducted under controlled conditions with fixed data splits to ensure consistency. To further address this limitation and evaluate the generalization capability of the proposed model, additional cross-dataset experiments were conducted using a randomly selected subset (approximately 10% of the available test samples) from an external dataset. The model demonstrated consistent performance, achieving an mAP50–95 of 0.747 with a high recall of 0.927, indicating strong robustness beyond the primary evaluation dataset.
Furthermore, evaluation on another independent dataset using a custom training–validation split (75–25%) yielded stable performance, with recall reaching 0.901, confirming the model’s ability to maintain detection sensitivity across varying data distributions.
Importantly, these results were obtained under reduced-resolution conditions, demonstrating that effective architectural and training-level tuning can preserve and even enhance localization robustness without increasing input size.
While the proposed model demonstrates strong generalization across multiple brain tumor datasets, the evaluation remains within the same application domain. Nevertheless, the underlying optimization strategy is not task-specific and may be applicable to other medical object detection tasks, particularly those involving small or heterogeneous targets. However, further validation on diverse medical datasets is required to fully establish generalizability.
Overall, the proposed framework highlights that sensitivity-oriented and localization-consistent brain tumor detection can be achieved efficiently at lower resolution. This finding suggests that performance improvements in medical object detection do not necessarily require larger input sizes but, rather, principled optimization of model capacity and training dynamics.


Author Contributions

Conceptualization, F.L., S.N. and A.A.-A.; methodology, A.A.-A.; software, A.A.-A.; validation, A.A.-A. and S.N.; formal analysis, F.L., S.N. and A.A.-A.; investigation, A.A.-A.; writing—original draft preparation, A.A.-A.; writing—review and editing, A.A.-A., S.N. and F.L.; visualization, A.A.-A. and S.N.; supervision, F.L. and S.N.; project administration, S.N. All authors have read and agreed to the published version of the manuscript.

Funding

This research received no external funding.

Institutional Review Board Statement

Not applicable.

Informed Consent Statement

Not applicable.

Data Availability Statement

Data available in a publicly accessible repository: The original data presented in the study are openly available in Br35H at DOI: https://www.kaggle.com/datasets/ahmedhamada0/brain-tumor-detection (accessed on 22 April 2026).

Conflicts of Interest

The authors declare no conflicts of interest.

Appendix A. Supplementary Threshold-Normalized Performance Visualizations

Figure A1. Normalized performance surfaces of the final AdamW-optimized model relative to the 480 × 480 baseline. Values above 1 indicate improvement over the reduced-resolution baseline.
Applsci 16 04320 g0a1
Figure A2. Normalized performance surfaces of the final AdamW-optimized model relative to the original 640 × 640 baseline. Values near or above 1 indicate that the optimized reduced-resolution model approaches or exceeds the high-resolution reference.
Applsci 16 04320 g0a2

References

  1. Khalighi, S.; Reddy, K.; Midya, A.; Pandav, K.B.; Madabhushi, A.; Abedalthagafi, M. Artificial intelligence in neuro-oncology: Advances and challenges in brain tumor diagnosis, prognosis, and precision treatment. npj Precis. Oncol. 2024, 8, 80. [Google Scholar] [CrossRef] [PubMed]
  2. Dorfner, F.J.; Patel, J.B.; Kalpathy-Cramer, J.; Gerstner, E.R.; Bridge, C.P. A review of deep learning for brain tumor analysis in MRI. npj Precis. Oncol. 2025, 9, 2. [Google Scholar] [CrossRef]
  3. Aamir, M.; Rahman, Z.; Bhatti, U.A.; Abro, W.A.; Bhutto, J.A.; He, Z. An automated deep learning framework for brain tumor classification using MRI imagery. Sci. Rep. 2025, 15, 17593. [Google Scholar] [CrossRef]
  4. Sapkota, R.; Flores-Calero, M.; Qureshi, R.; Badgujar, C.; Nepal, U.; Poulose, A.; Zeno, P.; Vaddevolu, U.B.P.; Khan, S.; Shoman, M.; et al. YOLO advances to its genesis: A decadal and comprehensive review of the You Only Look Once (YOLO) series. Artif. Intell. Rev. 2025, 58, 274. [Google Scholar] [CrossRef]
  5. Shia, W.C.; Ku, T.H. Enhancing Microcalcification Detection in Mammography with YOLO-v8 Performance and Clinical Implications. Diagnostics 2024, 14, 2875. [Google Scholar] [CrossRef]
  6. Jocher, G.; Chaurasia, A.; Qiu, J. YOLO by Ultralytics (Version 8.0.190), 2023, GitHub. Available online: https://github.com/ultralytics/ultralytics/blob/main/ultralytics/cfg/models/v8/yolov8.yaml (accessed on 22 April 2026).
  7. Lin, T.Y.; Dollár, P.; Girshick, R.; He, K.; Hariharan, B.; Belongie, S. Feature pyramid networks for object detection. In Proceedings of the IEEE Conference on Computer Vision and Pattern Recognition, Honolulu, HI, USA, 21–26 July 2017; pp. 2117–2125. [Google Scholar]
  8. Liu, S.; Qi, L.; Qin, H.; Shi, J.; Jia, J. Path aggregation network for instance segmentation. In Proceedings of the IEEE Conference on Computer Vision and Pattern Recognition, Salt Lake City, UT, USA, 18–23 June 2018; pp. 8759–8768. [Google Scholar]
  9. Zhang, H.; Wang, Y.; Dayoub, F.; Sunderhauf, N. Varifocalnet: An iou-aware dense object detector. In Proceedings of the IEEE/CVF Conference on Computer Vision and Pattern Recognition, Nashville, TN, USA, 20–25 June 2021; pp. 8514–8523. [Google Scholar]
  10. Zheng, Z.; Wang, P.; Liu, W.; Li, J.; Ye, R.; Ren, D. Distance-IoU loss: Faster and better learning for bounding box regression. In Proceedings of the AAAI Conference on Artificial Intelligence, New York, NY, USA, 7–12 February 2020; Volume 34, pp. 12993–13000. [Google Scholar]
  11. Ren, S.; Song, J.; Yu, L.; Tian, S.; Long, J. DHC-YOLO: Improved YOLOv8 for Lesion Detection in Brain Tumors, Colon Polyps, and Esophageal Cancer. Res. Sq. 2024. [Google Scholar] [CrossRef]
  12. Kang, M.; Ting, C.M.; Ting, F.F.; Phan, R.C.W. Bgf-yolo: Enhanced yolov8 with multiscale attentional feature fusion for brain tumor detection. In Proceedings of the International Conference on Medical Image Computing and Computer-Assisted Intervention; Springer: Berlin/Heidelberg, Germany, 2024; pp. 35–45. [Google Scholar]
  13. Zhu, L.; Wang, X.; Ke, Z.; Zhang, W.; Lau, R.W. Biformer: Vision transformer with bi-level routing attention. In Proceedings of the IEEE/CVF Conference on Computer Vision and Pattern Recognition, Vancouver, BC, Canada, 17–24 June 2023; pp. 10323–10333. [Google Scholar]
  14. Jiang, Y.; Tan, Z.; Wang, J.; Sun, X.; Lin, M.; Li, H. GiraffeDet: A heavy-neck paradigm for object detection. arXiv 2022, arXiv:2202.04256. [Google Scholar]
  15. Bakhtiarnia, A.; Zhang, Q.; Iosifidis, A. Efficient high-resolution deep learning: A survey. ACM Comput. Surv. 2024, 56, 1–35. [Google Scholar] [CrossRef]
  16. Umirzakova, S.; Ahmad, S.; Khan, L.U.; Whangbo, T. Medical image super-resolution for smart healthcare applications: A comprehensive survey. Inf. Fusion 2024, 103, 102075. [Google Scholar] [CrossRef]
  17. Hirahara, D.; Takaya, E.; Kadowaki, M.; Kobayashi, Y.; Ueda, T. Effect of the pixel interpolation method for downsampling medical images on deep learning accuracy. J. Comput. Commun. 2021, 9, 150–156. [Google Scholar] [CrossRef]
  18. Lakhani, P. The importance of image resolution in building deep learning models for medical imaging. Radiol. Artif. Intell. 2020, 2, e190177. [Google Scholar] [CrossRef] [PubMed]
  19. Rajaraman, S.; Yang, F.; Zamzmi, G.; Xue, Z.; Antani, S. Assessing the Impact of Image Resolution on Deep Learning for TB Lesion Segmentation on Frontal Chest X-rays. Diagnostics 2023, 13, 747. [Google Scholar] [CrossRef]
  20. Bista, R.; Timilsina, A.; Manandhar, A.; Paudel, A.; Bajracharya, A.; Wagle, S.; Ferreira, J. Advancing tuberculosis detection in chest X-rays: A YOLOv7-based approach. Information 2023, 14, 655. [Google Scholar] [CrossRef]
  21. Liu, C.; Chen, Y.; Shi, H.; Lu, J.; Jian, B.; Pan, J.; Cai, L.; Wang, J.; Zhang, Y.; Li, J.; et al. Does DINOv3 set a new medical vision standard? arXiv 2025, arXiv:2509.06467. [Google Scholar] [CrossRef]
  22. Pascual-González, M.; Jiménez-Partinen, A.; Palomo, E.J.; López-Rubio, E.; Ortega-Gómez, A. Hyperparameter optimization of YOLO models for invasive coronary angiography lesion detection and assessment. Comput. Biol. Med. 2025, 196, 110697. [Google Scholar] [CrossRef]
  23. Ranjbarzadeh, R.; Crane, M.; Bendechache, M. The impact of backbone selection in YOLOv8 models on brain tumor localization. Iran J. Comput. Sci. 2025, 8, 939–961. [Google Scholar] [CrossRef]
  24. Han, W.; Dong, X.; Wang, G.; Ding, Y.; Yang, A. Application and improvement of YOLO11 for brain tumor detection in medical images. Front. Oncol. 2025, 15, 1643208. [Google Scholar] [CrossRef] [PubMed]
  25. Byeon, H. Yolo v10-based brain tumor detection: An innovative approach in ct imaging. Nanotechnol. Percept. 2024, 20, 113–125. [Google Scholar]
  26. Bai, R.; Xu, G.; Shi, Y. SCC-YOLO: An improved object detector for assisting in Brain tumor diagnosis. In Proceedings of the 2025 International Conference on Health Big Data, Kunming, China, 28–30 March 2025; pp. 114–120. [Google Scholar]
  27. Dulal, R.; Dulal, R. Brain Tumor Identification using Improved YOLOv8. arXiv 2025, arXiv:2502.03746. [Google Scholar] [CrossRef]
  28. Amoroso, N.; Quarto, S.; La Rocca, M.; Tangaro, S.; Monaco, A.; Bellotti, R. An eXplainability Artificial Intelligence approach to brain connectivity in Alzheimer’s disease. Front. Aging Neurosci. 2023, 15, 1238065. [Google Scholar] [CrossRef]
  29. Wang, H.; Toumaj, S.; Heidari, A.; Souri, A.; Jafari, N.; Jiang, Y. Neurodegenerative disorders: A holistic study of the explainable artificial intelligence applications. Eng. Appl. Artif. Intell. 2025, 153, 110752. [Google Scholar] [CrossRef]
  30. Li, P.; Zhang, R.; Zhu, Z.; Zhang, L.; Bai, Y. Efficient Brain Tumor Detection Based on Channel Shuffling. Res. Sq. 2024. [Google Scholar]
  31. Chen, A.; Lin, D.; Gao, Q. Enhancing brain tumor detection in MRI images using YOLO-NeuroBoost model. Front. Neurol. 2024, 15, 1445882. [Google Scholar] [CrossRef]
  32. Chen, J.; Yang, T.; Xie, L.; Yang, L.; Zhao, H. Application of algorithms based on improved YOLO in MRI image detection of brain tumors. Front. Neurol. 2025, 16, 1646476. [Google Scholar] [CrossRef]
  33. Singh, A.; Van de Ven, P.; Eising, C.; Denny, P. Compact & capable: Harnessing graph neural networks and edge convolution for medical image classification. arXiv 2023, arXiv:2307.12790. [Google Scholar] [CrossRef]
  34. Guo, Y.; Ma, Z.; Li, X.; Dong, Y. TLRM: Task-level relation module for GNN-based few-shot learning. In Proceedings of the 2021 International Conference on Visual Communications and Image Processing (VCIP), Munich, Germany, 5–8 December 2021; pp. 1–5. [Google Scholar]
  35. Ishtaiwi, A.; Ali, A.M.; Al-Qerem, A.; Alsmadi, Y.; Aldweesh, A.; Alauthman, M.; Alzubi, O.; Nashwan, S.; Ramadan, A.; Al-Zghoul, M.; et al. Impact of Data-Augmentation on Brain Tumor Detection Using Different YOLO Versions Models. Int. Arab J. Inf. Technol. 2024, 21, 466–482. [Google Scholar] [CrossRef]
  36. Azad, P.; Heidari, A.; Akcora, C.G.; Khonsari, A.; Rastegar, S.H. A unified graph neural network-based approach for few-shot learning with task nodes and DiffPool abstraction. Neurocomputing 2026, 676, 133003. [Google Scholar] [CrossRef]
  37. Hamada, A. Br35H: Brain Tumor Detection Dataset. 2020. Available online: https://www.kaggle.com/datasets/ahmedhamada0/brain-tumor-detection (accessed on 20 November 2025).
  38. King, R. Brief Summary of YOLOv8 Model Structure; GitHub: San Francisco, CA, USA, 2023. [Google Scholar]
  39. Patel, S.; Kadam, Y.; Thombare, A.; Salvi, K.; Jadhav, D. A review of brain tumor detection techniques using YOLOv8. Int. J. Res. Appl. Sci. Eng. Technol. 2024, 12, 1075–1078. [Google Scholar] [CrossRef]
  40. Zhou, P.; Xie, X.; Lin, Z.; Yan, S. Towards understanding convergence and generalization of AdamW. IEEE Trans. Pattern Anal. Mach. Intell. 2024, 46, 6486–6493. [Google Scholar] [CrossRef]
  41. Iiduka, H. Appropriate learning rates of adaptive learning rate optimization algorithms for training deep neural networks. IEEE Trans. Cybern. 2021, 52, 13250–13261. [Google Scholar] [CrossRef]
  42. Wenkel, S.; Alhazmi, K.; Liiv, T.; Alrshoud, S.; Simon, M. Confidence score: The forgotten dimension of object detection performance evaluation. Sensors 2021, 21, 4350. [Google Scholar] [CrossRef] [PubMed]
  43. Sorour, A. MRI for Brain Tumor with Bounding Boxes. 2024. Available online: https://www.kaggle.com/datasets/ahmedsorour1/mri-for-brain-tumor-with-bounding-boxes (accessed on 4 April 2026).
  44. Roberts, D. Brain Tumor Object Detection Datasets. 2021. Available online: https://www.kaggle.com/datasets/davidbroberts/brain-tumor-object-detection-datasets/data (accessed on 4 April 2026).
  45. Obi, G.; Saito, A.; Sasaki, Y.; Kato, T. Linearly Convergent Mixup Learning. arXiv 2025, arXiv:2501.07794. [Google Scholar] [CrossRef]
  46. Antczak, K. On regularization properties of artificial datasets for deep learning. arXiv 2019, arXiv:1908.07005. [Google Scholar] [CrossRef]
  47. Wang, C.Y.; Yeh, I.H.; Mark Liao, H.Y. Yolov9: Learning what you want to learn using programmable gradient information. In Proceedings of the European Conference on Computer Vision; Springer: Berlin/Heidelberg, Germany, 2024; pp. 1–21. [Google Scholar]
  48. Wang, A.; Chen, H.; Liu, L.; Chen, K.; Lin, Z.; Han, J.; Ding, G. Yolov10: Real-time end-to-end object detection. Adv. Neural Inf. Process. Syst. 2024, 37, 107984–108011. [Google Scholar]
  49. Deng, K.; Wen, Q.; Yang, F.; Ouyang, H.; Shi, Z.; Shuai, S.; Wu, Z. OS-DETR: End-to-end brain tumor detection framework based on orthogonal channel shuffle networks. PLoS ONE 2025, 20, e0320757. [Google Scholar] [CrossRef]
  50. Kang, M.; Ting, C.M.; Ting, F.F.; Phan, R.C.W. RCS-YOLO: A fast and high-accuracy object detector for brain tumor detection. In Proceedings of the International Conference on Medical Image Computing and Computer-Assisted Intervention; Springer: Berlin/Heidelberg, Germany, 2023; pp. 600–610. [Google Scholar]
  51. Sun, L.; Zheng, L.; Xiao, Z.; Xin, Y.; Jiang, L. STAR-YOLO: A High-Accuracy and Ultra-Lightweight Method for Brain Tumor Detection. IEEE Access 2025, 13, 109914–109930. [Google Scholar] [CrossRef]
  52. Kang, M.; Ting, F.F.; Phan, R.C.W.; Ting, C.M. PK-YOLO: Pretrained knowledge guided YOLO for brain tumor detection in multiplanar MRI slices. In Proceedings of the 2025 IEEE/CVF Winter Conference on Applications of Computer Vision (WACV), Tucson, AZ, USA, 26 February–6 March 2025; pp. 3732–3741. [Google Scholar]
  53. Chhimpa, G.R.; Awasthi, S.; Bhati, N.; Yadav, P.; Wani, N.A. A transfer learning-driven fine-tuning of YOLOv10 for improved brain tumor detection in MRI images. Sci. Rep. 2025, 16, 98. [Google Scholar] [CrossRef]
Figure 1. Brain MRI image samples from dataset [37] with bounding box annotations indicating tumor locations. The red boxes highlight tumor regions of varying sizes and shapes.
Applsci 16 04320 g001
Figure 2. Overview of the BGF-YOLO architecture according to [12] the configuration used in this study emphasized in red background. The input resolution was reduced to 480 × 480, while the network capacity was scaled using depth = 1.1 and width = 1.4. Accordingly, the detection heads operate at 120 × 120, 60 × 60, 30 × 30, and 15 × 15 feature mAP scales (strides 4–32), preserving the original multi-scale detection design under reduced resolution.
Applsci 16 04320 g002
Figure 3. Detection performance surfaces for the depth-scaled model at 480 × 480 resolution. The four subplots show precision, recall, mAP50, and mAP50–95 as functions of the confidence threshold and IoU threshold. The semi-transparent reference planes indicate the baseline performances at 480 × 480 and 640 × 640, enabling direct visual comparison across the threshold space.
Applsci 16 04320 g003
Figure 4. Detection performance surfaces for the width-scaled model at 480 × 480 resolution. The metric surfaces indicate that width expansion improves recall and mAP-related measures over a broader threshold region than depth-only scaling, while precision remains moderately reduced compared to the most selective configurations.
Applsci 16 04320 g004
Figure 5. Detection performance surfaces for the balanced depth–width model at 480 × 480 resolution. The joint behavior of precision, recall, mAP50, and mAP50–95 indicates that coordinated depth and width scaling yields a more balanced and stable detector than isolated architectural scaling.
Applsci 16 04320 g005
Figure 6. Detection performance surfaces after incorporating MixUp augmentation and dropout regularization into the balanced model. The figure highlights improved localization robustness, particularly in terms of mAP50–95, while maintaining strong recall across a broad threshold region.
Applsci 16 04320 g006
Figure 7. Detection performance surfaces for the final AdamW-optimized model at 480 × 480 resolution. The plots show precision, recall, mAP50, and mAP50–95 over the investigated confidence and IoU thresholds. The final model achieves the most favorable trade-off between sensitivity and localization robustness among the tested configurations.
Applsci 16 04320 g007
Figure 8. Representative qualitative detection results on brain MRI images between Ground-truth (A) and the prediction model (B).
Applsci 16 04320 g008
Figure 9. Training performance curves showing the evolution of precision, recall, mAP50, and mAP50–95 across training epochs. The solid blue lines represent the recorded metric values, while the dotted orange lines indicate the smoothed trends. The results demonstrate stable convergence and progressive performance improvement throughout the training process.
Applsci 16 04320 g009
Table 1. The effect of the resolution reduction on the performance of the method. Performance comparison of the BGF-YOLO model at two input resolutions (640 × 640 and 480 × 480).
Image SizePrecisionRecallmAP50mAP50–95ConfIoUDepthWidth
6400.9190.9260.9740.6530.0010.511.25
4800.9120.8690.9230.6320.0010.511.25
Table 2. The effect of increasing the depth scaling ( 1.0 1.2 ) on the performance under 480 × 480 resolution, for representative IoU and conf values from the parameter sweep.
Depth ScalingPrecisionRecallmAP50mAP50–95ConfIoU
1.20.9490.8030.9060.6190.0010.50
1.20.9610.8030.8920.6390.200.45
1.20.9580.8030.9110.6190.0010.45
Table 3. The effect of increasing the width scaling ( 1.25 1.3 ) on the performance under 480 × 480 resolution, for representative IoU and conf values from the parameter sweep with depth fixed at 1.2 .
Depth ScalingWidth ScalingPrecisionRecallmAP50mAP50–95ConfIoU
1.21.30.8940.8520.9060.6250.0010.50
1.21.30.8970.8610.9090.6640.150.60
1.21.30.9370.7300.8520.6430.350.05
1.21.30.8960.8610.9130.6630.100.60
Table 4. Balanced scaling (depth = 1.1, width = 1.4).
Depth ScalingWidth ScalingPrecisionRecallmAP50mAP50–95ConfIoU
1.11.40.9080.8770.9330.6410.0010.50
1.11.40.9080.8770.9350.6220.00010.50
1.11.40.9250.8110.8880.6490.200.20
Table 5. Performance after incorporating MixUp and Dropout.
PrecisionRecallmAP50mAP50–95ConfIoU
0.9310.8800.9460.6620.0010.50
0.9430.8110.8960.6780.350.05
0.8880.9100.9390.6920.100.40
0.9310.8800.9540.6900.0150.50
Table 6. Performance metrics obtained using the AdamW optimizer with a learning rate of lr 0 = 0.001 at an input resolution of 480 × 480 , demonstrating higher precision values but reduced recall and mAP50–95 compared to lower learning rate settings.
PrecisionRecallmAP50mAP50–95ConfIoU
0.9550.8360.9490.6400.0010.50
0.9780.7790.8970.6600.100.05
0.9150.8810.9630.6630.020.60
0.9150.8810.9510.6820.150.60
0.9150.8810.9460.6620.0150.60
Table 7. Performance metrics obtained using the AdamW optimizer with a learning rate of lr 0 = 0.0001 at 480 × 480 resolution, showing improved recall and balanced mAP50–95 performance, indicating enhanced sensitivity and localization capability.
PrecisionRecallmAP50mAP50–95ConfIoU
0.8700.9370.9510.6420.0010.50
0.9460.7950.8940.6470.020.05
0.9460.7950.8890.6490.100.05
0.8700.9370.9540.6610.010.50
0.8580.9430.9460.6720.050.50
0.8700.9370.9540.6640.0150.50
Table 8. Progressive performance improvements throughout the proposed detection pipeline.
Stage (480 × 480 Unless Stated)PrecisionRecallmAP50mAP50–95ConfIoU
Original baseline0.9190.9260.9740.6530.0010.50
(640 × 640)
Reduced baseline0.9120.8690.9230.6320.0010.50
(480 × 480)
Best depth-scaling0.9610.8030.8920.6390.200.45
Best width-scaling0.8970.8610.9090.6640.150.60
Best balanced scaling0.9080.8770.9330.6410.0010.50
Best regularisation0.8880.9100.9390.6920.100.40
(MixUp + Dropout)
Best AdamW0.8580.9430.9460.6720.050.50
Table 9. Comparative performance evaluation of the proposed method against state-of-the-art approaches on the Br35H dataset [37]. Performance metrics include precision, recall, mAP50, and mAP50–95 under different input resolutions.
MethodYearDatasetInput SizePrecisionRecallmAP50mAP50–95
YOLOv8x [6]2023Br35H 640 × 640 0.9070.8810.9270.646
YOLOv9e [47]2024Br35H 640 × 640 0.9270.8690.9190.630
YOLOv10x [48]2024Br35H 640 × 640 0.9160.8080.8800.603
OS-DETR [49]2025Br35H 640 × 640 0.9500.9420.9570.742
RCS-YOLO [50]2023Br35H 640 × 640 0.9080.8850.8780.580
STAR-YOLO [51]2025Br35H 640 × 640 0.9370.8520.642
PK-YOLO [52]2025Br35H 640 × 640 0.8580.8960.9470.681
YOLOv10 TL [53]2025Br35H 640 × 640 0.9680.9270.9610.739
Your original baseline [12]2024Br35H 640 × 640 0.9190.9260.9740.653
Proposed method (Ours)2026Br35H 480 × 480 0.8580.9430.9460.672
Disclaimer/Publisher’s Note: The statements, opinions and data contained in all publications are solely those of the individual author(s) and contributor(s) and not of MDPI and/or the editor(s). MDPI and/or the editor(s) disclaim responsibility for any injury to people or property resulting from any ideas, methods, instructions or products referred to in the content.