


Abstract
Carbon emissions (CEs) are a primary driver of global climate change, particularly pronounced in China’s Yangtze River Delta (YRD) region, where rapid economic development and urbanization have led to a substantial increase in CEs. At fine spatial scales (e.g., county level) or in regions with limited statistical data, traditional methods for CE accounting are constrained by data gaps and inconsistencies, which hinders the accurate characterization of regional disparities. Therefore, this study proposes a CE spatial downscaling method based on nighttime light (NTL) data. By integrating remote sensing data with the IPCC emission inventory model, energy consumption-related carbon emissions (ECCEs) across the YRD region from 2000 to 2020 were quantified. Through global spatial autocorrelation analysis and standard deviation ellipse (SDE) analysis, the spatial distribution characteristics and temporal variation trends of ECCEs were revealed. Results indicate that total CEs increased significantly over the study period. CE hotspots were concentrated in the Hangzhou Bay area and the Shanghai–Nanjing corridor, while coldspots were identified in southwestern Anhui and Zhejiang. From 2010, the CE centroid shifted toward the southwest or northwest, and the regional CE distribution evolved from a point pattern to a band-shaped pattern. These findings offer a novel approach for CE monitoring and can provide scientific support for low-carbon development policies and precise emission reduction strategies in data-scarce regions of developing countries.
1. Introduction
Human activities, especially CEs from fossil fuel use and large-scale energy consumption, are the most serious contributors to global climate change, further posing a great challenge to the natural environment, ecosystems, and the sustainability of human society [1,2,3,4]. CEs have become a major global issue that requires immediate attention from countries worldwide [5,6]. On cutting carbon dioxide (CO2) emissions and developing a low-carbon economy, the worldwide community has come to an agreement [7,8,9]. Particularly, the Paris Agreement in 2015, by setting greenhouse gas reduction targets, has promoted actions to address global climate change. The latest IPCC report emphasizes the need for the world to accelerate the transition to a low-carbon energy system, with the aim of achieving net-zero emissions by 2050 to limit global warming to below 2 °C [10,11].
In 2010, China surpassed the United States as the world’s largest CO2 emitter, accounting for 24.5% of global CO2 emissions [12,13]. Meanwhile, China is confronted with the dual challenges of meeting economic development demands while reducing CO2 emissions [14]. To tackle this challenge, China has assumed independent responsibilities and introduced the “dual carbon” goals on 22 September 2020, aiming to reach carbon peaking by 2030 and achieve carbon neutrality by 2060 [15].
As one of the frontier areas in China’s economic development, the YRD region has seen the rapid advancement of urbanization and economic growth intensify the increase in CEs, thereby escalating the contradiction between air quality and economic development. With the proposal of the “dual carbon” goals and the “Yangtze River Delta Integration Development Plan” [16], the growth rate of CEs in the YRD region has shown a fluctuating downward trend. However, as the fundamental unit of both the grassroots economy and CEs, county-level administrative regions have seen growing importance in energy consumption-related research [17]. Hence, conducting a quantitative analysis on the spatiotemporal patterns of CEs in the YRD region, at the county level, is of great significance for formulating precise emission reduction targets and effective policies.
Regarding CE accounting methodologies, the method for compiling greenhouse gas emission inventories proposed by the Intergovernmental Panel on Climate Change (IPCC) [18] is internationally recognized and widely used for national CE accounting. From an industrial perspective, existing studies have focused on CE research in key sectors, including the construction [19,20] and transportation industries [21,22]. In terms of influencing factor analysis, existing studies primarily use econometric methods, such as the generalized method of moments (GMM) [23], the LMDI method [24], and regression models [25], to explore the impact mechanisms of factors including GDP [26,27], population aging [28], the urbanization process [29], technological innovation [30], and energy transition [31] on CEs. However, all these methods struggle to fully reveal the spatial characteristics of CEs, limiting the effective monitoring of regional development balance.
With the continuous advancement of satellite remote sensing technology, increasingly abundant datasets and products for CE analysis have been widely applied. Although such datasets have demonstrated significant value in global-scale and national-scale studies [32], they generally have limitations in regional analyses. For instance, EDGAR provides global emission data at a 0.1° × 0.1° (~10 km) resolution; however, its accuracy at the provincial level is constrained. ODIAC offers a finer resolution (~1 km) but relies heavily on power plant databases that are frequently incomplete in developing or data-scarce regions. These limitations restrict the application of these datasets in small-scale regional studies requiring continuous time series [33,34]. Compared with EDGAR and ODIAC, integrating corrected NTL data with energy statistics offers several distinct advantages, including an effective spatial resolution (~1 km), bottom-up calibration that mitigates spatial allocation errors, and consistent long-term temporal coverage (2000–2020) capable of dynamically capturing evolving emission patterns across rapidly urbanizing regions.
High-resolution data on the spatial distribution of CEs are essential for formulating effective clean energy policies. Although county-level ECCE inventories can identify high-emission units, they suffer from severe data limitations—incomplete energy balance table (EBT) coverage, significant collection errors, low transparency, and questionable reliability—which prevent accurate detection of emission hotspots and coldspots. Addressing this critical data gap is urgently needed. NTL remote sensing data have long served as a powerful tool to overcome these statistical shortcomings.
NTL data effectively characterize the intensity of human activities through the total digital number (TDN) [35,36] and have been widely demonstrated to be a reliable indicator for estimating socioeconomic levels and energy consumption [37,38]. Compared with traditional statistical methods, which have drawbacks such as data gaps and delayed updates, NTL data can provide continuous spatial information, which significantly enhances the capability of CE inversion [39]. Currently, the mainstream DMSP-OLS NTL and NPP-VIIRS NTL datasets each have their own limitations: DMSP-OLS data suffers from light spillover and pixel oversaturation [40]; although NPP-VIIRS data offers higher spatial resolution and is not affected by pixel oversaturation, its time series is relatively short (starting from 2012) [41]. To construct long-term time-series data, researchers usually attempt to integrate these two NTL data sources [42]. However, traditional integration methods tend to cause result deviations due to the inherent errors in DMSP-OLS data [43]. To address these issues, in recent years, cross-sensor calibration methods, especially the NTL dataset generated using the nighttime light convolutional long short-term memory network (NTLSTM) and the maximum selection of the difference enlarged by smoothed time series (MODEST), have effectively resolved problems related to data consistency and precision, making them a key data source for quantifying the spatial details of CEs within cities [44]. Despite these advancements, challenges remain in CE research at the county-level unit scale.
Against this backdrop, county-level statistical data are indispensable for accurately characterizing CO2 emission patterns within individual administrative units and formulating targeted emission reduction policies. However, China’s current monitoring system severely lacks detailed energy consumption data required for accurate ECCE estimation. In this study, we developed a grid-scale ECCE estimation method by integrating county-level energy statistics with NTL data, analyzed the spatiotemporal dynamics of ECCEs in the YRD region, and provided a scientific foundation for effective county-level carbon emission control and reduction.
The primary contributions of this study are as follows: (1) overcoming the constraints of administrative boundaries by employing corrected and reconstructed NTL data to develop a high-resolution, grid-scale ECCE estimation model; (2) proposing and comparing two distinct simulation approaches to accurately characterize the spatiotemporal dynamics of ECCEs in the YRD region from 2000 to 2020; (3) quantifying the spatial agglomeration and trajectory of ECCE centers of gravity to reveal the dynamic evolution and migration patterns of emission clusters in the YRD region; (4) proposing spatially differentiated, targeted emission reduction strategies for high-emission regions based on identified spatial heterogeneity and evolutionary patterns, thereby providing scientific support for achieving China’s “dual carbon” goals and sustainable regional development. This study presents a novel grid-scale estimation framework that effectively overcomes the scarcity and incompleteness of subnational energy statistics, enabling robust capture of ECCE spatiotemporal heterogeneity. These findings provide a scientific foundation for regionally differentiated emission reduction policies while offering actionable insights for ecological conservation and sustainable urban–regional development. This approach is also applicable to other developing nations and provides fresh insights into the low-carbon shift and sustainable advancement of metropolitan areas and wider communities.
2. Materials and Methods
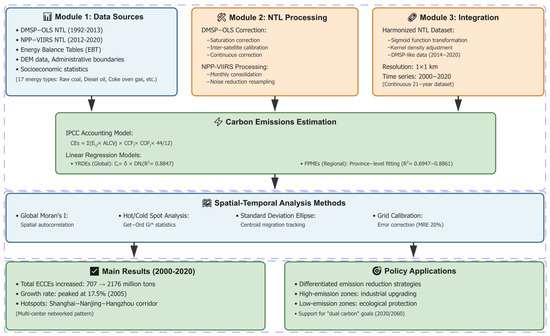
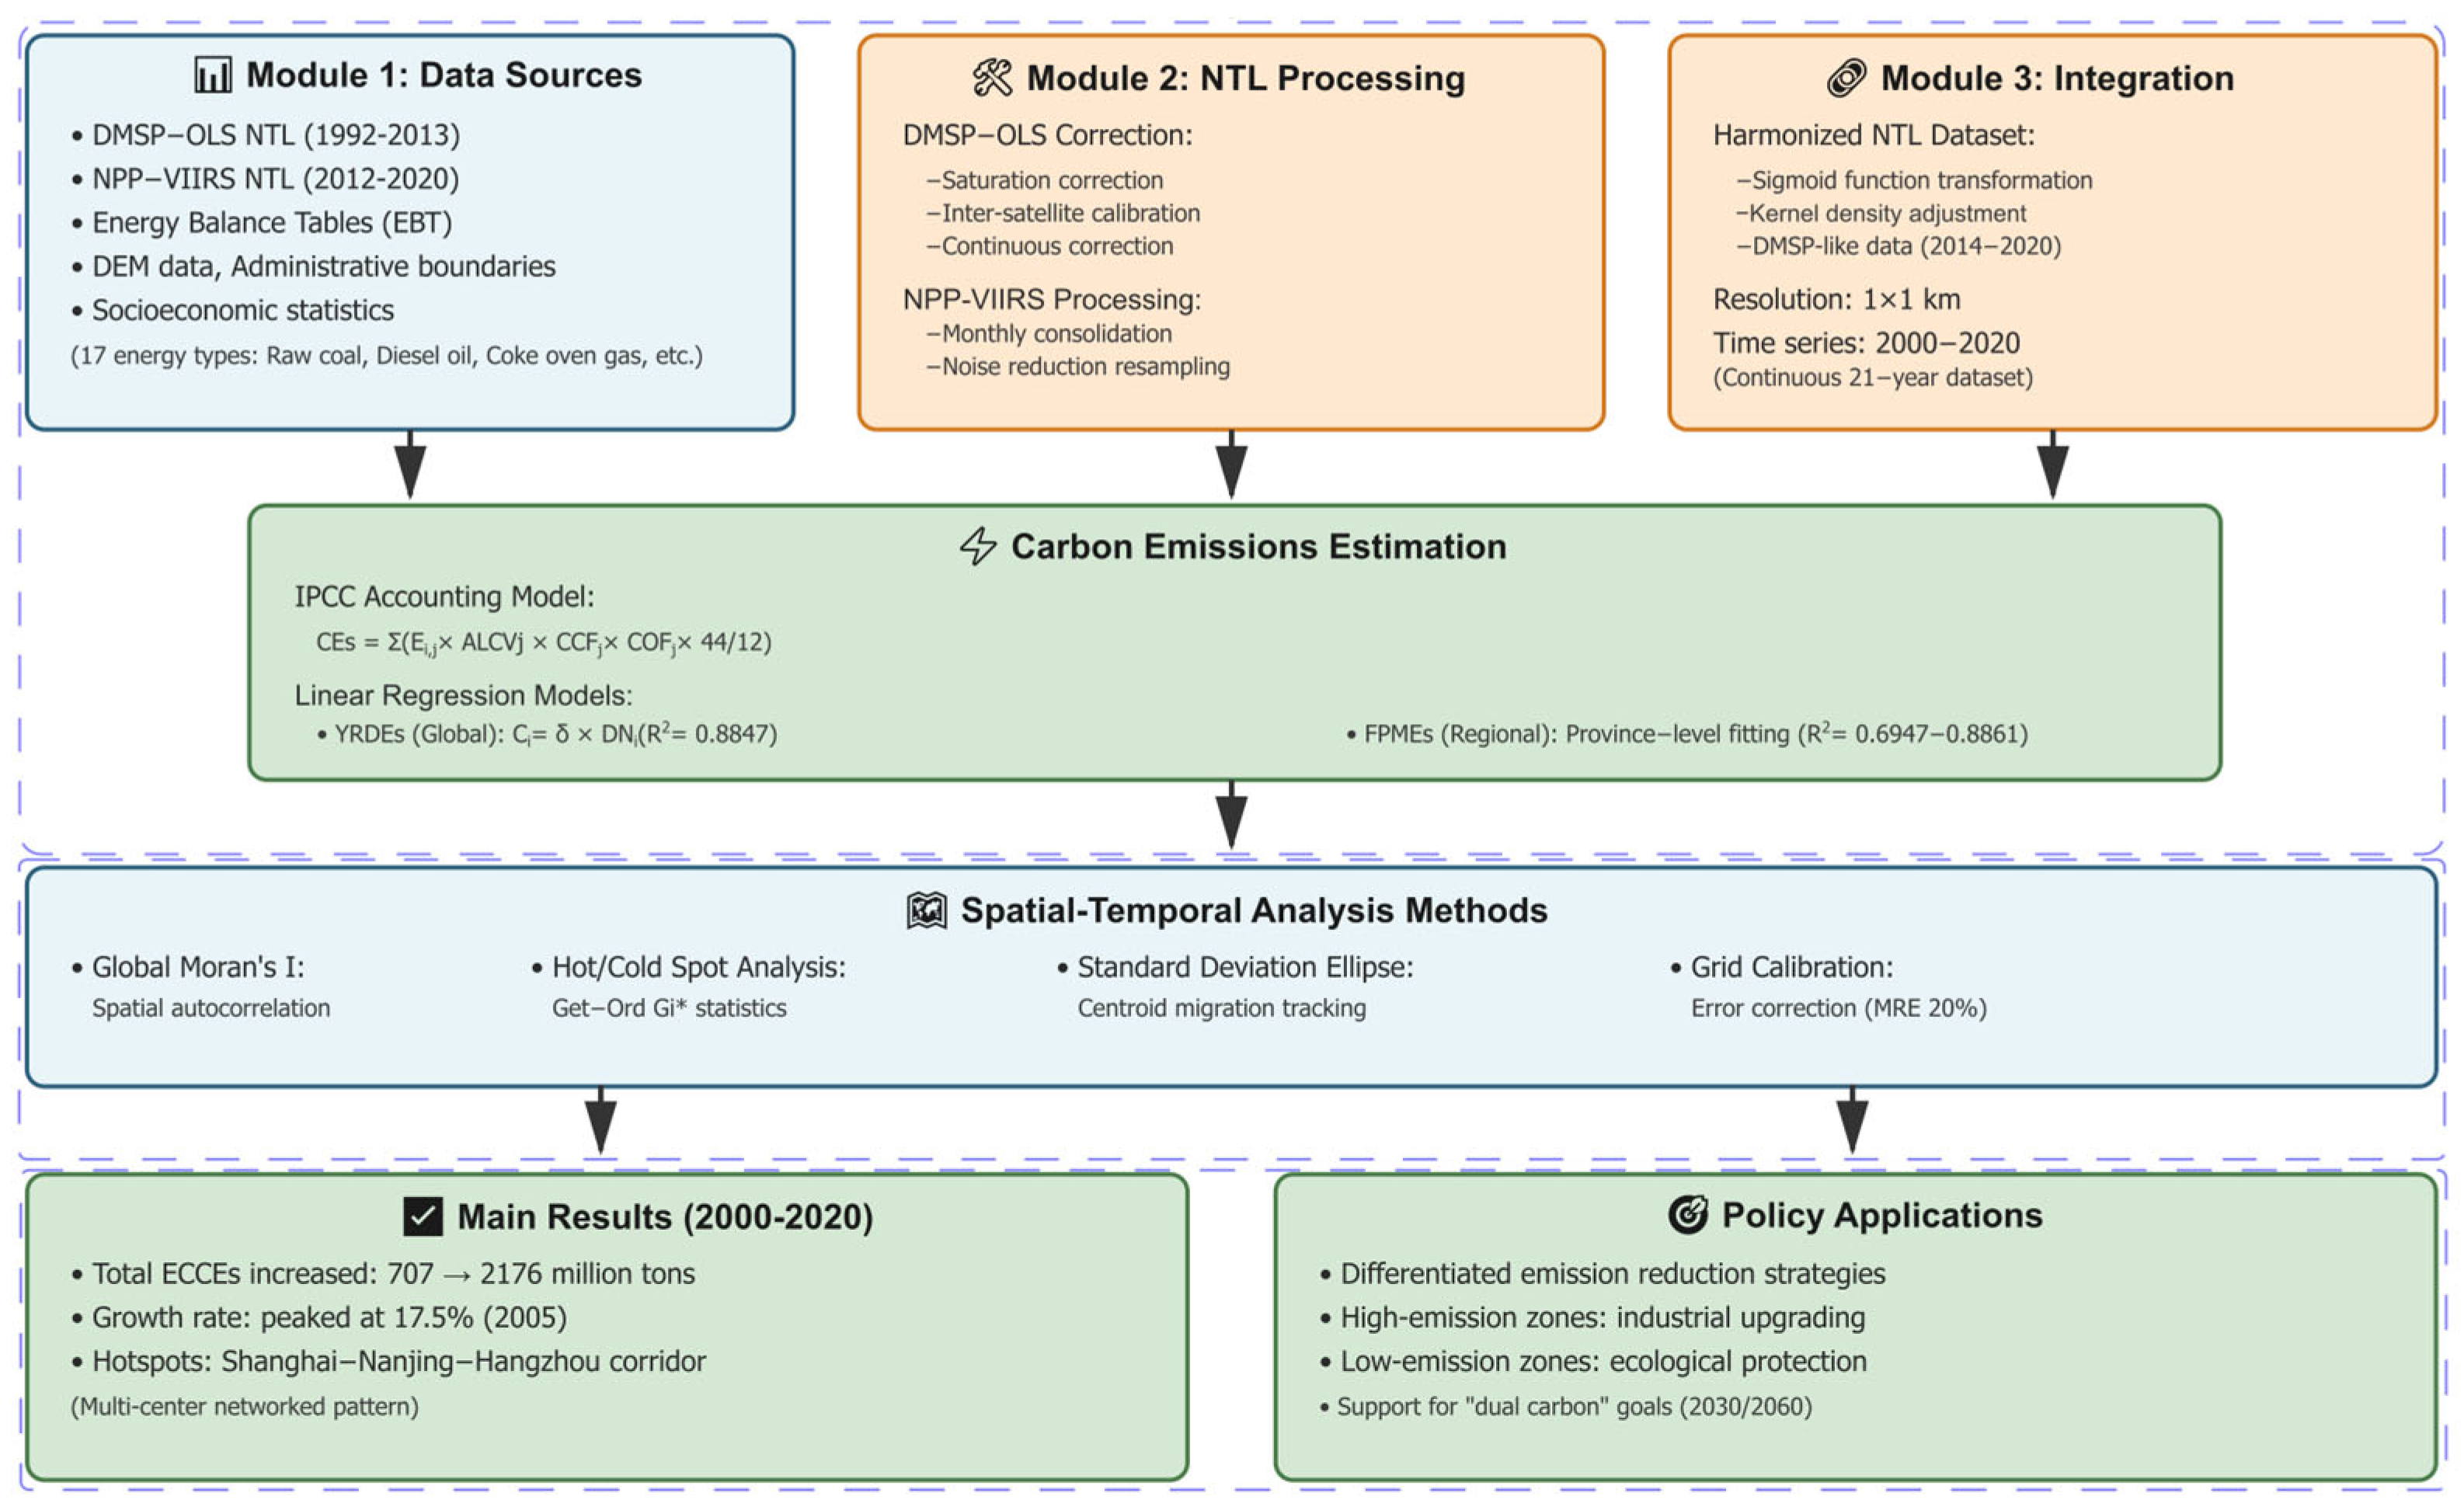
With the YRD region as a case study, this research establishes a refined ECCE estimation model through the collection and processing of NTL data and EBT data. This model enables the estimation of ECCEs in the YRD region at multiple scales, encompassing regional, provincial, municipal, and county levels. To better understand the spatiotemporal evolution characteristics of ECCEs at the county scale in the YRD region, this research also employs analytical methods including global spatial autocorrelation analysis, cold- and hotspot analysis, and the standard deviational ellipse method. The research framework is shown in Figure 1.
Figure 1.
Research framework.
2.1. Study Area
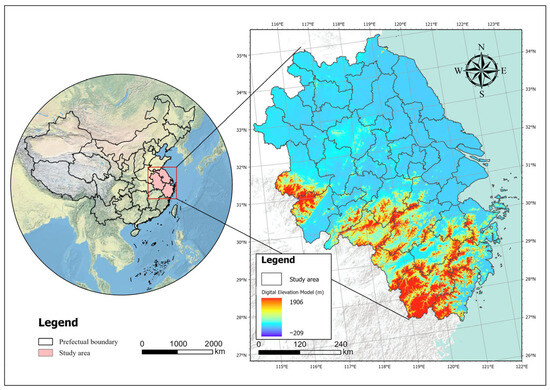
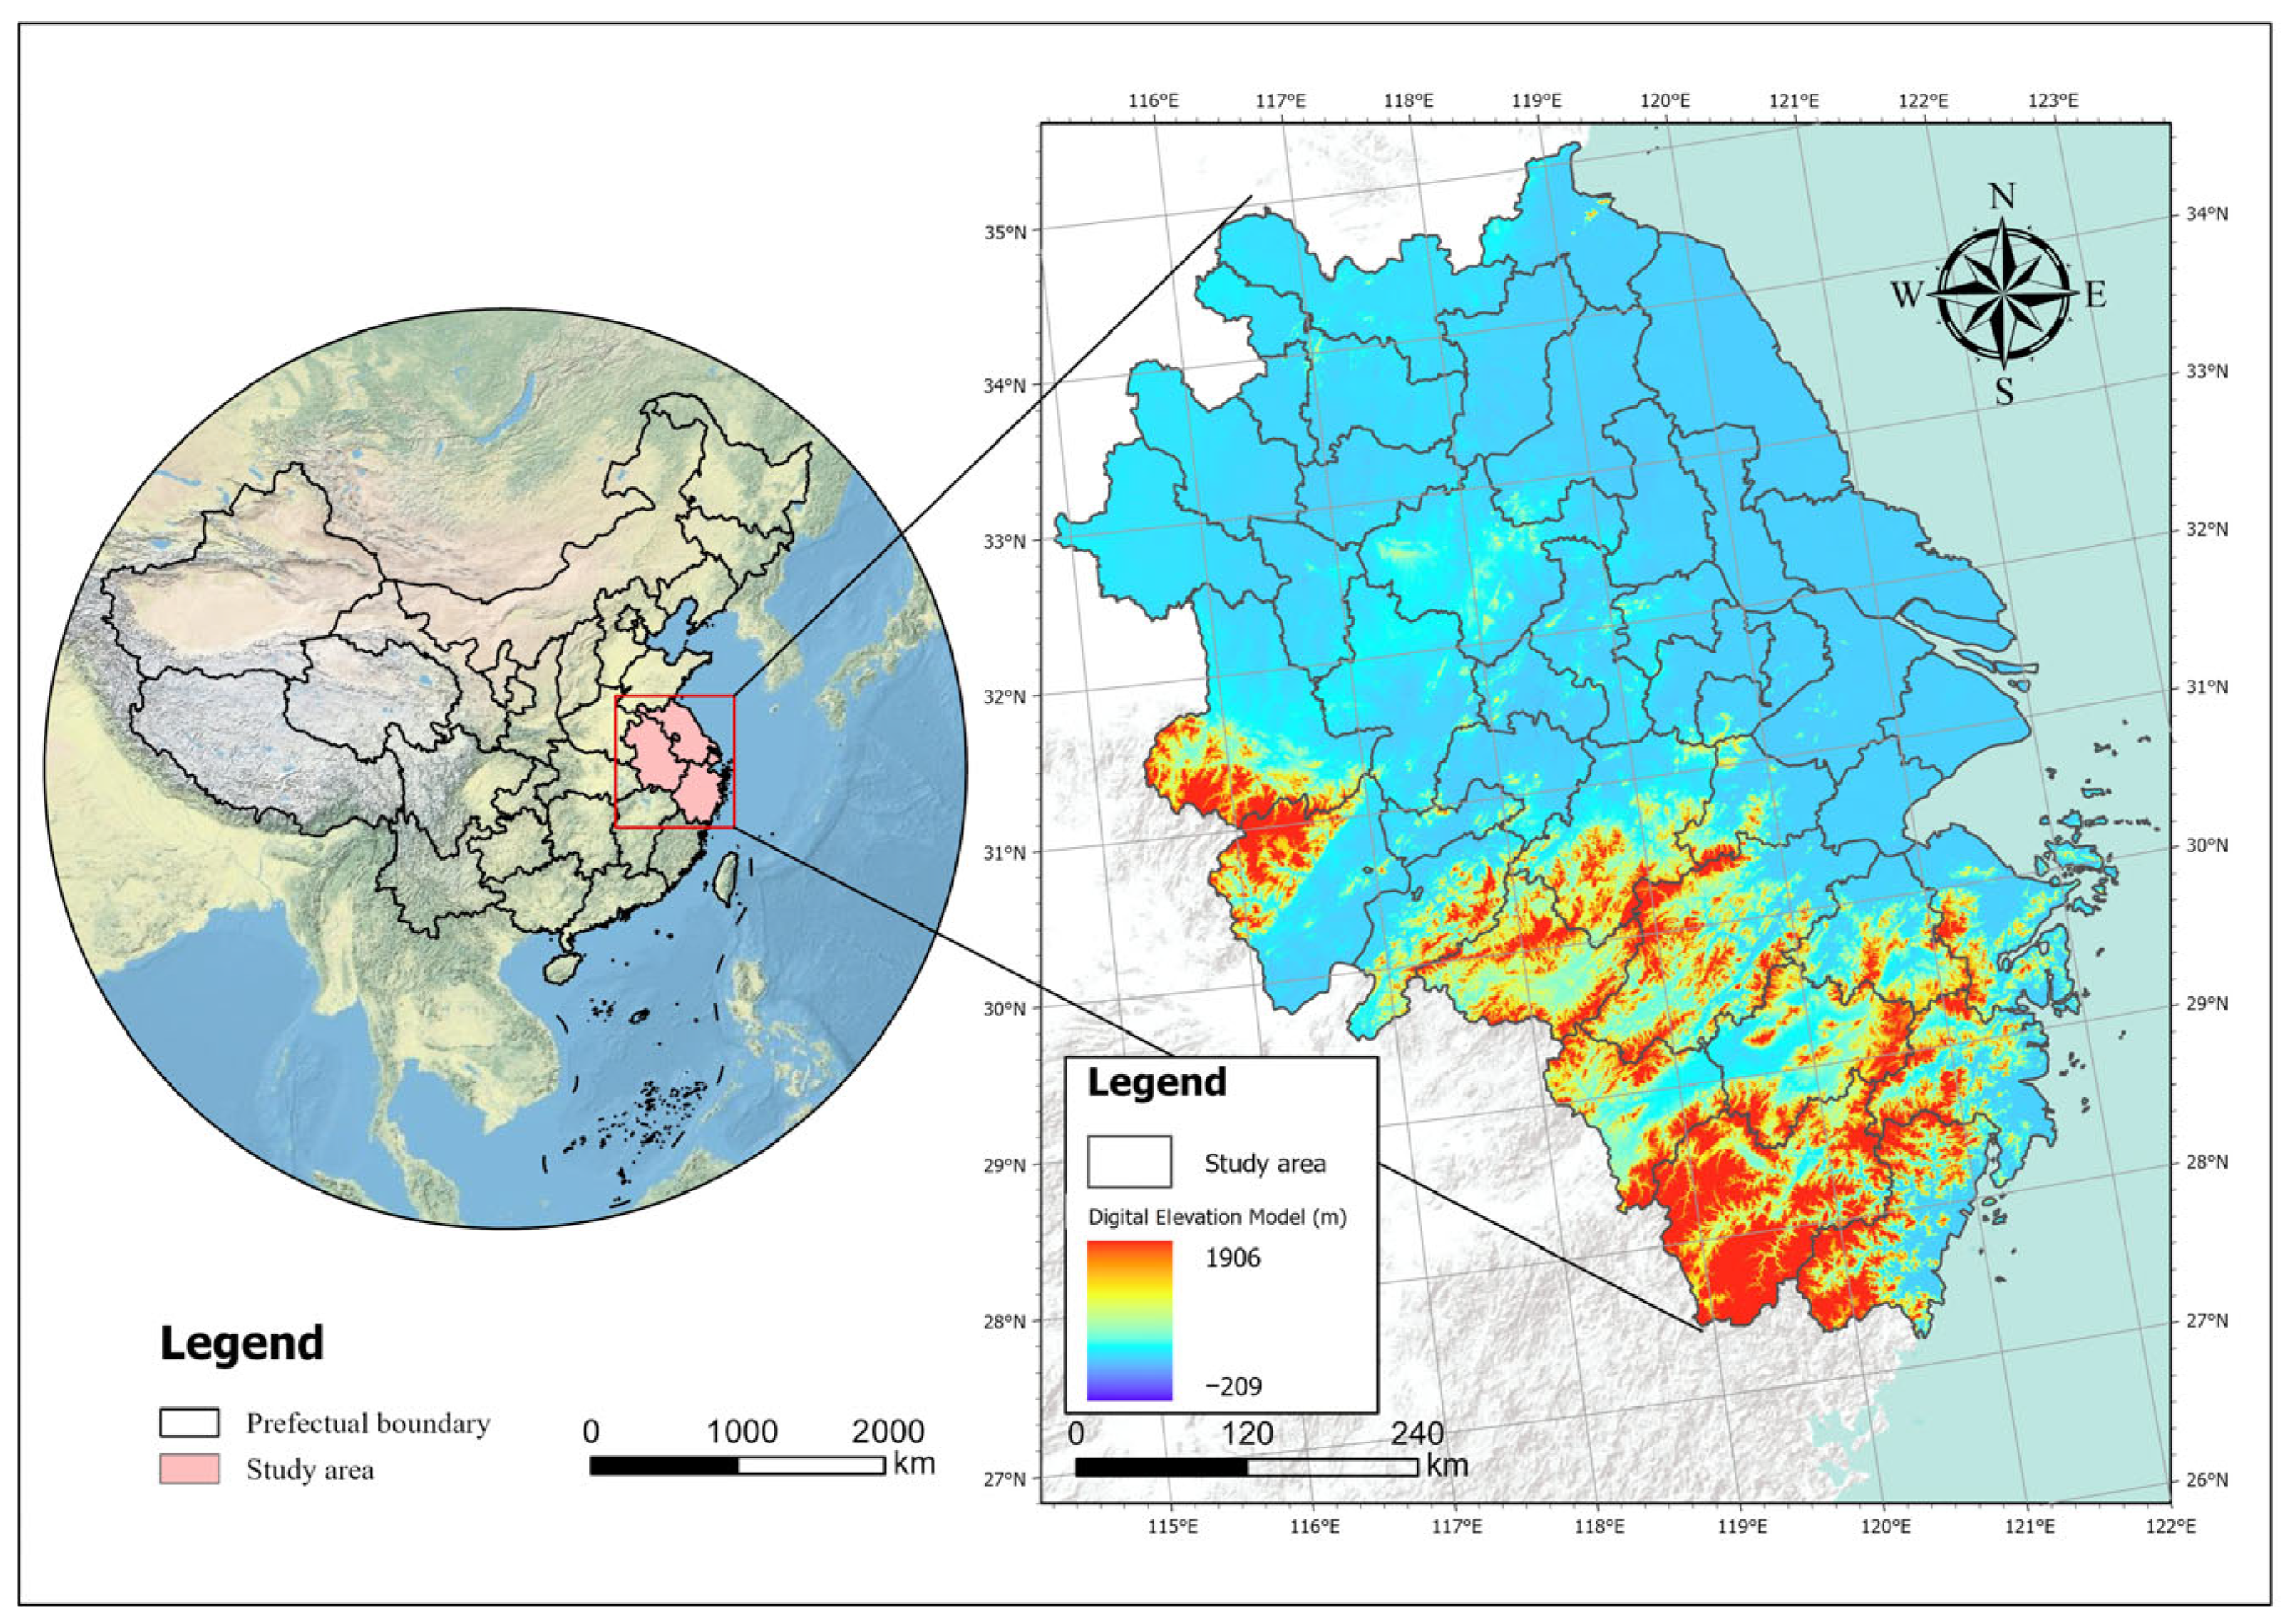
The YRD region is situated on the eastern coast of China (Figure 2). It comprises Shanghai municipality, Jiangsu Province, Zhejiang Province, and Anhui Province, serving as a core region in China’s advancement of integrated development. The administrative scope covers approximately 358,000 km2, with the terrain generally showing a gradient distribution pattern of “eastern coastal plain–southwestern low mountains and hills”. The elevation in the region increases gradually from several meters in the offshore plain to over 1900 m. The study area is located at 27°21′ N–35°20′ N latitude and 114°4′ E–123°08′ E longitude, with diverse land use types. Dense urban built-up areas are distributed along the eastern coast and the Yangtze River; the central plain is dominated by farmland; and the southwestern part consists of low mountains and hills covered with forests and grasslands.
Figure 2.
Geographical position of the YRD region.
The YRD region is one of the most dynamic, open, and innovative regions in China, with unique advantages and significant development potential [45]. As of 2024, the total GDP of the YRD region was approximately 27.6 trillion yuan (CNY), accounting for roughly one-fourth of China’s total GDP. Its permanent population exceeded 227 million, accounting for 16.6% of China’s total population. Its industrial structure is dominated by the secondary and tertiary industries. Advanced manufacturing and modern service industries develop in a coordinated manner, forming a core engine that drives China’s economic growth. In 2022, the total energy consumption of the YRD region accounted for 17% of China’s national total, making it a pivotal region in China for ECCEs [46].
2.2. Materials
This study primarily employs remote sensing data, natural environment data, and statistical data. Remote sensing data include DMSP-OLS NTL data from 1992 to 2013, NPP-VIIRS NTL data from 2012 to 2020, 30 m digital elevation model (DEM) data, and harmonized NTL data from 1992 to 2020. NTL data were processed through a harmonized processing method [47]. Natural environment data include national zoning and administrative divisions of the YRD region. Energy statistics mainly record the consumption of 17 types of energy sources, including raw coal, coke, gasoline, and kerosene. Table 1 presents the specific data types and their sources.
Table 1.
Data types and sources used in this study.
2.3. Research Methodology
2.3.1. Harmonized Processing of NTL Data
This study utilizes a widely adopted, long-term, and consistent NTL time-series (https://doi.org/10.6084/m9.figshare.9828827.v5) dataset spanning from 1992 to 2020 [48], with a spatial resolution of 30 arc-seconds. This ready-made dataset effectively addresses the temporal inconsistencies of DMSP-OLS data and the limited historical coverage of NPP-VIIRS data. The harmonization process, fully detailed in previous studies [47,48], primarily involves: (1) inter-sensor calibration of DMSP-OLS images using quadratic regression models to ensure continuity across different satellites (F10–F18) [49]; and (2) generation of DMSP-like time series from VIIRS data (2014–2020) via sigmoid function transformation and spatial resolution adjustment [50,51,52]. For the specific needs of this study, the harmonized dataset was further processed through mask extraction, projection transformation, and resampling to a unified spatial resolution of 1 × 1 km.
2.3.2. CE Accounting Model
To avoid ambiguity, this study strictly distinguishes between two types of CE data. Estimated CEs: Refers to CEs calculated based on energy consumption statistics and IPCC method, as shown in Equation (1). These serve as the ground truth for model training. Simulated CEs: refers to CEs derived from NTL data using regression models, as shown in Equation (2).
- 1.
- Estimation of CEs: According to the statistical records of energy consumption in Shanghai, Anhui, Zhejiang, and Jiangsu, CE estimation is based on the 2006 IPCC Guidelines and a method refined in 2019 [18,53]. Taking into account the accessibility and timeliness of energy consumption data in the research zone, we ultimately selected 17 types of energy for estimating ECCEs in the YRD region from 2000 to 2020. The calculation formula, Equation (1), is as follows [54]:
In Equation (1), A represents the total estimated CEs (tons), and Et,j denotes the total consumption of the j-th type of energy in the t-th year (104 tons or 108 m3). ALCVj indicates the average lower heating value of the j-th type of energy (PJ/104 tons or PJ/108 m3). CCFj is the carbon content factor for the j-th type of energy (tons C/TJ); COFj represents the carbon oxidation factor of carbonaceous fuel j, in percentage (%); and 44/12 is the molar ratio of CO2 to C. Data on ALCV, CCF, and COF are sourced from Shan et al. [55].
- 2.
- Simulation of CEs: Currently, studies focusing on exploring and verifying the relationship between total energy consumption and TDN are extensive and well-established. In this research, a univariate linear regression model, Equation (2), was constructed based on approaches proposed in previous studies [14,56] and can be expressed as follows:
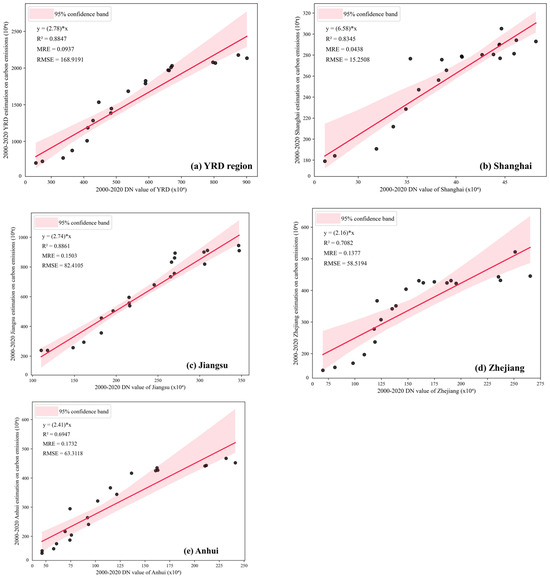
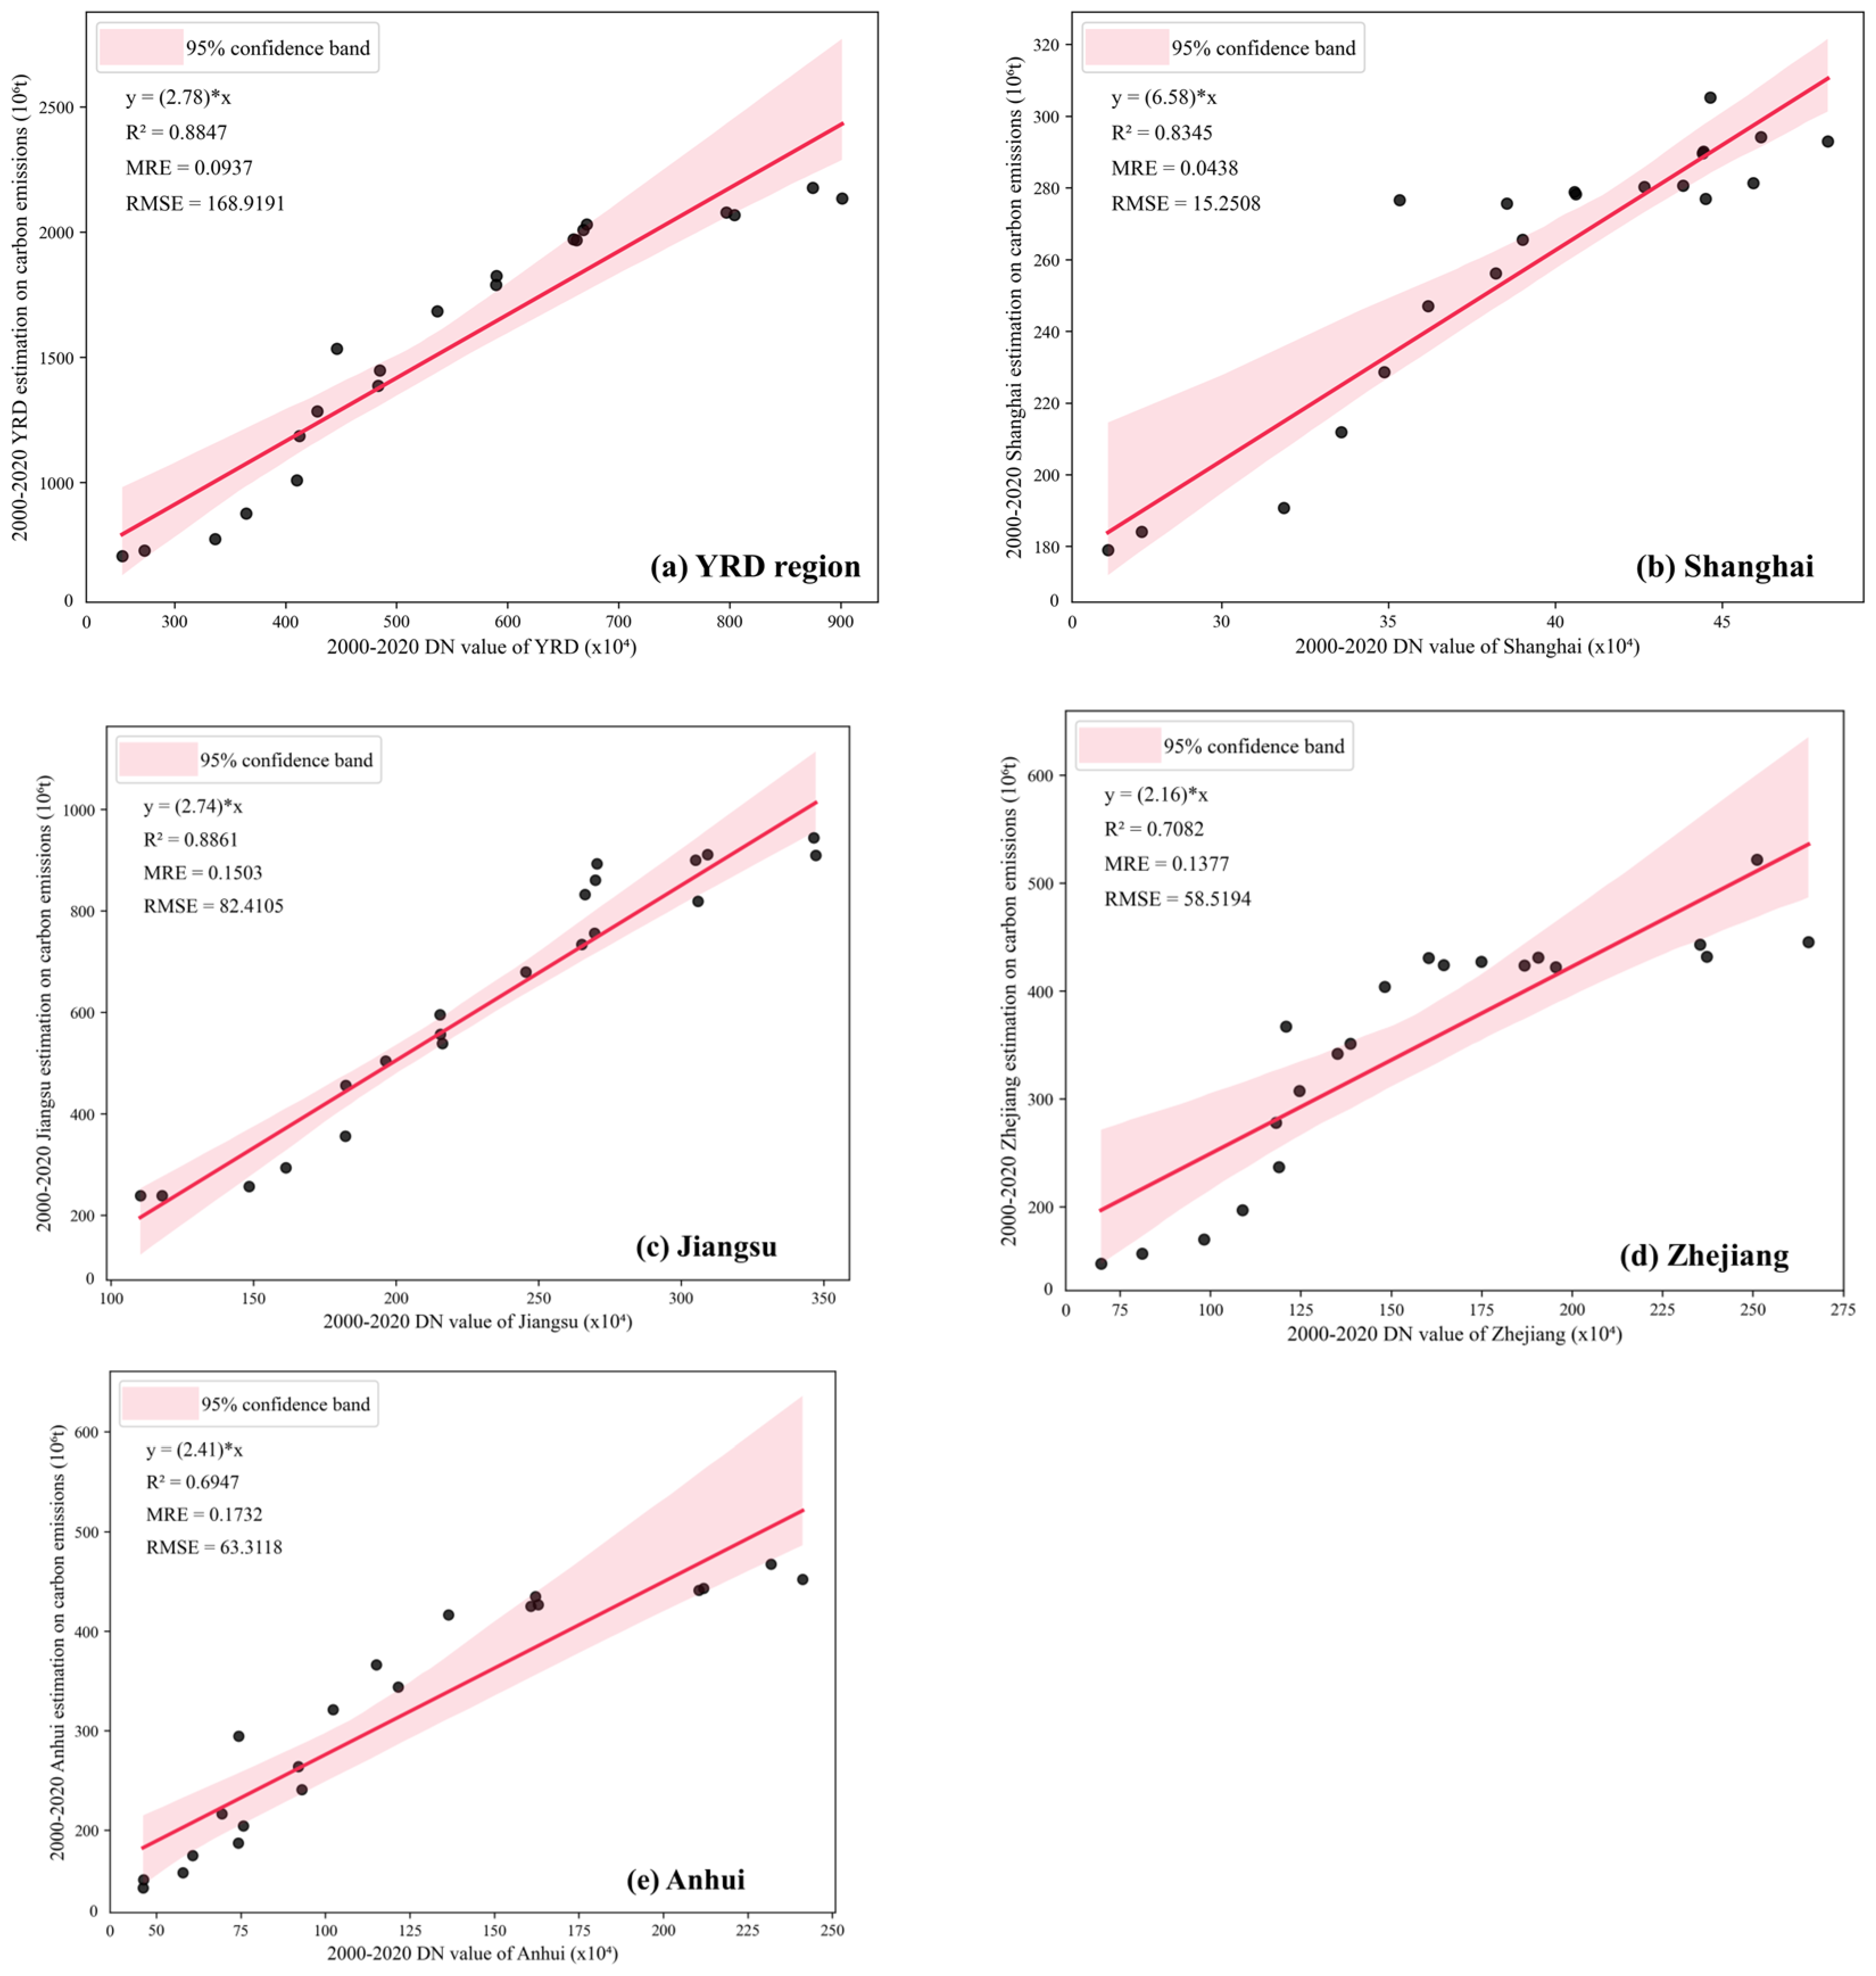
Figure 3.
Estimation of CEs and harmonized NTL data fitting from 2000 to 2020. (a) shows the YRD region; (b–e) provide data on Shanghai, Jiangsu, Zhejiang, and Anhui in sequence.
Referring to the above relationship, we can accurately simulate CEs in the YRD region from 2000 to 2020. Since harmonized NTL data can reflect the dynamic changes in DN values of different pixels across different years of urban development, we projected the annual simulated CEs onto the DN of the corresponding temporal pixels. This enables us to achieve the simulation of the corresponding CEs through the TDN of each pixel area. Specifically, we employed two distinct methods to simulate ECCEs across the entire YRD region:
- (1)
- Global Simulation Method: This approach fits a single regression model to the entire YRD region to derive ECCEs, herein referred to as YRDEs. It assumes regional integration, treating the YRD as a unified economic entity. This method addresses the following question: can a generalized global model adequately capture total emission trends in a developing urban agglomeration without considering internal administrative boundaries?
- (2)
- Regional Simulation Method: This strategy computes ECCEs for the four constituent provinces/municipalities individually using separate regression models and aggregates the results into what are termed FPMEs. It accounts for significant developmental disparities within the YRD region. It aims to determine whether accounting for local heterogeneity through regional simulation improves the accuracy of emission pattern representation compared to a global model.
- 3.
- CE Raster Data Evaluation and Correction: Accuracy validation is a critical step in assessing model performance. In this study, the accuracy of CE simulation was evaluated by comparing errors between estimated and simulated CEs. As shown in Table 2 and Table 3, significant relative errors are observed in the periods 2002–2004, 2009–2010, and 2019–2020.Table 2. Comparison of errors in ECCE estimation and YRDE simulation from 2000 to 2020.Table 3. Comparison of errors in ECCE estimation and FPME simulation from 2000 to 2020.
To address the errors arising from the above-mentioned regional regression function, the simulated CE data were calibrated. Referring to this calibration, the annual total of simulated CEs is obtained by multiplying each grid pixel’s CE value in the NTL data by its corresponding scaling factor, and then summing all resulting products. Thus, the corrected spatial CE data can be obtained using Equation (3) below:
where Cr(n) represents the estimated value of actual CEs in the n-th year, Ck(n) is the simulated value of CEs in the n-th year, Ck(n)q is the simulated value of CEs in the n-th year for the q-th grid cell, and Cm(n)q is the corrected value of CEs in the n-th year for the q-th grid cell. Specifically, Equation (3) constrains the pixel-level simulations such that the regional totals match the official energy statistics. This ensures that the resulting map remains consistent with administrative records, effectively serving as a spatially explicit downscaling of the official statistics.
2.3.3. Spatial Autocorrelation Statistics
- 1.
- Moran’s I index. Global spatial autocorrelation statistics are often used to describe the degree of aggregation in the study area, which is typically quantified using Moran′s I index [57]. This index spans a range of values from −1 to 1. When the value of Moran’s I is greater than 0, it indicates positive spatial autocorrelation: the closer the value is to 1, the more significant the positive spatial autocorrelation; conversely, when it is less than 0, it indicates negative spatial autocorrelation, and the closer it is to −1, the more significant the negative spatial autocorrelation [58,59]. The detailed formula is outlined below [60]:
- 2.
- Cold- and hotspot analysis. Coldspot and hotspot analysis is an effective tool for identifying the precise location and degree of spatial correlation in carbon emission clusters, and it addresses the issue of spatial independence that Moran’s I fails to fully reveal [56]. Through the Getis–Ord Gi* index, the spatial relationship of carbon emissions between a spatial region and its adjacent regions can be evaluated, and thus the spatial clusters of high values (hotspots) and low values (coldspots) can be identified [62]. This analysis approach facilitates identification of the agglomeration of carbon emission values and determines the spatial positions of these high (low)-value clusters [63]. The specific calculation formula of the Gi* index can be found in relevant studies [64,65].
2.3.4. SDE Analysis
SDE analysis is a classic method for analyzing spatial distribution characteristics, which can reveal the spatial relationships between geographical elements from a global spatial perspective [66,67]. This method provides a quantitative description of the directionality and spatial extent of spatial distribution through parameters such as the length, width, and eccentricity of the ellipse [68]. The specific calculation formula can be found in relevant research [69].
3. Results
3.1. Simulation Results and Data Consistency Test
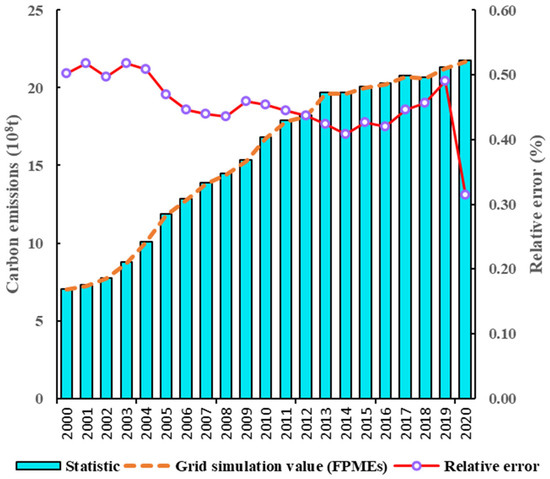
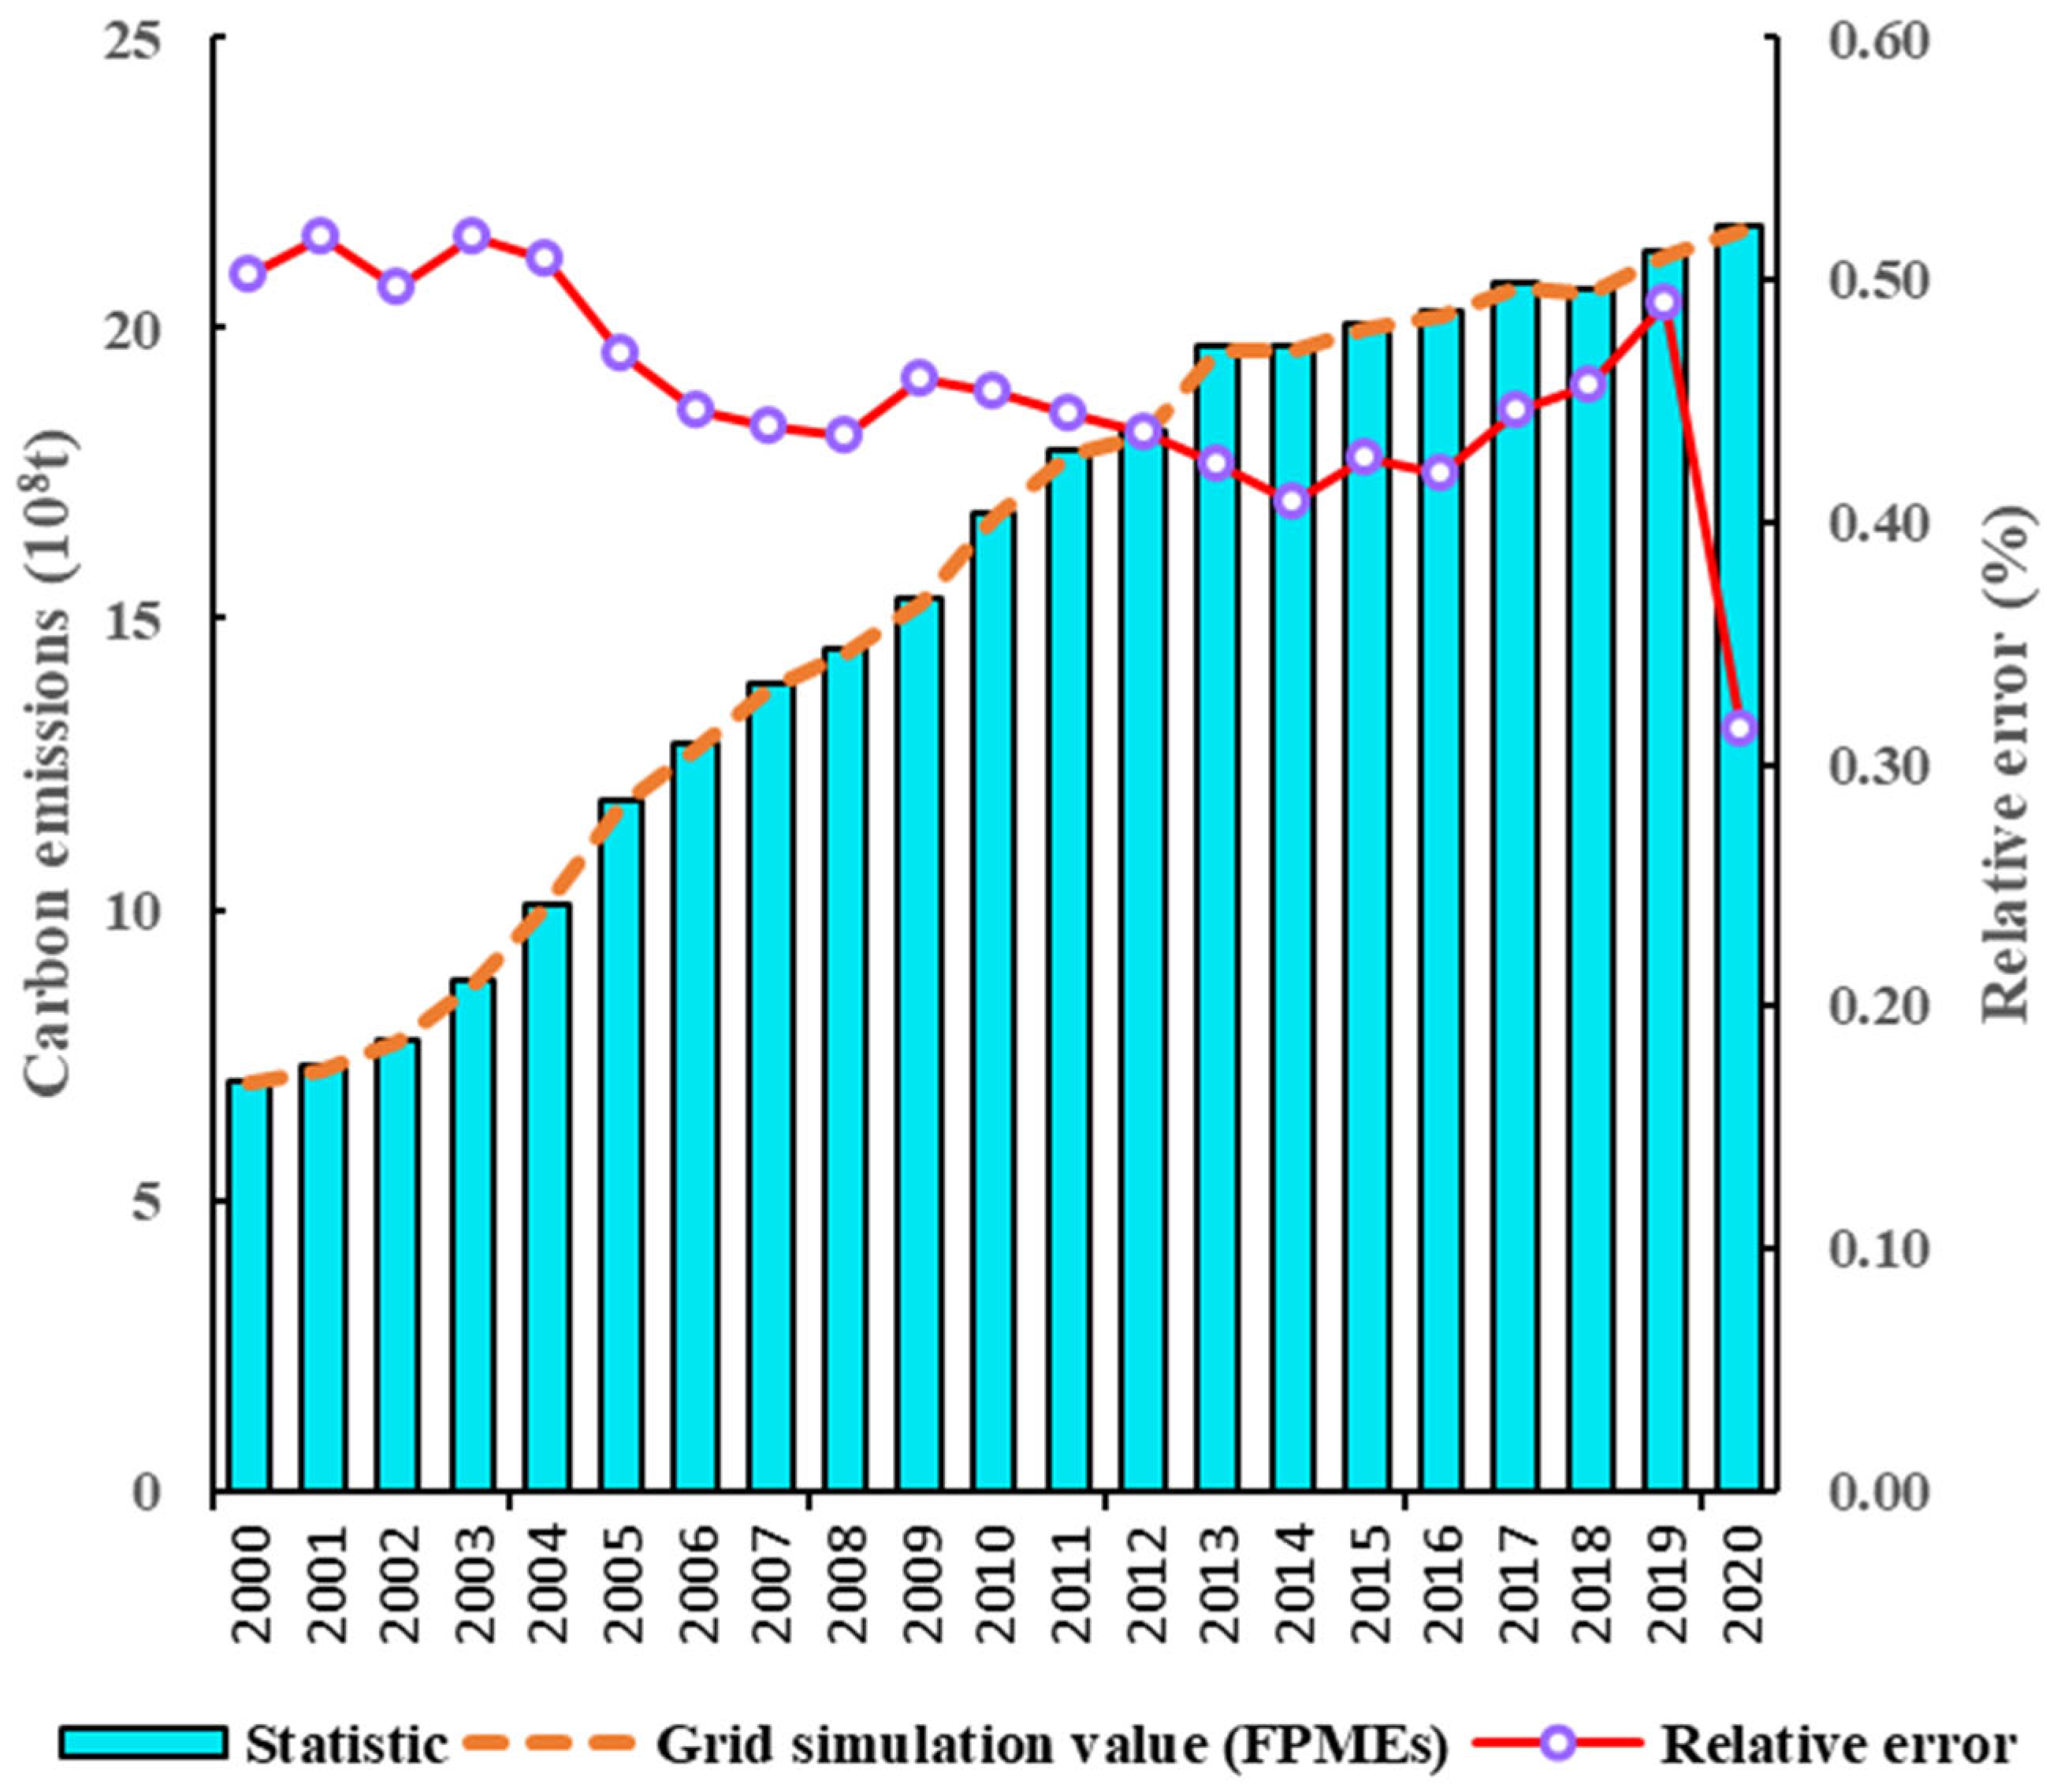
The results are presented in Figure 4 and Table 4. Among these, the relative errors between the gridded simulated and statistical values of YRDEs are all on the order of 10−6, reaching a minimum of 3.35 × 10⁻⁶% in 2019 and a maximum of 4.05 × 10⁻⁶% in 2001. The relative error between the grid-based simulated and statistical values of FPMEs was lowest at 0.31% in 2020 and highest at 0.52% in 2003. Figure 4 and Table 4 confirm that the calibration process effectively bridges the gap between NTL-based simulations and statistical records, thereby ensuring data consistency between the spatially gridded estimates and administrative inventories. These findings indicate that NTL data can be applied to study the spatiotemporal characteristics of ECCEs in the YRD region with high accuracy and reliability.
Figure 4.
Simulation error analysis of FPMEs in the YRD region of China from 2000 to 2020.
Table 4.
Simulation error analysis of YRDEs in the YRD region of China from 2000 to 2020.
3.2. Spatial–Temporal Evolution Characteristics of CE Grids
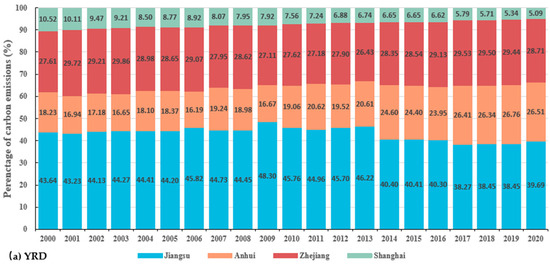
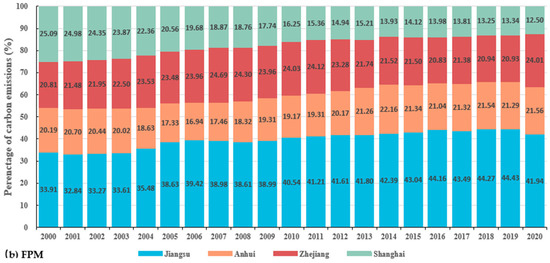
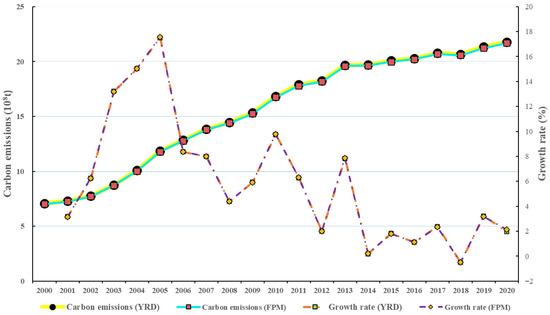
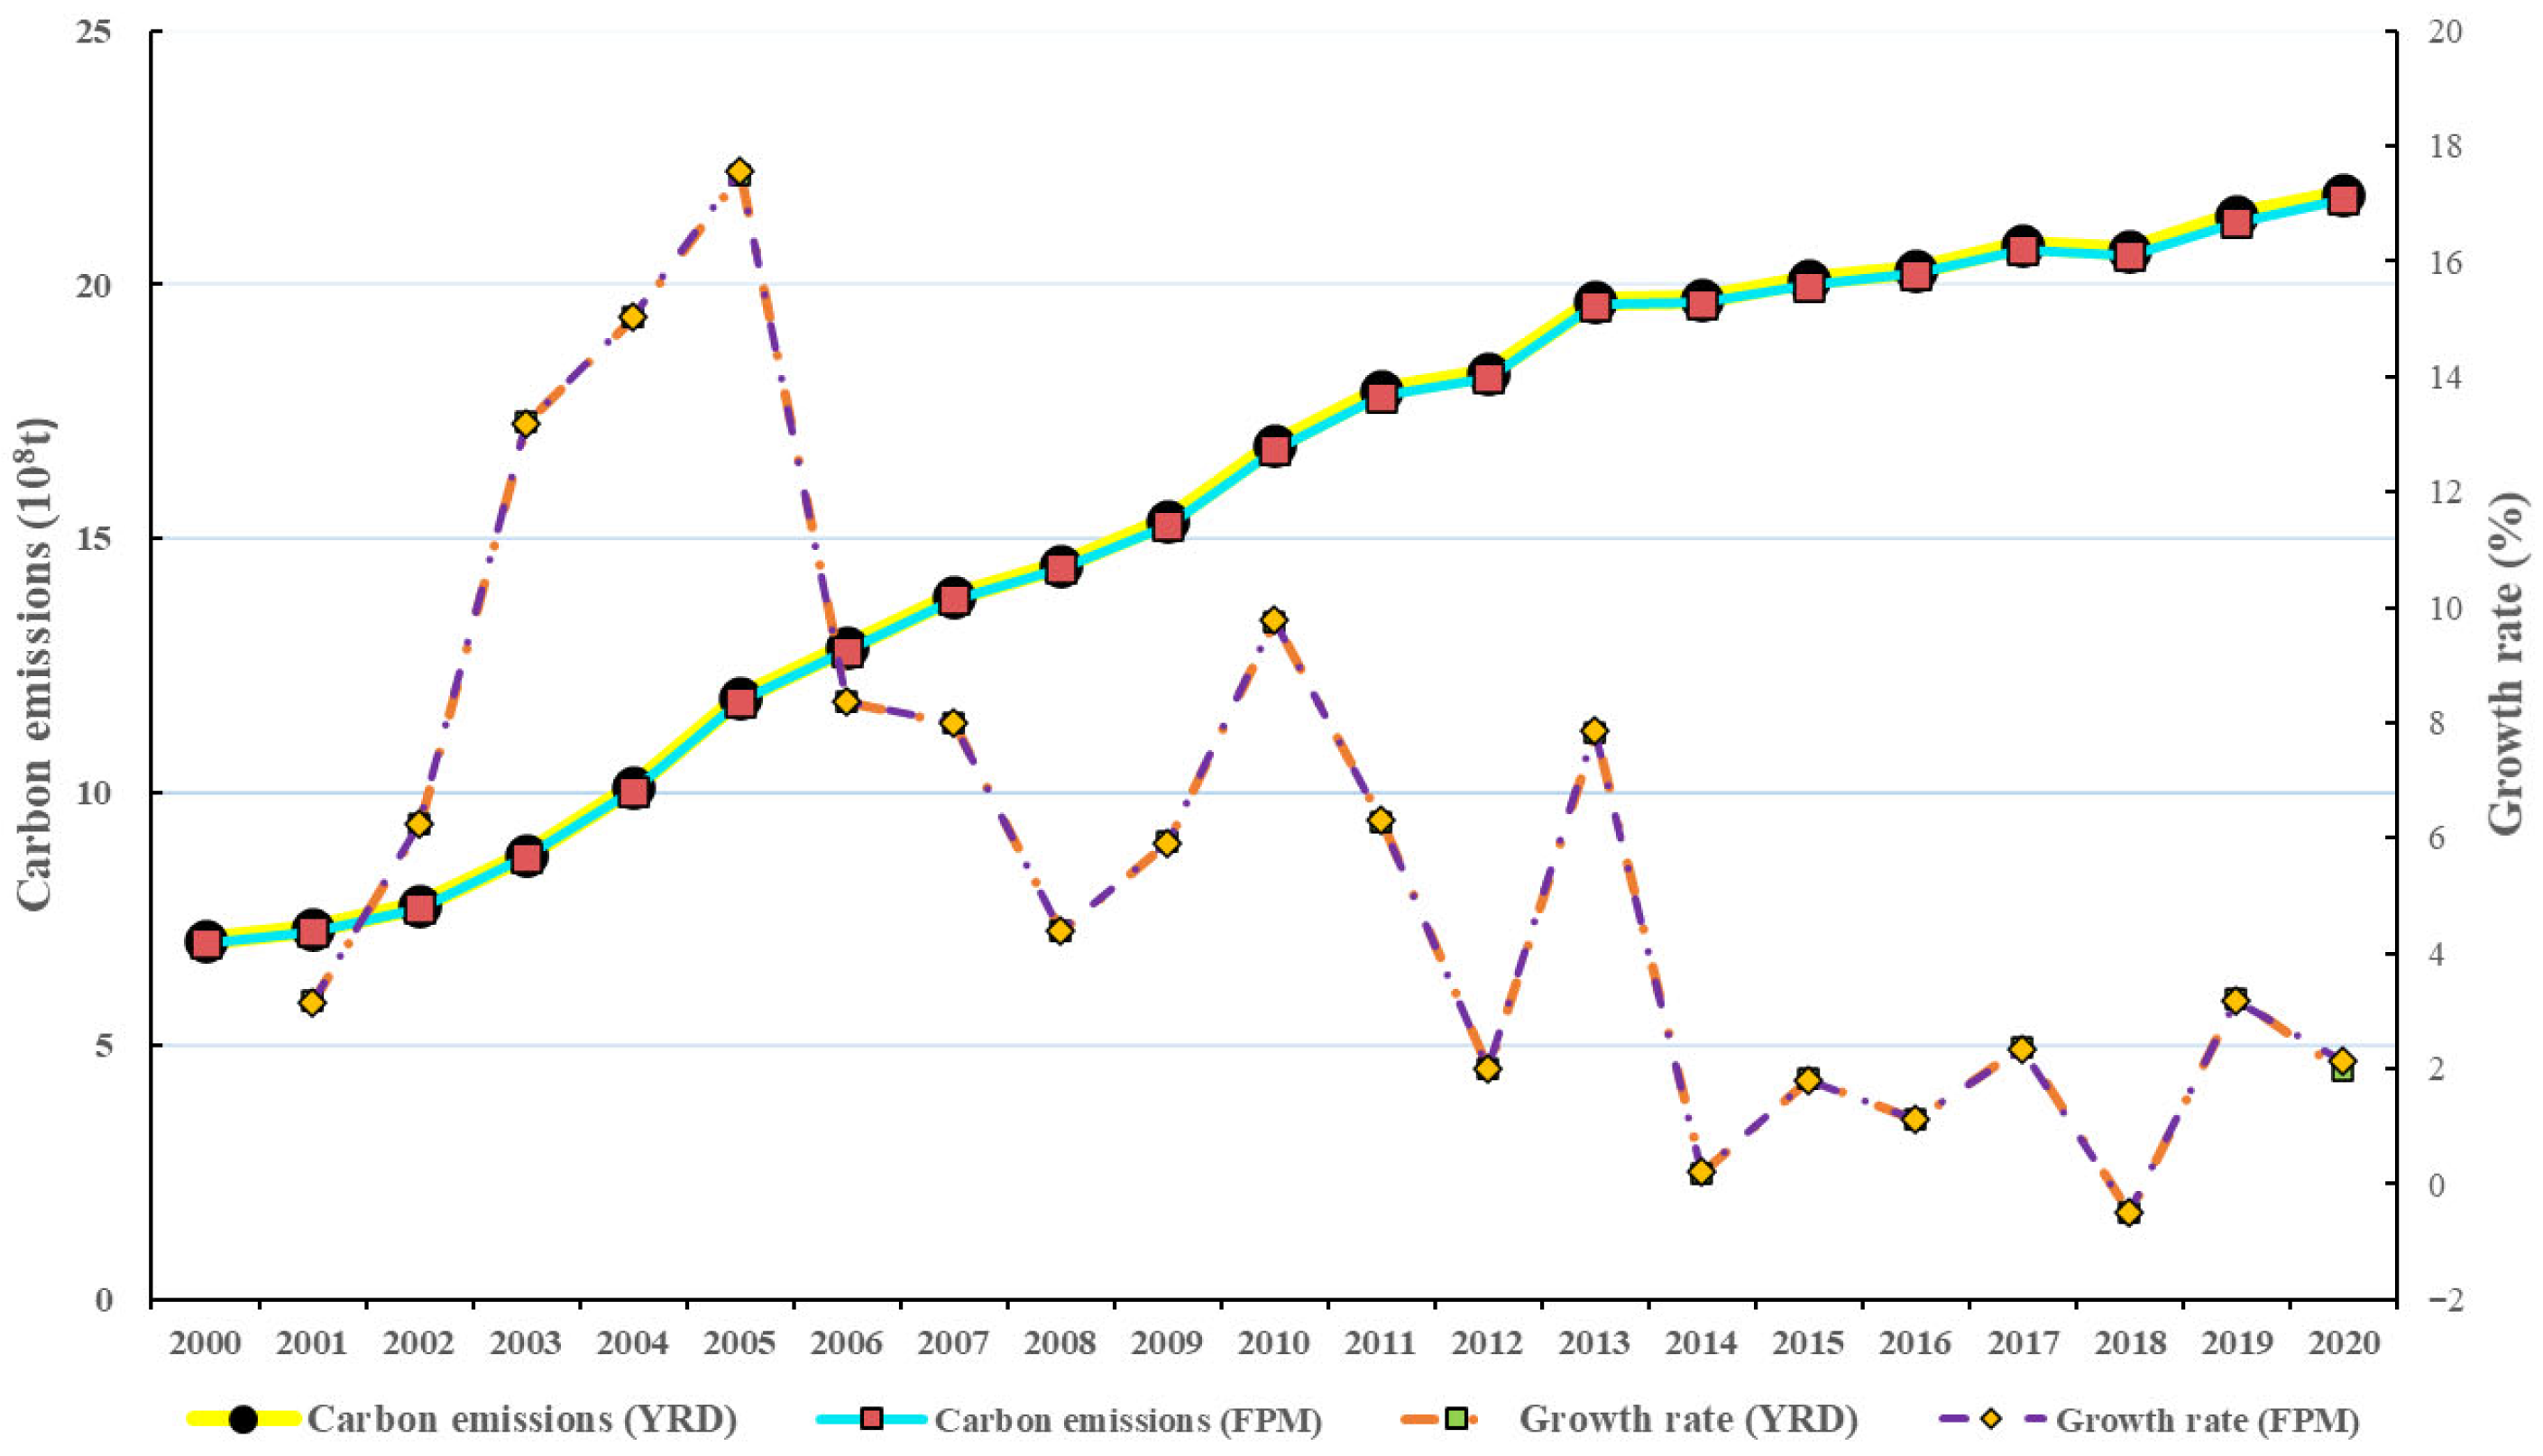
As shown in Figure 5 and Figure 6, the findings are as follows: From 2000 to 2020, the total ECCEs derived from the two simulation approaches both exhibited a consistent trend of continuous growth, with a highly similar overall growth pattern. YRDEs increased from 707 million tons in 2000 to 2.176 billion tons in 2020, while FPMEs rose from 703 million tons in 2000 to 2.169 billion tons in 2020. The trajectories of the annual growth rates of ECCEs under the two simulation methods were nearly identical, both rapidly rising from low levels in 2001 (YRDEs: 3.16%; FPMEs: 3.15%) to peaks in 2005 (YRDEs: 17.51%; FPMEs: 17.56%). Thereafter, they fluctuated downward to negative growth in 2018 (YRDEs: −0.49%; FPMEs: −0.50%), and finally slowly recovered to 1.96% and 2.14% in 2020, respectively. Notably, growth decelerated markedly after 2014. In terms of geographical distribution, the ranking of total ECCEs across the four provinces/municipalities remained consistent, following the order of Jiangsu > Zhejiang > Anhui > Shanghai. Nevertheless, variations existed in the changing trends of ECCE share of each province/municipality between the two simulation approaches.
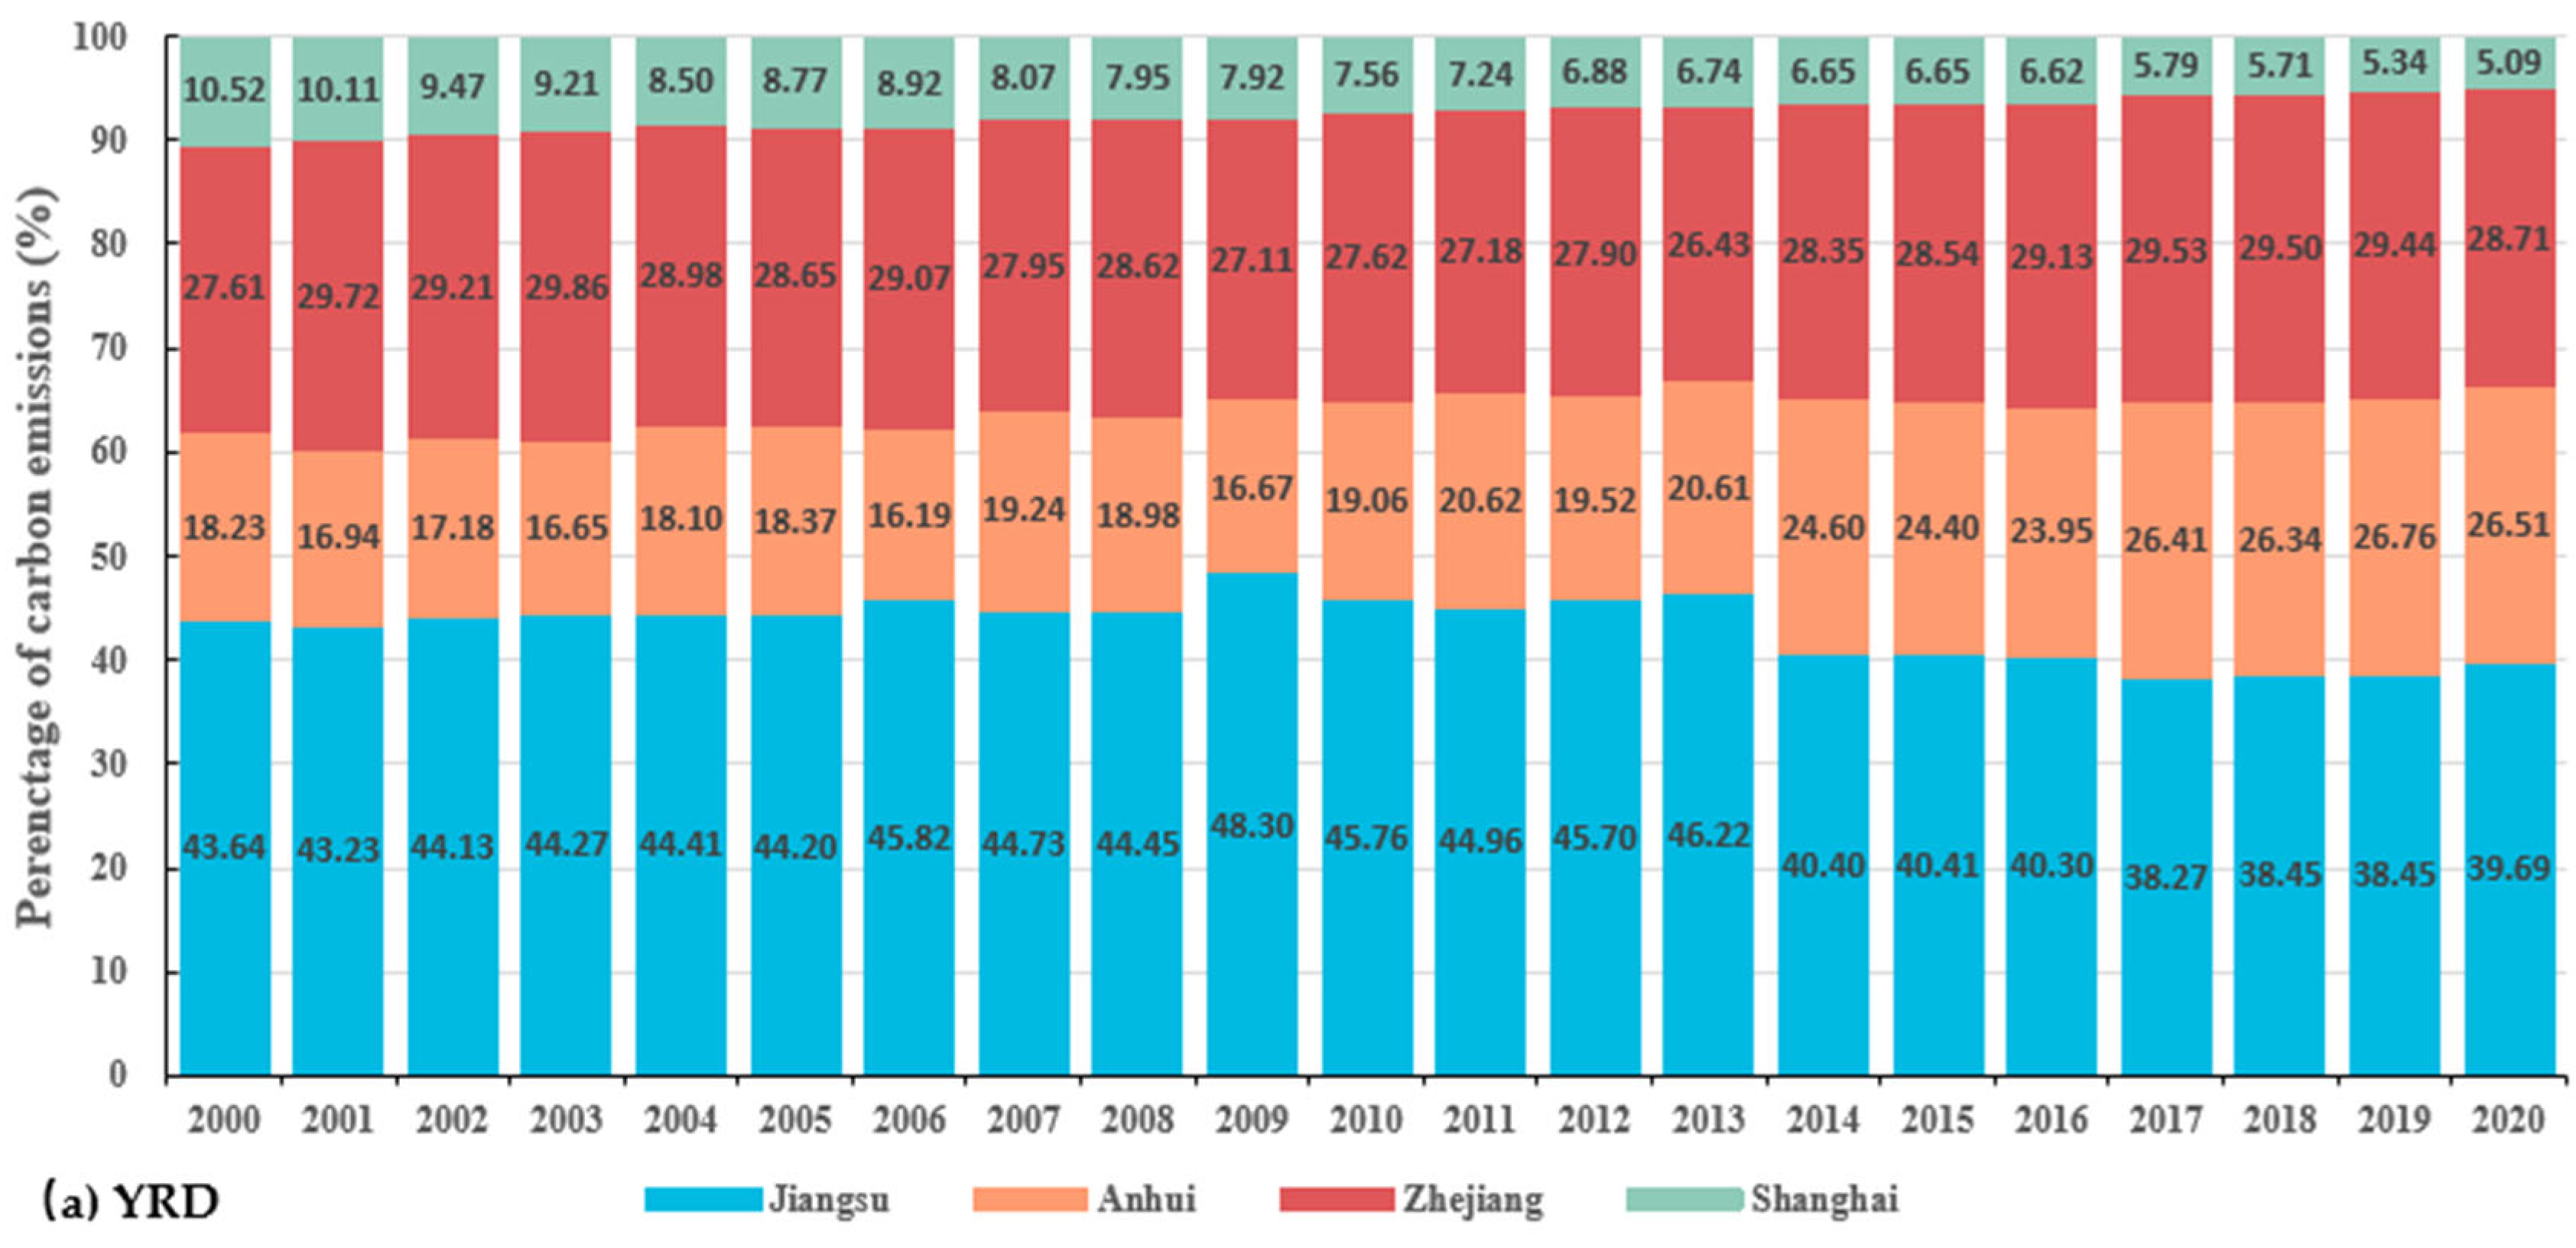
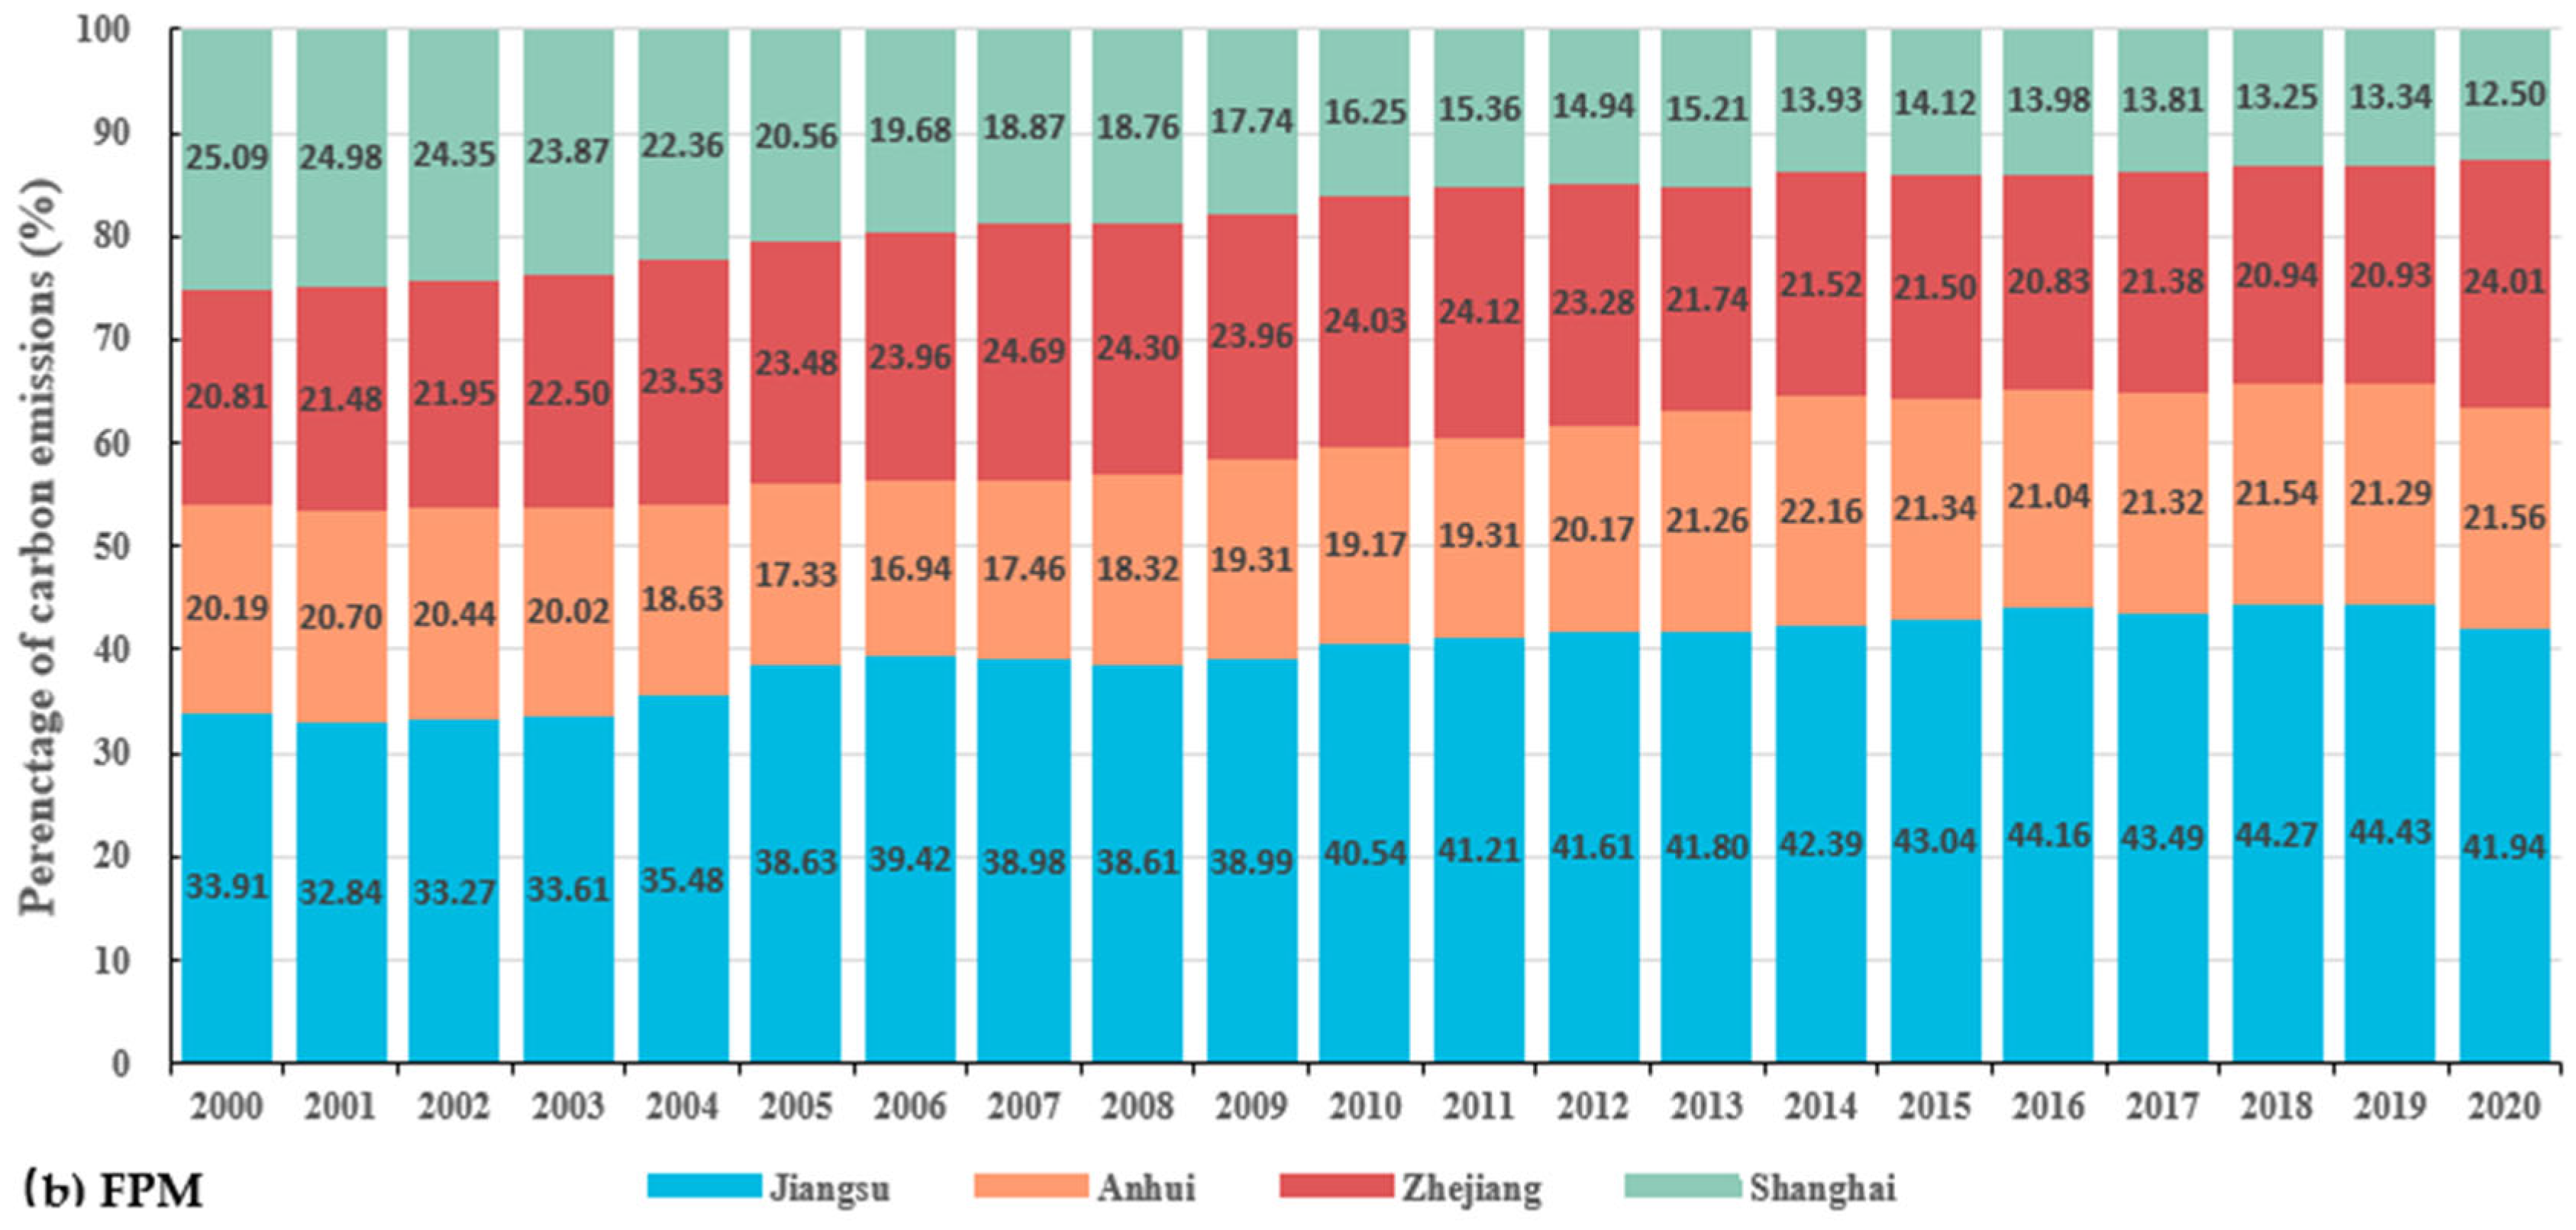
Figure 5.
Annual proportion of YRDEs and FPMEs of each province and municipality in the YRD region from 2000 to 2020. (a) Annual proportion of YRDEs; (b) annual proportion of FPMEs.
Figure 6.
Change trend of YRDEs and FPMEs in the YRD region from 2000 to 2020.
Based on the YRDE results, Jiangsu Province’s proportion of ECCEs has consistently remained at a high level with minor fluctuations, gradually decreasing from 43.64% in 2000 to 39.69% in 2020; Shanghai municipality’s proportion has shown a continuous downward trend, dropping from 10.52% in 2000 to 5.09% in 2020; Zhejiang Province’s proportion has displayed a fluctuating upward characteristic, rising from 27.61% in 2000 to 28.71% in 2020; and Anhui Province’s proportion, although relatively low, has increased with slight fluctuations, rising from 18.23% in 2000 to 26.51% in 2020.
Referring to the FPME results, Jiangsu Province’s proportion maintained a high level: it initially fluctuated upward from 33.91% in 2000 to a peak of 44.43% in 2019, before dropping to 41.94% in 2020; Shanghai’s proportion sustained its declining trajectory, falling from 25.09% (ranked second) in 2000 to 12.50% (ranked fourth) in 2020. Zhejiang Province’s proportion also exhibited a fluctuating upward trend, rising from 20.81% in 2000 to 24.01% in 2020. Anhui Province’s proportion showed a slightly fluctuating increase, rising from 20.19% in 2000 to 21.56% in 2020.
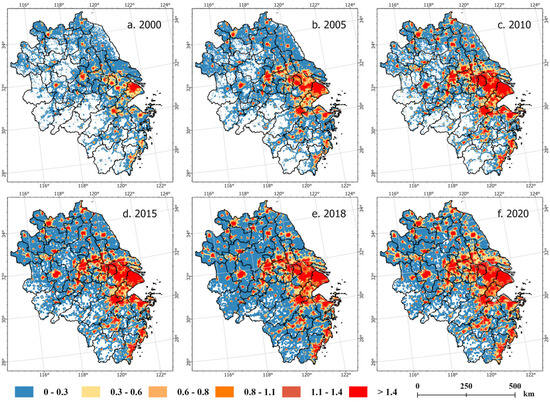
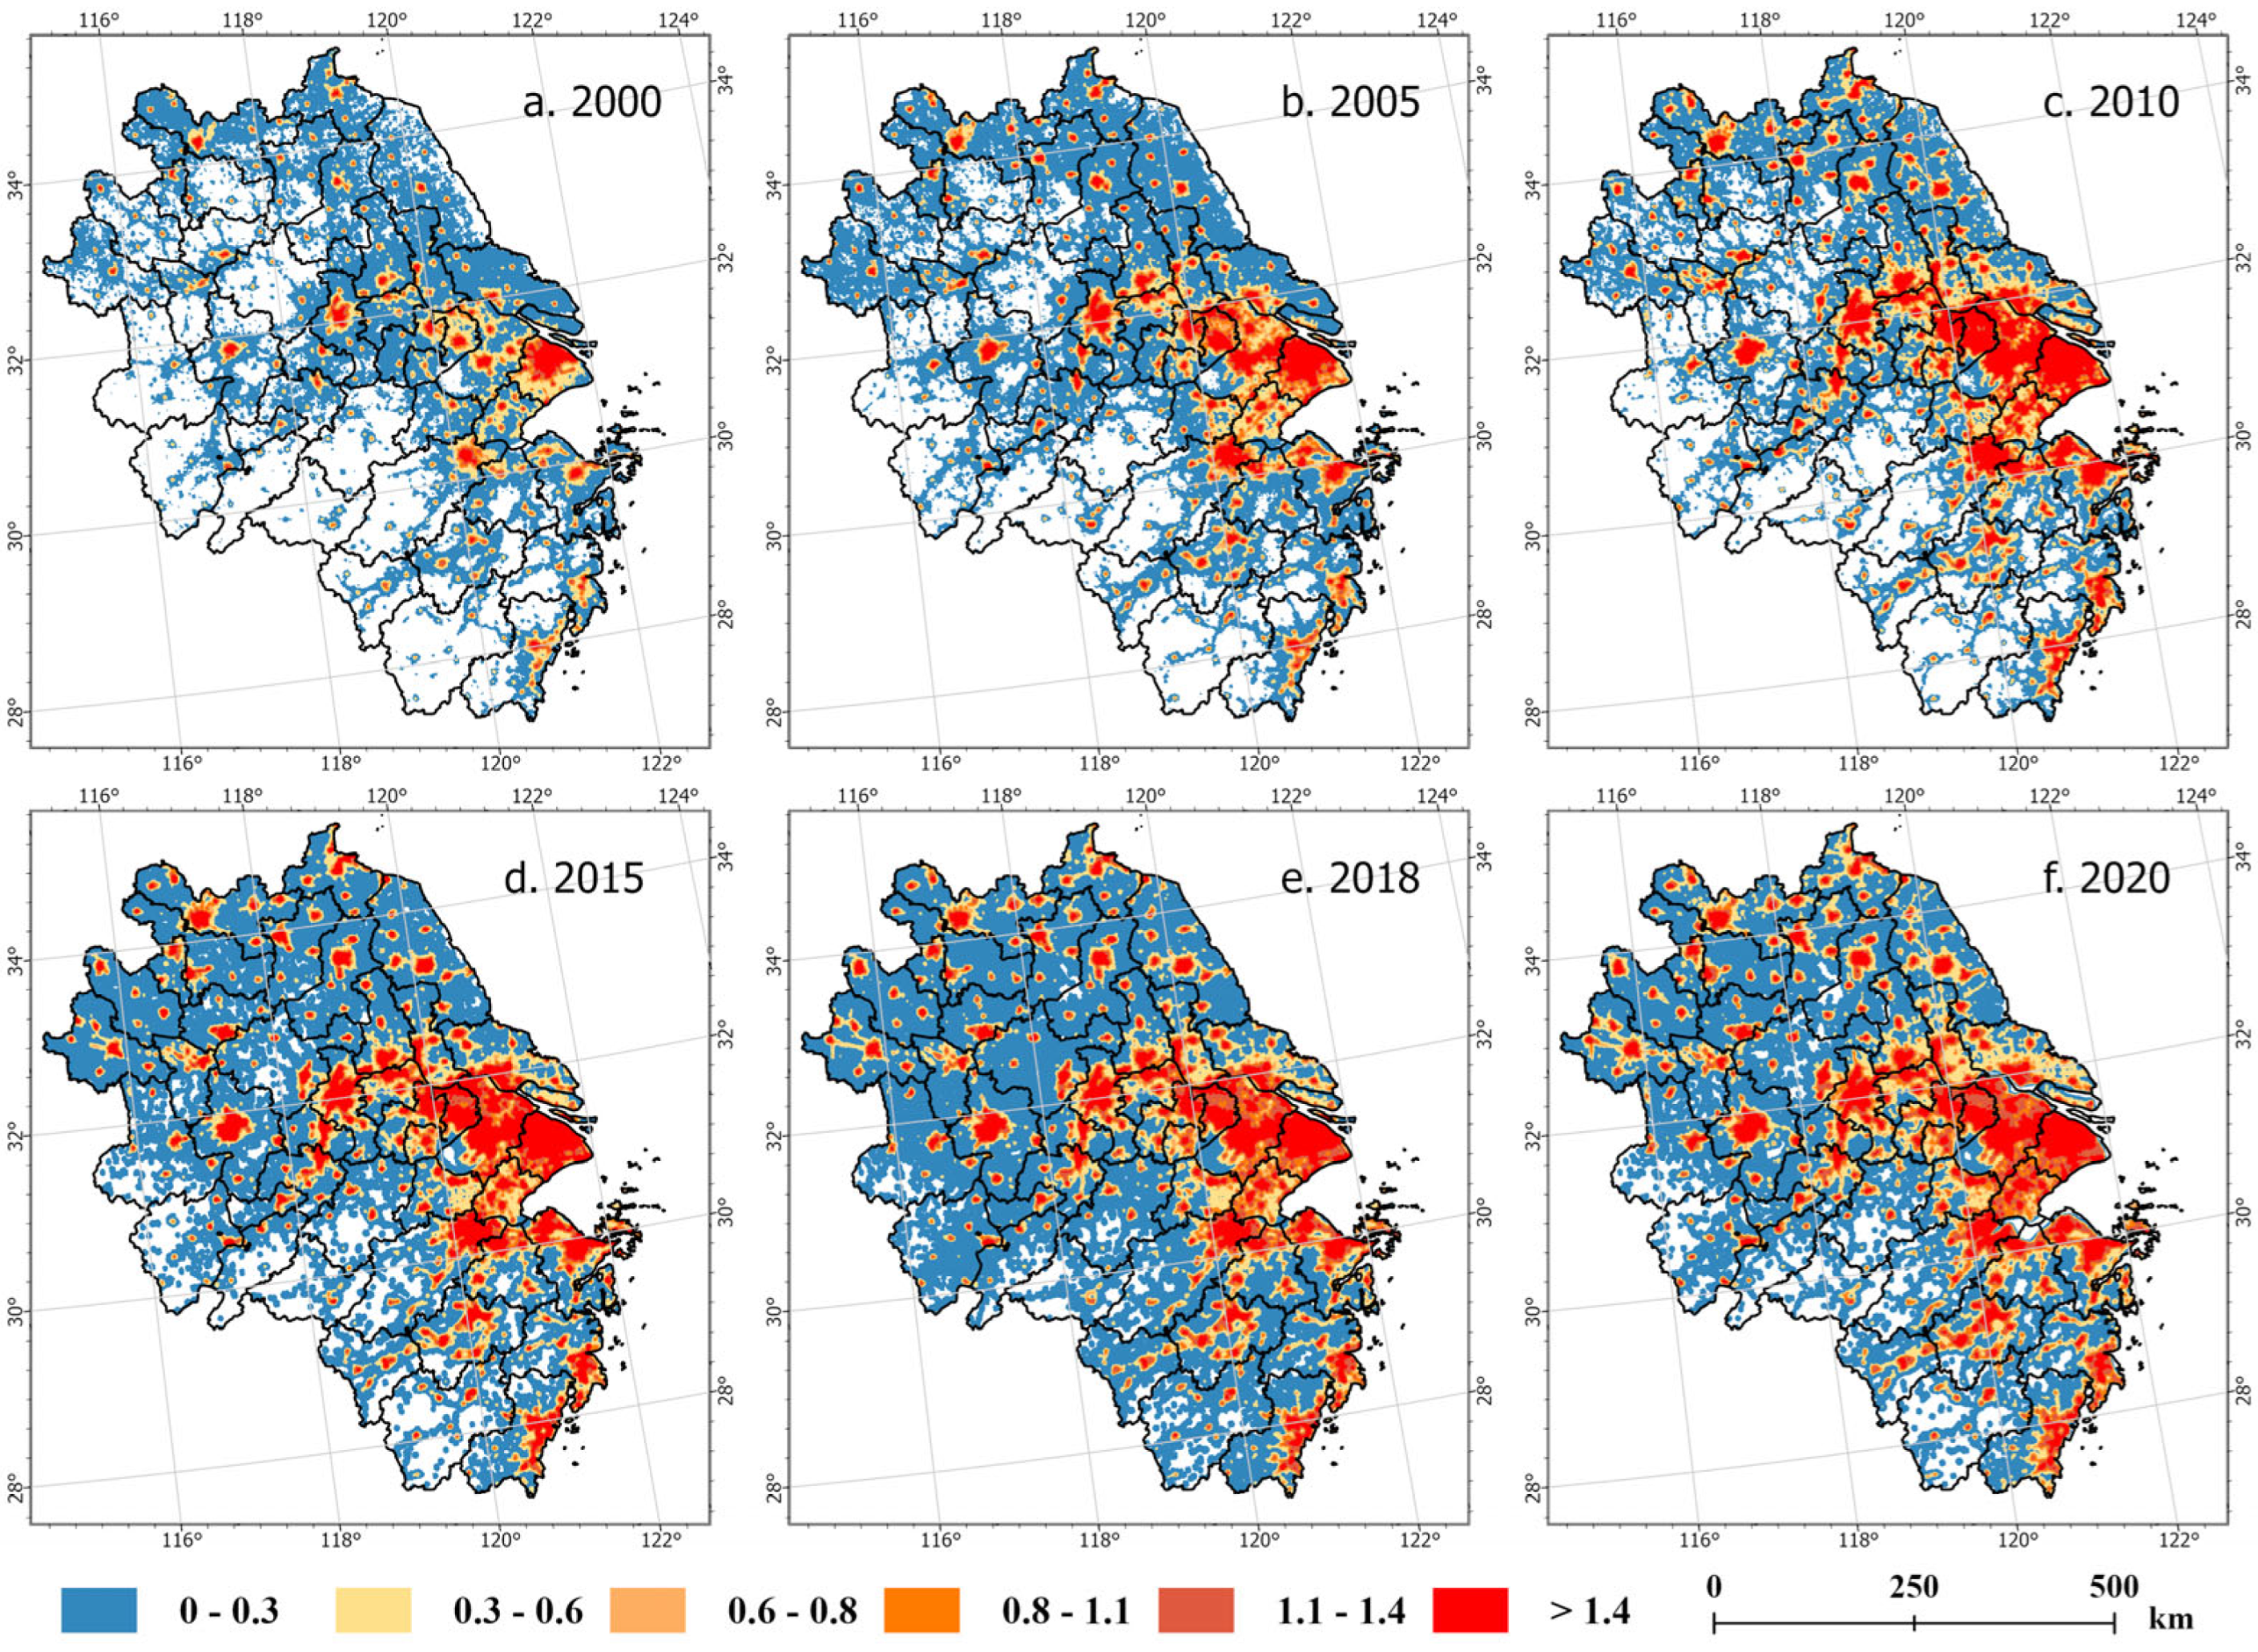
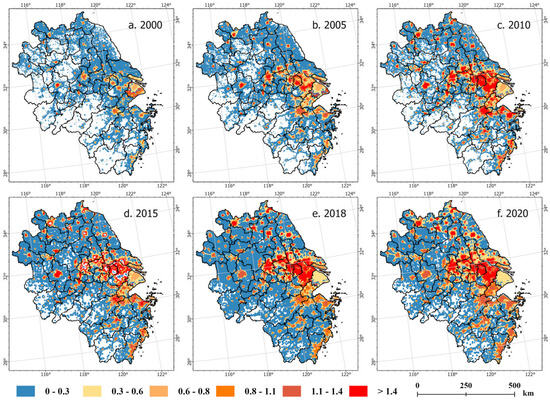
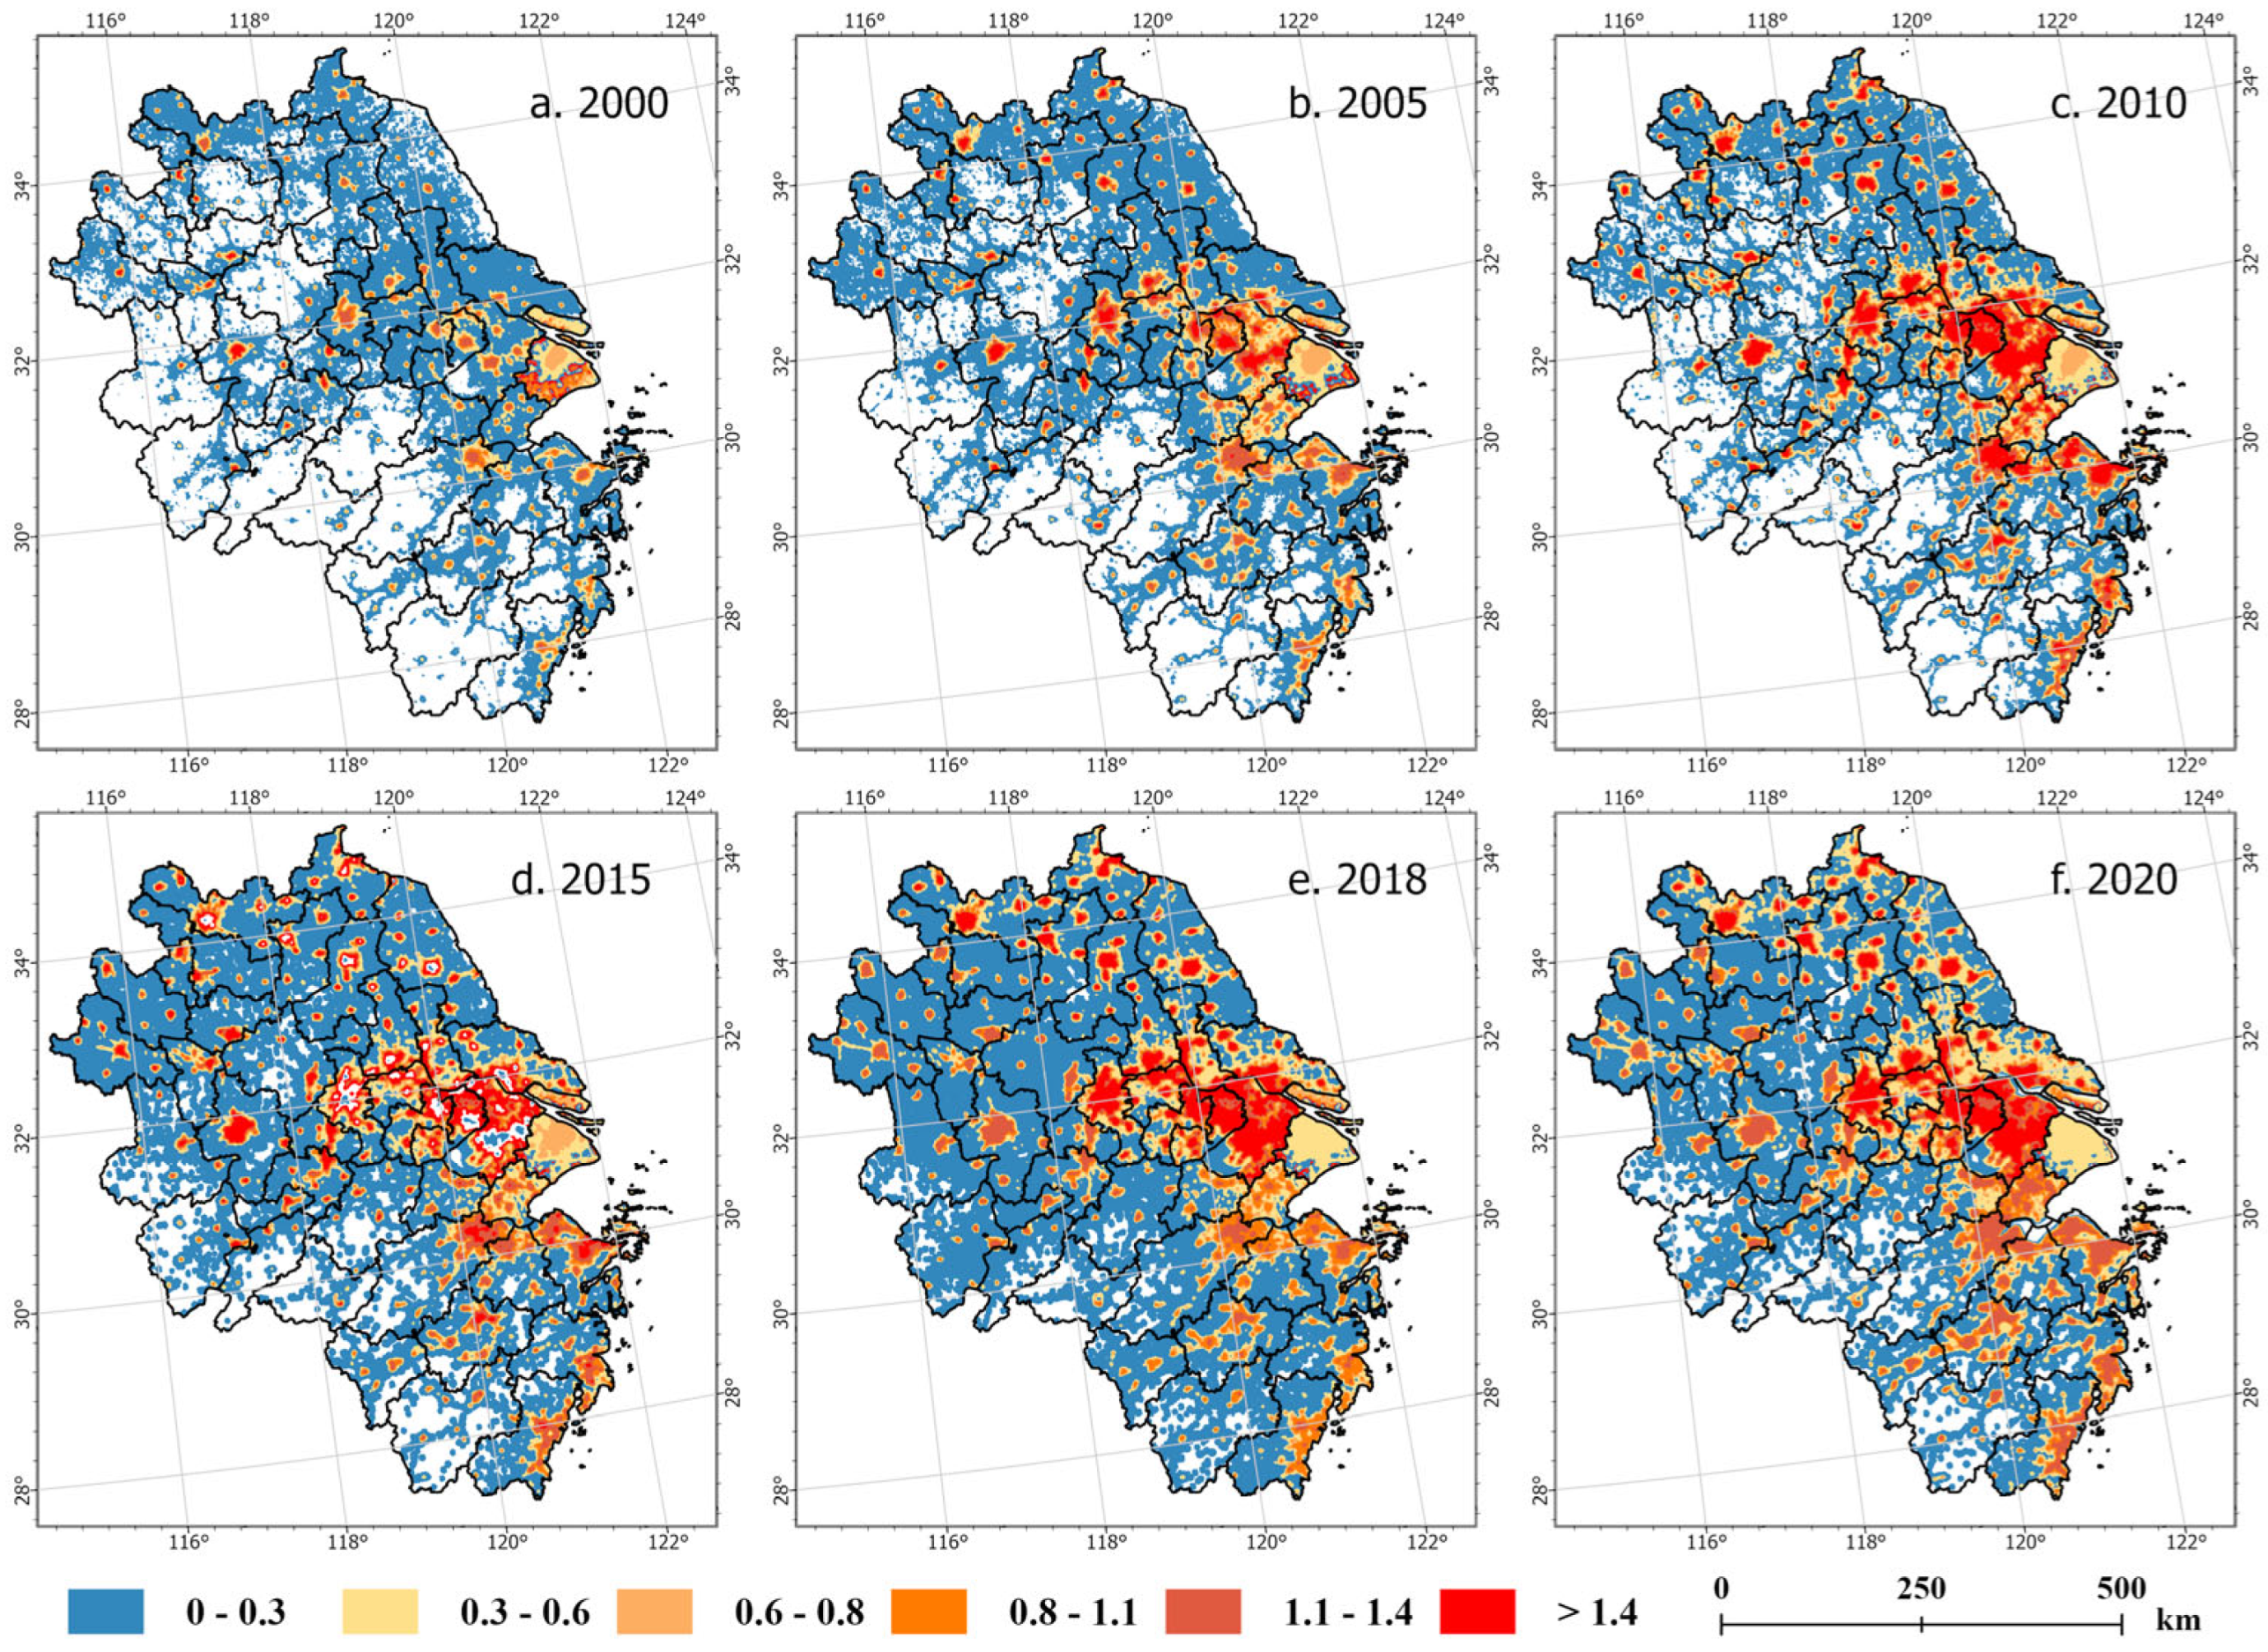
During 2000–2020, ECCEs in the YRD region exhibited a notable spatial agglomeration trend (Figure 7 and Figure 8). Over time, the ECCE intensity in the eastern coastal regions and the core area of the YRD region gradually increased, with high intensity primarily concentrated in Shanghai and its adjacent areas, developing a “multi-center networked” high-value distribution pattern centered on energy-intensive cities.
Figure 7.
Spatial simulation results of YRDEs in the YRD region from 2000 to 2020.
Figure 8.
Spatial simulation results of FPMEs in the YRD region from 2000 to 2020.
The spatial simulation results of YRDEs and FPMEs are broadly consistent. In 2000, the ECCE level in the YRD region was relatively low, with a limited spatial distribution range. Major cities such as Shanghai and Nanjing exhibited distinct high-CE cores with relatively high emission concentration; emissions in regions like Suzhou and Hangzhou were relatively concentrated, while peripheral areas had low emission levels and scattered distribution patterns. By 2005, along with rapid economic growth, the spatial range of ECCEs expanded significantly, particularly in core urban areas. High-density emission areas began to connect spatially, forming contiguous clusters. The high-emission zone centered on Shanghai expanded into southern Jiangsu and northern Zhejiang, extending progressively from southeast to northwest. Meanwhile, the emission zones of Nanjing and Suzhou merged, initially forming a localized high-value ECCE cluster in the YRD region. Despite the growth in ECCEs in places like Hangzhou and Wuxi, their emissions remained mainly characterized by local concentration and had not yet achieved full integration with neighboring regions. In 2010, the total ECCEs in the YRD region continued to rise, with the growth concentrated primarily in core cities. The number of high-CE centers was reduced to some extent, yet their coverage extended further, with more regions included in high-emission zones. The emission zones of Shanghai continued to expand toward the southeast and linked with southern Jiangsu and northern Zhejiang; the emission range of places like Nanjing and Suzhou continued to expand outward and gradually began to border neighboring regions; and the emission zones of Hangzhou and Wuxi continued to expand, initially exhibiting the characteristic of banded distribution. On the whole, the ECCE spatial pattern gradually evolved from a point-shaped structure to a combination of linear and banded structures, and the connectivity between regions was significantly improved. In 2015, ECCEs in the YRD region continued to grow, and the ECCE concentration of economic central cities (represented by Shanghai and Nanjing) intensified further. High-emission regions expanded outward with large cities as cores, forming a more complex ECCE network whose coverage extended to southern Jiangsu, northern Zhejiang, and other surrounding areas. In 2018, ECCEs were controlled to some extent, and their spatial distribution became more uniform; however, Shanghai and Nanjing remained emission cores, and the emission scope of other regions expanded. In 2020, the ECCE core areas of the YRD region contracted to some extent, but the diffusion trend persisted, eventually forming multi-level, high-density ECCE agglomeration areas. However, in Shanghai, significant differences were observed between FPME results and the surrounding simulated values in certain central areas in 2000, 2010, and 2020. We hypothesize that this is due to the inaccuracies of the applied local simulation formula.
3.3. Spatial Agglomeration Characteristics of ECCEs
According to Equation (4), the global Moran’s I index values of the YRD region and the corresponding Z and p values for YRDEs and FPMEs can be calculated (Table 5 and Table 6).
Table 5.
Global spatial autocorrelation analysis results of YRDEs in the YRD region from 2000 to 2020.
Table 6.
Global spatial autocorrelation analysis results of FPMEs in the YRD region from 2000 to 2020.
The results show that all p values of YRDEs and FPMEs in the YRD region from 2000 to 2020 are statistically significant at the 0.01 statistical confidence level, confirming that ECCEs in this region exhibit significant spatial correlation and clustering. The global Moran’s I presented in Table 5 and Table 6 is positive, indicating agglomeration in the spatial distribution of YRDEs and FPMEs in the YRD region. For YRDEs, this index increased from 0.259 in 2000 to 0.317 in 2006, then decreased year by year to 0.206 in 2014, and subsequently rose slowly to 0.230 in 2020, indicating an overall weakening trend in spatial correlation of ECCEs. The global Moran’s I for FPMEs declined from 0.448 in 2000 to 0.243 in 2014, rose slightly to 0.254 in 2016, and then fell again to 0.237 in 2020, indicating an overall weakening trend in spatial autocorrelation. This decline in global spatial autocorrelation indicates the spatial diffusion of ECCEs from core cities to peripheral areas. As emission sources disperse from concentrated cores, regional spatial structures become increasingly complex and mosaic-like, ultimately diminishing regional clustering intensity. To examine local spatial heterogeneity and the temporal evolution of high- and low-value clusters in YRDEs and FPMEs, we performed a hotspot analysis (Getis–Ord Gi*) to identify statistically significant hotspots and coldspots.
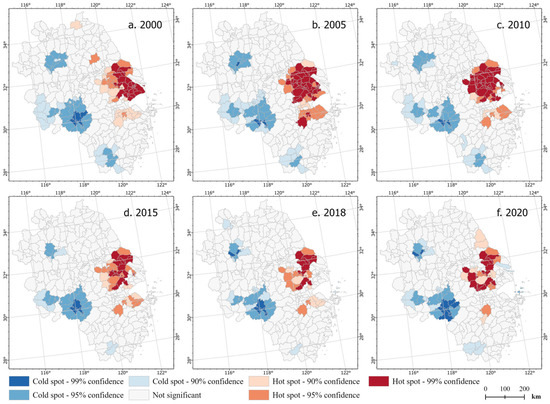
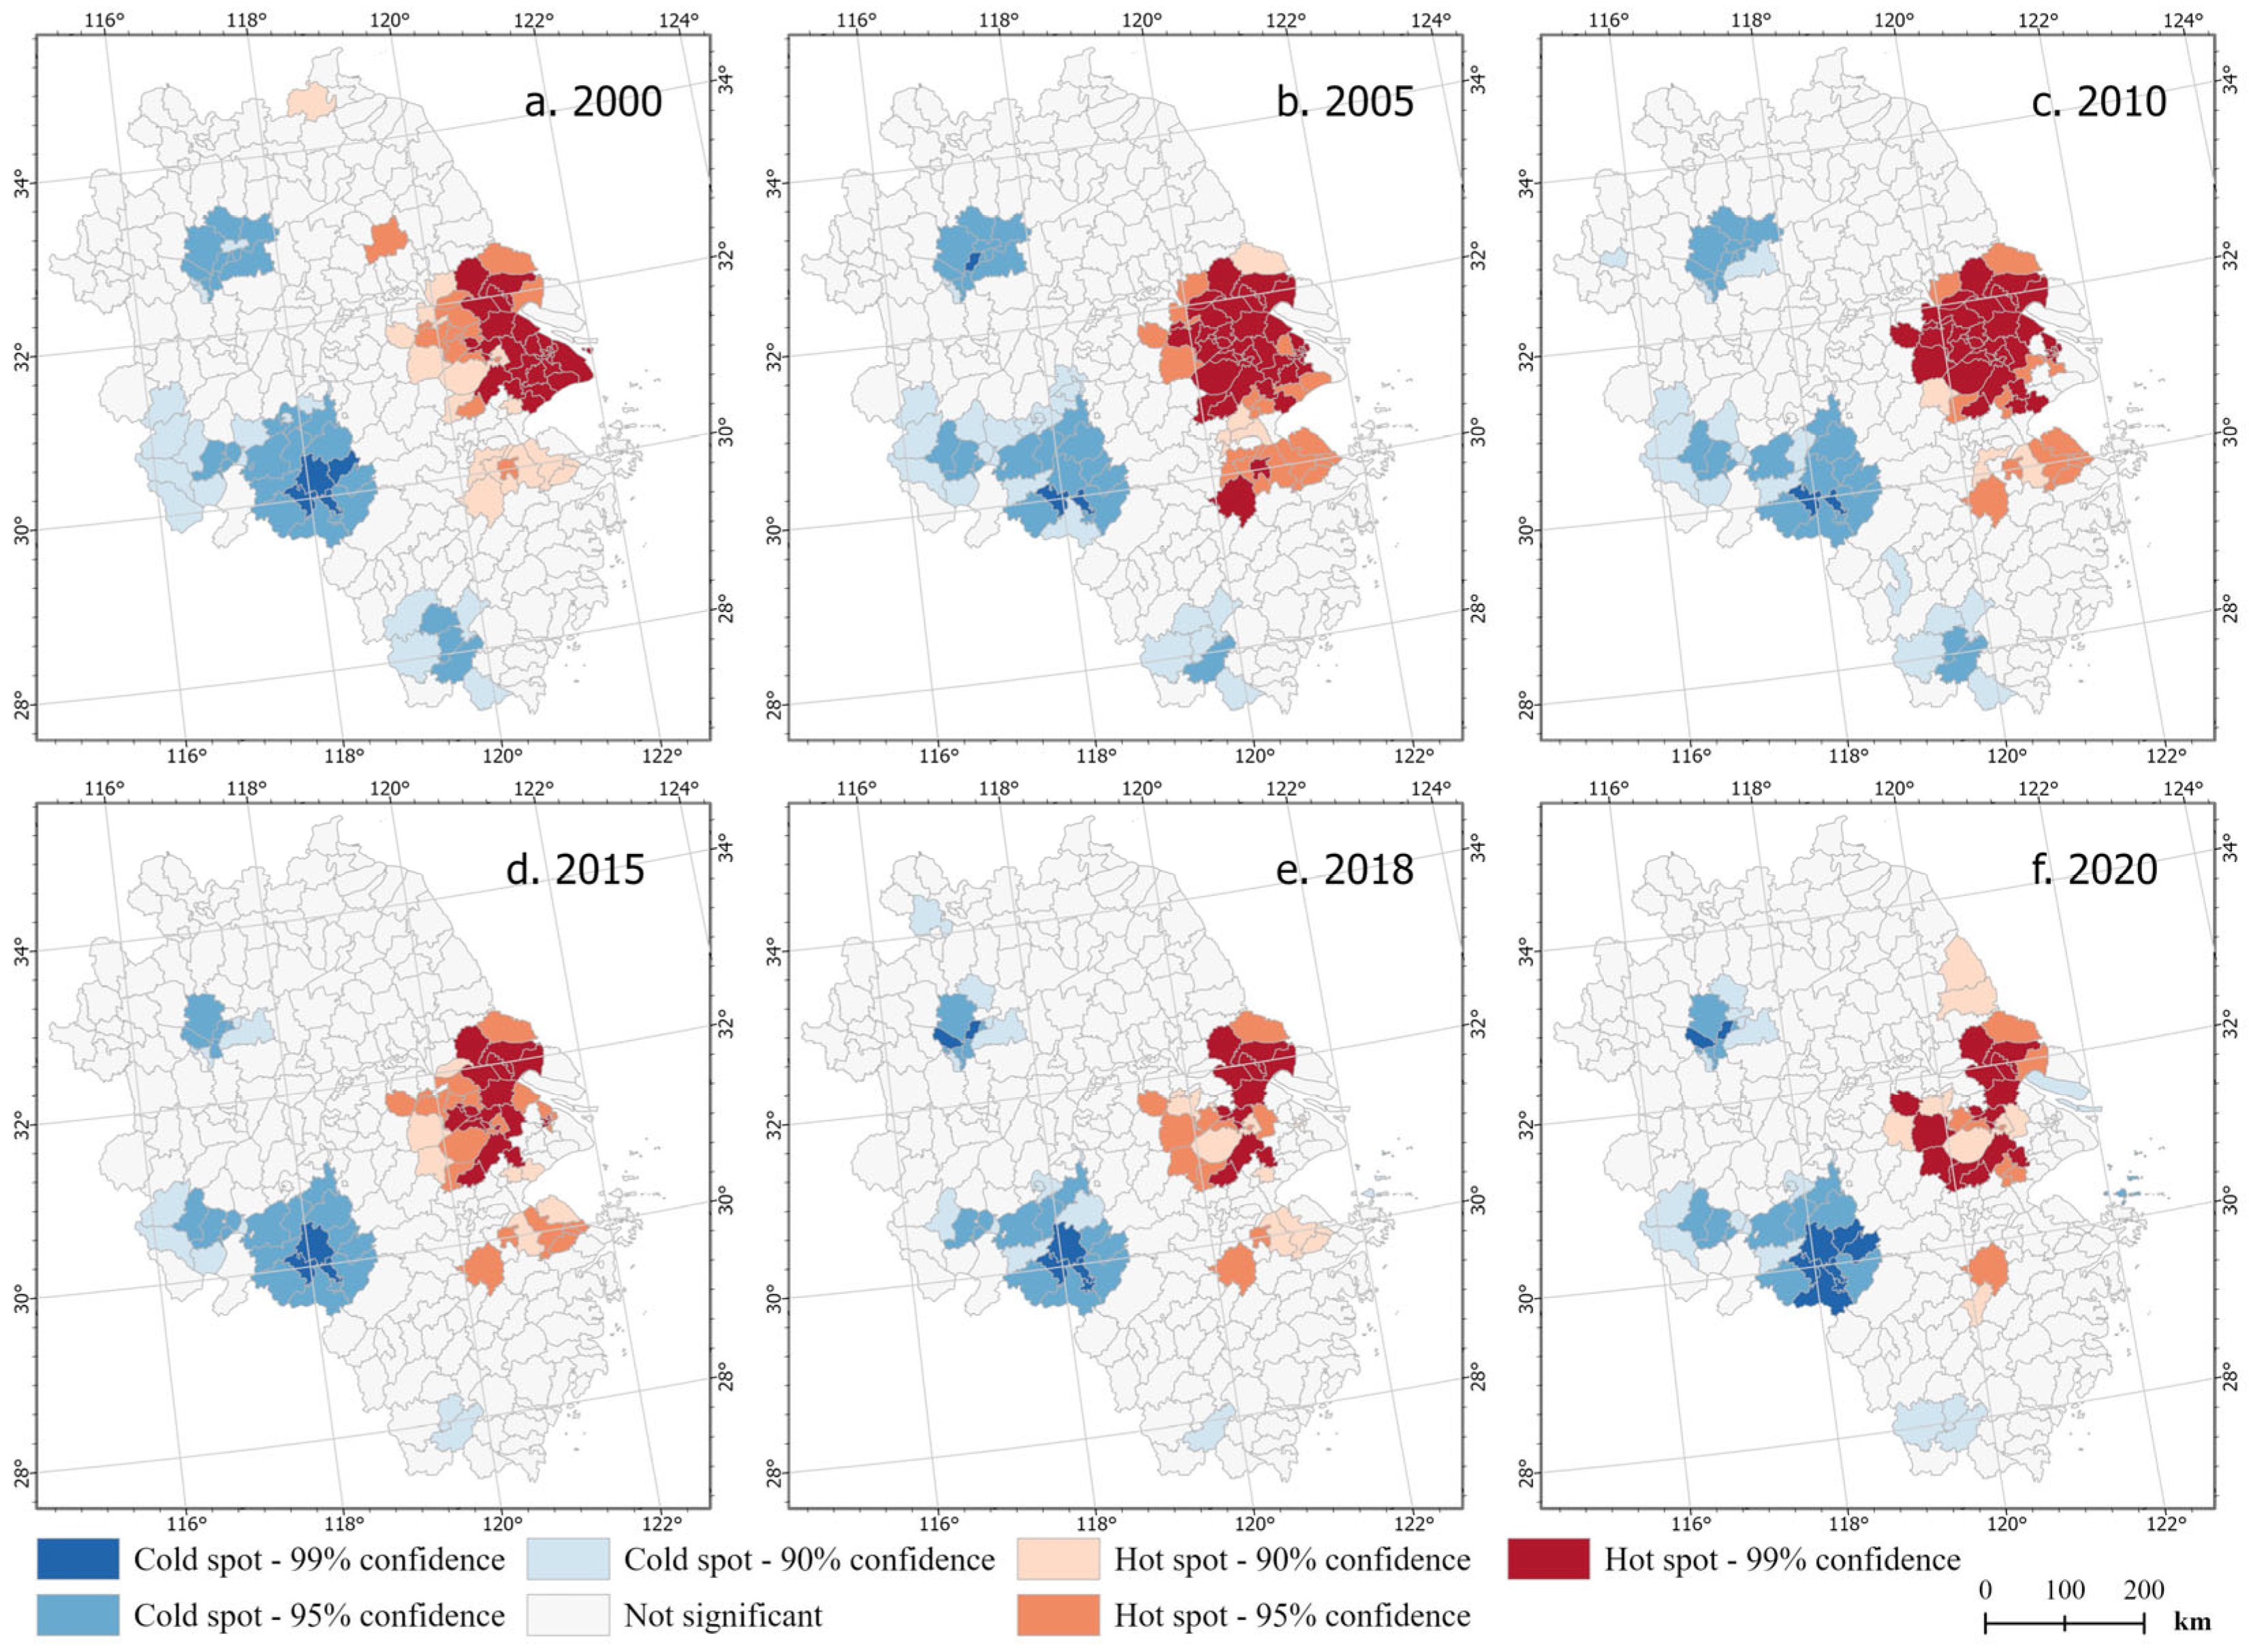
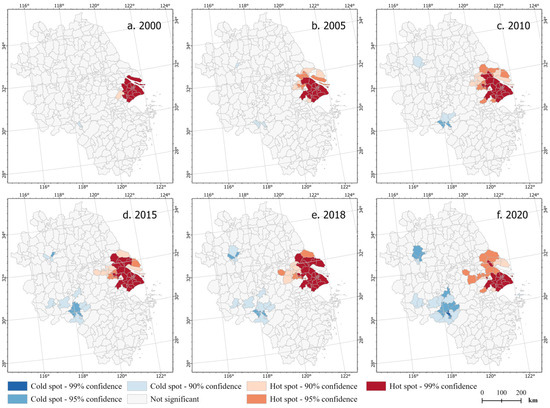
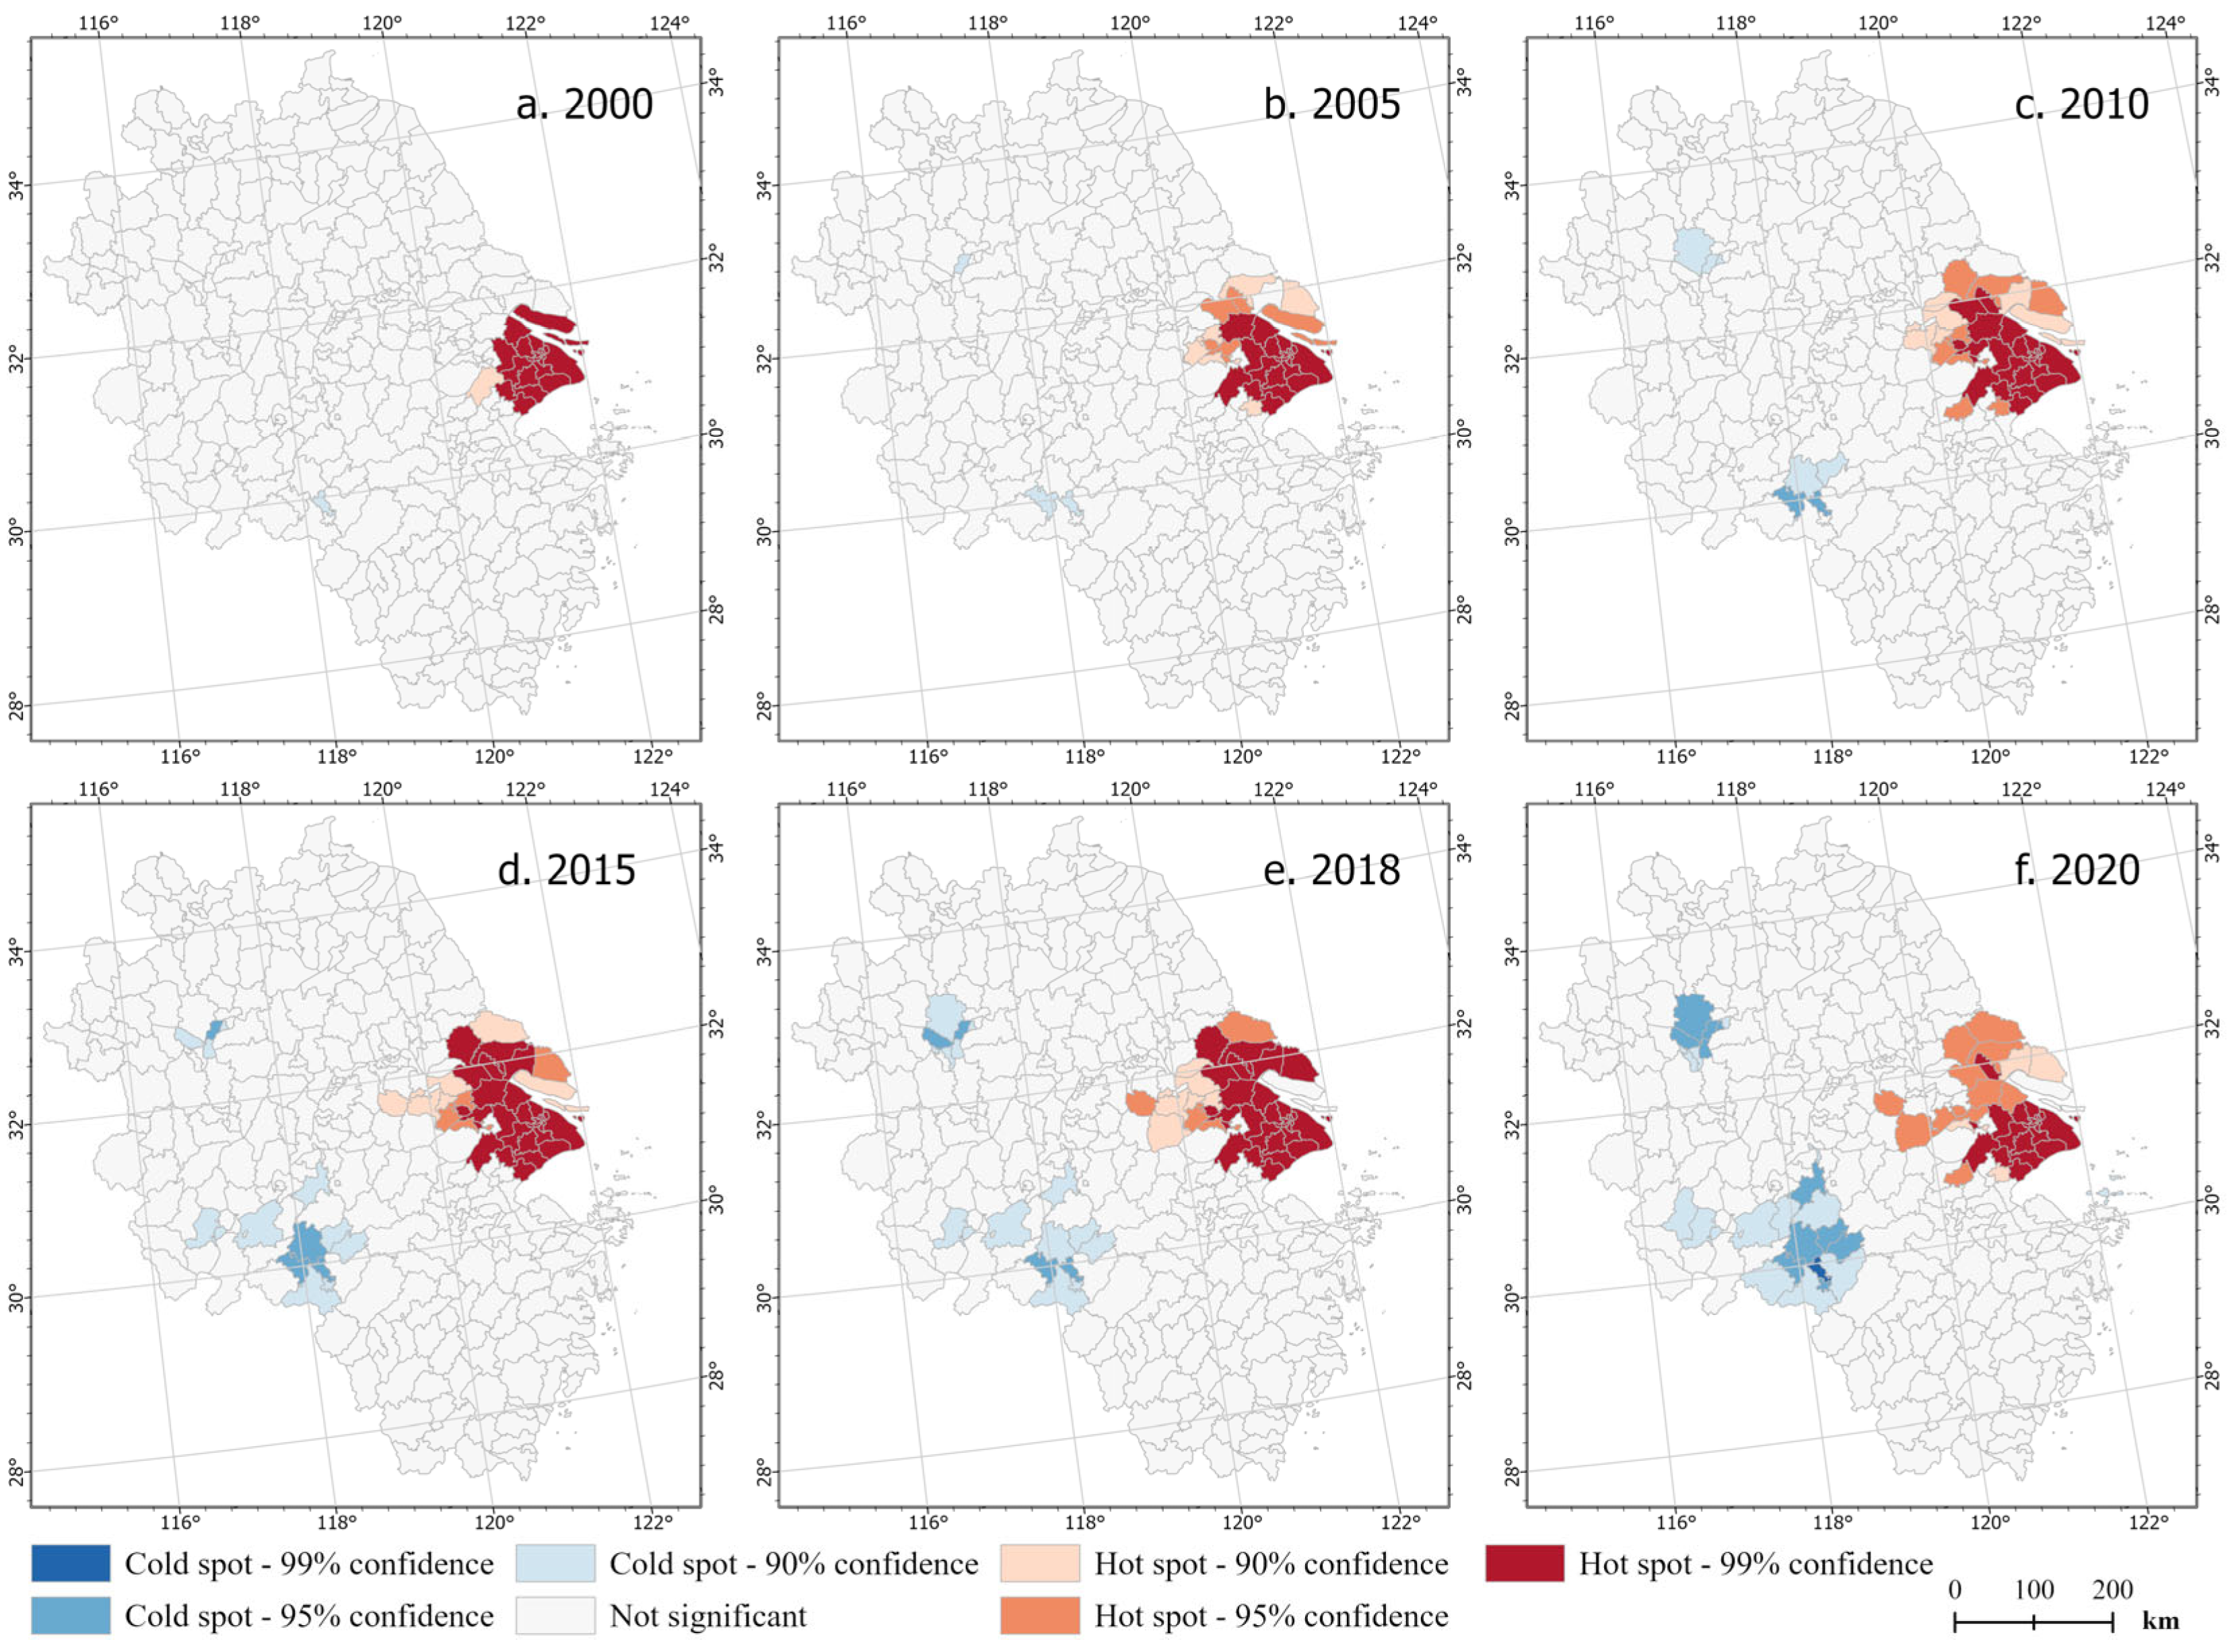
Cold- and hotspot analysis yields several key outputs, including Gi Z-scores, Gi p values, and Gi Bin values, while also revealing the degree of spatial concentration exhibited by ECCEs. Using the Spatial Statistics module tool in ArcGIS Pro 3.0.1, we mapped the spatial extent of statistically significant hotspots and coldspots for both YRDEs and FPMEs across the YRD region (Figure 9 and Figure 10).
Figure 9.
Results of cold- and hotspot analysis on YRDEs in the YRD region from 2000 to 2020.
Figure 10.
Results of cold- and hotspot analysis on FPMEs in the YRD region from 2000 to 2020.
Overall, from 2000 to 2020, YRDEs in the YRD region experienced significant changes while maintaining relatively high spatial stability. Hotspots were mainly concentrated in the eastern coastal economic core areas, centered on Shanghai, connecting the adjacent areas of southern Jiangsu and northern Zhejiang, and forming a “Z”-shaped, multi-center networked high-value pattern. This transition from a monocentric to a polycentric grid structure corroborates the observed annual decline in global Moran’s I. Specifically, the emergence of multiple emission centers diminishes global spatial autocorrelation relative to a single dominant core. These regions, represented by cities such as Shanghai, Suzhou, Nanjing, and Hangzhou, exhibited significant ECCE clustering, which intensified year by year. Coldspot regions were mainly distributed in some mountainous areas and ecological protection zones in the western YRD region, such as western Anhui, southern Anhui’s mountainous areas, and the ecological protection zones in southwestern Zhejiang. In terms of spatial extent, the area of coldspots decreased from 60,363.67 km2 in 2000 to 45,684.38 km2 in 2020, a decline of 24.32%. Similarly, the total area of hotspots contracted from 45,853.12 km2 to 34,123.39 km2, representing a 25.58% decrease. This concurrent contraction implies that while emission intensities remain high, high-value clusters are becoming increasingly concentrated rather than expanding diffusely.
For FPMEs, a high level of spatial stability is also maintained. Hotspot distribution is more centered on Shanghai and extends to southern Jiangsu, forming a clustering effect that increases significantly annually. The main coldspot distribution is basically consistent with that of YRDEs, showing a trend of annual growth in regional area. Coldspots are concentrated in western and southern Anhui, with partial distribution in northern Anhui. Quantitatively, the spatial dynamics of FPMEs are notably more pronounced. The area of hotspots expanded from 11,236.52 km2 in 2000 to 26,029.66 km2 in 2020, a 131.65% increase, reflecting the rapid proliferation of high-value zones. Concurrently, the spatial extent of coldspots surged from a baseline of 418.46 km2 in 2000 to 26,567.27 km2 in 2020. While this constitutes a substantial 6248.88% rise, it primarily signals the emergence of distinct low-value zones in western and southern Anhui that were previously statistically insignificant.
3.4. Centroid Migration Characteristics
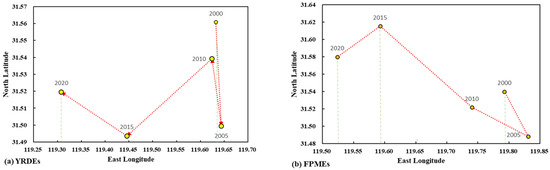
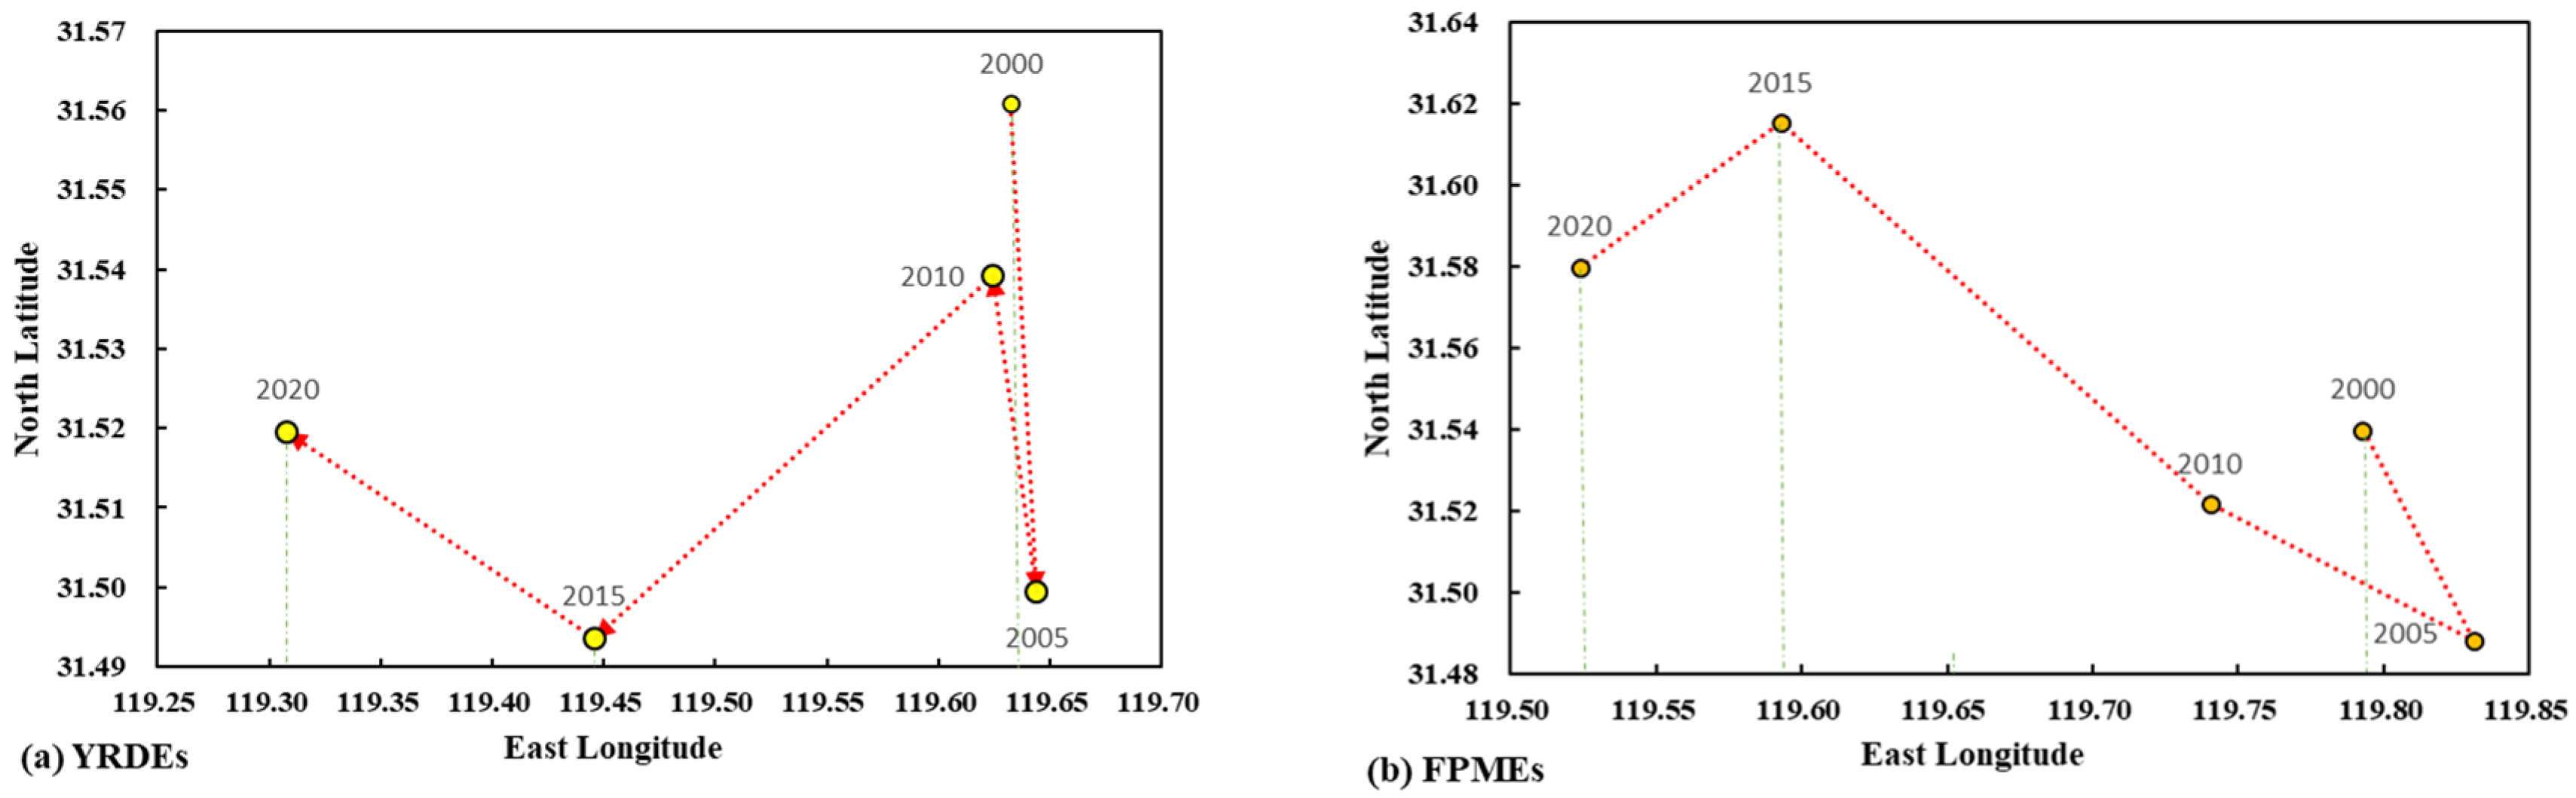
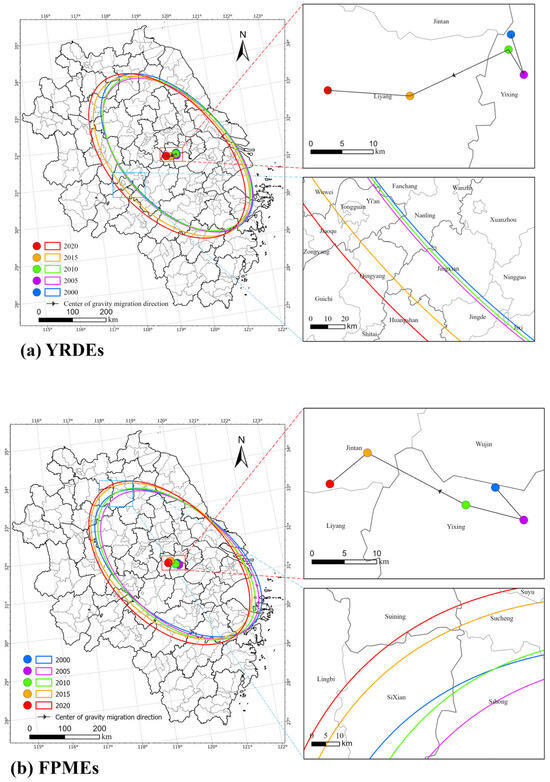
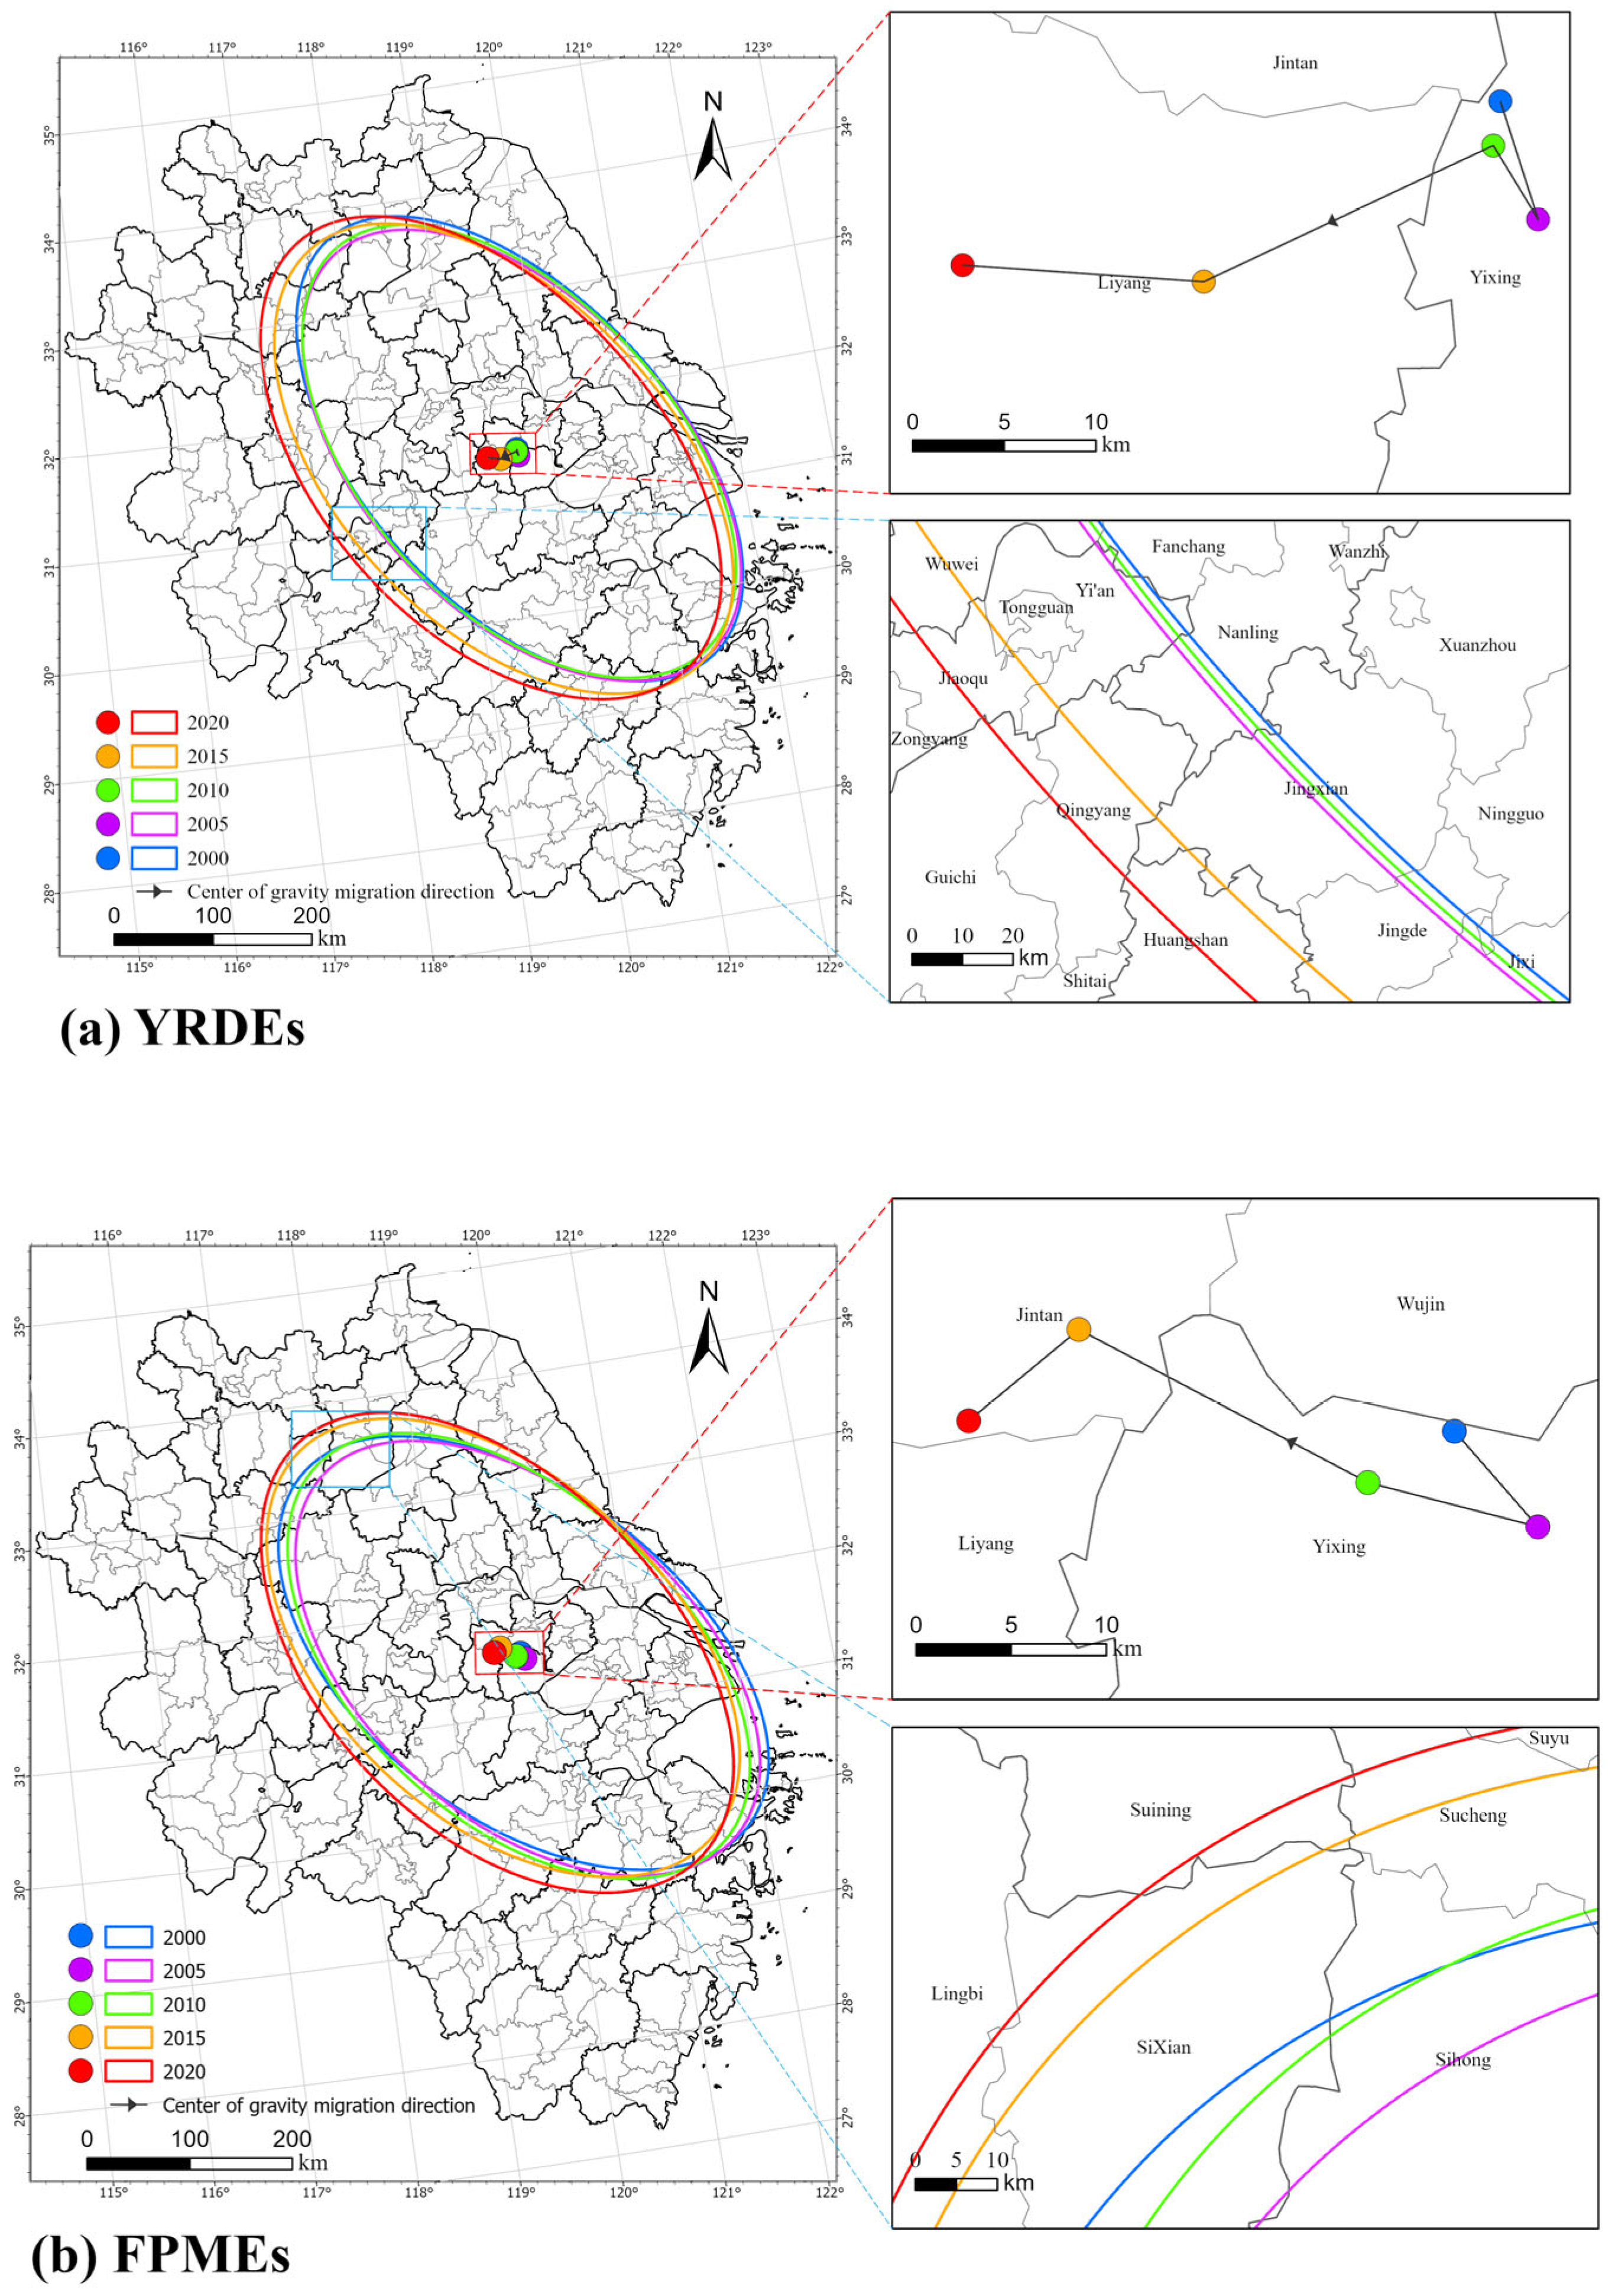
During 2000–2020, the trajectory of centroid migration (Figure 11) and the migration trend (Table 7 and Table 8; Figure 12) of YRDEs and FPMEs in the YRD region reveal the variations in the spatial distribution of ECCEs. The results indicate that both YRDEs and FPMEs effectively reflect the gradual expansion trend of ECCE coverage in the YRD region. In terms of the overall spatial pattern, YRDEs show an expansion trend from northeast to southwest, while FPMEs exhibit an expansion trend from southeast to northwest.
Figure 11.
Trajectory of ECCE centroid migration in the YRD region from 2000 to 2020. (a) YRDEs; (b) FPMEs.
Table 7.
SDE parameters of YRDEs in the YRD region from 2000 to 2020.
Table 8.
SDE parameters of FPMEs in the YRD region from 2000 to 2020.
Figure 12.
Development trend of ECCEs in the YRD region from 2000 to 2020. (a) YRDEs; (b) FPMEs.
From 2000 to 2020, the ECCE barycenters of both YRDEs and FPMEs underwent four shifts, with their spatial evolution characteristics as follows:
For YRDEs, the YRDE centroid in 2000 was located in Yixing City (under Wuxi City), Jiangsu Province (31.56° N, 119.63° E). In 2005 and 2010, despite minor shifts, the centroid remained in Yixing City (2005: 31.50° N, 119.64° E; 2010: 31.54° N, 119.62° E). In 2015, the YRDE centroid changed significantly, shifting to the southwest to Liyang City (under Changzhou City), Jiangsu Province (31.49° N, 119.45° E), moving a distance of 17.72 km. From 2000 to 2020, the total moving distance of the ECCE centroid in the YRD region was 42.80 km; of this total distance, the longitude showed a fluctuating westward movement, while the latitude exhibited a significant southward movement. The flattening ratio of the SDE decreased from 46.04% in 2000 to 42.38% in 2020, demonstrating that the directionality of YRDEs’ spatial distribution weakened to some extent, and the spatial pattern became more balanced.
For FPMEs, the FPME centroid in 2000 was located in Yixin City, Wuxi City, Jiangsu Province (31.54° N, 119.79° E). Although minor changes occurred in 2005 (31.49° N, 119.83° E) and 2010 (31.52° N, 119.74° E), the centroid remained within Yixing City. In 2015, the FPME centroid shifted significantly northwestward to Jintan District, Changzhou City, Jiangsu Province (31.62° N, 119.59° E), with a migration distance of 17.44 km. From 2015 to 2020 (31.58° N, 119.52° E), it moved southwestward and remained within Jintan District throughout the period. From 2000 to 2020, the total migration distance of the FPME centroid was 41.21 km: longitude first moved eastward and then continuously westward, while latitude showed a fluctuating northward trend. The major axis of the SDE increased by 4.87 km from 2000 to 2015, while the minor axis increased by 10.58 km over the same period. The flatness rate decreased from 43.12% to 40.35% by 2020. Changes in its spatial distribution directionality and spatial pattern evolution trend were consistent with those of YRDEs.
4. Discussion
4.1. Scale Dependency and Methodological Comparison
Both simulation results (YRDEs and FPMEs) demonstrate that ECCEs in the YRD region exhibited a consistent growth trend from 2000 to 2020, with a particularly rapid increase during 2000–2005. After 2014, the growth rate of ECCEs gradually slowed down and had stabilized by 2020. This change was closely related to China’s “dual carbon” goals proposed at the 2015 Paris Climate Conference and the 2020 Session of the United Nations General Assembly.
Despite exhibiting similar temporal trends, the two methods show significant discrepancies regarding provincial contributions (Figure 5) and spatial patterns (Figure 7, Figure 8, Figure 9 and Figure 10). These differences underscore the scale dependency inherent in CE simulation modeling.
First, concerning the regression mechanism, the global simulation assumes regional integration by applying a uniform coefficient across the entire region. This approach generates a “smoothing effect” that exaggerates polarization. As illustrated in Figure 9, YRDEs reveal significant “coldspots” in the mountainous areas of southwest Zhejiang. This anomaly arises because the global model is disproportionately influenced by high-intensity signals from Shanghai and southern Jiangsu. When less developed areas in Zhejiang are compared against this elevated regional baseline, they manifest statistically as extreme “coldspots.” In contrast, the regional simulation eliminates these statistical artifacts (Figure 10). By employing a separate regression for Zhejiang, the model identifies lower emissions in the southwest as consistent with the province’s internal baseline rather than as anomalies. Consequently, regional simulation corrects aggregation bias, thereby reflecting local conditions more accurately.
Second, the temporal trajectory of the global Moran’s I index for FPMEs quantitatively illustrates this structural shift, declining from 0.448 in 2000 to 0.237 in 2020. This significant decrease implies not a descent into chaotic development, but rather a transition from monocentric concentration to a polycentric, fragmented distribution pattern. In 2000, emissions were heavily concentrated in core cities such as Shanghai and Suzhou, creating large, contiguous high-value clusters characterized by high spatial autocorrelation. Over the subsequent two decades, rapid urbanization and industrial transfer facilitated the emergence of numerous county-level sub-centers and industrial parks throughout the region. This diffusion process fragmented the original large-scale clusters into smaller, localized hotspots, thereby diminishing global spatial autocorrelation. The lower Moran’s I observed in 2020 reflects this “multi-nucleation effect,” confirming that regional development has evolved toward a more balanced yet spatially discrete network, driven by the proliferation of small-to-medium-sized cities.
Therefore, this comparative analysis confirms that a global model is inadequate for developing urban agglomerations characterized by significant internal imbalances. By accounting for local heterogeneity, the regional simulation approach mitigates the overestimation of polarization (i.e., false coldspots) and provides a more precise basis for policymaking.
4.2. Cause Analysis
Following national initiatives, the YRD region has implemented clean energy strategies and achieved significant progress, particularly in electrifying public buildings and transportation systems. Despite the dominance of heavy chemical industries and substantial reliance on traditional fossil energy in the YRD region, further reduction in ECCEs remains imperative. ECCEs in the YRD region were strongly correlated with economic development, population density, and industrial structure. Core cities such as Shanghai, Suzhou, and Nanjing exhibit high levels of industrialization, extreme population agglomeration, and intensive energy consumption, all of which drive elevated ECCEs. Owing to the concentration of energy-intensive industries, ECCEs in the Jiangsu and Zhejiang Provinces significantly exceed those in Shanghai municipality and Anhui Province. With ongoing urbanization, energy consumption in the construction, transportation, and industrial sectors continues to rise, thereby driving ECCEs upward. Furthermore, geographical disparities and uneven regional development have resulted in distinct spatial patterns of emissions: high-emission areas are primarily concentrated in Shanghai and its surrounding economic centers, whereas emissions in Anhui Province remain relatively low. Overall, the growth of ECCEs in the YRD region has been primarily driven by rapid economic development, industrial structure, population agglomeration, and reliance on fossil-based energy. It should be noted that, owing to the lack of fine-grained socioeconomic data (e.g., county-level GDP and industrial structure), this study primarily analyzes the driving factors from a qualitative perspective. Future research should seek to compile more granular data to enable quantitative attribution analyses, such as panel data regression, thereby further validating the mechanisms identified herein.
4.3. Regional CE Reduction Strategy
During the study period, hotspots of ECCEs in Jiangsu Province were mainly concentrated in Nanjing, Suzhou, and Wuxi. These cities possess thriving manufacturing and heavy chemical industries, leading to substantial energy consumption and elevated ECCEs. By contrast, low-carbon areas in Jiangsu Province were mainly located in Huai’an and Suqian, where economic activities remain less developed and energy consumption is correspondingly low. Given these regional differences, tailored emission reduction strategies are recommended as follows: High-emission regions should promote the green and low-carbon transformation of traditional industries (e.g., iron and steel, petrochemical), strictly control coal consumption, and vigorously advance clean energy substitution (e.g., photovoltaic energy). Low-emission regions should prioritize environmental protection, green agriculture, and eco-tourism development. Additionally, the ECCE monitoring system should be strengthened, green technological innovation promoted, low-carbon lifestyles advocated, and economic growth decoupled from ECCEs.
High-ECCE zones in Zhejiang Province were centered on economically advanced cities including Hangzhou and Ningbo. Notably, in Hangzhou, the information technology and financial sectors drove the growth of energy demand. Low-ECCE areas were mainly distributed in the mountainous regions of Lishui City and Zhoushan City, where economic development was relatively lagging and ECCE levels were low. For high-value areas (i.e., in high-ECCE areas), it is necessary to vigorously develop low-energy-consuming industries such as the information technology and financial industries, strictly control coal consumption, and promote the green upgrading of modern service industries. Across the province, non-fossil energy sources such as photovoltaic (PV) and wind energy should be actively developed, the construction of a product carbon footprint management system should be accelerated, and the technological transformation of key industries for energy conservation and carbon reduction should be promoted. At the same time, it is necessary to improve the dual control system for energy consumption and ECCEs and use digital means to strengthen supervision efforts. For low-value areas (i.e., in low-ECCE areas), ecological protection should be strengthened, and green industries such as eco-tourism should be developed.
The high-ECCE zones in Anhui Province were primarily centered on Hefei and its peripheral industrial bases. As the provincial capital, Hefei served as an economic and technological hub with a large-scale manufacturing sector and substantial coal consumption, which led to relatively high ECCEs. Low-ECCE zones were mainly distributed in the southern Anhui mountainous areas and remote agricultural regions, where energy consumption was relatively low and ECCE levels were low. To reduce regional differences in ECCEs in Anhui Province, for Hefei and its surrounding industrial high-ECCE areas, strict control should be imposed on coal consumption; the green transformation of high-energy-consuming industries (e.g., iron and steel, the chemical industry) should be promoted; new energy sources such as photovoltaic (PV) energy should be vigorously developed; and innovative mechanisms (e.g., carbon credits in industrial parks) should be explored and promoted. For low-ECCE zones such as southern Anhui’s mountainous areas and remote agricultural regions, ecological protection should be strengthened; forest carbon sinks should be consolidated; green industries including eco-agriculture and tourism should be developed; and the value of ecological products should be realized. The whole province needs to synergistically promote the optimization of the industrial structure, the clean transition of the energy structure, and the enhancement of ecological carbon sinks.
The high-ECCE areas in Shanghai were mainly distributed in bustling urban districts including Pudong New District and Huangpu District. As an international metropolis, Shanghai’s energy consumption mainly came from the secondary and tertiary industries, especially heavy chemical industries and high-end manufacturing. In contrast, low-ECCE areas were relatively few and mainly distributed in areas with high green coverage, such as Shanghai’s suburban areas. The main urban areas of Shanghai had high electricity consumption and relatively high ECCEs. These findings highlight the need to strengthen the supply of smart low-carbon energy and develop emergency backup and peak-shaving power sources, optimize population scale, and reduce carbon-intensive production. Furthermore, improving the efficiency of low-carbon transportation systems and building structures, such as “green buildings”, should be prioritized.
Furthermore, building on the identified “Z-shaped” high-emission cluster that spans Shanghai, Suzhou, Wuxi, Nanjing, Hangzhou, and Ningbo, we recommend establishing a trans-provincial collaborative governance mechanism. Specifically, such a mechanism would encompass three key components: first, a cross-boundary carbon quota trading system enabling high-emission cities within the “Z-shaped” belt to purchase quotas from ecological carbon-sink areas (e.g., southern Anhui and western Zhejiang); second, joint enforcement and monitoring in contiguous border zones; and third, a regional data-sharing platform underpinned by the high-resolution monitoring approach proposed in this study to support integrated decision-making under the YRD integration strategy.
4.4. Strengths and Limitations
According to the results of this study, the spatiotemporal simulation of ECCEs based on NTL data shows good applicability. In particular, the R2 of YRDEs simulated by the global simulation method reaches 0.885, which is superior to that reported in previous studies [70]. Meanwhile, the spatial distribution and trend of FPMEs simulated via the regional simulation method are mostly similar to those of YRDEs, with an average R2 of 0.781. This indicates that the simulation results are highly reliable. In terms of total ECCEs, the YRD region shows a sustained growth trend, while its growth rate generally fluctuates downward. This trend is slightly different from the results reported in previous studies [14], which adopted multi-scale data analysis methods. In terms of spatial distribution, from 2000 to 2020, the spatial pattern of ECCEs in the YRD region gradually evolved from three primary centers centered on Shanghai, Nanjing, and Hangzhou into a “multi-center networked” spatial structure. Prior studies had confirmed the existence of ECCE spatial agglomeration in the YRD region at the national macro scale [14]; however, they had not fully revealed the internal details of the “multi-center networked” distribution pattern—particularly the evolution process from a point-like to a zonal pattern.
This methodological framework holds considerable potential for replication in other data-scarce regions and developing countries, such as Sub-Saharan Africa and Southeast Asia. To replicate this approach in such regions, planners would need to follow three practical steps: first, acquiring open-source NTL data (e.g., DMSP/OLS or NPP/VIIRS) to serve as the spatial proxy; second, collecting the finest available administrative energy statistics (e.g., at the national or provincial/county level) as control totals; and third, applying the calibration model proposed in this study to downscale these aggregate statistics into pixel-level estimates. The primary data requirement is the availability of reliable aggregate statistics for at least one administrative level; provided that this “top-down” constraint is met, the proposed method can effectively fill the data gap at lower administrative levels (e.g., municipalities or counties) where official records are unavailable.
Nevertheless, this study has several limitations that warrant further discussion. First, regarding the transferability discussed above, the relationship between NTL and carbon emissions may vary across climatic zones and development stages, necessitating local parameter recalibration rather than a direct transfer of coefficients. Second, scale effects, light diffusion, urban terrain, and differences in NTL data correction methods may all affect the extraction results of such data. Third, this study only estimates ECCEs based on limited types of fossil energy consumption and fails to cover other important ECCE sources, such as cement production and land use change. Fourth, the final calibration step employs a proportional adjustment (Equation (3)) rather than more advanced spatially explicit approaches, such as geographically weighted regression (GWR). Although GWR is theoretically superior for capturing the spatial non-stationarity of the NTL-CE relationship, it requires a sufficient number of ground-truth sample points to robustly estimate local regression coefficients. In this study, however, reliable official energy statistics are available only at the provincial level, yielding too few samples to calibrate a stable GWR model at finer scales. Moreover, the proportional adjustment acts as a top-down constraint, ensuring exact statistical consistency between the disaggregated pixel-level estimates and the official provincial energy balance tables—a property particularly important for policy applications under China’s “dual carbon” framework. Future research should explore GWR or other spatially varying coefficient models as more granular sub-provincial energy data become available.
Future studies should incorporate multi-source data, including points of interest (POIs), land use data, and high-resolution remote sensing imagery, to more accurately characterize the spatial distribution of ECCEs at finer scales. Future research could integrate external environmental policy constraints to simulate ECCEs under multiple scenarios, thereby enhancing simulation accuracy and providing robust support for China’s “dual carbon” (carbon peaking and carbon neutrality) goals. For other countries with less complete ECCE inventories, the methodological framework presented here can be locally calibrated, and regional joint monitoring networks established, to address data gaps and facilitate emission reduction efforts.
5. Conclusions
Regression analysis of long-term time-series NTL data (1992–2020) and provincial energy consumption statistics reveals a strong correlation between ECCEs and NTL intensity in the YRD region. It should be noted that the final product of this study is a spatial downscaling of statistical data based on NTL data, rather than an independent emission estimate. The global simulation method yields an R2 of 0.885, an MRE of 9.37%, and an RMSE of 169 million tons for the YRD region.
For the regional simulation method, the R2 and corresponding errors are as follows: Shanghai (R2 = 0.834, MRE = 4.38%, RMSE = 15 million tons), Jiangsu Province (R2 = 0.886, MRE = 15.03%, RMSE = 82 million tons), Zhejiang Province (R2 = 0.708, MRE = 13.77%, RMSE = 58 million tons), and Anhui Province (R2 = 0.695, MRE = 17.32%, RMSE = 63 million tons). Both models demonstrate high precision, ensuring the credibility of the results. Notably, comparative analysis reveals that NTL-based emission modeling is inherently scale-dependent. The global simulation applies a uniform coefficient across the entire region, which generates a “smoothing effect” that exaggerates spatial polarization and produces statistical artifacts, such as false “coldspots,” in less developed areas like southwest Zhejiang. In contrast, the regional simulation employs province-specific regressions, which effectively eliminates aggregation bias and more accurately reflects local emission conditions. Therefore, for urban agglomerations with significant internal developmental imbalances, the regional simulation provides more precise and policy-relevant spatial representations. The main findings of this study are as follows:
- From 2000 to 2020, ECCEs in the YRD region continued to grow, as demonstrated by the values in 2000 (YRDEs: 707 million tons; FPMEs: 703 million tons) and those in 2020 (YRDEs: 2176 million tons; FPMEs: 2163 million tons). The annual growth rate rose rapidly from 2001 (YRDEs: 3.16%; FPMEs: 3.15%) to 2005 (YRDEs: 17.51%; FPMEs: 17.56%), and then began to fluctuate downward, with the average growth rate dropping significantly during 2014–2020 (YRDEs: 1.45%; FPMEs: 1.47%). Specifically, there was a slowdown in growth after 2014.
- From 2000 to 2020, ECCEs in the YRD region exhibited a distinct spatial distribution pattern characterized by “high in the east and low in the west, and core–periphery”. High-value areas were continuously concentrated in the Hangzhou Bay Rim region and the Shanghai–Nanjing–Hefei corridor, forming banded high-emission agglomeration zones; the hilly mountainous areas in southwestern Anhui and southwestern Zhejiang remained stable low-carbon zones. Spatially, the data showed a “multi-center networked” distribution pattern expanding from core cities to their surrounding areas.
- During 2000–2020, the global spatial positive correlation of ECCEs in the YRD region showed a year-by-year weakening trend, while the cold- and hotspot pattern remained generally stable. The results of both simulation methods reveal that hotspots continued to concentrate in the key regions of “Nanjing–Suzhou–Shanghai–Hangzhou”, and coldspots were stably distributed in southwestern Anhui. Notably, the coldspots of YRDEs were also distributed in southwestern Zhejiang. For YRDEs, the area of hotspots contracted from 45,853.12 km2 in 2000 to 34,123.39 km2 in 2020, representing a 25.58% decrease, while the area of coldspots decreased from 60,363.67 km2 to 45,684.38 km2, a decline of 24.32%. For FPMEs, the area of hotspots expanded from 11,236.52 km2 in 2000 to 26,029.66 km2 in 2020, a 131.65% increase, while the area of coldspots surged from a baseline of 418.46 km2 to 26,567.27 km2, a substantial 6248.88% rise. The major axis of the SDE consistently exhibited a “southeast–northwest” orientation; its rotation angle and flattening ratio both decreased, while the lengths of the major and minor axes increased. This indicates that the distribution range of ECCEs expanded, while the directionality tended to weaken.
In the future, the YRD region should establish a precision-based emission reduction system with zoning and classification: high-value areas (such as Shanghai, Nanjing, and Hangzhou) need to vigorously promote industrial upgrading and clean energy replacement, and establish a park-level carbon credit management mechanism; low-value areas (such as the hilly areas of western Anhui and western Zhejiang) should focus on developing ecological carbon sinks and green low-carbon industries, and prevent the transfer of high-carbon production capacity. Meanwhile, the YRD region should leverage its regional synergy advantages to jointly build a grid-based carbon monitoring platform and an inter-provincial carbon trading market; vigorously promote the construction of the Zero-Carbon Demonstration Zone along the G60 Science and Technology Innovation Corridor; and promote the transformation of the regional multi-center network structure toward a low-carbon development model by strengthening spatial management, control, and smart supervision.
Author Contributions
Conceptualization, X.Y.; methodology, X.Y.; software, X.Y.; validation, X.Y., Z.Y. and F.Y.; formal analysis, X.Y.; investigation, X.Y.; resources, X.Y.; data curation, X.Y. and Y.A.; writing—original draft preparation, X.Y.; writing—review and editing, F.Y.; visualization, X.Y.; supervision, F.Y.; project administration, F.Y.; funding acquisition, Z.Y. and F.Y. All authors have read and agreed to the published version of the manuscript.
Funding
This study was supported by the National Natural Science Foundation of China (Grant No. 42171079) and Guangxi Key Research and Development Plan Project (AB24010117).
Institutional Review Board Statement
Not applicable.
Informed Consent Statement
Not applicable.
Data Availability Statement
The data used in this study are derived from publicly available sources, including [nighttime light/energy statistics datasets, etc.]. Processed data supporting the findings of this study are available from the corresponding author upon reasonable request.
Conflicts of Interest
The authors declare no conflicts of interest. The funders had no role in the design of the study; in the collection, analyses, or interpretation of data; in the writing of the manuscript; or in the decision to publish the results.
References
- Nian, V.; Chou, S.K.; Su, B.; Bauly, J. Life cycle analysis on carbon emissions from power generation—The nuclear energy example. Appl. Energy 2014, 118, 68–82. [Google Scholar] [CrossRef] [Scilit]
- Liu, K.; Harrison, M.T.; Yan, H.; Liu, D.L.; Meinke, H.; Hoogenboom, G.; Wang, B.; Peng, B.; Guan, K.; Jaegermeyr, J.; et al. Silver lining to a climate crisis in multiple prospects for alleviating crop waterlogging under future climates. Nat. Commun. 2023, 14, 765. [Google Scholar] [CrossRef] [Scilit] [PubMed]
- Kammen, D.M.; Sunter, D.A. City-integrated renewable energy for urban sustainability. Science 2016, 352, 922–928. [Google Scholar] [CrossRef] [Scilit]
- Li, C.; Zuo, J.; Wang, Z.; Zhang, X. Production- and consumption-based convergence analyses of global CO2 emissions. J. Clean. Prod. 2020, 264, 121723. [Google Scholar] [CrossRef] [Scilit]
- Friedlingstein, P.; O’Sullivan, M.; Jones, M.W.; Andrew, R.M.; Hauck, J.; Olsen, A.; Peters, G.P.; Peters, W.; Pongratz, J.; Sitch, S.; et al. Global Carbon Budget 2020. Earth Syst. Sci. Data 2020, 12, 3269–3340. [Google Scholar] [CrossRef] [Scilit]
- Le Quéré, C.; Jackson, R.B.; Jones, M.W.; Smith, A.J.P.; Abernethy, S.; Andrew, R.M.; De-Gol, A.J.; Willis, D.R.; Shan, Y.; Canadell, J.G.; et al. Temporary reduction in daily global CO2 emissions during the COVID-19 forced confinement. Nat. Clim. Change 2020, 10, 647–653. [Google Scholar] [CrossRef] [Scilit]
- Stoddard, I.; Anderson, K.; Capstick, S.; Carton, W.; Depledge, J.; Facer, K.; Gough, C.; Hache, F.; Hoolohan, C.; Hultman, M.; et al. Three Decades of Climate Mitigation: Why Haven’t We Bent the Global Emissions Curve? Annu. Rev. Environ. Resour. 2021, 46, 653–689. [Google Scholar] [CrossRef] [Scilit]
- Höhne, N.; Gidden, M.J.; den Elzen, M.; Hans, F.; Fyson, C.; Geiges, A.; Jeffery, M.L.; Gonzales-Zuñiga, S.; Mooldijk, S.; Hare, W.; et al. Wave of net zero emission targets opens window to meeting the Paris Agreement. Nat. Clim. Change 2021, 11, 820–822. [Google Scholar] [CrossRef] [Scilit]
- Steffen, W.; Rockström, J.; Richardson, K.; Lenton, T.M.; Folke, C.; Liverman, D.; Summerhayes, C.P.; Barnosky, A.D.; Cornell, S.E.; Crucifix, M.; et al. Trajectories of the Earth System in the Anthropocene. Proc. Natl. Acad. Sci. USA 2018, 115, 8252–8259. [Google Scholar] [CrossRef] [Scilit]
- Erickson, P.; Lazarus, M.; Piggot, G. Limiting fossil fuel production as the next big step in climate policy. Nat. Clim. Change 2018, 8, 1037–1043. [Google Scholar] [CrossRef] [Scilit]
- IPCC Intergovernmental Panel on Climate Change Data Distribution Centre. Available online: https://www.ipcc-data.org/ (accessed on 9 September 2025).
- Guan, D.; Liu, Z.; Geng, Y.; Lindner, S.; Hubacek, K. The gigatonne gap in China’s carbon dioxide inventories. Nat. Clim. Change 2012, 2, 672–675. [Google Scholar] [CrossRef] [Scilit]
- Zhang, Y.-J. The impact of financial development on carbon emissions: An empirical analysis in China. Energy Policy 2011, 39, 2197–2203. [Google Scholar] [CrossRef] [Scilit]
- Su, Y.; Chen, X.; Li, Y.; Liao, J.; Ye, Y.; Zhang, H.; Huang, N.; Kuang, Y. China’s 19-year city-level carbon emissions of energy consumptions, driving forces and regionalized mitigation guidelines. Renew. Sustain. Energy Rev. 2014, 35, 231–243. [Google Scholar] [CrossRef] [Scilit]
- Wang, P.-T.; Xu, Q.-C.; Wang, F.-Y.; Xu, M. Investigating the impacts of the Dual Carbon Targets on energy and carbon flows in China. Energy 2024, 313, 133778. [Google Scholar] [CrossRef] [Scilit]
- Shen, Z.; Xu, X. Influence of the Economic Efficiency of Built-Up Land (EEBL) on Urban Heat Islands (UHIs) in the Yangtze River Delta Urban Agglomeration (YRDUA). Remote Sens. 2020, 12, 3944. [Google Scholar] [CrossRef] [Scilit]
- Long, Z.; Zhang, Z.; Liang, S.; Chen, X.; Ding, B.; Wang, B.; Chen, Y.; Sun, Y.; Li, S.; Yang, T. Spatially explicit carbon emissions at the county scale. Resour. Conserv. Recycl. 2021, 173, 105706. [Google Scholar] [CrossRef] [Scilit]
- IPCC 2006 IPCC Guidelines for National Greenhouse Gas Inventories. Available online: https://www.ipcc-nggip.iges.or.jp/public/2006gl/index.html (accessed on 10 September 2025).
- Wu, P.; Song, Y.; Zhu, J.; Chang, R. Analyzing the influence factors of the carbon emissions from China’s building and construction industry from 2000 to 2015. J. Clean. Prod. 2019, 221, 552–566. [Google Scholar] [CrossRef] [Scilit]
- Zhou, Y.; Hu, D.; Wang, T.; Tian, H.; Gan, L. Decoupling effect and spatial-temporal characteristics of carbon emissions from construction industry in China. J. Clean. Prod. 2023, 419, 138243. [Google Scholar] [CrossRef] [Scilit]
- Li, R.; Li, L.; Wang, Q. The impact of energy efficiency on carbon emissions: Evidence from the transportation sector in Chinese 30 provinces. Sustain. Cities Soc. 2022, 82, 103880. [Google Scholar] [CrossRef] [Scilit]
- Ercan, T.; Onat, N.C.; Keya, N.; Tatari, O.; Eluru, N.; Kucukvar, M. Autonomous electric vehicles can reduce carbon emissions and air pollution in cities. Transp. Res. Part D Transp. Environ. 2022, 112, 103472. [Google Scholar] [CrossRef] [Scilit]
- Wang, Q.; Zhang, C.; Li, R. Towards carbon neutrality by improving carbon efficiency—A system-GMM dynamic panel analysis for 131 countries’ carbon efficiency. Energy 2022, 258, 124880. [Google Scholar] [CrossRef] [Scilit]
- Sun, Q.; Chen, H.; Long, R.; Zhang, J.; Yang, M.; Huang, H.; Ma, W.; Wang, Y. Can Chinese cities reach their carbon peaks on time? Scenario analysis based on machine learning and LMDI decomposition. Appl. Energy 2023, 347, 121427. [Google Scholar] [CrossRef] [Scilit]
- Kais, S.; Sami, H. An econometric study of the impact of economic growth and energy use on carbon emissions: Panel data evidence from fifty eight countries. Renew. Sustain. Energy Rev. 2016, 59, 1101–1110. [Google Scholar] [CrossRef] [Scilit]
- Li, Y.; Chen, Y.; Wang, Y. Grey forecasting the impact of population and GDP on the carbon emission in a Chinese region. J. Clean. Prod. 2023, 425, 139025. [Google Scholar] [CrossRef] [Scilit]
- Ben Amara, D.; Qiao, J.; Zada, M. How to reconcile the climate change issue with economic growth? Spatial dual mediating effects of carbon emissions and foreign investment. J. Clean. Prod. 2023, 411, 137285. [Google Scholar] [CrossRef] [Scilit]
- Wang, Q.; Li, L.; Li, R. Uncovering the impact of income inequality and population aging on carbon emission efficiency: An empirical analysis of 139 countries. Sci. Total Environ. 2023, 857, 159508. [Google Scholar] [CrossRef] [Scilit]
- Qiao, R.; Liu, X.; Gao, S.; Liang, D.; GesangYangji, G.; Xia, L.; Zhou, S.; Ao, X.; Jiang, Q.; Wu, Z. Industrialization, urbanization, and innovation: Nonlinear drivers of carbon emissions in Chinese cities. Appl. Energy 2024, 358, 122598. [Google Scholar] [CrossRef] [Scilit]
- Qiao, R.; Zhao, Z.; Wu, T.; Zhou, S.; Ao, X.; Yang, T.; Liu, X.; Liu, Z.; Wu, Z. Unveiling the nonlinear drivers of urban land resources on carbon emissions: The mediating role of industrial upgrading and technological innovation. Resour. Conserv. Recycl. 2025, 212, 108000. [Google Scholar] [CrossRef] [Scilit]
- Murshed, M.; Ahmed, Z.; Alam, M.S.; Mahmood, H.; Rehman, A.; Dagar, V. Reinvigorating the role of clean energy transition for achieving a low-carbon economy: Evidence from Bangladesh. Environ. Sci. Pollut. Res. 2021, 28, 67689–67710. [Google Scholar] [CrossRef] [Scilit]
- Wang, M.; Cai, B. A two-level comparison of CO2 emission data in China: Evidence from three gridded data sources. J. Clean. Prod. 2017, 148, 194–201. [Google Scholar] [CrossRef] [Scilit]
- Cai, B.; Cui, C.; Zhang, D.; Cao, L.; Wu, P.; Pang, L.; Zhang, J.; Dai, C. China city-level greenhouse gas emissions inventory in 2015 and uncertainty analysis. Appl. Energy 2019, 253, 113579. [Google Scholar] [CrossRef] [Scilit]
- Shan, Y.; Guan, D.; Liu, J.; Mi, Z.; Liu, Z.; Liu, J.; Schroeder, H.; Cai, B.; Chen, Y.; Shao, S.; et al. Methodology and applications of city level CO2 emission accounts in China. J. Clean. Prod. 2017, 161, 1215–1225. [Google Scholar] [CrossRef] [Scilit]
- Henderson, J.V.; Storeygard, A.; Weil, D.N. Measuring Economic Growth from Outer Space. Am. Econ. Rev. 2012, 102, 994–1028. [Google Scholar] [CrossRef] [Scilit] [PubMed]
- Mellander, C.; Lobo, J.; Stolarick, K.; Matheson, Z. Night-Time Light Data: A Good Proxy Measure for Economic Activity? PLoS ONE 2015, 10, e0139779. [Google Scholar] [CrossRef] [Scilit] [PubMed]
- Xiao, H.; Ma, Z.; Mi, Z.; Kelsey, J.; Zheng, J.; Yin, W.; Yan, M. Spatio-temporal simulation of energy consumption in China’s provinces based on satellite night-time light data. Appl. Energy 2018, 231, 1070–1078. [Google Scholar] [CrossRef] [Scilit]
- Levin, N.; Duke, Y. High spatial resolution night-time light images for demographic and socio-economic studies. Remote Sens. Environ. 2012, 119, 1–10. [Google Scholar] [CrossRef] [Scilit]
- Shi, K.; Yu, B.; Huang, Y.; Hu, Y.; Yin, B.; Chen, Z.; Chen, L.; Wu, J. Evaluating the Ability of NPP-VIIRS Nighttime Light Data to Estimate the Gross Domestic Product and the Electric Power Consumption of China at Multiple Scales: A Comparison with DMSP-OLS Data. Remote Sens. 2014, 6, 1705–1724. [Google Scholar] [CrossRef] [Scilit]
- Yu, T.; Liu, C.; Akbar, A.; Liu, Y.; Li, W.; Wu, H.; Huang, W. Reconnecting the 30-Year Timeline (1992–2023): Constructing a Consistent Global 500-m NTL Dataset Using Super-Resolution Reconstruction and Ground-Object Feature Constraints. IEEE Trans. Geosci. Remote Sens. 2025, 63, 5638021. [Google Scholar] [CrossRef] [Scilit]
- Elvidge, C.D.; Ghosh, T.; Baugh, K.; Zhizhin, M.; Hsu, F.-C.; Katada, N.S.; Penalosa, W.; Hung, B.Q. Rating the Effectiveness of Fishery Closures With Visible Infrared Imaging Radiometer Suite Boat Detection Data. Front. Mar. Sci. 2018, 5, 132. [Google Scholar] [CrossRef] [Scilit]
- Lv, Q.; Liu, H.; Wang, J.; Liu, H.; Shang, Y. Multiscale analysis on spatiotemporal dynamics of energy consumption CO2 emissions in China: Utilizing the integrated of DMSP-OLS and NPP-VIIRS nighttime light datasets. Sci. Total Environ. 2020, 703, 134394. [Google Scholar] [CrossRef] [Scilit]
- Chen, J.; Gao, M.; Cheng, S.; Hou, W.; Song, M.; Liu, X.; Liu, Y.; Shan, Y. County-level CO2 emissions and sequestration in China during 1997–2017. Sci. Data 2020, 7, 391. [Google Scholar] [CrossRef] [Scilit]
- Zhang, L.; Ren, Z.; Chen, B.; Gong, P.; Xu, B.; Fu, H. A Prolonged Artificial Nighttime-light Dataset of China (1984–2020). Sci. Data 2024, 11, 414. [Google Scholar] [CrossRef] [Scilit]
- Li, Y.; Wang, S. Exploration of Eco-Environment and Urbanization Changes Based on Multi-Source Remote Sensing Data—A Case Study of Yangtze River Delta Urban Agglomeration. Sustainability 2024, 16, 5903. [Google Scholar] [CrossRef] [Scilit]
- Xie, B.-C.; Wang, P.-L.; Hao, P.; Kang, J.-D. Low-carbon transformation path of power mix in the Yangtze River Delta region. J. Environ. Manag. 2024, 372, 123316. [Google Scholar] [CrossRef] [Scilit]
- Li, X.; Zhou, Y. A Stepwise Calibration of Global DMSP/OLS Stable Nighttime Light Data (1992–2013). Remote Sens. 2017, 9, 637. [Google Scholar] [CrossRef] [Scilit]
- Li, X.; Zhou, Y.; Zhao, M.; Zhao, X. A harmonized global nighttime light dataset 1992–2018. Sci. Data 2020, 7, 168. [Google Scholar] [CrossRef] [Scilit]
- Elvidge, C.D.; Ziskin, D.; Baugh, K.E.; Tuttle, B.T.; Ghosh, T.; Pack, D.W.; Erwin, E.H.; Zhizhin, M. A Fifteen Year Record of Global Natural Gas Flaring Derived from Satellite Data. Energies 2009, 2, 595–622. [Google Scholar] [CrossRef] [Scilit]
- Li, X.; Zhou, Y.; Eom, J.; Yu, S.; Asrar, G.R. Projecting Global Urban Area Growth Through 2100 Based on Historical Time Series Data and Future Shared Socioeconomic Pathways. Earth’s Future 2019, 7, 351–362. [Google Scholar] [CrossRef] [Scilit]
- Liu, Z.; He, C.; Zhang, Q.; Huang, Q.; Yang, Y. Extracting the dynamics of urban expansion in China using DMSP-OLS nighttime light data from 1992 to 2008. Landsc. Urban Plan. 2012, 106, 62–72. [Google Scholar] [CrossRef] [Scilit]
- Yu, B.; Tang, M.; Wu, Q.; Yang, C.; Deng, S.; Shi, K.; Peng, C.; Wu, J.; Chen, Z. Urban Built-Up Area Extraction From Log- Transformed NPP-VIIRS Nighttime Light Composite Data. IEEE Geosci. Remote Sens. Lett. 2018, 15, 1279–1283. [Google Scholar] [CrossRef] [Scilit]
- Grassi, G.; Conchedda, G.; Federici, S.; Abad Viñas, R.; Korosuo, A.; Melo, J.; Rossi, S.; Sandker, M.; Somogyi, Z.; Vizzarri, M.; et al. Carbon fluxes from land 2000–2020: Bringing clarity to countries’ reporting. Earth Syst. Sci. Data 2022, 14, 4643–4666. [Google Scholar] [CrossRef] [Scilit]
- Zhao, P.; Zeng, L.; Li, P.; Lu, H.; Hu, H.; Li, C.; Zheng, M.; Li, H.; Yu, Z.; Yuan, D.; et al. China’s transportation sector carbon dioxide emissions efficiency and its influencing factors based on the EBM DEA model with undesirable outputs and spatial Durbin model. Energy 2022, 238, 121934. [Google Scholar] [CrossRef] [Scilit]
- Shan, Y.; Guan, D.; Zheng, H.; Ou, J.; Li, Y.; Meng, J.; Mi, Z.; Liu, Z.; Zhang, Q. China CO2 emission accounts 1997–2015. Sci. Data 2018, 5, 170201. [Google Scholar] [CrossRef] [Scilit]
- Yang, D.; Luan, W.; Qiao, L.; Pratama, M. Modeling and spatio-temporal analysis of city-level carbon emissions based on nighttime light satellite imagery. Appl. Energy 2020, 268, 114696. [Google Scholar] [CrossRef] [Scilit]
- Papacharalampous, G.; Tyralis, H.; Papalexiou, S.M.; Langousis, A.; Khatami, S.; Volpi, E.; Grimaldi, S. Global-scale massive feature extraction from monthly hydroclimatic time series: Statistical characterizations, spatial patterns and hydrological similarity. Sci. Total Environ. 2021, 767, 144612. [Google Scholar] [CrossRef] [Scilit] [PubMed]
- Anselin, L.; Li, X. Operational local join count statistics for cluster detection. J. Geogr. Syst. 2019, 21, 189–210. [Google Scholar] [CrossRef] [Scilit] [PubMed]
- Wang, L.; Zhang, S.; Xiong, Q.; Liu, Y.; Liu, Y.; Liu, Y. Spatiotemporal dynamics of cropland expansion and its driving factors in the Yangtze River Economic Belt: A nuanced analysis at the county scale. Land Use Policy 2022, 119, 106168. [Google Scholar] [CrossRef] [Scilit]
- Shi, K.; Yu, B.; Zhou, Y.; Chen, Y.; Yang, C.; Chen, Z.; Wu, J. Spatiotemporal variations of CO2 emissions and their impact factors in China: A comparative analysis between the provincial and prefectural levels. Appl. Energy 2019, 233–234, 170–181. [Google Scholar] [CrossRef] [Scilit]
- Zhang, P.; Yang, D.; Qin, M.; Jing, W. Spatial heterogeneity analysis and driving forces exploring of built-up land development intensity in Chinese prefecture-level cities and implications for future Urban Land intensive use. Land Use Policy 2020, 99, 104958. [Google Scholar] [CrossRef] [Scilit]
- Zhu, W.; Muhammad, A.; Han, M.; Li, Y.; Kong, X.; Kong, F. Spatial distribution and aggregation of human-environment coordination and optimal paths in the Yellow River Delta, China. Ecol. Indic. 2022, 143, 109380. [Google Scholar] [CrossRef] [Scilit]
- Barrell, J.; Grant, J. Detecting hot and cold spots in a seagrass landscape using local indicators of spatial association. Landsc. Ecol. 2013, 28, 2005–2018. [Google Scholar] [CrossRef] [Scilit]
- Lee, C. Unraveling the dynamics of vacant housing: Multi-scale analysis of socio-demographic-economic, physical environmental, and spatial clusters in South Korean cities (2015–2020). Cities 2025, 167, 106327. [Google Scholar] [CrossRef] [Scilit]
- Getis, A.; Ord, J.K. The Analysis of Spatial Association by Use of Distance Statistics. Geog. Anal. 1992, 24, 189–206. [Google Scholar] [CrossRef] [Scilit]
- Shi, Y.; Matsunaga, T.; Yamaguchi, Y.; Zhao, A.; Li, Z.; Gu, X. Long-term trends and spatial patterns of PM2.5-induced premature mortality in South and Southeast Asia from 1999 to 2014. Sci. Total Environ. 2018, 631–632, 1504–1514. [Google Scholar] [CrossRef] [Scilit]
- Eryando, T.; Susanna, D.; Pratiwi, D.; Nugraha, F. Standard Deviational Ellipse (SDE) models for malaria surveillance, case study: Sukabumi district-Indonesia, in 2012. Malar. J. 2012, 11, P130. [Google Scholar] [CrossRef] [Scilit]
- Polajžer, B.; Brezovnik, R.; Ritonja, J. Evaluation of Load Frequency Control Performance Based on Standard Deviational Ellipses. IEEE Trans. Power Syst. 2017, 32, 2296–2304. [Google Scholar] [CrossRef] [Scilit]
- Moore, T.W.; McGuire, M.P. Using the standard deviational ellipse to document changes to the spatial dispersion of seasonal tornado activity in the United States. npj Clim. Atmos. Sci. 2019, 2, 21. [Google Scholar] [CrossRef] [Scilit]
- Xue, H.; Ma, Q.; Ge, X. Spatiotemporal dynamics and driving factors of energy-related carbon emissions in the Yangtze River Delta region based on nighttime light data. Sci. Rep. 2025, 15, 3384. [Google Scholar] [CrossRef] [Scilit] [PubMed]

Disclaimer/Publisher’s Note: The statements, opinions and data contained in all publications are solely those of the individual author(s) and contributor(s) and not of MDPI and/or the editor(s). MDPI and/or the editor(s) disclaim responsibility for any injury to people or property resulting from any ideas, methods, instructions or products referred to in the content. |
© 2026 by the authors. Licensee MDPI, Basel, Switzerland. This article is an open access article distributed under the terms and conditions of the Creative Commons Attribution (CC BY) license.