


Abstract
This study applies a multi-criteria decision-making (MCDM) framework integrating the Analytic Hierarchy Process (AHP), entropy weight method, and game theory to evaluate the safety of aqueducts, using the Kezi River Aqueduct in Xinjiang, China, as a case study. Field water filling tests were conducted to simulate operational loads, monitoring strain, deflection, and settlement. Subjective weights were derived via an AHP model using a natural index scale, while objective weights were aggregated from existing expert studies via entropy weighting. Game theory was then employed to reconcile these into a final combined weight set across three primary criteria: safety, durability, and applicability. Results show that the aqueduct behaves elastically under load, with measured values well below code limits, confirming adequate bearing capacity. The combined model yielded a comprehensive safety score of 87.15, classifying the structure as ‘first class’ according to DB44/T2041-2017. Although numerous non-structural web cracks were observed, they were assessed as not compromising current structural integrity.
1. Introduction
Research on aqueduct health assessments have seen various methodological developments. Li et al. [1] employed a fuzzy inference system coupled with failure mode and effect analysis to establish a risk prediction model for water diversion infrastructure. Ma et al. [2] used the G-PCM method on the OpenSees platform to simulate and evaluate the seismic fragility of a three-span simply supported beam aqueduct. Liu et al. [3] implemented a BIM-based integrated visualization framework to enhance safety management for large-scale water diversion projects. Internationally, methods for infrastructure safety evaluation often incorporate reliability indices [4] and advanced finite element modeling [5]. Multi-criteria decision-making (MCDM) techniques like AHP and entropy have been widely applied in infrastructure management [6]. However, the specific integration of AHP, entropy weighting, and game theory for aqueduct safety evaluation—particularly when combined with comprehensive field load testing for validation—remains underexplored. While such integrated models aim to balance subjective expertise with objective data, their added complexity must be justified against simpler alternatives, especially in single-case applications.
However, a critical gap remains in how to effectively combine subjective and objective evaluations. Existing studies often employ direct weighting schemes, such as arithmetic averaging, which rely on the arbitrary assumption that expert experience and data-driven statistics are equally reliable (). This lack of mathematical rigor can lead to significant bias, especially in aqueduct safety assessments where historical data is often sparse (favoring AHP), while specific structural defects require precise quantification (favoring entropy). To address this, this study introduces game theory not merely to combine weights, but to identify the Nash equilibrium. This framework mathematically minimizes the deviation between subjective and objective vectors, ensuring that the final weights represent a robust consensus rather than an arbitrary average.
This paper investigates the structural safety of the Kezi River Aqueduct following the appearance of web cracks post-construction. The study aims to: (1) apply a combined AHP-entropy and game theory weighting framework for safety evaluation, justifying its necessity over simpler approaches; (2) validate the structural performance through in situ water filling load tests, with a critical discussion on data limitations; and (3) assess the impact of the observed cracks on the overall safety rating through both qualitative and mechanistic reasoning.
2. Improved Analytic Hierarchy Process Evaluation Method Based on the Game Theory Combined Weight
2.1. Subjective Weight of Index Based on the Improved Analytic Hierarchy Process
Since Saaty proposed the AHP method, it has become a staple in addressing the direction of decision-making. However, the use of a 1 to 9 scale for weight calculations has been critiqued for its lack of reasonableness [7,8]. Subsequent research has seen some scholars use alternative scales to address the limitations of 1 to 9 scales, such as the 9n/9 scale [9], a8 scale [10], 0.1~0.9 scale [11] and so on. Luo SL Tung [12] introduced several evaluation criteria for the analytic hierarchy scale, such as scale memorability, scale weight fitting, scale order preservation, scale perceptibility and scale uniformity. The calculation steps of the Analytic Hierarchy Process facilitate the transformation of qualitative judgment into quantitative judgment, and the selection of the scale can affect the accuracy of the quantification. For the multi-criteria evaluation problems requiring high precision, the scale based on the natural index e0/5~e8/5 is adopted [13]. Table 1 illustrates a comparison between the 1–9 scale and the natural index scale.
Table 1.
1–9 scale and natural index scale comparison.
The consistency of the judgment matrix is a critical requirement for the validity of the AHP. The maximum eigenvalue (λmax) was calculated for the matrix in Table 2. The Consistency Index (CI) and Consistency Ratio (CR) were then determined as follows:
where RI is the random index for a matrix of size n = 3 (RI = 0.58). The calculated CR was 0.04, which is less than the threshold of 0.1, confirming an acceptable level of consistency in the pairwise comparisons [14].
CI = (λmax − n)/(n − 1), CR = CI/RI,
Table 2.
Subjective weight of Analytic Hierarchy Process.
The Analytic Hierarchy Process used in this paper uses the natural index scale to calculate the weight. The method is as follows.
(1) The natural index scale is used to calculate, and the judgment matrix is constructed, according to the principles of the Analytic Hierarchy Process. The elements of the same layer are compared in pairs, and the judgment matrix A = aij is constructed according to the scale (aij represents the importance of the i-th factor relative to the j-th factor, aij > 0).
(2) Calculate the weight of each index. The weight coefficient of each factor is the eigenvector w of the judgment matrix, which corresponds to the maximum eigenvalue λmax of the matrix.
The root-mean-square method is used to approximate the solution (4) index weight coefficient.
Calculation steps for AHP using the natural index scale:
- Multiply each row element of the judgment matrix to get Mi:
- Open nth power to Mi and get
- The vector is normalized to obtain
2.2. Weight Summary Based on Entropy Weight Method
To derive objective weights, existing expert weight sets from prior aqueduct safety studies were aggregated. The entropy weight method quantifies the dispersion in expert judgments: lower entropy indicates more decisive judgment. The weight for each expert is inversely proportional to their entropy, and a composite objective weight vector is calculated. This approach leverages existing knowledge but assumes that the aggregated expert opinions are relevant and transferable to the Kezi River context—a point discussed in Section 4.1. The steps of establishing an entropy model are as follows.
- (1)
- Determine the subjective weight. According to the subjective weight W = (Wij)m*n given by m experts in the existing research, it is assumed that there is an ideal optimal weight value S, and its subjective weight vector is x* = (x1, x2, x3, ···, xn)T.
- (2)
- Calculate the subjective weight level vector of experts. The difference between the optimal weight value S and the subjective weight value of each expert is used to measure the weight of the expert and establish the subjective weight level vector of the expert.In the formula, Ei is the expert evaluation level vector.
- (3)
- Establishment of entropy model. The entropy Hi for the i-th expert’s evaluation was calculated to measure the dispersion in their weight assignments. A lower entropy value indicates more decisive expert judgment:where k is a constant (k = 1/ln(n)), and e{ij} is the normalized value of the j-th criterion weight given by the i-th expert.Hi = −k ∑{j = 1}^{n} e{ij}\ln(e_{ij})
- (4)
- Calculate the proportion of expert weight. The weight Si for each expert, reflecting their reliability, is inversely proportional to their entropy:Si = (1/Hi)/(∑_{i = 1}^{m} 1/Hi)Among them, the value of Si is proportional to the proportion of experts in the evaluation system. The larger the value, the greater the proportion of the expert.
- (5)
- Based on the entropy weight method, according to the different evaluation systems of aqueduct health status and the cognitive differences in different experts on the same index, the existing research results in aqueduct weight are summarized from the three indexes of aqueduct safety, durability and applicability, so as to obtain the closest optimal weight value. The subjective weight value Wi = (wi1, wi2, ···, win)T of the existing experts is summarized, and then the entropy model is used to calculate the objective weight vector S = (S1, S2, S3, ···, Sn)T(j = 1, 2, ···, n). Finally, based on the weighted fusion calculation, the optimal approximate value of the comprehensive weight of each index is obtained.
2.3. The Combination Weight of the Index Is Determined Based on Game Theory
Game theory is used to find a Nash equilibrium between the subjective (AHP) and objective (entropy) weight vectors, minimizing overall deviation. The optimal linear combination coefficients (α1, α2) are derived through optimization. This step aims to harmonize expert judgment with data-derived weights. However, its advantage over a simple fixed-ratio combination should be interpreted with caution, as the improvement depends on the specific context and data quality. The specific steps are as follows.
- (1)
- Linear combination weight. The objective weight obtained by the entropy weight method and the subjective weight obtained by the Analytic Hierarchy Process are linearly combined:In the formula, and are the main and objective weight coefficients, respectively.
- (2)
- Optimizing the combination coefficient. According to the idea of the game aggregation model, with the goal of minimizing the deviation, the linear combination coefficients α1 and α2 are optimized to obtain the optimal weight, and the objective function is determined:
- (3)
- Optimization equations. According to the differential properties of the matrix, the objective function is equivalent to the optimization of the first derivative conditions of the linear equations:
- (4)
- Normalization. The optimal linear combination coefficients α1 and α2 are normalized to the following:
- (5)
- Determine the comprehensive weight. The comprehensive weight based on game theory combination weighting is as follows:
2.4. Sensitivity Analysis
A sensitivity analysis was performed by varying α1 and α2 by ±10% and ±20%. The comprehensive safety score varied between 86.1 and 88.0 (deviation < 1.0 from 87.15), and the ‘first class’ classification remained unchanged, indicating robust conclusions against minor weight perturbations.
2.5. Aqueduct Safety Category
According to DB44/T2041-2017 [15] aqueduct safety is classified into four categories (Table 3). This regional standard is applied here in the absence of a specific local code; its applicability is discussed in Section 4.2.
Table 3.
Aqueduct engineering safety rating.
2.6. Basic Standards for Safety Status Rating
Scoring follows DB44/T2041-2017 [15], with adjustments for project-specific conditions (Table 4).
Table 4.
Standard aqueduct index scores.
3. Engineering Application
3.1. Project Profile
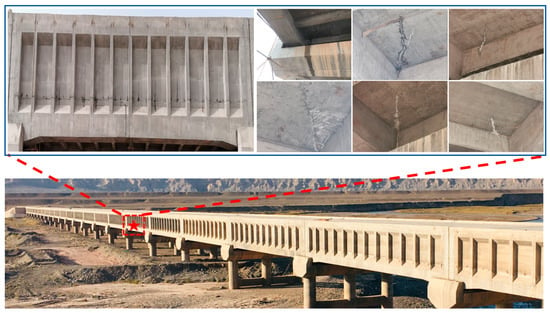
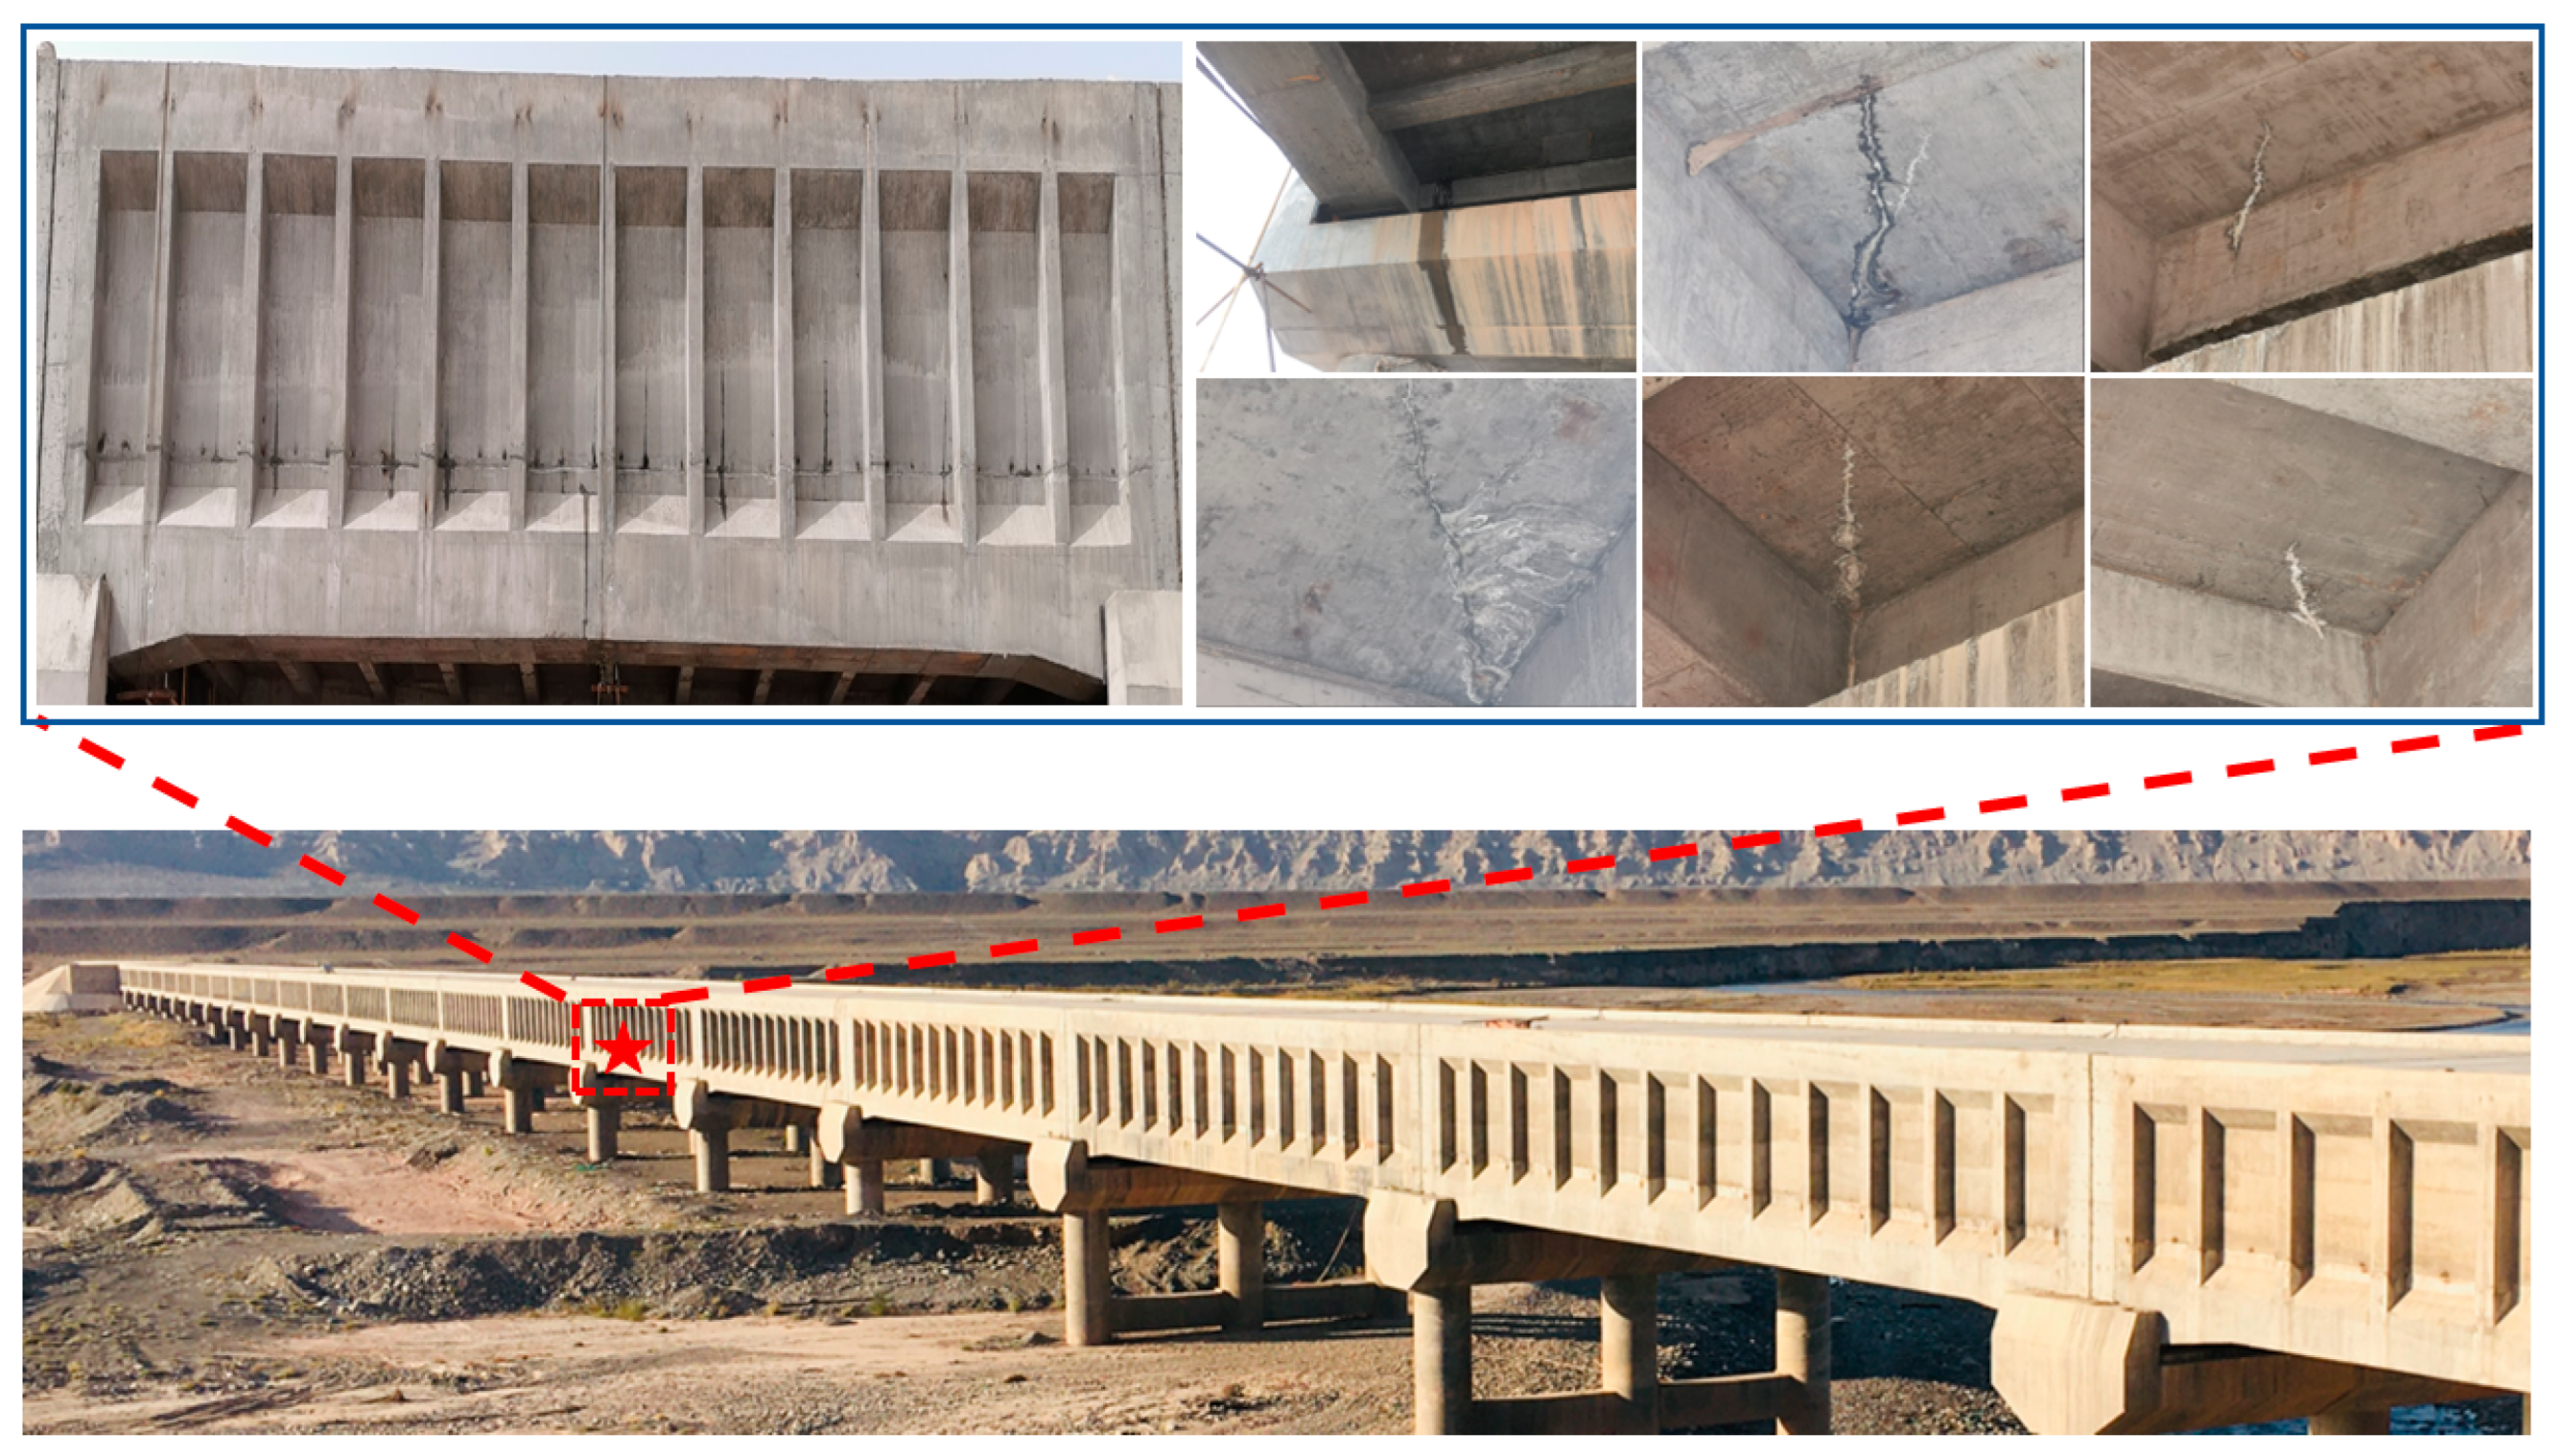
The Kezi River aqueduct project is located along the main canal on the south bank of the Kezi River in Shufu County, Xinjiang. The designed discharge capacity of the main canal on the south bank is designated as Q = 87 m3/s, with an increased discharge capacity of Q = 100 m3/s. The narrowest part of the Kezi River measures 650 m. The aqueduct is located 460 m downstream from the main canal diversion gate. The left bank slope is approximately 70°, and that of the right bank is about 30°. The concrete construction of the Kezi River Aqueduct was executed in two phases. After the secondary pouring and stripping of each span of the aqueduct, vertical cracks were observed at the web, as illustrated in Figure 1, ranging from a few to dozens. Despite improvements in aspects such as mixture ratios and maintenance during the construction period, cracks persist.
Figure 1.
Vertical cracks in the web of the Kezi River aqueduct. The five-pointed star in the picture represents the partial view of the study area.
Preliminary assessments based on their pattern suggests they are likely induced by thermal shrinkage and/or plastic settlement during concrete curing, rather than structural overloading. The cracks are vertical, non-propagating (as confirmed during inspections), with widths predominantly below 0.2 mm. This pattern is inconsistent with flexural or shear cracks from overloading but aligns with common non-structural cracking phenomena in mass concrete (e.g., refer to ACI 224.1R-2007) [16]. However, a detailed fracture mechanics analysis was beyond the scope of this study.
3.2. Water-Filled Load Test
3.2.1. Purpose of Water-Filled Load Test
It is necessary to check the quality of the deformation and contraction joints and the construction joints of the aqueduct under various operational conditions. This includes assessing the deflection and strain distribution of the aqueduct under the influence of established water level (such as the design water depth, increased water depth and other characteristic water levels). Simultaneously, it is also imperative to monitor the settlement deformation of the aqueduct foundation, including uniform settlement and non-uniform settlement. In addition, it is necessary to inspect the concrete cracks and leakage in the aqueduct. Finally, according to the results of the water filling test, the safety of the aqueduct is scientifically evaluated. Following this evaluation, appropriate engineering measures are implemented to improve the performance of the aqueduct and prolong its service life, thereby providing a basis for safety assessments during the project’s operation.
3.2.2. Selection of Test Section
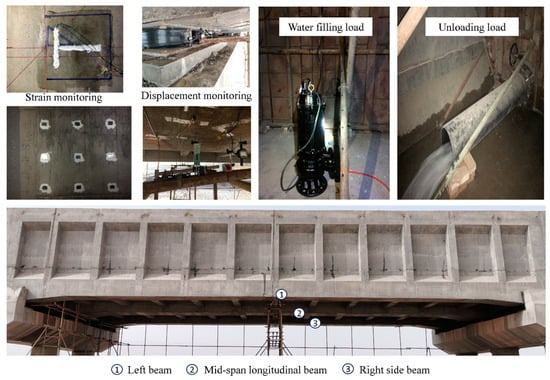
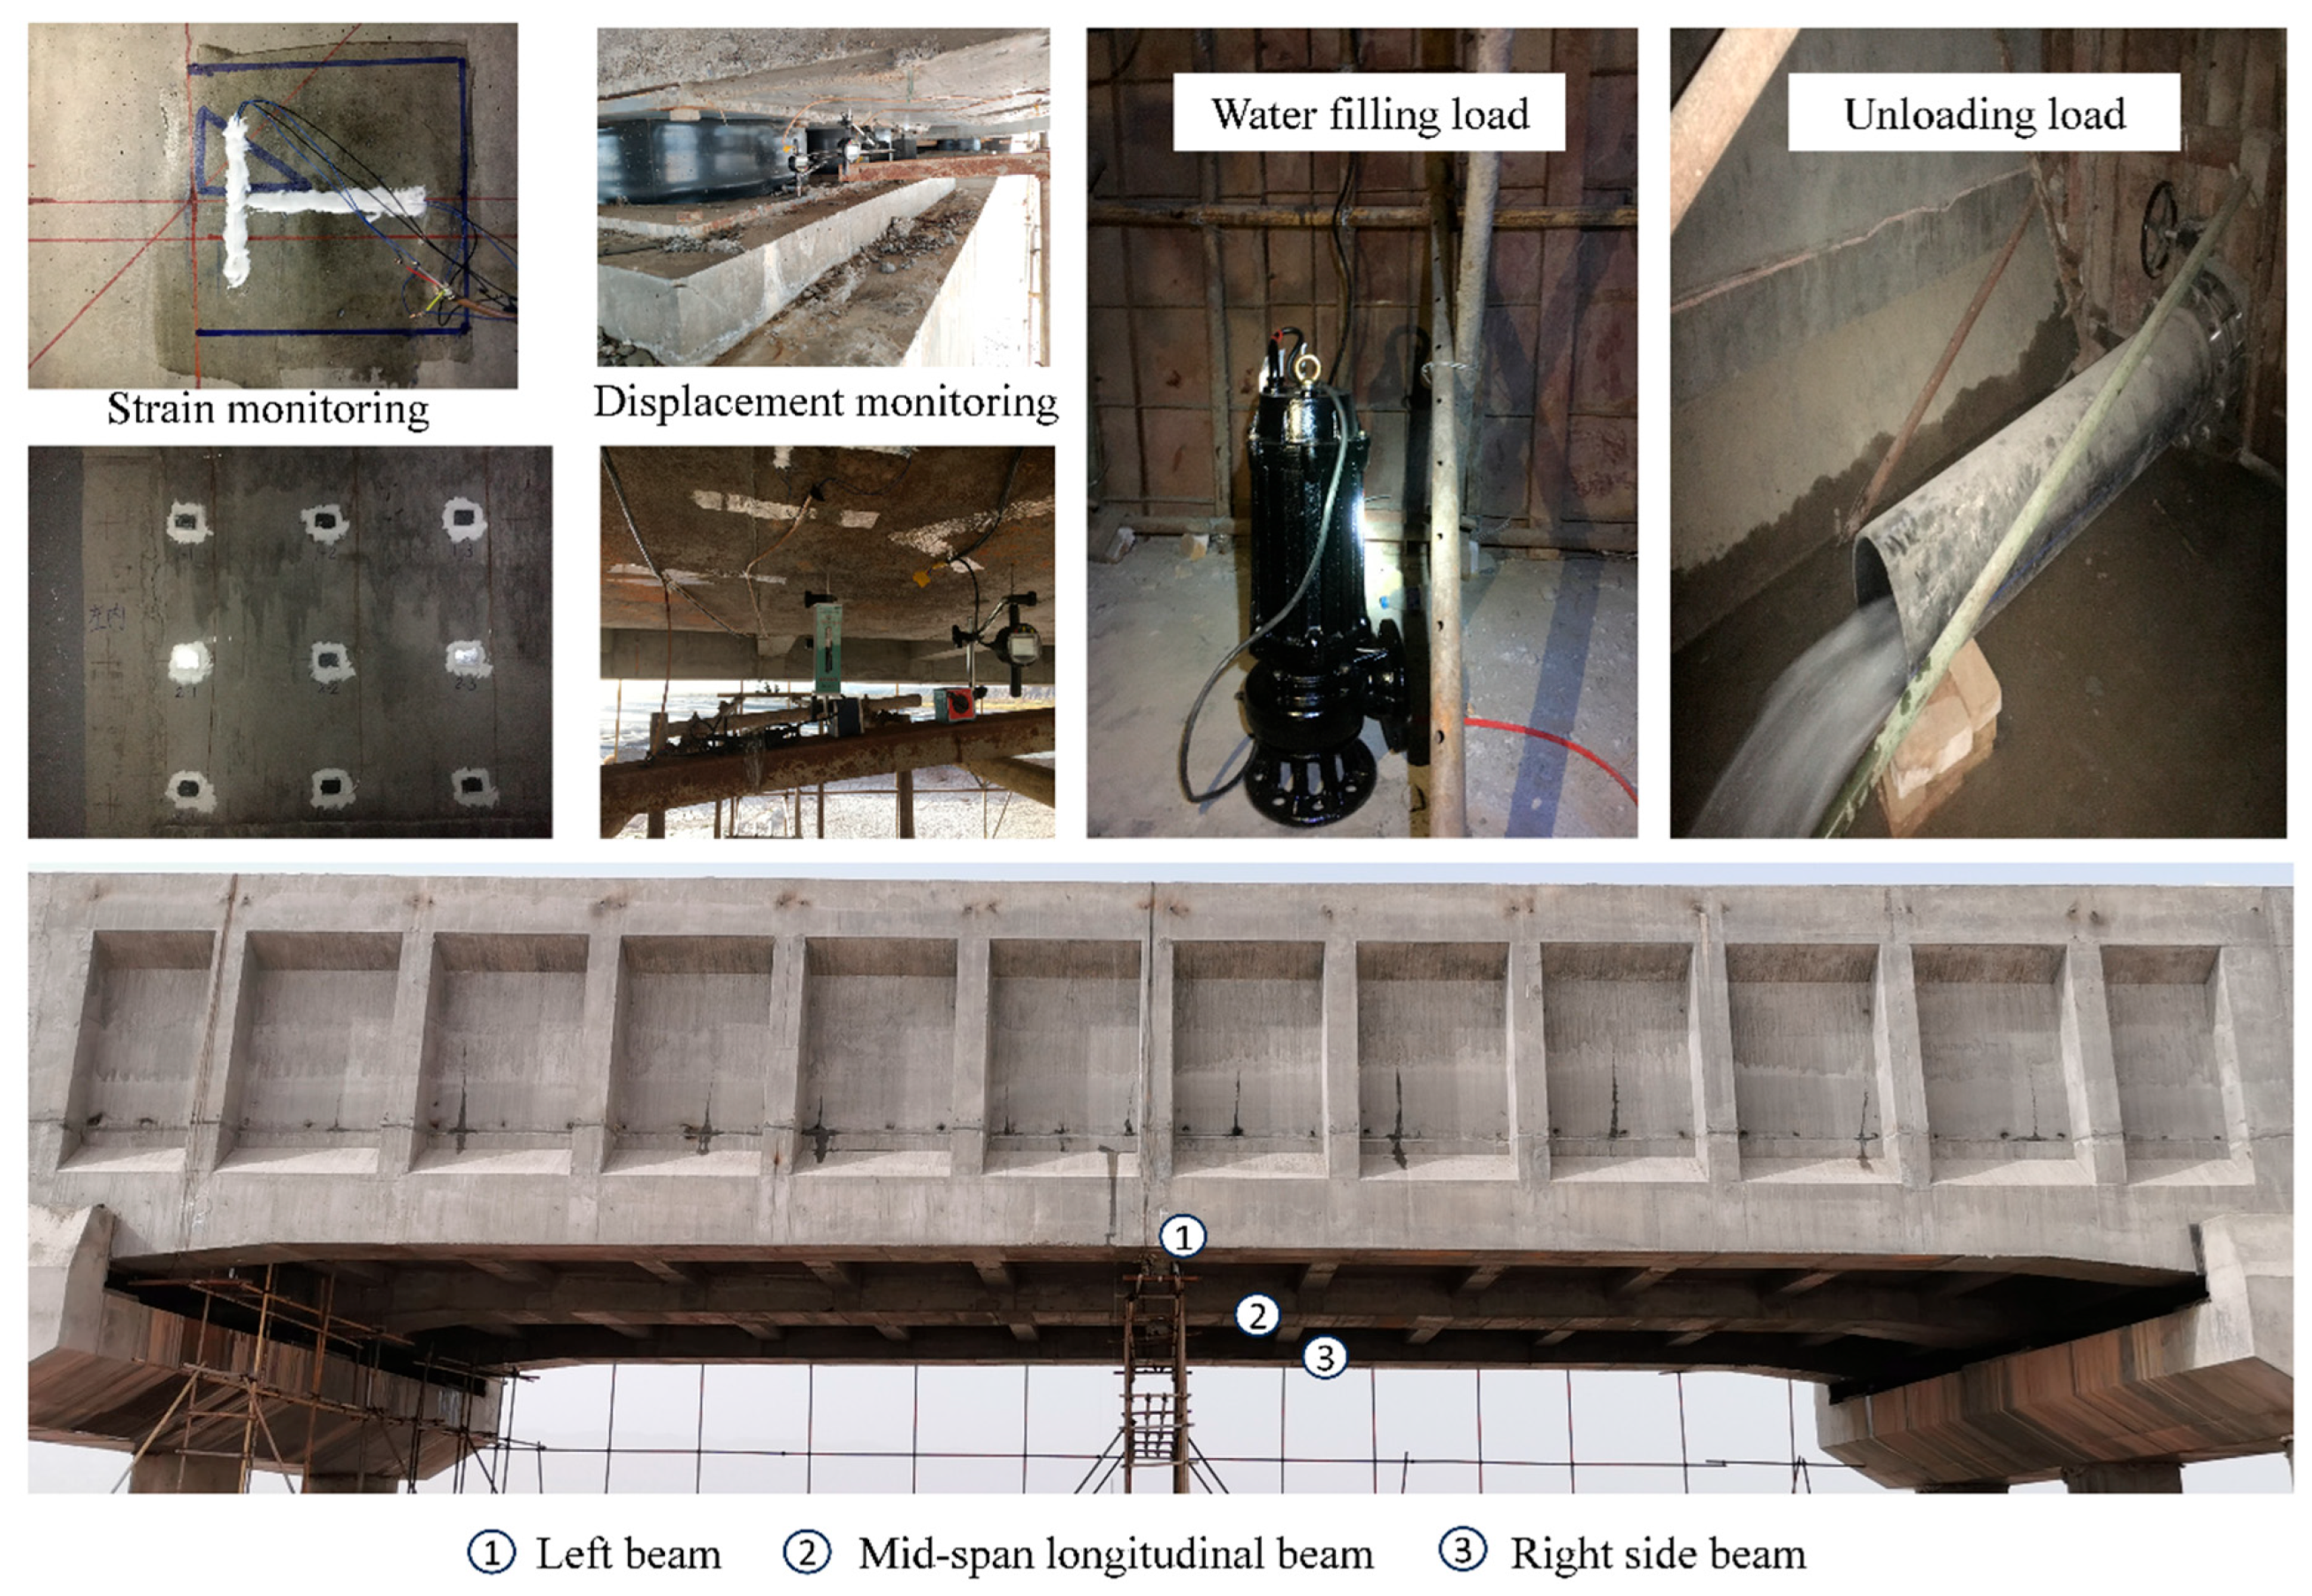
Strain measurements were acquired using resistive strain gauges, and deflection was monitored using high-precision dial gauges. All sensors were calibrated prior to testing. According to the safety inspection data for the Kezi River aqueduct, the majority of cracks were observed at a web of the seventh span of the aqueduct, including 17 cracks wider than 0.2 mm and 87 cracks narrower than 0.2 mm. The existence of these cracks may compromise the structural bearing capacity of the aqueduct and adversely affect its structural safety. In response to the settlement problem observed during actual operation, monitoring of a single span may induce an asymmetric load, thereby reducing the reliability of the monitoring data. Therefore, the water filling test was also carried out in the eighth span, applying a symmetrical load to the pier between the seventh and eighth spans to ensure that the monitoring results more accurately reflected the actual operation situation. The main monitoring instruments were arranged at the seventh span. Figure 2 displays the Kezi River Aqueduct Load Test Figure.
Figure 2.
Schematic diagram of instrument layout for the Kezi River Aqueduct load test.
3.2.3. Loading and Unloading of Water Filling Test
This loading test adopted a six-stage loading process, where the design water depth is denoted as H, the increased water depth as H plus, and the full tank water depth as H full. The stages of loading were as follows: 1/4*H, 1/2*H, 3/4* H, H, H plus and full tank H full for six-stage loading. After the completion of water loading at each stage, the water level was kept static for 30 min before the monitoring data was recorded.
The unloading test was divided into six stages: full tank H full, H plus, H, 3/4*H, 1/2*H, 1/4*H and emptying. Similarly to the water filling stages, each subsequent stage began after the water level had remained static for 30 min, during which the changes under each condition were recorded.
3.3. Safety Monitoring Results and Analysis
3.3.1. Safety Categories and Evaluation Criteria
- (1)
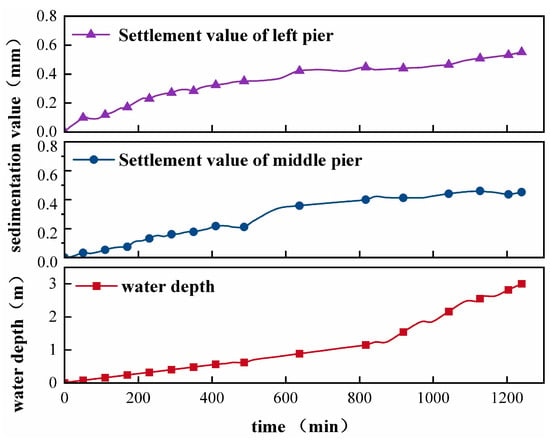
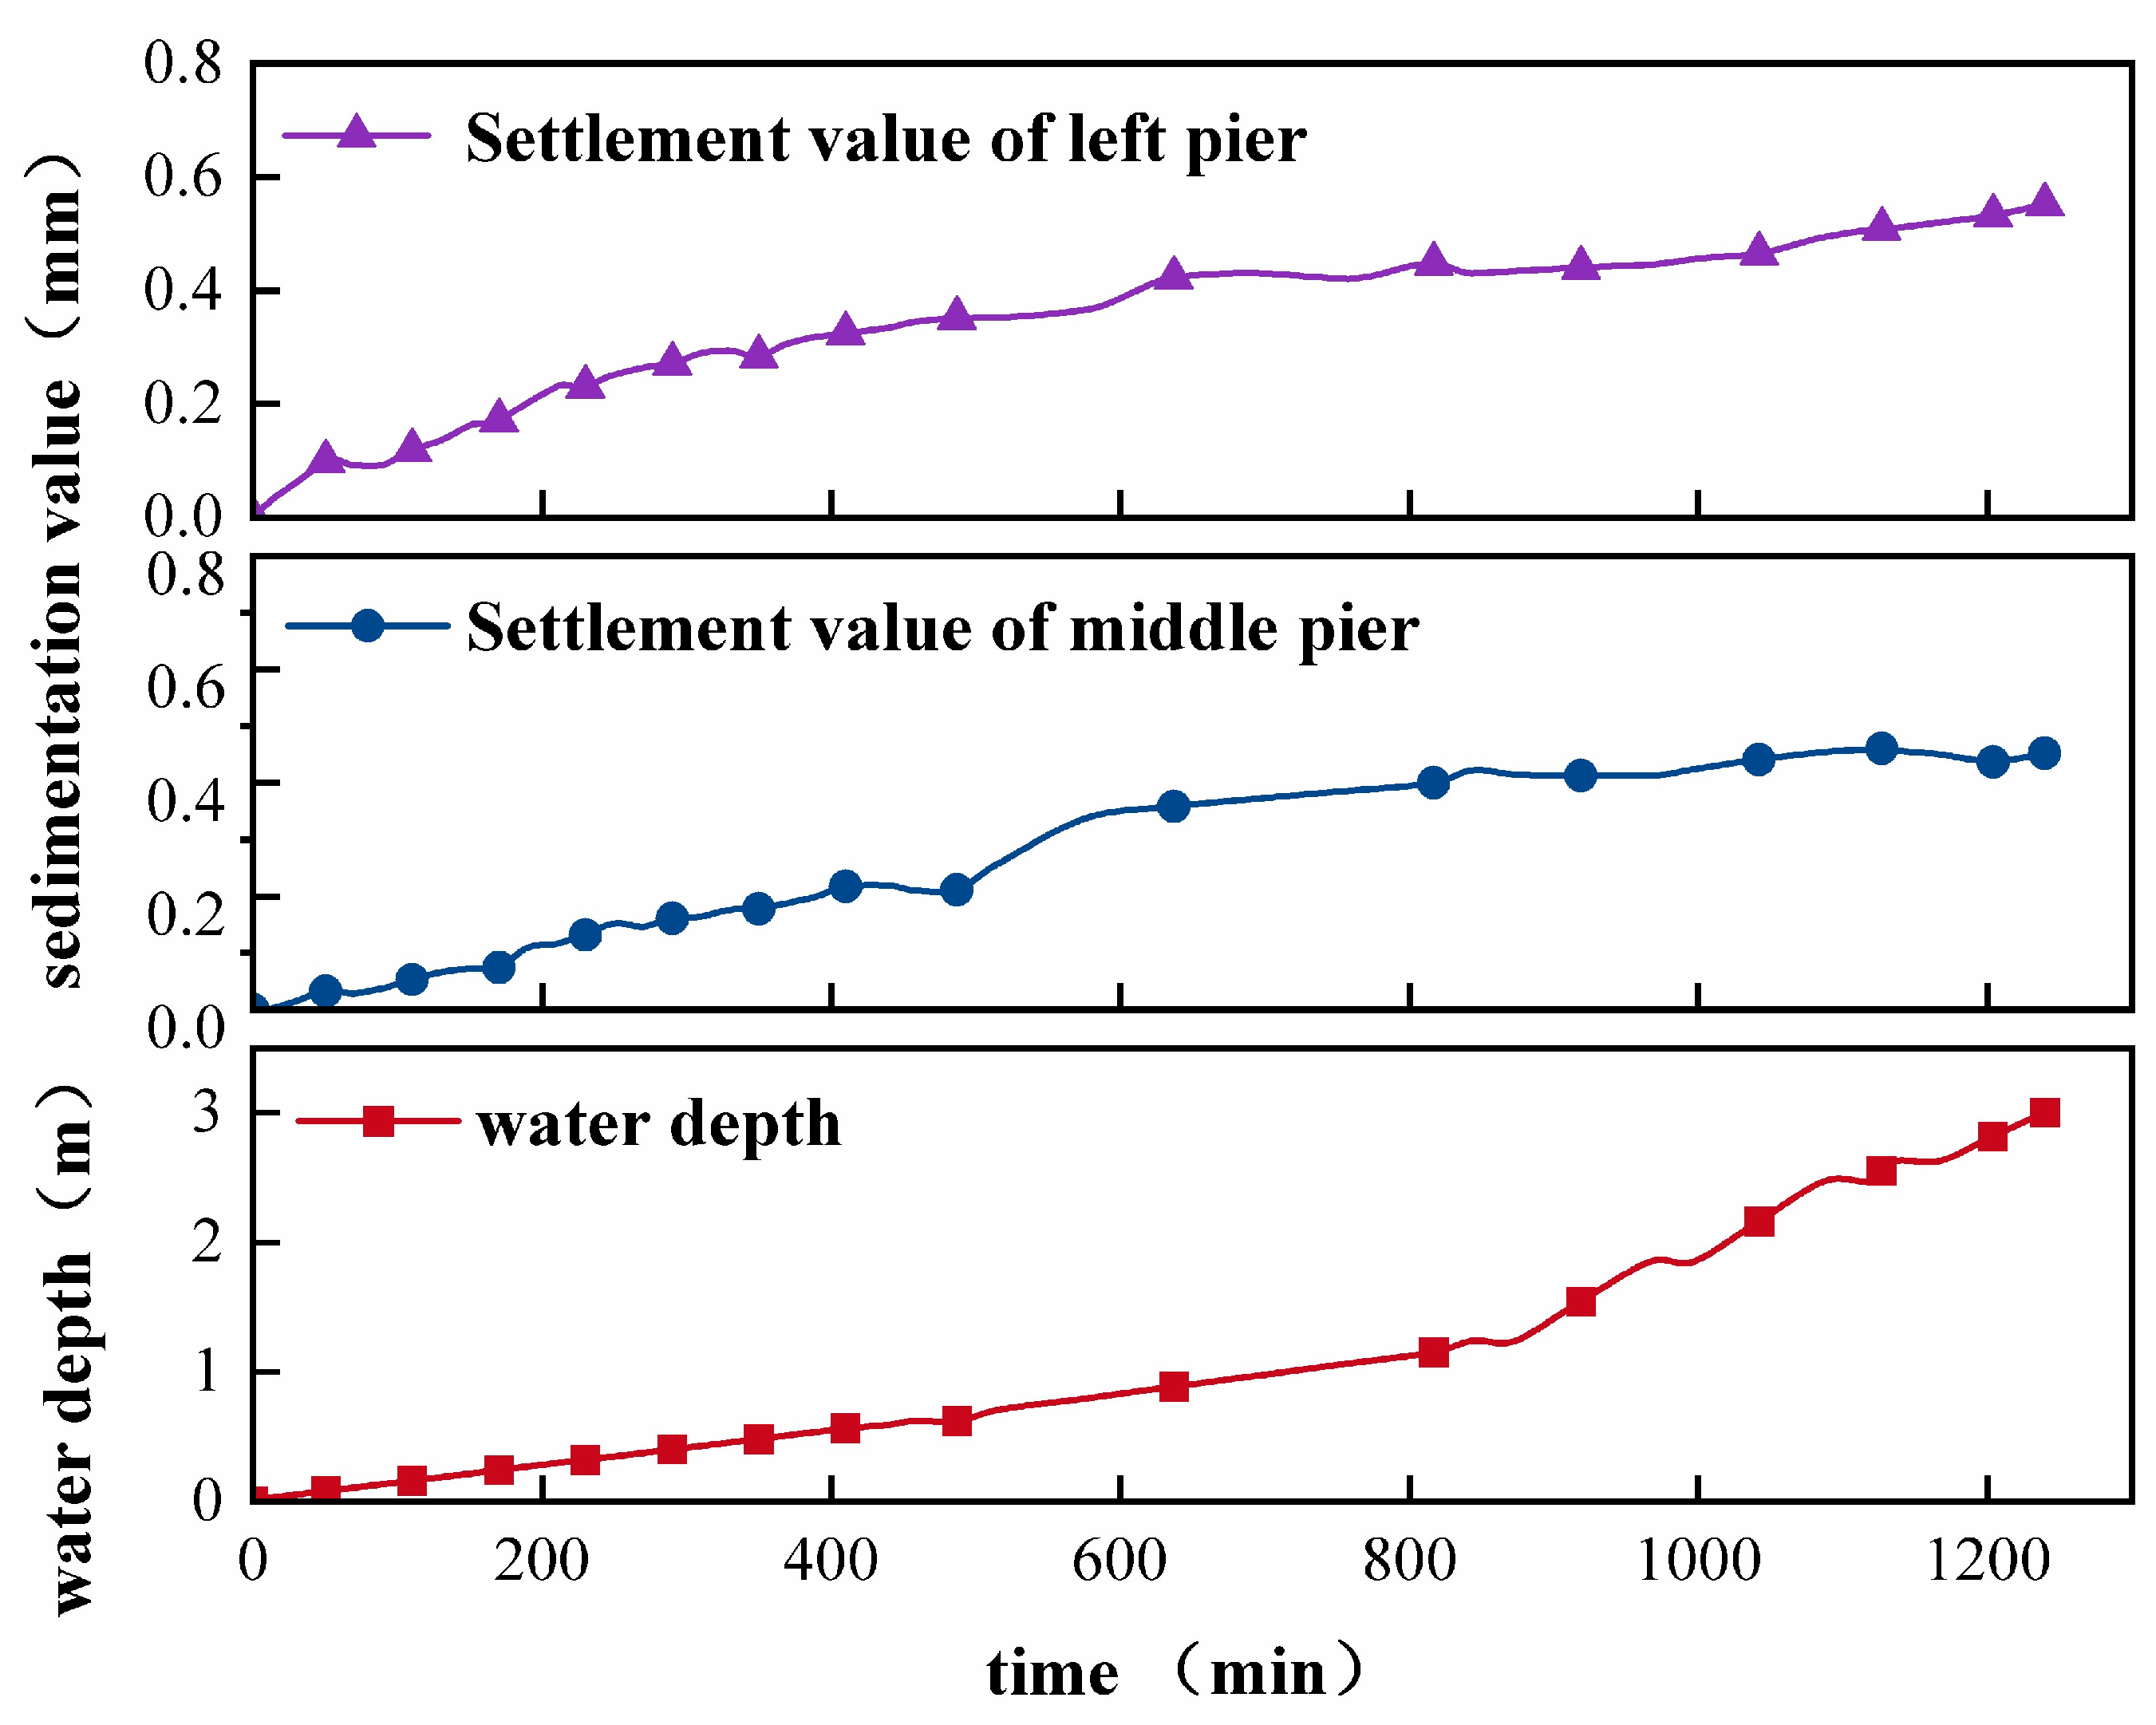
- Pier settlement. The time-history curve (Figure 3) showed increasing settlement with water depth, but no significant differential settlement, indicating satisfactory foundation performance.Figure 3. Time-history curve of pier settlement.
- (2)
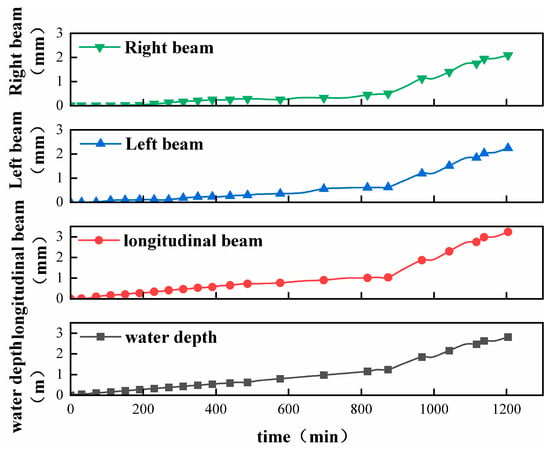
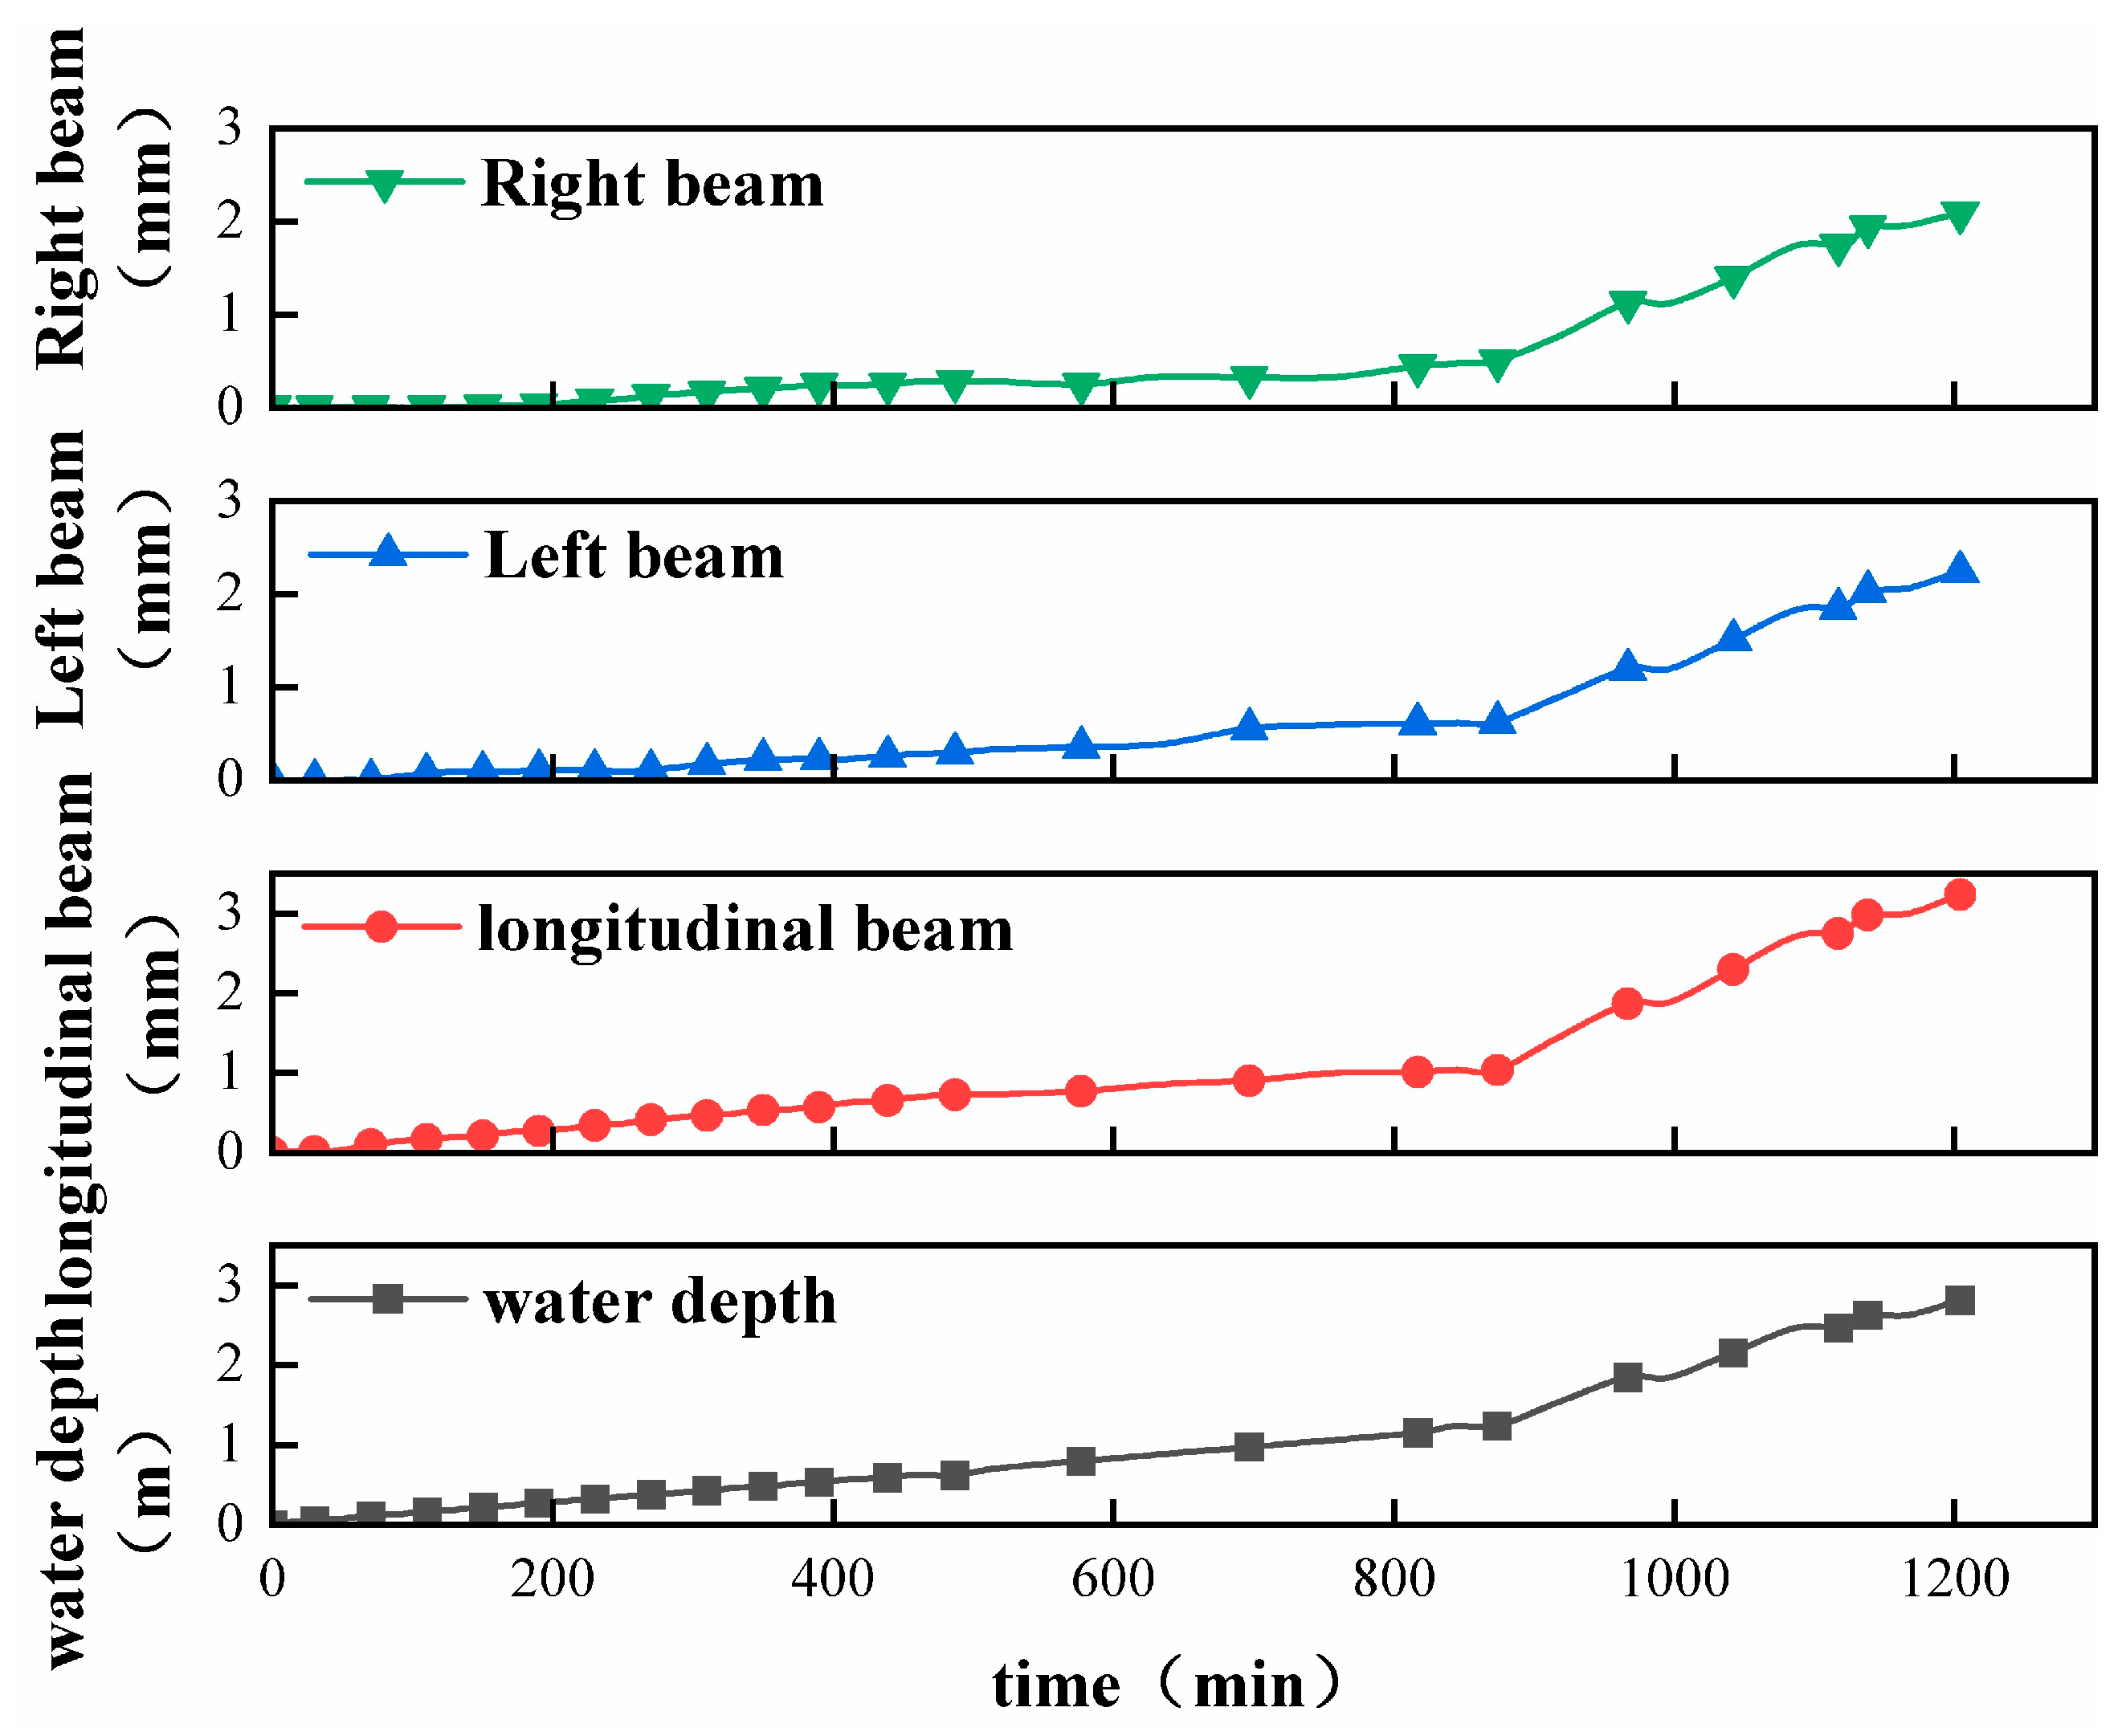
- Mid-span deflection. Deflection increased linearly with load (Figure 4), indicating elastic behavior. Maximum deflection was 3.40 mm.Figure 4. Deflection time-history curve of each beam in mid-span.
- (3)
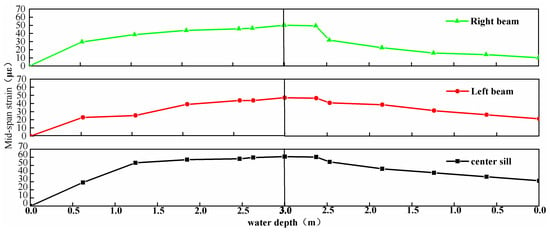
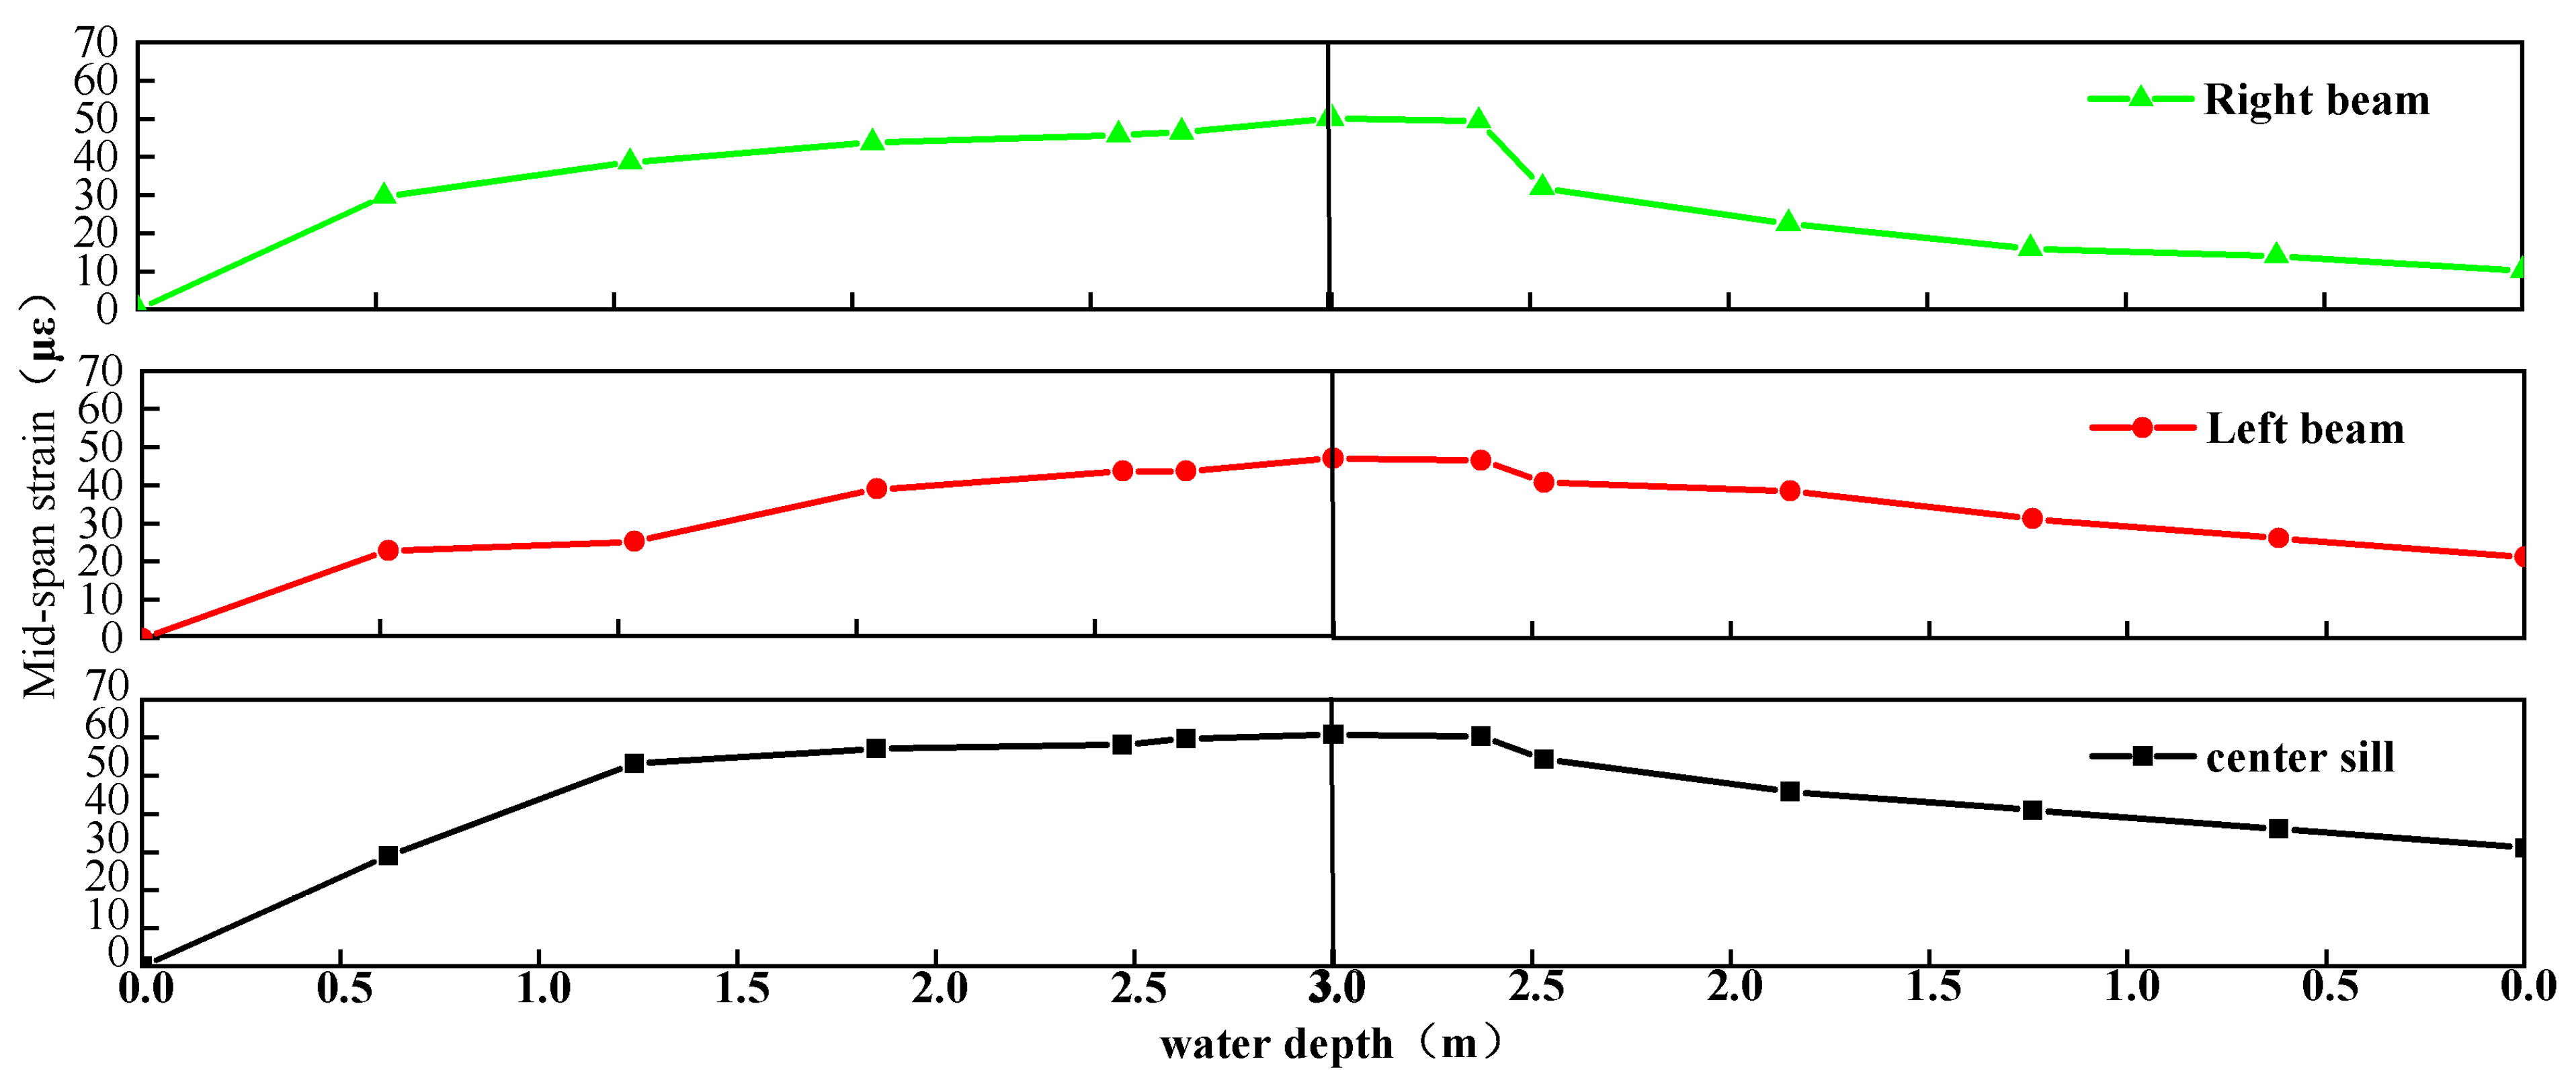
- Strain monitoring. Strain increased linearly with water depth and recovered partially upon unloading (Figure 5), confirming elastic response.Figure 5. Water depth and mid-span strain curve.
3.3.2. Analysis of Bearing Capacity of Aqueduct Structure
- (1)
- Deflection analysis. Allowable deflection per SL191-2008 [17] is 50 mm. Measured max. deflection was 3.40 mm, well within limits.
- (2)
- Relative residual strain analysis. Relative residual strain S’~ p~ was 10.4% (<20% per JTG/TJ2l-2011) [7]. It should be noted that this result is based on a single load cycle; repeated cycles would be needed to assess long-term cumulative effects and measurement variability. The calculation formula is as follows:
In the formula: Sp is the residual strain measured after unloading, S’p is the relative residual strain, and St is the maximum strain measured under load.
The residual strain of the Kezi River Aqueduct, recorded after unloading from the point of maximum strain, measured only 6.32 um. At the apex of the water level during the water-filled load test, the mid-span strain observed amounts up to 60.89 um. According to the specification formula, the relative residual strain calculates to 10.4%, which meets the specification. This value remains well within the 20% threshold, indicating that the deformation of the aqueduct box girder maintains a robust elastic working state. It is explicitly noted that this measurement was derived from a single load cycle; the test was not repeated multiple times due to field constraints. Therefore, classical statistical measures of uncertainty (e.g., standard deviation from repeated trials) are not available. The result should be interpreted as a point estimate within this specific test context.
- (3)
- Comparative Analysis: Table 5 shows similar aqueducts also performed well within limits.Table 5. Statistics of water load test results of some aqueduct structures in China.
4. Comprehensive Aqueduct Safety Assessment
4.1. Determine the Weight of Aqueduct Safety Evaluation
- (1)
- AHP subjective weights. Using the natural index scale, weights for safety, applicability, and durability were 0.4506, 0.2474, and 0.3020, respectively (Table 2).
- (2)
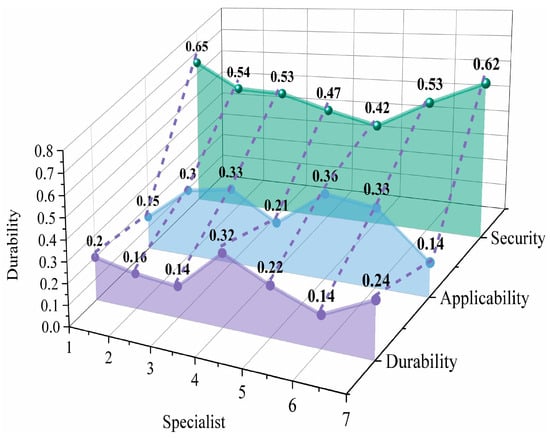
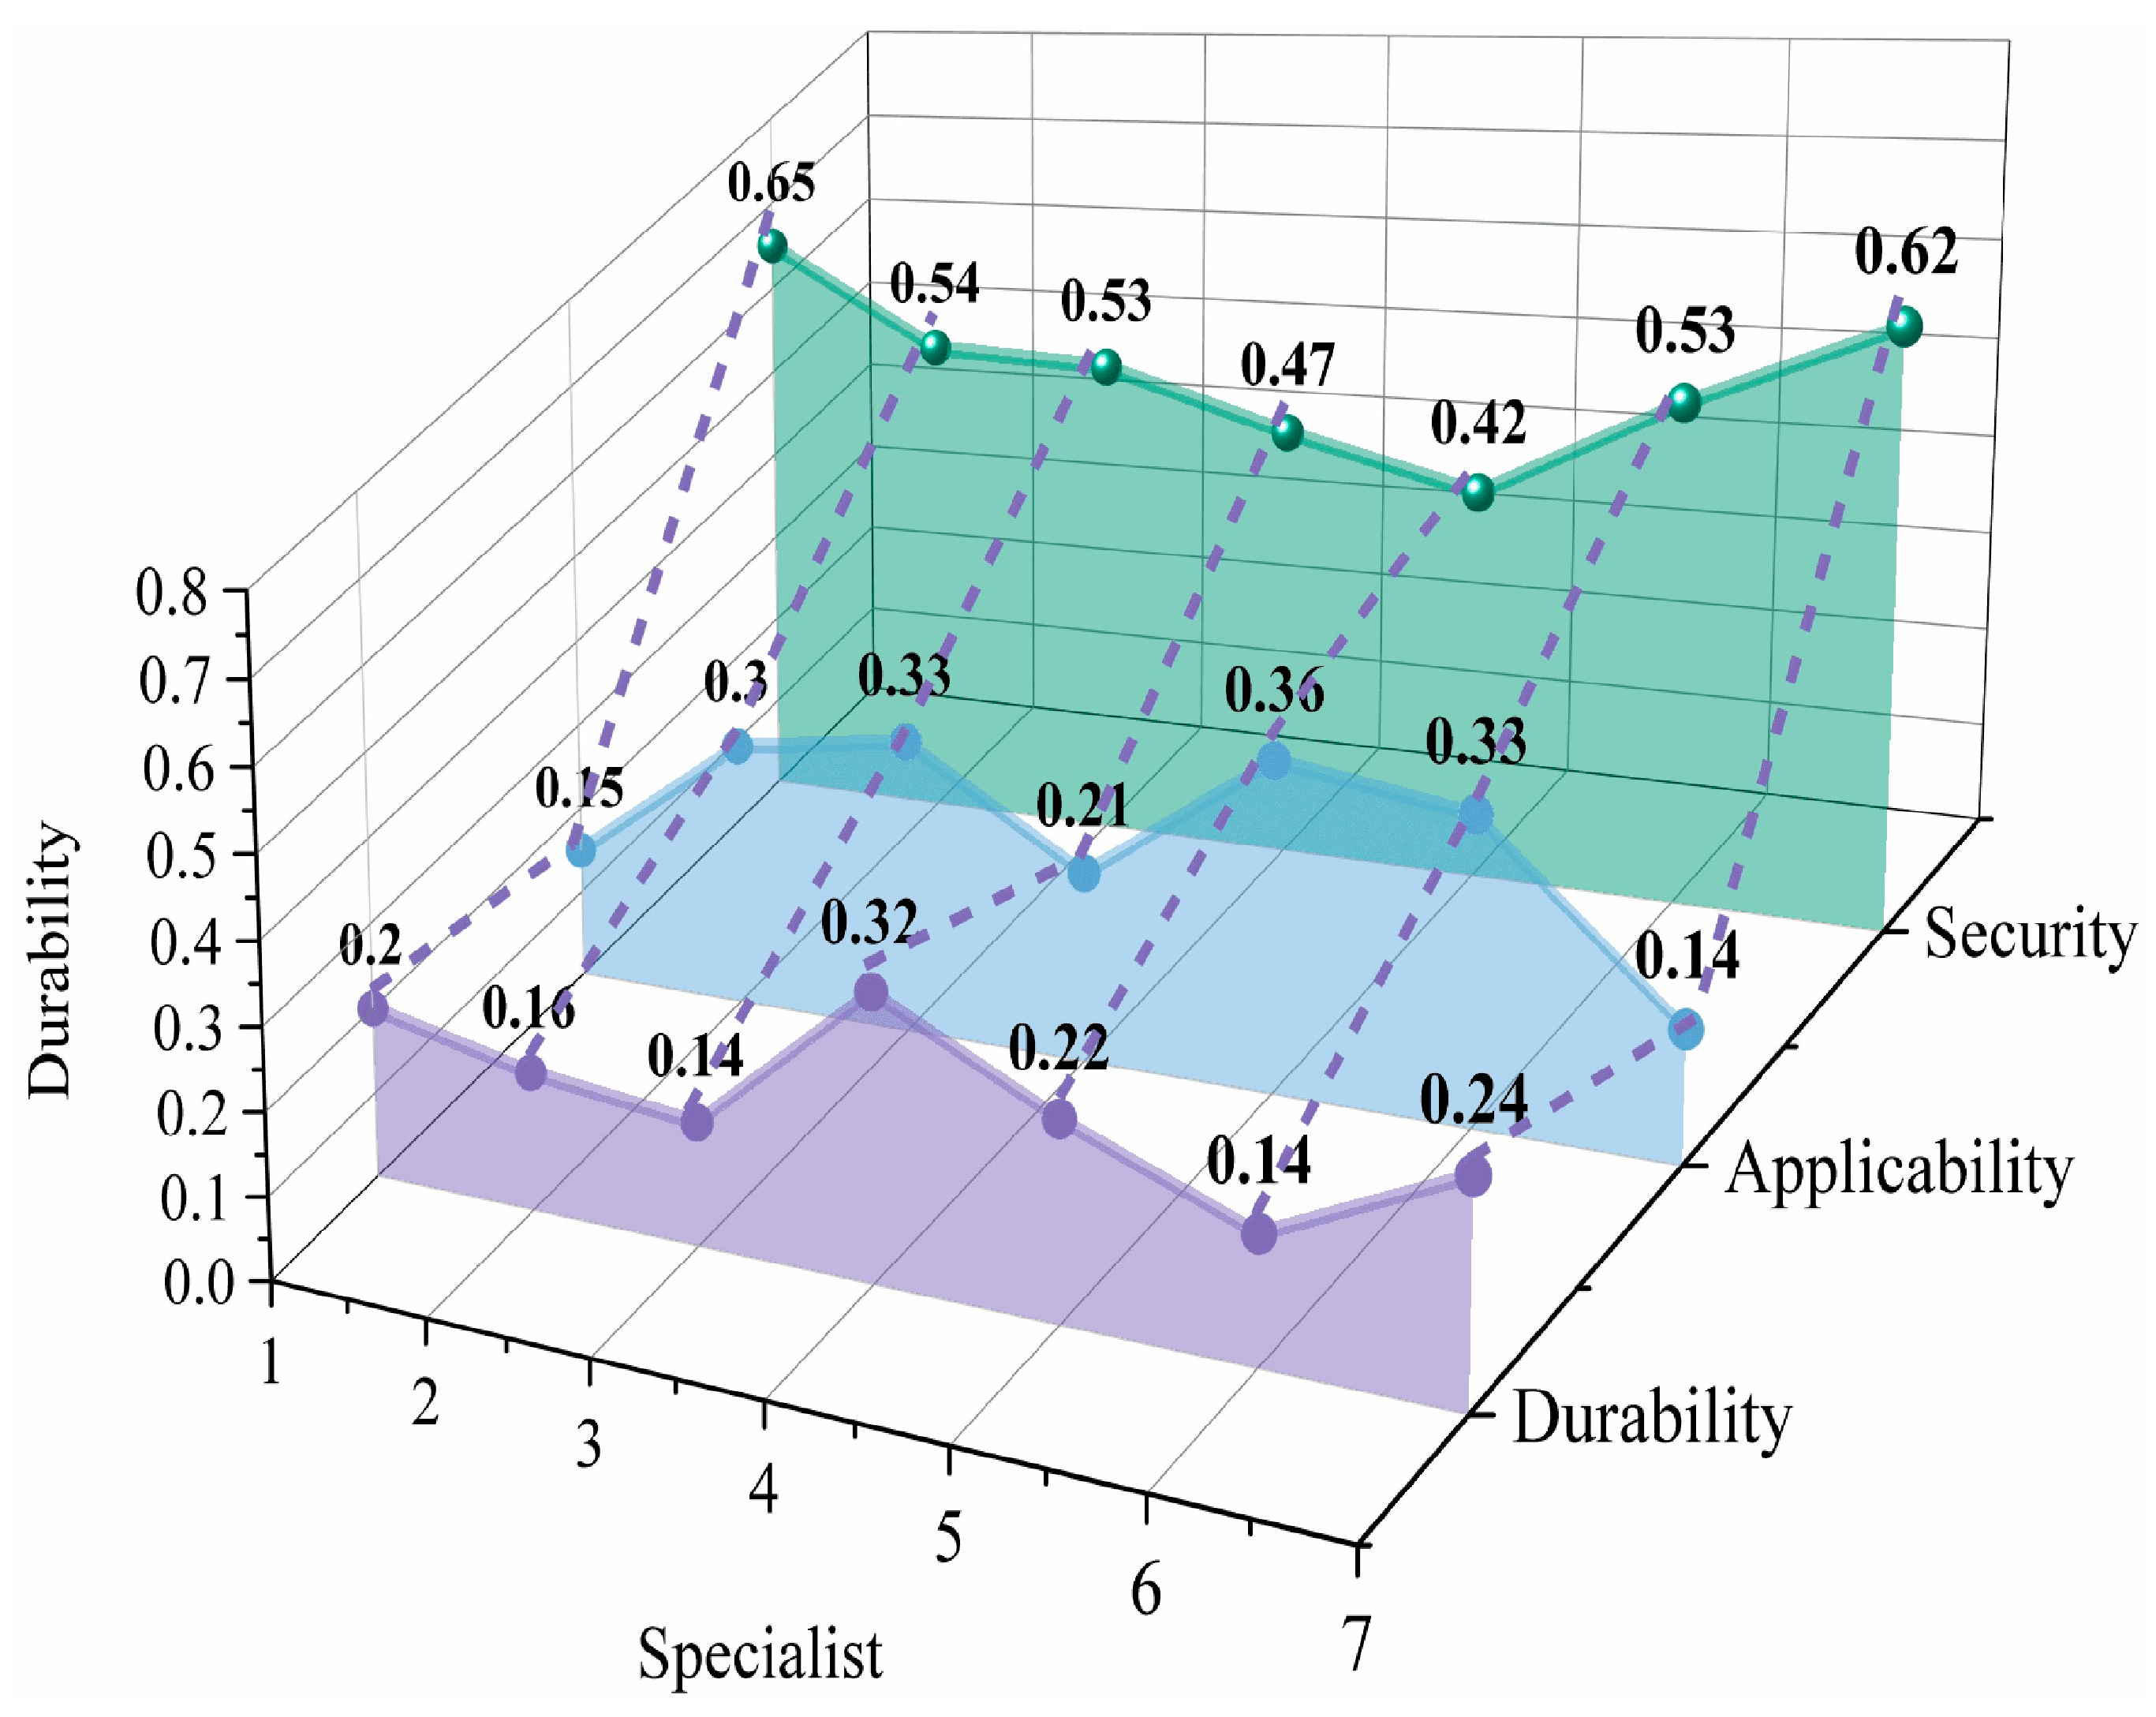
- Entropy objective weights. Aggregating seven prior studies (Table 6 and Figure 6) yielded objective weights of 0.5380, 0.1920, and 0.2600 for safety, applicability, and durability, respectively. Safety received the highest weight, consistent with its priority in most evaluations. However, synthesizing weights from studies with different contexts and standards introduces uncertainty regarding their direct applicability to this case.Table 6. Summary weight of entropy weight method.Figure 6. Objective weights derived from the entropy method for the three primary criteria.
From Table 6 and Figure 6, it is evident that the weight of safety indicators peaks at 0.5380, aligning with the general trend of expert evaluations, thus underscoring safety as the paramount criterion in aqueduct safety assessments. The weight assigned to durability is 0.2600, ranking it second, indicating its substantial impact on the safety evaluation of aqueducts. Although the weight of applicability is relatively lower at 0.1920, it retains significant relevance. Through the entropy weight method, the data variability of each index is quantitatively analyzed, enabling an objective determination of weights. This approach minimizes the influence of subjective human factors, ensuring a more scientific and equitable distribution of weights.
- (3)
- Game theory combined weights. The combined weights were 0.5177 (safety), 0.2089 (applicability), and 0.2734 (durability), with α1 = 0.7394 and α2 = 0.2606.
4.2. Safety Assessment of Aqueduct
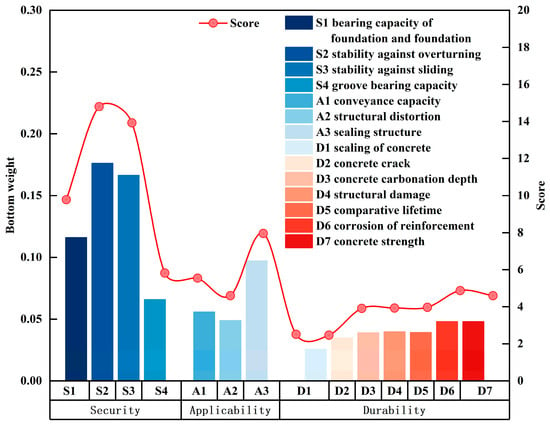
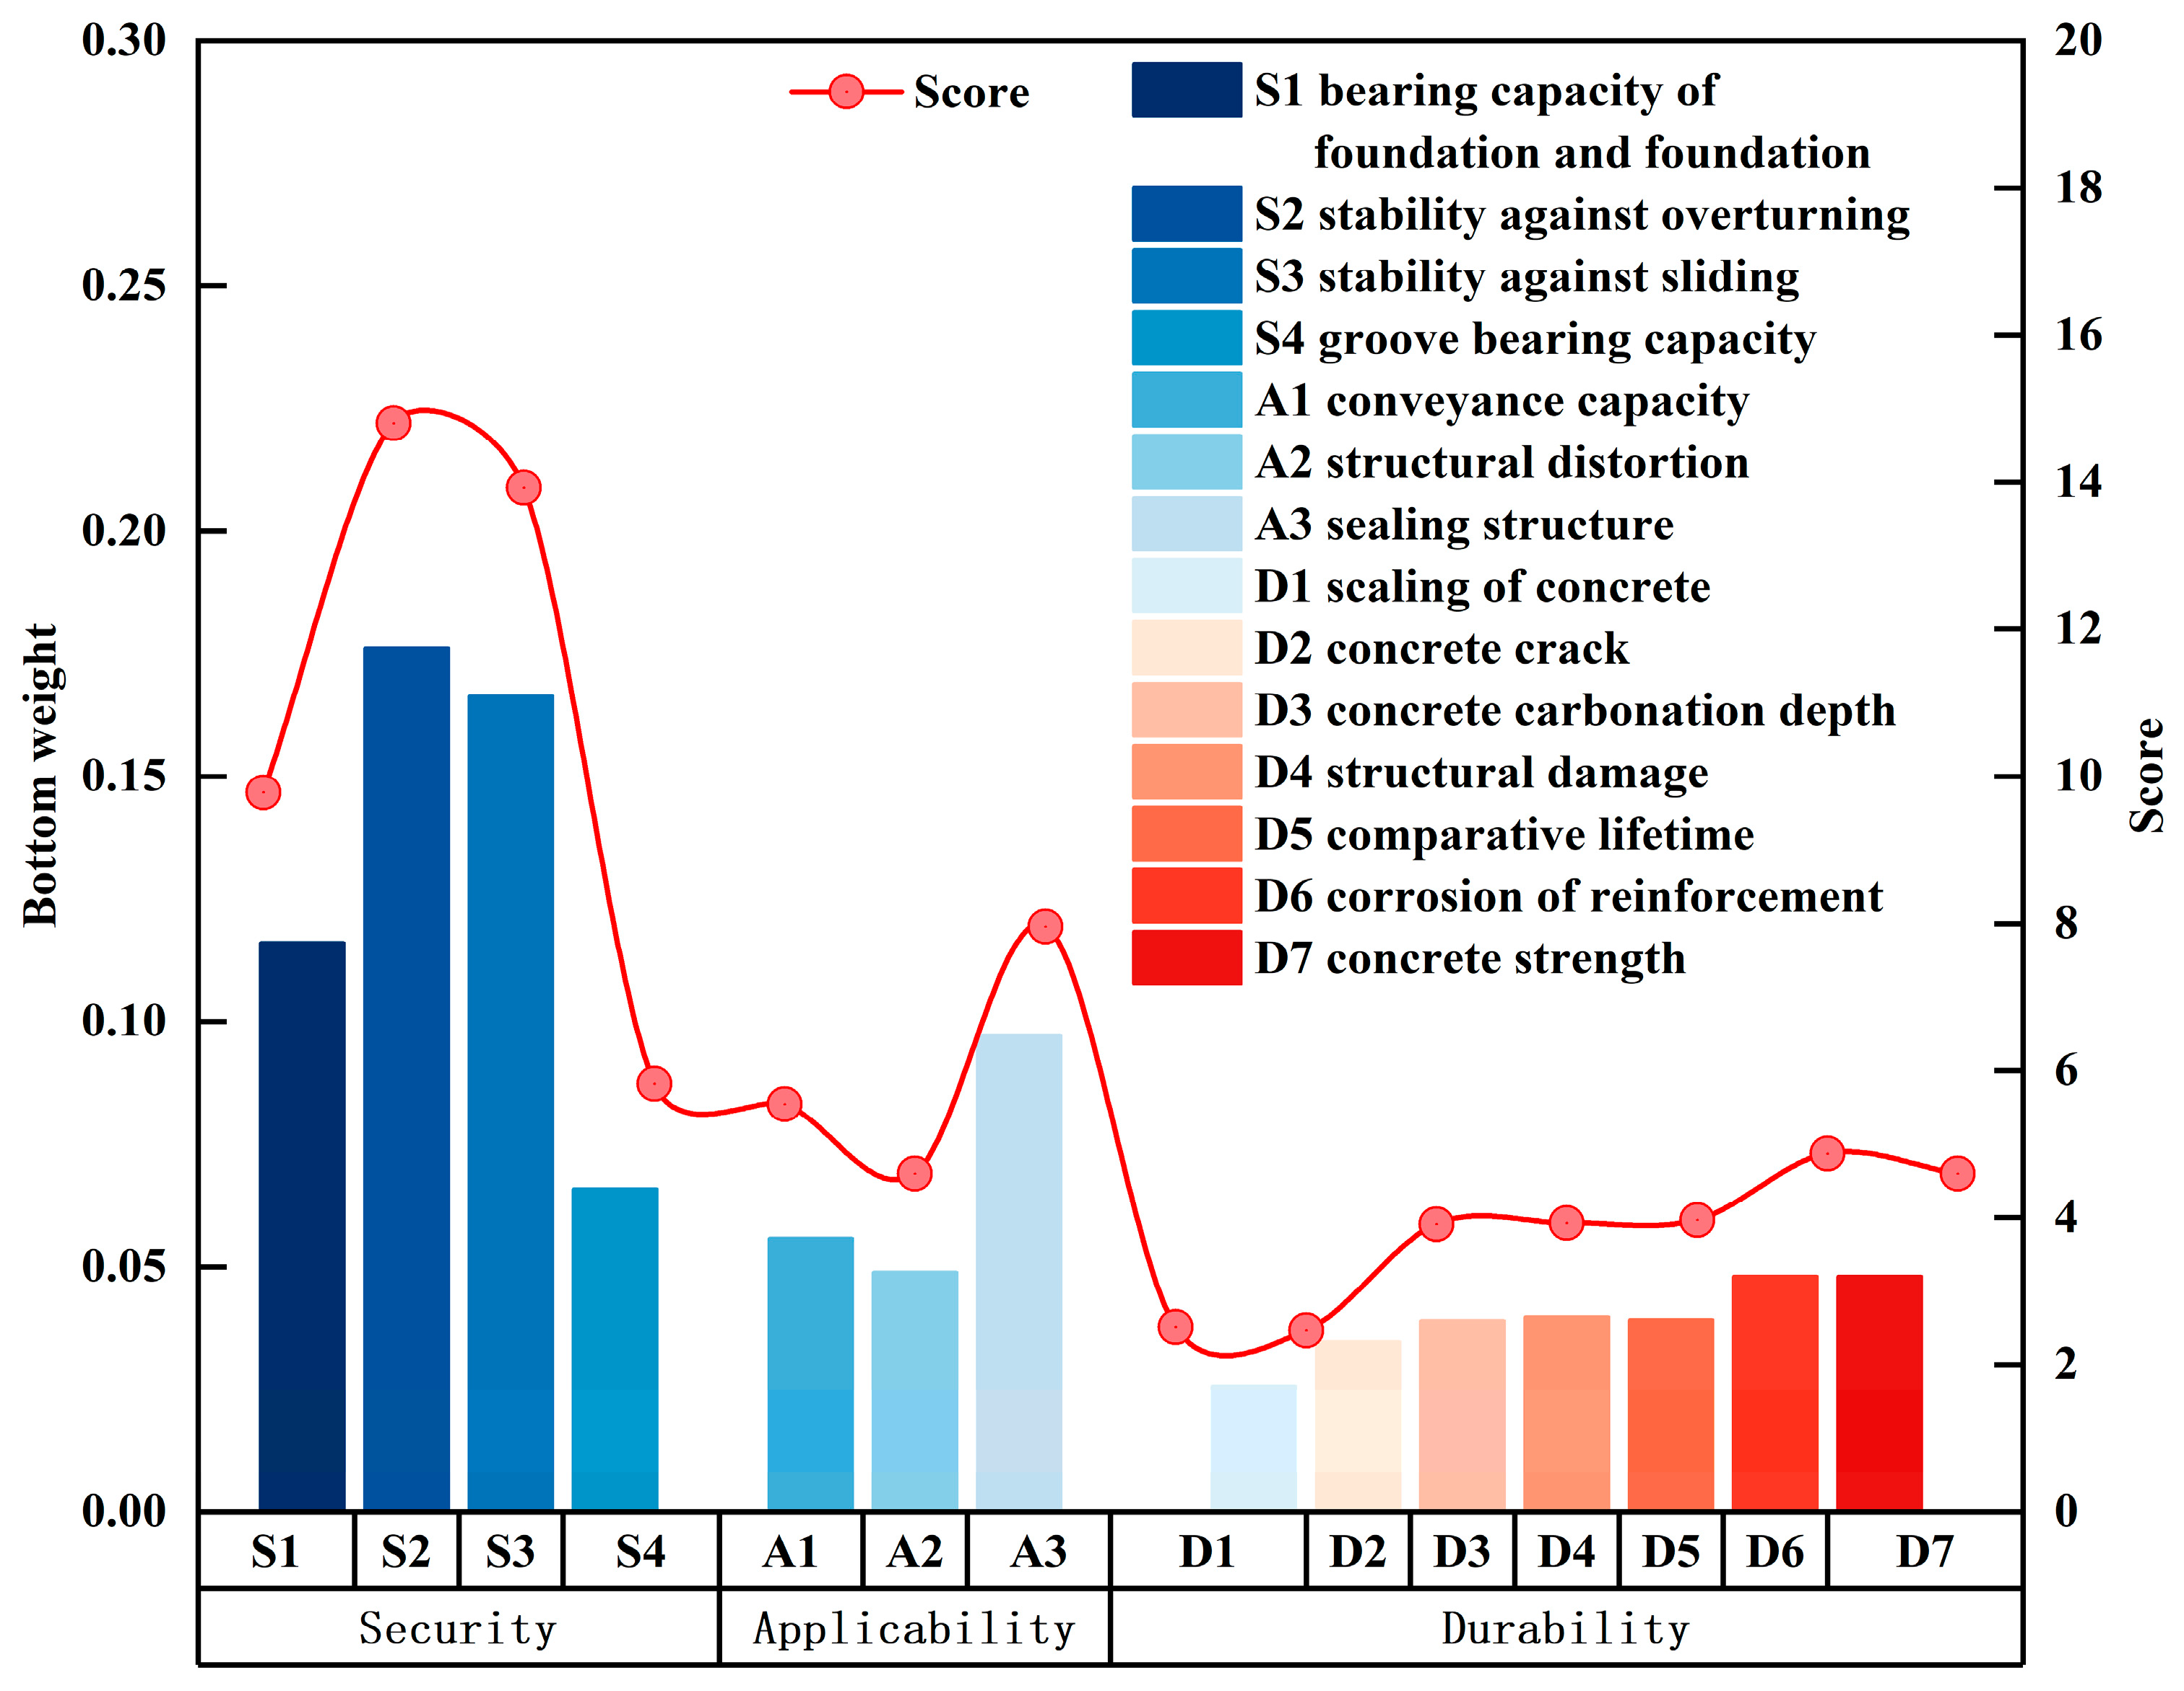
The combined weights (Figure 7) emphasize safety as the most critical criterion. Scoring each indicator against Table 5 and aggregating yields a total score of 87.15, classifying the aqueduct as ‘first class’. It is acknowledged that the use of DB44/T2041-2017 [15], a regional standard from Guangdong Province, is based on the absence of a local standard and similar evaluation principles. Nevertheless, climatic and operational differences may affect the direct transferability of threshold values. Within durability, concrete cracking scored low due to the observed web cracks. Although currently assessed as non-structural, these cracks warrant monitoring and repair (e.g., epoxy injection and surface sealing) to ensure long-term durability.
Figure 7.
Summary of weight of each evaluation index of the Kezi River Aqueduct.
4.3. Results Validation
Field tests confirmed that the concrete strength mostly meets design; carbonation depth is minimal; and max deflection (3.4 mm) and relative residual strain (10.4%) are within limits. These results align with the model’s ‘first class’ conclusion, supporting the aqueduct’s current structural adequacy.
4.4. Comparative Analysis and Methodological Validation
To validate the necessity and superiority of the game theory-based weighting model, a quantitative comparative analysis was conducted against three simplified approaches: the single subjective method (AHP), the single objective method (entropy), and the direct arithmetic mean method (assuming equal reliability, i.e., ). The weight distributions and final evaluation results are summarized in Table 7.
Table 7.
Comparison of weights and evaluation results under different methods.
4.4.1. Analysis of Weight Deviation
As observed in Table 7, although all methods classify the aqueduct as ‘first class’ (level I), the internal distribution of risk weights varies significantly, which affects maintenance prioritization. The entropy method assigned the lowest weight to ‘durability’ (0.2600) solely based on data discreteness. However, given the observed cracks in the aqueduct web (as detailed in Section 3.3), relying purely on data distribution would underestimate the structural durability risks. Conversely, the AHP method assigned a higher weight (0.2782) to durability, reflecting the experts’ engineering judgment regarding potential hazards. The arithmetic mean method () produced a durability weight of 0.2691. By arbitrarily assuming a ‘50/50’ balance, this simple method diluted the critical expert’s warning regarding structural defects. In contrast, the game theory method optimized the coefficients (), mathematically proving that for this specific case, the expert diagnostic model (AHP) holds higher reliability than the available data distribution. Consequently, the game theory weight for durability (0.2734) effectively retains the focus on structural safety while still incorporating necessary corrections from the monitoring data.
4.4.2. Quantitative Verification of Added Value
To address whether the game-theoretic combination offers added value beyond a direct weighted scheme, we calculated the deviation indicator () based on the objective function in Equation (12). This indicator represents the Euclidean distance (inconsistency) between the combined weights and the source information.
Deviation of arithmetic mean (): when applying the simple average (), the calculated deviation is 0.0394.
Deviation of game theory (): with the optimized coefficients (), the deviation is reduced to 0.0104.
The comparison demonstrates that the game theory optimization reduced the information deviation by approximately 73.6% compared to the arithmetic mean method. This significant reduction () serves as concrete evidence that the proposed framework is not merely a complex calculation, but a necessary optimization to minimize information loss and maximize the credibility of the safety assessment.
5. Conclusions
This study integrated field load testing with an AHP-entropy-game theory model to evaluate the Kezi River Aqueduct.
- (1)
- Water filling tests confirmed elastic structural behavior with all key indicators below code limits. Observed web cracks were deemed non-structural based on pattern and global response, though detailed fracture analysis was not conducted.
- (2)
- The combined model produced a safety score of 87.15 (‘first class’), effectively merging subjective and objective weighting.
- (3)
- The primary limitation is the single-case validation, which restricts generalizability. The methodological complexity, while thorough, may be disproportionate for a single case without comparative demonstration against simpler models. Future work should apply this framework to diverse aqueducts to test its robustness, incorporate repeated load cycles and statistical uncertainty analysis, and integrate mechanical crack assessment or finite element modeling for deeper durability evaluation.
In summary, the framework provides a structured, quantifiable approach for aqueduct condition assessment, as demonstrated in this case, but its broader utility requires further validation and potential simplification for routine application.
Furthermore, the comparative analysis confirmed that the game theory-based approach offers substantive added value over simpler weighting schemes. By optimizing the combination coefficients, the proposed framework reduced the information deviation by 73.6% compared to the arithmetic mean method, validating its robustness in balancing subjective expert experience with objective monitoring data.
Author Contributions
J.W.: Conceptualization, Funding acquisition, Methodology, Project administration, Supervision, Writing—review and editing; C.F.: Investigation, Software, Writing—original draft; J.Z.: Conceptualization, Writing—original draft, Writing—review and editing; S.Z.: Conceptualization, Writing—original draft, Writing—review and editing; R.C.: Conceptualization, Funding acquisition, Writing—review and editing. All authors have read and agreed to the published version of the manuscript.
Funding
This research was funded by the Open Fund Project of Key Laboratory of Dam Engineering Safety and Disaster Prevention and Control Corps, grant number TC202507004, and the Natural Science Foundation of Xinjiang Uygur Autonomous Region, grant number 2024D01A73. The APC was funded by Xinjiang Production and Construction Corps.
Institutional Review Board Statement
Not applicable.
Informed Consent Statement
Not applicable.
Data Availability Statement
The data that support the findings of this study are available from the corresponding author upon reasonable request.
Acknowledgments
The authors would like to acknowledge the financial support from the Open Fund Project of Key Laboratory of Dam Engineering Safety and Disaster Prevention and Control Corps (No. TC202507004) and the Natural Science Foundation of Xinjiang Uygur Autonomous Region (No. 2024D01A73).
Conflicts of Interest
Author Rui Cheng was employed by the company XPCC Surveying & Designing Institute Group Co., Ltd. The authors declare that they have no known competing financial interests or personal relationships that could have appeared to influence the work reported in this paper.
References
- Li, H.; Liang, M.; Li, F.; Zuo, J.; Zhang, C.; Ma, Y. Operational safety risk assessment of water diversion infrastructure based on FMEA with fuzzy inference system. Water Supply 2022, 22, 7513–7531. [Google Scholar] [CrossRef] [Scilit]
- Ma, Y.; Wu, Z.; Liu, Z.; Zhang, M.; Aibaidula, M. Seismic fragility analysis of aqueduct structural systems based on G-PCM method. Sustainability 2022, 14, 13161. [Google Scholar] [CrossRef] [Scilit]
- Liu, T.; Zhang, S.; Wang, C. A BIM-based safety management framework for operation and maintenance in water diversion projects. Water Resour. Manag. 2021, 35, 1619–1635. [Google Scholar] [CrossRef] [Scilit]
- Melchers, R.; Beck, A. Structural Reliability Analysis and Prediction; John Wiley & Sons: Hoboken, NJ, USA, 2017. [Google Scholar] [CrossRef] [Scilit]
- Wei, J.; Yan, X. Seismic Fragility of Large-Span Elevated U-Shaped Aqueduct Based on Incremental Dynamic Analysis. Appl. Sci. 2025, 15, 9623. [Google Scholar] [CrossRef] [Scilit]
- Taherdoost, H.; Madanchian, M. Multi-Criteria Decision Making (MCDM) Methods and Concepts. Encyclopedia 2023, 3, 77–87. [Google Scholar] [CrossRef] [Scilit]
- JTG/TJ2l-2011; Specification for Detection and Evaluation of Bearing Capacity of Highway Bridges. People’s Traffic Press: Beijing, China, 2011.
- Zhang, S.; Yu, X.; Mao, H.; Yao, H.; Li, P. Evaluating Expressway Safety Based on Fuzzy Comprehensive Evaluation with AHP–Entropy Method: A Case Study of Jinliwen Expressway in Zhejiang Province, China. Systems 2023, 11, 496. [Google Scholar] [CrossRef] [Scilit]
- Beynon, M. An analysis of distributions of priority values from alternative comparison scales within AHP. Eur. J. Oper. Res. 2002, 140, 104–117. [Google Scholar] [CrossRef] [Scilit]
- Sipahi, S.; Timor, M. The analytic hierarchy process and analytic network process: An overview of applications. Manag. Decis. 2010, 48, 775–808. [Google Scholar] [CrossRef]
- Goepel, K.D. Comparison of judgment scales of the analytical hierarchy process—A new approach. Int. J. Inf. Technol. Decis. Mak. 2019, 18, 445–463. [Google Scholar] [CrossRef] [Scilit]
- Tung, S.L.; Tang, S.L. A comparison of the Saaty’s AHP and modified AHP for right and left eigenvector inconsistency. Eur. J. Oper. Res. 1998, 106, 123–128. [Google Scholar] [CrossRef] [Scilit]
- Cheng, Y.; Wang, Z.; Xu, C.; Cheng, H.; Zhu, X. Safety grade evaluation of aqueduct structure based on fuzzy cloud theory analysis. Teh. Vjesn. 2020, 27, 874–882. [Google Scholar] [CrossRef] [Scilit]
- Saaty, R.W. The analytic hierarchy process—What it is and how it is used. Math. Model. 1980, 9, 161–176. [Google Scholar] [CrossRef] [Scilit]
- DB44/T2041-2017; Aqueduct Safety Appraisal Procedure. China Water Conservancy and Hydropower Press: Beijing, China, 2017.
- ACI 224.1R-07; Causes, Evaluation, and Repair of Cracks in Concrete Structures. American Concrete Institute: Farmington Hills, MI, USA, 2007.
- SL191-2008; Code for Design of Hydraulic Concrete Structures. China Water Resources and Hydropower Press: Beijing, China, 2009.
- Wang, Y.; Zhang, Z.; Ren, J.; Wang, T.; Liu, J. Comprehensive evaluation of large-scale aqueduct safety based on dynamic weight-cloud model. J. Hohai Univ. (Nat. Sci.) 2023, 51, 56–63. [Google Scholar] [CrossRef]
- Wang, Y.; Ma, X.; Lu, L. Study on comprehensive safety evaluation of aqueduct project in Ningxia Yellow River irrigation area. J. Water Conserv. Constr. Eng. 2017, 15, 89–94. [Google Scholar]
- Zhang, W.; Du, Y.; Zhang, Y. Fuzzy comprehensive evaluation of the health status of aqueducts. J. Irrig. Drain. 2018, 37, 86–91+116. [Google Scholar]
- Luo, R.; Huang, J.; Tu, J.; Li, Z.; Xu, Y. AHP comprehensive evaluation method of aqueduct safety based on group decision-making. J. Water Conserv. Constr. Eng. 2020, 18, 198–203+220. [Google Scholar]
- Luo, R.; Huang, J.; Li, Z. Comprehensive evaluation of aqueduct safety based on improved FCE. J. Hohai Univ. (Nat. Sci. Ed.) 2021, 49, 162–169. [Google Scholar]
- Wang, Z.; Du, Y. Comprehensive evaluation of aqueduct health status based on SQL-Server database. Hydropower 2022, 48, 123–129. [Google Scholar]
- Yang, C. Shangwu Aqueduct Structure Safety Assessment Research. Master’s Thesis, Anhui Jianzhu University, Hefei, China, 2023. [Google Scholar]

Disclaimer/Publisher’s Note: The statements, opinions and data contained in all publications are solely those of the individual author(s) and contributor(s) and not of MDPI and/or the editor(s). MDPI and/or the editor(s) disclaim responsibility for any injury to people or property resulting from any ideas, methods, instructions or products referred to in the content. |
© 2026 by the authors. Licensee MDPI, Basel, Switzerland. This article is an open access article distributed under the terms and conditions of the Creative Commons Attribution (CC BY) license.