


Abstract
Coal mining has generated a large amount of underground space, which has traditionally been reused mostly as mine wastewater storage. Given the excellent thermal insulation properties of these mine reservoirs, their potential for seasonal energy storage is considerable. However, research on cross-seasonal thermal energy storage utilizing coal mine underground reservoirs remains limited, and the thermal storage characteristics of such systems throughout their entire operational cycle are not yet fully understood. This study employs numerical simulation methods to analyze the thermal storage performance of a cross-seasonal thermal storage system based on a coal mine underground reservoir throughout a fully operation cycle. Based on the actual geological conditions of the Daliuta Coal Mine in the Shendong Mining Area, we established a thermal-fluid coupling model for a coal mine underground reservoir. Using this model, we analyzed the entire process of the heat injection stage, heat storage stage, and heat production stage within the cross-seasonal thermal energy storage system. Based on the model, the feasibility of utilizing a coal mine underground reservoir for cross-seasonal thermal energy storage was evaluated, and the system’s thermal storage performance was assessed. Results indicate that under current geological conditions of the Daliuta Coal Mine and designed operating parameters, the effective heat storage rate of the cross-seasonal system can reach 78.16%. Through investigation of the thermal storage process, the distribution evolution of hot water and heat dissipation mechanisms were thoroughly analyzed. This study identified the heat storage phase as the primary stage controlling heat loss and discussed key influencing factors affecting the thermal storage process. These findings provide novel insights for utilizing coal mine goafs and residual underground spaces, offering a reference for developing and designing novel energy storage facilities.
1. Introduction
Coal resources occupy an important role in the global energy landscape. The large-scale extraction of coal, however, exerts a substantial impact on mining area environments and its subsurface structures. On the one hand, mining activities are typically accompanied by the wastage of large volumes of mine water and the depletion of water resources [1,2]. On the other hand, with the extraction of coal resources, a large number of goaf areas have been generated, forming a vast quantity of subsurface void space [3]. These underground voids not only can cause ground subsidence and affect the stability of surface structures but also can have severe impacts on surface water bodies and groundwater systems [4,5,6]. Studies indicate that by 2030 the number of closed and abandoned coal mines in China could reach 15,000 [7]. Handling these mines and the underground voids through conventional methods to prevent impacts of the abandoned spaces on surface and subsurface environments still presents considerable challenges.
To address this issue, researchers proposed the concept of coal mine underground reservoirs (CMURs), which refer to enclosed underground water storage areas formed by utilizing the goaf created after coal seam extraction, utilizing surrounding coal pillars and artificial dam structures [8]. This structure enables the direct creation of underground water storage spaces, facilitating the storage and management of water in mining areas. This approach prevents the wastage of water resources generated during coal mining operations. Chen et al. [7] first proposed the concept of CMURs and investigated their water storage applications and feasibility for mine water management. Based on this, the Daliuta Coal Mine in the Shendong Mining Area conducted a field test on CMURs, studying the practical feasibility of establishing CMURs within goaf areas. Field tests were performed to evaluate the reservoirs’ water storage capacity, yielding favorable results [8]; Zhang et al. [9] analyzed the water storage process of a CMUR at the Zhangshuanglou Coal Mine in Xuzhou and evaluated its impact on groundwater protection. Chi et al. [10] employed a fuzzy integrated discrimination method to conduct a detailed analysis of the impact of CMURs on groundwater resource carrying capacity in the Shendong Mining Area from 2009 to 2021. The results indicate that CMURs significantly enhanced the groundwater resource carrying capacity of the mining area, demonstrating positive implications for the healthy development of the regional ecosystem. Building upon this, Chi et al. further investigated the CMUR water management method and proposed fundamental theories and methodologies for water management and forecasting [11,12]. These studies confirm the potential of CMURs for mine water storage and their significant role in groundwater protection while also establishing the fundamental theories and methods for CMUR water volume management. Additionally, researchers have conducted extensive studies on rock mechanics [13,14] and hydrogeochemical [15,16] issues related to CMUR construction and operation. While these studies provide valuable references for CMUR design and operational management, their primary focus remains on water storage applications, with minimal exploration of other potential uses for CMURs.
In recent years, the demand for cross-seasonal thermal energy storage utilizing geological formations has grown. Several large-scale engineering methods for thermal energy storage have now been developed. These methods can be categorized into two types based on the storage mechanism: pit thermal energy storage (PTES) [17,18] and aquifer thermal energy storage (ATES) [19,20]. PTES, due to its large water storage capacity, possesses significant thermal storage potential. It can be readily integrated with industrial waste heat and other heating sources (such as solar thermal energy), further enhancing thermal storage efficiency and reducing operational costs of the thermal storage system [21,22]. Moreover, during heat storage using PTES, thermal stratification occurs within the water pit. It reduces heat dissipation and enhances the heat storage efficiency [23,24]. However, PTES systems typically occupy large areas and involve significant construction costs, limiting their application and promotion [18]. In contrast, ATES offers low costs and minimal heat loss. Due to the low thermal conductivity of geological formations, temperatures can be maintained for several months or even more than a year without substantial dissipation, resulting in stable thermal storage performance [25,26]. However, it demands stringent geological site conditions. The common practice of directly reinjecting hot water into aquifers poses significant environmental risks. Furthermore, its thermal storage capacity is typically limited. Consequently, its current application is restricted to formations with high water content and substantial water-holding capacity [27,28].
Given the extensive continuous underground water-bearing spaces within CMURs and that the surrounding rock typically consists of low-thermal-conductivity mudstones and sandstones, utilizing CMURs for underground thermal energy storage combines the advantages of both ATES and PTES methods to achieve efficient thermal energy storage in underground spaces. This approach is commonly referred to as the coal mine underground reservoir-based thermal energy storage (CMUR-TES) method. This approach avoids the substantial construction demands of PTES while enabling large-scale, continuous-water-body thermal storage with high heat capacity for seasonal energy transfer. However, current research on CMUR-based seasonal thermal storage remains limited, with only a few studies conducting numerical simulations.
Wang et al. [29] utilized numerical simulation methods to analyze the high-temperature thermal storage performance of a CMUR-TES system in the Shendong Mining Area. Vukelic et al. [30] analyzed the utilization potential of shallow geothermal energy in closed coal mines, examining the performance and characteristics of utilizing abandoned coal mines for aquifer thermal energy storage. Wang et al. [31] studied an abandoned coal mine in Shandong, China, analyzing the feasibility of utilizing mine water for clean heating and cooling applications. They also determined the impact of different tunnel types on thermal effects. These studies not only validate the feasibility of CMUR in constructing thermal energy storage systems but also demonstrate that CMUR-TES holds broad research prospects for cross-seasonal thermal energy storage. However, their study only considered the heat storage and heat generation processes, without evaluating the impact of the injection process.
Although some researchers have conducted studies on CMUR-TES, most investigations have focused on a single thermal storage cycle or the heat exchange performance of surface equipment, with limited attention given to the thermal storage capabilities of the CMUR itself. Existing research on system thermal storage performance has not adequately considered the impact of the hot water injection process on the overall heat generation capacity of the system, which poses a disadvantage for accurately evaluating the system’s thermal storage capabilities. A thorough analysis of the CMUR’s thermal storage performance and its evolution during cross-seasonal storage processes is crucial for accurately evaluating the CMUR-TES system’s thermal storage capabilities and determining its operational parameters. To address this, this study establishes a numerical model based on the actual conditions of the abandoned working face at the Daliuta Coal Mine in the Shendong Mining Area. It simulates and analyzes a complete thermal storage cycle of the CMUR-TES system, evaluates the overall thermal storage performance and heat transport characteristics at each stage, and discusses the impact of key operational parameters on the system configuration. This study refined the evaluation of CMUR-TES thermal storage performance, particularly by fully accounting for the impact of hot water injection on system thermal storage. It demonstrated the feasibility of cross-seasonal thermal storage using CMUR-TES and analyzed the primary factors influencing the system’s thermal storage capabilities. This study provides valuable reference for the design and assessment of CMUR-TES.
2. Problem Setup
2.1. Concept Model of CMUR-TES
This study utilized the actual conditions of the 52503-working face in the 5-2 coal seam of the Daliuta Coal Mine in the Shen Dong mining area of China to establish the basic model of CMUR-TES. The 5-2 coal seam is one of the main coal seams mined in the Daliuta Coal Mine, and years of mining have formed a large number of goafs [7]. The 52503-working faces involved in this study was completed in 2019. According to the publicly available data, there are low-permeability mudstone and sandy mudstone distributed above and below the 52503-working face [32,33]. To address water consumption in coal mining and the waste of groundwater through drainage, the Daliuta Coal Mine built a CMUR at the 52503-working face to store mining-generated groundwater. The reservoir, located at a depth of 420 m, is surrounded by anti-seepage layers, and the low-permeability mudstone above and below the coal seam further ensures the stability and safety of water storage [7].
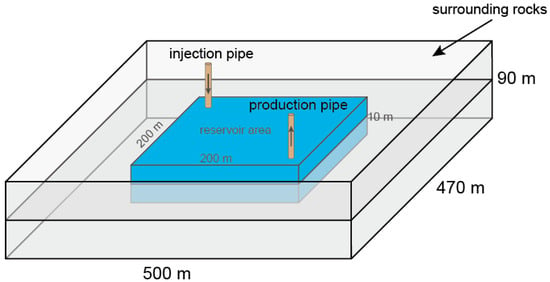
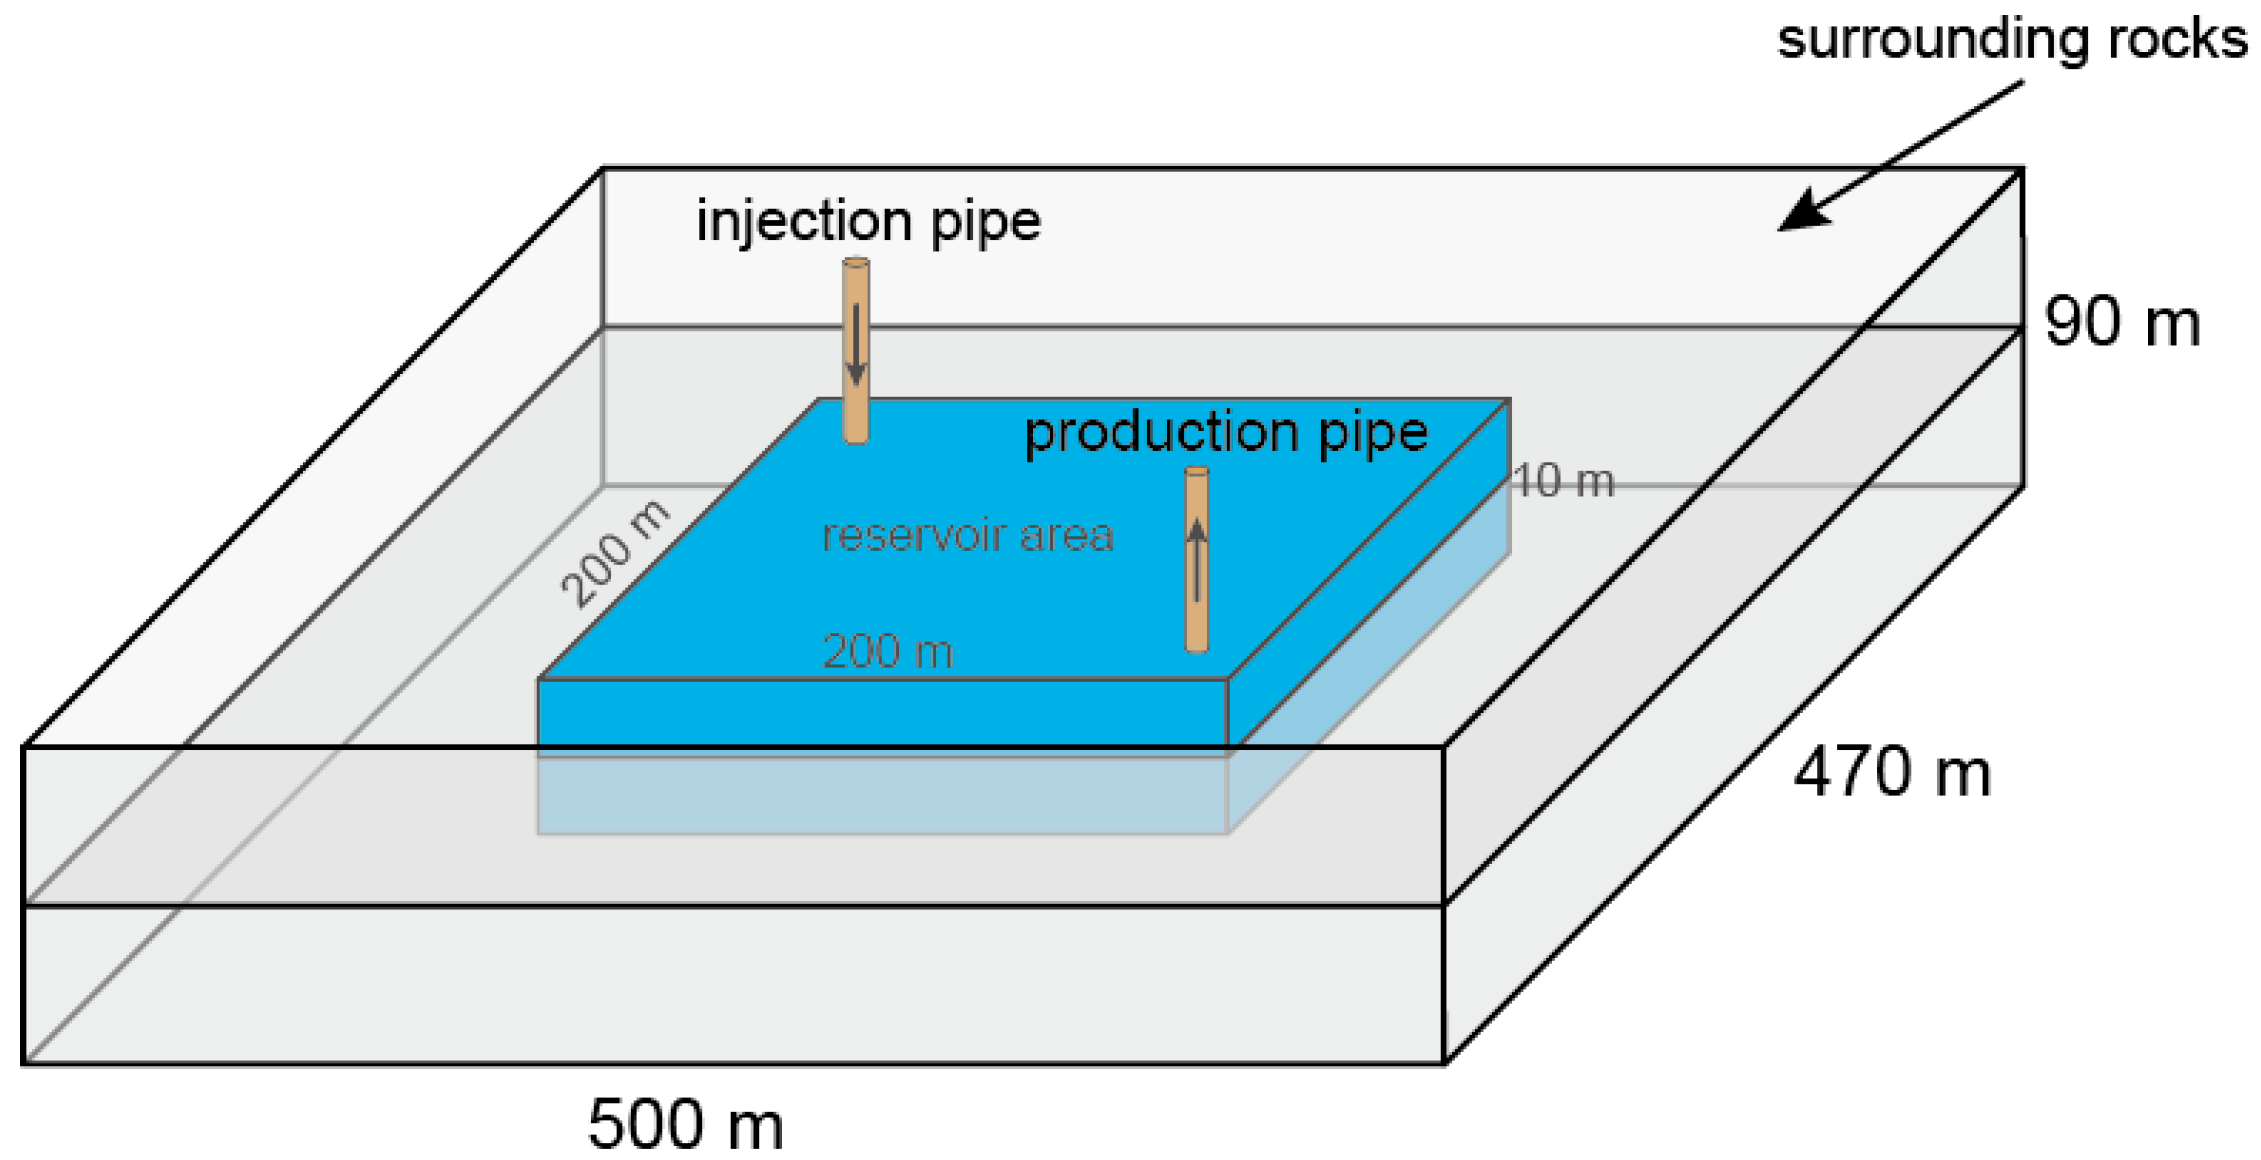
The conceptual model is illustrated in Figure 1. The CMUR-TES system comprises two parts: the reservoir area designated for hot water storage and the surrounding rock around the reservoir area. Based on the geological conditions at the Daliuta Coal Mine, the reservoir area is set to a cuboid with edge dimensions of 200 m × 200 m × 10 m, providing a total reservoir volume of 4 × 10⁵ m3; the surrounding rock is defined as a larger cuboid with edge dimensions of 500 m × 470 m × 90 m. The reservoir is centrally positioned within the domain, with a vertical boundary of the reservoir of 40 m and a lateral boundary exceeding 100 m from the model boundaries. This configuration minimizes boundary-induced influence on heat transfer in the surrounding rock, thereby improving simulation accuracy. In practice, pipeline systems at two diagonal corners of the reservoir area enable water injection and extraction; in the numerical model, these are represented as point sources for injection and extraction.
Figure 1.
Conceptual model of CMUR-TES.
The system operates in three sequential stages: First, during the heat injection stage (HIS), water is extracted from the reservoir via pumping points, heated at the surface, and reinjected into the reservoir area through injection points. This process only heats the initial water within the reservoir area without altering the total water volume. Next is the heat storage stage (HSS). During this stage, the heated water is contained within the reservoir area. In the HSS, the hot water exchanges heat with the surrounding rock, and a portion of the heat in the water is lost to the rock, causing the temperature of the water in the reservoir to decrease. The third stage is the heat production stage (HPS). During this stage, hot water is extracted to the surface via pumping pipes, while the tailwater is returned to the system through injection pipes. The entire operation involves only heat transfer without consuming water, which conforms to the basic requirements for water resource conservation.
2.2. Governing Equations of CMUR-TES
The physical processes in CMUR-TES are divided into fluid flow and heat transfer. Fluid flow differs between the surrounding rock, which is modeled as a porous medium, and the reservoir area, which contains continuous liquid. The model includes fluid seepage from the reservoir boundary into the surrounding rock. Heat transfer is described by convection–conduction equations, with separate formulations for each region to reflect their different thermal behaviors. The governing equations for each physical process are described in the sections below.
2.2.1. Governing Equations for Fluid Flow
- (1)
- Fluid flow in the reservoir area
As mentioned earlier, the fluid within the reservoir area is a continuous fluid. Therefore, we use the Navier–Stokes (N–S) equation to govern the fluid flow, which is as follows:
where and are the velocity and pressure of fluid in the reservoir area; and are fluid density and dynamic viscosity, respectively; and is the gravitational acceleration. Boldface in the formulas denotes vectors. Equations (1) and (2) account for the fluid’s motion under the influences of gravity, pressure, and viscosity; when combined with boundary conditions, they can simulate the flow of water within a reservoir area.
- (2)
- Fluid flow in the surrounding rocks
Because the surrounding rock is regarded as a porous medium, the fluid flow within it is described by the continuity equation for seepage, as shown in Equation (3):
where and are the porosity and permeability of rocks; is the fluid pressure in the surrounding rocks; and is the mass recharge source of the seepage field.
2.2.2. Governing Equations for Heat Transfer
- (1)
- Heat transfer in the reservoir area
During the heat transfer processes within a reservoir area, the heat transfer is governed by the convection–diffusion equation of heat, which is as follows:
where is the heat capacity of the fluid; is the fluid temperature in the reservoir area; is the thermal conductivity of the fluid; is the additional heat sources; and is the fluid velocity in the reservoir area, and it is calculated by Equations (1) and (2).
- (2)
- Heat transfer in the surrounding rocks
Heat transfer in the surrounding rock is governed by the heat convection–diffusion equation. Because the surrounding rock is treated as a porous medium, some parameters in the equation depend on the physical properties of both fluids and the rock matrix. Given its low permeability, fluid flow in the pores is very slow, so the local thermal equilibrium assumption is applied, which means that pore fluid and rock matrix temperatures are equal at all times. The governing equation for heat transfer in the surrounding rock is as follows:
where is the mass heat capacity of the saturated rock, which can be calculated by ; and are the density and heat capacity of the rock matrix, respectively; is the temperature of the surrounding rocks; is the thermal conductivity of the saturated rock; is the additional heat source; and is the fluid velocity in the surrounding rocks, which is computed using Darcy’s law:
2.3. Boundary and Initial Conditions
Based on the actual CMUR-TES structure, the boundary conditions include the exterior boundaries of the surrounding rock and the interface conditions between the reservoir area and the surrounding rock. Because the boundary of the surrounding rock is far away from the reservoir boundaries (more than 100 m horizontally and 40 m vertically), changes in pore pressure and temperature within the rocks during the simulation will not affect the boundary; therefore, the exterior boundaries of the surrounding rock in the model are set as zero-flux boundaries for temperature and pore pressure. This approach reduces the computational overhead and ensures the accuracy of the model, thereby facilitating the numerical simulation. For the interface conditions between the reservoir zone and the surrounding rock, the model imposes continuity conditions for the fluid flow and temperature. In other words, the fluid velocity and the fluid temperature are equal on both sides of the interface, namely
where is the fluid exchange between the reservoir area and the surrounding rocks. Equations (7) and (8) are only satisfied at the boundary between the reservoir area and surrounding rocks.
Site test data show a geothermal gradient of approximately 1.4 °C/100 m in the shallow stratum (1~1000 m) [7], resulting in only about a 1.5 °C temperature difference between the model top and bottom. Therefore, the initial temperature is uniformly set to 35 °C across the model. For fluid pressure, the surrounding rock is initialized under hydrostatic conditions based on a depth of 380 m to the model top (420 m to the reservoir top), that is, pore pressures of 3.025 MPa at the top and 4.707 MPa at the bottom in the surrounding rock. In the reservoir area, pressure is balanced relative to the static water level at its top, and the initial fluid temperature is set to 30 °C. During operation, circulating water is injected at a constant pressure and produced at a constant flow rate via point sources located at opposite corners of the reservoir, as shown in Figure 1.
2.4. Model Parameters
According to the actual geological conditions, the surrounding rock of the entire model is in mudstone, so the surrounding rock of the model can be regarded as homogeneous [7]. Table 1 shows the thermal physical parameters used in the model.
Table 1.
Values of thermal–physical parameters.
2.5. Simulation Scheme and Software
This study employed COMSOL Multiphysics 6.3 for modeling and computer simulation. The fluid flow in the reservoir area was described through the laminar flow interface in the software, while the flow in the surrounding rock was simulated using the groundwater flow interface. The heat transfer process was achieved by the porous media heat transfer interface; within this interface, the reservoir area was set as a “fluid” domain to enable numerical simulation of continuous fluid. Within the “fluid domain”, the convective heat transfer calculation automatically invokes the velocity field solved by the laminar flow module, ensuring the accuracy of physical coupling. The software includes all necessary initial and boundary conditions, as well as the connection condition model between the reservoir area and the surrounding rock, facilitating the efficient construction of the CMUR-TES numerical model. The geometric model was established using the built-in tools of the software and meshed with the built-in mesh generator. After mesh convergence verification, the predefined “Extra Fine” mesh setting was selected to ensure computational convergence while minimizing the calculation time as much as possible.
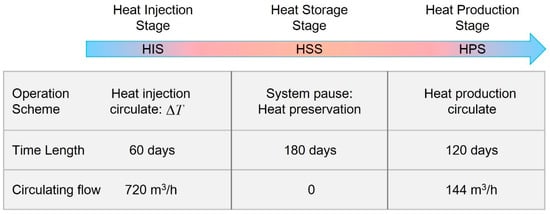
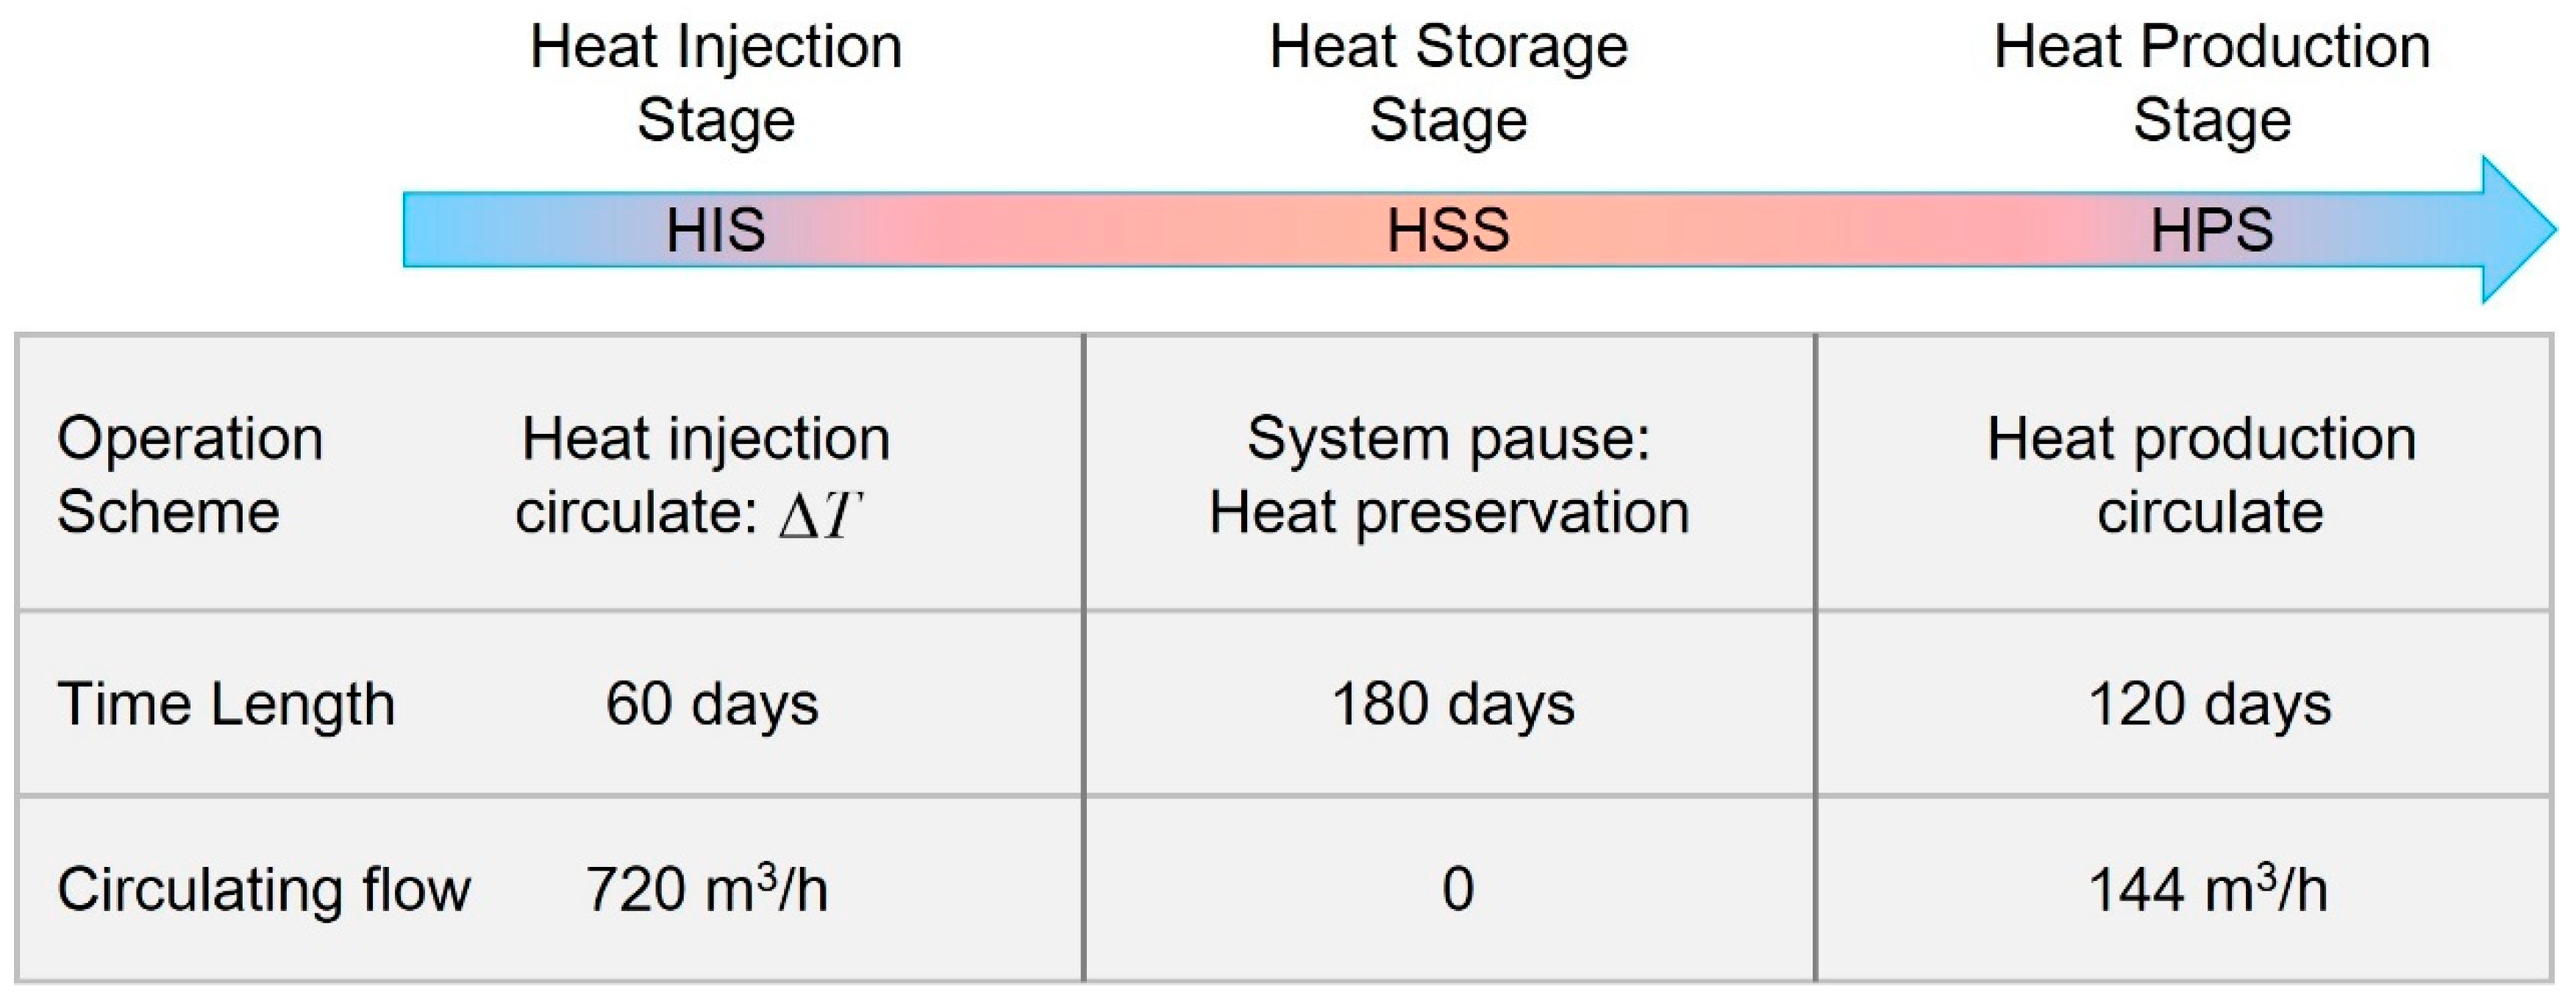
The model simulates the operation of the system in three stages throughout an entire heat storage cycle, namely the HIS, HSS, and HPS, as shown in Figure 2. Each stage has a distinct operating mode. The HIS lasts 60 days and aims to maximize heat injection into the reservoir area by circulating water at 20 °C above the initial temperature. To maintain a constant net water volume, water is injected at 720 m3/h and 50 °C, with an equal flow rate extracted at the production point. After heat injection, the system pauses, and the HSS starts. Due to the rock’s low thermal conductivity, the stored heat inside the hot water remains largely retained during this stage. The duration of this stage is 180 days, which meets the current operating conditions of CMUR-TES and is also the longest cross-seasonal heat storage time (from summer to winter). After the HSS, the system enters the HPS. Hot water is extracted from the reservoir via the production point for surface utilization, and the cooled tail water is reinjected at the same rate through the injection point to maintain water balance and prevent waste. The full cycle lasts 360 days, encompassing all CMUR-TES operational stages. The simulation uses an automatic time step controlled by the software, with a maximum of 1 day.
Figure 2.
Operational process configuration for CMUR-TES within a thermal storage cycle.
In addition, to analyze the influence of the main engineering parameters of the CMUR-TES model on the system performance, a parameter sensitivity analysis is conducted in this study. The analysis examined the impact of thermal conductivity, the specific heat capacity of the surrounding rock, and the injection temperature of hot water during the heating stage on the system performance during operation. The relevant parameter values are detailed in Table 2.
Table 2.
Simulation scheme and parameter setup.
3. Results and Analysis
3.1. Heat Injection Performance Analysis: 0~60 Days (60 Days)
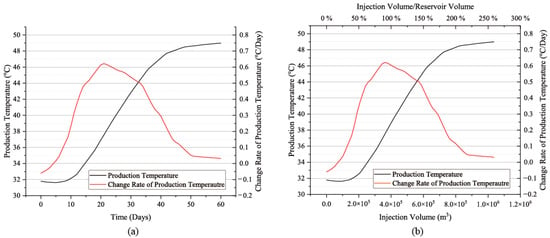
During the HIS, the production temperature is the most direct result monitored by the system. Figure 3 illustrates the evolution of the production temperature from the CMUR-TES system throughout the HIS. To quantitatively analyze the impact of the injection process on water temperature in the reservoir area, we investigated not only the evolution of production temperature over time (Figure 3a) but also its evolution with the injected water volume (Figure 3b). As shown in Figure 3a, the production temperature initially decreases slightly during the first 5 days, followed by a continuous rise until it stabilizes near 49 °C. The rate of change in production temperature indicates a slight decrease in output temperature during the initial 5 days, though the decline was minimal at approximately 0.05 °C/day. Thereafter, the rate of temperature changes began to rise rapidly, peaking at approximately 0.62 °C/day. Subsequently, it started to gradually decrease, falling below 0.05 °C/day as the injection cycle approached 50 days. The rate continued to decline thereafter yet remained above 0 until day 60.
Figure 3.
The evolution process of production temperature with time (a) and injection volume (b) during the HIS.
The results show that during the heat injection cycle of the system, hot water was continuously injected into the reservoir, while cold water in the reservoir was constantly discharged. However, throughout the 60-day injection process, the production output temperature never reached the injection temperature (50 °C), and although it still showed a slow upward trend on the 60th day, in actuality, the production output temperature had basically stabilized at the 50th day with a very small increase thereafter, negligible compared to the earlier period. From this, two conclusions can be drawn: First, in the heat injection process of the CMUR-TES system, there is an upper limit to the total heat storage capacity of the system, and this limit is lower than the theoretical heat storage capacity (THSC), which means that heat is stored when the reservoir area is filled with water at the designated high temperature. Second, after a period of heat injection operation, although the production output temperature still shows a slight increase, its rate of change is extremely low. When the system enters this state, the effect of continued heat injection on increasing the heat storage capacity is very limited, and heat injection should be stopped; the CMUR-TES system should be transferred to the HSS. For the current CMUR-TES system, after 50 days of heat injection, it approached the heat injection limit, and the contribution of the subsequent 10 days of heat injection is minimal and can be omitted in actual operation.
The circulating water volume determines when the system reaches its heat storage limit. As shown in Figure 3b, circulating the reservoir volume (4 × 10⁵ m3) only results in the production temperature reaching about 50% of its maximum; however, when the circulated volume exceeds twice the reservoir volume, the output temperature stabilizes. This indicates that CMUR-TES must circulate more than twice the reservoir’s volume to reach the ultimate thermal storage capacity (UTSC).
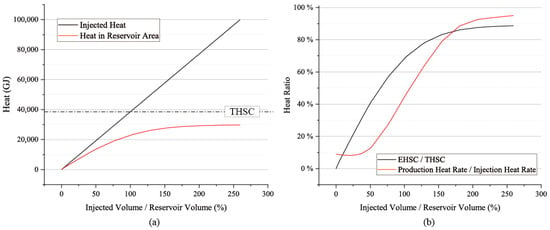
Figure 4 presents the results of the evolution process of the heat storage in the reservoir area and heat injection during the HIS (Figure 4a), as well as their proportions (Figure 4b). The calculation results show that the system’s quantity of heat storage remains stable at 29,699.72 GJ (relative to the initial temperature of 30 °C). This result indicates that there is an upper limit to the system’s heat storage, which is reached when the injected water volume exceeds twice the reservoir capacity. This is consistent with the calculation results of the output temperature. Moreover, the actual quantity of heat storage in the CMUR is less than the THSC. In contrast, the total heat injection quantity reached 99,843.84 GJ, which is approximately 3.6 times the system’s UHSC. This indicates that most of the injected heat did not remain in the system and was dissipated or cycled out during the HIS.
Figure 4.
Calculated results of (a) reservoir heat storage and injected heat and (b) their proportions during the HIS.
As shown in Figure 4b, the heat proportion results indicate that the UHSC of the system is approximately 90% of the THSC, meaning that the heat storage capacity utilization rate of the CMUR reaches about 90%. This implies that under the current conditions, although the heat storage space is fully filled with water, there is still about 10% of the heat storage capacity that has not been effectively utilized. This result suggests that in the CMUR-TES system, the heat storage utilization rate of the reservoir can reach around 90%.
The main reason for this phenomenon is that not all the injected heat is retained in the reservoir during the HIS. A considerable portion of the heat is continuously carried out of the system along with the temperature rise in the output fluid. At the initial stage of heat injection, less than 10% of the injected heat is carried away by the output fluid (red line in Figure 4b); however, as the HIS progresses, the proportion of heat carried away gradually increases, while the proportion of heat retained in the reservoir correspondingly decreases. When the actual heat storage capacity of the CMUR tends to stabilize, over 95% of the injected heat is carried out of the system simultaneously upon entry, even though the system’s heat storage capacity has not yet reached the THSC. This energy loss mechanism is the fundamental reason why the system’s heat storage capacity approaches its limit values and maintains a stable state.
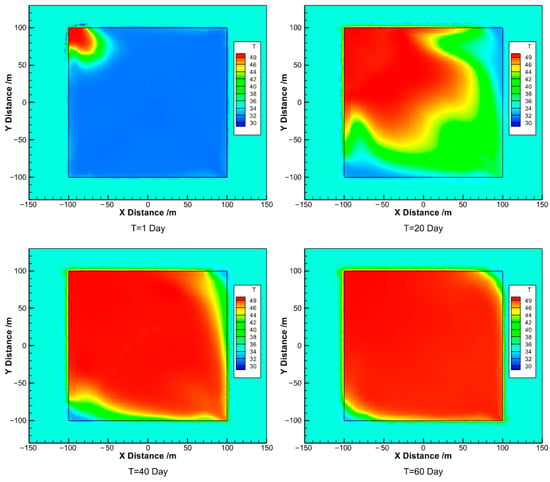
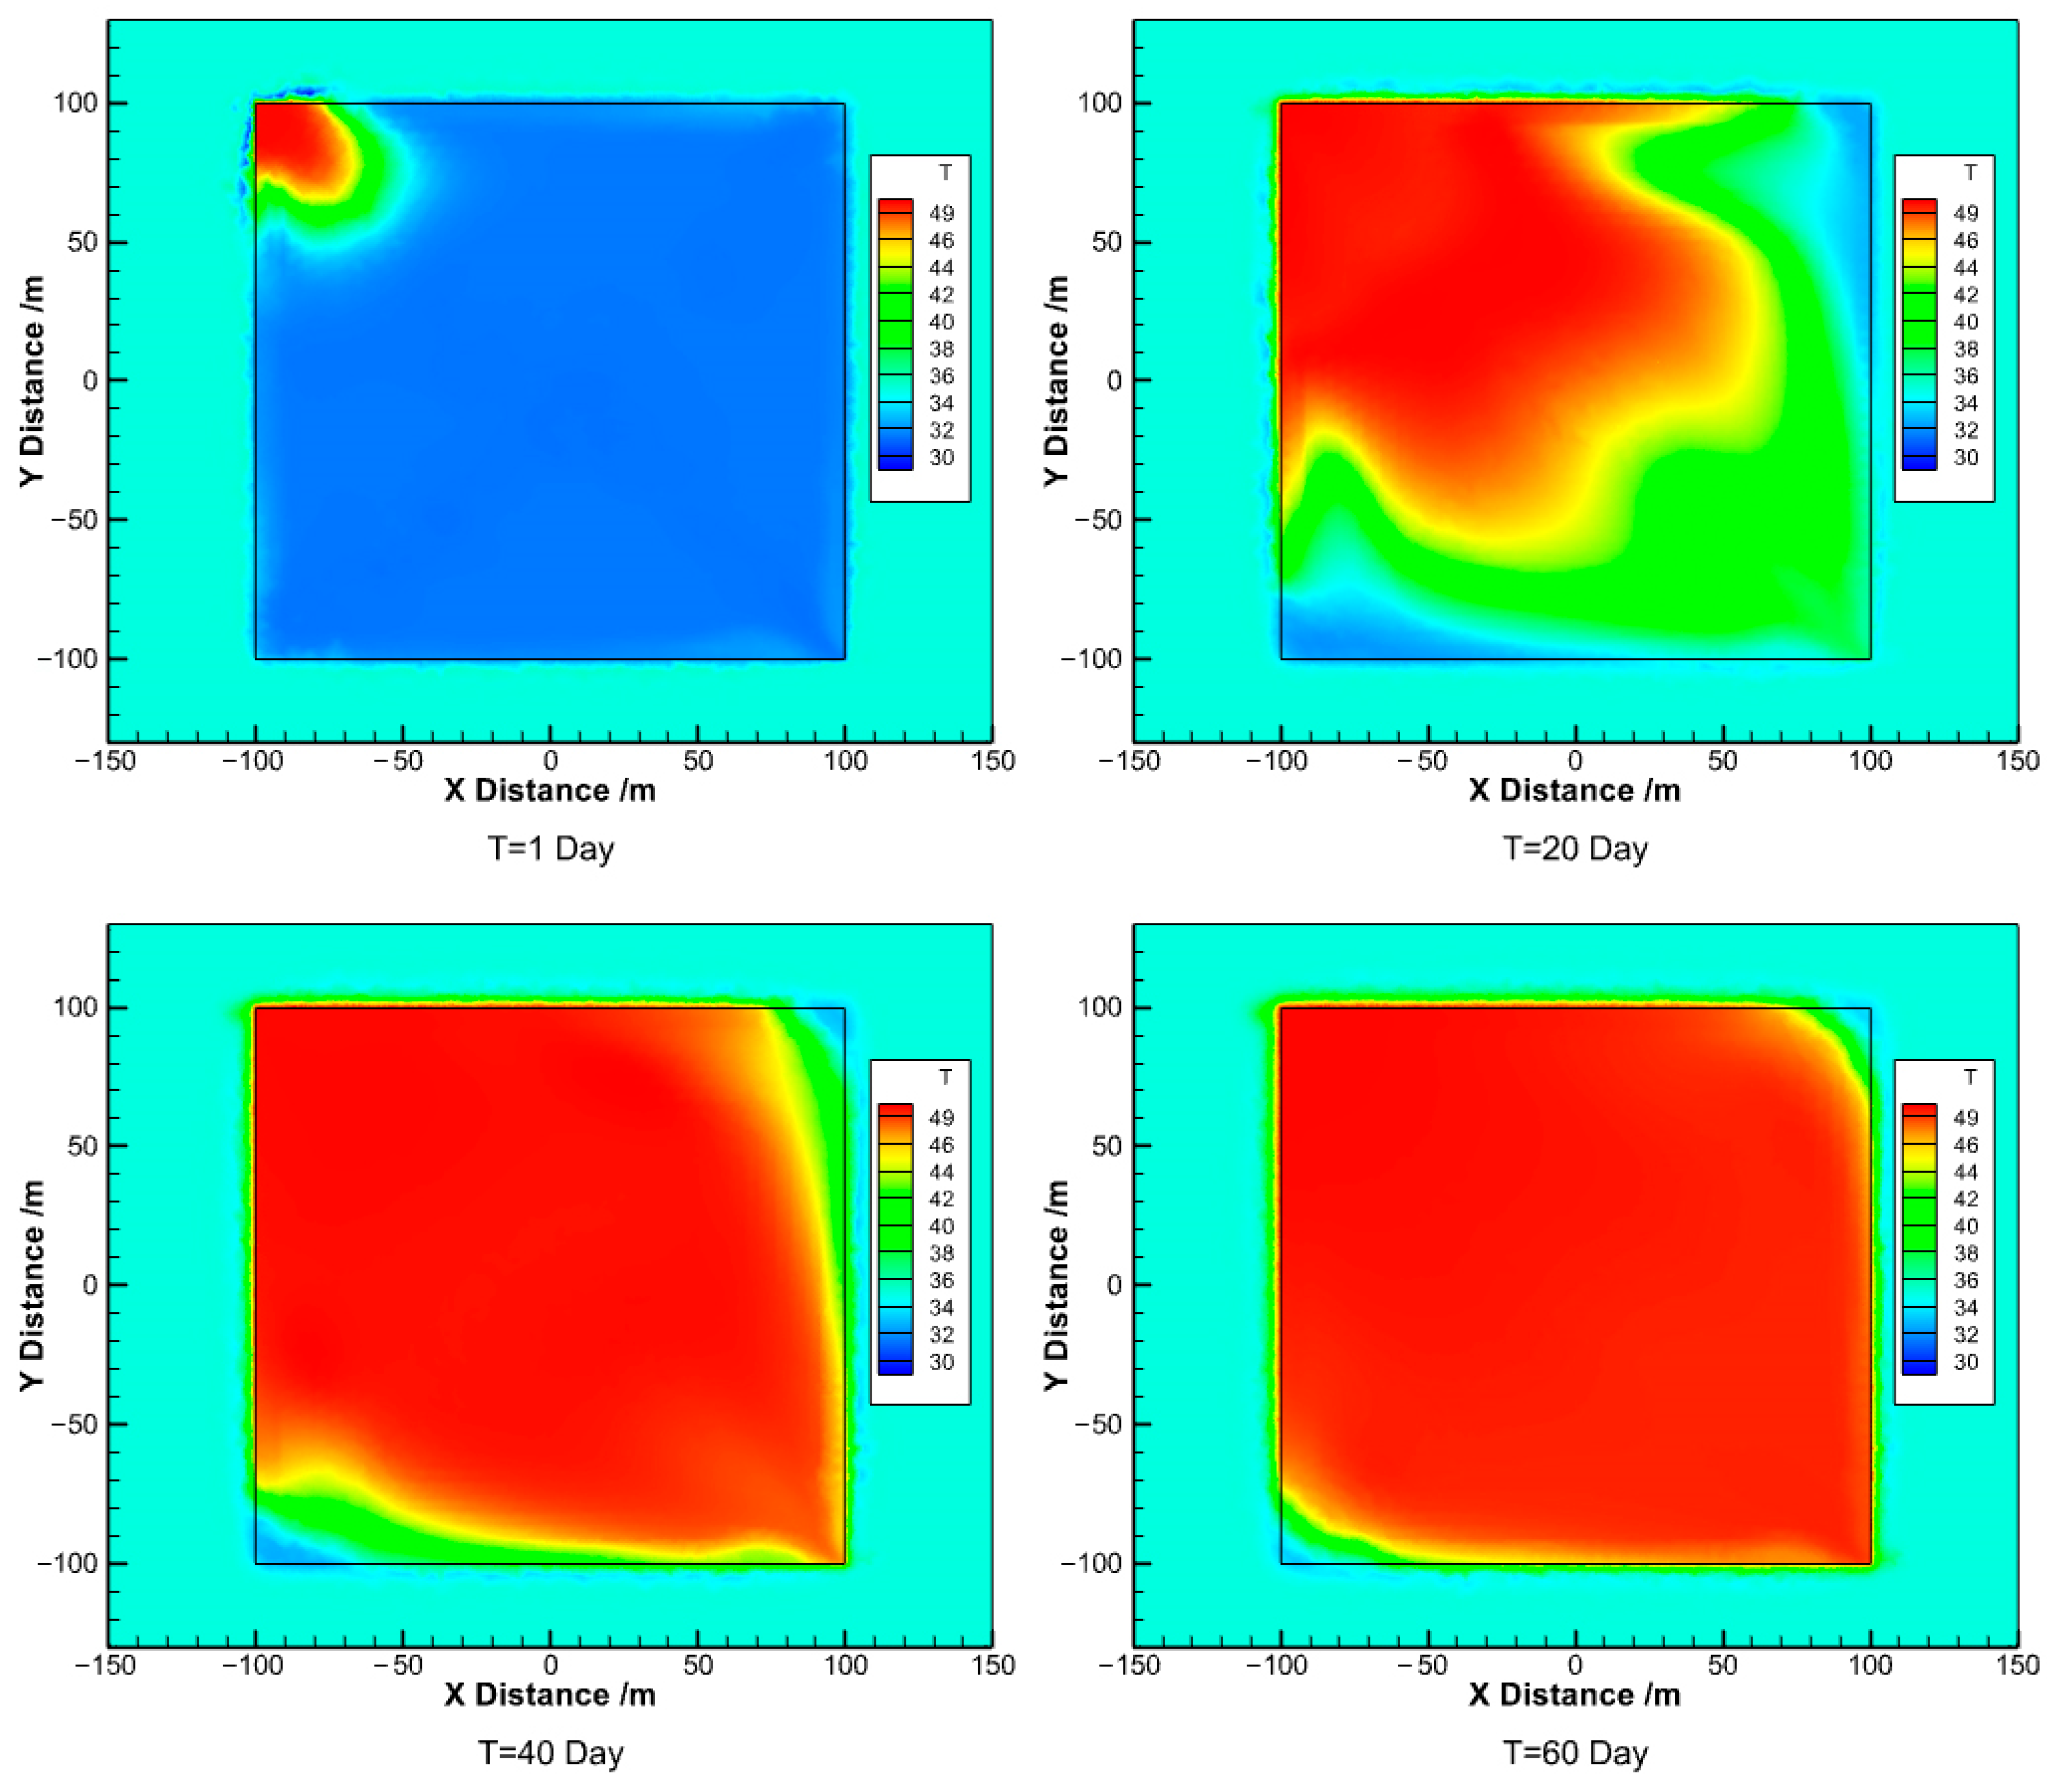
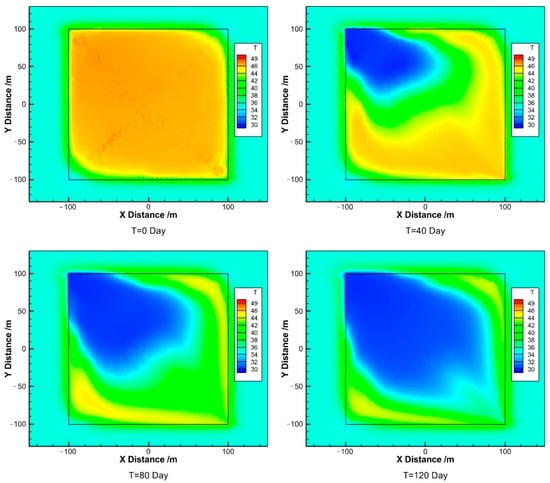
To further analyze the heat transfer process of the system during heat injection and the heat storage principle of the system, the temperature distribution of hot water at different injection times is shown in Figure 5. As water 20 °C higher than the initial temperature of the reservoir is continuously injected into the upper left corner of the reservoir area, the cold water in the system is gradually replaced, and the volume of hot water gradually increases. At 20 days of injection, a part of the mixed hot water at the front edge is already extracted from the reservoir area, and a thermal short-circuit situation of injection–extraction is formed in the system. As the injection process proceeds, this thermal short-circuit situation gradually intensifies. By 40 days, the injected hot water approaches the extraction output; and by 60 days, the injected hot water (close to 50 °C) is extracted, and a complete thermal short circuit is formed in the reservoir area, with the system reaching a stable state of heat injection. At this point, even if the injection continues, the extracted hot water, due to its high temperature, will carry away most of the injected heat, and the overall heat storage capacity of the system will no longer increase significantly. This conclusion is consistent with the analysis of the production output temperature and heat proportion (Figure 3 and Figure 4).
Figure 5.
Temperature field evolution process of the HIS.
In addition, the temperature distribution within the reservoir area illustrated that even at the final stage of heat injection stabilization, the reservoir is not entirely occupied by hot water. Along the diagonal opposite to the line connecting the injection and extraction points, a region of low-temperature water persists. The temperature in this corner remains below the injection temperature, and throughout the injection process, the original cold water in this region cannot be effectively displaced by the incoming hot water. This incomplete thermal displacement limits the reservoir’s heat storage efficiency and prevents it from reaching 100%.
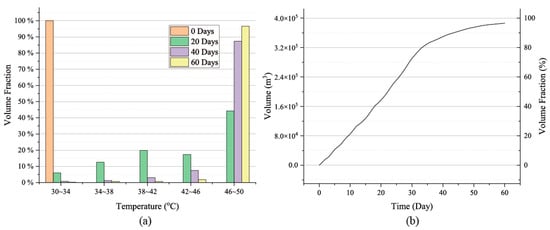
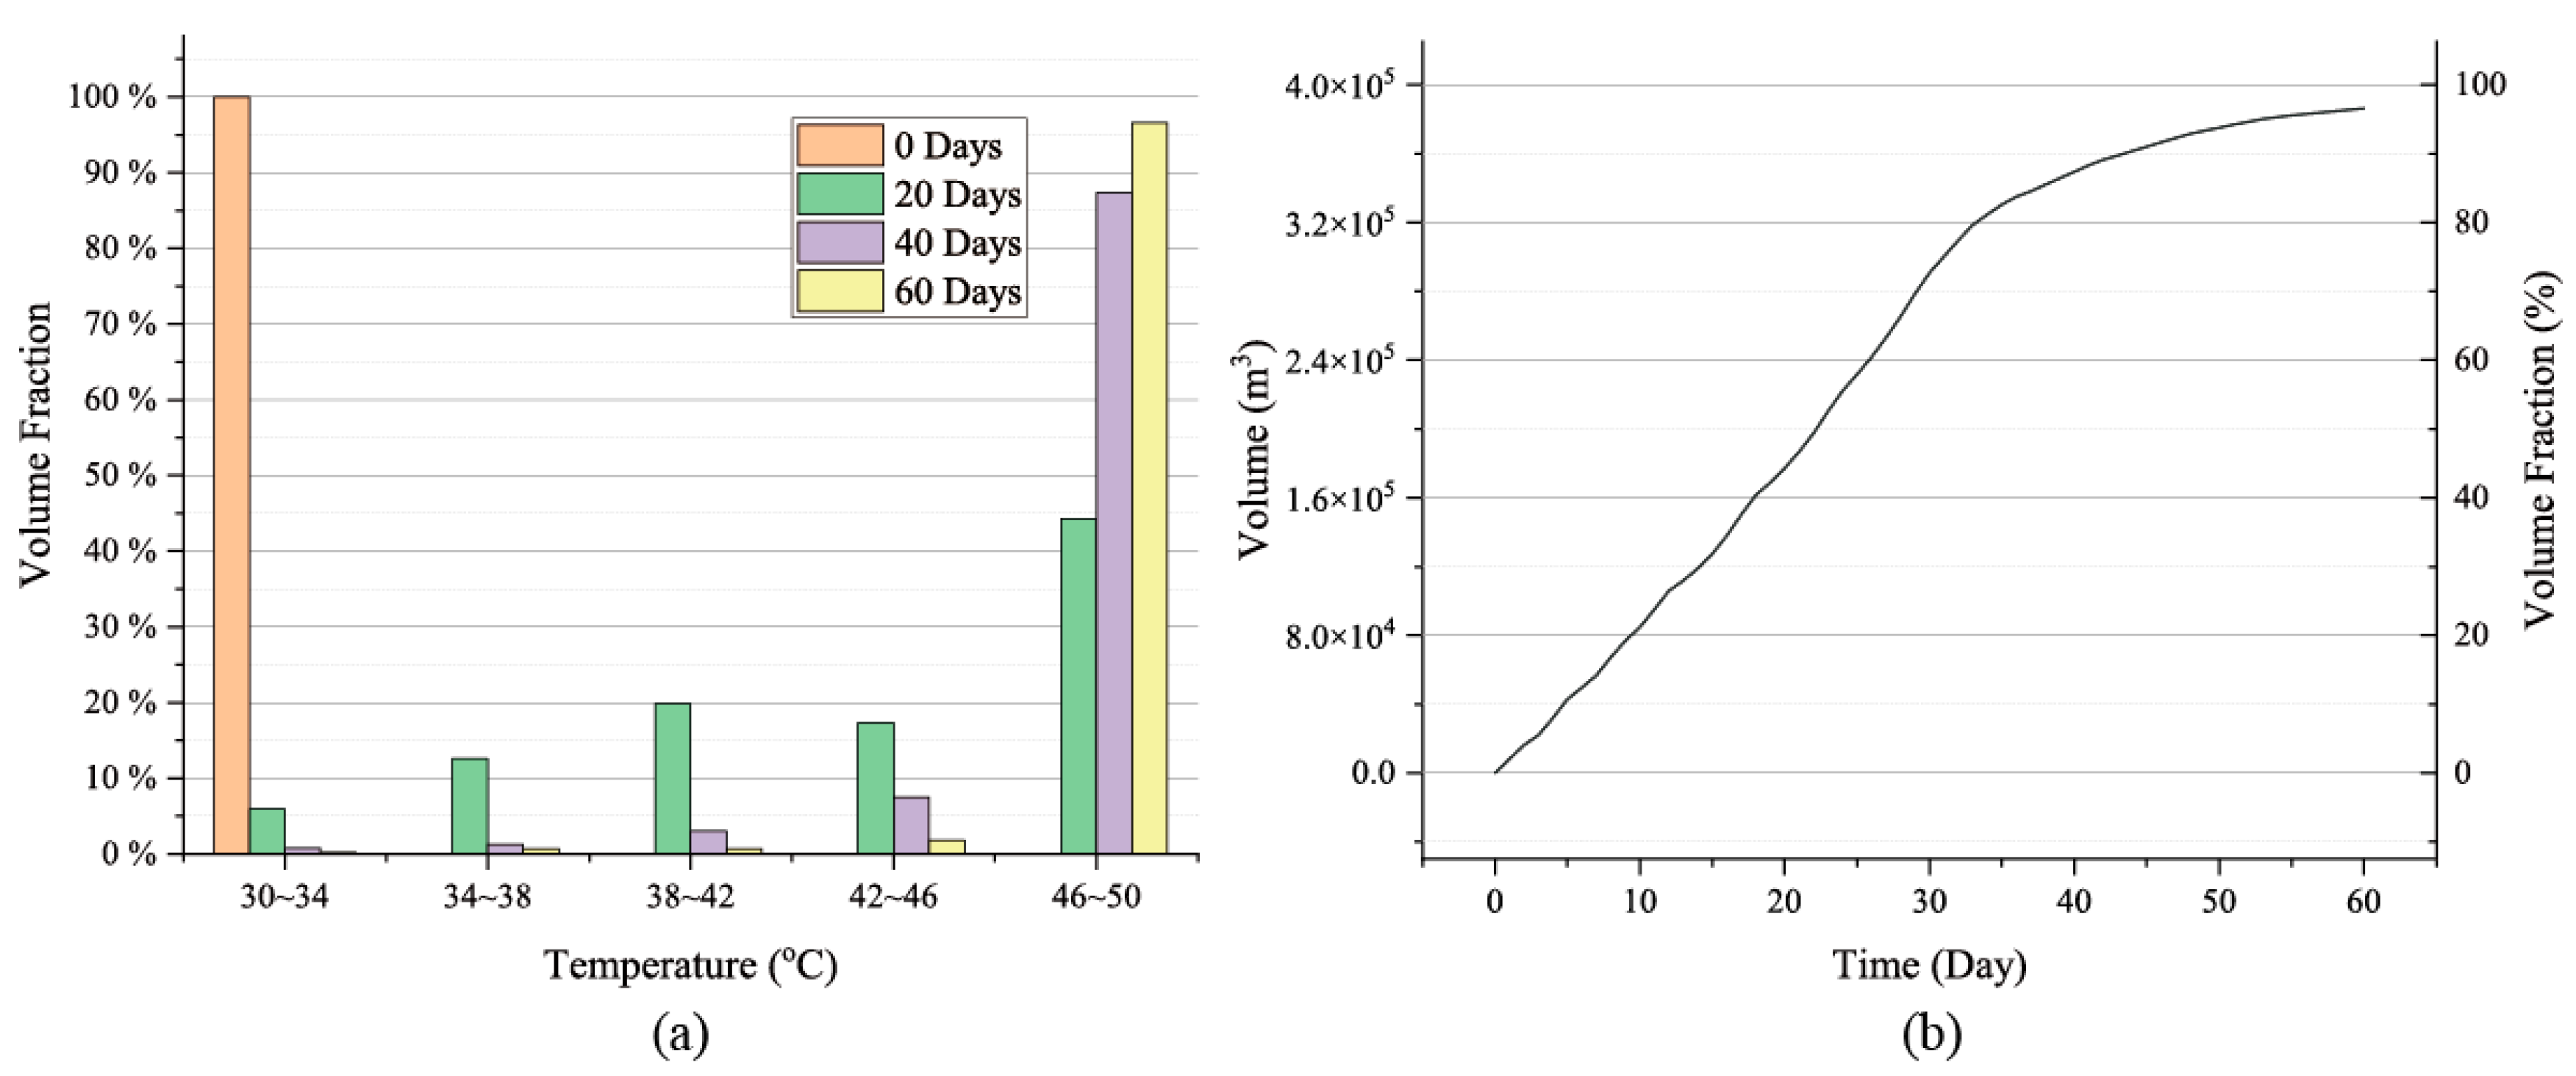
Furthermore, the distribution of the hot water volume in the reservoir area during the HIS is shown in Figure 6. It shows that, in the initial state, all the water in the reservoir area is at 30 °C, which is the initial fluid temperature. Within the first 20 days, water at 30~34 °C was rapidly replaced due to fluid extraction and mixing between the injected hot water and the initial reservoir water. As the HIS continued, high-temperature water (46~50 °C) increased quickly, while low-temperature water decreased correspondingly. By day 60, over 90% of the reservoir was occupied by high-temperature water, with 96.54% above 46 °C, 1.82% between 42~46 °C, and ~1% at lower temperatures. This indicates that most of the reservoir is effectively heated, though about 3% remains underheated. As shown in Figure 5, these underheated zones are located along the outer boundaries and at the two corners without injection or extraction wells. Despite a high-temperature water volume fraction exceeding 95% at thermal equilibrium, the system’s actual heat storage only reaches ~90% of the THSC. This is primarily because the temperature of the high-temperature water does not fully reach the injection temperature (50 °C). Most of the water injected and stored in the reservoir area stabilizes at around 48~49 °C. This results in a slightly lower heat storage rate compared to that of hot water.
Figure 6.
Volume distribution of reservoir water (a) and hot water (T > 46 °C) volume evolution (b) during the HIS.
Overall, the ultimate heat storage capacity (UHSC) of the CMUR can reach approximately 90% of the THSC. This result is achieved after injecting about twice the reservoir volume in circulating water. Additionally, roughly 10% of the system’s thermal capacity remains unused because the initial cold water cannot be replaced during the HIS. Nevertheless, the system’s heat injection performance can still be considered sufficient to meet engineering requirements, which is a positive outcome for subsequent heat storage and heat production.
3.2. Heat Storage Performance Analysis: 61~240 Days (180 Days)
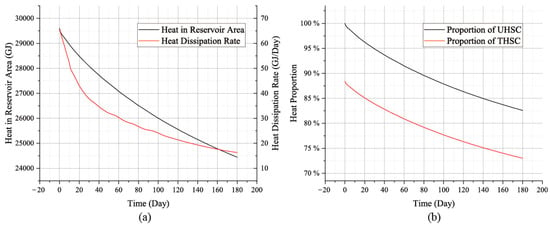
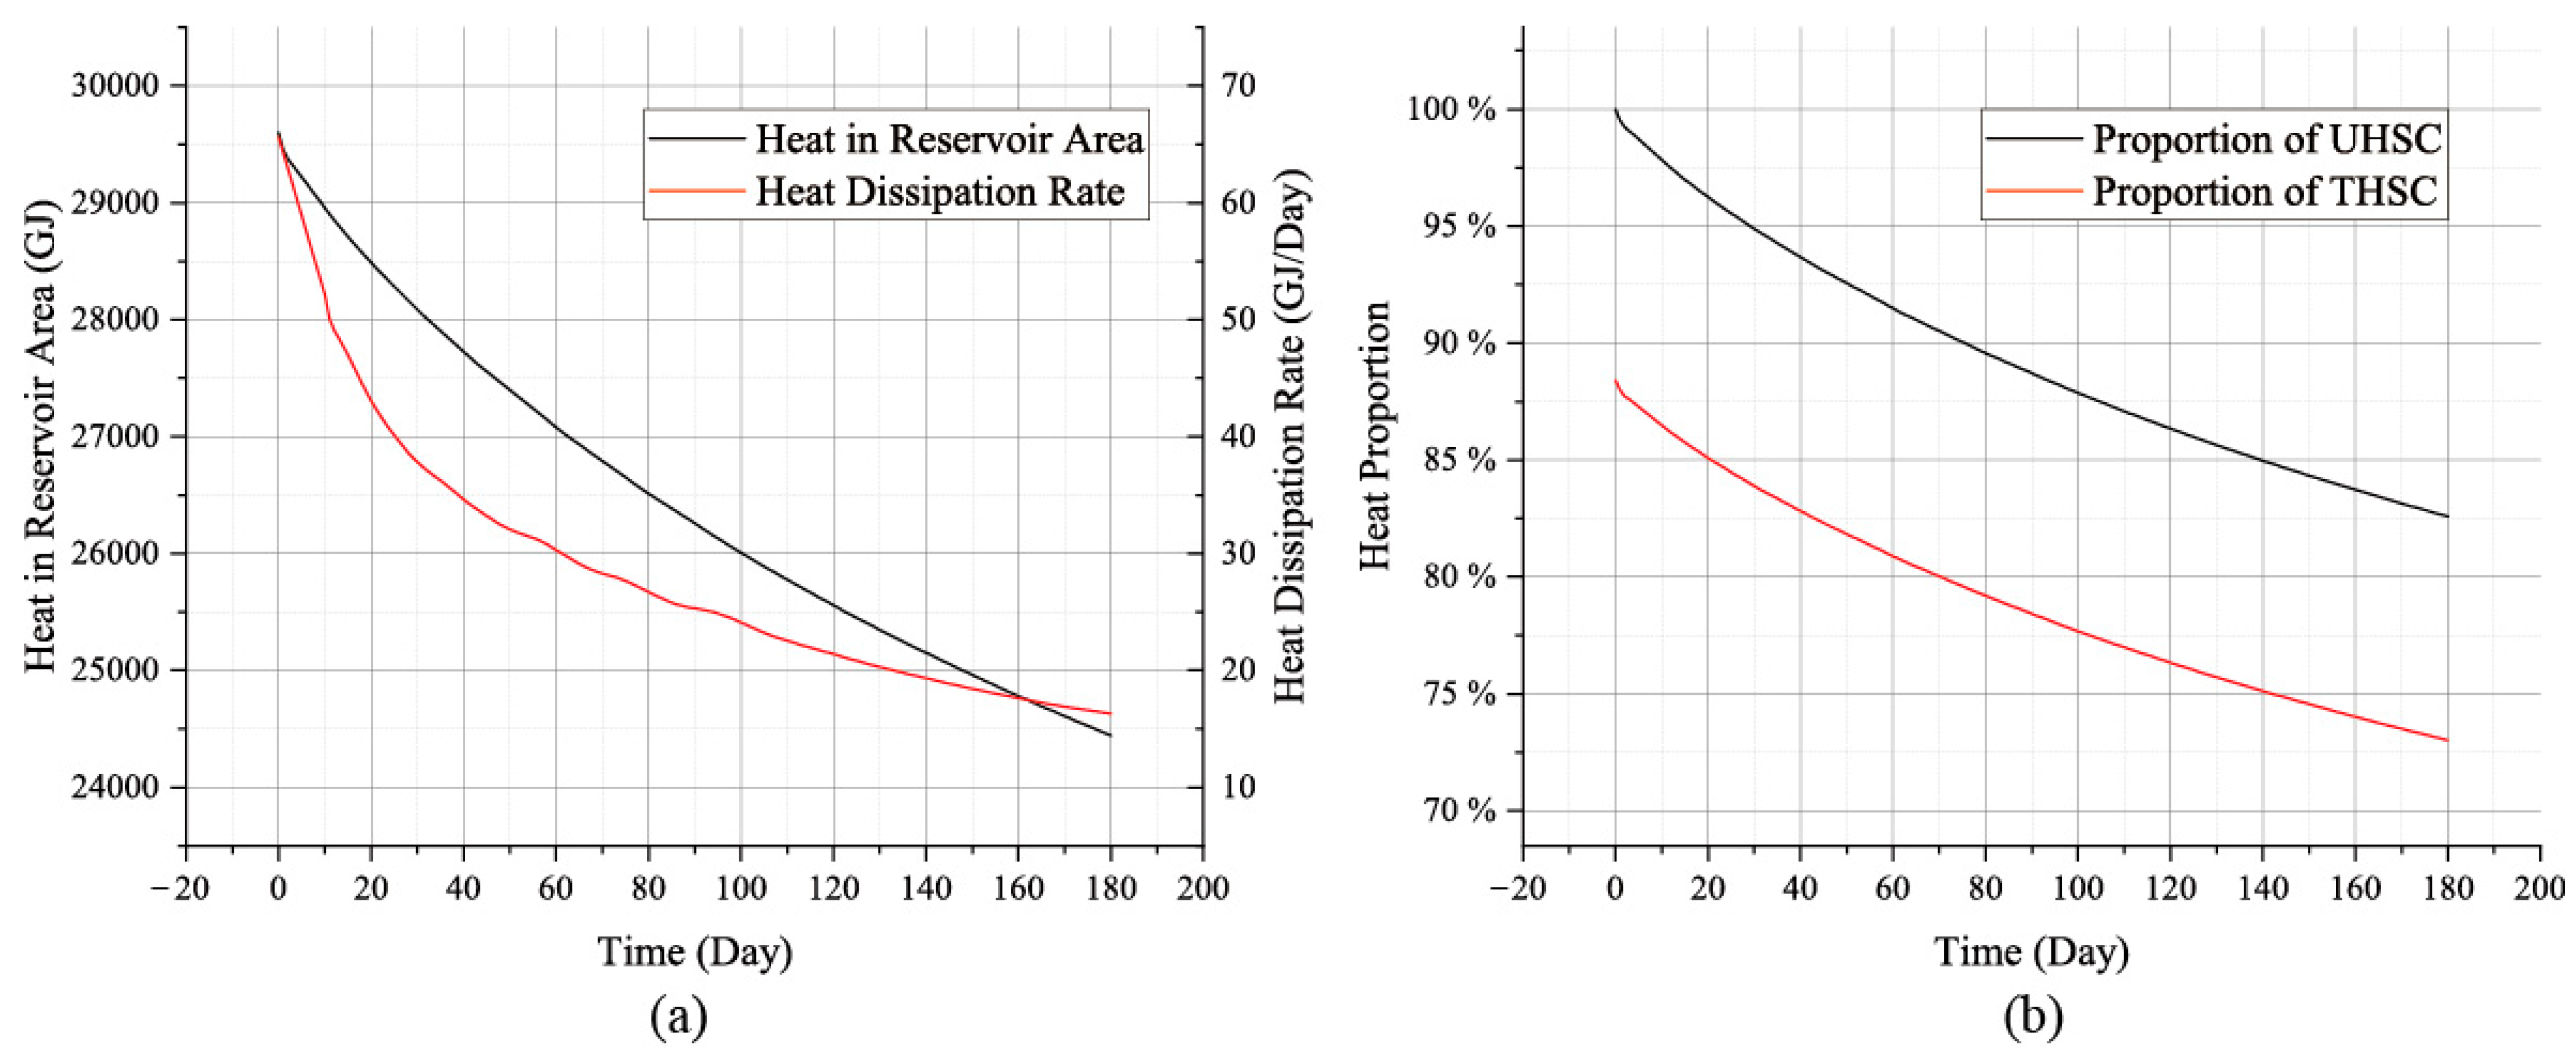
After heat injection, we analyzed the system’s heat storage performance based on the results of the HIS. The duration of the HSS is 180 days, the time set to meet the practical engineering requirements for cross-seasonal heat storage (i.e., the maximum time span from summer to winter). During the HSS, hot water is preserved in the reservoir, with heat gradually lost to surrounding rock through conduction. The heat quantity evolution of the total stored heat and heat loss rate over time (Figure 7a), along with the ratio of stored heat to THSC and UHSC (Figure 7b), is used to assess the thermal performance of the system. Compared to the initial 29,699 GJ at the start of the HSS, the decrease in heat quantity is approximately 17.69%. That is to say, after the HSS, about 17.96% of the UHSC has been dissipated. Thus, approximately 82% of the injected heat was retained over 180 days, yielding a heat storage efficiency of 82%. This result is comparable to the thermal storage efficiency achieved by other forms of cross-seasonal thermal storage models [34,35].
Figure 7.
Evolution of the system’s heat storage (a) and its heat proportion (b) during the HSS (the time axis shows the duration of the HSS).
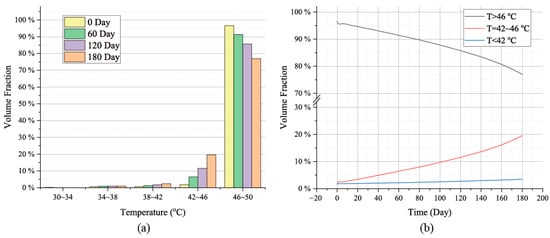
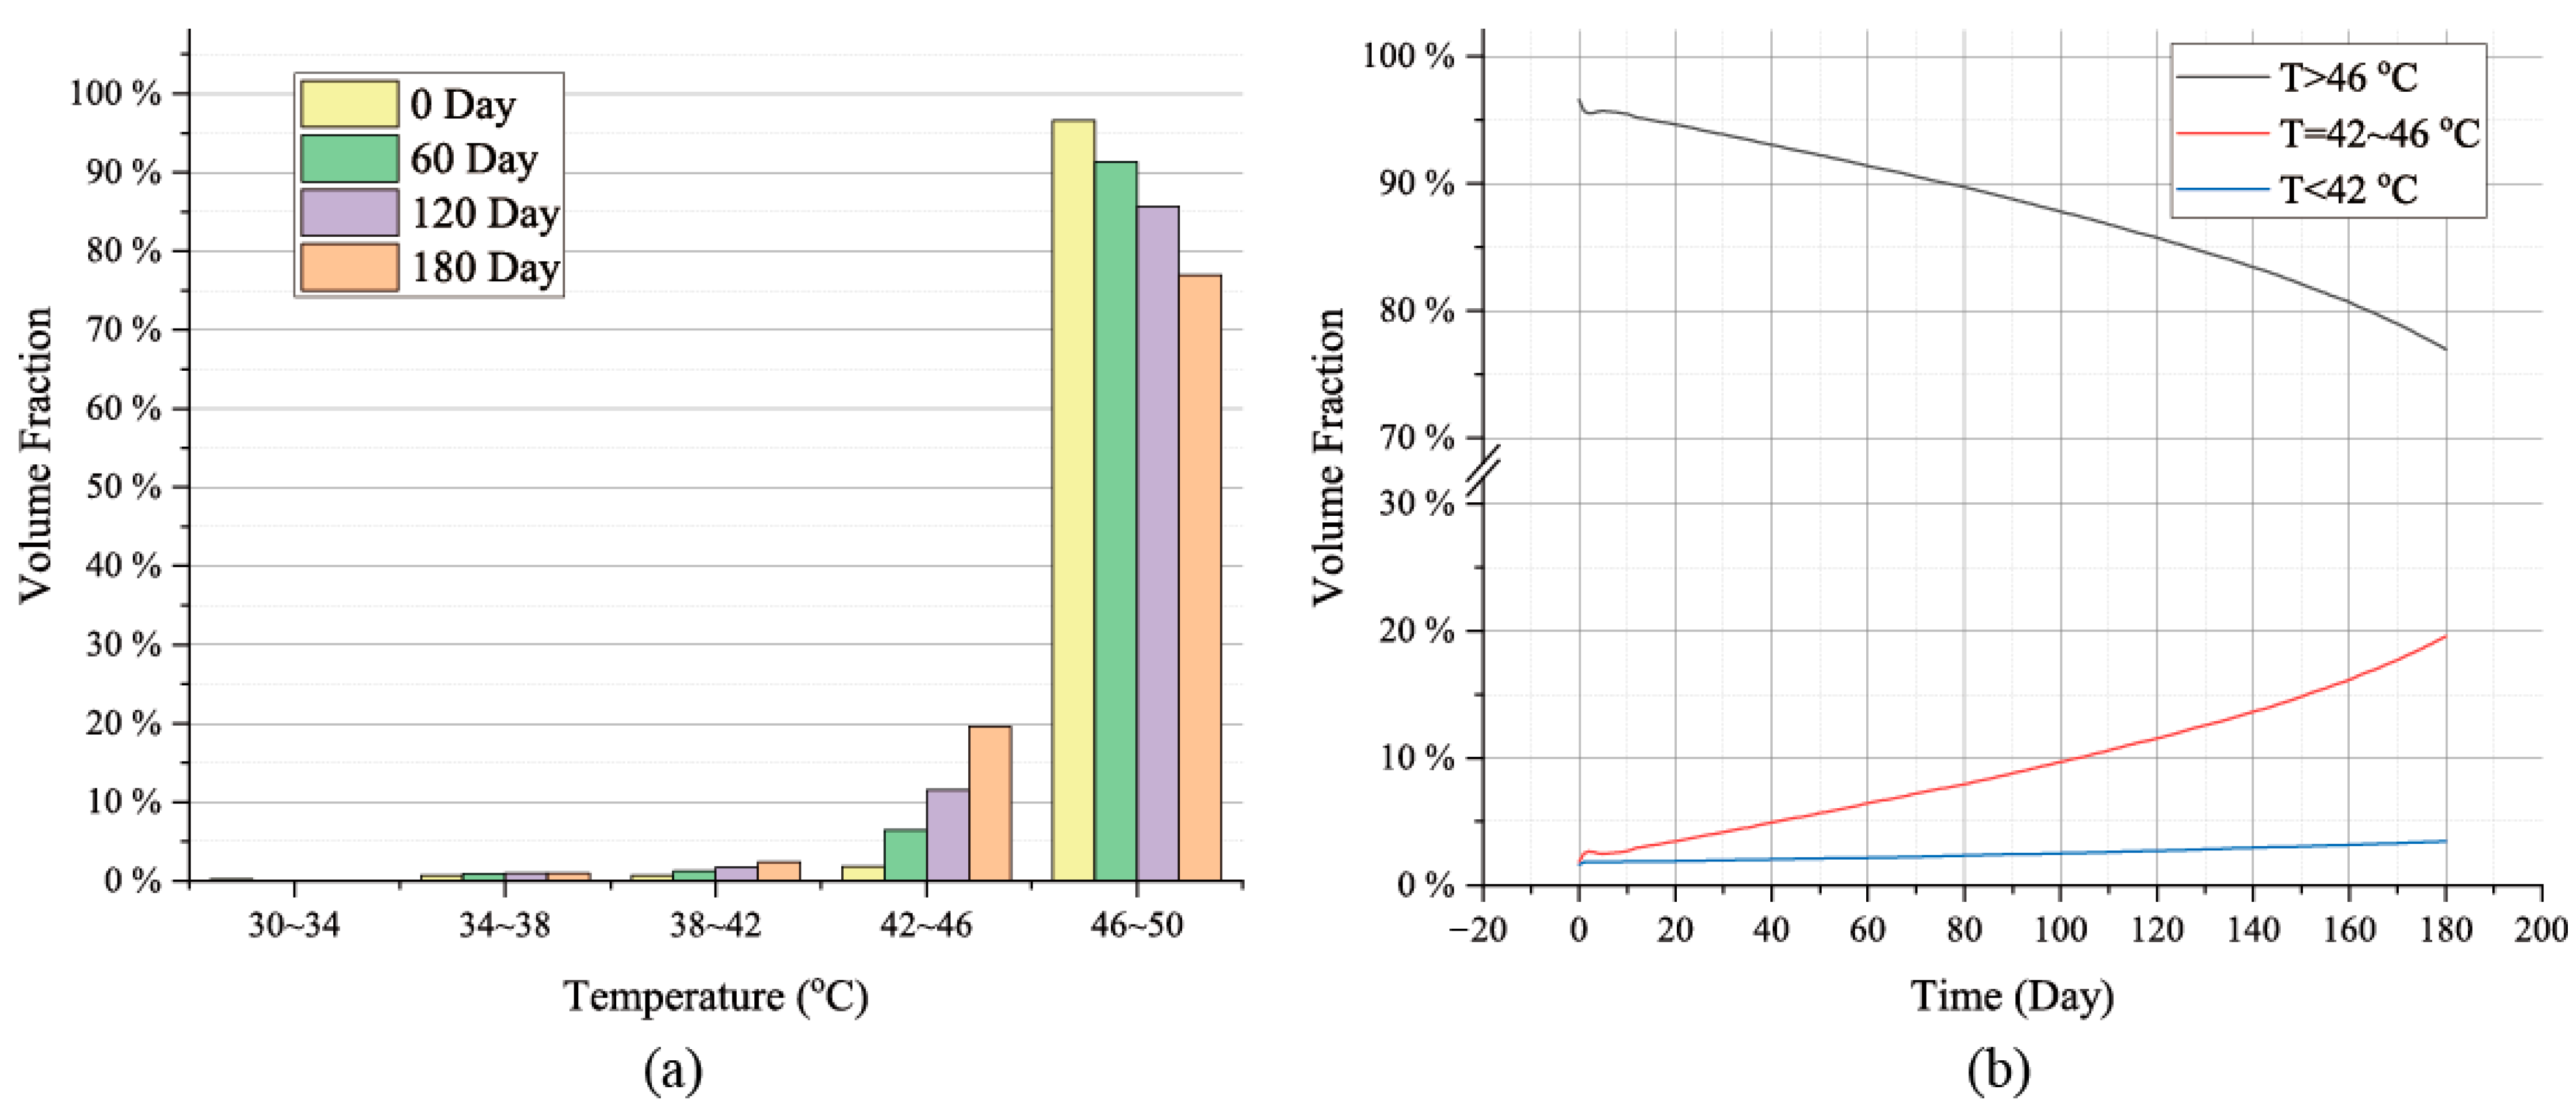
For the heat storage process of the CMUR-TES system, in engineering practice, apart from the total heat within the system, the temperature of the hot water also determines the heat storage performance of the system. The volume distribution and proportion of hot water at different temperatures and their evolution over time during the heat storage process are shown in Figure 8. The results indicate that as heat storage progresses, the proportion of high-temperature water (46~50 °C) in the reservoir gradually decreases, while the proportion of sub-high-temperature water (42~46 °C) increases. This suggests that during the heat storage process, the high-temperature water in the system gradually cools down, and most of the high-temperature water converts to sub-high-temperature water after cooling. Although the volume fraction of low-temperature water (30~42 °C) also increases, due to its overall small proportion, the increase in volume is very limited, and the total volume of low-temperature water remains basically unchanged.
Figure 8.
Volume fraction of hot water in the reservoir area (a) and the time evolution process of hot water volume (b) during the HSS.
The calculation results for the temporal evolution of the volume fractions of high-temperature water and sub-high-temperature water during the HSS are shown in Figure 8b. The results show that the volume fraction of high-temperature water decreases uniformly throughout the storage process, dropping from 96.5% to 76.9%—a reduction of 19.6%. Concurrently, the volume fraction of sub-high-temperature water increases from 1.82% to 19.50%, representing an increase of 18.03%, which is nearly equivalent to that of the high-temperature water. It indicates that most of the high-temperature water transformed into sub-high-temperature water after cooling, preventing significant hot-water temperature reduction within the system. Regarding low-temperature water, both its volume fraction and total volume exhibited minimal changes throughout the storage phase, accounting for less than 5% of the total volume. This suggests that the low-temperature water volume remained essentially unchanged, which is advantageous for the system’s thermal storage performance.
To analyze the evolution of thermal distribution within the system during heat storage, the temporal evolution of the temperature distribution within the reservoir area was examined, with results shown in Figure 9. The results indicate that as heat storage progresses, the overall temperature within the reservoir area decreases, though the reduction is modest (less than 5 °C). Additionally, a region with a more pronounced cooling effect exists at the reservoir’s periphery. Water in this area exhibits lower temperatures, dropping below 42 °C within the first 60 days of heat storage, thereby forming the reservoir’s low-temperature water. However, due to the limited thickness of this low-temperature layer (less than 2 m), the total volume of cold water within this region remains small, exerting minimal impact on overall heat storage. Furthermore, the evolution of the temperature distribution indicates that the initial low-temperature zones formed at the two corners of the reservoir area within the HIS remain largely unchanged during the heat storage process. Although a certain volume of low-temperature water exists within these zones, this portion does not mix intensely with the hot water in the reservoir. Consequently, its impact on the reservoir’s overall heat storage performance is also minimal.
Figure 9.
Temperature field evolution process during the HSS.
In summary, throughout the HSS, although the reservoir temperature exhibited a steady and gradual decline, no large-scale, intense cooling occurred. This gradual temperature change primarily stems from steady-state heat transfer at the boundaries, where hot water in the central region continuously exchanges heat with the surrounding rock through the low-temperature water layer formed at the reservoir’s edge. Although the boundary water rapidly cooled during the initial storage phase, the low thermal conductivity of water caused the formed low-temperature layer to act as an insulating barrier, effectively suppressing further heat diffusion outward. This insulating effect significantly slowed the expansion of the low-temperature layer toward the center, limiting its influence to a very confined area. Consequently, throughout the HSS, most regions within the reservoir maintained relatively high temperatures, effectively safeguarding the system’s thermal storage performance. This mechanism aligns with existing research findings, further validating the reliability and stability of the CMUR-TES system during long-term thermal storage [29].
3.3. Heat Production Performance Analysis: 240~360 Days (120 Days)
Based on the results from the HSS, we analyzed the HPS. From day 240 to day 360 of system operation, the system produced hot water for surface utilization of the CUMR-TES system. During the HPS, the system maintained a production flow rate of 144 m3/h for 120 days. Over this period, a total of 414,720 m3 of water was produced through the CMUR-TES system, with the production volume slightly exceeding the total volume of the reservoir area. This facilitated more complete extraction of hot water from the system, enhancing its thermal storage efficiency.
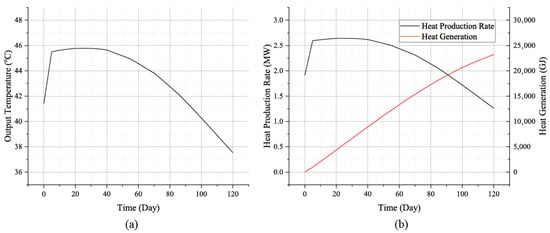
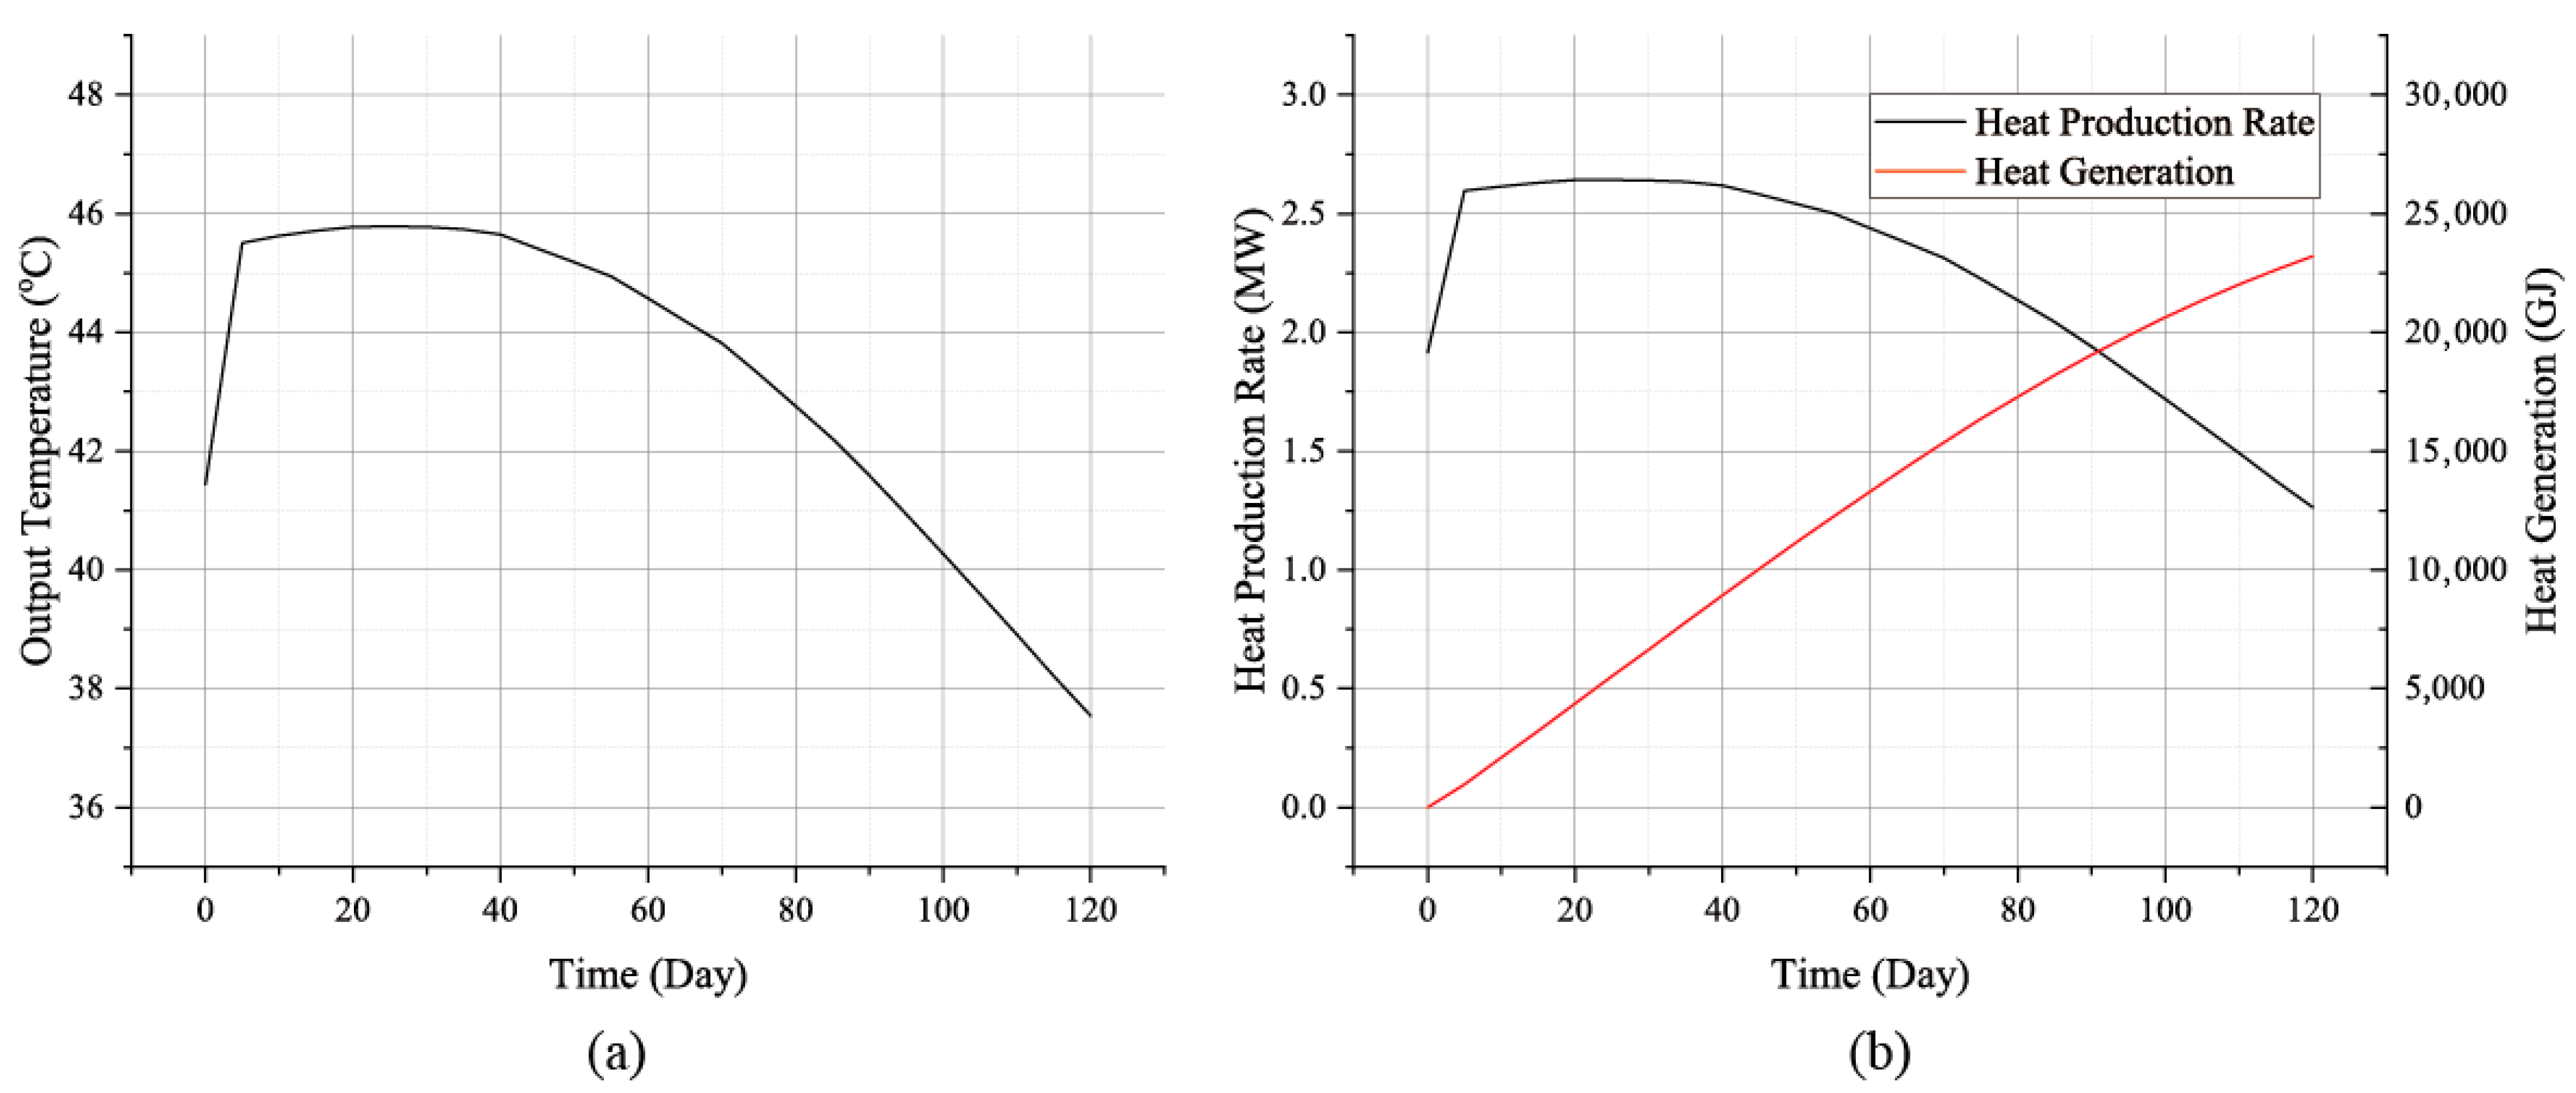
The calculated output temperature and heat production performance during the HPS are shown in Figure 10. The output temperature (Figure 10a) indicates a rapid rise during the initial 5 days. Subsequently, a stable period of approximately 35 days ensued, with the output temperature maintaining around 45.8 °C, exhibiting minimal fluctuations and overall stability. Starting from day 40, the temperature began a continuous decline at a basically constant rate. By the end of the HPS, the output temperature had decreased to 37.54 °C, remaining slightly above the injection temperature. The trend of the heat production rate closely parallels that of the output temperature (Figure 10b), similarly progressing through three distinct phases: a rapid ascent, stable maintenance, and a gradual decline. During the initial 5 days, the HPR rapidly increased to 2.6 MW, then stabilized within the 2.6~2.65 MW range for approximately 35 days. From day 40, it gradually decreased, reaching 1.26 MW by the end of operation on day 120. Calculations of total heat production indicate that during the 120-day HPS, the system delivered 23,209.14 GJ of heat. This represents 95% of the heat stored at the conclusion of the HSS, yielding a heat extraction rate of approximately 95%. This result demonstrates that the HPS efficiently recovers the vast majority of heat stored during the HSS, with residual unusable heat constituting less than 5%. This validates the system’s high thermal energy recovery capability.
Figure 10.
Evolution of output temperature (a) and performance of heat production (b) of the CMUR-TES system during the HPS.
Considering the thermal storage performance of the CMUR-TES system throughout its entire storage cycle, calculation results indicate that after the HSS, the residual heat within the system (system storage capacity) accounts for 82.3% of the system’s maximum storage capacity, yielding a storage efficiency of 82.3%. In the HPS, 95% of the system’s storage capacity can be extracted for ground-level utilization. Therefore, comprehensive calculations indicate that 78.16% of the maximum heat storage capacity injected during the HIS phase can be recovered and utilized, meaning that the system’s effective heat storage rate is 78.16%. This result is comparable to that of other ATES configurations [18,36,37]. However, the CMUR-TES cavity structure offers greater thermal storage capacity and production flow rates, presenting a significant advantage for thermal storage engineering applications. These findings further validate the substantial development potential of CMUR-TES for cross-seasonal thermal storage.
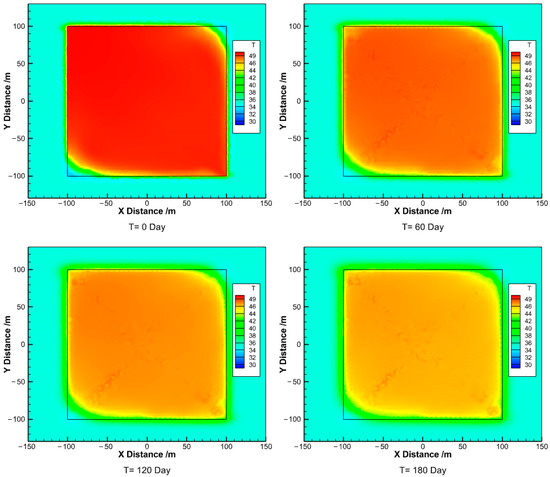
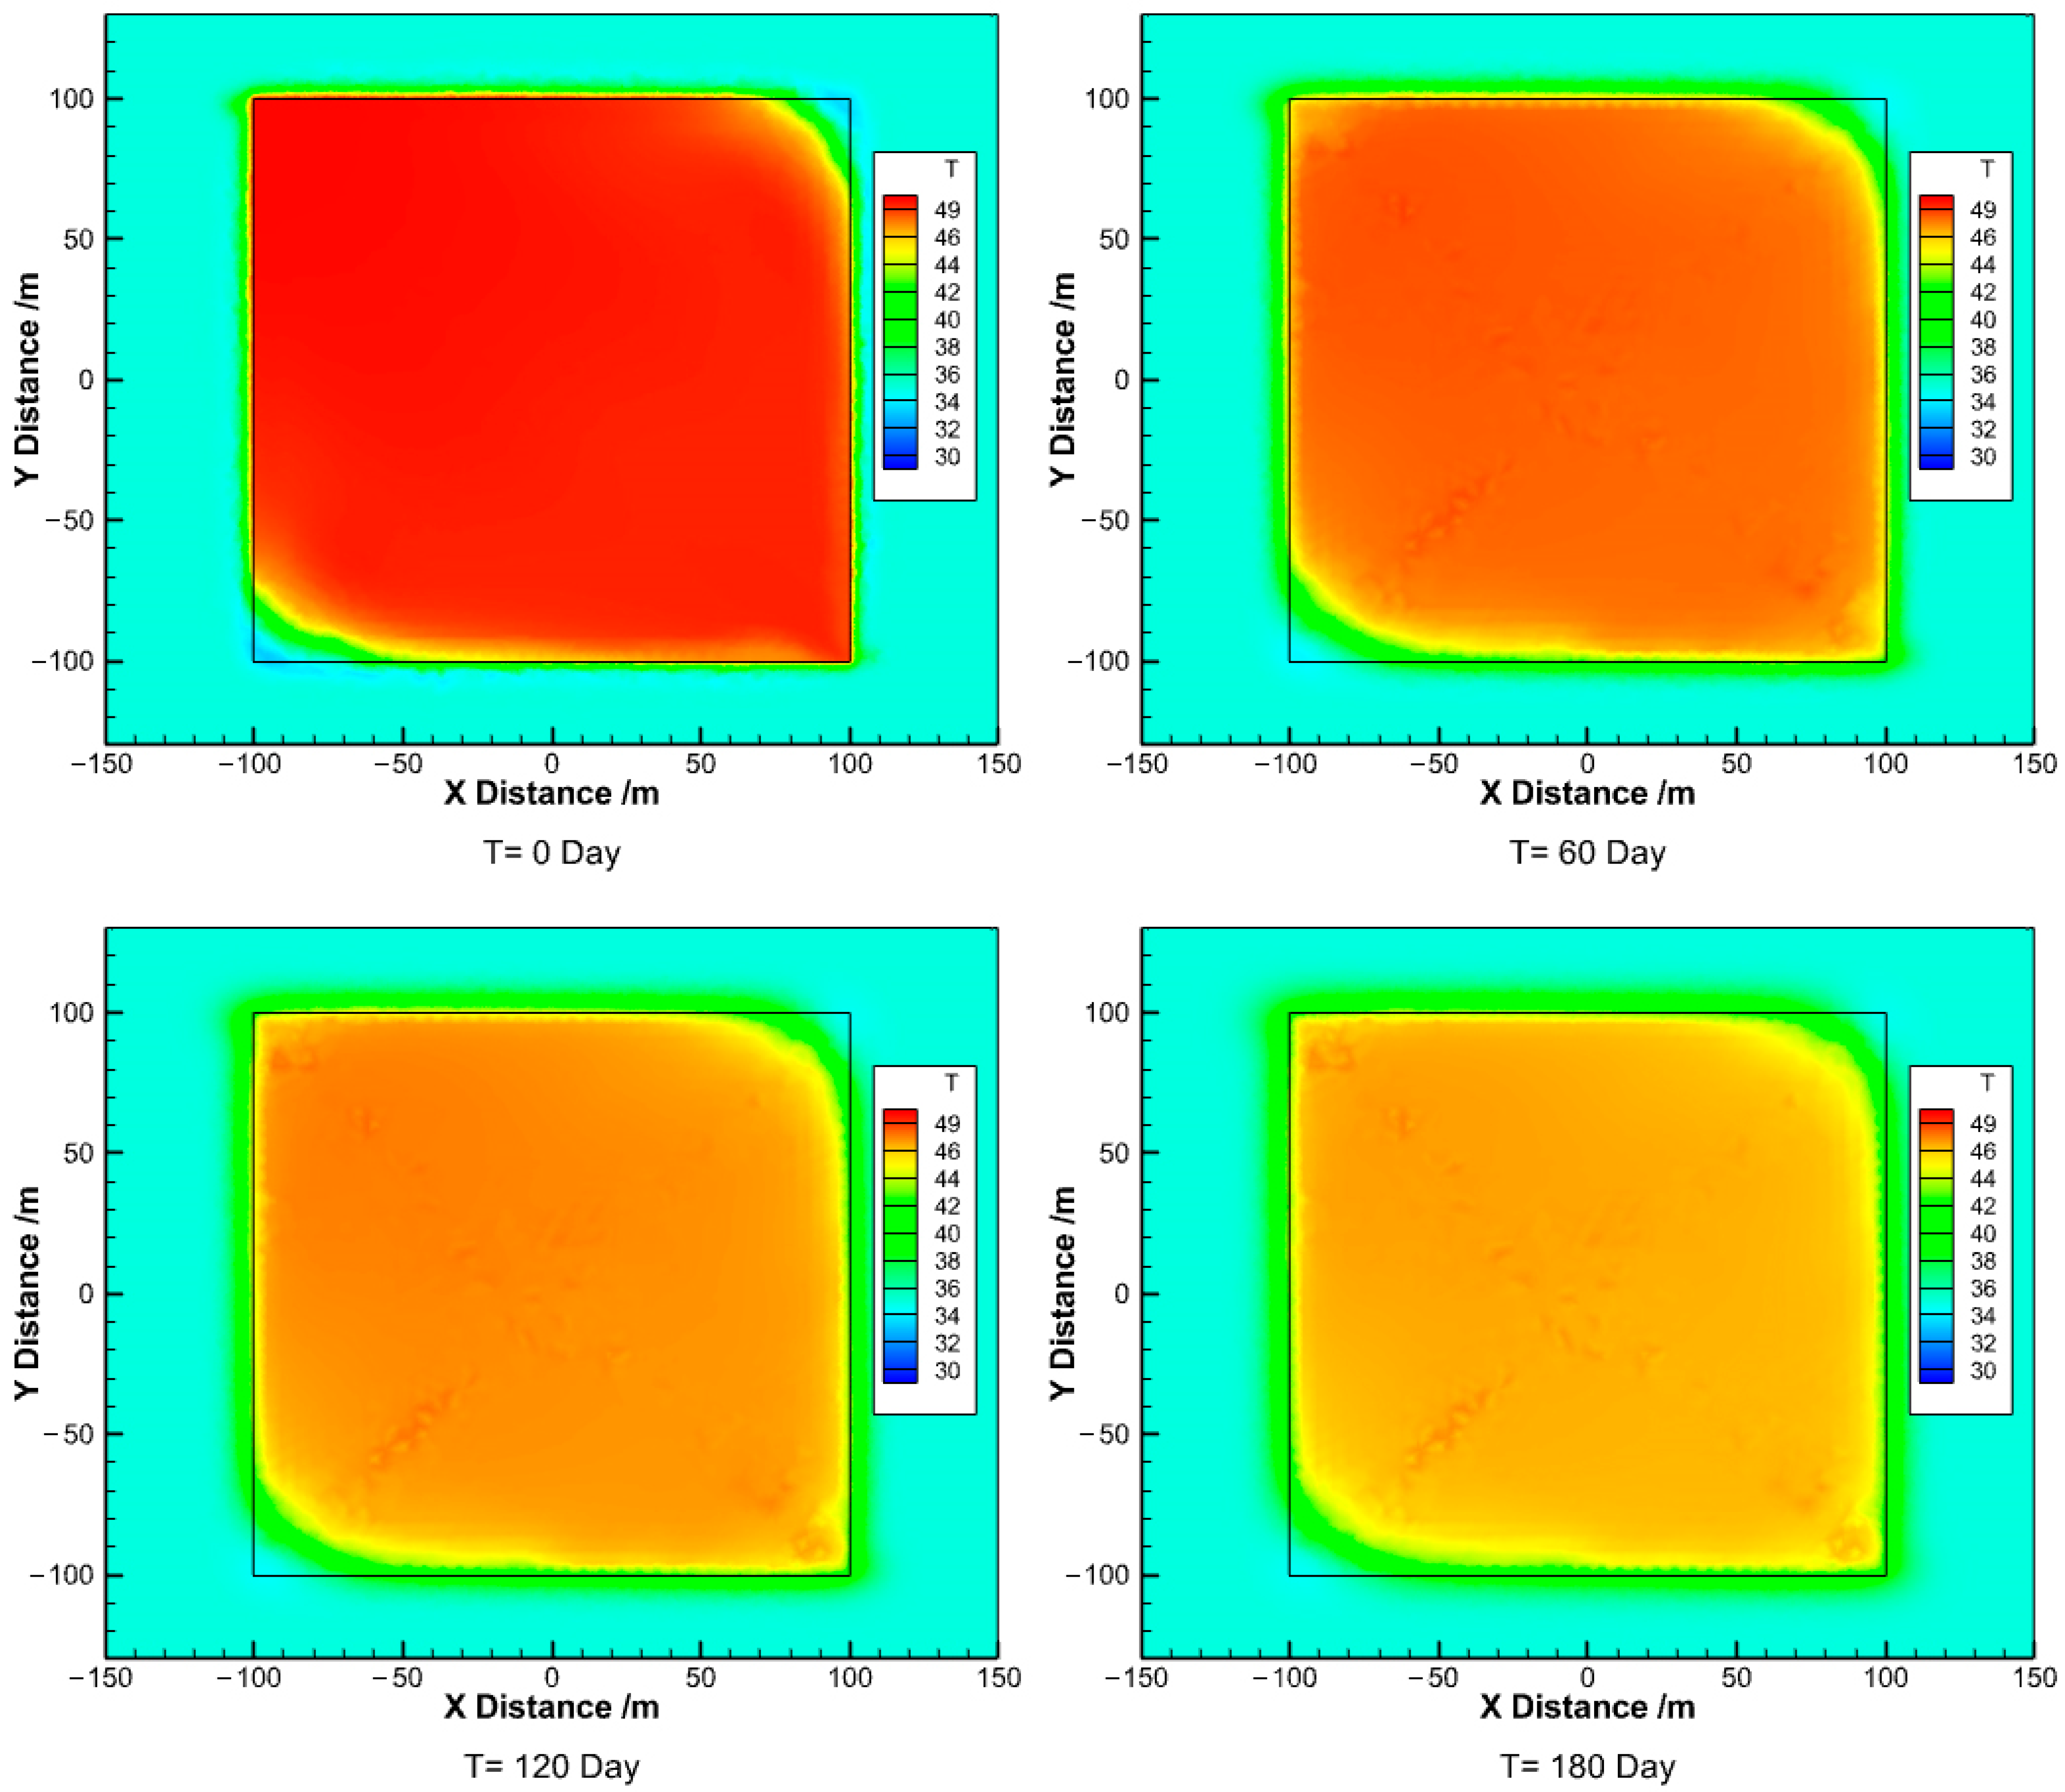
The evolution of the temperature distribution during the HPS effectively explains the mechanism behind changes in output temperature and heat production rate. In the early stages of heat production, the pumped water originates from the reservoir’s peripheral zone. At the beginning of the HSS, extracted water exhibits lower temperatures due to boundary heat transfer effects. As shown in Figure 11, on day 0, the water temperature at the pumping point (lower right corner) was approximately 41 °C, resulting in an initial output temperature. As production continued, high-temperature water from areas further from the boundary gradually entered the flow path, causing the output temperature to rise and the system to enter a stable high-temperature hot water production stage. Subsequently, the leading edge of the reinjected low-temperature tailwater gradually advances toward the extraction well, forming a localized cold short-circuit phenomenon that causes the production flow temperature to slowly decrease. Combining Figure 10a and Figure 11, it is evident that due to the limited duration of the HPS, the cold short circuit has not yet fully connected the reinjection well and the extraction well. Therefore, although the production output temperature has decreased, it remains higher than the temperature at the injection temperature. Furthermore, even during the late production phase, localized residual hot water persists in the reservoir’s other two corners at temperatures between 40~46 °C, albeit in a small volume. However, regarding heat recovery efficiency, the results of this study (78.16%) are higher than those of previous research (approximately 78% vs. 95%) [29]. The primary reason for this discrepancy lies in the comprehensive consideration of the heat injection process during the injection phase in this study. During the HIS, unusable low-temperature zones had already formed in the reservoir corners. These zones persisted throughout the entire heat storage and release process, occupying part of the effective space. Although no water exchange occurred in these zones during operation, their presence did not significantly impact the assessment of the system’s effective heat storage rate or total heat output, as the low-temperature water within them was excluded from the system’s heat balance calculations. In contrast, previous studies omitted this low-temperature zone, leading to overestimation of the usable storage space and consequently underestimation of actual heat recovery rates. By comprehensively accounting for corner low-temperature zones, this study provides more accurate heat recovery rate assessments, further enhancing the reliability of system performance evaluations.
Figure 11.
Temperature field evolution process during the HPS.
In summary, over a complete 360-day thermal storage period, the CMUR-TES system achieves an effective thermal storage rate of 78.16%. Based on the above analysis, the primary limiting factor for the system’s effective thermal storage rate is heat loss during the HSS. Although some local reservoir spaces remain underutilized during the HIS, the thermal energy recovery rate still reaches 95%, which is a very high level. Compared with other existing types of cross-seasonal thermal storage systems, the system designed in this study demonstrates superior thermal energy recovery efficiency and possesses excellent engineering applicability, particularly for large-scale thermal storage projects based on large geological bodies.
4. Discussion
To conduct an in-depth analysis of the thermal storage characteristics, we discuss key parameters that significantly influence the CMUR-TES performance, based on the fundamental operational scheme parameters. It examines how variations in these parameters affect the system’s thermal storage capabilities.
4.1. Influence of Injection Temperature
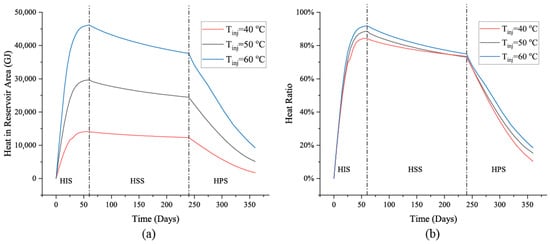
The results of the system heat evolution process in CMUR-TES and its proportion of THSC evolution at different injection temperatures are shown in Figure 12. The results indicate that at higher injection temperatures, the heat stored within the system increases. This is determined by the greater heat capacity inherent in high-temperature hot water. However, for the HIS, it can be seen that higher injection temperatures will achieve thermal storage stability at a later stage. In other words, under conditions of elevated injection temperatures, it is necessary to appropriately extend the duration of the HIS to more fully realize heat injection, enabling the system to reach the UHSC.
Figure 12.
Analysis of heat evolution of CMUR-TES under different injection temperature conditions: (a) heat storage in CMUR-TES; (b) heat storage proportion relative to the THSC.
For the HSS, it can be observed that the heat decay rate within the reservoir area is slightly higher under elevated temperature conditions. This is due to the greater temperature difference between the hot water and the surrounding rock resulting in a faster heat transfer rate. Consequently, heat dissipation increases, causing the stored heat within the system to dissipate more rapidly compared to low-temperature water. However, despite some heat loss within the system, the overall situation remains manageable, with no occurrence of large-scale heat decay. For the HPS, it can be observed that the heat within the system under different injection temperature conditions generally maintains a stable linear decline. Under higher injection temperatures, heat dissipation occurs more rapidly. This is primarily because elevated injection temperatures correspond to higher production fluid temperatures, resulting in higher heat generation rates within the system and consequently faster heat reduction rates.
The results showing the heat proportion within the system relative to the THSC indicate that increasing the injection temperature enhances the system’s thermal storage utilization rate. This implies more effective utilization of the system’s thermal storage capacity. Furthermore, based on this higher thermal storage utilization rate, the system’s thermal storage process achieves high thermal storage efficiency throughout the entire operating cycle—even though higher temperatures result in faster heat dissipation rates.
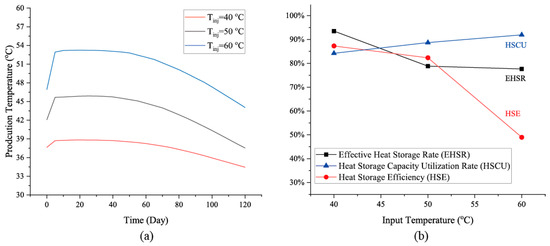
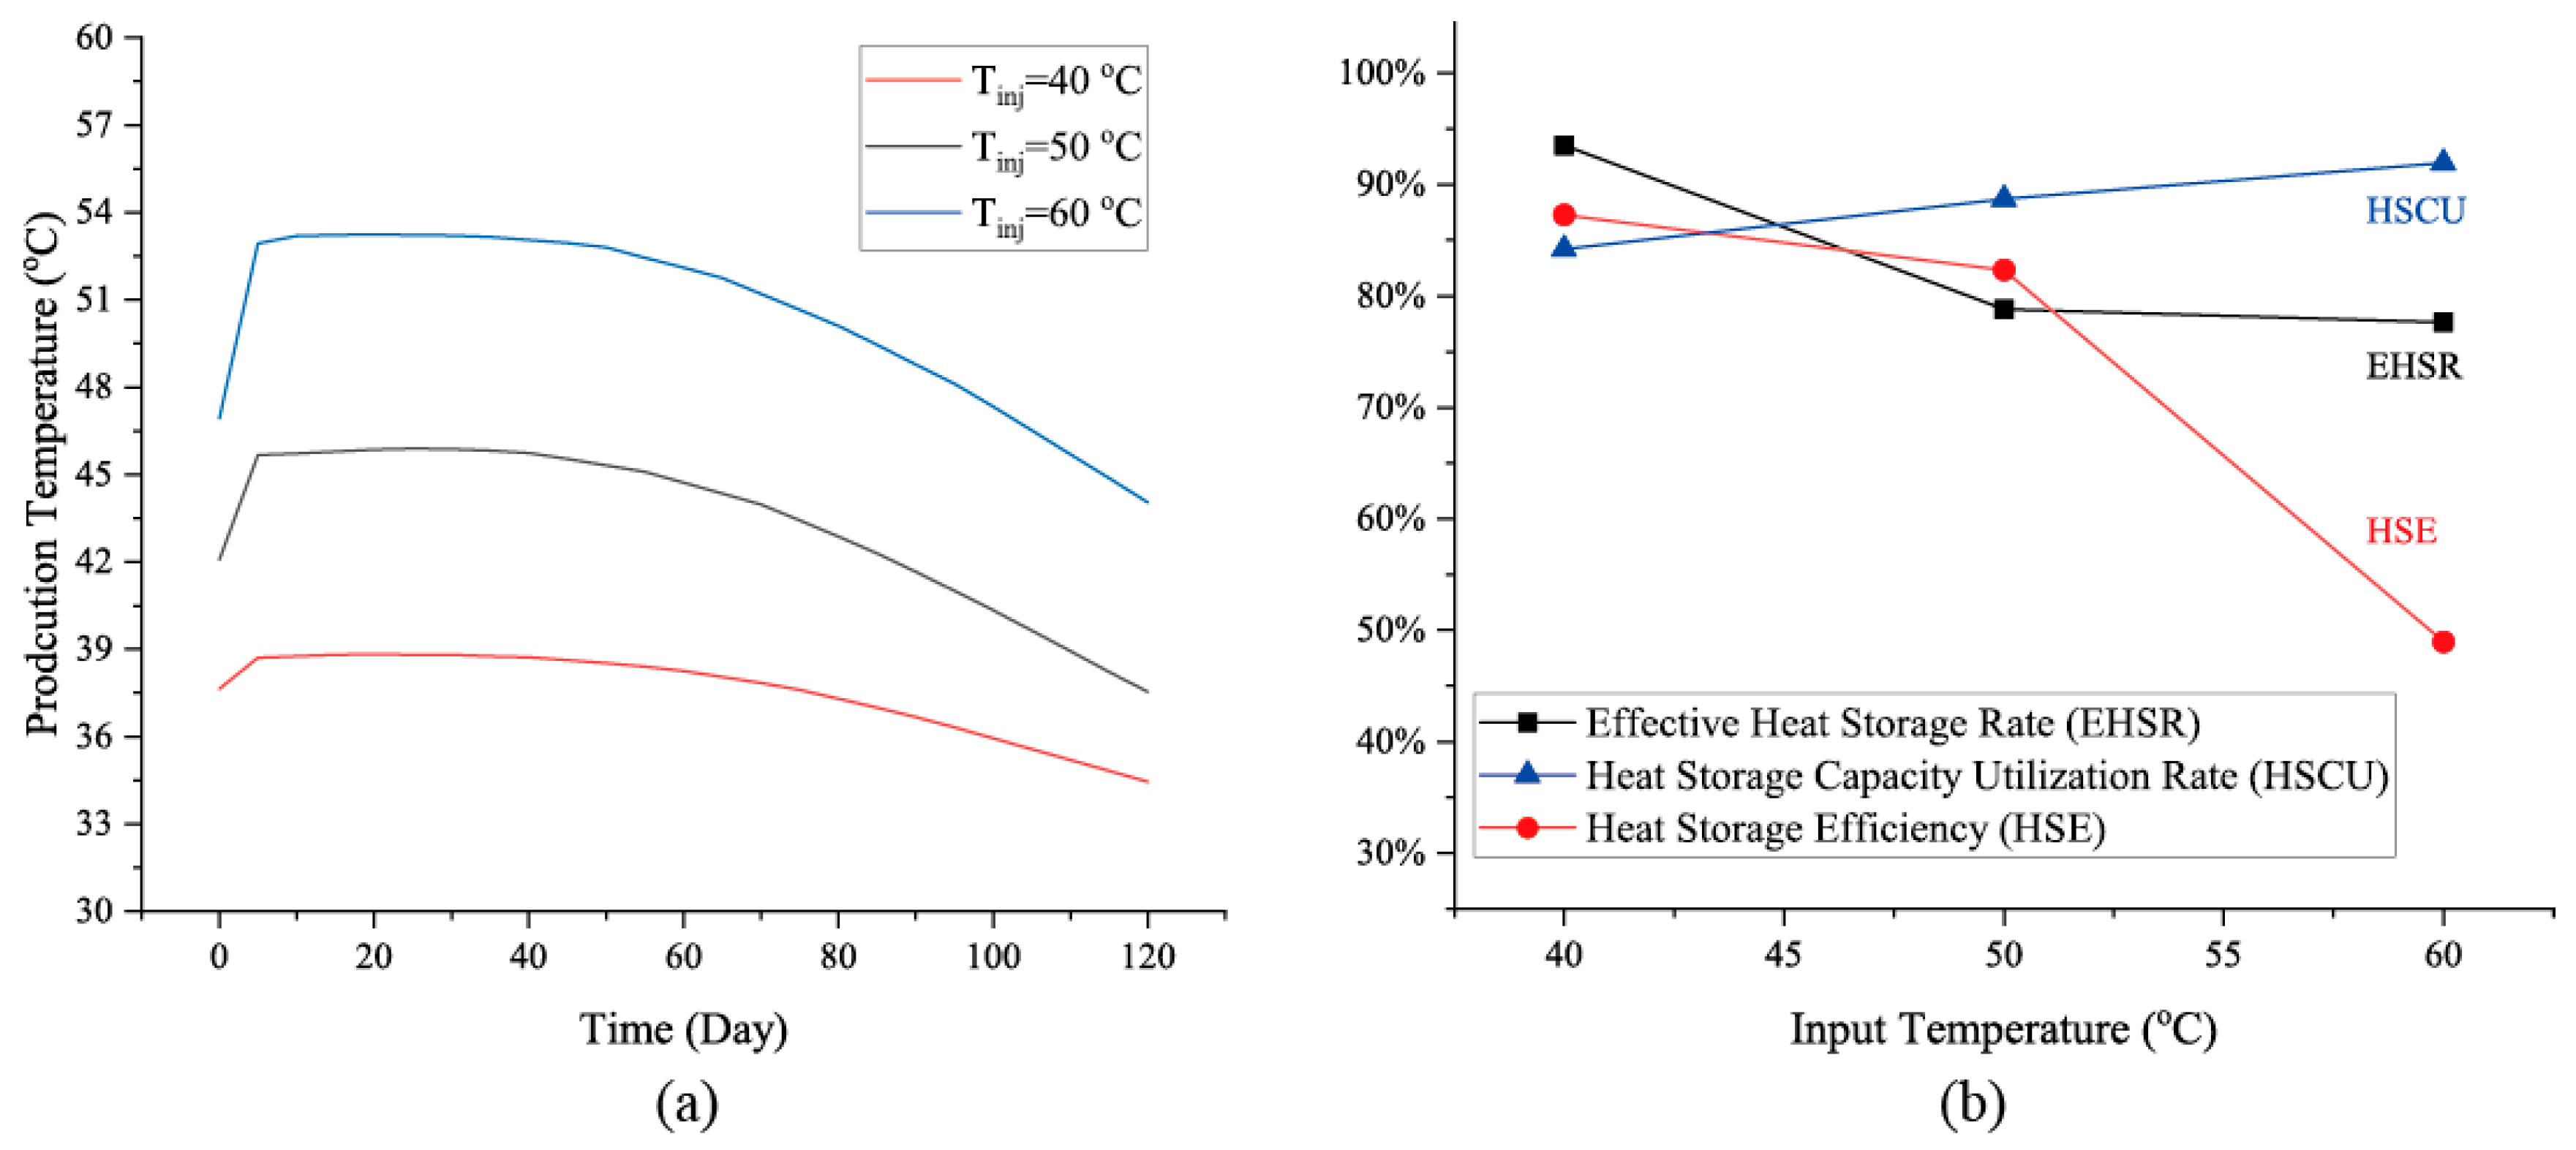
Figure 13 shows the system output temperature and energy efficiency analysis results under different injection temperature conditions. The output temperature of the HPS exhibits essentially consistent patterns across varying injection temperatures, with higher injection temperatures corresponding to higher flow temperatures (Figure 13a). Additionally, higher injection temperatures exhibit faster decreasing rates during the decline phase of the HPS, while lower injection temperatures show a relatively slower decrease. These phenomena are primarily determined by the temperature of the hot water stored within the system after the HSS phase. Higher temperatures create a larger temperature difference with the tailwater circulating for injection. During the injection process, as the cold water gradually migrates toward the pumping point, the flow temperature under high injection conditions decreases more significantly, resulting in a faster decrease rate.
Figure 13.
Analysis of system energy efficiency under different injection temperature conditions: (a) production temperature; (b) system energy efficiencies.
To further analyze the system’s overall thermal storage efficiency, the thermal storage efficiency metrics for each stage are also displayed in Figure 13b. It indicates that as injection temperature increases, the system’s effective heat storage rate (EHSR) gradually decreases, with the rate of decline progressively slowing. This demonstrates that regardless of how high the injection temperature rises, the CMUR-TES system’s effective heat storage rate tends toward a stable value of approximately 75% to 80%. Detailed analysis of the operational processes during each system phase reveals that for the HIS, the heat storage capacity utilization rate (HSCU) progressively increases with rising injection temperature. Conversely, for the HSS, the heat storage efficiency (HSE) decreases as injection temperature rises, with the rate of decline exceeding the increase in HSCU. This disparity contributes to the overall effective heat storage rate of the CMUR-TES system experiencing a certain degree of reduction as injection temperature increases.
4.2. Influence of the Surrounding Rock’s Thermal Conductivity
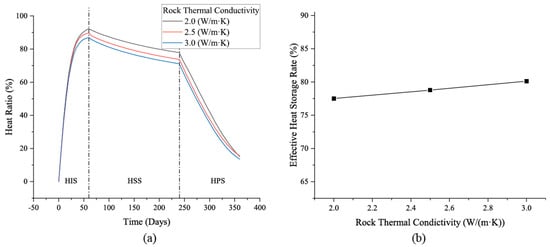
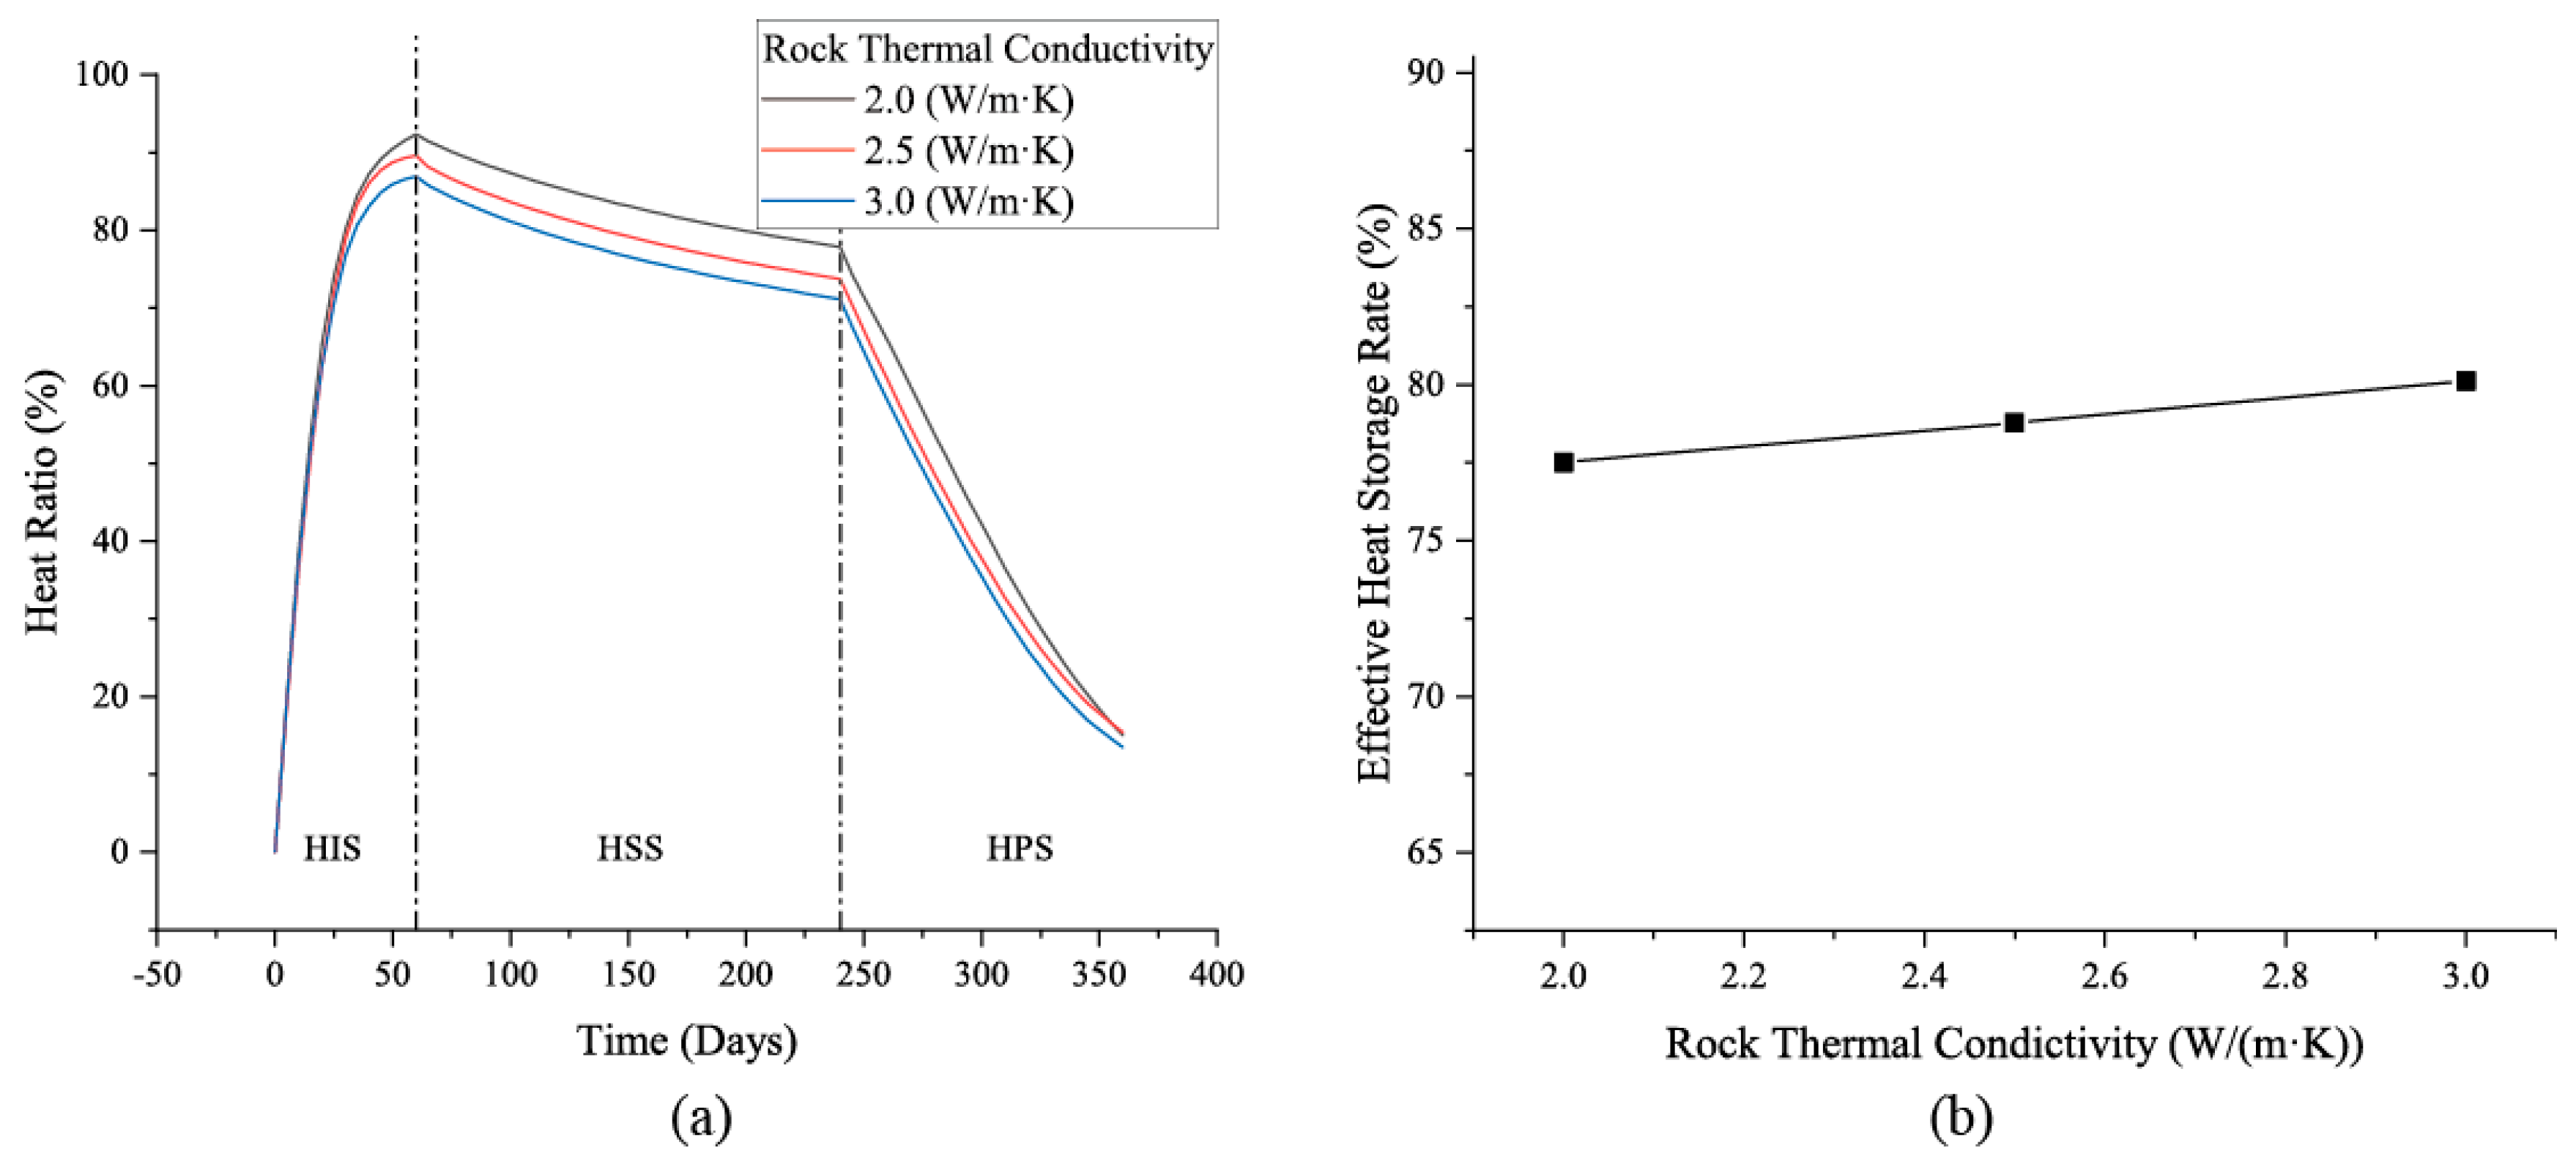
Figure 14 presents the heat storage performance of the CMUR-TES system and the results of its heat storage rate under different surrounding rock thermal conductivity values. The trend in heat storage capacity across stages (Figure 14a) indicates that lower rock thermal conductivity enhances the system’s heat storage capacity at each stage while slightly increasing the hot-water temperature. This occurs primarily because reduced thermal conductivity weakens heat transfer between hot water and rock, minimizing heat loss to the surrounding rock and retaining more heat within the system. However, numerically, even with a heat transfer coefficient varying by approximately 25% relative to 2.5 W/m·K, the proportion of stored heat to the total heat storage capacity (THSC) increases by only 2% to 5%. This indicates that while the thermal conductivity coefficient does influence heat storage capacity, its effect relative to the system’s total thermal storage is limited. Therefore, in practical engineering assessments, if the surrounding rock properties do not undergo significant changes, the weight assigned to the thermal conductivity coefficient’s impact can be appropriately reduced. Regarding the effective heat storage rate (EHSR) under different thermal conductivity values (Figure 14b), results show that lower thermal conductivity corresponds to a slightly lower EHSR. However, within the range of 2.0 W/m·K to 3.0 W/m·K, the variation in EHSR is only 3% to 5%, further indicating that the thermal conductivity of the surrounding rock has a minor impact on the system’s heat production performance. Compared to prior studies [29,34,35], this research finds weaker influence of thermal conductivity on the EHSR when considering injection processes. This primarily stems from incorporating considerations of unusable storage volumes within reservoirs during injection, thereby preventing overestimation of available heat and enhancing the accuracy of thermal storage performance assessments. This modification also reduces the proportion of effective heat variation relative to the total heat within the system, correspondingly diminishing the influence of external parameters. Nevertheless, whether or not the injection process is considered has no fundamental impact on the overall conclusions; it merely provides more precise numerical evaluation results.
Figure 14.
Analysis of the heat evolution (a) and effective heat storage rate (b) of CMUR-TES under different rock thermal conductivity values.
4.3. Influence of the Surrounding Rock’s Specific Heat Capacity
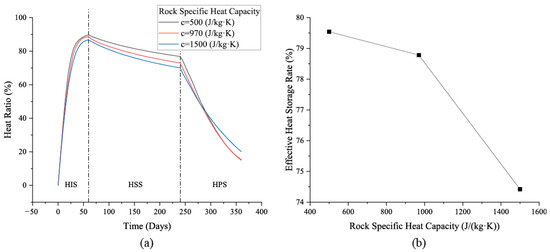
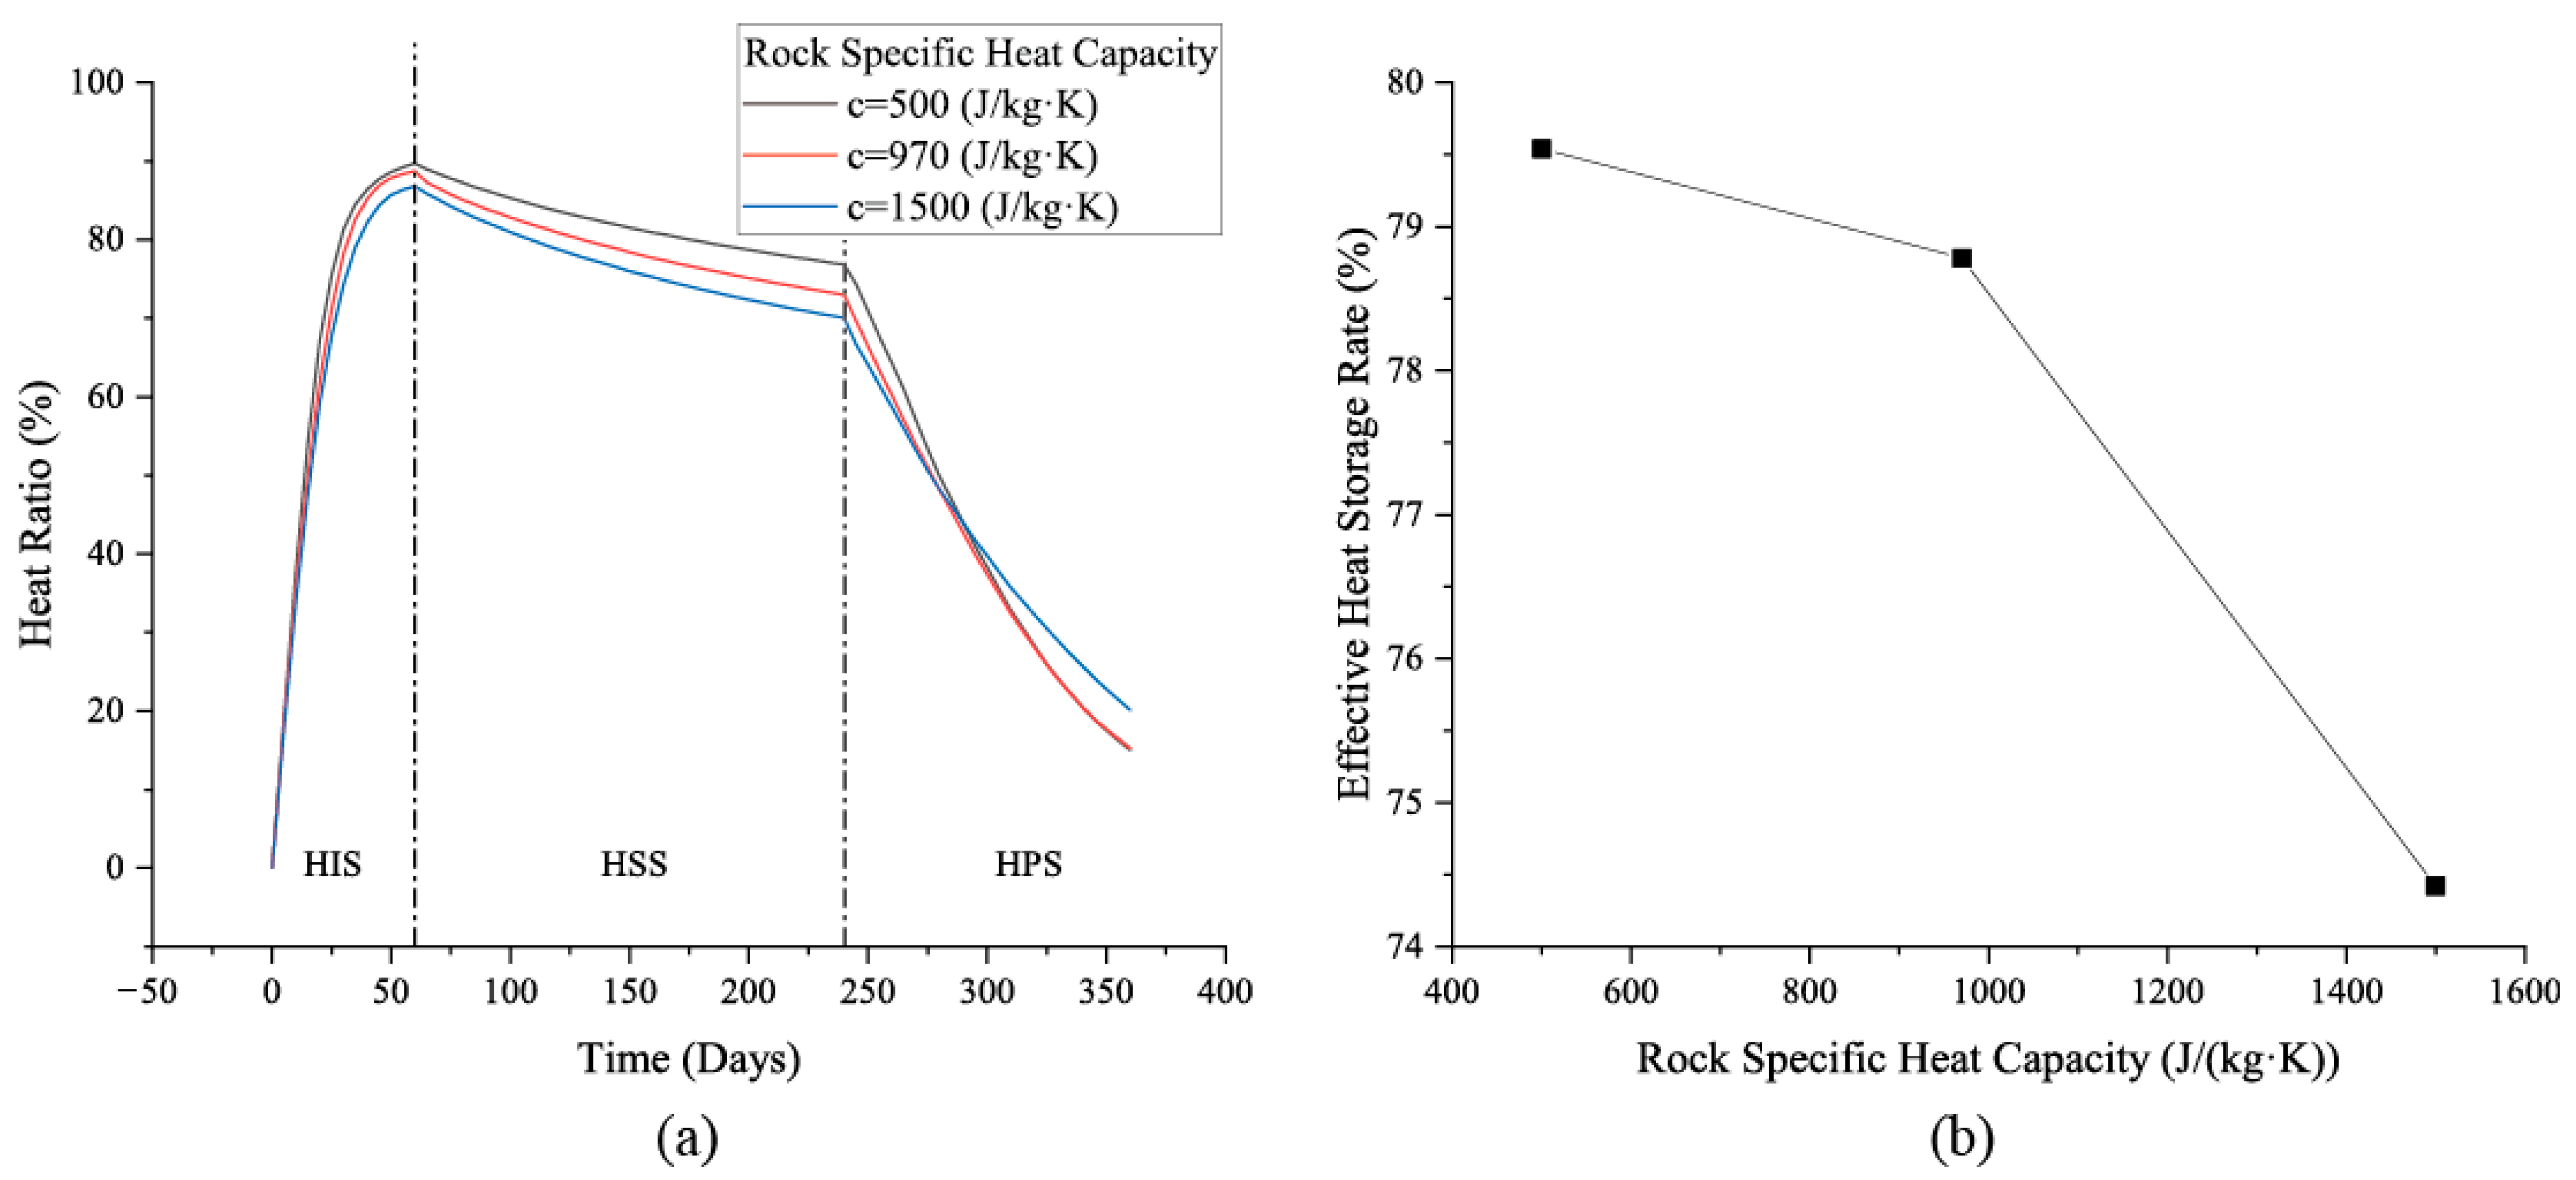
Figure 15 presents the heat storage process analysis for CMUR-TES under different surrounding rock specific heat capacity values. The results indicate that during the HIS and HSS phases, higher rock mass specific heat capacity reduces the heat stored within the CMUR. This is primarily because a higher specific heat capacity indicates absorbing more heat to achieve water–rock thermal equilibrium, consequently decreasing the heat stored inside the water in the system. However, numerically, even when the rock’s specific heat capacity tripled (from 500 J/(kg·K) to 1500 J/(kg·K)), the system’s total heat storage capacity decreased by only 6%, indicating a relatively minor impact on overall thermal storage performance. For the HPS, results indicate that while lower rock specific heat capacity provides higher initial heat capacity during the production phase, its heat storage capacity declines more rapidly. Conversely, under conditions of higher rock specific heat capacity, the rate of heat storage decline within the system during the HPS phase is slower. Furthermore, for specific heats of 500 J/(kg·K) and 970 J/(kg·K), the rate of heat loss in the latter half (after 290 days of operation) was nearly identical. This indicates a lower limit to the influence of rock specific heat on system heat storage performance; below this threshold, its effect on the HPS phase becomes negligible.
Figure 15.
Analysis of the heat evolution (a) and effective heat storage rate (b) of CMUR-TES under different rock heat specific capacity values.
Regarding the effective heat storage rate (Figure 15b), it can be observed that a higher specific heat capacity of the surrounding rock reduces the system’s effective heat storage rate. This is primarily because rock with high specific heat capacity absorbs more heat within the system, leading to increased heat dissipation and consequently a lower effective heat storage rate. However, judging from the numerical results, this impact is actually not significant. Even under conditions where the specific heat capacity increases by a factor of three, the system’s overall heat storage efficiency decreases by less than 6%. This result accounts for the heat generation phase and is consistent with the findings for heat storage capacity. Thus, while the specific heat capacity of the surrounding rock does influence the system’s overall heat storage performance, this influence is numerically limited. In practical scenarios, the specific heat capacity of the surrounding rock typically does not exhibit substantial variation (exceeding threefold). For CMUR-TES systems, the surrounding rock is predominantly composed of sandstone, mudstone, or other sedimentary rocks, whose specific heat capacities do not differ dramatically. Consequently, the system’s overall thermal storage performance under such conditions remains largely unaffected. This aspect can be appropriately considered during CMUR-TES design.
5. Conclusions
Based on the actual conditions of coal mine goaf areas, this study develops a full-process operational model of coal mine underground reservoir-based thermal energy storage (CMUR-TES) for cross-seasonal applications and employs a multiphysics-coupled numerical framework to analyze energy evolution across the heat injection (HIS), heat storage (HSS), and heat production (HPS) stages, together with a comprehensive performance assessment and analysis of key engineering and operational parameters. The results confirm the feasibility of cross-seasonal CMUR-TES. Under the configurations and operating conditions examined, nearly 80% of the injected heat can be recovered and reused. During the HIS, complete displacement by hot water is not achieved, with cold water persisting in two corners of the reservoir, limiting the maximum injection capacity to 82.3% of the theoretical storage capacity. During the HSS, heat dissipates to the surrounding rock via conduction without causing substantial cooling of the stored hot water; approximately 17% of the injected heat is lost during storage, which is acceptable. In the HPS, the outlet temperature is about 46 °C for the first five days, maintains stable production for roughly 35 days, and then declines gradually; after 120 days of production, the outlet temperature is about 37.5 °C. Overall, about 95% of the residual heat in the system is extracted and utilized during the HPS, with less than 5% remaining unrecovered, indicating that the HPS effectively releases nearly all heat stored during the HSS.
Sensitivity analyses show that increasing the injection temperature raises the production temperature but reduces the effective heat storage fraction; increasing the thermal conductivity and specific heat capacity of the surrounding rock lowers storage efficiency to a limited extent that is largely negligible in practical engineering. Taken together, these results demonstrate that CMUR-TES offers high efficiency and strong engineering feasibility for cross-seasonal thermal storage applications. These conclusions and insights can provide references for the research and design of large-scale cross-seasonal thermal storage projects. However, it should be pointed out that this study modeled a CMUR based on actual site conditions, so the design of the cross-seasonal thermal storage process and the operational parameters of CMUR-TES represent a design-based, anticipated analysis. Consequently, there have been no published cross-seasonal thermal storage project at the actual site up to now, making it hard to validate the model with real site data. Nevertheless, considering the accuracy of the physical parameters used in the modeling process and the similarity of results to those obtained from other forms of thermal storage systems, these results indirectly demonstrate that the conclusions drawn in this study can provide engineering reference from a qualitative perspective. Future research should further refine and elaborate the model through in-depth studies utilizing actual CMUR-TES installations.
Author Contributions
Methodology: W.T. and Z.H.; conceptualization: Z.H. and H.Z.; validation: W.T., C.F. and X.H.; formal analysis: W.T. and Z.H.; writing—original draft: W.T. and Z.H.; software: W.T., C.F. and X.H.; writing—review and editing: J.T., Q.G., H.Z. and Y.Y.; project administration: J.T., Q.G. and H.Z. All authors have read and agreed to the published version of the manuscript.
Funding
This work was jointly supported by the State Key Laboratory of the Water Resources Protection and Utilization in Coal Mining Open Fund (NICE_RD_2023_156) and the Scientific Research project of the Jilin Provincial Department of Education (grant number: JJKH20240157KJ). The APC was funded by the State Key Laboratory of the Water Resources Protection and Utilization in Coal Mining Open Fund.
Institutional Review Board Statement
Not applicable.
Informed Consent Statement
Not applicable.
Data Availability Statement
Data are contained within the article.
Conflicts of Interest
Author Xiaolin He was employed by the company China Construction Second Engineering Bureau Co., Ltd. The remaining authors declare that the research was conducted in the absence of any commercial or financial relationships that could be construed as potential conflicts of interest.
Abbreviation
| Nomenclature | |
| heat capacity of fluid | |
| heat capacity of the rock matrix | |
| permeability of rock | |
| the gravitational acceleration | |
| pressure of fluid in the reservoir area | |
| fluid pressure in the surrounding rock | |
| mass recharge source of the seepage field | |
| additional heat sources in the reservoir area | |
| additional heat source in the surrounding rock | |
| fluid exchange between the reservoir area and the surrounding rock | |
| fluid temperature in the reservoir area | |
| temperature of the surrounding rock | |
| fluid velocity in the reservoir area | |
| the fluid velocity in the surrounding rock | |
| fluid density | |
| density of the rock matrix | |
| dynamic viscosity | |
| porosity of rock | |
| thermal conductivity of fluid | |
| the thermal conductivity of saturated rock | |
| mass heat capacity of saturated rock | |
| Abbreviation | |
| CMURs | coal mine underground reservoirs |
| PTES | pit thermal energy storage |
| ATES | aquifer thermal energy storage |
| CMUR-TES | coal mine underground reservoir-based thermal energy storage |
| HIS | heat injection stage |
| HSS | heat storage stage |
| HPS | heat production stage |
| THSC | theoretical heat storage capacity |
| UTSC | ultimate thermal storage capacity |
| EHSR | effective heat storage rate |
| HSCU | heat storage capacity utilization rate |
| HSE | heat storage efficiency |
| THSC | total heat storage capacity |
References
- Lin, G.; Dong, D.; Li, X.; Fan, P. Accounting for Mine Water in Coal Mining Activities and its Spatial Characteristics in China. Mine Water Environ. 2020, 39, 150–156. [Google Scholar] [CrossRef] [Scilit]
- Yang, J.; Guo, L. Dynamic Evaluation of Water Utilization Efficiency in Large Coal Mining Area Based on Life Cycle Sustainability Assessment Theory. Geofluids 2021, 2021, 7793988. [Google Scholar] [CrossRef] [Scilit]
- Cui, C.-Q.; Wang, B.; Zhao, Y.-X.; Xue, L.-M. Waste mine to emerging wealth: Innovative solutions for abandoned underground coal mine reutilization on a waste management level. J. Clean. Prod. 2020, 252, 119748. [Google Scholar] [CrossRef] [Scilit]
- Dong, S.; Yin, H.; Yao, S.; Zhang, F. Detecting Surface Subsidence in Coal Mining Area Based on DInSAR Technique. J. Earth Sci. 2013, 24, 449–456. [Google Scholar] [CrossRef] [Scilit]
- Yang, Y.; Wu, Z.; Shi, F. Data-driven Analysis of Risk Factors for Coal Mine Accidents. Teh. Vjesn.-Tech. Gaz. 2025, 32, 296–305. [Google Scholar]
- Zhou, D.-W.; Wu, K.; Cheng, G.-L.; Li, L. Mechanism of mining subsidence in coal mining area with thick alluvium soil in China. Arab. J. Geosci. 2015, 8, 1855–1867. [Google Scholar] [CrossRef] [Scilit]
- Chen, Y.; Zhang, Y.; Xia, F.; Xing, Z.; Wang, L. Impacts of Underground Reservoir Site Selection and Water Storage on the Groundwater Flow System in a Mining Area-A Case Study of Daliuta Mine. Water 2022, 14, 3282. [Google Scholar] [CrossRef] [Scilit]
- Li, P.; Ma, L.; Wu, Y.; Zhang, L.; Hao, Y. Concurrent Mining During Construction and Water-Filling of a Goaf Groundwater Reservoir in a Coal Mine. Mine Water Environ. 2018, 37, 763–773. [Google Scholar] [CrossRef] [Scilit]
- Zhang, C.; Luo, B.; Xu, Z.; Sun, Y.; Feng, L. Research on the Capacity of Underground Reservoirs in Coal Mines to Protect the Groundwater Resources: A Case of Zhangshuanglou Coal Mine in Xuzhou, China. Water 2023, 15, 1468. [Google Scholar] [CrossRef] [Scilit]
- Chi, M.-b.; Li, Q.-s.; Cao, Z.-g.; Fang, J.; Wu, B.-y.; Zhang, Y.; Wei, S.-r.; Liu, X.-q.; Yang, Y.-m. Evaluation of water resources carrying capacity in ecologically fragile mining areas under the influence of underground reservoirs in coal mines. J. Clean. Prod. 2022, 379, 134449. [Google Scholar] [CrossRef] [Scilit]
- Chi, M.; Cao, Z.; Li, Q.; Zhang, Y.; Wu, B.; Zhang, B.; Yang, Y.; Liu, X. Water Supply and Regulation of Underground Reservoir in Coal Mine considering Coal-Water Occurrence Relationship. Geofluids 2022, 2022, 2892964. [Google Scholar] [CrossRef] [Scilit]
- Chi, M.; Cao, Z.; Wu, B.; Li, Q.; Zhang, Y.; Wu, Y.; Wang, L.; Yang, Y.; Zhang, B.; Li, H. Prediction of water source and water volume of underground reservoir in coal mine under multiple aquifers. Water Supply 2022, 22, 4067–4081. [Google Scholar] [CrossRef] [Scilit]
- Li, Y.; Yao, Q.; Xia, Z.; Xu, Q.; Yu, L.; Liu, Z.; Chen, S. Stability Evaluation of the Artificial Dam in Underground Reservoirs Under Storage and Drainage Cycles: A Method Based on Concrete Performance and Case Study. Rock Mech. Rock Eng. 2025, 58, 7725–7744. [Google Scholar] [CrossRef] [Scilit]
- Rong, T.; Wang, J.; Wang, L.; Zhang, S.; Ren, X.; Yang, Y.; Zhou, Y. A damage model of rock-concrete composite in coal mine underground reservoirs. Constr. Build. Mater. 2024, 455, 139046. [Google Scholar] [CrossRef] [Scilit]
- Liu, S.; Zhang, K.; Gao, J.; Yang, Y.; Bai, L.; Yan, J. Research on Temporal Patterns of Water-Rock Interaction in the Coal Mine Underground Reservoir Based on the Dynamic Simulation Test. ACS Omega 2023, 8, 13819–13832. [Google Scholar] [CrossRef] [Scilit]
- Zhang, Q.; Luo, S.; Zhao, L.; Zhang, P.; Wang, S.; Sun, C.; Zhang, L. Effect of Darcy flux on the release of dissolved organic matter and nitrogen from coal gangue in a coal mine underground reservoir: Column experiments. Chem. Geol. 2020, 545, 119652. [Google Scholar] [CrossRef] [Scilit]
- Sifnaios, I.; Furbo, S.; Jensen, A.R. Monitoring data of the Hoje Taastrup water pit thermal energy storage. Data Brief 2025, 58, 111305. [Google Scholar] [CrossRef] [Scilit]
- Xiang, Y.; Xie, Z.; Furbo, S.; Wang, D.; Gao, M.; Fan, J. A comprehensive review on pit thermal energy storage: Technical elements, numerical approaches and recent applications. J. Energy Storage 2022, 55, 105716. [Google Scholar] [CrossRef] [Scilit]
- Mahon, H.; O’Connor, D.; Friedrich, D.; Hughes, B. A review of thermal energy storage technologies for seasonal loops. Energy 2022, 239, 122207. [Google Scholar] [CrossRef] [Scilit]
- Marojevic, K.; Kurevija, T.; Macenic, M. Challenges and Opportunities for Aquifer Thermal Energy Storage (ATES) in EU Energy Transition Efforts—An Overview. Energies 2025, 18, 1001. [Google Scholar] [CrossRef] [Scilit]
- Formhals, J.; Kirschstein, X.; Dahash, A.; Seib, L.; Sass, I. Development, validation and demonstration of a new Modelica pit thermal energy storage model for system simulation and optimization. Geotherm. Energy 2024, 12, 23. [Google Scholar] [CrossRef] [Scilit]
- Yang, T.; Liu, W.; Kramer, G.J.; Sun, Q. Seasonal thermal energy storage: A techno-economic literature review. Renew. Sustain. Energy Rev. 2021, 139, 110732. [Google Scholar] [CrossRef] [Scilit]
- Chen, J.; Chen, K.; Zhang, W.; Su, J.M.; Zhao, B.; Hu, M.; Pei, G. Numerical study of a solar district heating system with photovoltaic-thermal collectors and pit thermal energy storage. Energy 2025, 317, 134705. [Google Scholar] [CrossRef] [Scilit]
- Dahash, A.; Ochs, F.; Janetti, M.B.; Streicher, W. Advances in seasonal thermal energy storage for solar district heating applications: A critical review on large-scale hot-water tank and pit thermal energy storage systems. Appl. Energy 2019, 239, 296–315. [Google Scholar] [CrossRef] [Scilit]
- Dobson, P.; McLing, T.; Spycher, N.; Fleuchaus, P.; Neupane, G.; Doughty, C.; Zhang, Y.; Smith, R.; Atkinson, T.; Jin, W.; et al. High-Temperature Aquifer Thermal Energy Storage (HT-ATES) Projects in Germany and the Netherlands-Review and Lessons Learned. Energies 2025, 18, 19961073. [Google Scholar] [CrossRef] [Scilit]
- Herrmann, M.; Fleuchaus, P.; Godschalk, B.; Verbiest, M.; Sorensen, S.N.; Blum, P. Capital costs of aquifer thermal energy storage (ATES): A review. Renew. Sustain. Energy Rev. 2026, 226, 116202. [Google Scholar] [CrossRef] [Scilit]
- Fleuchaus, P.; Godschalk, B.; Stober, I.; Blum, P. Worldwide application of aquifer thermal energy storage—A review. Renew. Sustain. Energy Rev. 2018, 94, 861–876. [Google Scholar] [CrossRef] [Scilit]
- Zhou, X.; Gao, Q.; Chen, X.; Yan, Y.; Spitler, J.D. Developmental status and challenges of GWHP and ATES in China. Renew. Sustain. Energy Rev. 2015, 42, 973–985. [Google Scholar] [CrossRef] [Scilit]
- Wang, Z.; Tang, J.; Hu, Z.; Guo, Q.; Zhang, H.; Zhang, K.; Kang, S.; He, X. Potential Evaluation of Cross-Seasonal Heat Storage of Coal Mine Underground Reservoir: A Case Study Based on Multiphysics Coupling Numerical Simulation Method. Appl. Sci. 2025, 15, 10070. [Google Scholar] [CrossRef] [Scilit]
- Vukelic, Z.; Sporin, J. Groundwater Potential for the Utilisation of Shallow Geothermal Energy from a Closed Coal Mine. Water 2024, 16, 1572. [Google Scholar] [CrossRef] [Scilit]
- Wang, H.; Xu, Y.; Yuan, L.; Sun, Y.; Cai, Y. Analysis of geothermal heat recovery from abandoned coal mine water for clean heating and cooling: A case from Shandong, China. Renew. Energy 2024, 228, 120659. [Google Scholar] [CrossRef] [Scilit]
- Shi, X.; Zhang, J. Characteristics of Overburden Failure and Fracture Evolution in Shallow Buried Working Face with Large Mining Height. Sustainability 2021, 13, 13775. [Google Scholar] [CrossRef] [Scilit]
- Wang, B.; Zhou, D.; Zhang, J.; Liang, B. Study on the strength deterioration characteristic and damage model of coal pillar dams with repeated water immersion in underground reservoirs. Sci. Rep. 2024, 14, 6338. [Google Scholar] [CrossRef] [Scilit]
- Yuan, T.; Gu, Y.; Sima, W.; Yan, W.; Yang, M.; Chang, F. Energy storage mechanism and modeling method of underground aquifer to meet the demand of large-capacity new energy consumption. Appl. Therm. Eng. 2024, 256, 123961. [Google Scholar] [CrossRef] [Scilit]
- Zhang, Y.; Gao, X.; Sun, C.; Ye, C.; Gong, Y.; Kong, Y.; Pang, Z.; Li, H.; Lu, X.; Yao, Y. Thermal performance and analysis of high-temperature aquifer thermal energy storage based on a practical project. J. Energy Storage 2024, 82, 110399. [Google Scholar] [CrossRef] [Scilit]
- Sommer, W.T.; Doornenbal, P.J.; Drijver, B.C.; van Gaans, P.F.M.; Leusbrock, I.; Grotenhuis, J.T.C.; Rijnaarts, H.H.M. Thermal performance and heat transport in aquifer thermal energy storage. Hydrogeol. J. 2014, 22, 263–279. [Google Scholar] [CrossRef] [Scilit]
- Li, S.; Wang, G.; Zhou, M.; Song, X.; Shi, Y.; Yi, J.; Zhao, J.; Zhou, Y. Thermal performance of an aquifer thermal energy storage system: Insights from novel multilateral wells. Energy 2024, 294, 130915. [Google Scholar] [CrossRef] [Scilit]

Disclaimer/Publisher’s Note: The statements, opinions and data contained in all publications are solely those of the individual author(s) and contributor(s) and not of MDPI and/or the editor(s). MDPI and/or the editor(s) disclaim responsibility for any injury to people or property resulting from any ideas, methods, instructions or products referred to in the content. |
© 2026 by the authors. Licensee MDPI, Basel, Switzerland. This article is an open access article distributed under the terms and conditions of the Creative Commons Attribution (CC BY) license.