


Abstract
Cities worldwide face profound morphological changes due to population growth and urban densification. Coupled with climate change, this exacerbates the Urban Heat Island (UHI) effect and degrades outdoor thermal comfort. This paper introduces a novel simulation framework for climate-resilient urban design, transitioning from static planning standards to dynamic performance optimization. This research utilizes a multi-tiered data acquisition strategy, beginning with a PRISMA-guided Systematic Literature Review of 133 articles to identify key UHI mitigation variables. A high-fidelity, multi-physics Computational Fluid Dynamics (CFD) model was developed using the ANSYS Fluent solver, discretized with a poly-hexacore mesh of over 78 million cells. The simulation environment integrates multiscale data, including 2.5D urban geometry from GIS platforms, high-resolution satellite information (e.g., Copernicus and LiDAR) for surface and soil properties, and EUMETSAT weather files for boundary conditions. The model explicitly resolves aerodynamic and thermodynamic exchanges using Unsteady Reynolds-Averaged Navier–Stokes (URANS) equations, with vegetation represented via porous-medium parameterization. The core novelty lies in the development of a parameterized library of “Architectural Elements” (AEs) that introduces standardized material properties, derived from Ansys Granta Selector, directly with GIS-based street designs. This allows for iterative “what-if” scenario analyses over critical 24 h periods to assess the synergistic impact of green infrastructure (GI) and advanced materials. Validation against real-world monitoring data from the Grow-Green project confirmed the model’s accuracy, with a maximum error of only 0.22%. The results demonstrate that interconnecting isolated green areas and utilizing local porous materials can reduce UHI spot temperatures by 2–4 °C while significantly lowering building energy consumption.
1. Introduction
Mitigating the UHI effect is paramount for achieving resilient and sustainable urban development, requiring innovative, performance-based approaches that move beyond conventional static planning standards. To avoid current urban planning methodologies which typically fail to account for the complex, dynamic interplay between urban form, material choices, and microclimatic conditions [1].
The replacement of natural, permeable surfaces with impervious materials of high heat capacity and low reflectivity significantly alters the urban energy balance [2,3]. This phenomenon contributes to the increased energy demand for cooling, degraded air quality, and elevated risks to public health and thermal comfort, particularly during extreme heat events [4,5]. Quantifying the efficacy of UHI mitigation strategies, such as the adoption of “cool pavements” and GI, requires highly resolved predictive tools that can accurately model complex atmospheric physics at the microscale [4].
While numerous studies have addressed UHI mitigation through strategies like “cool pavements” and green infrastructure (GI) [2,3], a significant research gap remains in the seamless integration of these strategies into high-fidelity, predictive digital models that can provide rapid, synergistic impact assessments at the street scale. The existing literature often focuses on laboratory characterization or broad-scale urban energy balances without resolving the specific aerodynamic and thermodynamic exchanges of localized Architectural Elements [4]. Furthermore, there is a lack of frameworks that couple standardized material properties directly with GIS-based design tools [5] for iterative “what-if” scenario testing.
The objective of this paper is to present a modular simulation framework for optimizing urban design strategies through an efficient and accurate procedure. The framework develops modular AE and GI elements that can be parametrized with different materials, vegetation species and design solutions. Further to the parametrical scenario design, the framework is based on an efficient mathematical model allowing a quick and accurate evaluation of “what if” alternatives for the desired optimization.
Understanding the diverse relationships between Urban Heat Island (UHI) mitigation strategies and broader climate action (both adaptation and mitigation) is crucial for effective, integrated urban policy, which necessitates considering four interaction types of co-benefits, synergies, conflicts, and trade-offs. According to the relevant literature on this topic [6], laboratory characterization provides the necessary information to simulate UHI interactions, providing a model for impact assessment.
However, although current methodologies [7] provide a coherent framework, several challenges remain:
- Computational cost vs. resolution: While LES models like PALM-4U offer high detail, they are extremely demanding computationally, often limiting their use to smaller areas or shorter simulation periods.
- Explicit simulation gaps: Though current high-fidelity CFD models may explicitly resolve aerodynamic and thermodynamic exchanges, their focus remains on dominant physical drivers without adequate consideration of detail for the built environment materials.
- Standardization and integration: There is a gap in integrating standardized material properties and green infrastructure (GI) directly into digital models for quick, synergistic impact assessments.
- Static vs. dynamic planning: Many existing methodologies still rely on static planning standards, failing to account in detail for the complex, dynamic interplay between urban form and microclimatic conditions.
- Scalability of detailed micro-physics: Resolving the specific aerodynamic exchanges of detailed Architectural Elements consistently across larger spatial scales remains a challenge for unified urban climate projections.
The modeling of urban microclimates has evolved into a multiscale ecosystem. For studying critical parameters such as buildings, street pavement, and GI, numerical models have become the preferred approach due to the rise of Smart City platforms and high-resolution satellite data. These tools vary significantly in their numerical formulation and computational costs. Table 1 summarizes the scope, strengths, and limitations of the primary numerical tools [8] currently used in UHI modeling.
Table 1.
Primary numerical tools currently used in UHI modeling [8].
At the microscale (0.5–10 m), models such as PALM-4U offer full 3D LES of turbulent flow and thermodynamics, explicitly resolving buildings and urban morphology. PALM-4U extends the PALM model system with comprehensive urban physics—radiation, vegetation, anthropogenic heat, and chemistry—making it suitable for studies of street-canyon ventilation, thermal comfort, and pollutant dispersion [9,10].
ENVI-met, though not LES-based, provides a fully integrated microclimate simulation system with fine horizontal resolution (0.5–2 m), detailed vegetation modeling, and design-focused workflows. Its widespread use in planning practice stems from its ability to simulate shading, evapotranspiration, and local thermal comfort with relatively modest computational demands [11].
For city-district to full-city scales (50–500 m), Urban Canopy Models (UCMs) embedded within mesoscale numerical weather prediction systems remain essential. The Weather Research and Forecasting (WRF) model is particularly influential due to its suite of urban parameterizations, including the Single-Layer UCM, the multilayer Building Effect Parameterization (BEP), and the extended BEP + Building Energy Model (BEP + BEM) that couples building HVAC energy use with atmospheric processes [12]. These enable simulations at convection-permitting scales (~100–250 m), allowing representation of UHI dynamics, heat-wave amplification, and climate–energy interactions.
At the land-surface and energy-balance level, a physically based representation of radiation, heat storage, evapotranspiration, human water use, and anthropogenic heat allows urban patches to be simulated consistently across large grids. While not a 3D climatic model, it serves as a key component in multiscale modeling chains and is widely used for interpreting flux observations and representing surface processes in coupled systems [13]. Together, these tools form a coherent modeling framework across scales: mesoscale models capture regional forcing, fast urban climate models provide city-wide mapping at operational or climate-service timescales, and microscale CFD/LES systems resolve the urban form in detail for planning and design. Their complementary capabilities allow multi-tiered analyses that connect climate change, urban morphology, and human thermal comfort.
2. Materials and Methods
2.1. Bibliographical Search for UHI Modeling Frameworks
The investigative approach utilized a multi-method data acquisition strategy encompassing two primary techniques to address the stated research objectives: the Systematic Literature Review (SLR) and the Evidence-Based Case Study Analysis:
- Systematic Literature Review (SLR)—Guided by PRISMA principles: The literature review was executed as a systematic process to ensure comprehensiveness, reproducibility, and minimal bias, following the core PRISMA framework [14]:
- ○
- Identification: delineation of specific research queries designed to capture the interplay between UHI mitigation, climate adaptation, and urban policy. The initial search of academic databases (Scopus, Web of Science, and ScienceDirect) rendered 1549 papers.
- ○
- Specific inclusion and exclusion criteria were applied to filter the identified literature. Articles screened were relevant to “UHI mitigation and/or climate adaptation strategies”. The final number of articles was 133, which included only peer-reviewed journals and papers dating not earlier than 2020.
- ○
- Eligibility: Full texts of the screened articles were retrieved and subjected to a more detailed evaluation for methodological quality and content alignment. Key data elements (e.g., UHI strategy type, measured impact, climate action interaction type, and scale of application) were systematically extracted and synthesized to establish the foundational theoretical framework and identify research gaps. A total of 51 papers were selected (see Table 2 for their synthesis matrix) and analyzed to develop our framework model.
Table 2.
Literature review synthesis matrix.
2.2. Proposed UHI Framework Model
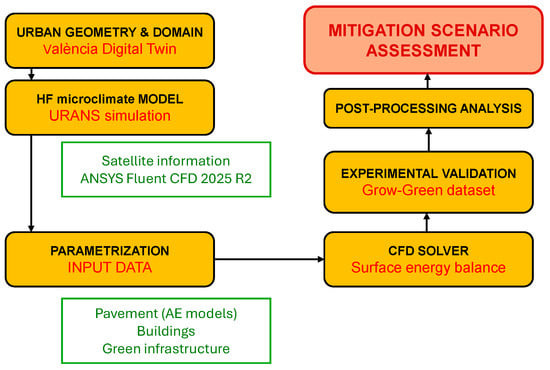
Our framework model follows the principles proposed by Almashhour et al. [15], adapted to the critical variables defined in [16]. In Figure 1, the flow diagram for the framework model is presented.
Figure 1.
Proposed conceptual UHI framework model.
Urban geometry defines our geospatial physical layer. According to Vitanova et al. [17], the built environment layer requires full detail of the building geometry, typology, materials and energy-related parameters. Additional urban layers include green infrastructure pavement and street sections with materials. For our research, we apply our model to the city of Valencia, where most the information required (except for street sections and materials) is available from the VLC Smart-city platform [18] and the PhD thesis developed by Calabuig-Moreno [19].
The climate layer was modeled for the simulation using available meteorological information from [18] and satellite data [20] but first required a decision on the detailed microclimate modeling tool to be used.
A starting point for this decision required an analysis of the available numerical tools ranging from building-resolving Large Eddy Simulations (LESs) to mesoscale models enhanced with urban canopy schemes. These tools differ substantially in numerical formulation, computational cost, and intended application scale. Together, they form a multiscale modeling ecosystem capable of addressing microclimate processes at the street scale, mesoscale UHI dynamics, and long-term urban climate projections.
The selected approach relies on Computational Fluid Dynamics (CFD) for resolving the transfer of heat, momentum, and mass within the complex geometry of the UCM [21]. Specifically, the ANSYS Fluent CFD solver is the basis for the final “what-if” scenario analysis, comparing the thermal performance of conventional street materials (e.g., asphalt) against proposed low-impact materials (e.g., high-albedo cool pavements) or green infrastructure changes under defined climatic conditions on the scenario under study but limited to a selected critical day (24 h). The Unsteady Reynolds-Averaged Navier–Stokes (URANS) simulation model is enhanced with satellite information [22] applied to the area and day but coupling the initial climate conditions to the virtual model of the area [23]. The output is then compared to real physical measurements of the scenario for validation [24]. The coupled microclimate weather model together with the virtual twin of the area under study can be used for different scenarios.
The framework model for our research was implemented in ArcGIS Pro 3.6 from ESRI https://support.esri.com/en-us/products/arcgis-pro, accessed (accessed on 12 January 2026). All AE and GI modular elements (including vegetation species information from [25]) were created with ModelBuilder using the Model Parameter functionality in ArcGIS for selecting pavement materials and vegetation species through Python PyCharm v.2025.3.2.1 scripts. This prepares the initial URBAN DOMAIN (Figure 1) to be loaded into ANSYS Fluent CFD 2025 R2 for setting the initial boundary conditions and solving the 24 h simulation.
The initial urban model is run with real urban detail to be calibrated with the real climate data for the selected simulation. After calibration, this process is repeated for sequential scenarios changing the URBAN DOMAIN according to the alternative strategies and their re-parametrization.
The mitigation scenario assessment includes an analysis of the UHI spots (those areas with an average temperature that is 20% above the surrounding space). This analysis includes the reduction in the UHI affected area on the model during the whole day (total area affected by the UHI effect during at least 1 h on the simulation day), the average percentual reduction in humidity during the day, and the energy consumption reduction in the 24 h simulated.
The post-processing stage for our mitigation scenario evaluation develops the proposed core novelty using a “what-if” analysis of alternative solutions for assessing their relative impact through an accurate representation of surface energy exchanges.
The first key element on the proposed methodology is to focus on concrete (critical) 24 h periods for the evaluation of the impact assessment. This allows utilizing a high-fidelity simulation algorithm to optimize public space design for mitigating UHI effects while enhancing overall sustainability and resilience. The proposed framework can apply the high-fidelity, multi-physics Computational Fluid Dynamics (CFD) coupled to a parametrical GIS model.
By establishing this validated computational environment, the framework enables dynamic, iterative testing of urban design interventions—from material changes and street-canyon geometries to the strategic placement and species selection of GI. This approach offers a proactive, evidence-based methodology for public space planning, transitioning beyond static regulatory compliance to a regime of dynamic performance optimization, where design decisions are directly correlated with simulated microclimatic improvements.
2.3. Input Data
A detailed explanation is required for the main elements on the UHI simulation model for Valencia used for this research. The main elements are:
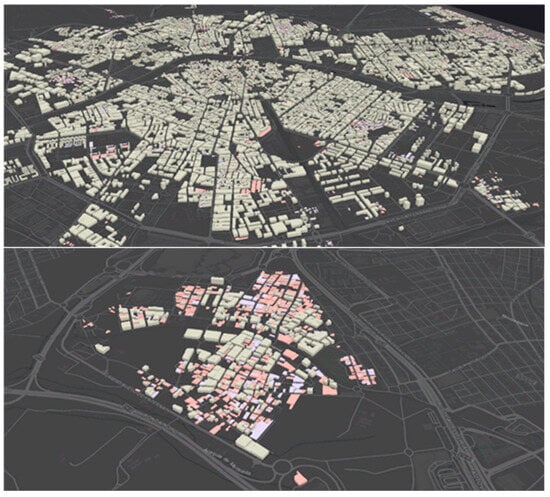
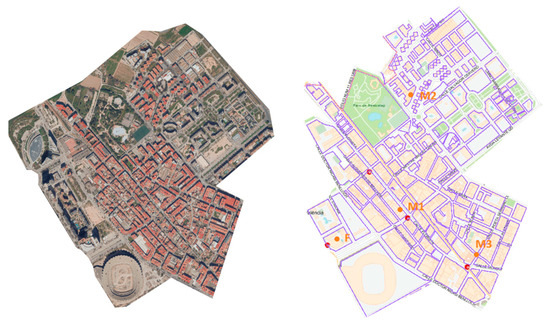
- Urban geometry and related domain: The GIS model was implemented on ArcGIS Online (October 2025) and can be accessed through https://raimon.maps.arcgis.com/ (accessed on 13 December 2025). In Figure 2, two reference 2.5D images for the city of Valencia and for the selected neighborhood (Benicalap) can be found.
Figure 2.
On top, an aerial view for the city of Valencia, and below, the Benicalap area (different colors relate to construction year for the buildings).
The Benicalap area has 534 buildings with an overall constructed area of 679,700 m2. Only 90 of these buildings are less than 20 years old. The detailed information per building is shown in Table 3.
Table 3.
Detailed information per building.
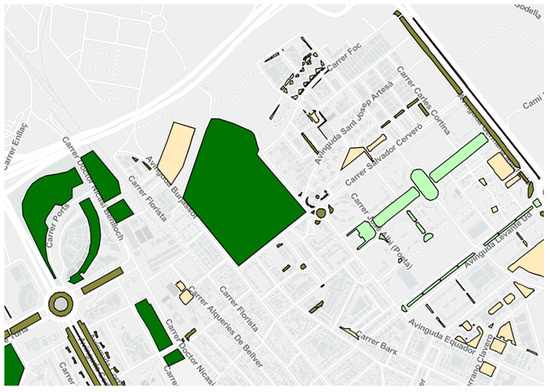
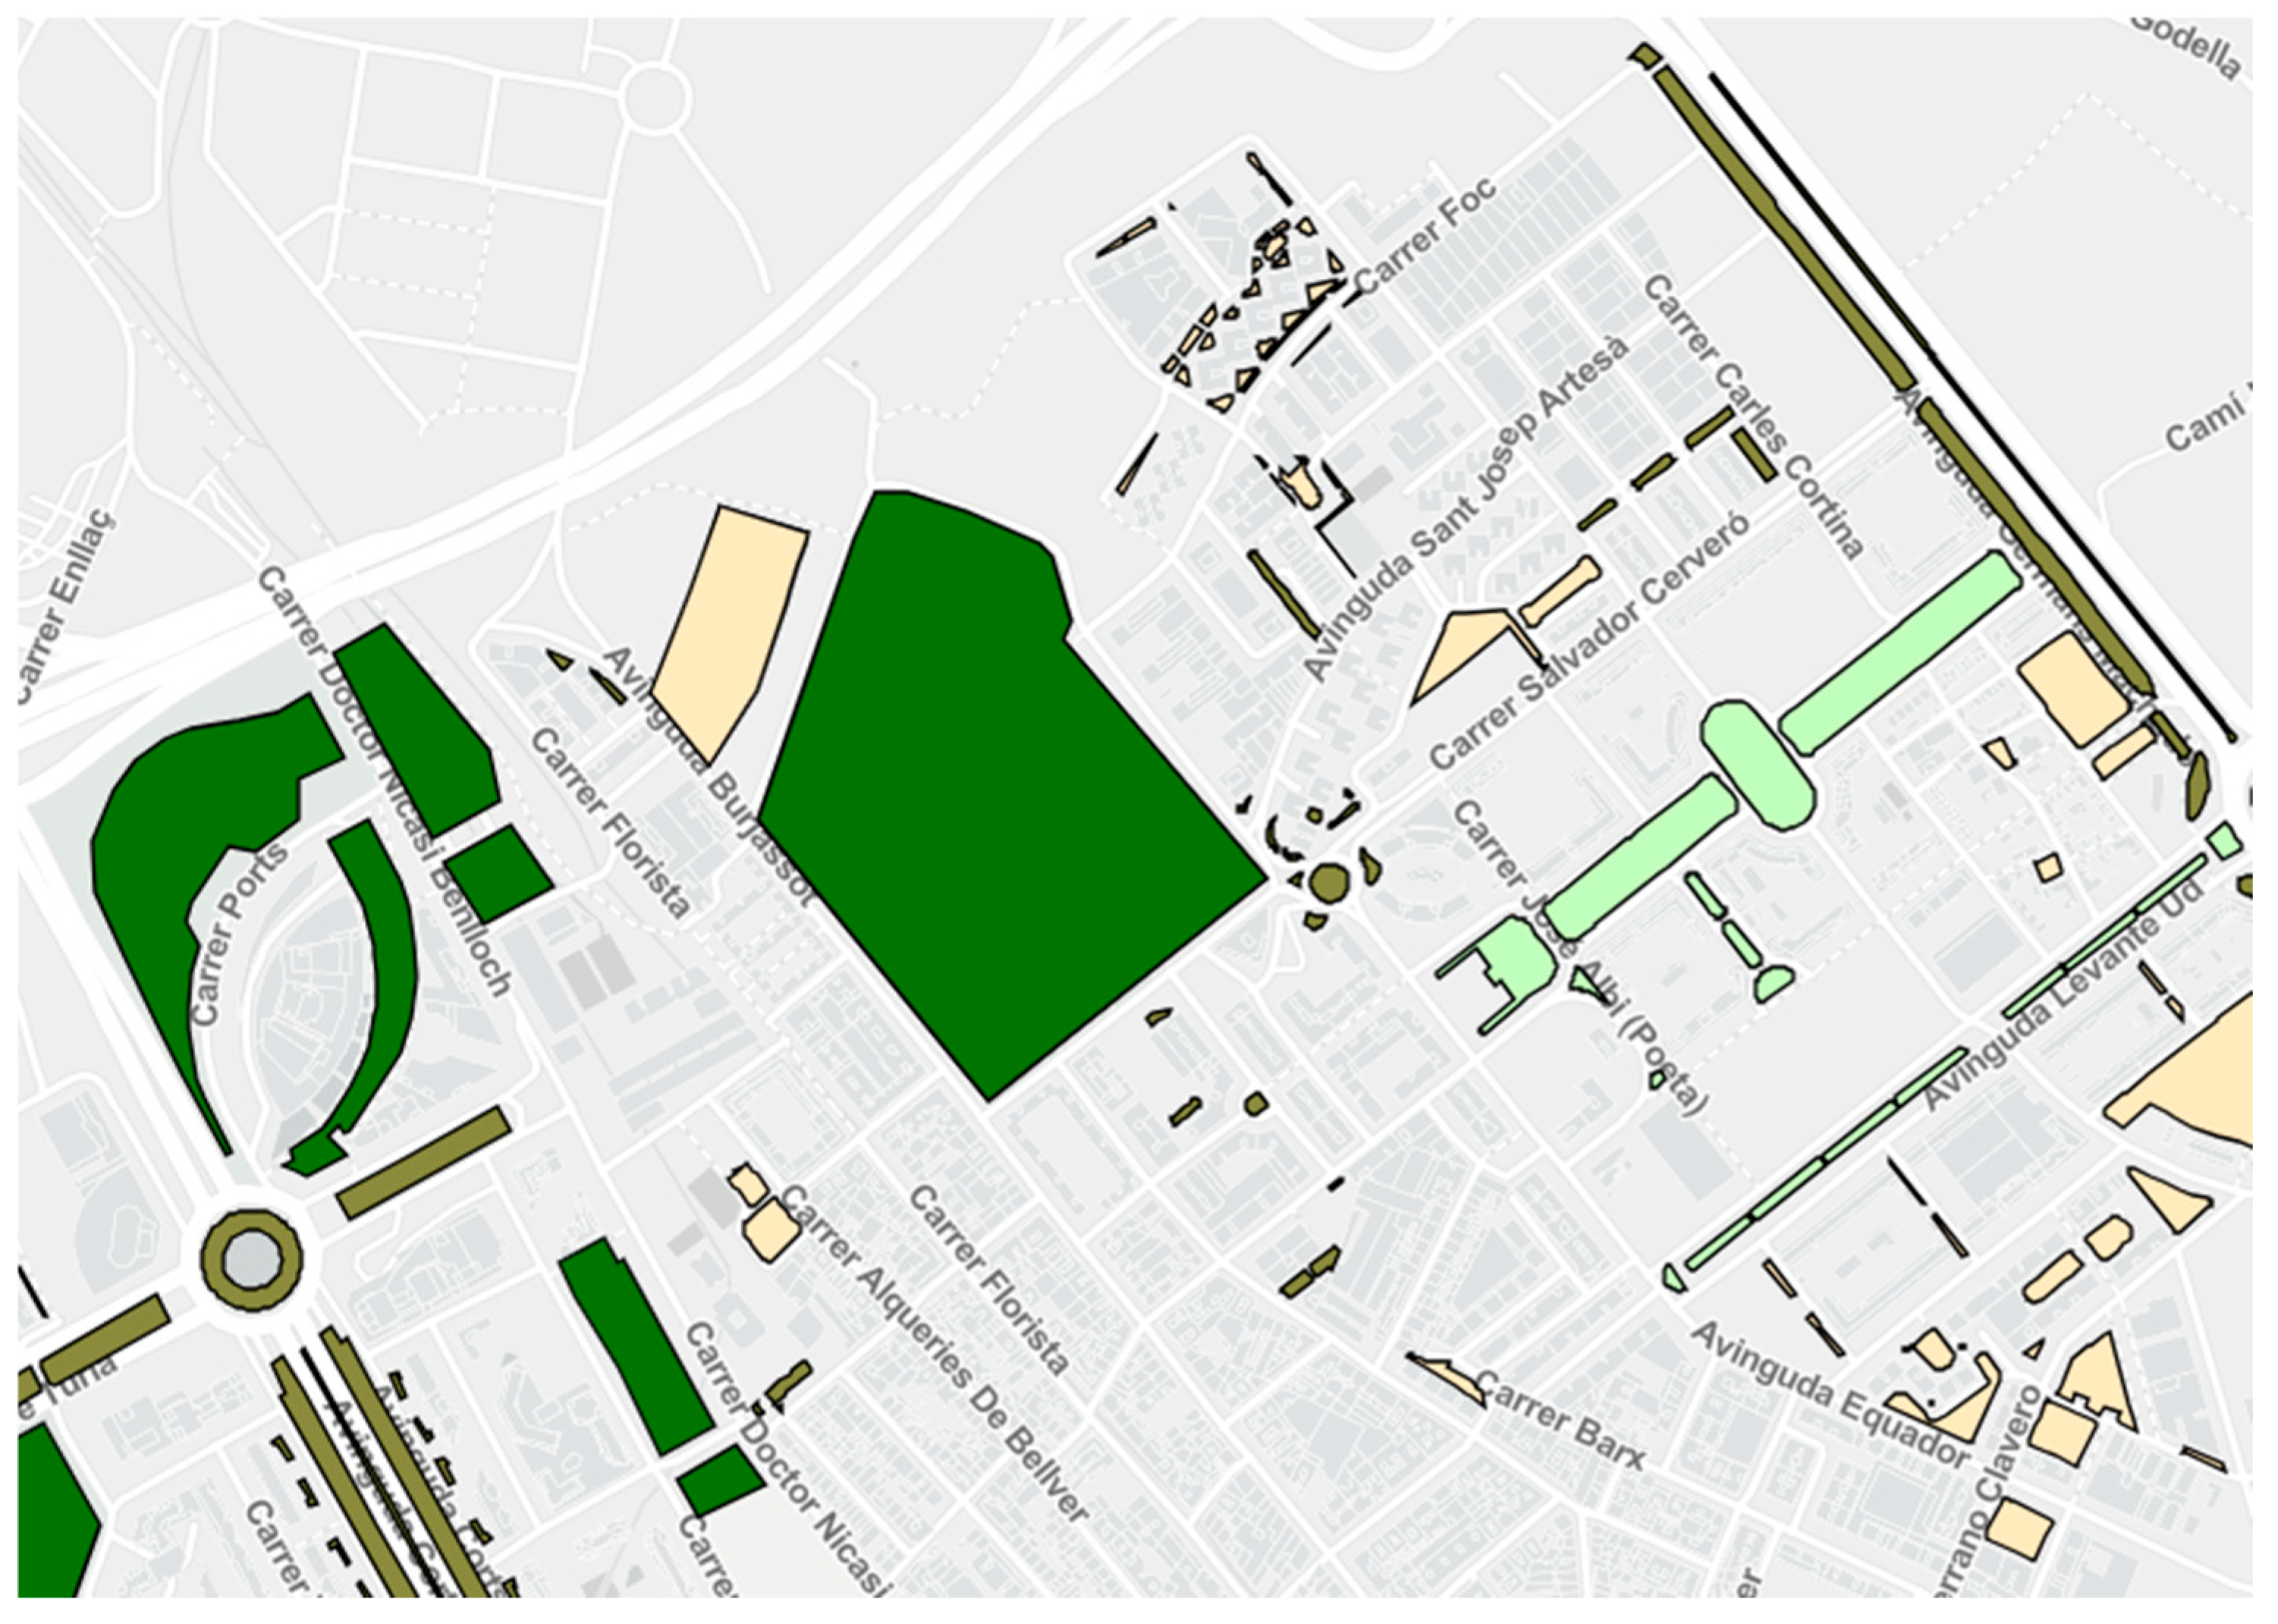
The green infrastructure was integrated as an independent layer from the Valencia platform [13]. See Figure 3 for details.
Figure 3.
Green infrastructure in the Benicalap neighborhood (dark green indicates trees, light green low growth species and cream green roofs).
All buildings were places on top of the terrain with fitted mesh created from the file obtained by the Valencia Region LIDAR flight with 25 m resolution (https://dadesobertes.gva.es/es/dataset?q=&tags=ICV&sort=views_recent+desc&tags=PNOA-LiDAR (accessed on 12 December 2025).
- Satellite information: See below the full details of the data platforms used.
- ○
- 1 m META CHM and GEDI L2A for fine-scale vegetation height and crown shape (https://www.nature.com/articles/s41597-024-03668-4, accessed on 14 December 2025).
- ○
- 10 m Copernicus Land-Cover for surface class from which we can get vegetation, soil, impervious materials, and water cell fractions, as well as soil type (https://land.copernicus.eu/en/products/global-dynamic-land-cover/land-cover-2020-raster-10-m-global-annual, accessed on 12 December 2025).
- ○
- SoilGrids v2.0 (250 m) for soil properties (https://soilgrids.org/, accessed on 14 December 2025).
- ○
- ERA5-Land, GLDAS-2.1, and SMAP L4 for initial soil temperature and moisture (9–25 km) (https://developers.google.com/earth-engine/datasets/tags/surface?hl=es-419, accessed on 14 December 2025).
- ○
- Copernicus CGLS Surface Albedo (https://www.copernicus.eu/en/global-land-surface-albedo, accessed on 14 December 2025).
- ○
- Modis MCD15A2H or Sentinel-2 NDVI for NDVI/LAI (10–500 m) (https://www.earthdata.nasa.gov/data/catalog/lpcloud-mcd15a2h-061, accessed on 14 December 2025).
- ○
- EUMETSAT weather file for boundary conditions on temperature, humidity, inflow velocity and direction, downloaded from the Destination Earth platform (https://platform.destine.eu/, accessed on 14 December 2025).
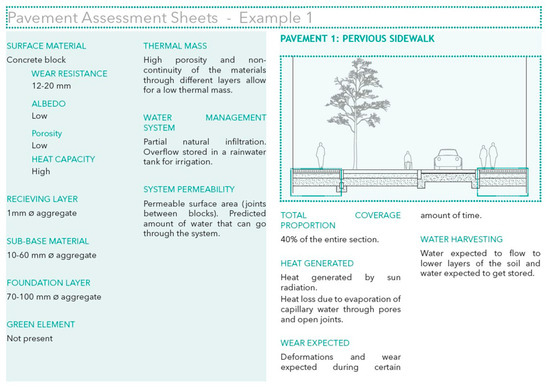
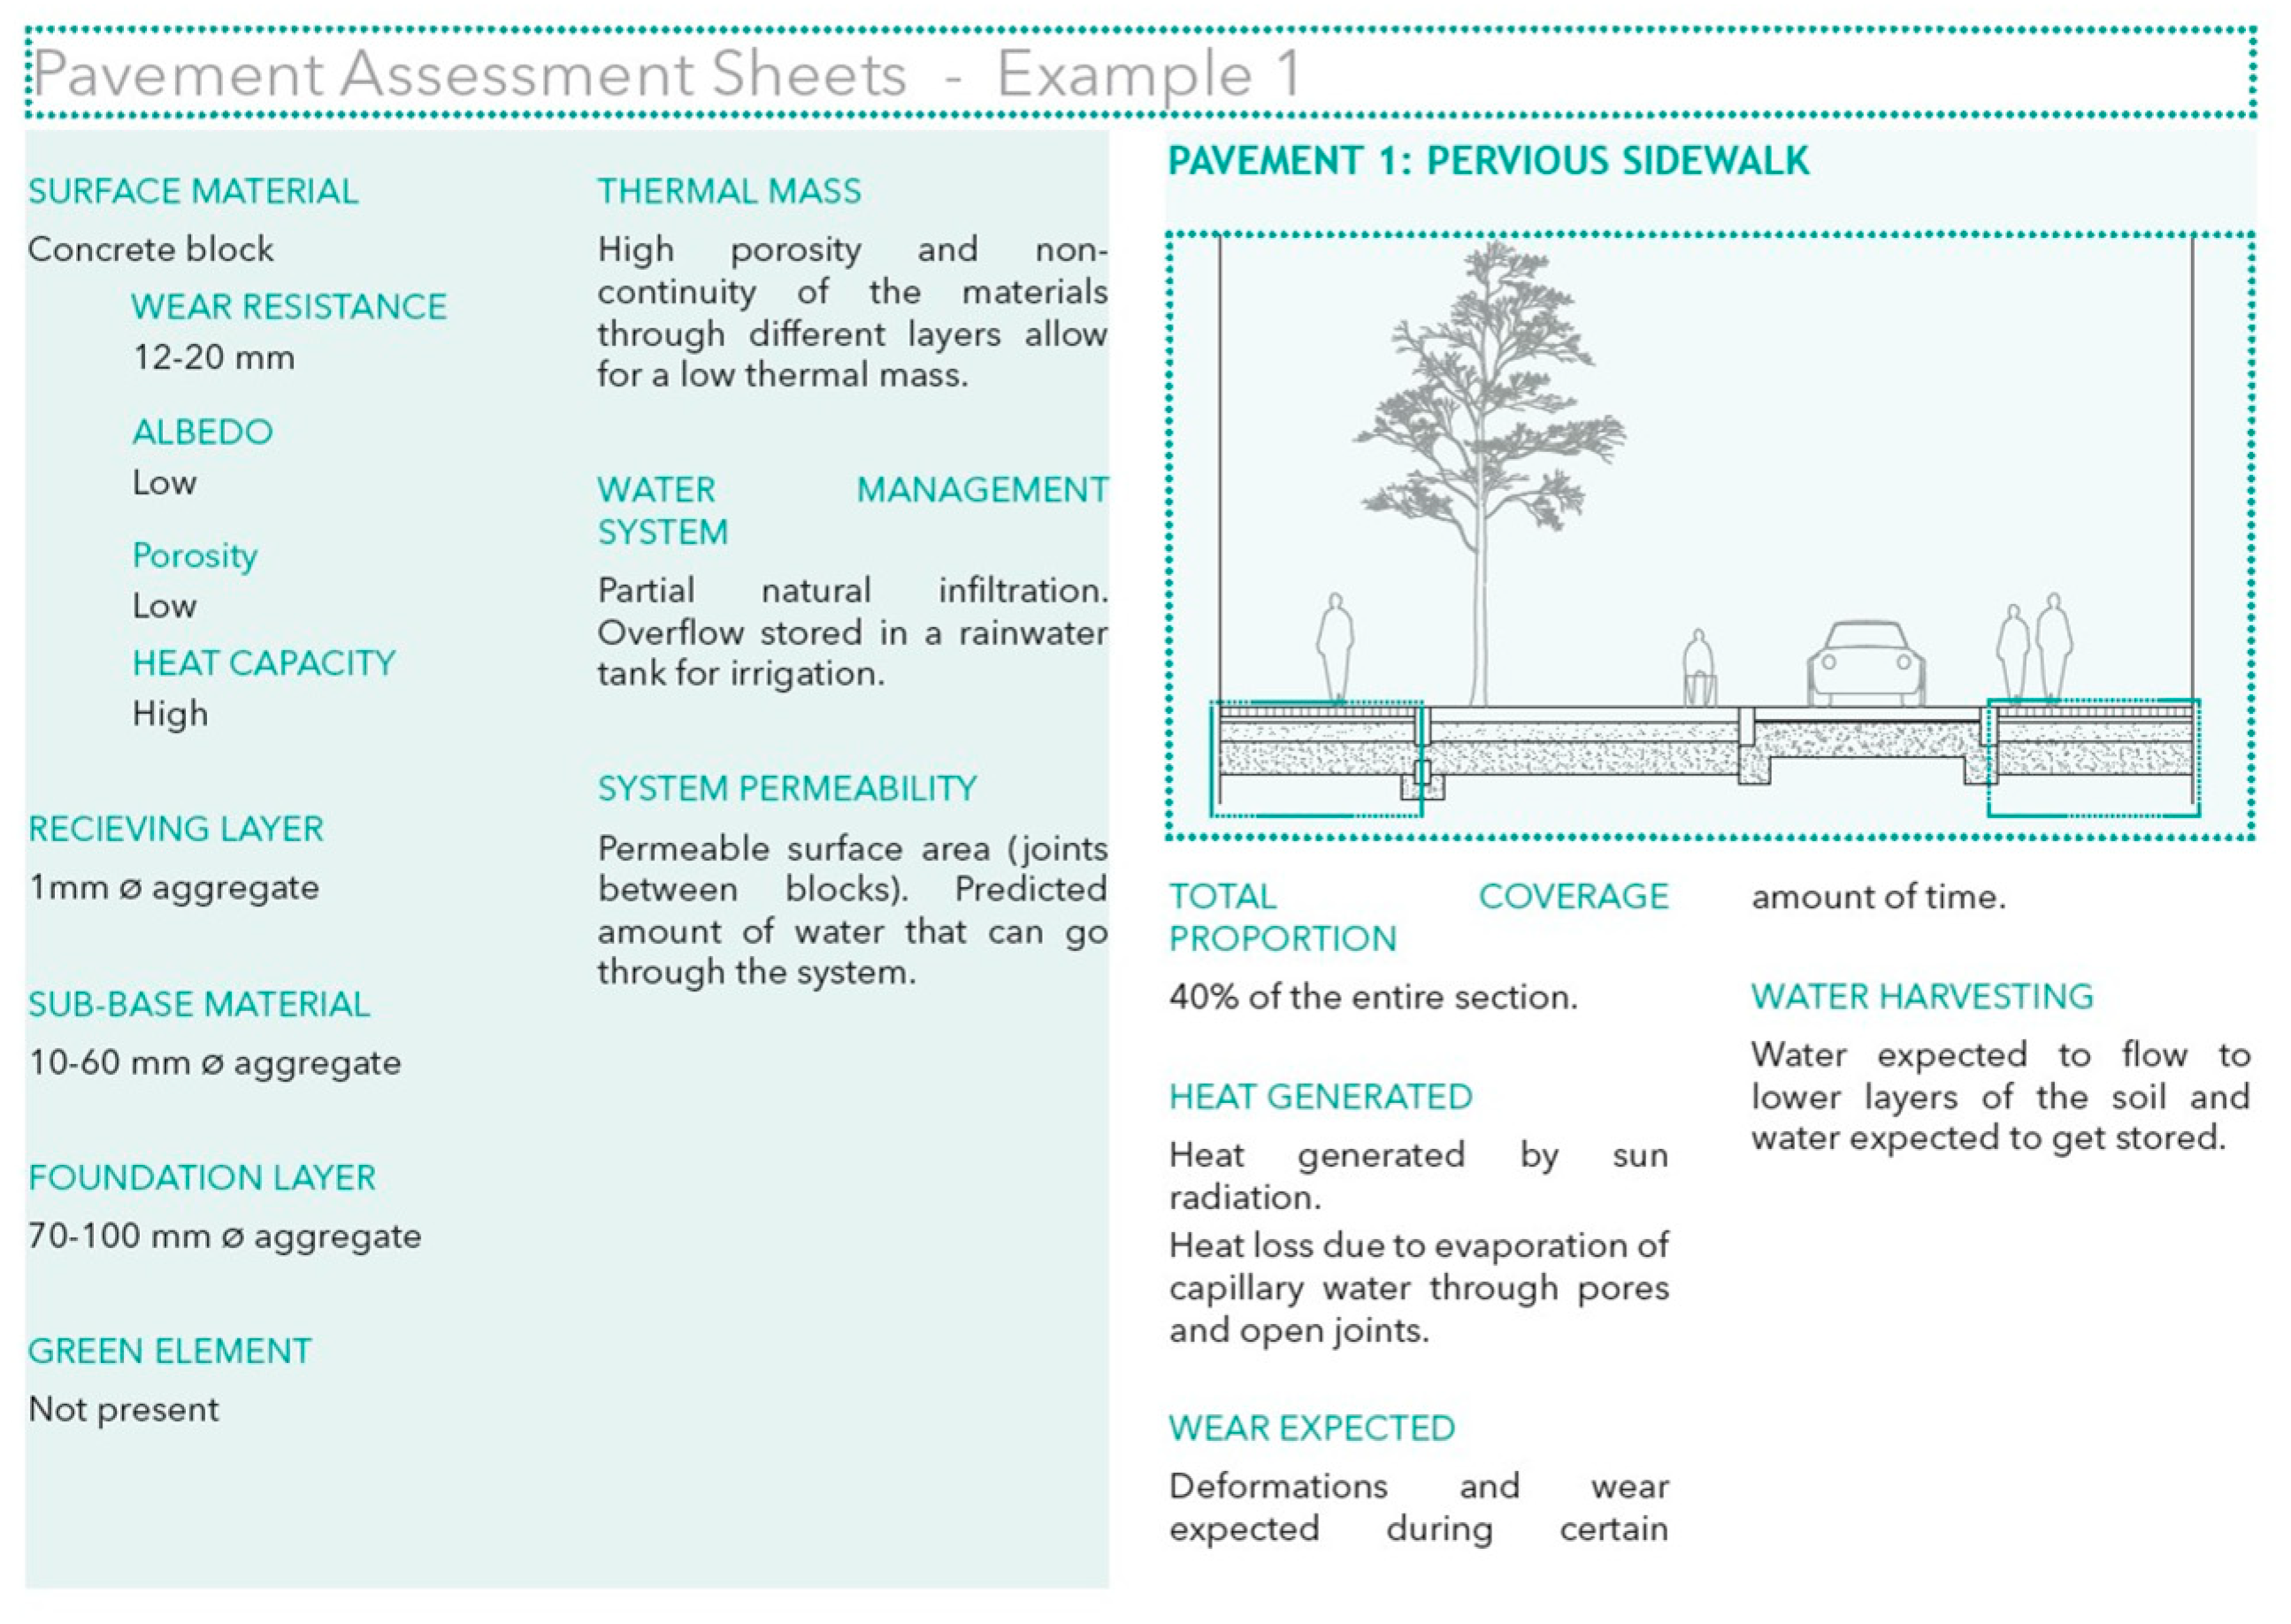
- Architectural Elements: Following the standardized taxonomy developed by Orozco-Sanchez [26] (as shown in Figure 4), all material properties for the street sections were analyzed by the authors and coded into an initial dataset coded into the AE layer.
- Grow-Green dataset [24]: Under Horizon 2020 Grant Agreement number 730283, Grow-Green partners designed different green infrastructure assessments, resulting in the Green Cities framework [27] for developing a knowledge base for future implementations. The dataset includes details for GI redesign at the street-section level (included in the previous AE where the vegetation species were also parametrized from [25]) and modular green roofs (part of GI solutions in [27] with vegetation from [25]). The monitoring results obtained for the Benicalap area in Valencia are available in the corresponding dataset [26]. These results were used for the validation of the CFD model.
Figure 4.
Pavement assessment sheets for each Architectural Element.
3. Results
3.1. High-Fidelity, Multi-Physics CFD Model and Validation
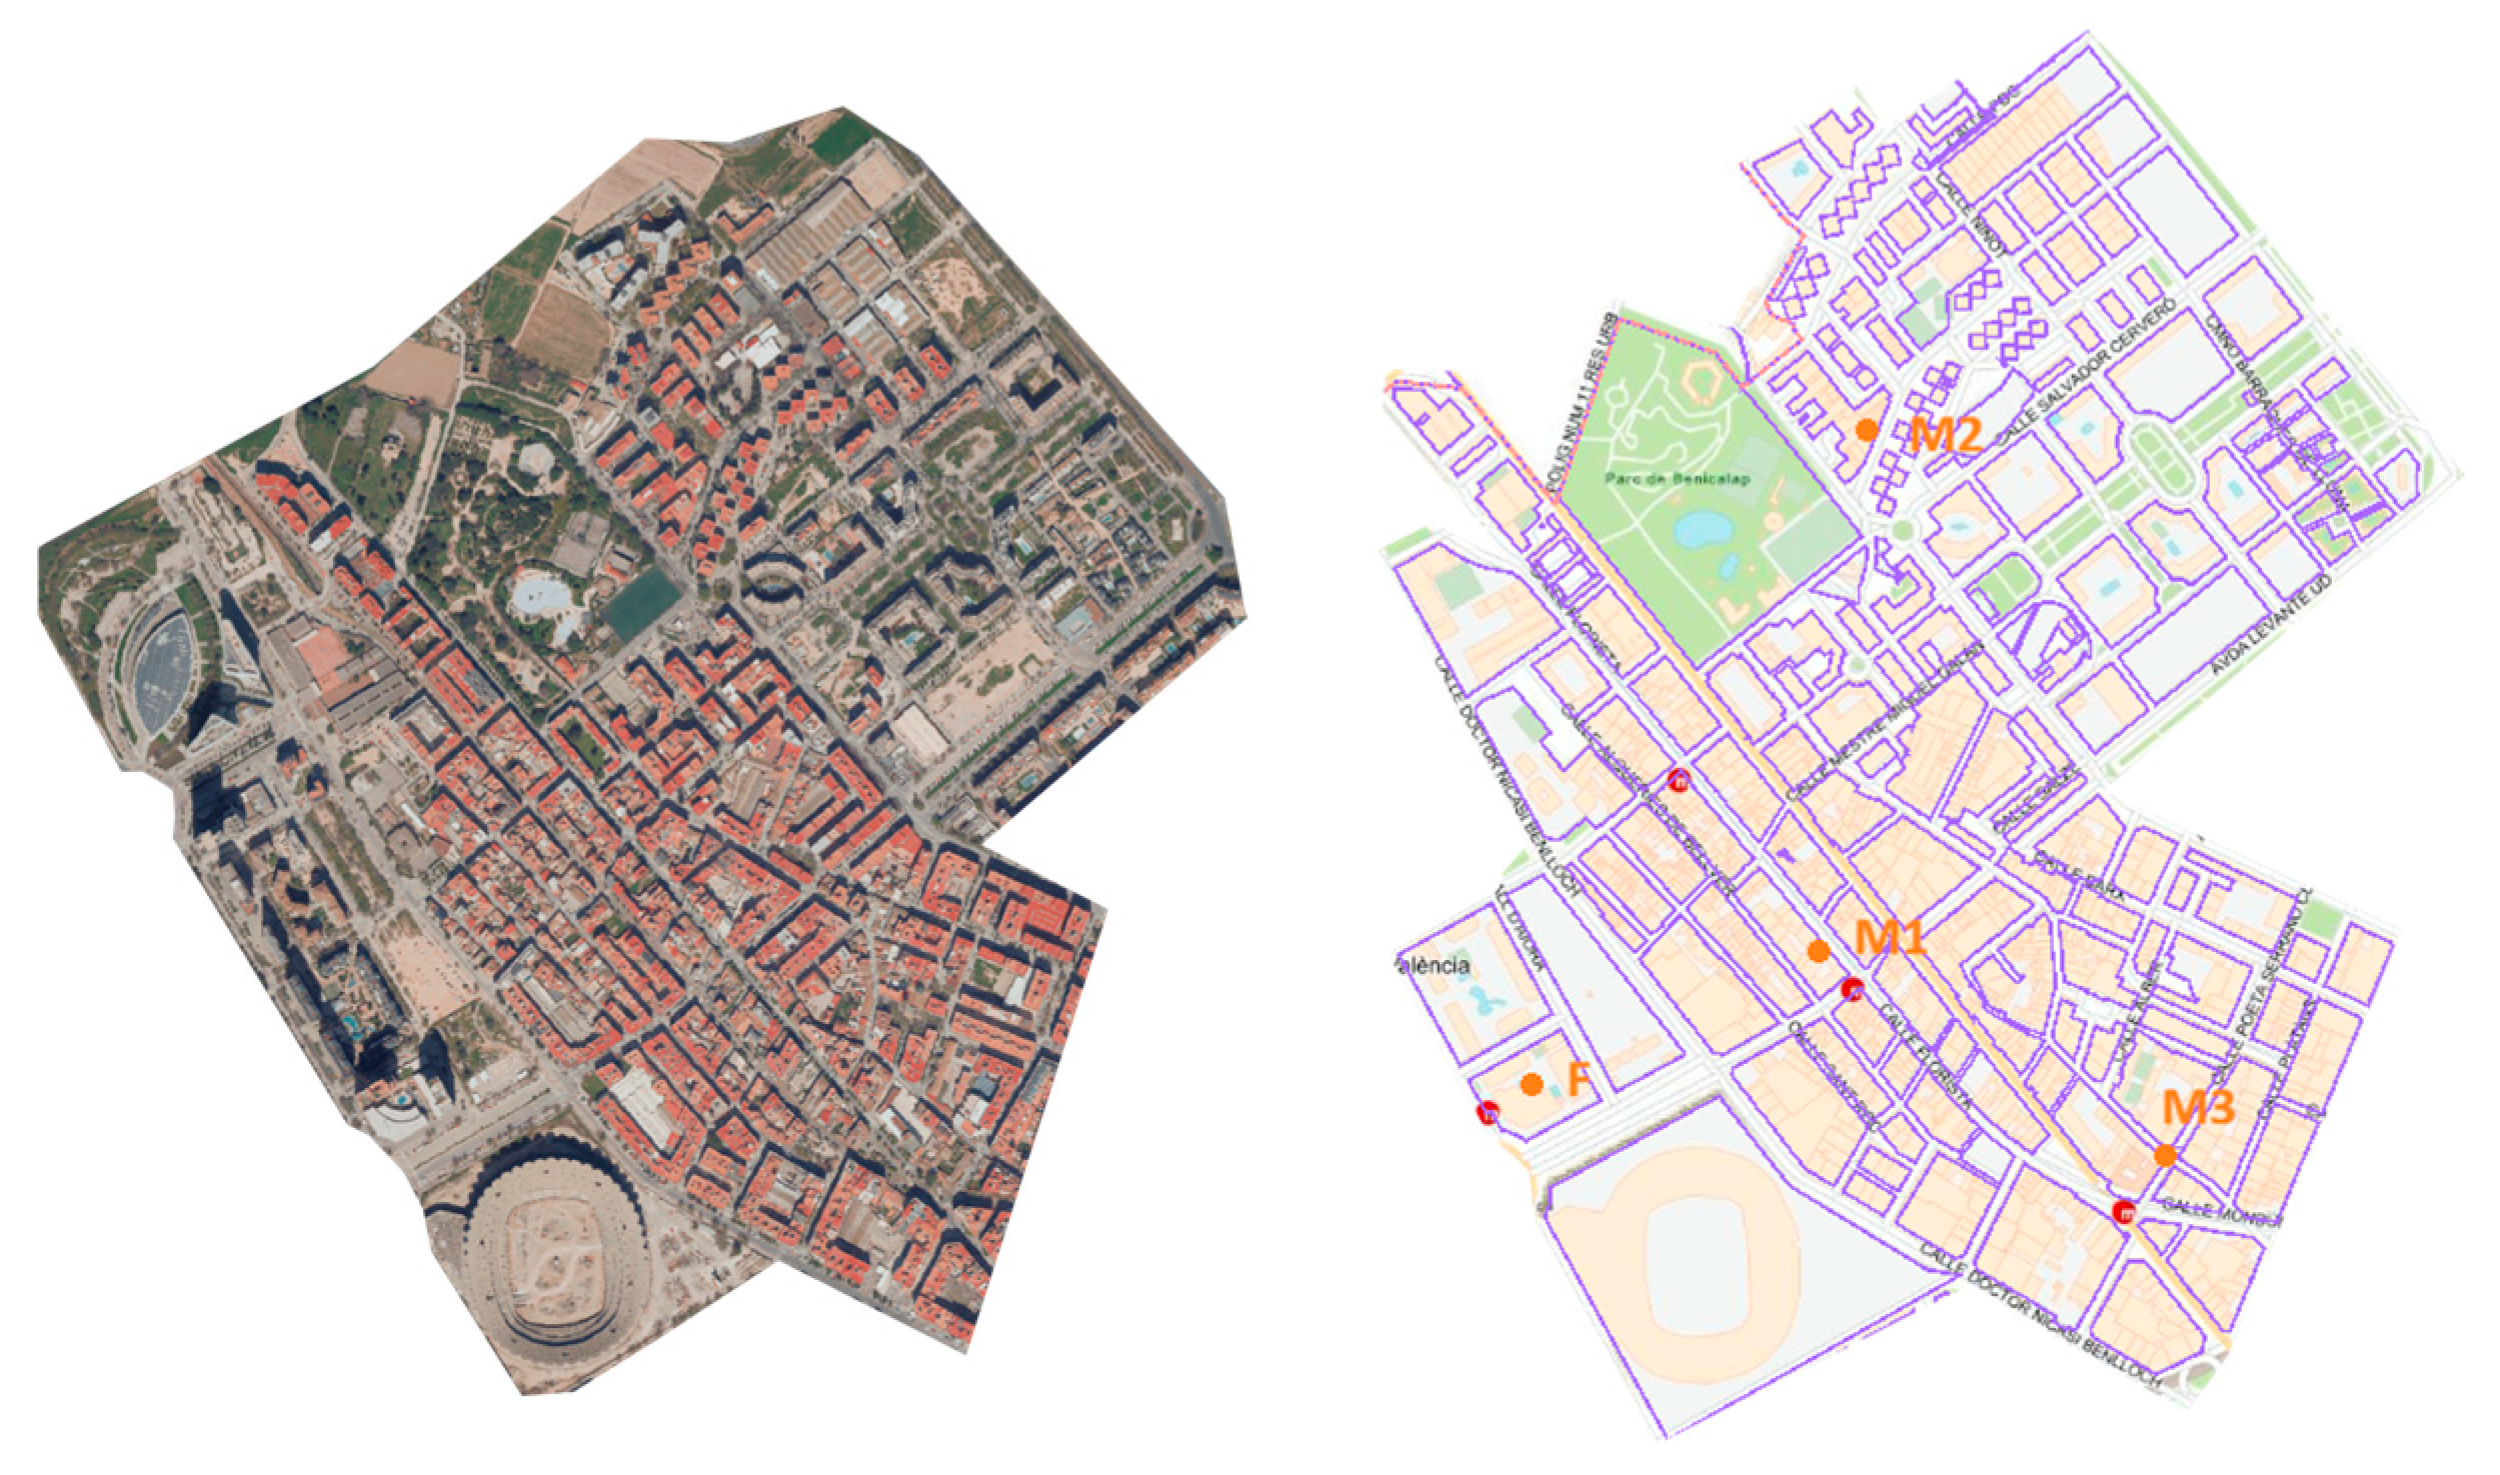
The computational CFD model for the study area presented in Figure 5 was the model domain discretized utilizing a poly-hexacore mesh comprising 78,243,659 cells, generated within ANSYS Fluent CFD 2025.R2 in meshing mode. Using an optimized morphology and using a computer with eight parallelized cores, run times for the selected 24 h period took 15 min (supporting the quick assessment claim once the basic model is set up).
Figure 5.
Benicalap study area and domain. Monitoring stations (in orange) were placed on points F (fixed station) and M1–M3 (mobile stations 1 to 3).
The work area is taken from the complete GIS model described previously, which includes the layers (buildings, streets and green infrastructure), each with their properties for meshing and boundary conditions.
The selection of this mesh resolution was defined following a formal grid-convergence analysis to assess the impact of mesh refinement on the simulation results. Three distinct mesh resolutions were investigated: coarse grid 37,594,117 cells, basic grid 78,243,659 cells, and fine grid 202,586,898 cells. The primary metric for comparison across the three grids was the wind speed ratio (local wind speed normalized by a reference speed) at various strategically selected locations within the area of interest (AOI). These locations included: three mobile weather stations and one reference weather station (see locations in Figure 5). Simulations for the grid-convergence study were executed using a steady-state Reynolds-Averaged Navier–Stokes (RANS) model. The inflow boundary conditions were applied consistently as defined in the input files. Furthermore, the generation of all three grids adhered to the established Best Practice Guidelines (BPG) outlined in [27].
Surface roughness in AE elements was coded in each of the materials for the building and street element domains. No other obstacle was modeled explicitly.
To account for the influence of thermal mass, the urban surface and all buildings were modeled according to their construction type, using shell conduction in Fluent. Internal building temperatures were maintained constant at 21 °C (also for energy consumption modeling obtained through the Digital Twin model).
All other climate boundary conditions (for all surfaces) were fixed to the values at 0:00 h on climate files for 31 July 2025, since on this date the highest average temperatures ever for the city of Valencia were reached (from the detailed hourly city temperature map from [18]). Two of the lateral domain boundaries were set as inlets and the other two as outlets, depending on the wind direction.
For the CFD simulations, 3D Unsteady Reynolds-Averaged Navier–Stokes (URANS) equations were applied, for which the realizable k-ε turbulence model [28] provides closure. Trees were modeled as volumetric porous zones in a spherical shape with a constant value of 3 × 10⁻¹ for the solar radiation transmittance for the tree canopy shade.
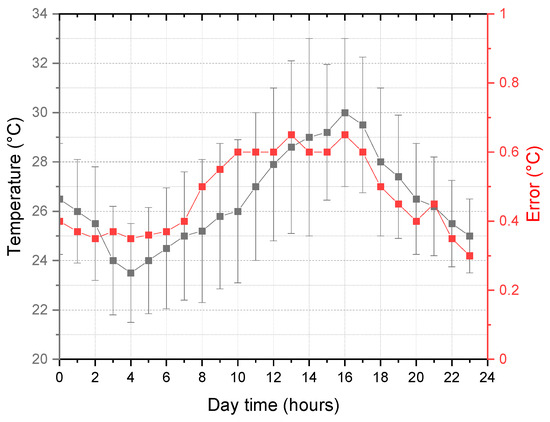
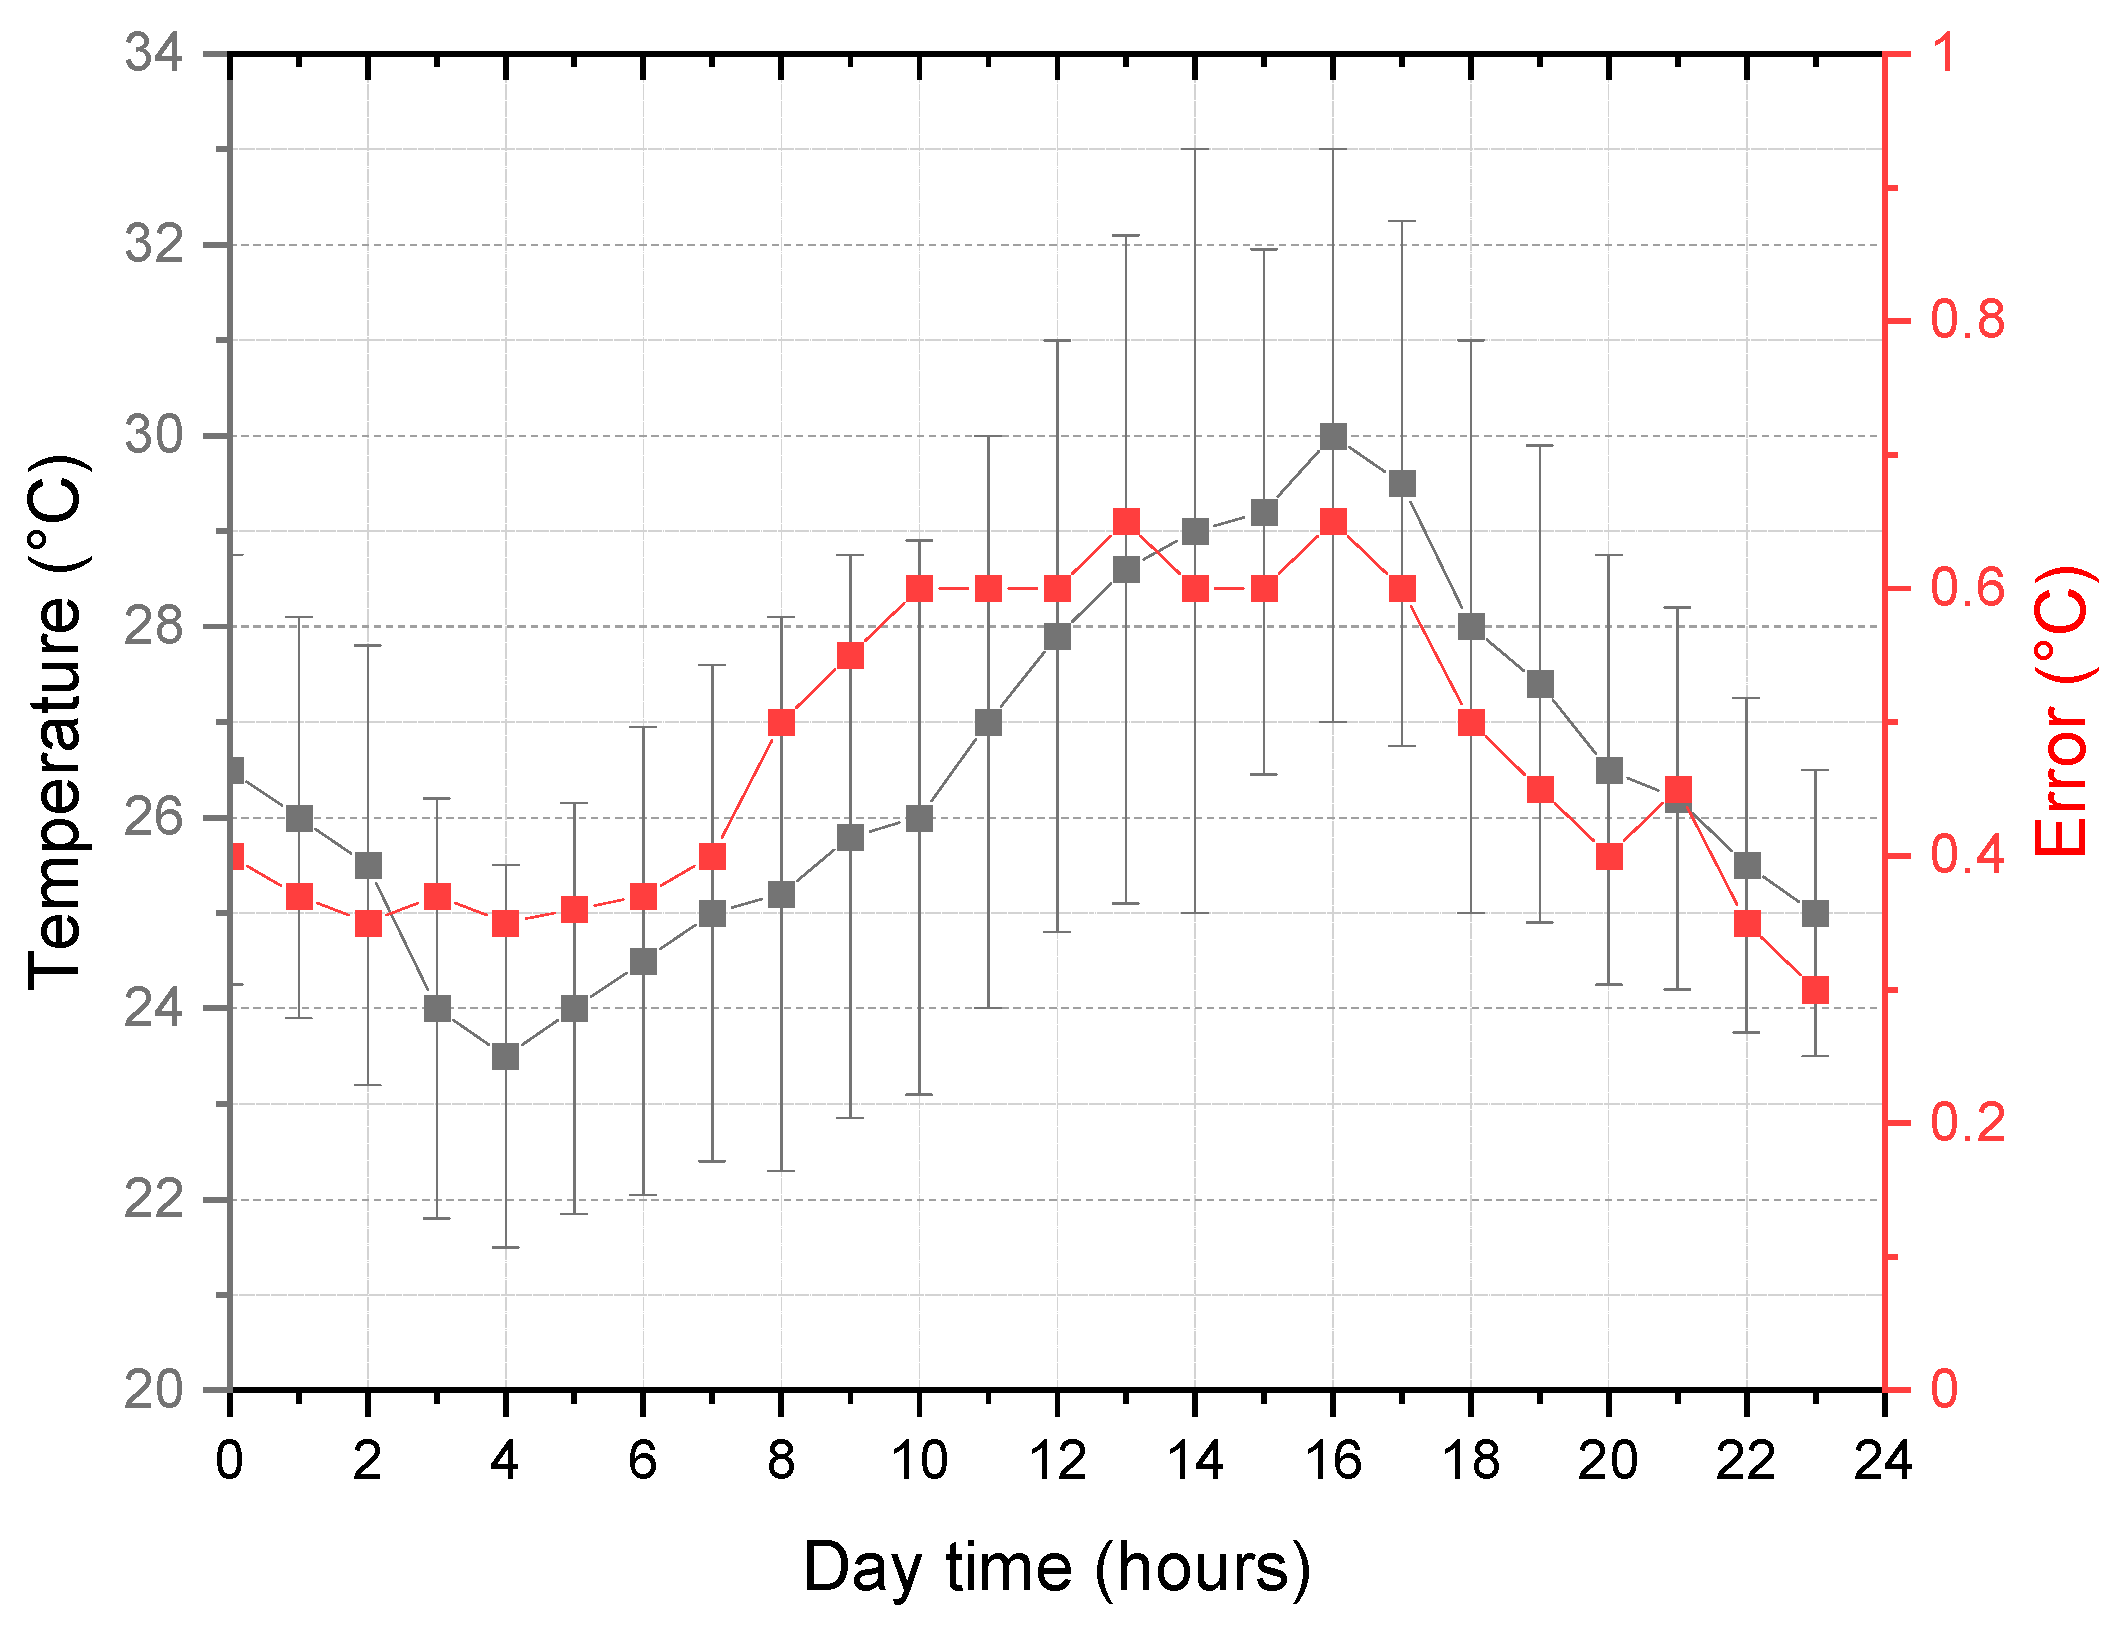
The predicted temperature profile ranges per hour are presented in Figure 6 for the 24 h period with the maximum absolute error per hour in the whole city after the calibration process with the monitoring dataset [24]. The maximum error obtained during the whole day was 0.65 °C (2.2%) for any point on the model. The same calibration process was applied to wind speed, radiation and humidity (also on the Grow-Green dataset [24]) with the following maximum errors: wind speed 0.09 m/sg (for a monitored value of 0.5 m/sg), reflected radiation (albedo) 9 w/m2 (for a monitored value of 180 w/m2) and relative humidity 2.3% (for a monitored value of 24%).
Figure 6.
Hourly temperature simulation ranges in black (simulated average temperature and variation range at city scale per hour) and maximum hourly validation errors in red (absolute difference from all monitored spots).
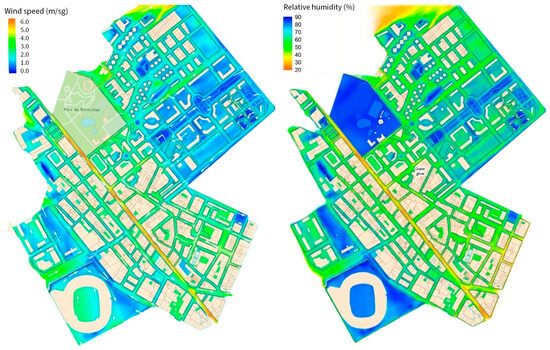
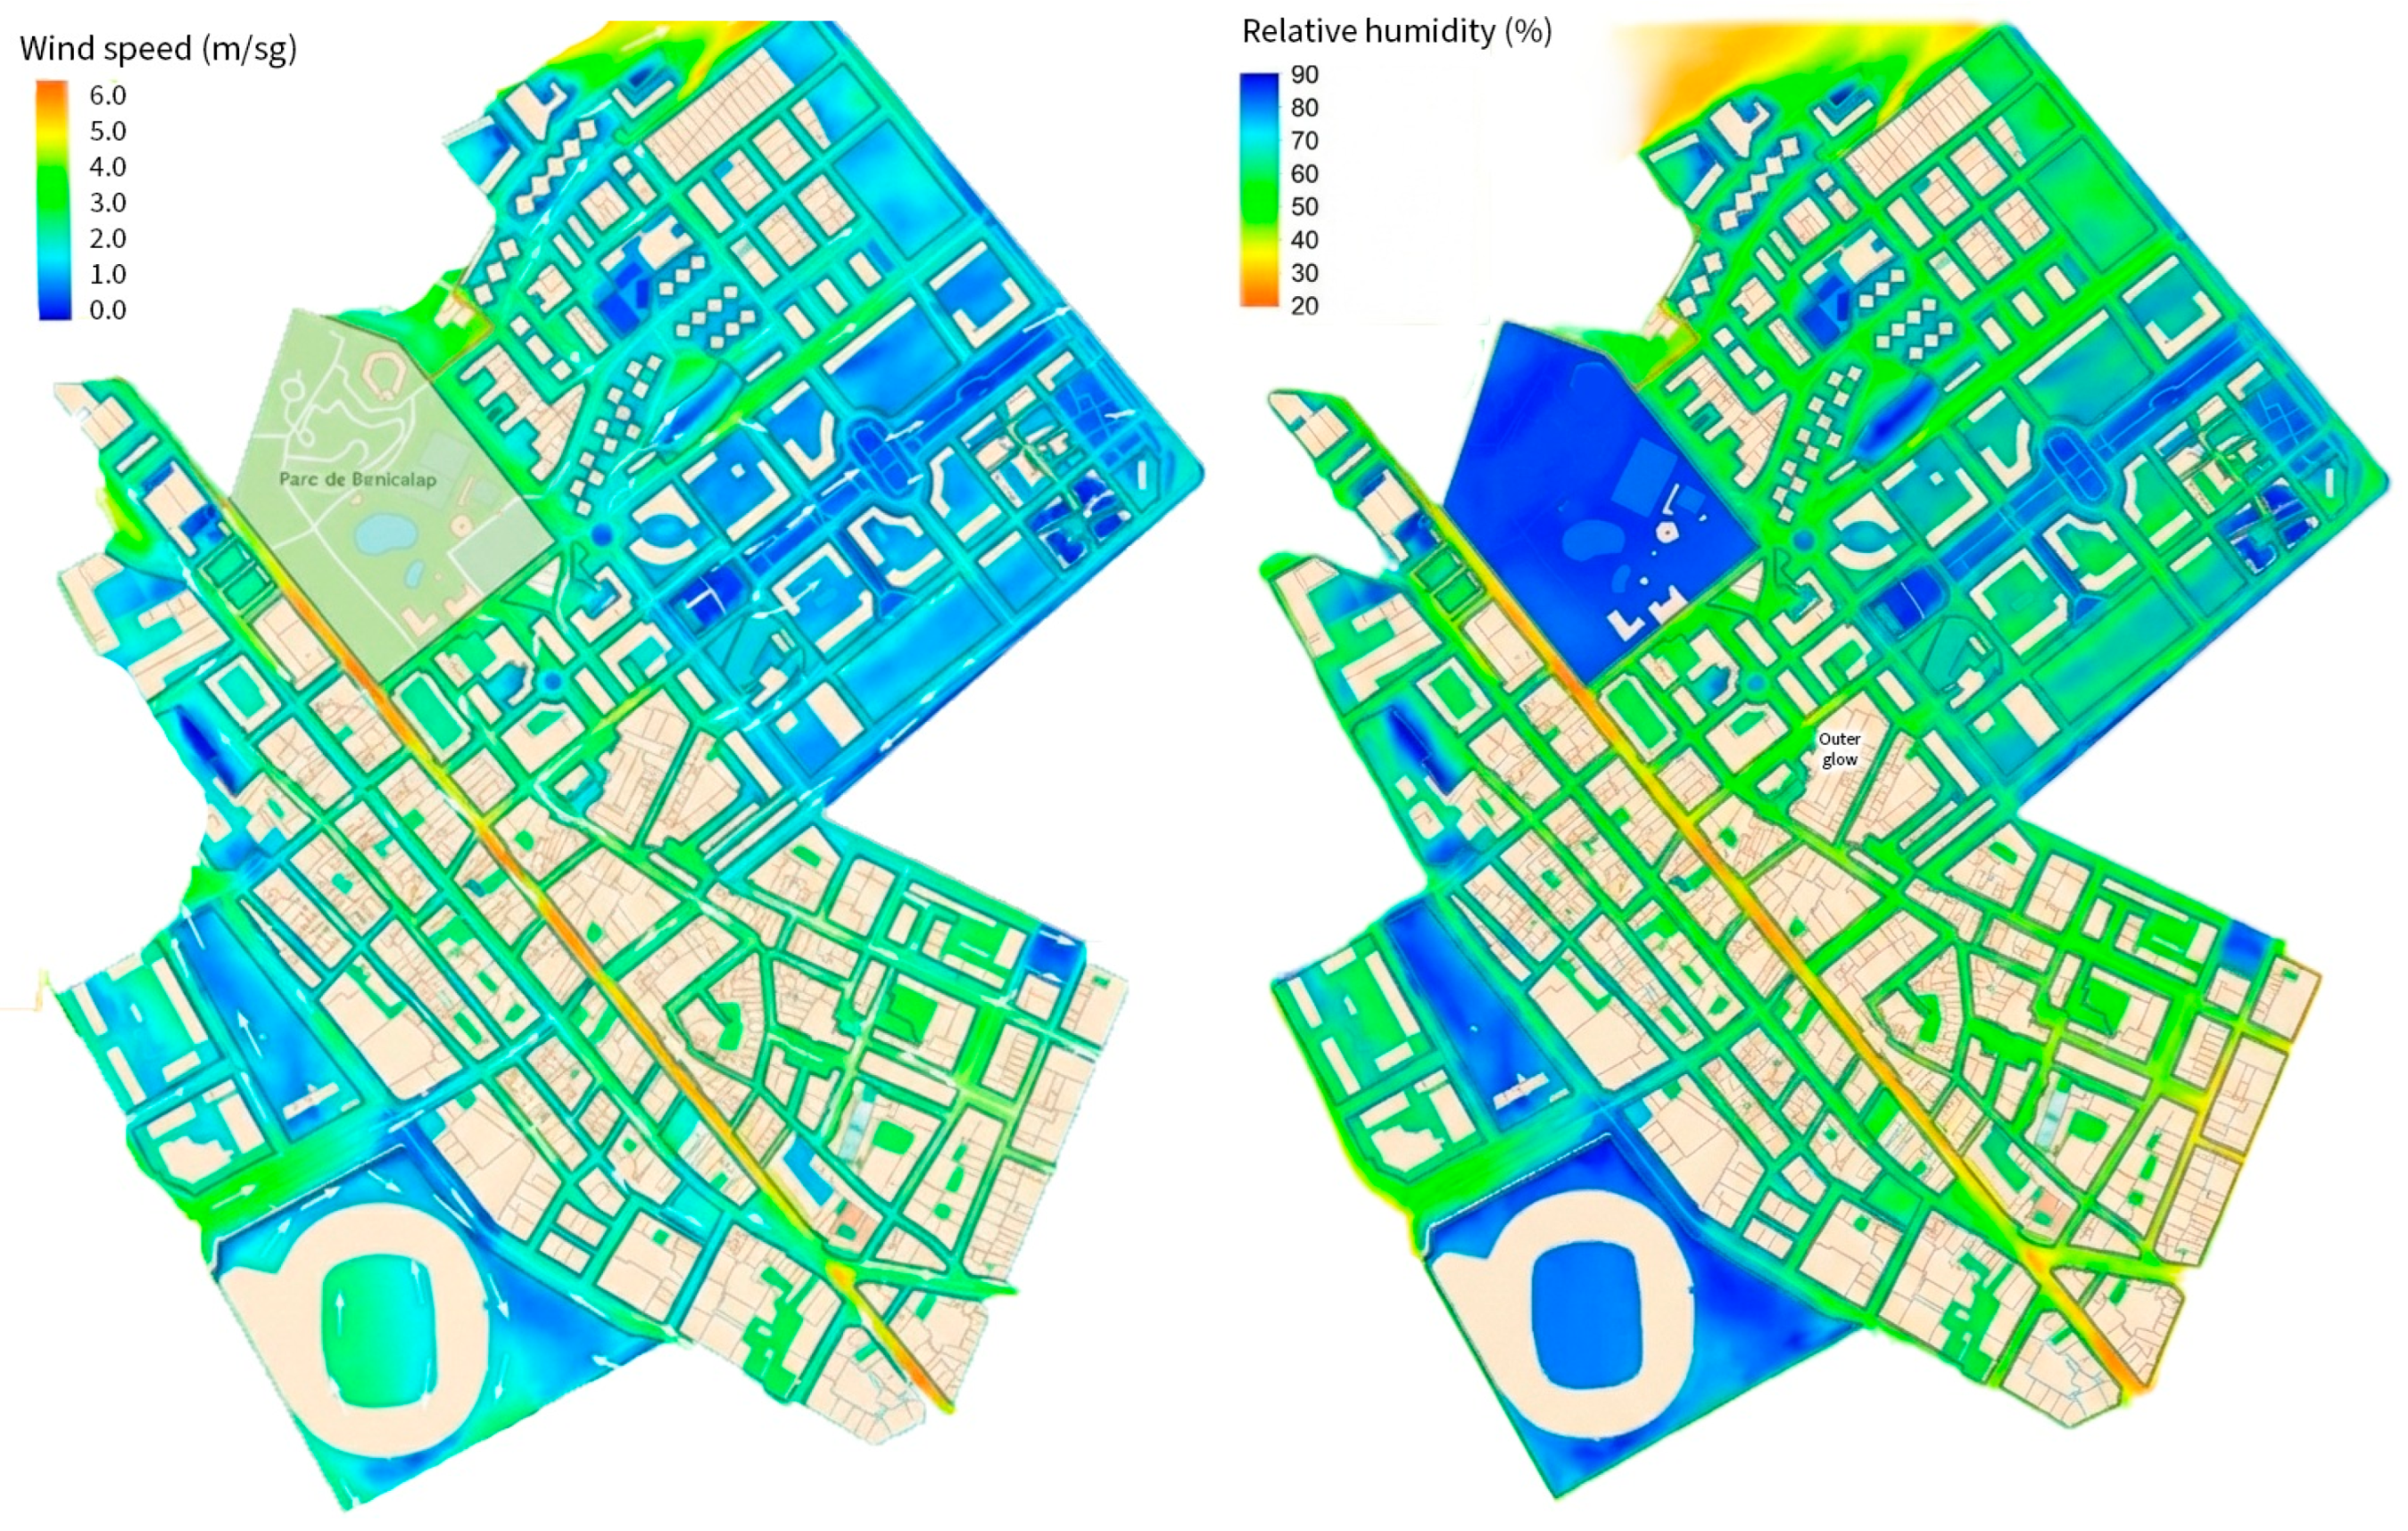
The model results for humidity and wind speed after calibration are presented in Figure 7 for the Benicalap study area at the peak temperature time (16:05).
Figure 7.
Model results after calibration for the study area at the peak temperature hour (16:05) showing: wind speed in meters per second (and direction) at an elevation of 22.5 m above the lowest ground point and relative humidity (%) at an elevation of 2 m above surface level.
This calibrated simulation model now is capable of analyzing from the initial temperature map at midnight between 30 and 31 July the alternative changes in wind, temperature, humidity and radiation interactions between all physical elements (AEs, GI, and building facades) altered on the Benicalap UHI constructing all relevant hypotheses using the same framework model (see Figure 8, and full details for the framework model in Section 3.2. By running the simulation for the whole day of 31 July 2025 again with the alternative greening, building and street AEs, the evolution of critical spots of the Benicalap UHIs can be seen.
Figure 8.
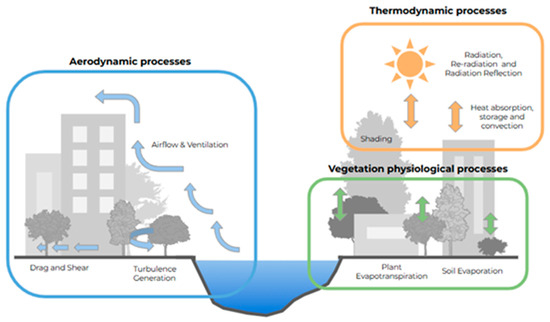
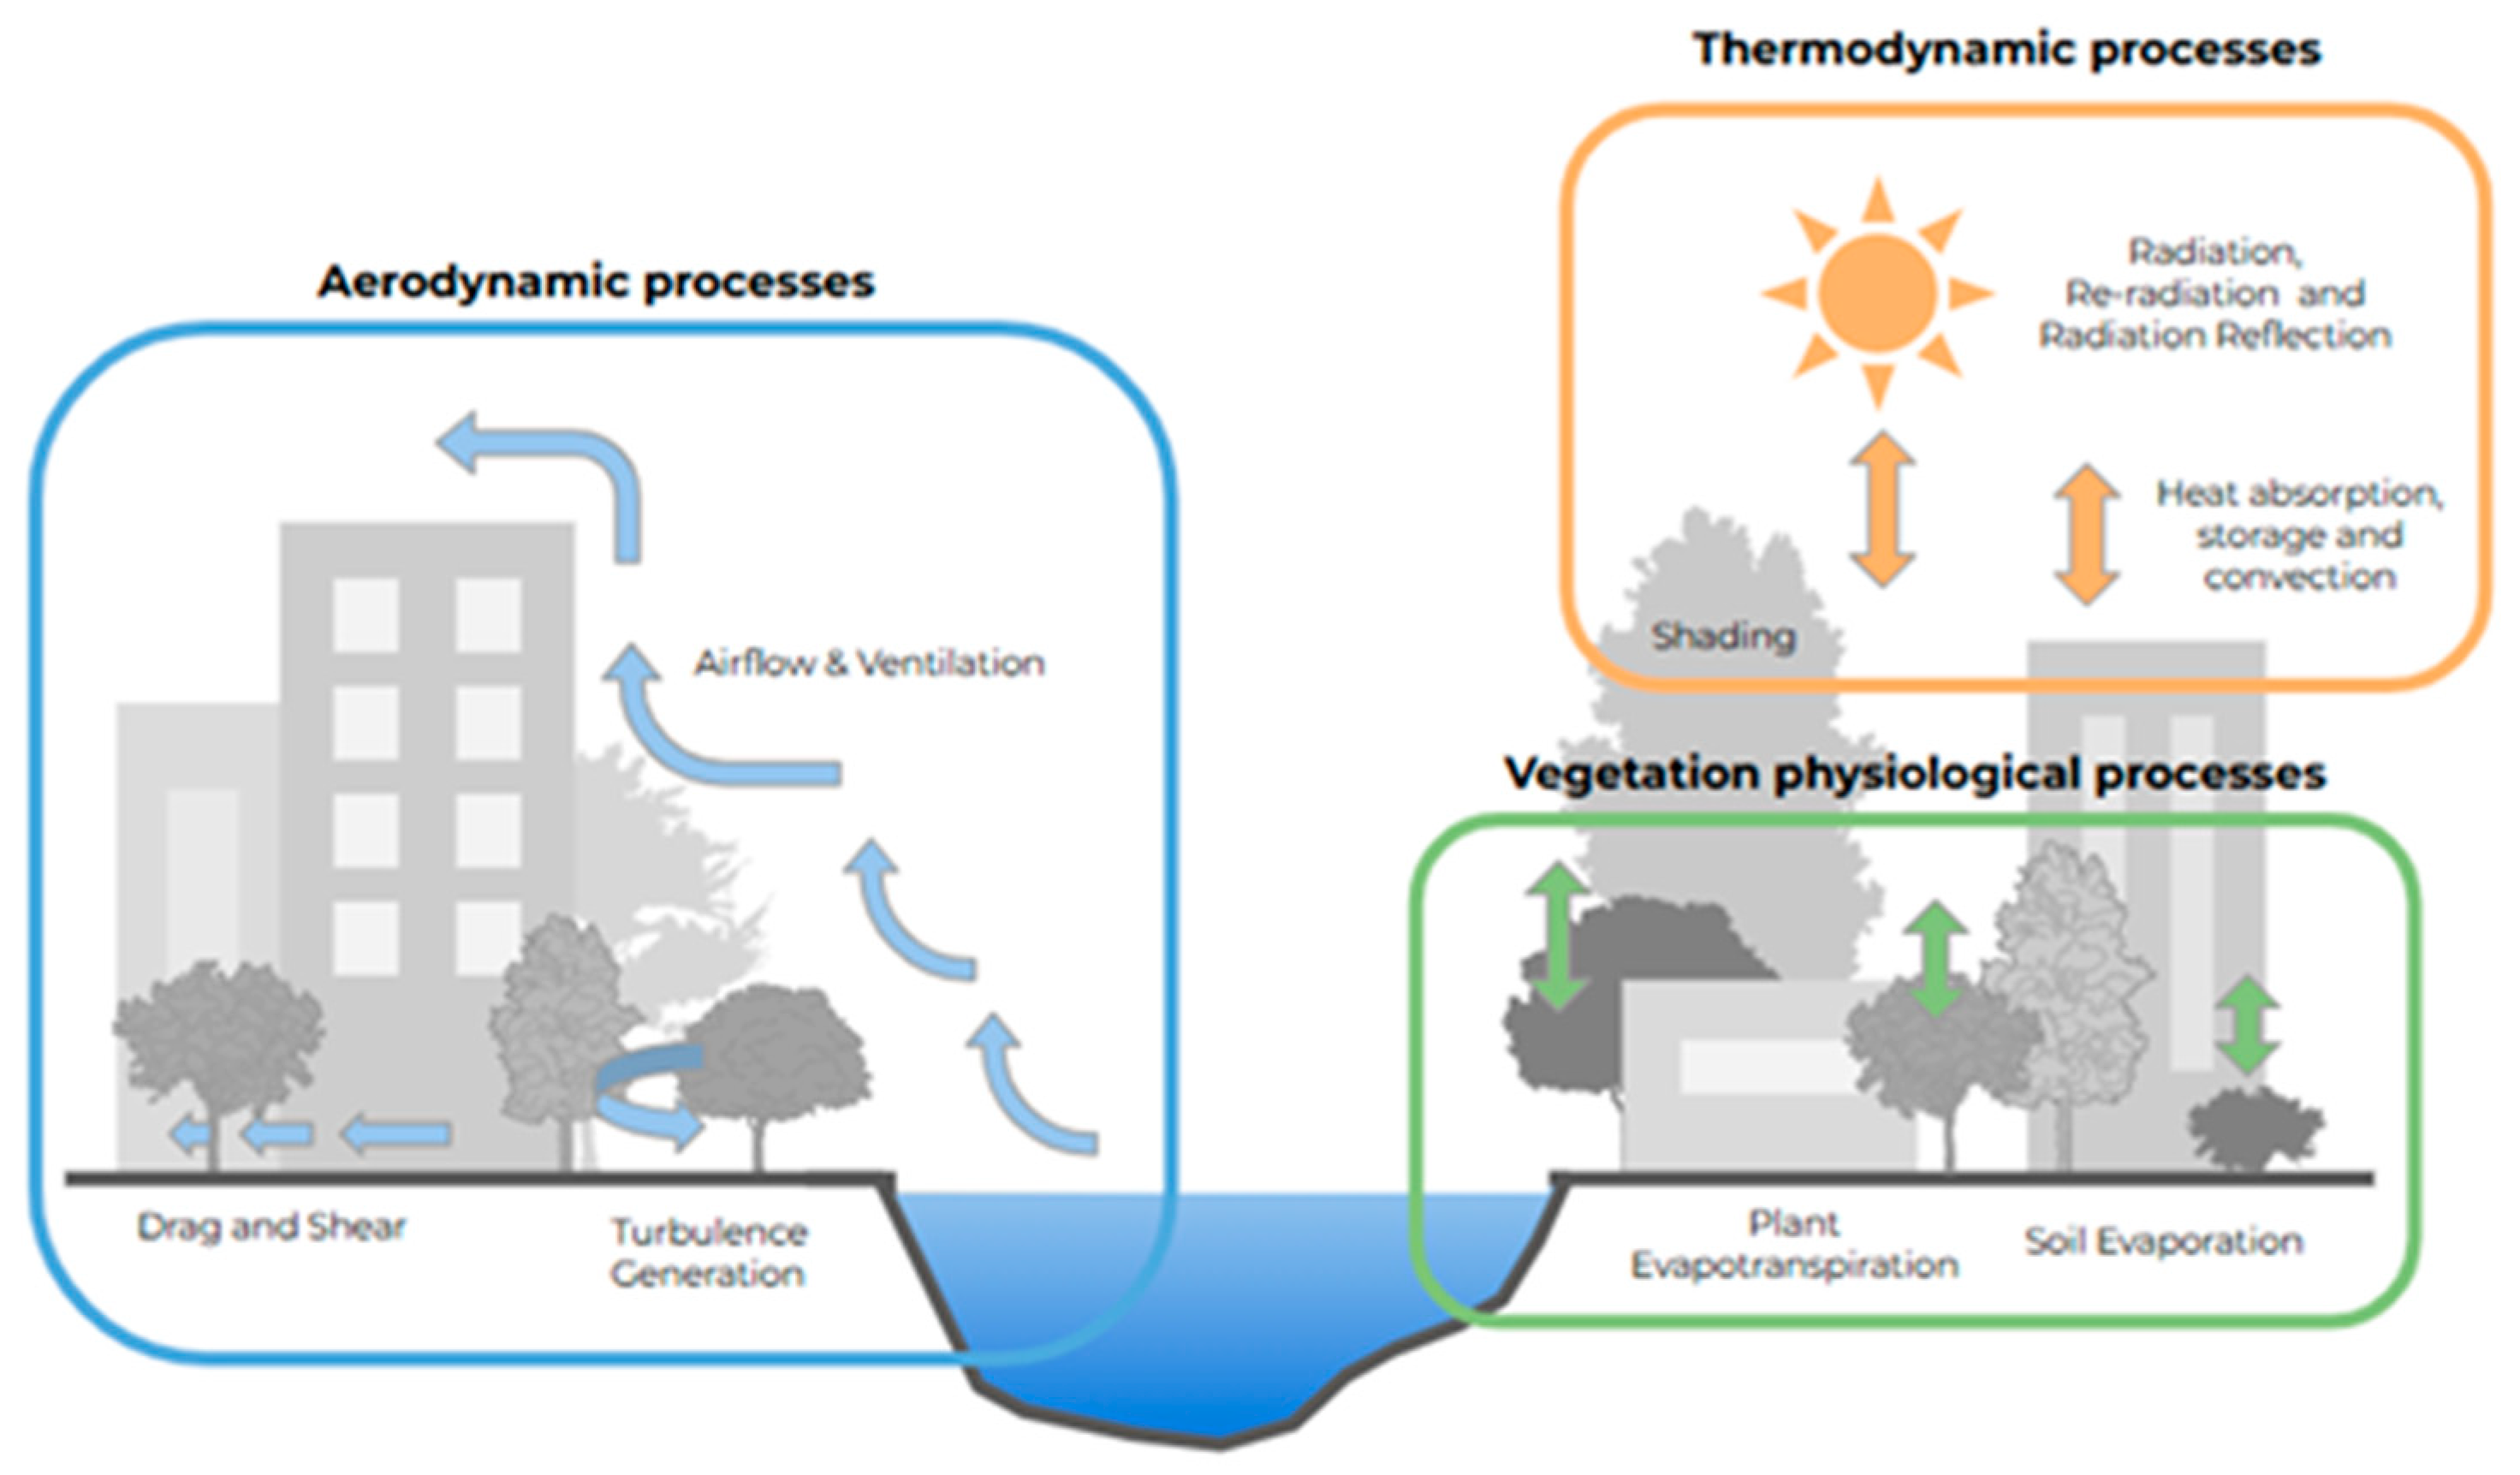
Hydrothermal and wind interactions. Arrows indicate energy (orange) and humidity (green and blue) exchanges in the UHI framework.
In the proposed framework for the ANSYS Fluent model, the integration of microclimate dynamics is not just a feature but a physical necessity. Urban microclimates are defined by circular feedback loops: the wind affects how a tree cools the air, and that cooling air changes the wind’s density and speed. Evaluating these three domains (aerodynamic, thermodynamic, and vegetation) jointly allows the model to capture “two-way coupling,” where each process informs the other in real time. Heat and mass transport (as shaped by urban geometry and surface roughness) describe the absorption, storage, and emission of heat across built and natural materials, controlling radiative and conductive fluxes. Vegetation-related processes regulate latent heat exchange through transpiration and evaporation, modulating humidity and surface temperature. The present modeling framework explicitly resolves aerodynamic and thermodynamic exchanges within a Large Eddy Simulation (LES) environment, while representing vegetation effects via porous-medium parameterizations for drag, shading, and radiative balance. Latent heat and biophysical water–energy feedback are not explicitly simulated, focusing the analysis on dominant physical drivers of microclimate variability that can be consistently represented across spatial scales.
3.2. Benicalap UHI Framework Model
The whole Benicalap UHI model includes the GIS file with all layers described in point 2.3 (buildings, streets with AE, and green infrastructure), together with the high-fidelity microclimate simulation model validated in the previous section. In order to analyze different scenarios and comparatively assess their impact, the following scenarios were considered for analysis:
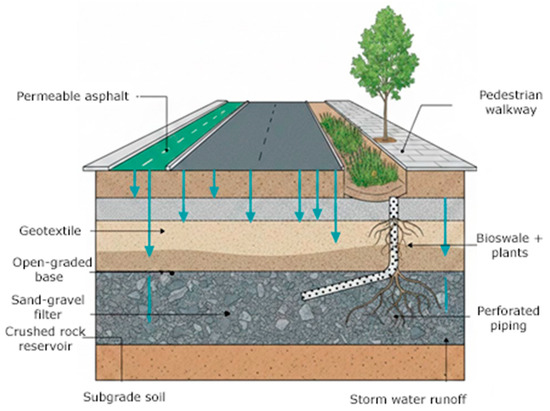
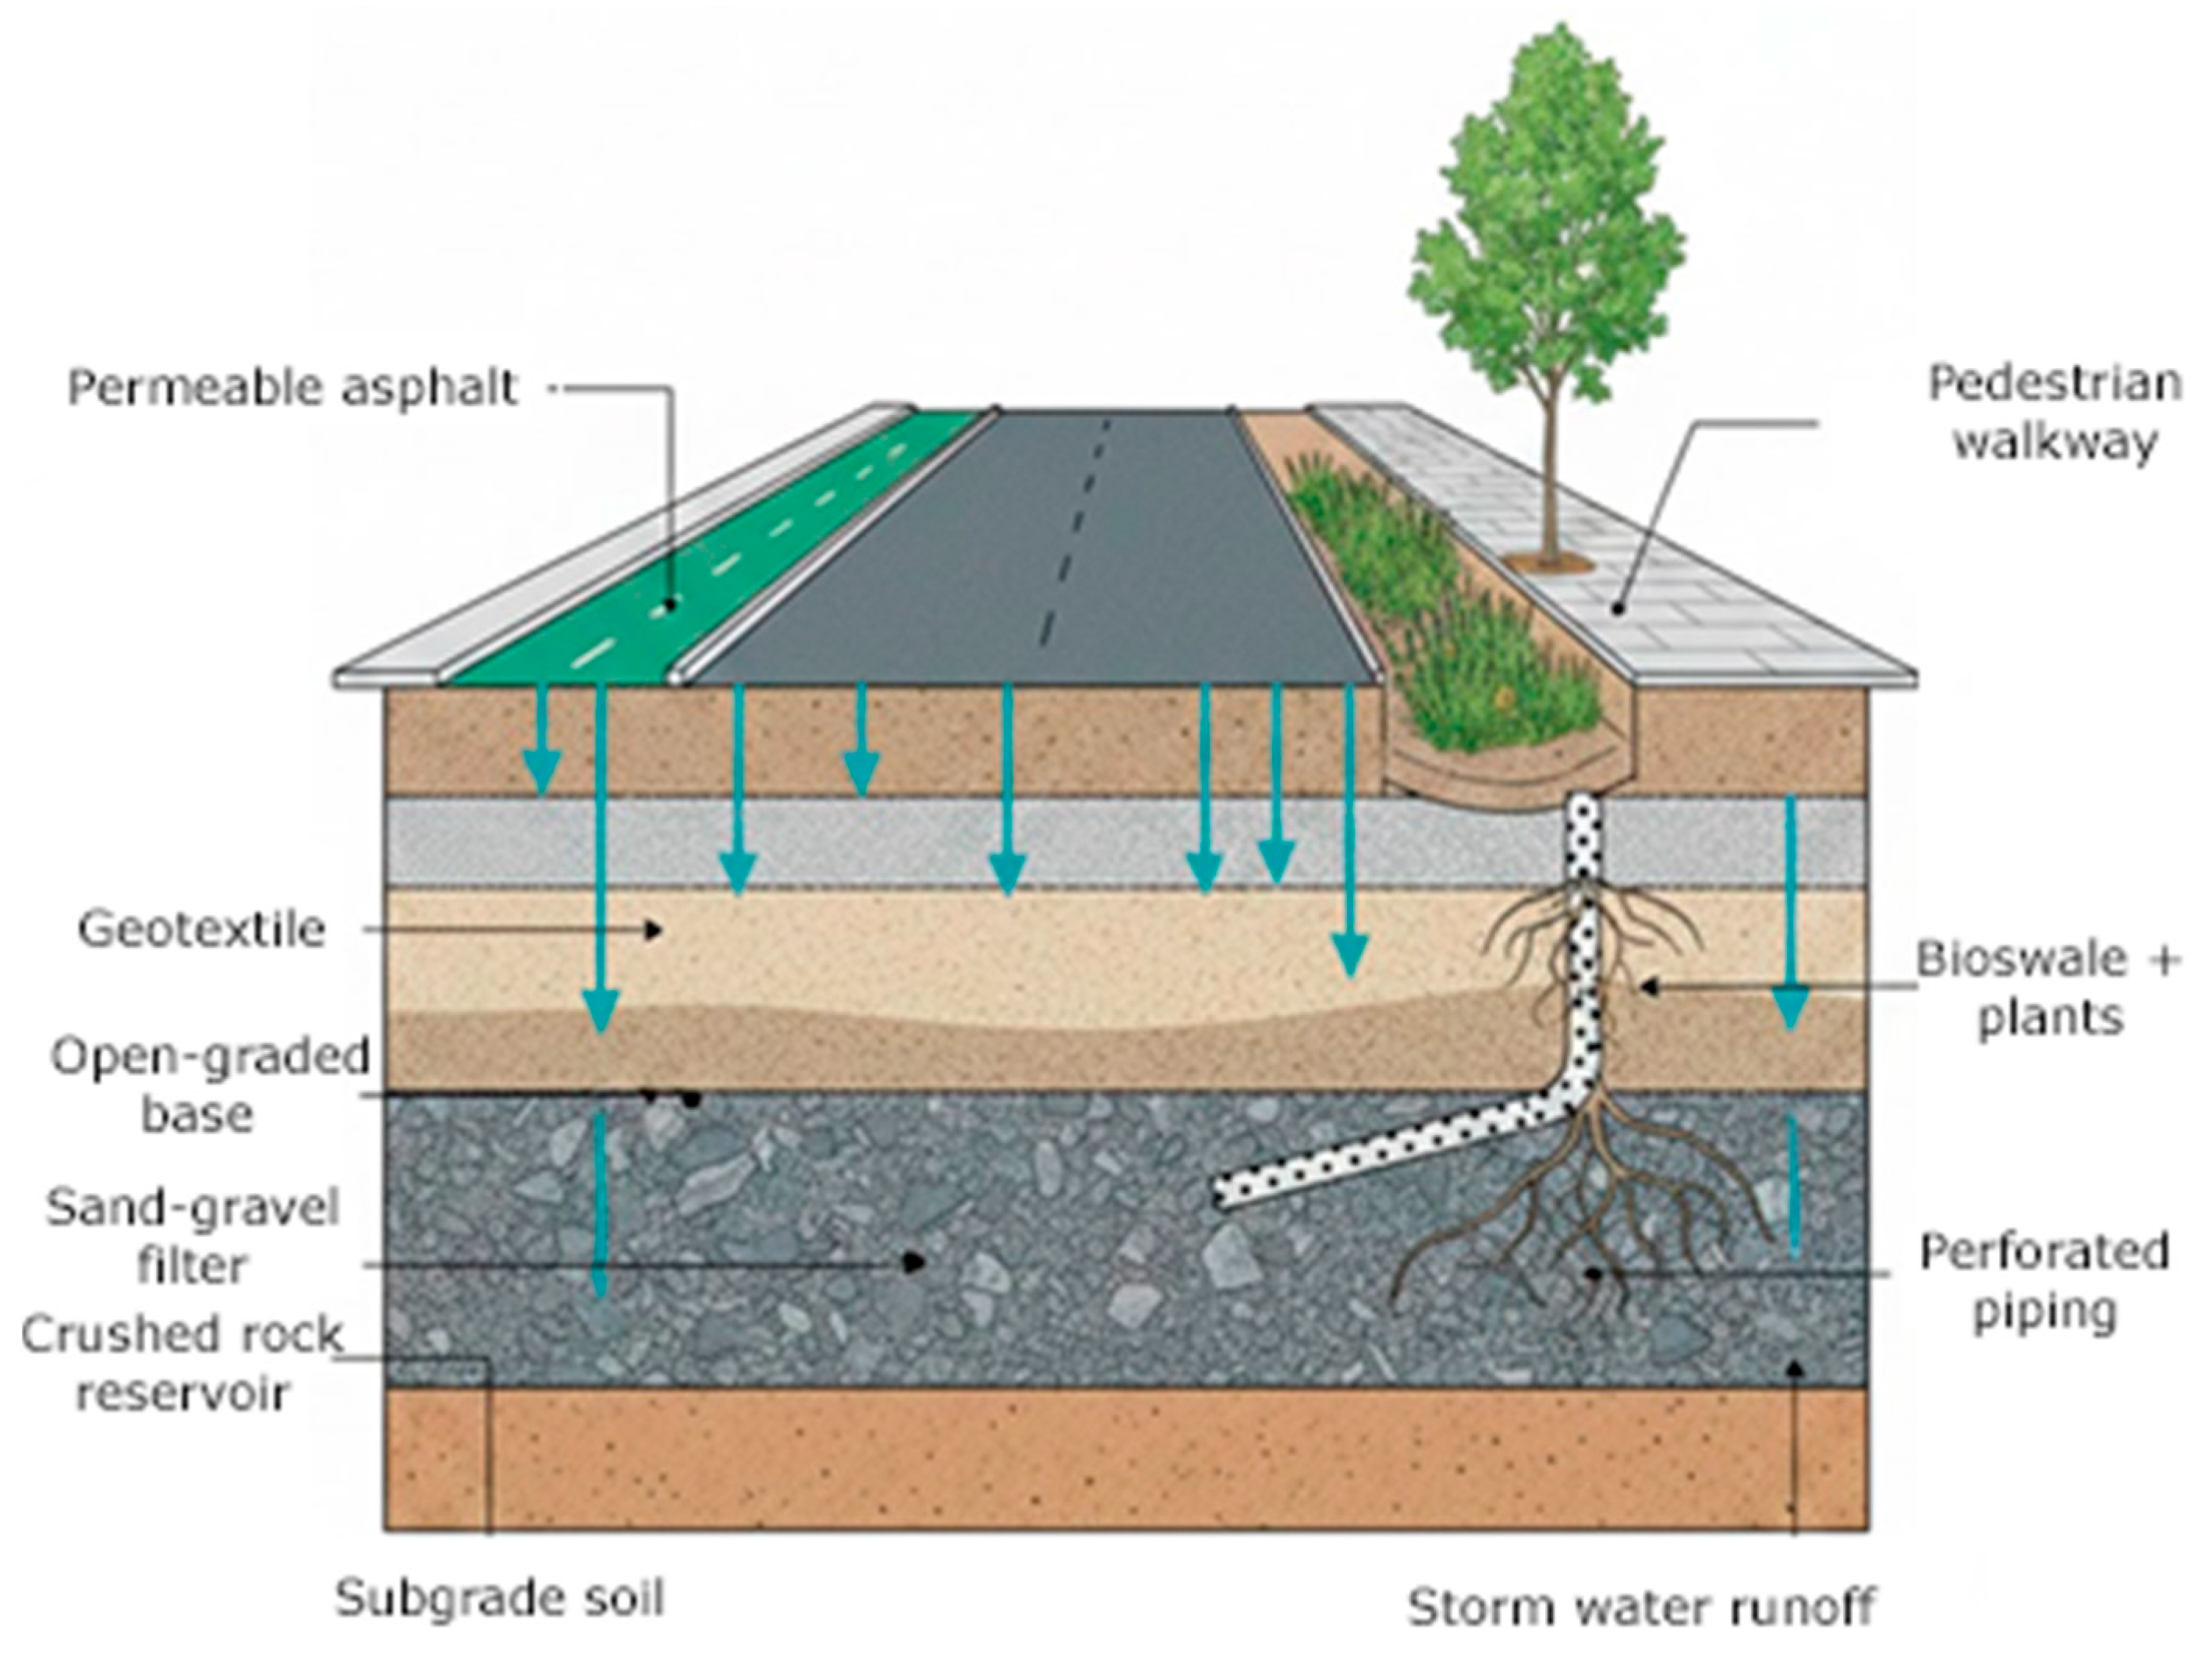
- Connection of isolated green areas (specific AE sections with vegetation): New street sections with trees were simulated at the street level following the design proposed in the Horizon Grow-Green project [29] and presented in Figure 9 as one of the new AEs created for the Benicalap UHI framework model.
- Substitution of traditional roofs with “green roofs” (specific GI modules) within UHI areas.
- Substitution of pavement materials on existing UHIs for Benicalap. A materials database under Ansys Granta Selector [30] with all the relevant properties from the energy storage, porosity, wear-resistance and albedo properties is coupled to the AE design [26] for optimal performance from the esthetic and performance points of view. The file with the records for the materials database has been published in the Grow-Green dataset [24].
- Providing a draining capacity of pavement for all streets with trees connected to the AE components [26].
- Detailed parametrization of the albedo factor for all facades and street surfaces (basic info from the materials in the Ansys CFD radiation model including the details for all surfaces exposed to radiation [24]).
- Street modeling includes the details from [18] for the geolocalized vegetation species for the UCM. This allows a realistic evaluation of the green infrastructure impact of evaporation through the Discrete Phase Model on Ansys CFD.
Figure 9.
Section for the new AE connecting existing green areas in Benicalap (blue arrows indicate rain water migration).
3.3. Benicalap UHI Impact Assessment Results
All the isolated green areas in Figure 5 were interconnected for the GI scenario by gall oak trees (very well adapted to the Valencia climate and with endurance to drought periods) separated by 10 m and placed on the street layout presented in Figure 9 (see [29] for full detail). The selected paving material was cream Buixcarró marble (a local porous natural stone with medium albedo and reduced heat capacity). The same material was used for the street pavement in the AE simulation.
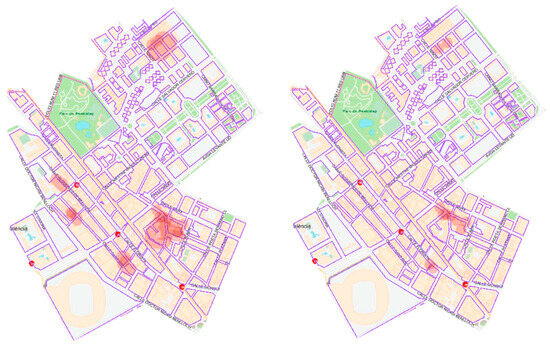
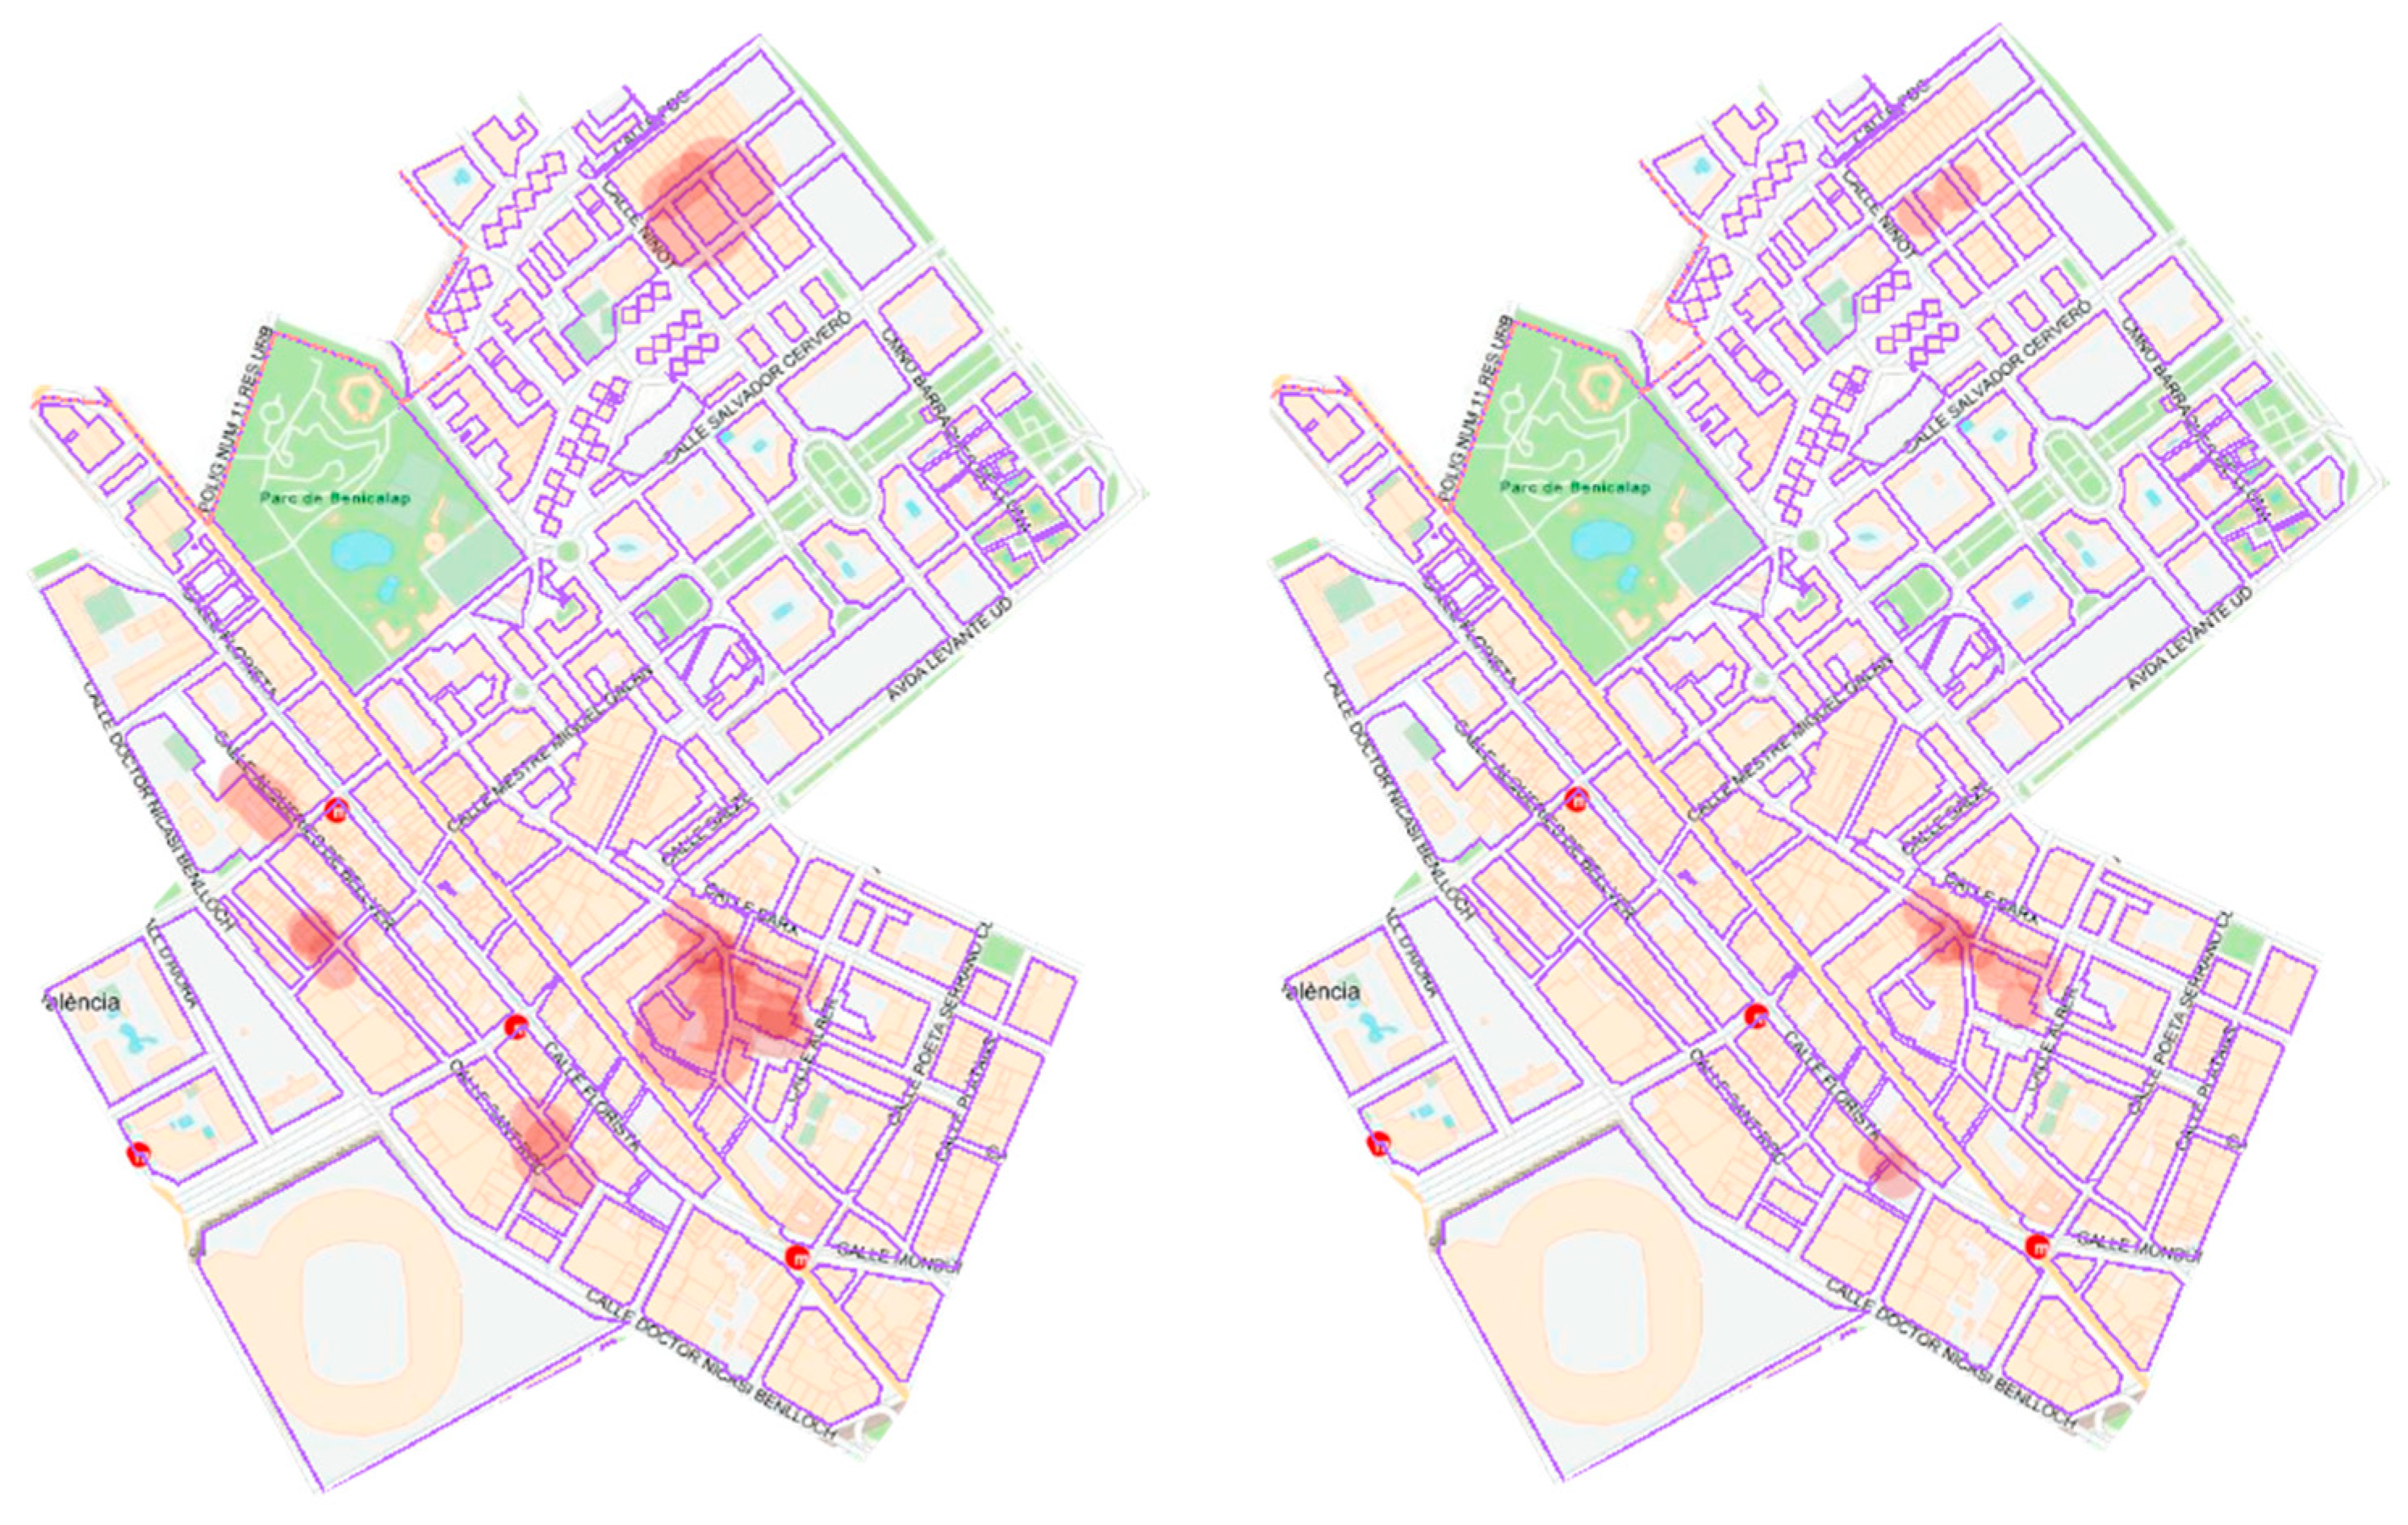
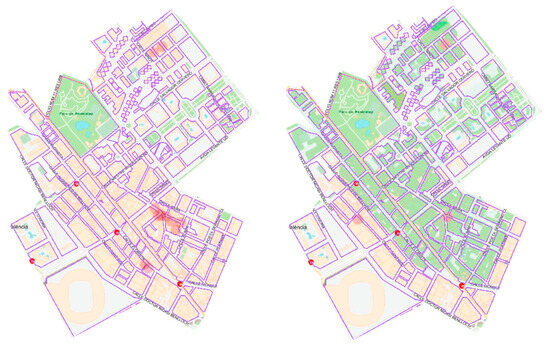
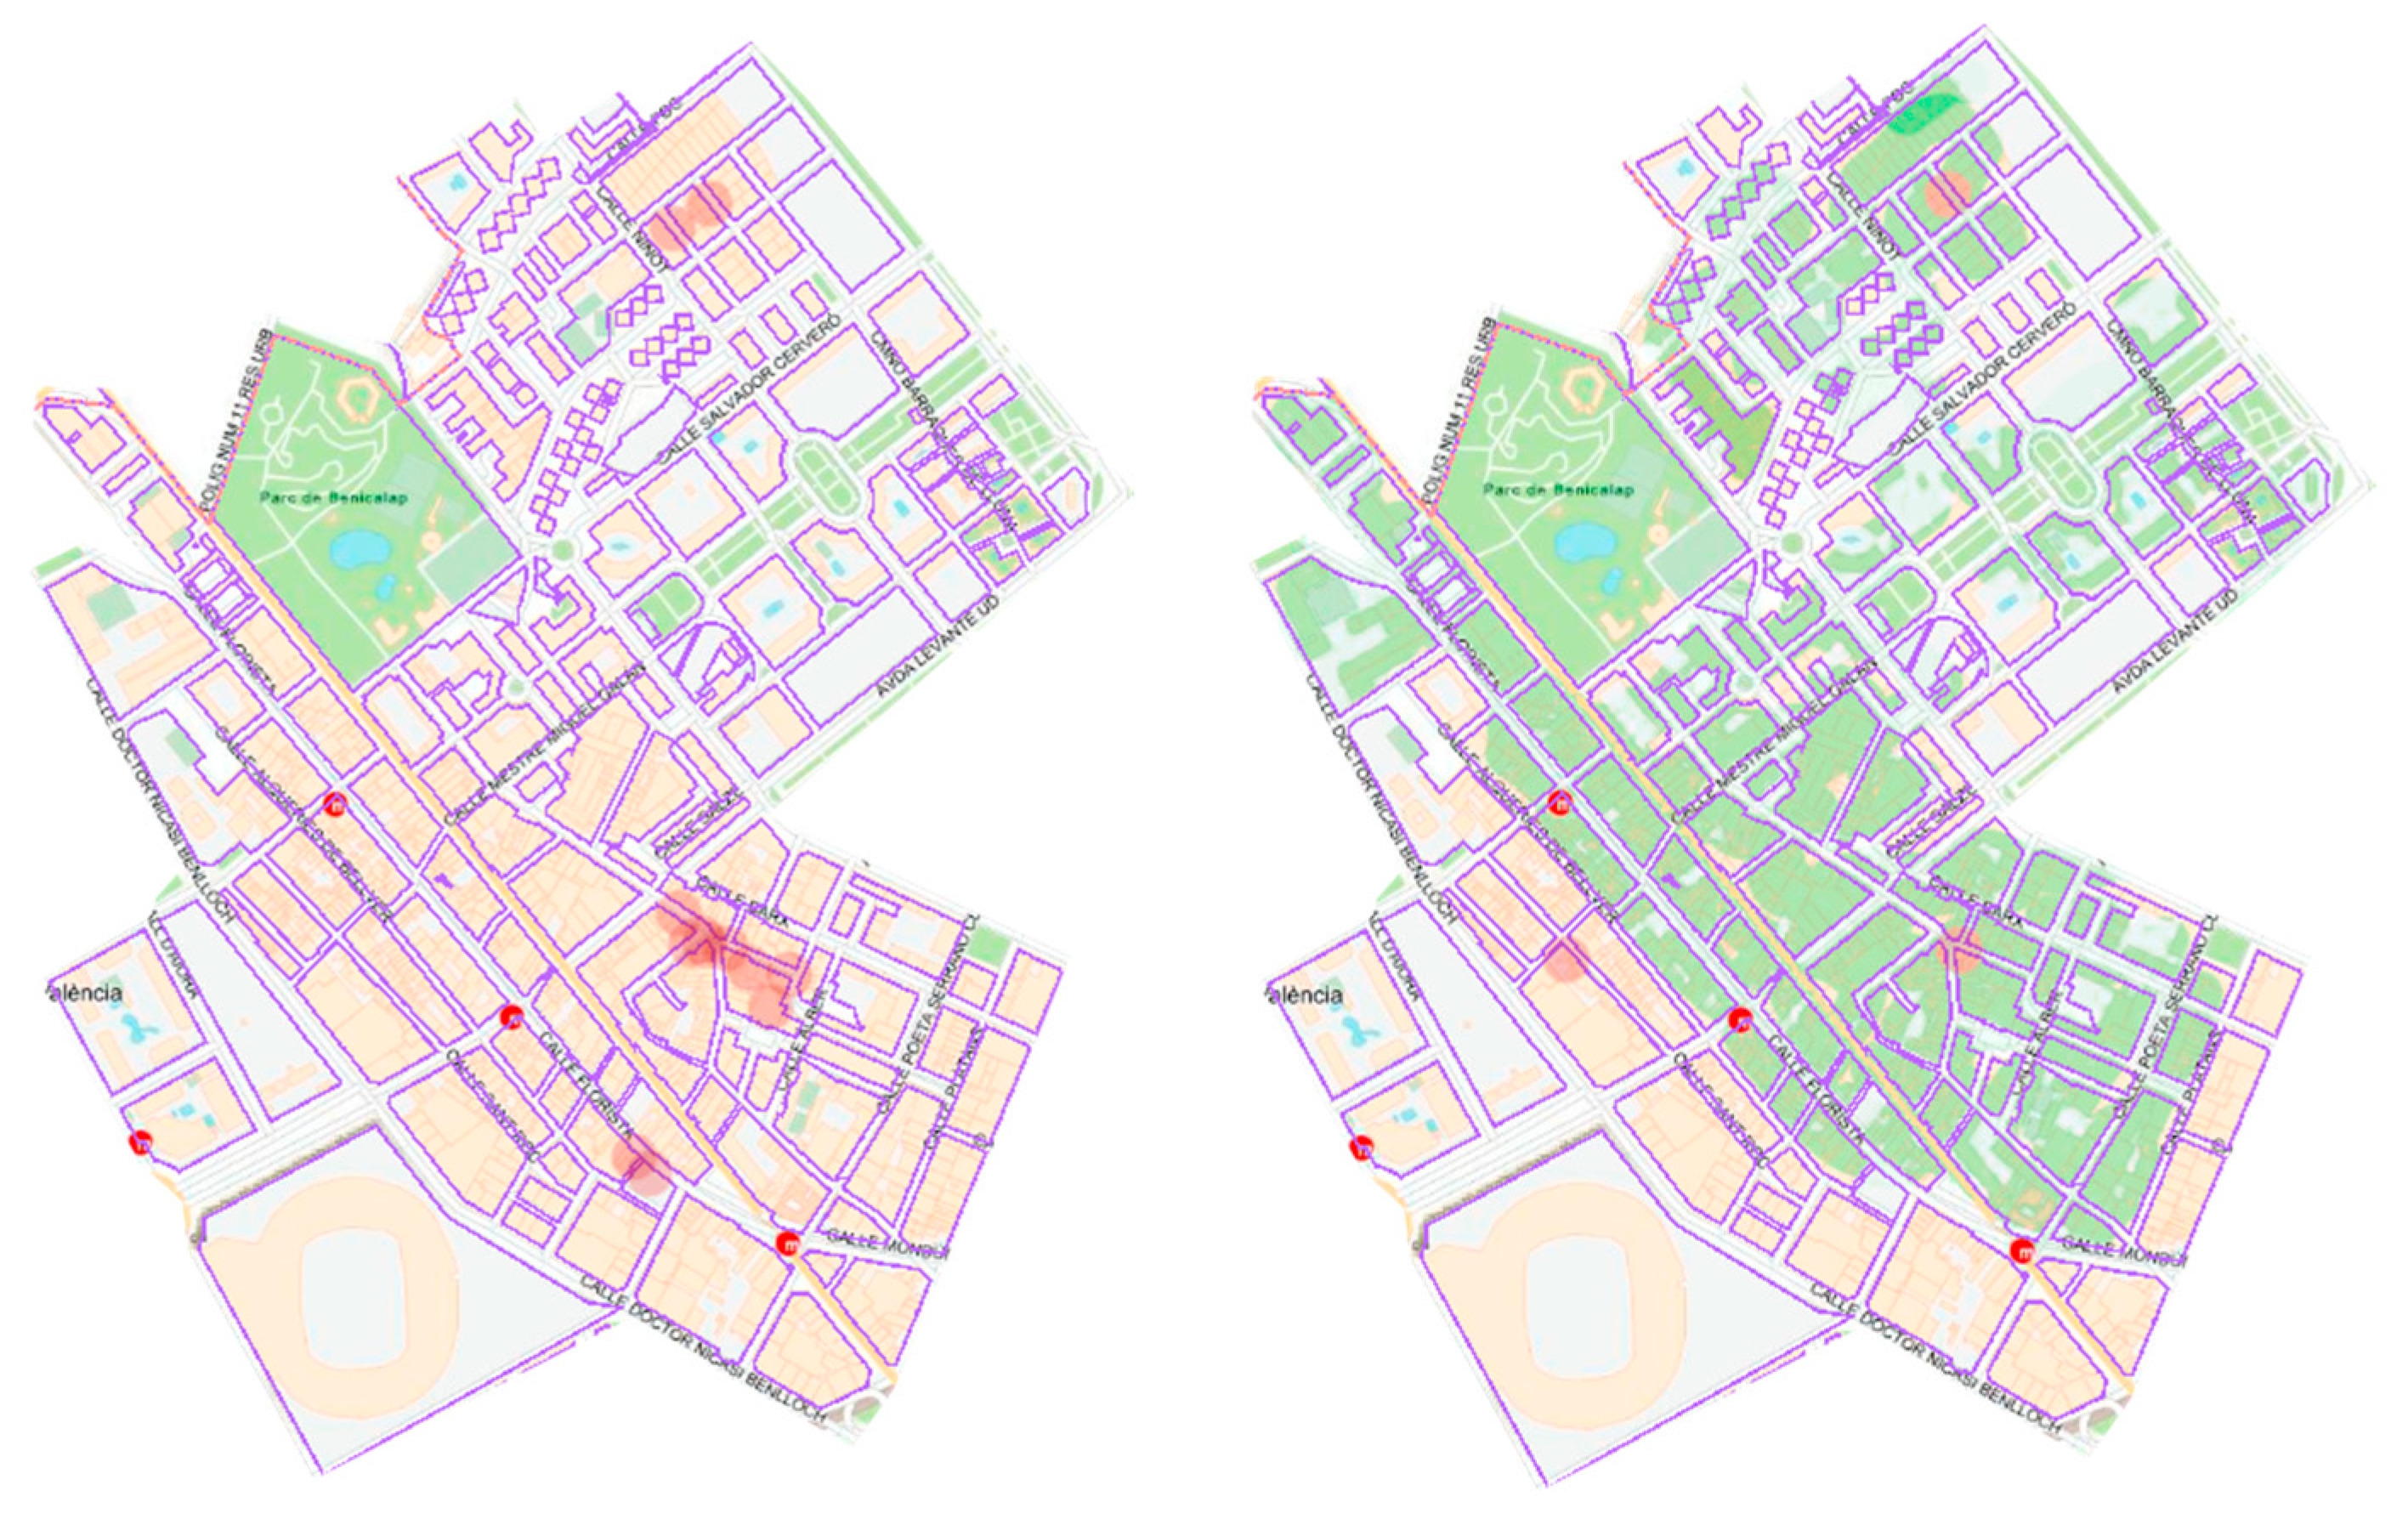
Heat concentration spots are presented in Figure 10 (before and after GI optimization) and Figure 11 (before and after GI + AE optimization). The numerical analysis of affected buildings in the area (and corresponding occupation) demonstrated that the initial 15.6% of buildings in the neighborhood affected by UHIs (affecting 23.4% of the population) can be reduced to 6.5% of the residential buildings with the GI scenario (9.1% of the population) and to 3.7% of residential buildings (4.6% of the population) after the GI + AE scenario.
Figure 10.
AE scenario. Total UHI area (identified by red cloud spots on the neighbourhood area) before and after AE optimization.
Figure 11.
UHIs (identified by red cloud spots on the neighbourhood area) after AE scenario and after AE + GI optimization.
In summer 2025, the city suffered 98 days with extreme heat (12 in 2024). As part of the simulation, an analysis of better facade insulation (defined by the facade materials for each building) reduces individual consumption of energy. Energy savings (corresponding to refurbished facade insulation at the neighborhood level) lead to an accumulated figure of 21% for the simulated day.
These findings are also supported by [31] on the fight for zero UHIs.
4. Discussion
UHIs are increasingly introducing extreme temperatures within cities. The core principle is the increase in the Solar Reflectance Index (SRI) of urban surfaces and the increased heat capacity of dense materials. Standard asphalt and dark concrete have a low albedo (typically 0.05 to 0.20), absorbing a significant fraction of incident shortwave radiation and re-emitting it as longwave thermal radiation. Switching to porous materials with a high albedo directly reduces the amount of absorbed solar energy. Porosity also allows for evaporative cooling to occur, especially following a rain event or through subsurface irrigation. GI is a synergetic component inducing convection air currents that avoid heat concentrations. Interconnecting isolated green patches in a network of green corridors facilitates the maintained Green Breeze effect across the city, preventing the formation of stagnant, high-temperature zones and heat accumulation across the urban fabric [32] while saving energy [33].
Direct Cooling is also enhanced by hydrothermal evaporation induced by plant respiration. Regarding hydrological co-benefits, specifically in the Mediterranean, Sedum species and drought-resistant vegetation can be used.
The specific form, shape and composition of these solutions can now be easily designed for enhanced impact and lower costs by the proposed simulation framework.
5. Conclusions
Mediterranean cities can avoid dry summers by adapting urban shape and materials. At the heart of the solution is street surfaces, especially vast paved areas, and green infrastructure shading coupled with convection currents. This can reduce the surface temperature by a noticeable 3 to 5 °C during the hottest part of the day.
The findings of this research provide urban designers, planners, and policymakers with a powerful tool for creating cooler, more comfortable, and demonstrably more resilient urban environments.
We introduce a novel methodology centered on the synergetic integration of connected GI and public space architecture for a combined microclimatic impact. This study initiates the establishment of a comprehensive, parameterized library of Architectural Elements (AE) [26], which systematically defines the microclimatic boundary conditions (including material properties and geometry) of street design, combined with open-source, site-specific vegetation species information [25].
The proposed methodology allows city planners to get closer to carbon reduction objectives through an efficient assessment of different designs through combined scenarios including:
- Green infrastructure cooling by evaporation coupled with shading. The induced convection currents through green corridors are critical in persistent dry spells.
- Selection of optimal AEs for street refurbishing, reducing water run-off while saving irrigation water and heat accumulation (which is critical in Mediterranean cities where water is precious).
- Introducing green roofs (with drought-resistant plants) for energy-efficient buildings.
- Refurbishment of building facades, reducing heat inside buildings and consequently achieving minimal energy consumption with fewer heat sources.
This significantly contributes to the reduction in UHIs (especially during the crucial night hours when we need the city to cool down) and attaining urban climate objectives.
6. Limitations and Future Work
While the proposed framework offers a high-fidelity approach to urban microclimate design, several important constraints must be acknowledged to contextualize the findings:
- Temporal simulation scope: The current research focuses on iterative “what-if” scenario analyses limited to selected critical 24 h periods. While this allows for rapid, high-fidelity assessment, it does not account for long-term seasonal variations or the cumulative thermal effects of successive heat-wave days.
- URANS turbulence modeling: This study utilizes Unsteady Reynolds-Averaged Navier–Stokes (URANS) equations for aerodynamic and thermodynamic resolution. While URANS is computationally efficient for complex urban geometries, it inherently parameterizes rather than fully resolves the fine-scale turbulent structures that more advanced Large Eddy Simulation (LES) models can capture.
- Exclusion of anthropogenic heat: The modeling framework focuses on dominant physical drivers of microclimate variability. Consequently, it does not explicitly simulate anthropogenic heat sources—such as vehicle emissions or heat rejected from air conditioning units—which can significantly influence localized urban temperature profiles.
- Assumption of clear-sky conditions: The boundary conditions for the simulation were derived from EUMETSAT weather files and fixed to specific peak temperature values (e.g., 31 July 2025). This typically assumes clear-sky conditions to assess maximum thermal stress, potentially overlooking the complex radiative interactions during cloudy or overcast periods.
- Vegetation feedback: Latent heat and biophysical water–energy feedback from vegetation are not explicitly simulated. Instead, vegetation is represented through porous-medium parameterizations for drag, shading, and radiative balance, which may simplify the complex cooling effect of plant transpiration.
These constraints highlight a trade-off between computational cost and model resolution. By prioritizing URANS over more demanding LES models like PALM-4U, the framework achieves the “quick assessment” capability necessary for iterative urban planning. However, the exclusion of anthropogenic heat and simplified vegetation feedback suggests that the model may slightly underestimate the total heat load in dense urban environments or the full cooling potential of diverse plant species. Future research should focus on integrating multi-day simulation cycles and coupling the CFD solver with more detailed biophysical models to capture the full spectrum of urban climate dynamics.
Author Contributions
Conceptualization and methodology, J.O.-M.; methodology and software, R.C.-M.; validation, F.J.O.-S.; formal analysis and investigation, all; resources and data curation, F.J.O.-S.; writing—original draft preparation, J.O.-M.; writing—review and editing, all. All authors have read and agreed to the published version of the manuscript.
Funding
This research was funded by the HORIZON program from the European Commission within project# 101073957, “The HuT”, granted on the call HORIZON-CL3-2021-DRS-01.
Data Availability Statement
Datasets used for the development and validation of the simulation model are available at the links from the RIUNET repository provided in the References section. Research data regarding detailed building information has not been publicly shared due to restrictions on the dataset ownership and privacy issues. We will make the data available upon request after previous authorization from the relevant parties.
Acknowledgments
The authors acknowledge the funding received from the European Commission HORIZON program.
Conflicts of Interest
The authors declare no conflicts of interest. The funders had no role in the design of the study; in the collection, analyses, or interpretation of data; in the writing of the manuscript; or in the decision to publish the results.
Abbreviations
The following abbreviations are used in this manuscript:
| AE | Architectural Elements |
| BPG | Best Practices Guidelines |
| CFD | Computational Fluid Dynamics |
| DT | Digital Twinning |
| GI | Green Infrastructure |
| GIS | Geographical Information System |
| LES | Large Eddy Simulation |
| NZC | Net Zero Cities |
| RANS | Reynolds-Averaged Navier–Stokes |
| SLR | Systematic Literature Review |
| SHX | Shapefile |
| UHI | Urban Heat Island |
| URANS | Unsteady Reynolds-Averaged Navier–Stokes |
References
- Barros Moreira de Carvalho, G.; Bueno da Silva, L. The microclimate implications of urban form applying computer simulation: Systematic literature review. Environ. Dev. Sustain. 2024, 26, 24687. [Google Scholar] [CrossRef] [Scilit]
- Nasrollahi, N.; Ghosouri, A.; Khodakarami, J.; Taleghani, M. Heat-Mitigation Strategies to Improve Pedestrian Thermal Comfort in Urban Environments: A Review. Sustainability 2020, 12, 10000. [Google Scholar] [CrossRef] [Scilit]
- Kousis, I.; Pisello, A.L. Evaluating the performance of cool pavements for urban heat island mitigation under realistic conditions: A systematic review and meta-analysis. Urban Clim. 2023, 49, 101470. [Google Scholar] [CrossRef] [Scilit]
- Chen, G.; Mei, S.J.; Hang, J.; Li, Q.; Wang, X. URANS simulations of urban microclimates: Validated by scaled outdoor experiments. Build. Environ. 2025, 272, 112691. [Google Scholar] [CrossRef] [Scilit]
- Al-Zghoul, S.; Al-Homoud, M. GIS-driven spatial planning for resilient communities: Walkability, social cohesion, and green infrastructure in Peri-Urban Jordan. Sustainability 2025, 17, 6637. [Google Scholar] [CrossRef] [Scilit]
- Amani, M.J.; Tanzadeh, R.; Moghadas Nejad, F.; Kabiri Nasrabad, M.M.; Chalabii, J.; Movahedi Rad, M. Urban Sustainability Through Pavement Technologies: Reducing Urban Heat Islands with Cool Pavements. Buildings 2025, 15, 504. [Google Scholar] [CrossRef] [Scilit]
- Bahadori, E.; Rezaei, F.; He, B.-J.; Heiranipour, M.; Attia, S. Evaluating urban heat island mitigation strategies through coupled UHI and building energy modeling. Build. Environ. 2025, 280, 113111. [Google Scholar] [CrossRef] [Scilit]
- Golbazi, M.; Liu, F.; Chen, Y.-H.; Juliano, T.W.; Richter, H. High-resolution modeling of extreme heat events with socioeconomic consideration: A real-case WRF–LES approach. Environ. Sci. Pollut. Res. 2025, 32, 21666–21680. [Google Scholar] [CrossRef] [Scilit] [PubMed]
- Hellsten, A.; Ketelsen, K.; Sühring, M.; Auvinen, M.; Maronga, B.; Knigge, C.; Barmpas, F.; Tsegas, G.; Moussiopoulos, N.; Raasch, S. A nested multi-scale system implemented in the large-eddy simulation model PALM model system 6.0. Geosci. Model Dev. 2021, 14, 3185–3214. [Google Scholar] [CrossRef] [Scilit]
- Salim, M.H.; Schubert, S.; Resler, J.; Krč, P.; Maronga, B.; Kanani-Sühring, F.; Sühring, M.; Schneider, C. Importance of radiative transfer processes in urban climate models: A study based on the PALM 6.0 model system. Geosci. Model Dev. 2022, 15, 145–171. [Google Scholar] [CrossRef] [Scilit]
- Schöneberger, P.; Sinsel, T.; Ouyang, W.; Tan, Z.; Bruse, M.; Simon, H. Enhancing urban microclimate simulations: Validating ENVI-met’s accuracy in modeling multi-directional radiative fluxes and mean radiant temperature in subtropical Hong-Kong. Build. Environ. 2025, 284, 113475. [Google Scholar] [CrossRef] [Scilit]
- Pappaccogli, G. Numerical Modelling of Urban Atmospheric Processes and Energetics from City to Building Scale: Case Study in Bolzano. Ph.D. Thesis, Free University of Bozen-Bolzano, Bolzano, Italy, 7 August 2019. Available online: https://hdl.handle.net/10863/35915 (accessed on 12 December 2025).
- Toparlar, Y.; Blocken, B.; Vos, P.; van Heijst, G.J.F.; Janssen, W.D.; van Hooff, T.; Montazeri, H.; Timmermans, H.J.P. CFD simulation and validation of urban microclimate: A case study for Bergpolder Zuid, Rotterdam. Build. Environ. 2015, 83, 79–90. [Google Scholar] [CrossRef] [Scilit]
- Rethlefsen, M.L.; Kirtley, S.; Waffenschmidt, S.; Ayala, A.P.; Moher, D.; Page, M.J.; Koffel, J.B. PRISMA-S Group. PRISMA-S: An extension to the PRISMA Statement for Reporting Literature Searches in Systematic Reviews. Syst. Rev. 2021, 10, 39. [Google Scholar] [CrossRef] [Scilit]
- Almashhour, R.; Kolo, J.; Beheiry, S. Critical reflections on strategies for mitigating and adapting to urban heat islands. Int. J. Urban Sustain. Dev. 2024, 16, 144–162. [Google Scholar] [CrossRef] [Scilit]
- Woong Kim, S.; Brown, R.D. Urban heat island (UHI) intensity and magnitude estimations: A systematic literature review. Sci. Total Environ. 2021, 779, 146389. [Google Scholar] [CrossRef] [Scilit]
- Vitanova, L.; Petrova-Antonova, D.; Shirinyan, E. Urban digital twin for assessing and understanding urban Heat Island impacts. Urban Clim. 2025, 62, 102530. [Google Scholar] [CrossRef] [Scilit]
- Available online: https://geoportal.valencia.es/apps/GeoportalHome/es/inicio/geodatos-abiertos (accessed on 12 December 2025).
- Available online: https://riunet.upv.es/entities/publication/a3faabb9-85e8-4eb6-ab1e-279bdea7678c (accessed on 12 December 2025).
- Wang, T.; Reinhart, C.; Qian Ang, Y. sat2shp: Extracting key building features from a single satellite image for urban building energy modelling and beyond. Sustain. Cities Soc. 2025, 118, 106054. [Google Scholar] [CrossRef] [Scilit]
- Cai, B.; Cheng, H.; Xiang, F.; Wang, H.; Kang, T. Modeling the Effects of Vegetation on Air Purification Through Computational Fluid Dynamics in Different Neighborhoods of Beijing. Buildings 2025, 15, 995. [Google Scholar] [CrossRef] [Scilit]
- Destefanis, T.; Guliyeva, S.; Boccardo, P.; Fissore, V. Advancing Flood Detection and Mapping: A Review of Earth Observation Services, 3D Data Integration, and AI-Based Techniques. Remote Sens. 2025, 17, 2943. [Google Scholar] [CrossRef] [Scilit]
- Brozovsky, J.; Simonsen, A.; Gaitani, N. Validation of a CFD model for the evaluation of urban microclimate at high latitudes: A case study in Trondheim, Norway. Build. Environ. 2021, 205, 108175. [Google Scholar] [CrossRef] [Scilit]
- Grow-Green Dataset. Available online: https://riunet.upv.es/entities/publication/f056b10c-c535-45bd-90fb-9023dc674afb (accessed on 12 December 2025).
- Available online: https://floraveg.eu/ (accessed on 16 January 2026).
- Orozco-Sánchez, J. Pavimentación y Espacio Público en el Centro Histórico de València: Evolución, Análisis y Relación Con el Entorno a Través de Casos de Studio. Bachelor’s Thesis, Universitat Politècnica de València, Valencia, Spain, 2022. Available online: https://riunet.upv.es/entities/publication/d3e28a13-218d-48f3-9ada-148683acd9cf (accessed on 12 December 2025).
- Available online: https://pure.manchester.ac.uk/ws/portalfiles/portal/251818752/GrowGreen_GCF_handbook_Final_version_Nov22_v3.pdf (accessed on 16 January 2026).
- Tominaga, Y. CFD simulations of turbulent flow and dispersion in built environment: A perspective review. J. Wind Eng. Ind. Aerodyn. 2024, 249, 105741. [Google Scholar] [CrossRef] [Scilit]
- Available online: https://cordis.europa.eu/project/id/730283/ (accessed on 12 December 2025).
- Available online: https://www.ansys.com/products/materials/granta-selector (accessed on 12 December 2025).
- Gago, E.J.; Roldan, J.; Pacheco-Torgal, F.; Lázaro, A.; Martın, M. The city as a power plant: Urban heat island effect mitigation technologies and the concept of a zero impact city. Renew. Sustain. Energy Rev. 2015, 42, 749–758. [Google Scholar] [CrossRef] [Scilit]
- Xue, Y.; Zhao, Y.; Wai, K.; Yuan, C.; Carmeliet, J. Heat and flow dynamics in cities: An experimental comparative study across diverse urban morphologies. Philos. Trans. A Math. Phys. Eng. Sci. 2025, 383, 20240573. [Google Scholar] [CrossRef] [Scilit]
- Emmanuel, R.; Krüger, E.L. Urban climate and the energy efficient city. Energy Build. 2012, 49, 12–19. [Google Scholar]

Disclaimer/Publisher’s Note: The statements, opinions and data contained in all publications are solely those of the individual author(s) and contributor(s) and not of MDPI and/or the editor(s). MDPI and/or the editor(s) disclaim responsibility for any injury to people or property resulting from any ideas, methods, instructions or products referred to in the content. |
© 2026 by the authors. Licensee MDPI, Basel, Switzerland. This article is an open access article distributed under the terms and conditions of the Creative Commons Attribution (CC BY) license.