


Featured Application
The proposed magnetic field sensor array offers a scalable and noninvasive solution for battery diagnostics by mapping magnetic fields during charging and discharging under normal operating conditions. Although this study focused on these states, the system’s capability enables broader applications, including health monitoring, safety assessment, and overall performance evaluation.
Abstract
Ensuring safety in energy storage systems increasingly relies on advanced diagnostic tools, among which magnetic field mapping plays a critical role. This work aims to develop and validate a high-sensitivity magnetic field sensor array for accurate field mapping and preliminary battery diagnostics. We present a 4 × 4 array of magnetic sensors integrated with a calibration procedure to ensure accurate output. The system was experimentally tested by characterizing the magnetic field generated by two planar copper conductors. Finite element simulations were performed for comparison and validation. Experimental measurements exhibited strong agreement with the simulation results, confirming the reliability of the sensor array. Next, the system was employed to map the magnetic field distribution of a pouch-type lithium-ion battery, demonstrating its capability for noninvasive diagnostics. Although this study focuses on magnetic field measurement rather than direct battery diagnosis, the results suggest that the proposed system—capable of measuring magnetic fields in batteries operating under normal conditions—could also perform these measurements under abusive conditions, thereby enabling diagnostic assessments. The proposed sensor array provides a scalable and precise solution for low-intensity magnetic field mapping, with potential applications in battery health monitoring and safety assessment.
1. Introduction
Electrochemical–magnetic coupling in lithium-ion batteries falls into two main categories: external magnetic fields influencing performance [1,2] and intrinsic magnetic fields enabling diagnostics [3,4,5,6]. While the former addresses ion transport and reaction kinetics, the latter—an emerging approach—underpins this work, which leverages magnetic signatures for noninvasive electrochemical state monitoring.
Magnetic field sensing is increasingly recognized as a critical tool for safety monitoring in energy storage systems [3,4,5,6], complementing its established roles in geophysics, biomedical diagnostics, navigation, and electromagnetic compatibility testing, as well as advanced electromagnetic system characterization [7]. The growing demand for compact, high-resolution, and low-noise magnetic field sensor arrays reflects the need for precise spatial mapping of magnetic fields [8,9,10,11]. In battery applications, magnetic sensing offers a noninvasive means of health monitoring and defect detection, enabling identification of anomalies such as tab or weld faults, irregular current paths, and localized short circuits [3,4,5,6]. In some cases, magnetic measurements even correlate with state of charge (SOC) [12].
Safety monitoring varies across battery-powered systems: large platforms like EVs rely on Battery Management Systems (BMSs) [13,14], whereas smaller devices often use simplified versions [15]. However, once a battery is removed for storage, servicing, or recycling, BMS data is typically unavailable, leaving first responders and handlers without critical safety information [16,17]. Magnetic diagnostics can bridge this gap by detecting internal current distributions and field anomalies that thermal imaging may miss.
Infrared cameras remain essential for identifying thermal instabilities [18,19,20], but their accuracy is limited by environmental factors [21,22], slow response to rapid combustion, and inability to reveal internal defects or SOC [23,24]. Conventional diagnostic techniques, such as voltage monitoring and electrochemical impedance spectroscopy (EIS), provide valuable insights into battery health and performance. However, EIS requires specialized equipment, controlled experimental conditions, and presents significant challenges for application in large-format cells or battery packs [25]. In contrast, magnetic field sensing offers a fully non-contact and scalable solution, enabling real-time monitoring without interfering with the battery structure or demanding complex setups, making it highly suitable for integration into battery management systems. Furthermore, magnetic sensing delivers direct information on current distribution and fault signatures [26,27,28,29,30], serving as a powerful complement to thermal diagnostics for early warning and enhanced situational awareness.
In this context, magnetic sensing should be viewed as a complementary tool that enhances battery surveillance capabilities by adding layers of information such as internal current distribution and magnetic field anomalies that thermal diagnostics alone cannot provide. This dual-modality approach strengthens early warning systems and situational awareness, especially when conventional data are limited. Although many techniques were not initially designed to fill diagnostic gaps, they can be repurposed effectively for fault detection and performance assessment [31]. Early studies showed that mapping magnetic fields leaking from cells revealed conductivity loss and short circuits, linking reduced conductivity to cycle deterioration [32]. One-dimensional scanning methods extended this work to diagnose capacity consistency across packs by detecting current imbalances [33], whereas sensor arrays and finite element simulations reconstructed current density maps and identified SOC anomalies such as dendrite formation [28]. Magnetic imaging also proved effective for collector defect detection [29]. More advanced three-dimensional electrochemical-magnetic-thermal models captured short circuits and cracks through distinct signatures [27], and gradient-based analysis distinguished internal faults from general degradation [29]. Instrumentation systems with hundreds of magnetic pixels refined spatial resolution, uncovering exponential current profiles and recording transient equalization events [34]. Most recently, real-time magnetic field imaging introduced destructive interference techniques to accentuate defect spots and classify failure modes such as tab connection faults or electrode misalignment [26].
Most existing systems rely on mechanical scanning, where a sensor is moved across the battery’s surface. While this method offers flexibility in sensor positioning, it suffers from significant drawbacks: mechanical complexity, slower sequential data acquisition, and limited ability to capture transient events. Scaling to larger systems further amplifies these issues, such as size, weight, vibration sensitivity, and the need for precise alignment and stable power sources increase setup time and reduce portability, making field deployment challenging. In contrast, array-based (static grid) systems eliminate moving parts, enabling simultaneous, high-resolution measurements across the entire battery surface. This supports real-time monitoring and enhances fault detection accuracy. However, these systems come with their own trade-offs: higher upfront hardware costs, the need for precise synchronization, and increased data processing demands. Despite these challenges, array-based designs offer superior scalability, reliability, and responsiveness compared to scanning-based approaches.
Building on this, our device employs a 4 × 4 sensor grid as an initial testbed, and although the results presented in this paper involve manual scanning of the grid, this configuration serves as a proof of concept for an intrinsically scalable, with the goal of upscaling to larger arrays in the future. Such scalability will enable measurements to be performed without the need for spatially scanning the samples. Combined with the interpolation procedure introduced in this paper, the approach is expected to enhance diagnostic resolution and robustness, advancing battery safety through improved detection of internal faults and anomalies. Although the motivation for this development is battery diagnostics, the array can capture spatial magnetic field distributions across a planar surface, enabling applications such as magnetic imaging [35], material characterization [36], and environmental field mapping [37,38]. This paper presents a dual objective. First, it details the design and implementation of the magnetic field sensor array (MFSA) and compares theoretical predictions with experimental measurements of magnetic fields generated by planar copper conductors. Once validated, the MFSA is applied to monitor the magnetic field near the surface of a lithium-ion pouch cell during controlled charge and discharge cycles.
This paper is organized as follows: Section 2 outlines the experimental setup, including the MFSA design, sample configurations, measurement protocol, and the theoretical framework for validation. Section 3 presents and discusses both experimental and numerical results, highlighting the application of the MFSA to characterize the magnetic field distribution on a lithium-ion battery. Finally, Section 4 summarizes the findings and suggests directions for future work.
2. Materials and Methods
Section 2.1 provides a detailed description of the MFSA. Section 2.2 and Section 2.3 present the samples under investigation, followed by the experimental procedure in Section 2.4. The data postprocessing approach is introduced in Section 2.5, and the numerical framework employed for validation is outlined in Section 2.6.
2.1. The Magnetic Field Sensor Array
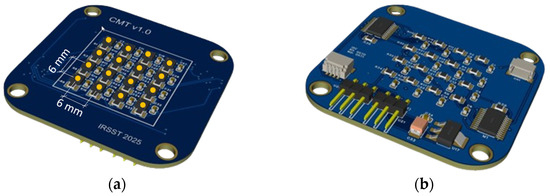
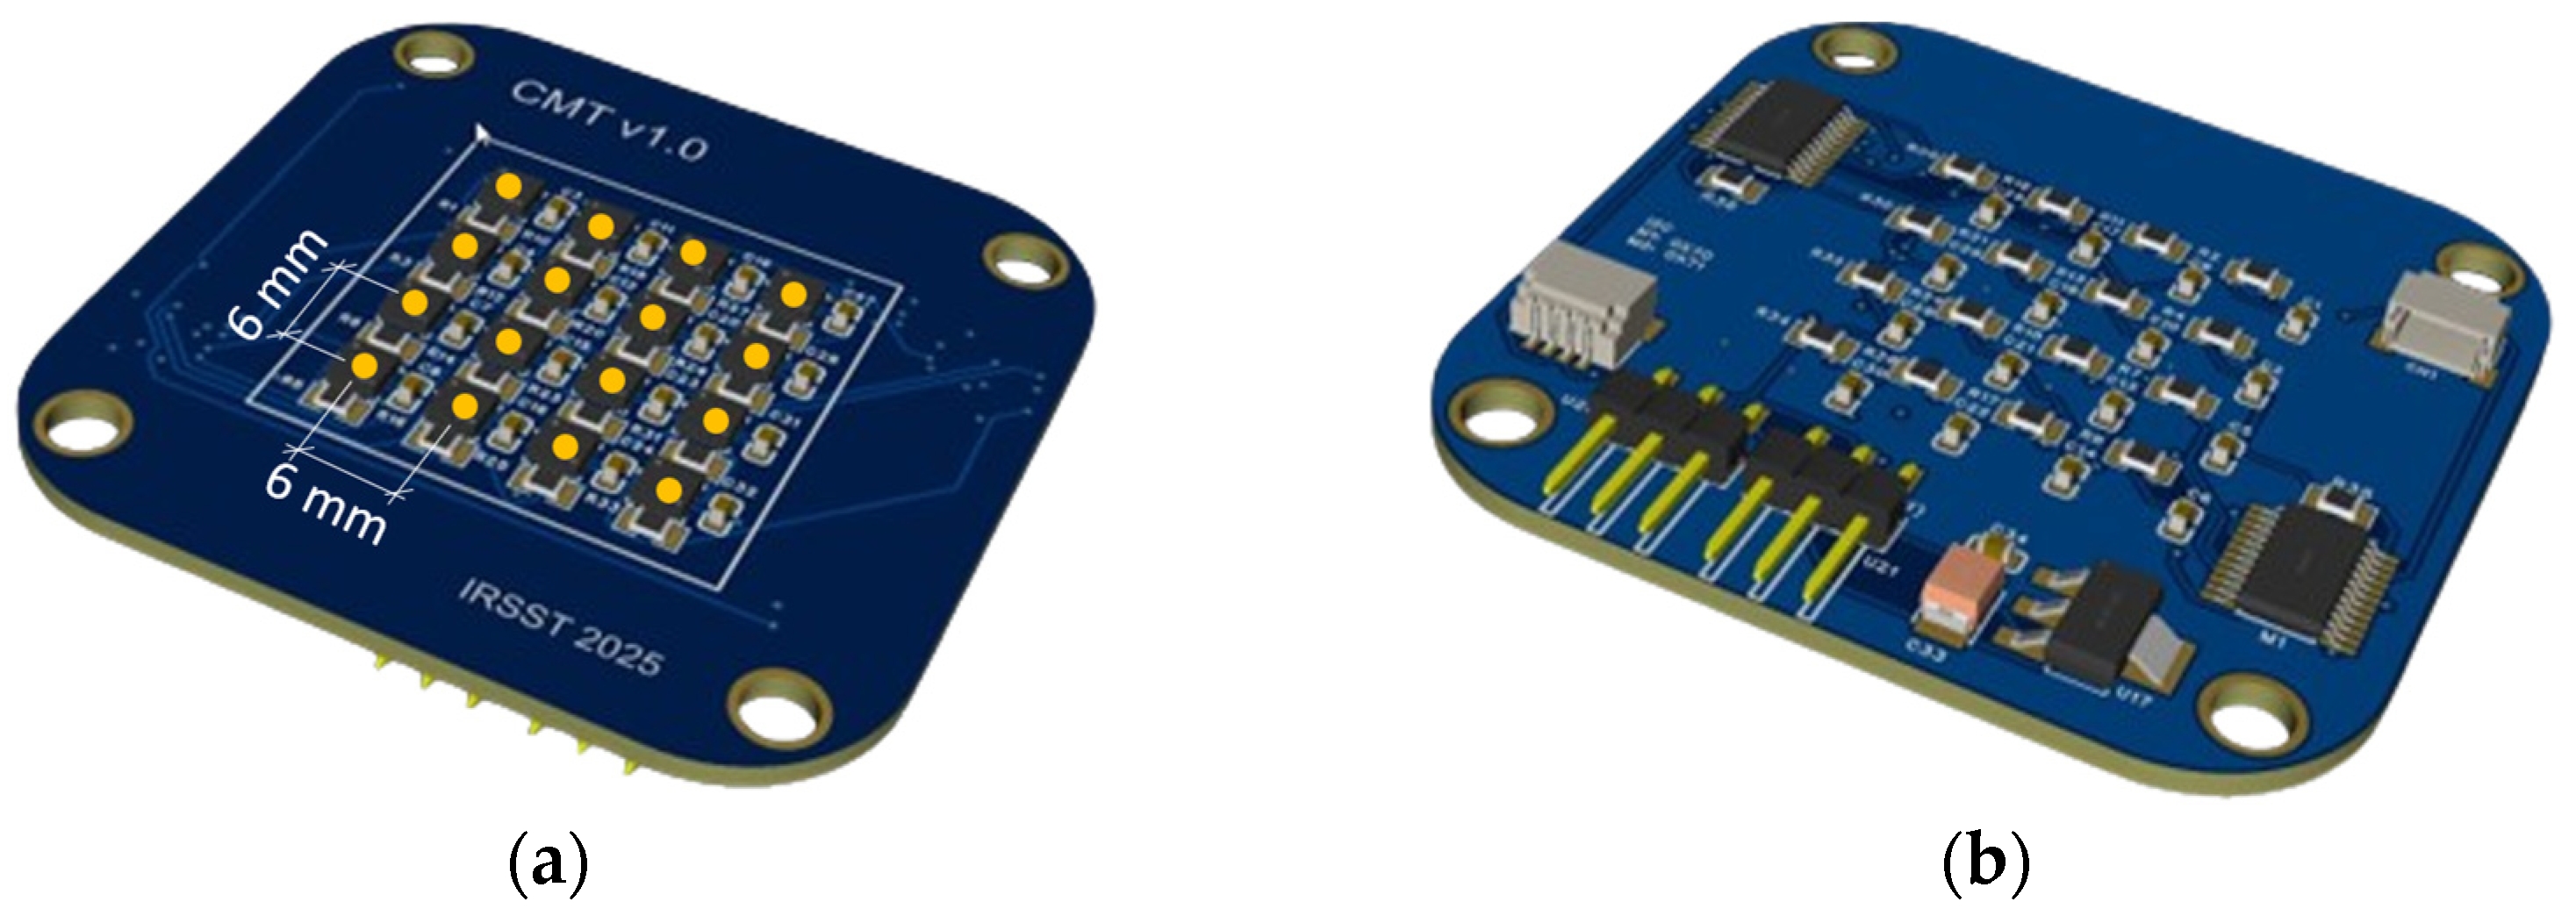
Figure 1 shows the developed MFSA used to measure local magnetic fields near the surface of the samples. The array consists of a 4 × 4 grid of MMC5983MA sensors from MEMSIC (Tianjin, China) [39], which are 3-axis anisotropic magnetoresistive magnetometers offering 18-bit resolution, a ±800 µT full-scale range and a maximum output data rate of 1 kHz. The sensors actually measure the three components of the magnetic flux density vector, which we will refer to by magnetic field or B field, for short. These specifications make the system well-suited for precision magnetic field mapping. The sensors also feature integrated temperature sensing and built-in degaussing circuitry, which improve measurement stability and accuracy in environments with variable thermal or magnetic conditions. The MMC5983MA is packaged in a 16-pin Land Grid Array (LGA) with dimensions of 1.0 × 3.0 × 3.0 mm.
Figure 1.
MFSA with 16 sensors arranged in a 4 × 4 grid. (a) Top view with sensor centers marked as orange dots; (b) Bottom view showing two multiplexers and components for I2C communication.
Sensors are arranged on a rigid, 1 mm thick PCB with 6 mm center-to-center spacing in both vertical and horizontal directions in the plane of the array, Figure 1a. Future work may focus on developing sensor grids on flexible substrates [40], enabling measurements across nonplanar or irregular sample surfaces. Therefore, the 4 × 4 array of magnetometers can be represented by a square of 16 dots, where each dot represents a sensor. It captures the magnetic field components Bx, By within the plane of the MFSA, whereas Bz is measured perpendicular to the plane.
Since the MMC5983MA has only one fixed I2C address (0x30), to operate multiple sensors sharing the same I2C address simultaneously, the MFSA architecture incorporates two TCA9548A multiplexers, configured at addresses 0x70 and 0x71. Each TCA9548A controls eight independent channels, allowing for a total of sixteen sensors to be managed. The MFSA is connected to the ESP32 microcontroller, that dynamically drives these channels, ensuring that only one sensor communicates on the I2C bus at a time. This approach prevents address conflicts while maintaining consistent and reliable data flow. Sequential data acquisition is optimized to minimize switching delays and deliver continuous, precise, and synchronized magnetic measurements. Additionally, a graphical user interface (GUI) was developed for this project to facilitate the selection of the communication port with the ESP32, as well as the real-time visualization and recording of the system’s generated data. The result is a modular, extensible, and interactive measurement platform, specifically designed for spatial magnetic field mapping.
The accuracy of the MFSA was validated using a magnetic field generated by Helmholtz coils and measured with a Wavecontrol SMP3 equipped with a WPH-DC probe (0.1 µT resolution) (Wavecontrol, Barcelona, Spain). For all 16 sensors, the relative deviation between measured sensor values (Bs) and expected values (Be), expressed as ΔB (%) = |Bs − Be|/Be × 100, was under 1% throughout the 10–100 µT range. The experimental resolution of the MFSA is approximately 1 µT. Based on the sensor datasheet, the MFSA’s estimated per-axis noise density falls within the nT/√Hz range. All measurements were conducted at room temperature, around 22 °C.
2.2. Planar Copper Conductors
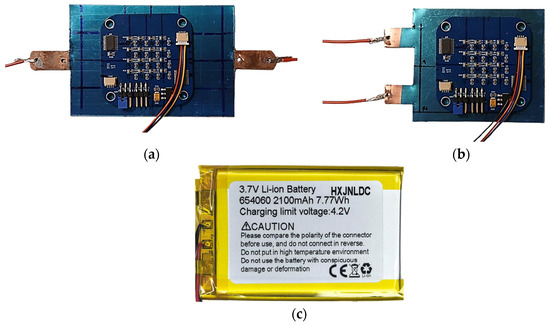
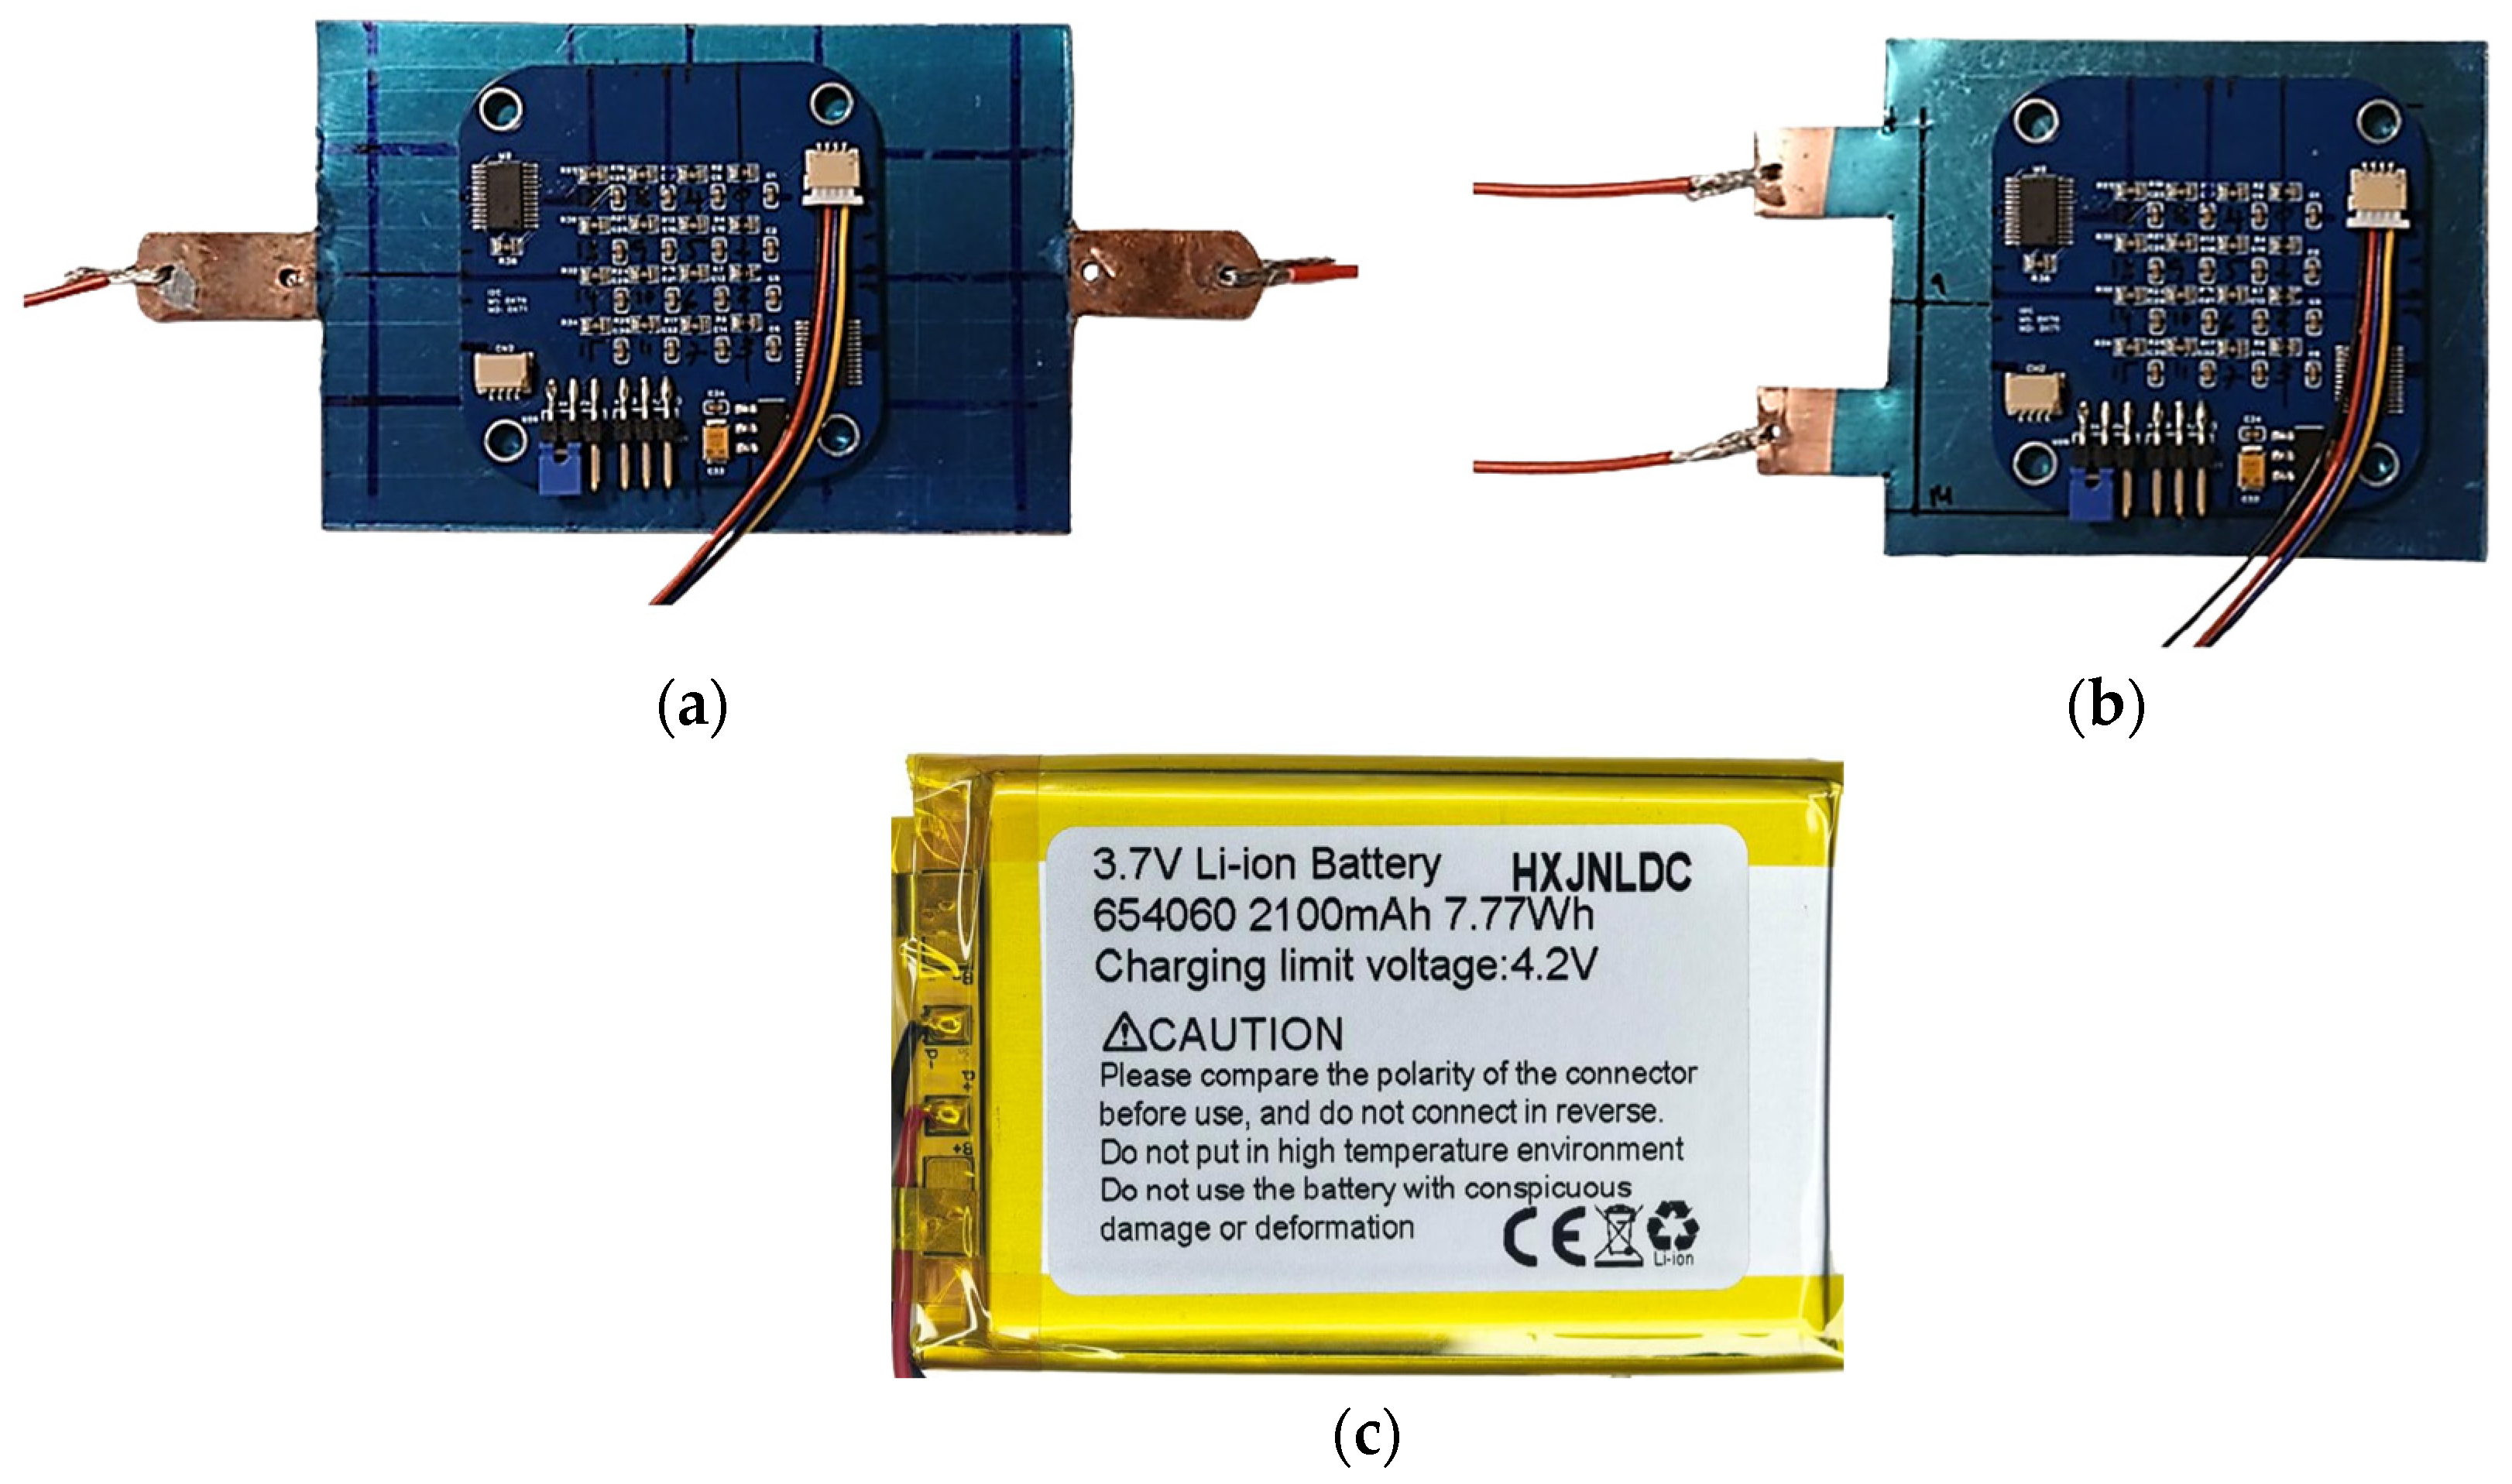
Figure 2a,b shows the copper samples used to evaluate the array’s ability to accurately map the magnetic fields across a surface. For clarity, we refer to these samples as CsA and CsB, respectively. Each sample is composed of copper approximately 0.6 mm thick. CsA measures 90 × 60 mm, whereas CsB measures 55 × 60 mm. In Figure 2a, the current collectors are center-aligned and placed on opposite sides, whereas in Figure 2b, they are located on the same side. This difference in configuration leads to distinct magnetic field distributions for each sample. During the experiments, both samples were subjected to a direct current of 1 A.
Figure 2.
Samples used for magnetic field mapping: (a) Copper plate sample with opposed current collectors, CsA. (b) Copper plate sample with collectors on the same side, CsB. (c) Lithium-ion battery. In (a,b), MFSA is shown in contact with sample surfaces. Images are not to scale.
2.3. Lithium-Ion Battery
To illustrate the use of the MFSA in assessing battery operation, we measured the magnetic field near the surface of a lithium-ion cell under active discharging and charging cycles. The test subject was a 3.7 V, 2100 mAh, 654060 pouch-type battery with nominal dimensions of approximately 6.5 × 40 × 60 mm, Figure 2c. This type of rechargeable cell is commonly found in DIY electronics, portable devices, and other low-power applications. Discharging and charging tests were both conducted at 1 A (C-rate of 0.5C) and 2 A (1C) at constant current condition. At a 1C rate, the battery discharged from 4 V to 3.3 V over approximately 22 min, providing a discharge capacity of 730 mAh and delivering about 2.4 Wh of energy.
2.4. Measurement Procedure
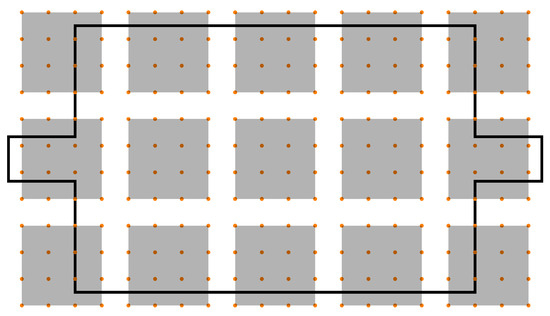
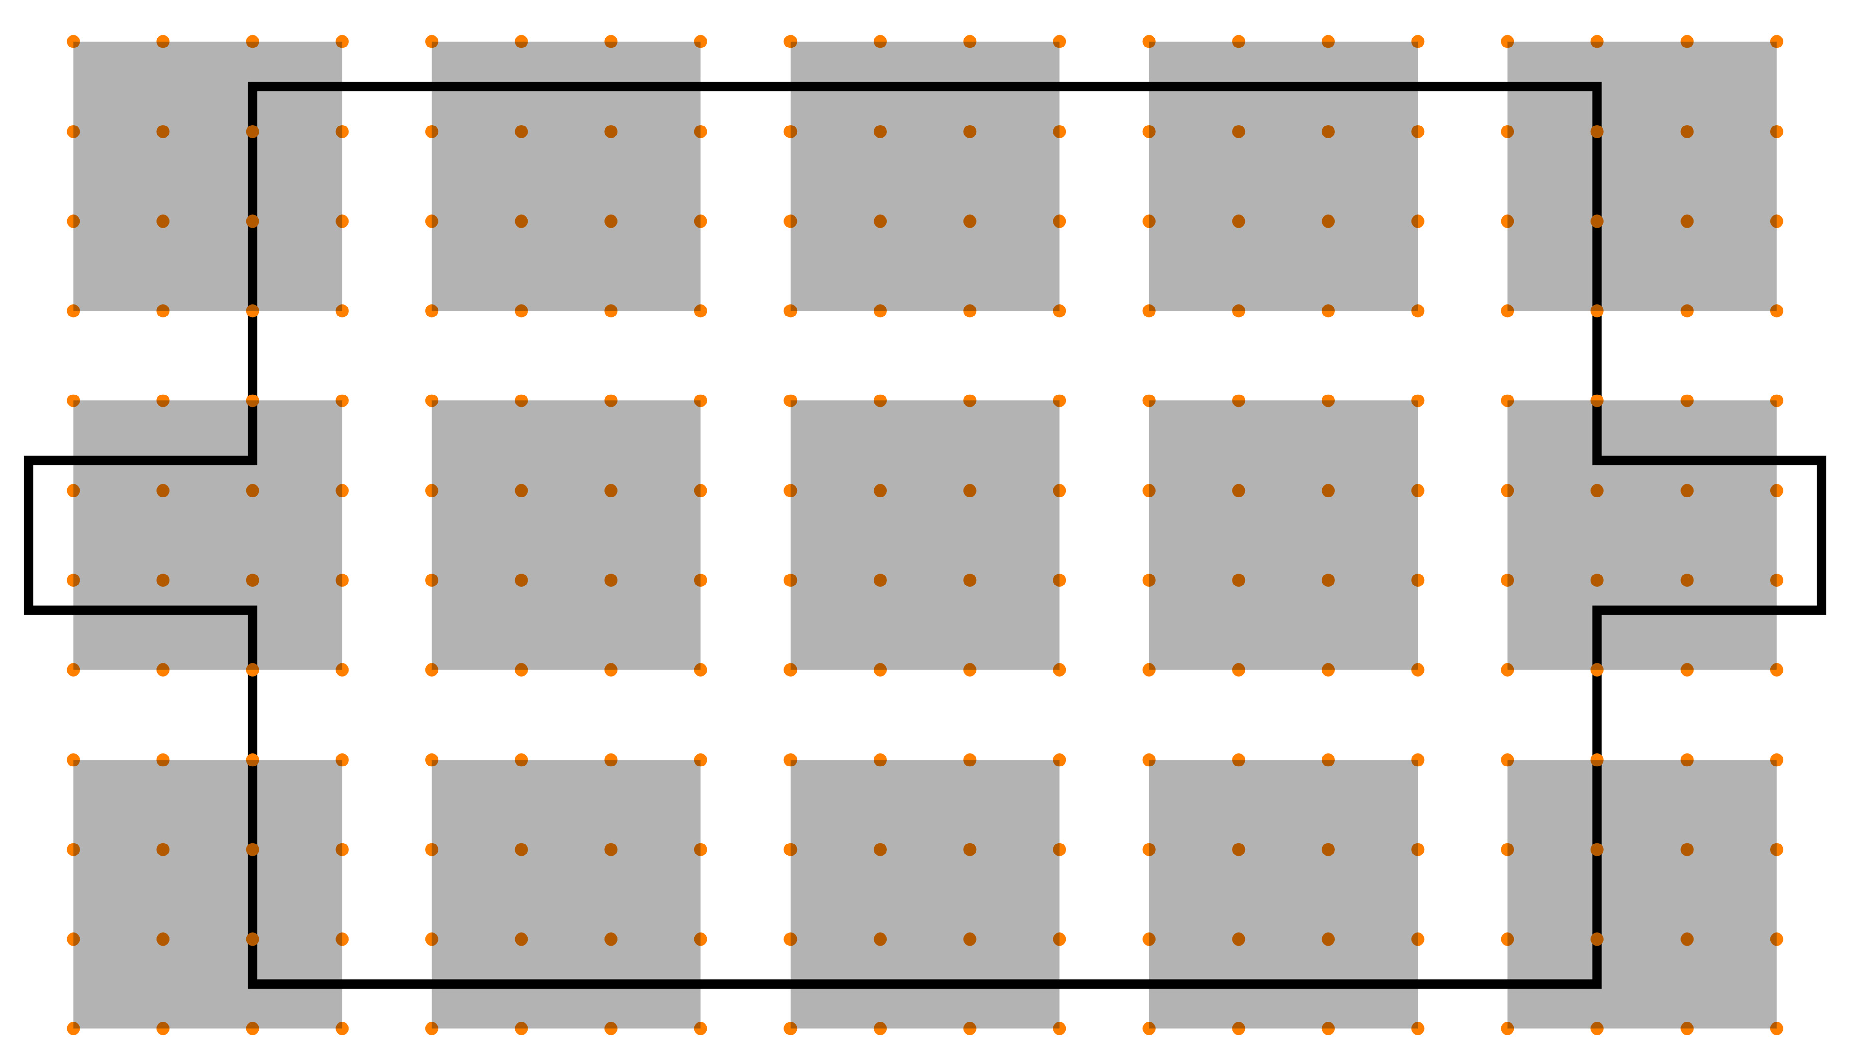
Prior to each measurement, background magnetic fields, originating from Earth’s geomagnetic field and surrounding equipment, were compensated by performing an offset calibration. This calibration utilized the sensor’s integrated set/reset degaussing function to nullify residual magnetization and stablish a zero-field baseline for subsequent readings. Next, the samples CsA and CsB were subjected to a 1 A direct current, and the resulting three components of B at the surface were measured. Because the MFSA covers an area of 18 × 18 mm, scanning the entire surface of the CsA and CsB samples required manually repositioning the array across 15 distinct locations, resulting in a total of 240 measurement points, Figure 3. An improved version of the MFSA is being developed to enable full-surface measurement of samples with similar dimensions, eliminating the need for sensor repositioning. In Figure 3, each gray rectangle represents a measurement position of the MFSA for sample CsA (the same procedure was applied to the sample CsB). Since three B-field components were recorded at each point, the data set includes a total of 720 individual parameters. At each location, the MFSA collected data for approximately one minute. Given the experimental acquisition rate of roughly 600 ms, each session yielded 100 data samples per component of B for each of the 16 sensors. The final experimental values represent the average of these 100 readings for each component of B.
Figure 3.
Surface measurement points on sample CsA mapped by the MFSA. Each gray square represents an MFSA position and contains 16 orange dots indicating the sensor grid. The same procedure was applied to sample CsB and the battery. Sensor spacing: 6 mm vertically and horizontally.
The procedure to measure the battery’s generated B field mirrored that used for copper samples. Because the battery surface area is smaller than that of the copper samples, nine distinct measurement points were sufficient to cover its surface. The B field has been recorded during both charging and discharging phases at constant currents of 1 A and 2 A (0.5C and 1C, respectively), using an EBC-A20 Battery Tester (ZKETECH, Shanghai, Chine). Notably, a residual magnetic field distribution was observed at the surface of the battery even when it was disconnected, likely originating from trace magnetic elements in the cathode material or from the wiring and terminal connections. The residual field measured prior to and following discharge appears either unaffected by the battery’s SOC or reflects polarization-related magnetic fields [29] that cannot be resolved by the MFSA. Additional research is needed to substantiate this interpretation. Consequently, the battery’s B field data presented in the following section collected during active charging and discharging is the result of the subtraction of this residual field.
2.5. Post-Treatment of the Experimental Data
Once the in-plane components of B (Bx and By) were measured at each point of the surface (as illustrated by the dots in Figure 3 for the sample CsA), a 3rd-order interpolation function, based on cubic polynomials in each spatial dimension [41], was applied to smoothly estimate values between the measured data points. This procedure was applied to both the copper samples and the battery. The Bz component was not analyzed in this work. Wolfram Mathematica 14.3.0 was employed to perform interpolation and create 2D field distributions and vector plots.
2.6. Numerical Computation of the Magnetic Field of the Copper Samples
The components of the B field were computed for the samples CsA and CsB. As an initial step, a DC voltage is applied across the sample terminals to establish a constant current of 1 A. This produces a current density vector, which varies with the spatial coordinates x and y. Because no potential difference exists along the thickness (z-axis), the out-of-plane component of the current density vector, Jz, can be disregarded. To perform these calculations, we have used FEMM 4.2 software [42], a finite element package designed for solving two-dimensional magnetostatic and low-frequency electromagnetic problems. After determining the components Jx and Jy as functions of x and y over the sample geometry, the magnetic field components Bx, By and Bz were computed via numerical integration of the Biot-Savart equation across the surface defined by −65 mm < x < 65 mm and −40 mm < y < 40 mm, at a given height z from the plane. To account for sensor thickness, the plane used for field calculations was positioned at z = 0.5 mm from the surface of the sample. The initial Fortran 90 program was written by one of the authors (LM) and subsequently reviewed and optimized with the assistance of Copilot to ensure accurate and efficient computation of the magnetic field components.
3. Results and Discussion
This section presents both the experimental and numerical results. Section 3.1 focuses on the analysis of samples CsA and CsB to evaluate the MFSA capability to measure B at the sample surface. Section 3.2 then examines the magnetic field measurements obtained from the battery.
3.1. Magnetic Field of Copper Samples
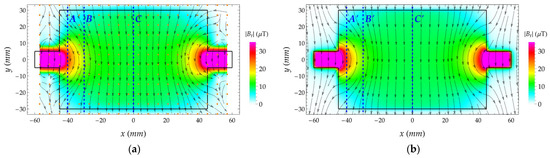
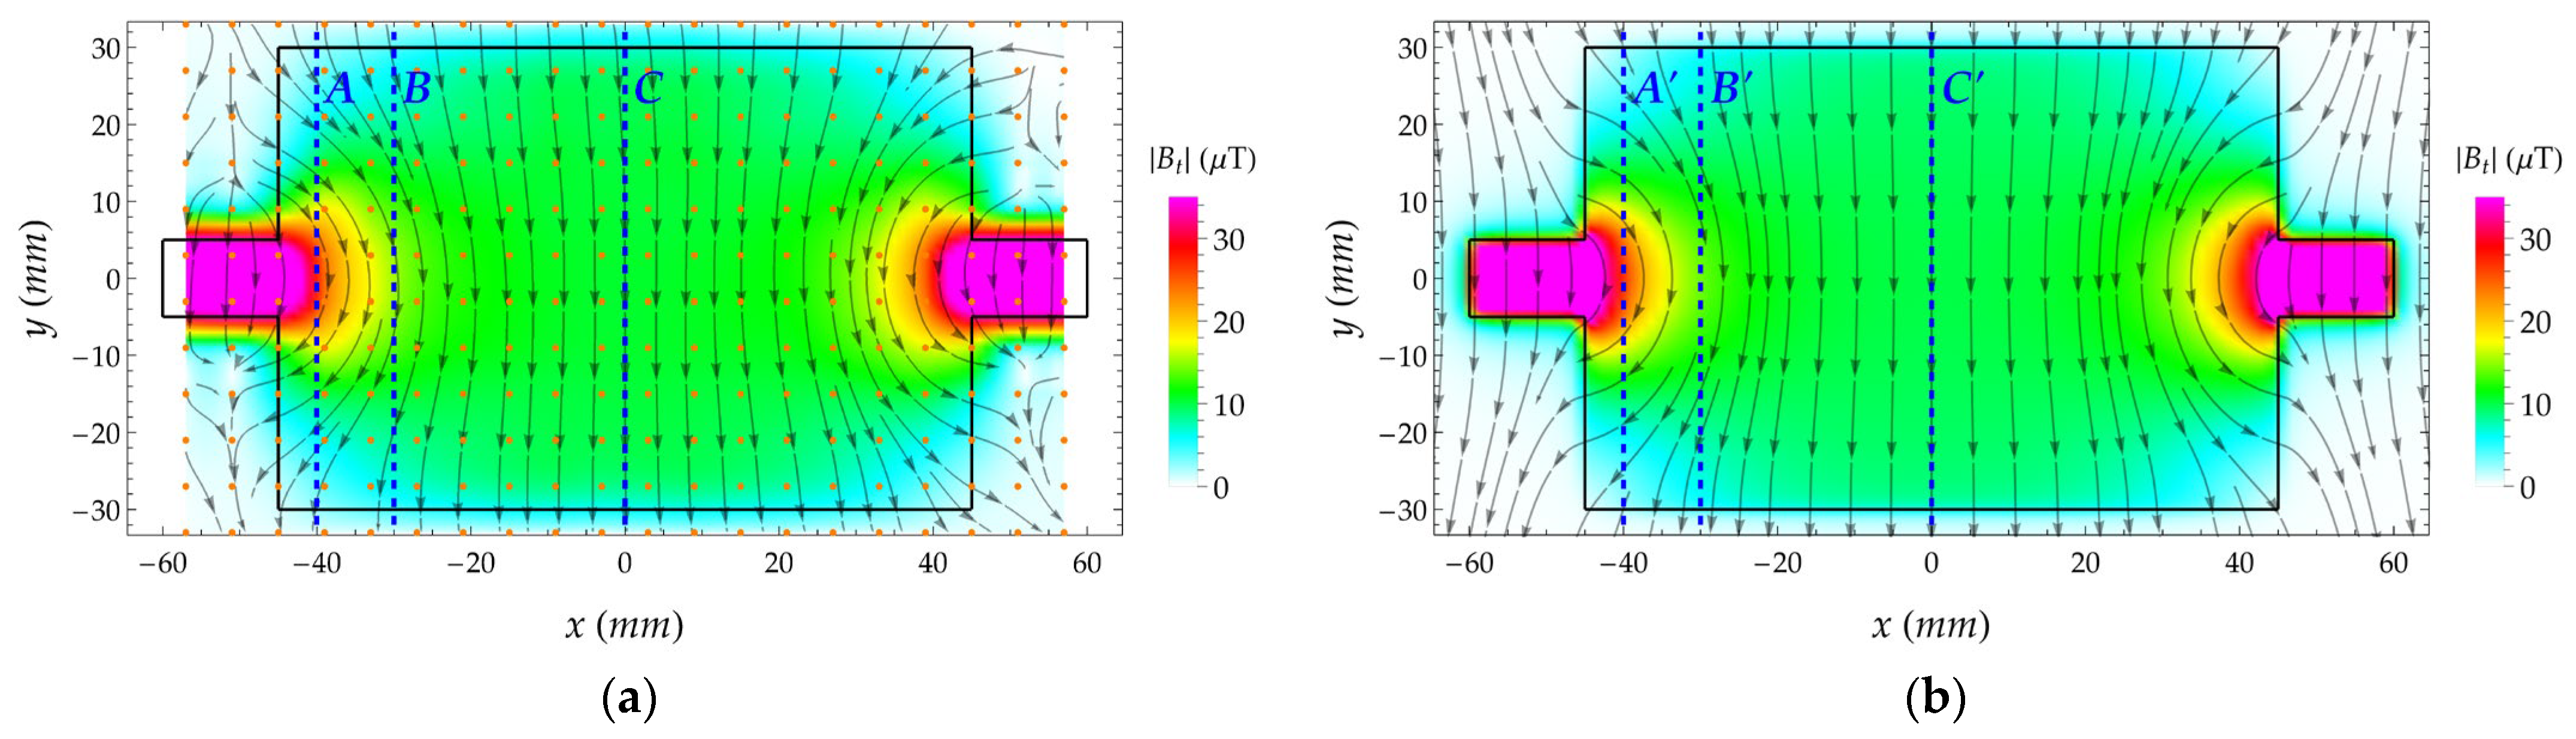
Figure 4a,b shows the experimental and simulated distributions of B at the surface of the CsA sample, subjected to a 1 A direct current flowing from the left to the right terminal. The color scale represents the magnitude of the in-plane component of B, |Bt|= (Bx2 + By2)1/2, which spans from zero up to approximately 54 µT near the terminals, but has been clipped at 35 µT to enhance visual clarity. Arrows in both figures depict the vector field formed by the Bx and By components.
Figure 4.
Comparison of magnetic field distributions on sample CsA: (a) Experimental and (b) simulated. A 1 A DC flows from the left to the right terminal.
Clearly, the component By is predominant as a result of the primarily horizontal current distribution, which is dictated by the conductor’s geometry. In Figure 4a, the orange dots indicate the 240 measurement locations used to reconstruct the full surface distribution via interpolation, as detailed in Section 2.4 and Section 2.5. The FEMM data shown in Figure 4b were generated according to the methodology described in Section 2.6. The vertical dotted lines mark the positions where the fields are plotted as a function of y, as shown below.
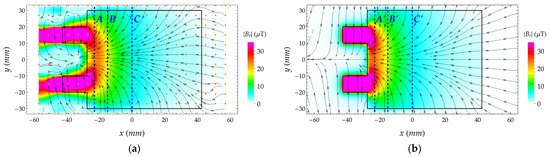
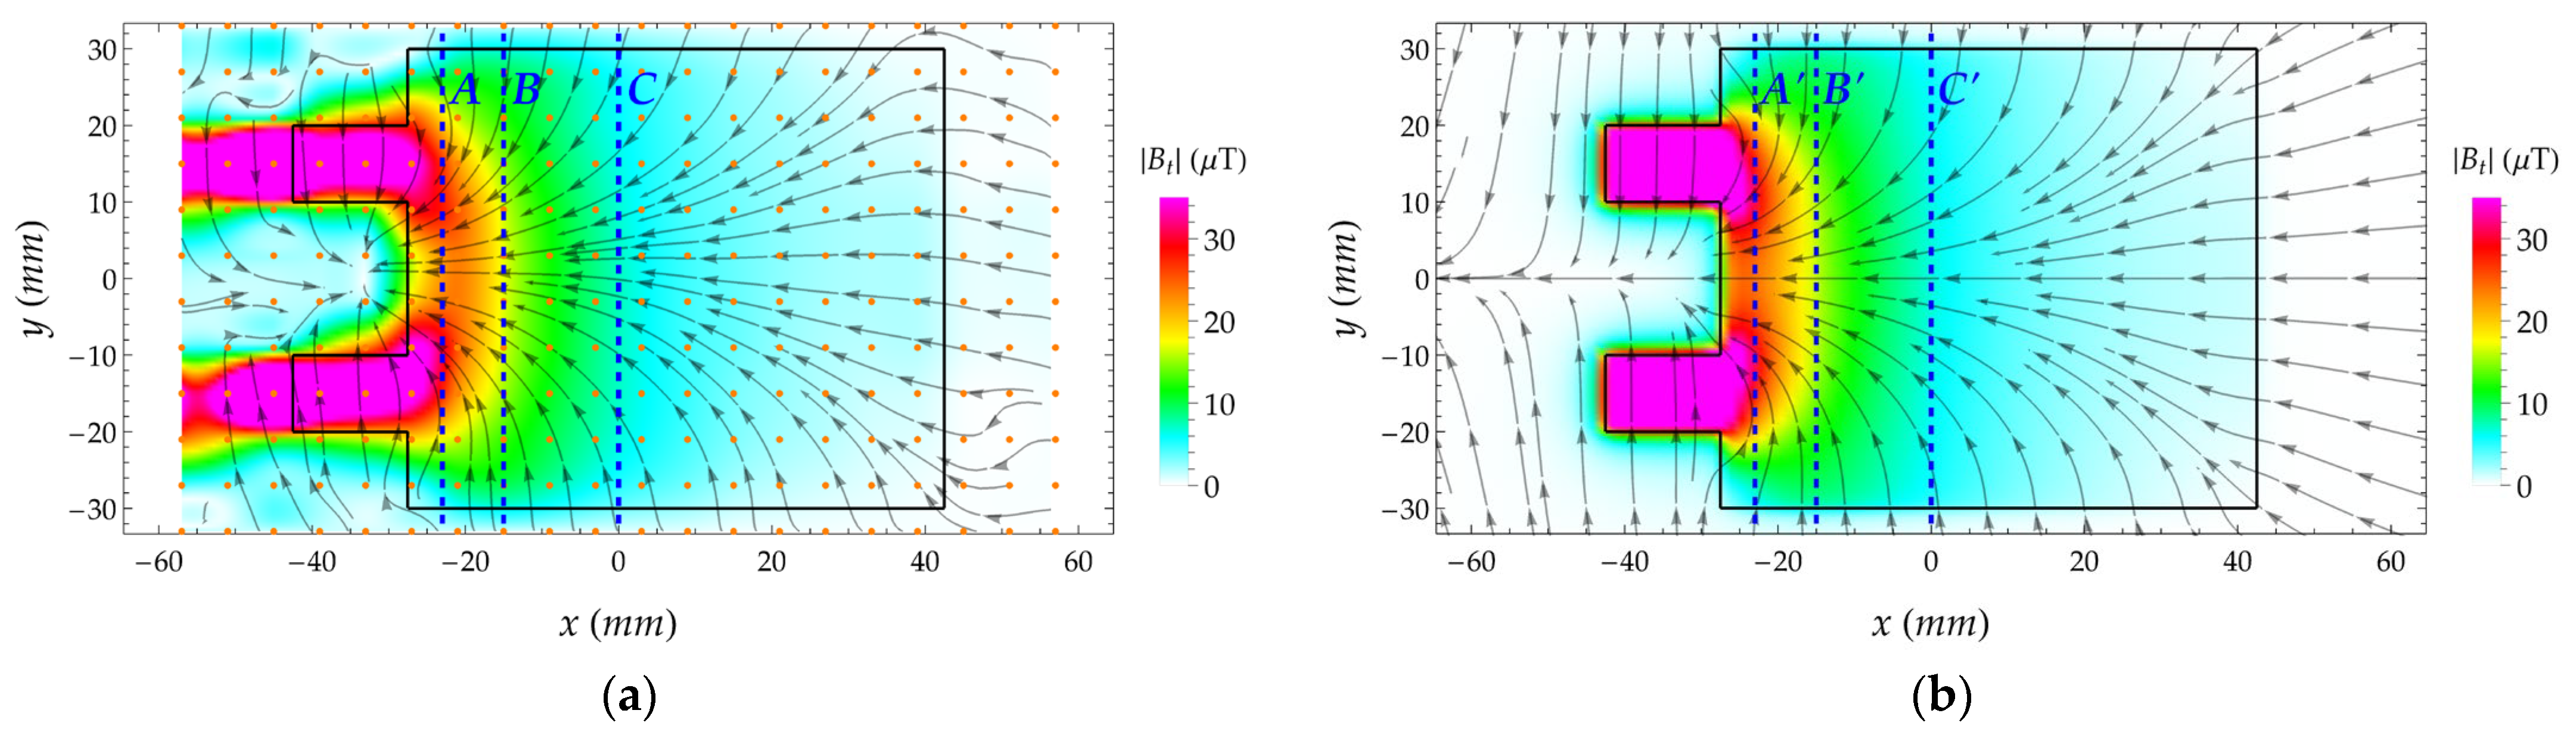
A similar analysis was conducted on sample CsB, which was likewise exposed to a 1 A direct current. Figure 5a,b displays the spatial distribution of |Bt| at the surface of the sample, obtained from both experimental measurement and simulation, with the current flowing from the upper to the lower terminal. As in Figure 4, the maximum |Bt| was capped at 35 µT for visual clarity. In both figures, arrows illustrate the vector field distribution. In Figure 5a, orange dots mark the measurement locations of the components of B, as previously described. The figures show a B field distribution consistent with a current entering through the upper terminal, predominantly flowing in the vertical direction, and exiting through the lower terminal. The slight field irregularities observed near the current pads in Figure 5a may be attributed to the imperfect geometry of the sample, as well as interpolation errors in measured regions with significant field variation. Figure 5a also shows a high field pattern extending beyond the sample boundaries, which originates from the wires connecting the sample to the current power supply, as Figure 2b shows.
Figure 5.
Comparison of magnetic field distributions on sample CsB: (a) Experimental and (b) simulated. A 1 A DC flows from the upper to the lower terminal.
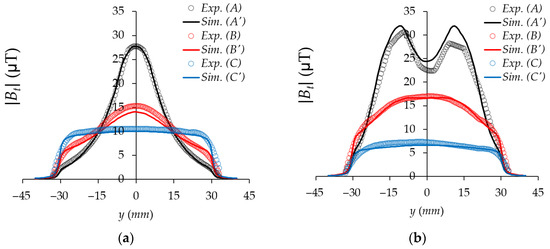
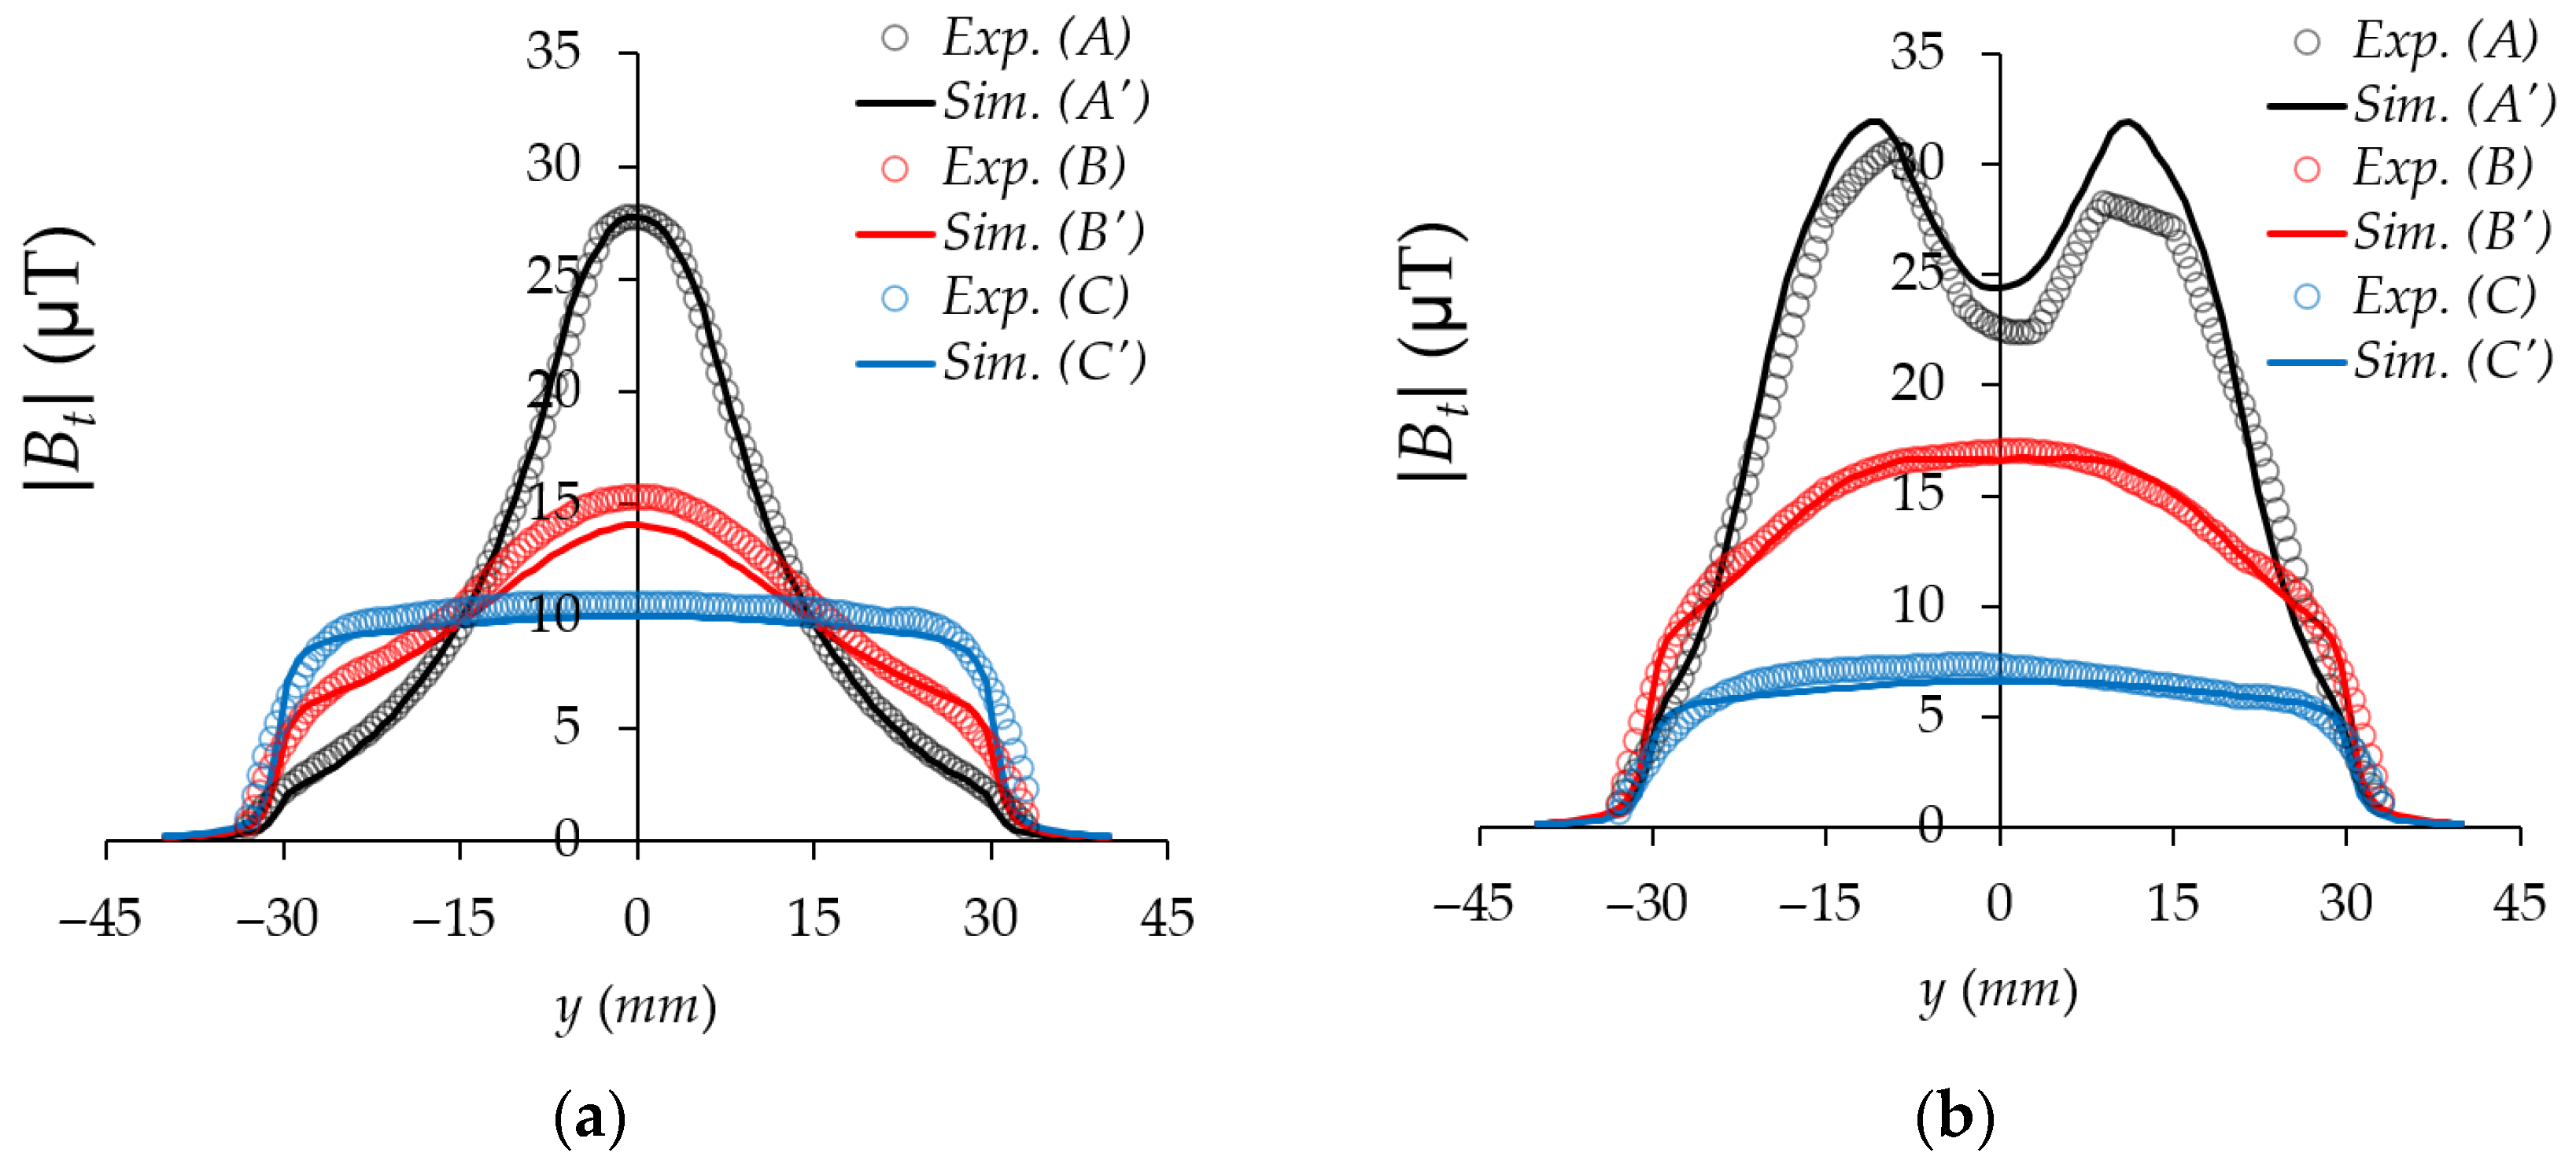
Figure 6a compares experiment and simulation along the vertical axis (y) at three fixed horizontal positions x = −40 mm, −30 mm, and 0 mm, corresponding to the dotted vertical lines labeled A, B, and C in Figure 4a and A′, B′, and C′ in Figure 4b. The comparison indicates that, overall, only minor discrepancies exist between the experimental measurements and the simulation results. These findings are also in qualitative agreement with those previously reported by Lee et al. [26]. Similarly, Figure 6b shows the magnetic field variation along y at x = −23 mm, −15 mm, and 0 mm, corresponding to the dotted lines labeled A, B, and C in Figure 5a and A′, B′, and C′ in Figure 5b. Slight discrepancies between the numerical calculations and experimental results are noted, mainly due to the factors mentioned above and the displacement of the sensor grid over the sample, as outlined in Section 2.4. Similarly to the previous sample, the overall distribution of |Bt| observed here is in qualitative agreement with that reported in [26].
Figure 4, Figure 5 and Figure 6 demonstrate that the MFSA reliably measures the magnetic field in the µT range near the surface of a planar sample. The system shows consistent performance in detecting both the x and y components of the B field, as highlighted by the dominant field orientations in samples CsA and CsB. Additionally, the results show that the sensors are highly sensitive, capable of detecting small field variations and measuring fields below 5 µT. In summary, the measurements and numerical simulations conducted on the copper samples have enabled us to assess and validate both the capabilities and limitations of the MFSA. Despite several experimental sources of error—including low magnetic fields below the resolution threshold of ±1 µT, a 6 mm physical spacing between sensors, misalignment from manually shifting the MFSA across the 15 positions illustrated in Figure 3, and interpolation errors particularly in regions with steep field gradients—the sensors array demonstrate sufficient reliability for investigating surface magnetic fields ranging from 1 µT to several tens of µT. In the next section, the MFSA and the established measurement procedure are employed to examine the B field characteristics of a lithium-ion battery during operation.
3.2. Magnetic Field of a Lithium-Ion Battery
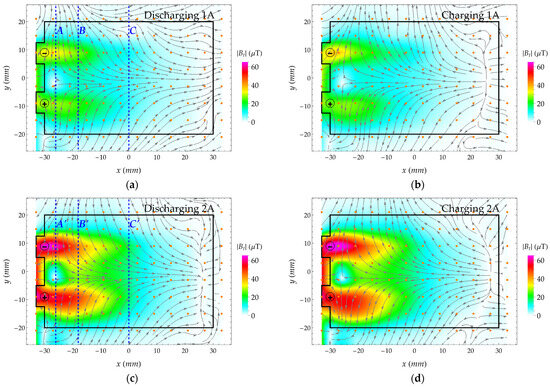
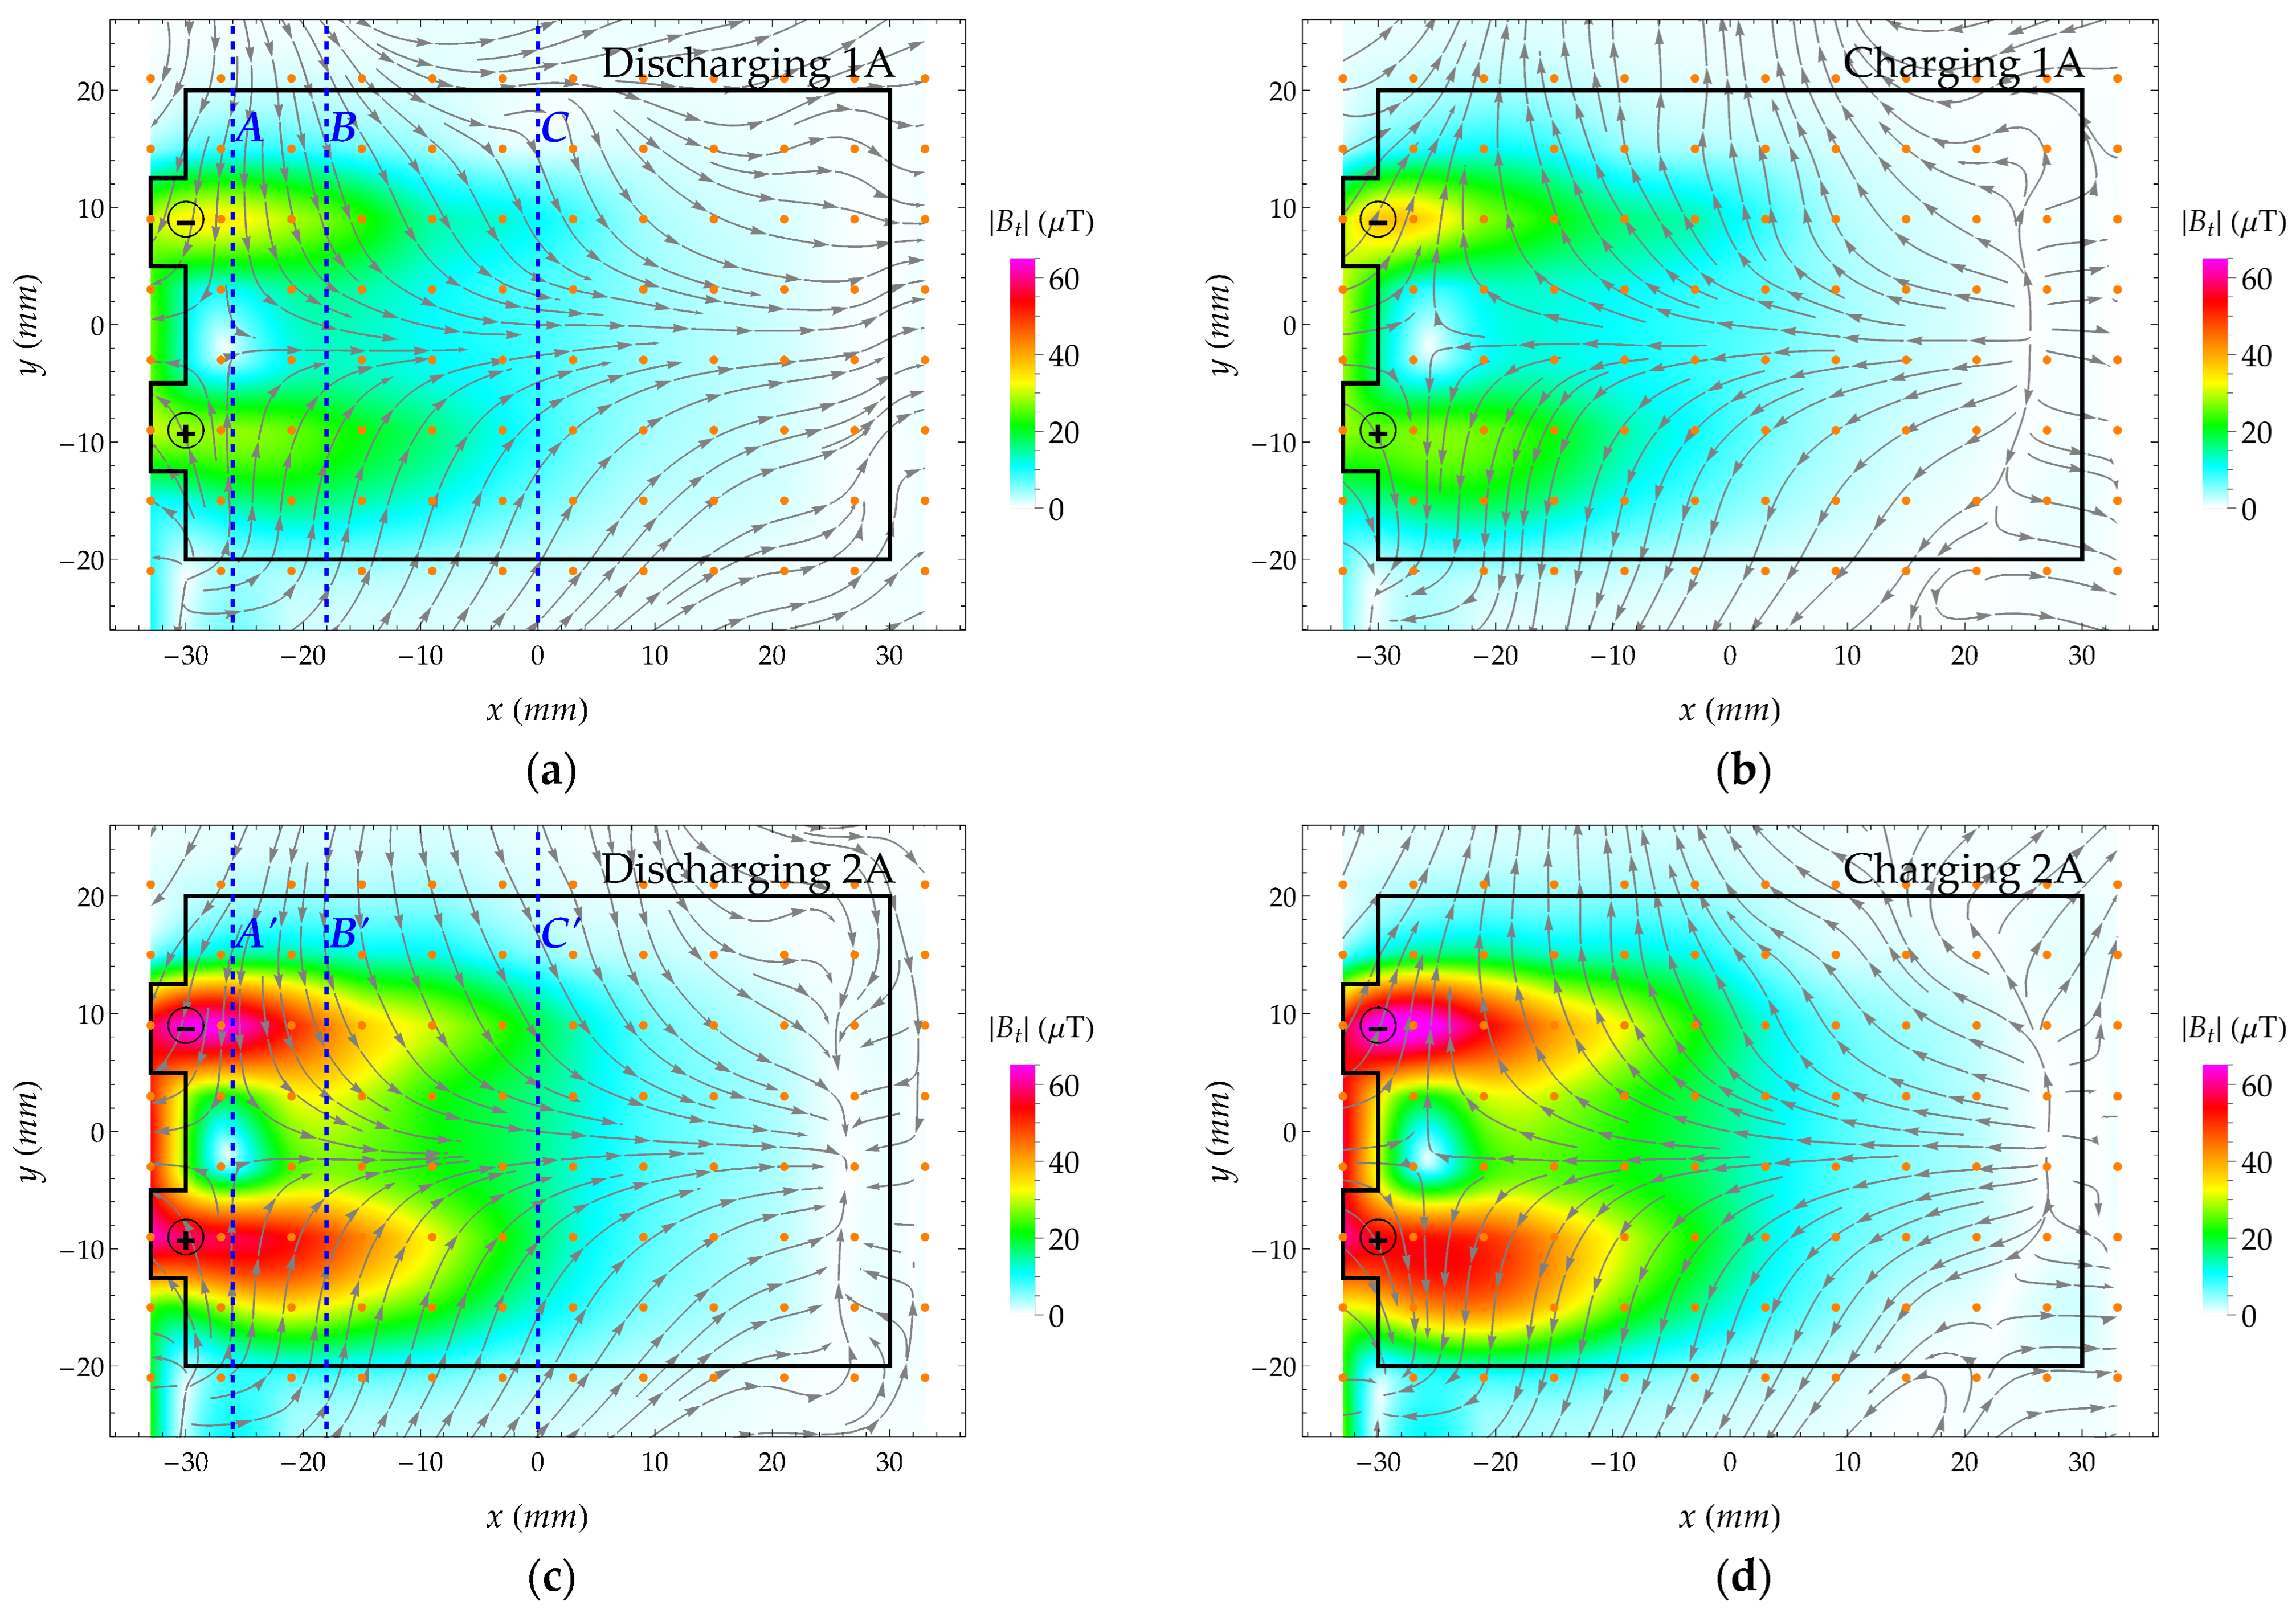
Figure 7 illustrates the measured B field near the battery surface under various conditions. For visual clarity, the maximum field values have been capped at 65 µT. Figure 7a,b depicts discharging and charging at a constant current of 1 A, whereas Figure 7c,d shows the same processes at 2 A. In each figure, color shading represents the magnitude of the tangential component of B, |Bt| (as defined in Section 3.1), arrows indicate the direction of the field lines, and the + and − symbols denote the battery’s positive and negative terminals. Additionally, the grid of orange dots represents the 144 measurement points employed to reconstruct the complete surface distribution through interpolation, as previously outlined.
Figure 7.
Measured magnetic field distribution at the battery surface shown in Figure 2c. (a,b) represent constant-current discharge and charge at 1 A, respectively, whereas (c,d) represent constant-current discharge and charge at 2 A.
The magnetic vector field pattern indicates a complex internal current flow within the battery. During discharging, as displayed in Figure 7a,c, where current exits through the positive terminal, the magnetic field near the terminals is predominantly vertical, as anticipated. However, farther from the terminals, particularly near the horizontal axis at the center of the battery, the rightward field suggests an upward vertical current path. Unlike the present case, the sample in Figure 5a,b exhibits a leftward magnetic field near the horizontal axis at its center, despite sharing a similar geometry and current path from the lower terminal. Analogous reasoning is also valid for the charging mode shown in Figure 7b,d. This intricate behavior reflects the specific internal architecture of the battery, the analysis of which lies beyond the scope of this study.
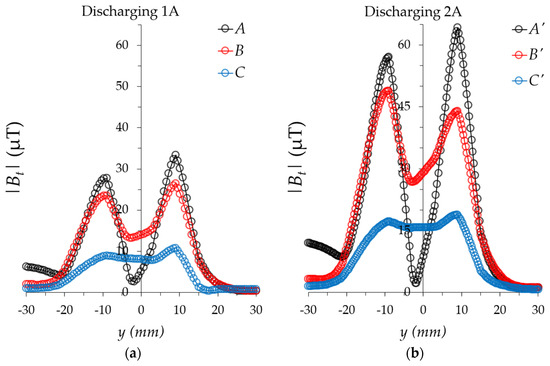
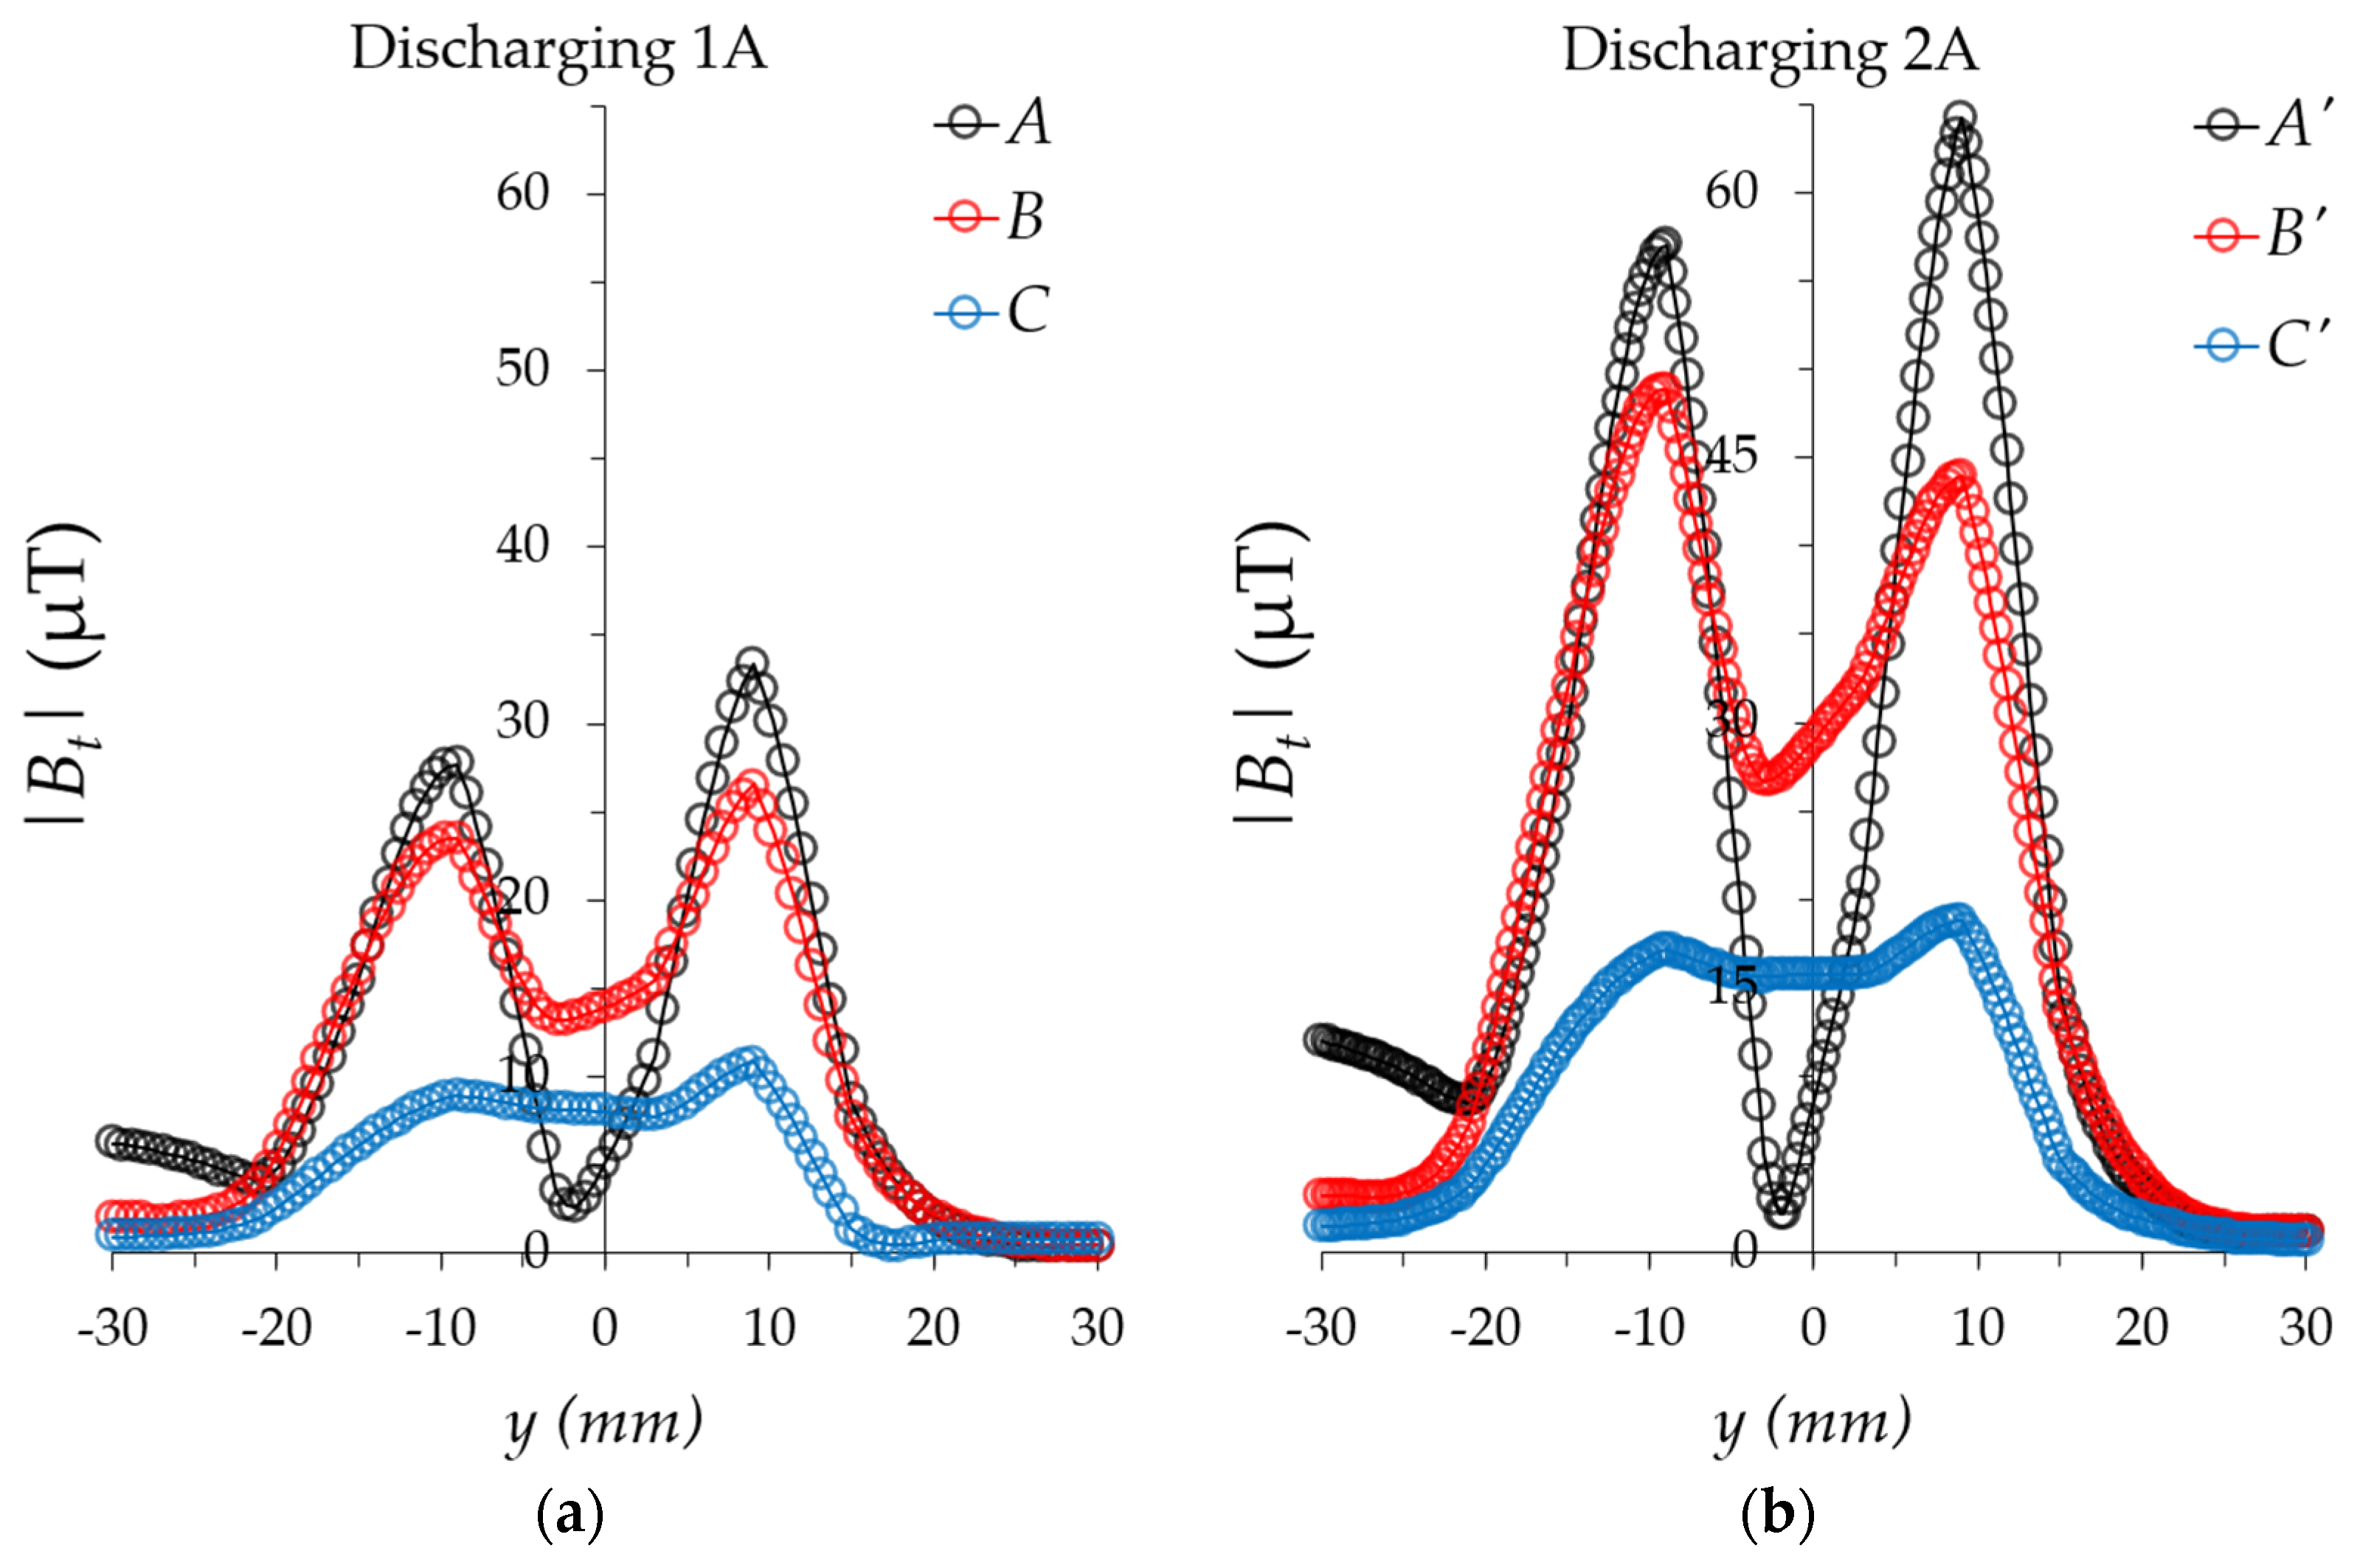
The vertical lines labeled A, B, C in Figure 7a and A′, B′, C′ in Figure 7c correspond to positions at x = −26 mm, −18 mm, and 0 mm. The field values along these lines, plotted as functions of y, are presented in Figure 8a,b. These plots reveal a slightly asymmetrical double-peak structure in the field near the terminals, as illustrated by curves A and B in Figure 8a and A′ and B′ in Figure 8b. Batteries with counter-side central alignment tabs have shown a similar effect, as noted in [26]. Such asymmetry likely arises from several factors: the configuration of internal current paths and electrode geometry, variations in conductivity and microstructure between anode and cathode materials that affect current distribution across the surface, and design elements such as external wiring and pad placement, which can further introduce imbalances in the magnetic field intensity [5]. Comparison of the field values during discharge at 1 A and 2 A indicates that the amplitude observed at 2 A is approximately twice that measured at 1 A, is agreement with the linear dependence of field intensity on current magnitude predicted by theory.
Figure 8.
Measured magnetic field versus battery width (y) at selected positions along its length, corresponding to the vertical dashed lines in Figure 7a,c. Field distribution during constant-current discharge is shown for 1 A in (a) and 2 A in (b). The lines in all curves in (a,b) are guides to the eye.
Furthermore, no significant quantitative difference in the field values has been observed between the discharging and charging modes, suggesting that the observed magnetic field behavior is predominantly governed by the charging/discharging current magnitude rather than the direction of charge transfer, as mentioned in Section 2.4. However, a transient phenomenon known as the recovery effect, where the battery voltage rises toward an equilibrium level after discharge and disconnection, is likely to produce a subtle magnetic signature in the pT range [43]. Ongoing work is focused on adapting the present system to measure magnetic susceptibility, thereby enhancing sensitivity into the pT/√Hz range.
The results presented in this section further demonstrate that the MFSA can measure the magnetic field distribution near the surface of a battery. From these measurements, the corresponding current distribution in the battery can be reconstructed using an inverse problem approach [8,44,45,46,47]. This analysis lies beyond the scope of the present work and will be pursued in future studies. As part of these efforts, we will also employ magnetic field measurements to characterize defects and critical internal behaviors in lithium-ion batteries, particularly those associated with localized heating and potential thermal runaway. An innovative visualization method was proposed in [26], where the current-induced magnetic field of the operating battery is canceled by the opposing field of a conductor with identical geometry placed beneath the cell and carrying the same current in the opposite direction. This suppression isolates the defect-related magnetic field, and future work will focus on implementing and evaluating this technique. Therefore, by associating magnetic field magnitude and direction with current distribution and electrochemical dynamics, SOC estimation can be achieved with greater precision under variable conditions. Lastly, note that different battery architectures may produce distinct magnetic field patterns; however, the proposed device aims to deliver relative measurements of these distributions. By linking a damaged battery to its magnetic field signature, a diagnostic framework can be established. In this study, the absolute magnetic field configuration at the surface is less relevant than the difference between the magnetic field patterns of a battery in normal operation and the same battery under abusive conditions.
4. Conclusions
We present the magnetic field sensor array (MFSA), consisting of 16 high-sensitivity magnetometers arranged in a 4 × 4 grid. This system is designed to capture all three components of a magnetic field within the µT range at 16 spatially distinct points separated by 6 mm both vertically and horizontally. In this work, we focus on mapping the magnetic field distribution near the surface of two planar copper samples and a low-power lithium-ion pouch battery. An experimental procedure was implemented to scan sample surfaces larger than the array and to interpolate field values between grid points. The main objective of this paper is to demonstrate the array’s capability to map magnetic fields while introducing a device with an inherently scalable structure. We are currently developing an 8 × 8 version of the system, which will enable mapping in a manner similar to a magnetic camera.
The B field of copper samples was numerically simulated using finite element analysis. The strong agreement between simulated and experimental measurements validated the accuracy of both the device and the experimental procedure, enabling reliable evaluation of the unknown magnetic field of a battery under both charging and discharging conditions. The device operated effectively without requiring a magnetic shield, owing to its built-in set/reset degaussing function, which facilitates future deployment in field applications. The results demonstrate the array’s potential for capturing magnetic signatures associated with battery operation. A follow-up study will explore its use in identifying faulty conditions in lithium-ion batteries.
Future work will focus on increasing the sensor density within the MFSA to enable the analysis of larger samples and capture temporal fluctuations in a magnetic field. Expanding the sensing area will allow for comprehensive surface mapping of samples smaller than the grid dimensions. Additionally, we aim to extend this research toward characterizing battery aging and state of health through magnetic field measurements. Planned experiments include subjecting batteries to control external stresses (thermal, mechanical, and electrical) while monitoring magnetic field variations. Establishing correlations between abnormal behavior and magnetic signatures is expected to reinforce the MFSA’s potential as a robust tool for battery safety diagnostics.
Author Contributions
Conceptualization, C.H.L. and L.G.C.M.; methodology, L.G.C.M.; software, C.H.L.; validation, L.G.C.M. and C.H.L.; formal analysis, L.G.C.M.; investigation, L.G.C.M. and C.H.L.; data curation, L.G.C.M.; writing—original draft preparation, L.G.C.M.; writing—review and editing, L.G.C.M. and C.H.L.; project administration, L.G.C.M.; funding acquisition, L.G.C.M. All authors have read and agreed to the published version of the manuscript.
Funding
This research was funded by Institut de Recherche Robert-Sauvé en Santé et en Sécurité du Travail (IRSST), grant number 2024-0041.
Institutional Review Board Statement
Not applicable.
Informed Consent Statement
Not applicable.
Data Availability Statement
The original contributions presented in this study are included in the article. Further inquiries can be directed to the corresponding author.
Acknowledgments
During the preparation of this study, the authors used Copilot (GPT-5) for the purposes of up-dating the Fortran code for numerically solving double integrals of the Biot–Savart law. The authors have reviewed and edited the output and take full responsibility for the content of this publication.
Conflicts of Interest
The authors declare no conflicts of interest. The funders had no role in the design of the study; in the collection, analyses, or interpretation of data; in the writing of the manuscript; or in the decision to publish the results.
References
- Costa, C.M.; Merazzo, K.J.; Goncalves, R.; Amos, C.; Lanceros-Mendez, S. Magnetically active lithium-ion batteries towards battery performance improvement. iScience 2021, 24, 102691. [Google Scholar] [CrossRef] [Scilit]
- Nduka, E.I.; Assan, N.; Yegamkulov, M.; Mukanova, A.; Bakenov, Z. Effect of magnetic field on the rate performance of a Fe2O3/LiFePO4 composite cathode for Li-ion batteries. RSC Adv. 2024, 14, 36005–36015. [Google Scholar] [CrossRef] [Scilit]
- Eto, A.; Akimoto, Y.; Okajima, K.; Okano, J.; Onoue, Y. Evaluation of lithium-ion batteries with different structures using magnetic field measurement for onboard battery identification. Green Energy Intell. Transp. 2025, 4, 100257. [Google Scholar] [CrossRef] [Scilit]
- Zhao, K.; Wan, X.; Lin, Y.; Wu, H.; Tan, X.; Zou, S.; Zhu, M.; Liu, J. Magnetic field-based non-destructive testing techniques for battery diagnostics. Adv. Energy Mater. 2024, 15, 2404295. [Google Scholar] [CrossRef] [Scilit]
- Lv, X.; Li, Q.; Wang, K. State monitoring of lithium-ion batteries based on in situ magnetic techniques: A review. Ionics 2025, 31, 7595–7613. [Google Scholar] [CrossRef] [Scilit]
- Yang, D.; Guo, H.; Wang, Y.; Wang, K. Research progress of lithium-ion battery monitoring technology based on noninvasive magnetic induction sensors. ACS Appl. Electron. Mater. 2025, 7, 4907–4923. [Google Scholar] [CrossRef] [Scilit]
- Khan, M.A.; Sun, J.; Li, B.; Przybysz, A.; Kosel, J. Magnetic sensors-A review and recent technologies. Eng. Res. Express 2021, 3, 22005. [Google Scholar] [CrossRef] [Scilit]
- Huang, G.-W.; Jeng, J.-T. Implementation of 16-channel AMR sensor array for quantitative mapping of two-dimension current distribution. IEEE Trans. Magn. 2018, 54, 6500605. [Google Scholar] [CrossRef] [Scilit]
- Wu, X.; Huang, H.; Peng, L.; Huang, Y.; Wang, Y. Algorithm research on the conductor eccentricity of a circular dot matrix Hall high current sensor for ITER. IEEE Trans. Plasma Sci. 2022, 50, 1962–1970. [Google Scholar] [CrossRef] [Scilit]
- Wang, X.; Zhang, S.; Song, J.; Liu, Y.; Lu, S. Magnetic signal denoising based on auxiliary sensor array and deep noise reconstruction. Eng. Appl. Artif. Intell. 2023, 125, 106713. [Google Scholar] [CrossRef] [Scilit]
- Lin, M.-Y.; Hsieh, S.-H.; Chen, C.-H.; Lin, C.-H. High-performance chip design with parallel architecture for magnetic field imaging system. IEEE Trans. Instrum. Meas. 2024, 73, 9502313. [Google Scholar] [CrossRef] [Scilit]
- Wang, T.; Liu, H.; Wang, W.; Yu, C. Research on charging monitoring method for lithium-ion batteries based on magnetic field sensing. Int. J. Electrochem. Sci. 2024, 19, 100711. [Google Scholar] [CrossRef] [Scilit]
- Zhang, Q.; Shang, Y.; Li, Y.; Zhu, R. A concise review of power batteries and battery management systems for electric and hybrid vehicles. Energies 2025, 18, 3750. [Google Scholar] [CrossRef] [Scilit]
- Waag, W.; Fleischer, C.; Sauer, D.U. Critical review of the methods for monitoring of lithium-ion batteries in electric and hybrid vehicles. J. Power Sources 2014, 258, 321–339. [Google Scholar] [CrossRef] [Scilit]
- Taborelli, C.; Onori, S.; Maes, S.; Sveum, P.; Hallaj, S.A.; Khayat, N.A. Advanced battery management system design for SOC/SOH estimation for e-bikes applications. Int. J. Powertrains 2016, 5, 325. [Google Scholar] [CrossRef] [Scilit]
- Kaliaperumal, M.; Dharanendrakumar, M.S.; Prasanna, S.; Abhishek, K.V.; Chidambaram, R.K.; Adams, S.; Zaghib, K.; Reddy, M.V. Cause and mitigation of lithium-ion battery failure-a review. Materials 2021, 14, 5676. [Google Scholar] [CrossRef] [Scilit]
- Koch, D.; Schweiger, H.-G. Possibilities for a quick onsite safety-state assessment of stand-alone lithium-ion batteries. Batteries 2022, 8, 213. [Google Scholar] [CrossRef] [Scilit]
- Gade, R.; Moeslund, T.B. Thermal cameras and applications: A survey. Mach. Vis. Appl. 2013, 25, 245–262. [Google Scholar] [CrossRef] [Scilit]
- Kim, H.-J.; Lee, J.-H.; Baek, D.-H.; Lee, J.-K. A study on thermal performance of batteries using thermal imaging and infrared radiation. J. Ind. Eng. Chem. 2017, 45, 360–365. [Google Scholar] [CrossRef] [Scilit]
- Kafadarova, N.; Sotirov, S.; Herbst, F.; Stoynova, A.; Rizanov, S. A System for determining the surface temperature of cylindrical lithium-ion batteries using a thermal imaging camera. Batteries 2023, 9, 519. [Google Scholar] [CrossRef] [Scilit]
- Glavaš, H.; Barić, T.; Karakašić, M.; Keser, T. Application of infrared thermography in e-bike battery pack detail analysis—Case study. Appl. Sci. 2022, 12, 3444. [Google Scholar] [CrossRef] [Scilit]
- Chacón, X.C.A.; Laureti, S.; Ricci, M.; Cappuccino, G. A Review of non-destructive techniques for lithium-ion battery performance analysis. World Electr. Veh. J. 2023, 14, 305. [Google Scholar] [CrossRef] [Scilit]
- Lee, M.; Lee, J.; Shin, Y.; Lee, H. Multiscale imaging techniques for real-time, noninvasive diagnosis of li-ion battery failures. Small Sci. 2023, 3, 2300063. [Google Scholar] [CrossRef] [Scilit]
- Goutam, S.; Timmermans, J.-M.; Omar, N.; Van Den Bossche, P.; Van Mierlo, J.; Rodriguez, L.M.; Nerea, N.; Swierczynski, M. Surface temperature evolution and the location of maximum and average surface temperature of a lithium-ion pouch cell under variable load profiles. In Proceedings of the European Electric Vehicle Congress, Brussels, Belgium, 3–5 December 2014. [Google Scholar]
- Hu, W.; Peng, Y.; Wei, Y.; Yang, Y. Application of Electrochemical Impedance Spectroscopy to Degradation and Aging Research of Lithium-Ion Batteries. J. Phys. Chem. C 2023, 127, 4465–4495. [Google Scholar] [CrossRef] [Scilit]
- Lee, M.; Shin, Y.; Chang, H.; Jin, D.; Lee, H.; Lim, M.; Seo, J.; Band, T.; Kaufmann, K.; Moon, J.; et al. Diagnosis of current flow patterns inside fault-simulated li-ion batteries via non-invasive, in operando magnetic field imaging. Small Methods 2023, 7, e2300748. [Google Scholar] [CrossRef] [Scilit]
- Bai, X.; Peng, D.; Chen, Y.; Ma, C.; Qu, W.; Liu, S.; Luo, L. Three-dimensional electrochemical-magnetic-thermal coupling model for lithium-ion batteries and its application in battery health monitoring and fault diagnosis. Sci. Rep. 2024, 14, 10802. [Google Scholar] [CrossRef] [Scilit] [PubMed]
- Bason, M.G.; Coussens, T.; Withers, M.; Abel, C.; Kendall, G.; Krüger, P. Non-invasive current density imaging of lithium-ion batteries. J. Power Sources 2022, 533, 231312. [Google Scholar] [CrossRef] [Scilit]
- Zhao, H.; Zhan, Z.; Cui, B.; Wang, Y.; Yin, G.; Han, G.; Xiang, L.; Du, C. Non-destructive detection techniques for lithium-ion batteries based on magnetic field characteristics-A model-based study. J. Power Sources 2024, 604, 234511. [Google Scholar] [CrossRef] [Scilit]
- Brauchle, F.; Grimsmann, F.; von Kessel, O.; Birke, K.P. Defect detection in lithium ion cells by magnetic field imaging and current reconstruction. J. Power Sources 2023, 558, 232587. [Google Scholar] [CrossRef] [Scilit]
- Mohammadi Moradian, J.; Ali, A.; Yan, X.; Pei, G.; Zhang, S.; Naveed, A.; Shehzad, K.; Shahnavaz, Z.; Ahmad, F.; Yousaf, B. Sensors innovations for smart lithium-based batteries: Advancements, opportunities, and potential challenges. Nano-Micro Lett. 2025, 17, 279. [Google Scholar] [CrossRef] [Scilit]
- Suzuki, S.; Okada, H.; Yabumoto, K.; Matsuda, S.; Mima, Y.; Kimura, N.; Kimura, K. Non-destructive visualization of short circuits in lithium-ion batteries by a magnetic field imaging system. Jpn. J. Appl. Phys. 2021, 60, 56502. [Google Scholar] [CrossRef] [Scilit]
- Wang, H.; Yu, K.; Mao, L.; He, Q.; Wu, Q.; Li, Z. Evaluation of lithium-ion battery pack capacity consistency using one-dimensional magnetic field scanning. IEEE Trans. Instrum. Meas. 2022, 71, 3507610. [Google Scholar] [CrossRef] [Scilit]
- Green, J.E.; Stone, D.A.; Foster, M.P.; Tennant, A. Spatially resolved measurements of magnetic fields applied to current distribution problems in batteries. IEEE Trans. Instrum. Meas. 2015, 64, 951–958, 951. [Google Scholar] [CrossRef] [Scilit]
- Mukhatov, A.; Le, T.A.; Pham, T.T.; Do, T.D. A comprehensive review on magnetic imaging techniques for biomedical applications. Nano Sel. 2023, 4, 213–230, 213. [Google Scholar] [CrossRef] [Scilit]
- Cai, J.; Zhou, T.; Xu, Y.; Zhu, X. A high-resolution magnetic field imaging system based on the unpackaged hall element array. Appl. Sci. 2024, 14, 5788. [Google Scholar] [CrossRef] [Scilit]
- Egli, R. Magnetic characterization of geologic materials with first-order reversal curves. In Magnetic Measurement Techniques for Materials Characterization; Franco, V., Dodrill, B., Eds.; Springer International Publishing: Cham, Switzerland, 2021; pp. 455–604. [Google Scholar]
- Li, W.; Wang, J. Magnetic sensors for navigation applications: An overview. J. Navig. 2013, 67, 263–275, 263. [Google Scholar] [CrossRef] [Scilit]
- MMC5983MA-AMR Magnetometer-MEMSIC Semiconductor Co., Ltd. 2025. Available online: https://www.memsic.com/magnetometer-5 (accessed on 19 November 2025).
- Pan, L.; Xie, Y.; Yang, H.; Li, M.; Bao, X.; Shang, J.; Li, R.W. Flexible magnetic sensors. Sensors 2023, 23, 4083. [Google Scholar] [CrossRef] [Scilit]
- Press, W.H.; Teukolsky, S.A.; Vetterling, W.T.; Flannery, B.P. Numerical Recipes: The Art of Scientific Computing; Cambridge University Press: Cambridge, UK, 2007. [Google Scholar]
- Meeker, D.C. Finite Element Method Magnetics, Version 4.2; 28 February 2018 Build. Available online: https://www.femm.info (accessed on 19 November 2025).
- Hu, Y.; Iwata, G.Z.; Mohammadi, M.; Silletta, E.V.; Wickenbrock, A.; Blanchard, J.W.; Budker, D.; Jerschow, A. Sensitive magnetometry reveals inhomogeneities in charge storage and weak transient internal currents in Li-ion cells. Proc. Natl. Acad. Sci. USA 2020, 117, 10667–10672. [Google Scholar] [CrossRef] [Scilit] [PubMed]
- Brauchle, F.; Grimsmann, F.; von Kessel, O.; Birke, K.P. Direct measurement of current distribution in lithium-ion cells by magnetic field imaging. J. Power Sources 2021, 507, 230292. [Google Scholar] [CrossRef] [Scilit]
- Kishimoto, Y.; Togo, T.; Kobayashi, Y.; Ohtsuka, T.; Amaya, K. Estimation method of current density between laminated thin sheets by inverse analysis of magnetic field (Application to short circuit localization). Mech. Eng. J. 2016, 3, 16-00046. [Google Scholar] [CrossRef] [Scilit]
- Roth, B.J.; Sepulveda, N.G.; Wikswo, J.P. Using a magnetometer to image a two-dimensional current distribution. J. Appl. Phys. 1989, 65, 361–372. [Google Scholar] [CrossRef] [Scilit]
- Kress, R.; Khun, L.; Potthast, R. Reconstruction of a current distribution from its magnetic field. Inverse Probl. 2002, 18, 1127–1146. [Google Scholar] [CrossRef] [Scilit]
Disclaimer/Publisher’s Note: The statements, opinions and data contained in all publications are solely those of the individual author(s) and contributor(s) and not of MDPI and/or the editor(s). MDPI and/or the editor(s) disclaim responsibility for any injury to people or property resulting from any ideas, methods, instructions or products referred to in the content. |
© 2026 by the authors. Licensee MDPI, Basel, Switzerland. This article is an open access article distributed under the terms and conditions of the Creative Commons Attribution (CC BY) license.