


Featured Application
The findings of this study can be applied to the development of whey yogurt formulations in dairy processing, particularly for the valorization of liquid whey as a dairy by-product. The optimized formulation provides a practical basis for incorporating a substantial proportion of whey while maintaining desirable physical stability during refrigerated storage. The constrained mixture-design approach can also be applied as a formulation tool for balancing multiple quality responses during the development of other fermented dairy products containing whey or similar dairy by-products.
Abstract
The valorization of whey, a major dairy-processing by-product, represents an important strategy for improving resource efficiency, supporting sustainable dairy production, and diversifying fermented dairy products. However, increasing whey incorporation into yogurt may affect gel stability and water retention during storage. This study aimed to develop and optimize a whey yogurt formulation using a constrained mixture-design approach, with milk, liquid whey, and skim milk powder (SMP) as formulation components. Twenty-two randomized experimental runs were conducted, including 13 formulations in the first batch and nine repeated formulations in a second batch. The mixture design was constrained to 40–100% milk, 0–50% whey, and 0–10% SMP, with the components summing to 100%. A multi-response approach was applied to evaluate syneresis, water-holding capacity (WHC), and pH after 1, 7, and 14 days of refrigerated storage, together with total phenolic content (TPC) and microbiological quality. The experimental data were analyzed using Design-Expert software (Version 13, Stat-Ease Inc., Minneapolis, MN, USA)), and mixture models were evaluated using analysis of variance and model-adequacy statistics. Numerical optimization was performed using a desirability-function approach, with minimization of syneresis and maximization of WHC as the principal optimization objectives. TPC was evaluated as a supplementary response but was not included in the final optimization because an adequate predictive model was not established. During storage, pH decreased, indicating progressive post-acidification, while syneresis and WHC varied among formulations and storage periods. The optimized formulation consisted of 52.665% milk, 38.948% whey, and 8.388% SMP, with an overall desirability of 0.754. The predicted syneresis and WHC values were 52.337 mL/100 mL and 48.442% on day 1, 53.231 mL/100 mL and 48.902% on day 7, and 50.913 mL/100 mL and 52.329% on day 14, respectively, while the predicted pH values were 4.361, 4.273, and 4.154. The numerical optimum was further evaluated using two independent confirmation runs, showing reasonable agreement between the predicted and experimental syneresis and pH values. TPC results showed considerable variation among the formulations, reflecting differences in the phenolic content of the developed yogurts, while microbiological analysis showed variable results among the experimental runs. Overall, the findings demonstrate the applicability of constrained mixture-design methodology for balancing whey utilization with yogurt physical stability and highlight the potential of liquid whey valorization as a sustainable strategy for fermented dairy product development.
1. Introduction
Whey is a major dairy by-product generated during cheese and other dairy processing. Although traditionally treated as a residual stream, whey contains lactose, soluble proteins, minerals, and other water-soluble nutrients that can be recovered through food applications. Its incorporation into value-added dairy products can therefore support more efficient use of milk constituents, reduce the need for disposal, and create additional value within the dairy production chain [1,2,3,4,5]. Recent reviews and case studies emphasize that whey valorization is increasingly viewed within a circular-bioeconomy framework, with food and beverage applications providing practical routes for converting a nutrient-rich by-product into value-added products [4,5]. Recent research on whey-based beverages and whey-enriched fermented products further demonstrates the feasibility of converting this by-product into foods with desirable technological characteristics. The valorization of whey is particularly relevant for small and medium dairy processors, where direct disposal may represent both an environmental burden and a loss of potentially useful nutrients.
A mixture-design approach is well suited to this problem because the formulation variables are proportions constrained to a constant total rather than independent process factors. In a mixture experiment, changing one component necessarily changes the relative contribution of the other components, making conventional one-factor-at-a-time experimentation inefficient for formulation development. Cornell [6] established the statistical framework for mixture experiments, and Galvan et al. [7] summarized their broad application in food and beverage formulation. Mixture and desirability approaches have also been successfully applied to yogurt, dairy powders, beverages, and other food matrices [8,9,10,11,12,13,14]. Recent dairy studies demonstrate the value of combining constrained mixture formulations with simultaneous optimization of several quality responses, including syneresis, texture, and storage behavior. For example, recent work on milk–whey mixtures used desirability-based optimization to identify balanced milk and whey proportions, while recent stirred-yogurt research showed that mixture optimization can identify formulations that satisfy multiple physical and sensory targets simultaneously [13,14].
Storage stability is especially important for whey yogurt because continued post-acidification and structural rearrangement of the protein network can progressively modify pH, syneresis, WHC, texture, and sensory quality [15,16,17]. Bierzuńska et al. [16] demonstrated that whey-protein modification can improve water retention and reduce syneresis during refrigerated storage, while Brodziak et al. [17] showed that whey-protein addition interacts with starter culture and storage time to affect yogurt physicochemical properties. The research of Hyseni [18] also observed high syneresis by day 21 in a formulation containing 75% milk and 25% whey, providing a direct motivation for evaluating formulation-dependent storage stability in the present work. In addition, Hyseni et al. [19,20] reported that liquid-whey incorporation can be used successfully in yogurt formulations supplemented with fruit ingredients, but the effects of formulation on texture and sensory properties underline the need for systematic control of the milk–whey balance. More recently, Hyseni et al. [21] evaluated yogurt produced with 25% liquid whey and fruit supplementation and reported that Enterobacteriaceae and Escherichia coli were not detected during storage, further supporting the feasibility of liquid-whey incorporation in fermented yogurt systems.
The balance between milk, whey, and skim milk powder (SMP) is therefore particularly important in whey yogurt. Whey can provide soluble proteins and lactose but, when used at high proportions, can alter the total solids and casein environment of the formulation. Previous studies have shown that dairy protein supplementation can modify acidification kinetics, rheological properties, firmness, and microstructure [22]. Whey protein concentrates have also been reported to influence the physical properties of yogurt [23], while changes in the casein-to-whey protein ratio can modify protein interactions and coagulation behavior [24,25]. SMP contributes additional protein and milk solids and can improve gel formation and water retention when incorporated at appropriate levels [22,26,27]. In a whey-containing yogurt system, Khadka and Timsina [27] reported lower syneresis with increasing SMP and also observed progressive changes in pH and syneresis during refrigerated storage. These findings indicate that formulation must be considered together with storage time rather than evaluated only immediately after fermentation.
Among the most important physical quality characteristics of yogurt are syneresis and water-holding capacity (WHC). Syneresis, or serum separation, represents the release of liquid from the protein network and is commonly associated with a weak or insufficiently compact gel structure. WHC describes the ability of the yogurt matrix to retain water against mechanical or storage-related stresses. These responses are closely related as formulations with stronger and more cohesive protein networks generally retain more serum and exhibit less visible whey separation [15,28]. Syneresis can be affected by total solids, protein concentration and type, casein-to-whey protein ratio, heat treatment, homogenization, starter culture, fermentation, cooling, and storage conditions [15]. Thus, increasing whey in a yogurt formulation cannot be considered only as a simple replacement of milk; it changes the composition of the protein system in which the acid-induced gel develops.
Yogurt provides a suitable matrix for whey utilization because its quality is determined by the composition of the milk base, protein interactions, fermentation conditions, and subsequent refrigerated storage. Yogurt is produced mainly through the activity of Streptococcus thermophilus and Lactobacillus delbrueckii subsp. bulgaricus, which convert lactose to lactic acid and progressively reduce the pH of the milk. As acidification proceeds, casein micelles lose their colloidal stability and aggregate to form a three-dimensional protein network. Heat treatment also promotes denaturation of whey proteins, which can associate with κ-casein and subsequently participate in the developing gel structure. Consequently, changes in the relative amounts of casein, whey proteins, and other milk solids can alter gel formation, network strength, serum immobilization, and the rheological properties of the final yogurt [15,22,26,28].
Despite these advances, limited work has addressed the simultaneous optimization of a three-component milk–whey–SMP yogurt system using multiple physical responses measured at several storage times together with pH as a storage-quality constraint. Evaluating syneresis and WHC only at one time point may overlook changes that develop during refrigerated storage. The present study therefore used a constrained randomized mixture design to characterize milk–whey–SMP formulations and to identify a formulation that simultaneously minimizes syneresis, maximizes WHC, and maintains an appropriate pH profile over 14 days. The objective was to formulate and optimize whey yogurt using milk, whey, and SMP as mixture components, with syneresis and WHC measured on days 1, 7, and 14 and pH incorporated into the final numerical optimization. The working hypothesis was that an appropriate balance of whey and SMP could permit substantial whey incorporation while maintaining the physical stability of the yogurt gel during refrigerated storage.
2. Materials and Methods
2.1. Raw Materials
Raw milk and cottage cheese whey were obtained from the same local dairy farm in Skopje, North Macedonia. The raw milk was collected from the farm, transported to the laboratory, and stored under refrigeration at 4 °C until yogurt preparation. The cottage cheese whey was produced at the same farm using milk from that farm. During cottage cheese production, the milk was initially pasteurized at 80–85 °C for 15 min and subsequently cooled to 30–35 °C. Rennet was then added to induce coagulation, and the milk was maintained until a stable curd formed. The curd was cut to facilitate whey separation, after which the whey was drained, filtered, packed in suitable containers, and stored under refrigeration at 4 °C until collection and subsequent use in the laboratory.
YO-FLEX® Express 1.0 starter culture (Chr. Hansen A/S, Hørsholm, Denmark), containing Streptococcus thermophilus and Lactobacillus bulgaricus, was used. Skimmed milk powder (SMP), medium-heat type, was supplied by Vita Nova, (Skopje, North Macedonia), and manufactured by Vinnitsa Dairy Plant Roshen (PrJSC “VDP “ROSHEN” Vinnytsia), Ukraine. According to the manufacturer’s specification, the product was produced from skimmed milk and was characterized by a moisture content below 4.0%, titratable acidity below 18 [29], a WPN value of 1.51–5.99, an insolubility index below 0.5 mL, and the absence of foreign materials. The skimmed milk powder had a fat content of <1.25%, lactose content of 54%, and protein content of >35%, as declared by the manufacturer.
2.2. Yogurt Manufacture
For yogurt preparation, the raw milk and cottage cheese whey were subjected to a second heat treatment at 85 ± 2 °C for 25 min in the laboratory before being cooled to the fermentation temperature of 45 ± 2 °C and inoculated with the starter culture. Formulations were prepared by combining the mixture components according to the experimental design and inoculated with 0.04% starter culture. Fermentation was conducted for 4 h at 43 °C. Yogurts were cooled and stored at 4–8 °C for 14 days.
2.3. Mixture Design
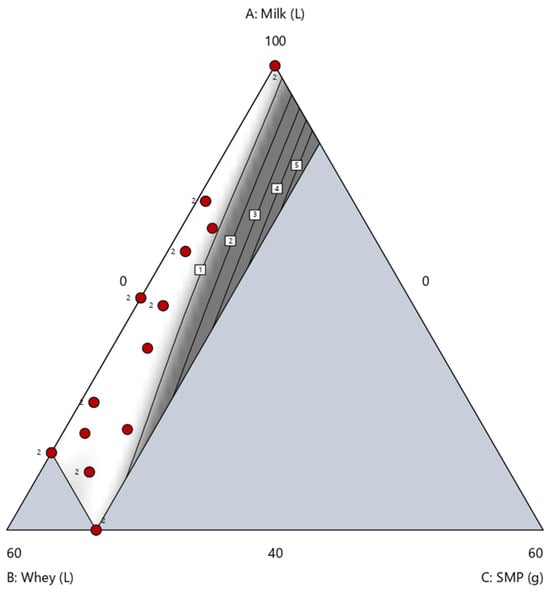
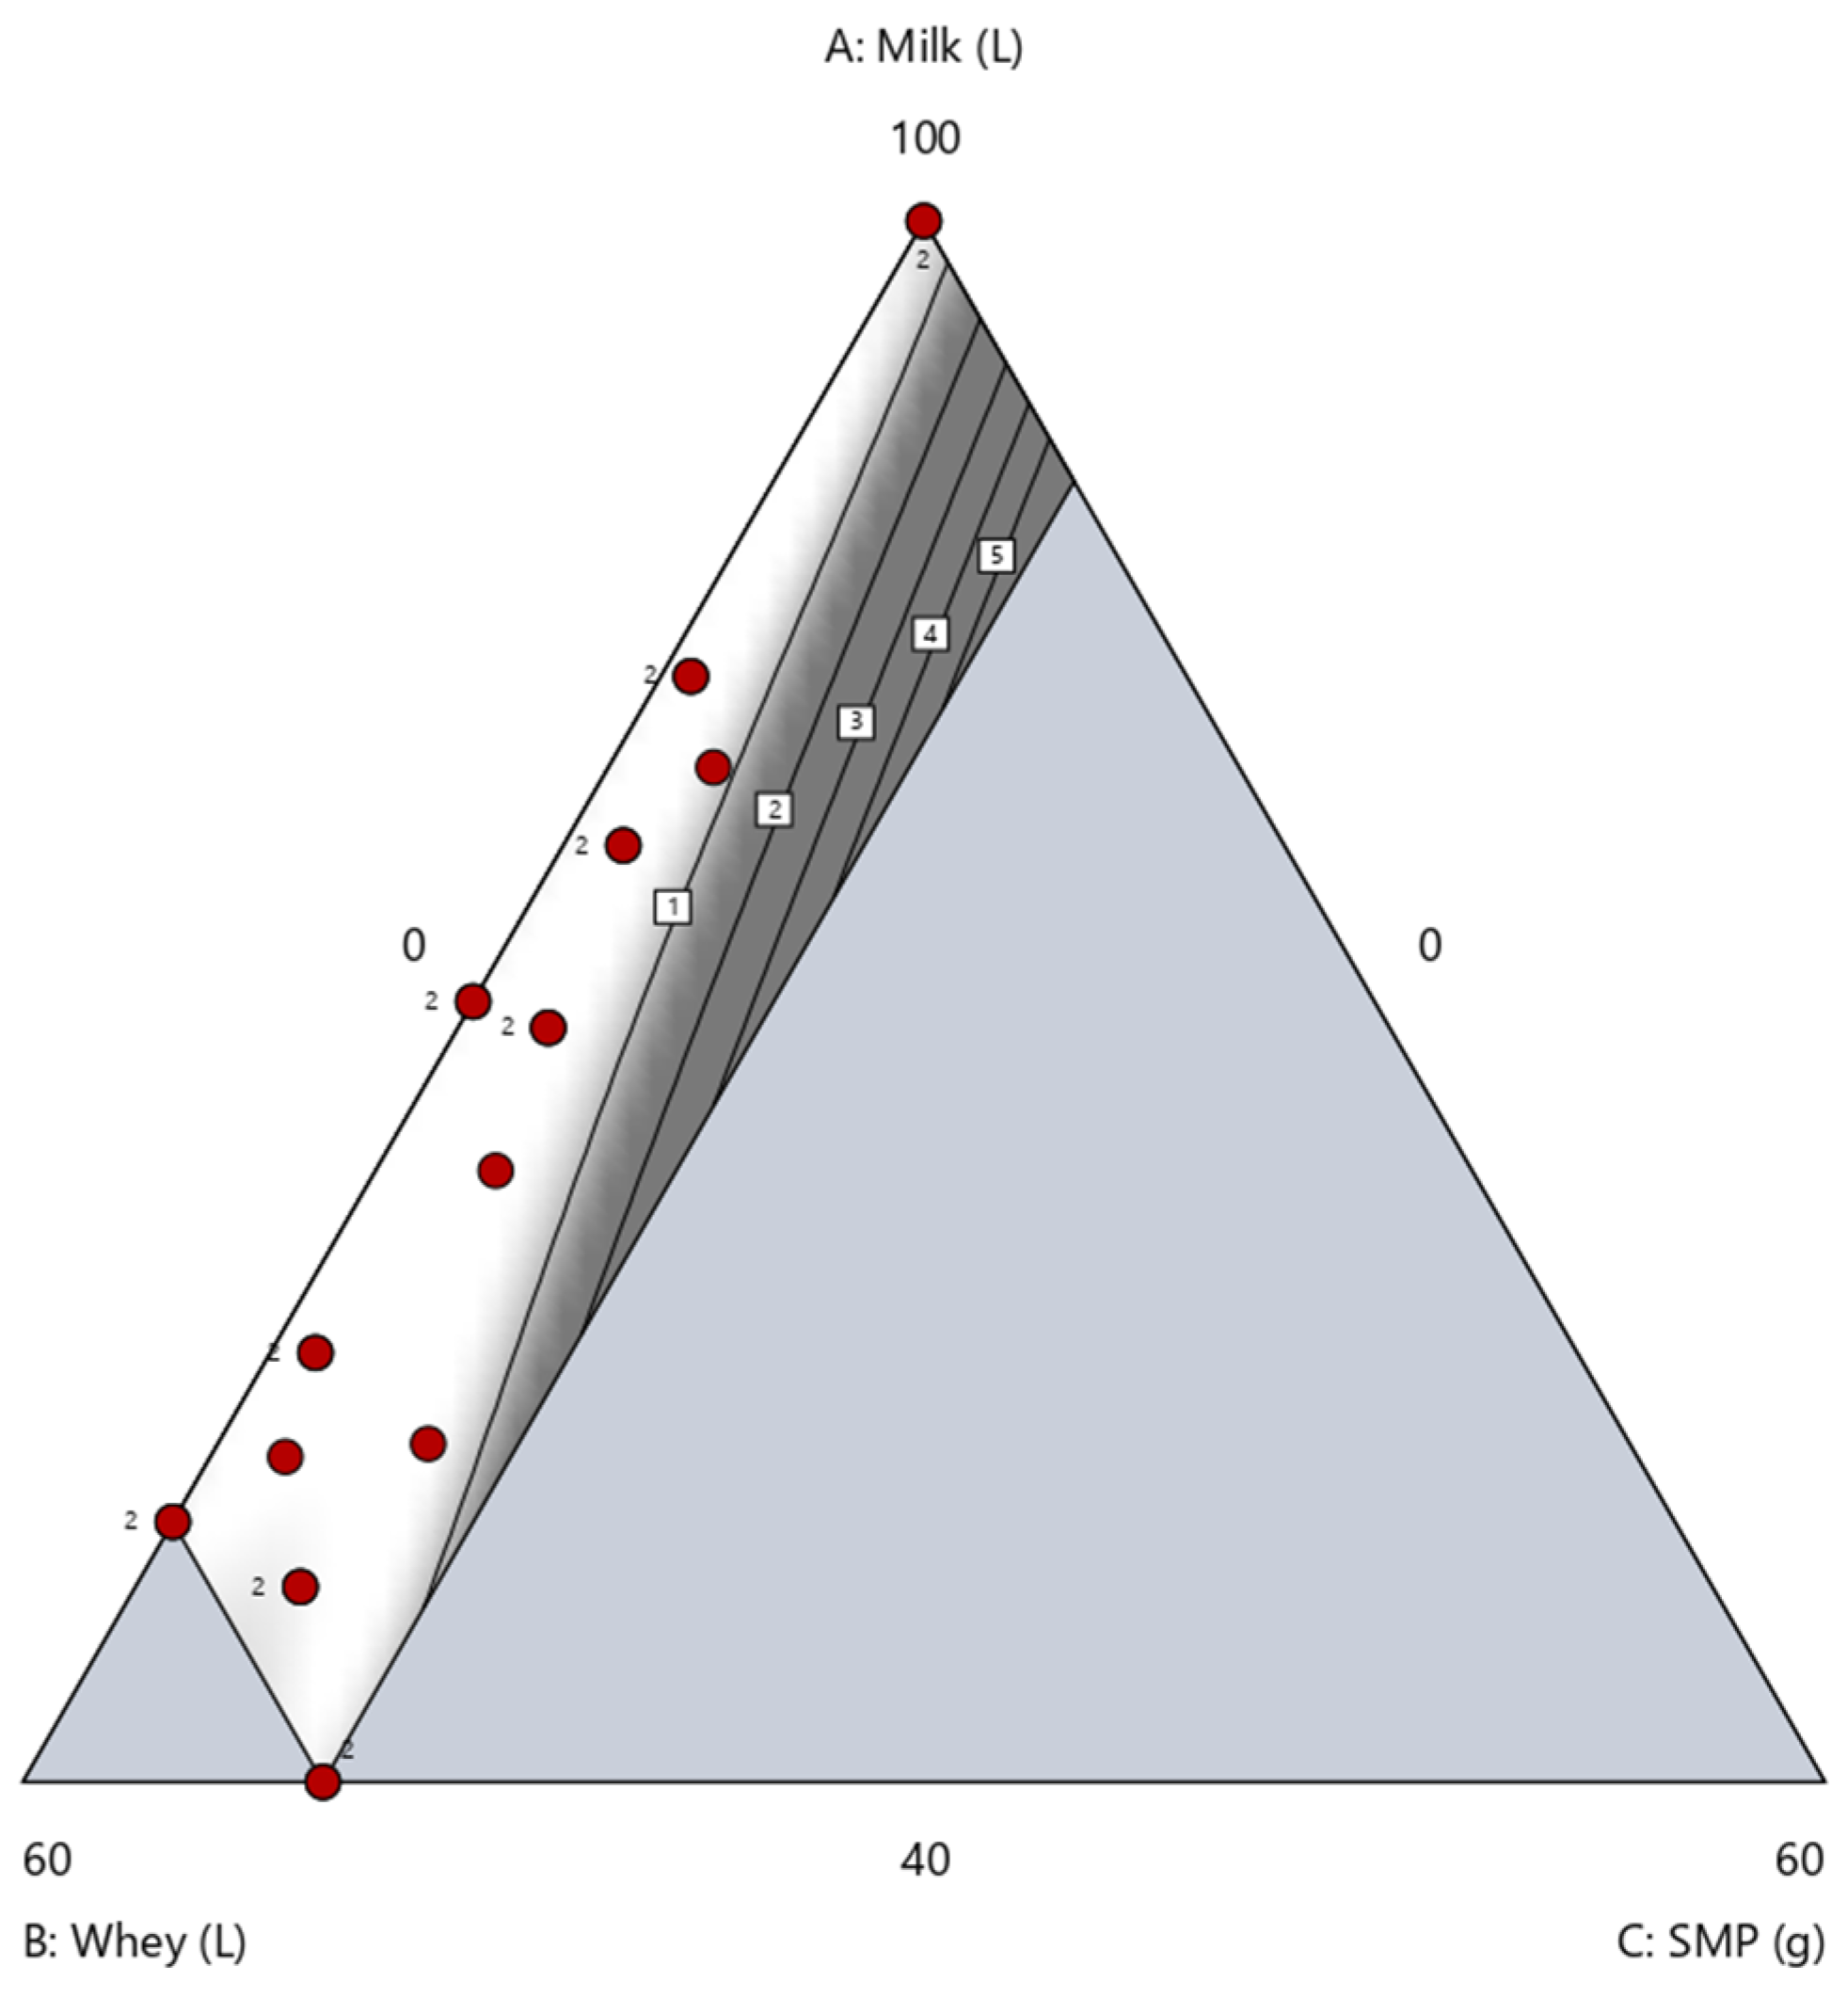
A mixture design was employed to investigate the effects of milk, whey, and skim milk powder (SMP) proportions on yogurt quality characteristics. The experimental design comprised 22 runs, including 13 initial formulations and 9 formulations independently prepared in a second batch to assess reproducibility. Each independently prepared formulation was treated as a separate experimental unit, and the responses from all 22 runs were included in the mixture-model analysis. The proportions of the three mixture components were varied within predefined formulation constraints and expressed exclusively as percentages: milk (A), 40–100%; whey (B), 0–50%; and SMP (C), 0–10%. The mixture constraint was (A + B + C = 100%) (Table S2). The distribution of the experimental runs within the formulation space is presented in Figure 1.
Figure 1.
Experimental formulation space and distribution of the 22 experimental runs generated using the mixture design. Red circles represent experimental design points, with adjacent numbers indicating the number of runs at overlapping mixture compositions. Shaded regions and numbered contour lines (1–5) represent the standard error of design, reflecting the variation in prediction precision across the mixture space.
Replicated formulations were included to estimate experimental error and assess lack of fit. Linear, quadratic, and higher-order mixture models were evaluated using Design-Expert. Model selection considered sequential model significance, lack of fit, adjusted R2, and predicted R2. The linear models were suggested for all responses, as the addition of higher-order terms did not significantly improve model performance and generally reduced predicted R2. Accordingly, linear models were retained as the most parsimonious options for describing the relationships between milk, whey, and skim milk powder within the investigated formulation domain. However, potential nonlinear effects cannot be completely excluded. Prior to processing, the physicochemical properties of the materials were determined. The physicochemical properties of the milk, whey and milk–whey mixtures were analyzed using a milk analyzer Lactoscan S (Milkotronic Ltd., Nova Zagora, Bulgaria). Table 1 presents the physicochemical properties of pasteurized milk, pasteurized whey, and the designed mixtures. Raw milk had a pH of 6.23, fat content of 4.02%, solids-non-fat (SNF) of 7.82%, lactose content of 4.37%, protein content of 2.86%, and a density of 1.027 g/cm3. Raw whey had a pH of 5.82, fat content of 0.62%, SNF of 7.03%, lactose content of 3.93%, protein content of 2.58%, and a density of 1.026 g/cm3.
Table 1.
Physicochemical properties of the pasteurized milk, pasteurized whey, and the designed mixtures.
2.4. pH, Syneresis and WHC
pH was measured with a Benchtop pH Meter-210 (BIOBASE, Jinan, China), on days 1, 7, and 14 after yogurt production.
Syneresis
Syneresis of the yogurts was evaluated by filtering the samples (100 mL) through Whatman filter paper number 1 (Whatman International Ltd., Maidstone, UK) overnight [30]. The volume of the obtained whey was calculated using the following formula:
where (Vw) is the volume of separated whey (mL) and (Vy) is the initial volume of the yogurt sample (mL). When a 100 mL yogurt sample was used, the numerical value of the measured whey volume in milliliters was equivalent to the syneresis response expressed in mL/100 mL. The resulting syneresis values were used as the response variable in the mixture-design statistical models and numerical optimization.
Syneresis (%) = (Vw/Vy) × 100
WHC
WHC was measured after centrifuging 5 g of yogurt at 3542× g for 20 min at 4 °C using an MPW-150R centrifuge (MPW MED. INSTRUMENTS, Warsaw, Poland). The calculation was:
WHC (%) = [1 − (whey weight/initial sample weight)] × 100
2.5. TPC
The analysis for determining the total phenolic content (TPC) of the yogurts was conducted using the method described by Nakov et al. [31]. All samples were analysed in triplicate. A blank sample was also prepared. In test tubes, 300 µL of the previously prepared supernatant was measured using an automatic pipette. Next, 1.5 mL of Folin–Ciocalteu reagent was added to all samples. The samples were left for 5 min before 1.5 mL of sodium carbonate solution was added. The samples were then vortexed and kept in the dark for 90 min. Absorbance was measured using an SP-UV1100 UV–Vis spectrophotometer (DLAB Scientific Co., Ltd., Beijing, China) at 760 nm.
2.6. Microbiological Analysis
Microbiological analysis of the yogurt samples was performed using standard microbiological procedures for food products. Samples were aseptically homogenized and serially diluted in sterile diluent. Appropriate dilutions were inoculated onto selective and non-selective culture media, including Columbia Blood Agar (CBA), ChromID™ CPS® (bioMérieux SA, Marcy-l’Étoile, France) Agar, and Salmonella-Shigella (SS) Agar for bacterial isolation, and Sabouraud Agar for the cultivation of yeasts and molds. Bacterial cultures were incubated at 37 °C for 24–48 h, whereas yeast and mold cultures were incubated at 25–30 °C for 48–72 h. Representative bacterial colonies were selected based on colony morphology and subjected to Gram staining and microscopic examination. The isolates were subsequently identified using the VITEK® 2 automated microbial identification system (bioMérieux, Marcy-l’Étoile, France) with appropriate identification cards. Identification was based on the biochemical profiles of the isolates generated by the VITEK® 2 system. The resulting identifications were used to characterize the bacterial microorganisms recovered from the yogurt samples.
2.7. Multi-Response Optimization
Design-Expert v13 was used for mixture modeling and numerical optimization. Model significance was assessed by ANOVA and adequacy by R2, adjusted R2, predicted R2, adequate precision, and lack of fit. Simultaneous numerical optimization used the Derringer–Suich desirability function [32]. Syneresis was minimized, WHC was maximized, and pH was included as a quality constraint according to the final Design-Expert optimization setup. The overall desirability represents the simultaneous satisfaction of the specified response goals.
The prediction error for confirmation experiments was calculated as:
Prediction error (%) = |Experimental − Predicted|/Predicted × 100
The original 22 design runs were used for model fitting; therefore, fitted-versus-observed agreement within those runs is reported as in-design prediction performance, not independent external validation.
3. Results
3.1. Syneresis and Water-Holding Capacity During Storage
Syneresis and water-holding capacity (WHC) of the yogurt formulations were evaluated on days 1, 7, and 14 of refrigerated storage. On day 1, syneresis values ranged from 48.5 to 69.5 mL/100 mL, while WHC ranged from 19.67 to 50.30%. On day 7, syneresis ranged from 50.5 to 67.0 mL/100 mL and WHC from 21.94 to 50.26%. On day 14, syneresis ranged from 48.0 to 69.5 mL/100 mL, whereas WHC ranged from 22.82 to 51.49%. These ranges indicate considerable variation among the formulations at each storage time (Table S1). The magnitude of syneresis differed among formulations throughout storage. On day 1, the lowest syneresis value was observed in R13 (48.5 mL/100 mL), whereas the highest value was observed in R2 (69.5 mL/100 mL). On day 7, syneresis values ranged from 50.5 mL/100 mL in R13 to 67.0 mL/100 mL in R16. On day 14, the lowest syneresis was recorded for R13 (48.0 mL/100 mL), while the highest value was observed in R16 (69.5 mL/100 mL). WHC also varied considerably among formulations. On day 1, values ranged from 19.67% in R3 to 50.30% in R13. On day 7, WHC ranged from 21.94% in R3 to 50.26% in R13. On day 14, the lowest WHC was observed in R3 (22.82%), whereas the highest value was recorded in R13 (51.49%). Thus, R13 maintained a comparatively high WHC throughout storage, while R3 consistently exhibited the lowest WHC. Changes in syneresis during storage varied among the formulations. Some formulations showed increased syneresis, whereas others showed decreased or relatively stable values from day 1 to day 14. For example, syneresis in R1 decreased from 57.0 to 48.5 mL/100 mL, while R8 decreased from 61.0 to 52.0 mL/100 mL. In contrast, R16 increased from 65.5 to 69.5 mL/100 mL. Similarly, changes in WHC differed among formulations. R1 increased from 41.88% on day 1 to 51.47% on day 14, and R8 increased from 38.89 to 45.05%. In contrast, R16 showed a slight decrease from 28.27 to 27.81%. The ratio and interactions of casein and whey proteins are particularly important because they influence protein aggregation, gel formation, and the resulting microstructure of yogurt [22,24,28]. The addition of whey proteins can also modify the physicochemical characteristics of yogurt and, depending on the formulation and processing conditions, affect both water retention and syneresis [17].
From a technological perspective, syneresis and WHC are important indicators of yogurt gel stability and water retention. Excessive serum separation can negatively affect the product’s physical appearance and potentially reduce consumer acceptability, whereas higher WHC generally reflects a greater capacity of the protein network to retain water during storage [15,28]. However, the practical significance of these responses depends on formulation, processing conditions, storage time, and the analytical methods used. Therefore, the observed values should be interpreted in the context of the specific yogurt system rather than against a universal acceptance threshold.
Overall, the results show substantial variation in both syneresis and WHC among the yogurt formulations during refrigerated storage. The direction and magnitude of changes from day 1 to day 14 were formulation-dependent, with some mixtures showing simultaneous reductions in syneresis and increases in WHC, while others showed the opposite pattern (Table S1).
3.2. pH During Storage
The pH of the yogurt formulations was monitored on days 1, 7, and 14 of refrigerated storage to evaluate acidification and post-acidification behavior. Initial pH values ranged from 4.11 to 4.85, with the lowest values observed in R17 (4.11), R18 (4.14), R1 (4.15), and R16 (4.17), whereas R12 (4.85) and R13 (4.73) showed the highest initial values. These differences indicate variation in the extent of acidification among formulations before or by the first day of storage. A progressive decrease in pH was observed in all formulations during storage, indicating continued post-acidification. This behavior is commonly observed in yogurt during refrigerated storage and is generally associated with continued metabolic activity of the yogurt starter cultures [16,17,22,27]. Similar storage-related pH changes have also been reported in whey-containing yogurt systems [4,20]. However, the magnitude of the decrease varied among formulations. The largest reduction from day 1 to day 14 was observed in R12, from 4.85 to 4.28, followed by R13, from 4.73 to 4.22. In contrast, R21 showed only a 0.07-unit decrease, from 4.23 to 4.16. R1 exhibited the lowest final pH (3.89), decreasing from 4.15 on day 1. These differences demonstrate that post-acidification was not uniform across the mixture formulations. The observed variation in post-acidification may be related to differences in starter activity and the composition of the milk–whey–skim milk powder matrix [16,17,22,27]. Because continued acidification can alter the casein protein network and consequently influence water retention and gel stability, pH should be considered together with syneresis and WHC [15,17,28]. Overall, all formulations underwent post-acidification during storage, but the extent of pH reduction differed considerably among mixtures.
3.3. Model Adequacy
The six principal physical responses were adequately represented by statistically significant linear mixture models with non-significant lack of fit. The strongest predictive performance was obtained for WHC on day 7 (R2 = 0.8027; predicted R2 = 0.7438), followed by WHC on days 1 and 14. Syneresis models showed more moderate predictive power but remained statistically adequate within the experimental domain.
W1: model p < 0.0001; R2 = 0.7161; adjusted R2 = 0.6862; predicted R2 = 0.6354; lack-of-fit p = 0.9996; adequate precision = 15.0176 (Table S3).
S1: model p = 0.0004; R2 = 0.5570; adjusted R2 = 0.5104; predicted R2 = 0.4135; lack-of-fit p = 0.5320; adequate precision = 10.6665 (Table S4).
W7: model p < 0.0001; R2 = 0.8027; adjusted R2 = 0.7820; predicted R2 = 0.7438; lack-of-fit p = 0.4077; adequate precision = 19.0819 (Table S3).
S7: model p = 0.0053; R2 = 0.4237; adjusted R2 = 0.3630; predicted R2 = 0.2142; lack-of-fit p = 0.9275; adequate precision = 8.1011 (Table S4).
W14: model p < 0.0001; R2 = 0.6949; adjusted R2 = 0.6628; predicted R2 = 0.6034; lack-of-fit p = 0.8244; adequate precision = 14.1593 (Table S3).
S14: model p = 0.0007; R2 = 0.5351; adjusted R2 = 0.4861; predicted R2 = 0.3569; lack-of-fit p = 0.9988; adequate precision = 9.9555 (Table S4).
For syneresis on day 7, the fitted linear mixture model was (S7 = 0.564076A + 0.696828B−0.431013C) (Table S5), where (A), (B), and (C) represent milk, whey, and skim milk powder, respectively. The model yielded an (R2) of 0.4237, an adjusted (R2) of 0.3630, and a predicted (R2) of 0.2142. The coefficient of variation was 5.75%, while the adequate precision value was 8.1011, exceeding the recommended threshold of 4. Although the model showed an adequate signal-to-noise ratio and described part of the variation in the experimental data, its relatively low predicted R2 indicates limited predictive reliability for new formulations. Therefore, predictions of syneresis on day 7 should be interpreted cautiously, particularly when used in numerical formulation optimization. The optimized formulation should consequently be considered a model-derived candidate within the investigated mixture region rather than definitive evidence of a technological optimum (Table S6).
3.4. Component Effects
Whey generally showed a positive contribution to syneresis, whereas SMP showed a negative contribution. For WHC, SMP showed a strong positive contribution and whey a negative contribution. Milk effects were response- and storage-dependent. This pattern agrees with the established role of protein composition and total solids in yogurt gel formation and water retention [15,22,23,24,33]. The result is consistent with Khadka and Timsina [27], who reported lower syneresis at higher SMP levels in whey yogurt, and with Arab et al. [15], who emphasized the joint effects of protein type, total solids, processing, and casein-to-whey protein balance.
3.5. Final Multi-Response Optimization
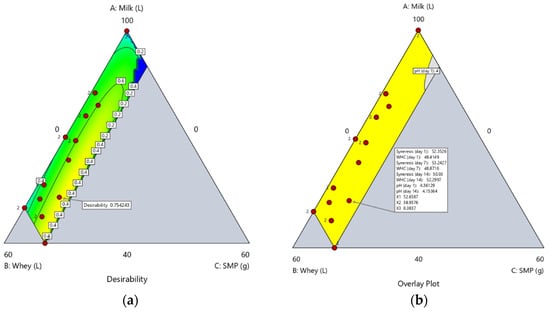
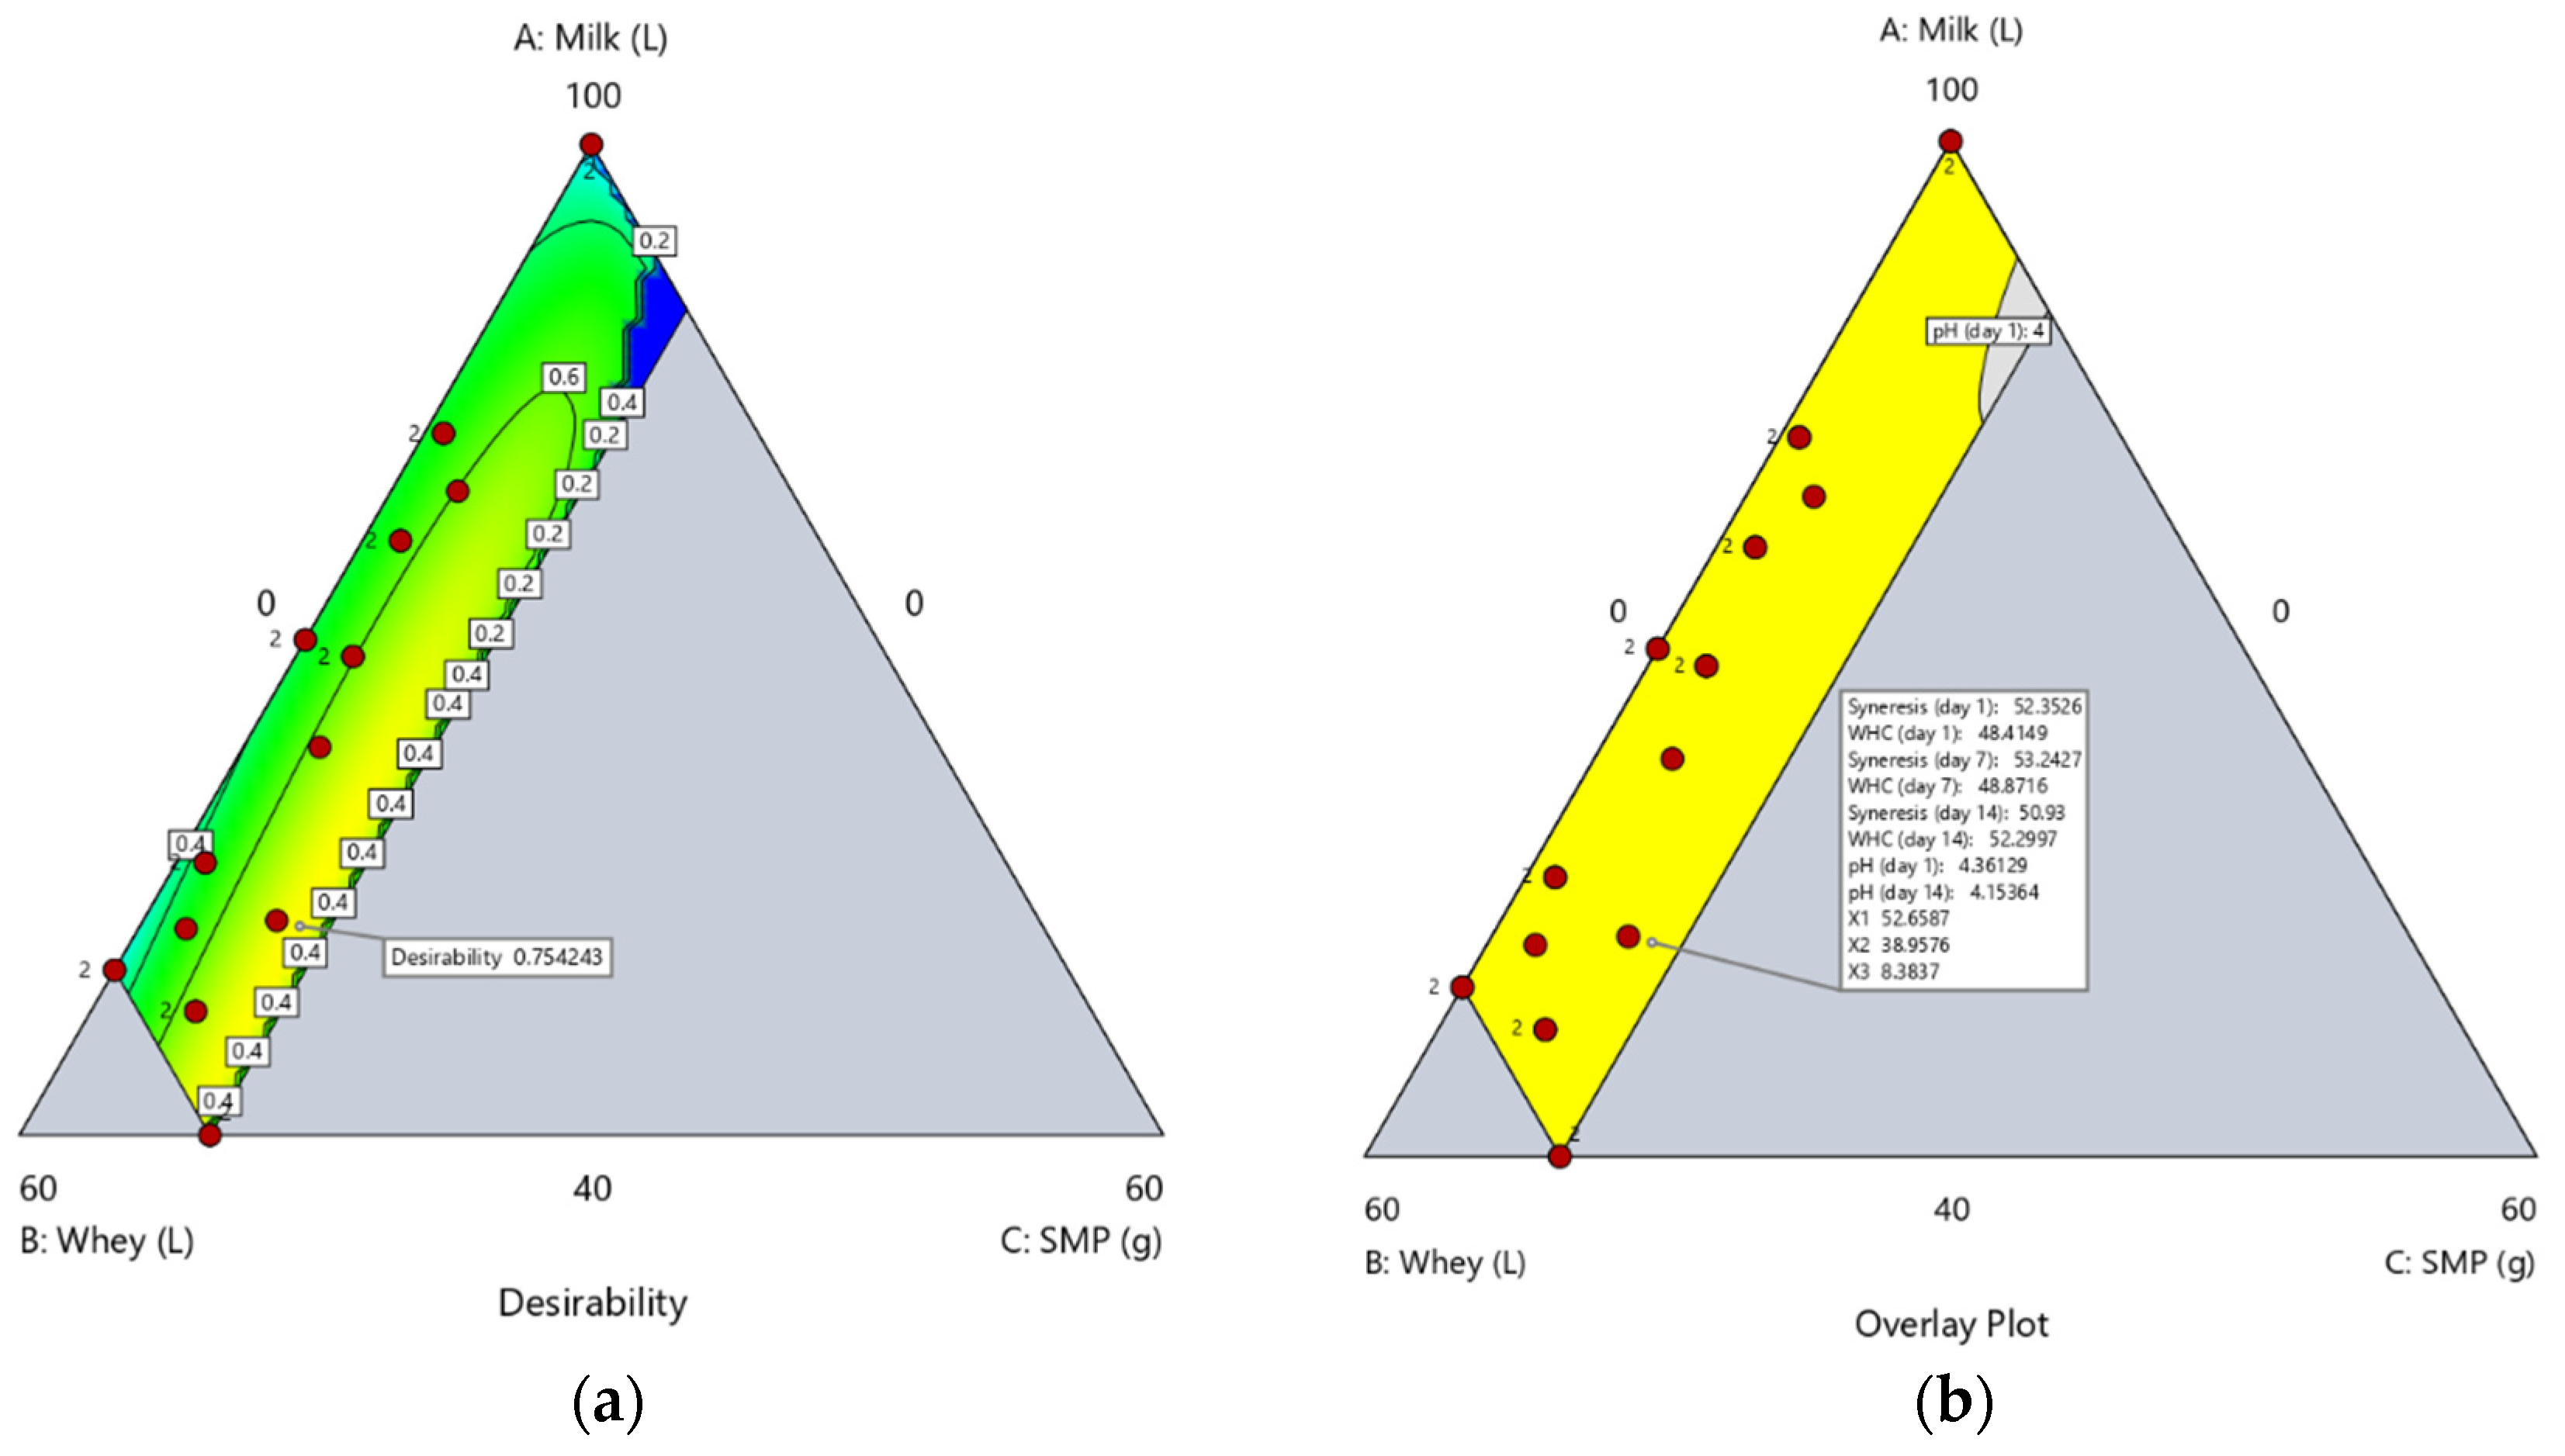
The multi-response numerical optimization identified a formulation containing 52.665% milk, 38.948% whey, and 8.388% skim milk powder (SMP), with an overall desirability of 0.754. This formulation provided the best simultaneous balance among the optimization criteria for syneresis, water-holding capacity (WHC), and pH during refrigerated storage. The graphical optimization results are presented in Figure 2, where the desirability plot illustrates the distribution of overall desirability within the investigated milk–whey–SMP mixture space, while the overlay plot shows the feasible formulation region satisfying the specified optimization criteria. The selected formulation was subsequently used for experimental confirmation.
Figure 2.
Multi-response graphical optimization of whey yogurt: (a) desirability plot showing the distribution of overall desirability within the milk–whey–skim milk powder mixture space; (b) overlay plot showing the feasible formulation region satisfying the specified optimization criteria for syneresis, water-holding capacity, and pH during refrigerated storage. Red circles represent the experimental runs, with adjacent numbers indicating the number of runs at overlapping mixture compositions. The colour gradient (green to yellow) illustrates changes in desirability, while contour labels indicate specific desirability values (0.2, 0.4, and 0.6). The yellow marker identifies the selected optimal formulation, with an overall desirability of 0.754243.
Predicted S1 = 52.337 mL/100 mL; W1 = 48.442%; S7 = 53.231 mL/100 mL; W7 = 48.902%; S14 = 50.913 mL/100 mL; W14 = 52.329%.
Predicted pH1 = 4.361; pH7 = 4.273; pH14 = 4.154.
3.6. Experimental Confirmation
The numerically optimized formulation (52.67% milk, 38.95% whey, and 8.38% SMP) was evaluated using two independent confirmation runs. The experimentally determined syneresis values showed prediction errors of 9.24%, 3.25%, and 4.59% after 1, 7, and 14 days of storage, respectively. The predicted and experimental pH values showed close agreement, with prediction errors ranging from 1.18% to 2.06%. These results indicate a reasonable agreement between the model predictions and the experimentally observed responses for syneresis and pH (Table 2).
Table 2.
Experimental validation of the numerically optimized yogurt formulation.
3.7. Total Phenolic Content (TPC)
The total phenolic content (TPC) varied considerably among the 22 milk–whey–SMP formulations, ranging from 12.52 to 93.66 mg GAE/100 mL. The highest value was observed in Run 4 (93.66 mg GAE/100 mL), containing 82.5% milk, 16.5% whey, and 1% SMP, followed by Run 10 (53.89 mg GAE/100 mL) with 63.5% milk, 32.5% whey, and 4% SMP. The milk-only formulation (Run 1) showed a TPC of 36.15 mg GAE/100 mL. These results indicate that changes in mixture proportions influenced the measured TPC, although the response did not increase linearly with increasing whey and SMP levels. The comparison among Runs 1, 4, and 10 suggests that the highest TPC was associated with an intermediate proportion of whey and a relatively low level of SMP. The lower value observed in Run 10, despite its higher whey and SMP contents, suggests that the response may be influenced by interactions among the mixture components rather than by the concentration of a single component. Differences in matrix composition may affect the availability and extractability of compounds contributing to the Folin–Ciocalteu response.
However, the Folin–Ciocalteu assay is not completely specific to phenolic compounds because other reducing substances can also contribute to the measured response. Therefore, the results should be interpreted as an estimate of phenolic-associated reducing capacity rather than as a direct measurement of individual phenolic compounds [34,35]. Despite the considerable variation among formulations, TPC was not included in the mixture-design optimization because an adequate predictive model could not be established. This avoided unsupported optimization of a response with insufficient predictive reliability. Nevertheless, TPC was retained as a supplementary functional response. Overall, run 4 exhibited the highest measured TPC, indicating that its particular balance of milk, whey, and SMP favored a greater Folin–Ciocalteu response within the investigated formulation space.
3.8. Microbiological Findings
The microbiological analysis of the yogurt samples revealed notable differences among the experimental runs. No microbial growth was detected in runs 1 and 14–22 under the analytical conditions used, whereas runs 2–13 showed the presence of several microorganisms, which were identified using the VITEK® 2 system. The identified organisms included Escherichia coli, Enterobacter kobei, Streptococcus uberis, and Enterococcus gallinarum. The detection of E. coli and E. kobei is consistent with concerns regarding hygiene and potential contamination during processing or handling. Enterobacter spp. have been reported as contaminants of milk and yogurt and may be associated with recontamination following heat treatment [36,37]. Streptococcus uberis is associated with bovine milk and is recognized as an environmental and intramammary pathogen of dairy cattle [38], whereas enterococci can occur in raw milk and dairy products and may also be associated with environmental, equipment, or post-processing contamination [39]. These observations are compatible with possible contamination from raw materials, the processing environment, equipment, or handling; however, the present experimental design was not intended to identify the specific source of contamination. Furthermore, the microbiological assessment was qualitative as it did not determine microbial concentrations or establish the origin of the recovered isolates. An additional limitation is that runs 2–13 and runs 14–22 belonged to different experimental batches. Therefore, differences in microbial recovery may reflect batch variability or differences in processing and handling rather than formulation alone. Because these potential effects could not be separated within the experimental design, no causal relationship between formulation and microbial recovery can be established.
The results nevertheless emphasize the importance of strict hygienic control when whey is incorporated into fermented dairy products, as whey may carry diverse microorganisms and may present microbiological-quality challenges when storage and handling conditions are inadequate [37,40]. A related study by Hyseni et al. [21] reported no detectable Enterobacteriaceae or E. coli in whey-supplemented yogurts during storage, although differences in raw materials, formulation, and processing conditions prevent direct comparison of the microbiological outcomes. The use of an automated identification platform such as VITEK® 2 provides a practical and standardized approach for the characterization of bacterial isolates in food microbiology.
Nevertheless, identification accuracy depends on the organism, isolate quality, and the system’s identification confidence. The microbiological findings should therefore be interpreted within the scope and limitations of the methods used. Future investigations should incorporate quantitative microbial analyses, appropriate microbiological quality-control procedures, and experimental designs that allow batch effects to be distinguished from formulation effects.
4. Discussion
From a dairy-processing perspective, the results support whey valorization through direct incorporation into a fermented food using a familiar processing route. The selected formulation demonstrates that substantial whey incorporation can be achieved while maintaining the principal physical quality targets through an appropriate balance of milk and SMP. The study therefore provides a formulation-level contribution to the sustainable utilization of a major dairy-processing by-product. At the same time, the microbiological observations indicate that whey handling and process hygiene remain important considerations, as microbial growth was detected in runs 2–13, whereas runs 1 and 14–22 showed no detectable growth under the analytical conditions used. Because the experimental design was not intended to isolate the causes of microbial contamination, these differences should not be attributed to formulation alone. This interpretation is consistent with previous reports indicating that whey may harbor diverse microorganisms and that post-process contamination can occur when whey or dairy-contact surfaces are inadequately controlled [37,40]. The findings therefore emphasize that successful whey valorization requires both formulation control and consistent hygienic processing.
The use of mixture design and desirability optimization is methodologically consistent with previous formulation studies. Cornell [6] established the basis for mixture experiments, while Galvan et al. [7] reviewed their application across food systems. Dairy and food studies have demonstrated the usefulness of mixture designs for optimizing starter combinations, dairy powder systems, yogurt formulations, and other multicomponent products [8,9,10,11,12,13,14]. Recent work on milk–whey systems identified an optimum near 30% whey and 70% milk, whereas the present yogurt formulation selected a higher whey fraction because SMP was simultaneously included as a third component [14]. This difference illustrates an important advantage of the present formulation strategy, as whey utilization was evaluated within a three-component system in which SMP could be used to compensate, at least partly, for structural changes associated with replacing milk with whey.
The selected numerical solution of 52.67% milk, 38.95% whey, and 8.38% SMP, with an overall desirability of 0.754, represents a compromise among several competing quality requirements. Increasing whey incorporation favors greater by-product utilization but may adversely affect serum retention and the protein network. Increasing SMP, in contrast, increases protein and total solids and can contribute to improved water retention, while also altering the overall composition of the formulation. The selected formulation therefore occupies an intermediate region of the mixture space rather than an extreme formulation point. Its approximately 39% whey fraction represents substantial by-product incorporation, while the approximately 8.4% SMP level provides additional protein and solids that may support physical stability. The alternative numerical solution containing 50% whey had a lower desirability of 0.740, illustrating the trade-off between greater whey incorporation and the simultaneous achievement of the defined quality objectives.
The practical significance of this numerical optimum should also be considered in relation to the predicted syneresis and water-holding capacity (WHC) values, rather than the desirability score alone. Syneresis is an important indicator of yogurt gel stability, as excessive serum separation can negatively affect product appearance and consumer acceptability, whereas WHC reflects the ability of the protein network to retain water during storage [15,28]. The predicted syneresis values for the selected formulation were 52.337, 53.231, and 50.913 mL/100 mL on days 1, 7, and 14, respectively, while the predicted WHC values were 48.442%, 48.902%, and 52.329% at the corresponding storage times. These predicted values provide a practical description of the expected physical behavior of the formulation during refrigerated storage. However, they represent model-based estimates and should not, by themselves, be interpreted as proof that the product achieves optimal technological quality or consumer acceptability. Direct comparisons with published studies are limited by differences in formulation, processing conditions, storage time, and analytical methods [15,28]. Moreover, the cited literature does not provide a single universal acceptance threshold for syneresis or WHC that can be directly applied to the present formulation. Although previous research on milk–whey mixtures identified an optimum containing approximately 30% whey [14], that study focused on compositional and nutritional characteristics rather than syneresis and WHC. It therefore provides context for the use of multi-response optimization but does not constitute a direct benchmark for the physical quality values predicted in the present study. Accordingly, the selected formulation is best described as the numerical optimum within the investigated mixture domain and a promising candidate for further technological validation, rather than as a definitively established optimum in terms of overall product quality.
Experimental confirmation provided preliminary evidence of the performance of the selected formulation. The prediction errors for syneresis were 9.24%, 3.25%, and 4.59% after 1, 7, and 14 days of storage, respectively, while those for pH ranged from 1.18% to 2.06%. These results indicate reasonable agreement between the predicted and experimentally observed syneresis and pH responses. However, the predictive performance of the syneresis models was limited, particularly on days 7 and 14, for which the predicted R2 values were 0.2142 and 0.3569, respectively. These values suggest limited reliability when predicting syneresis in untested formulations. Therefore, despite the statistical significance of the models, their predictions should be interpreted cautiously. Furthermore, confirmation was based on only two independent runs, limiting the conclusions that can be drawn regarding reproducibility. Additional experimental validation is needed before the optimized formulation can be considered robust.
For water-holding capacity (WHC), experimental confirmation was available only on day 14 because of laboratory-related technical difficulties. The predicted WHC was 52.329%, compared with an experimental mean of 48.15 ± 0.49%, corresponding to a prediction error of 7.92%. Since WHC could not be experimentally confirmed on days 1 and 7, the predicted WHC profile across storage remains only partially validated. Consequently, the selected formulation should be regarded as the numerical optimum within the investigated mixture domain and a promising candidate for further validation, rather than a definitively established technological optimum. Additional independent experiments are needed to assess the robustness and reproducibility of its performance. Furthermore, the relatively low predicted R2 values for syneresis on days 7 and 14 (0.2142 and 0.3569, respectively) indicate limited predictive reliability for these responses.
The storage results are also important because a formulation that performs well immediately after fermentation may not maintain the same physical quality during refrigerated storage. The predicted pH of the selected formulation decreased from 4.361 on day 1 to 4.154 on day 14, indicating continued post-acidification. Such a decline is commonly observed in fermented milk products during refrigerated storage, although the extent of post-acidification depends on formulation, starter culture, and storage conditions. Previous studies have reported similar post-acidification behavior in whey-containing yogurt systems [16,17,27]. These findings highlight the importance of including storage-time responses in formulation optimization rather than relying solely on measurements immediately after production.
The strong contribution of SMP to WHC agrees with previous studies. Damin et al. [22] showed that supplementation with SMP, whey protein concentrate, and sodium caseinate modifies acidification kinetics, rheological properties, and yogurt structure. Sodini et al. [23] similarly demonstrated that whey-protein concentrates can alter the physical properties of yogurt. Khadka and Timsina [27] specifically investigated whey yogurt and found that increasing SMP reduced syneresis, with the optimized formulation containing 8% SMP and a low level of stabilizer. Their storage study also showed that pH gradually decreased while syneresis increased during refrigeration. The present results extend these observations by evaluating SMP together with liquid whey and milk in a constrained three-component mixture and by following both syneresis and WHC at days 1, 7, and 14. The agreement between the present trends and previous yogurt studies supports the interpretation that protein concentration and total solids are important determinants of water retention in whey yogurt [15,16,17].
The observed component effects are consistent with the established mechanisms governing yogurt gel formation. Increasing whey generally increased syneresis and reduced WHC in the fitted mixture models, particularly at earlier storage stages, whereas increasing SMP showed the opposite tendency for WHC and generally contributed to lower syneresis. The milk component showed smaller or non-significant effects for some of the later syneresis responses, suggesting that, once an adequate milk fraction was present, further changes in milk proportion were less influential than the balance between whey and SMP. These trends can be interpreted in terms of the protein and total-solids environment. Yogurt structure develops through acid-induced casein aggregation together with interactions involving heat-denatured whey proteins [15,22,26,28]. Altering the casein-to-whey-protein ratio changes the balance of protein interactions, network organization, and water immobilization [24,25]. Thus, high whey proportions can substantially modify the gel matrix, whereas SMP can partly compensate by increasing protein and total solids and improving the capacity of the matrix to retain serum.
The present results demonstrate that the proportions of milk, whey, and SMP produced clear formulation-dependent differences in the physical behavior of the yogurt during refrigerated storage. Syneresis varied substantially among formulations on all three measurement days, while WHC also showed a broad formulation-dependent range. The statistical analysis indicated that the principal physical responses were adequately described by significant mixture models with non-significant lack of fit, with linear models generally providing an appropriate balance between model significance and predictive performance. The strongest model performance was obtained for WHC on day 7 (R2 = 0.8027; predicted R2 = 0.7438), whereas the syneresis models showed more moderate but still useful predictive performance. This pattern indicates that formulation composition accounted for an important proportion of the observed variation in yogurt physical properties, while the replicated experimental design provided an estimate of experimental variability and enabled assessment of model lack of fit.
Experimental confirmation further strengthened the interpretation of the numerical optimization. The selected formulation was independently prepared in two confirmation runs, and the experimentally determined syneresis values showed prediction errors of 9.24%, 3.25%, and 4.59% after 1, 7, and 14 days of refrigerated storage, respectively. The corresponding pH values also showed close agreement with the model predictions, with prediction errors ranging from 1.18% to 2.06%. The relatively low prediction errors, particularly for syneresis at day 14 and for pH throughout storage, indicate reasonable agreement between the predicted and experimentally observed responses. Because WHC was experimentally confirmed only on day 14, the confirmation should be interpreted as experimental support for the selected optimum based on syneresis and pH, with partial experimental support for the predicted WHC response. A limitation of this study is that experimental confirmation was based on only two independent runs. Although these experiments provided a preliminary assessment of the model predictions, further validation using additional independent batches and different raw-material sources is needed to establish the robustness and reproducibility of the selected formulation. These findings support the identification of a promising numerical optimum and demonstrate the usefulness of the mixture-design approach within the investigated formulation domain, although further validation is needed to establish the formulation’s overall technological performance.
5. Conclusions
The present study demonstrated that constrained mixture design can be effectively used to develop and optimize whey yogurt by simultaneously considering syneresis, WHC, and pH during refrigerated storage. The selected formulation of 52.665% milk, 38.948% whey, and 8.388% SMP achieved the highest overall desirability (0.754) and provided a balanced combination of physical stability and substantial whey incorporation. Experimental confirmation provided preliminary support for the selected numerical optimum based on syneresis and pH, while WHC was experimentally confirmed only on day 14. Therefore, the selected formulation represents a promising candidate within the investigated formulation domain, although further experimental validation is needed to establish its overall technological performance and reproducibility. TPC was useful as a supplementary quality response, but its lack of an adequate predictive model justified its exclusion from numerical optimization. The microbiological findings further emphasize that successful whey valorization requires strict hygienic control in addition to appropriate formulation. Overall, the results support the feasibility of using liquid whey in yogurt and demonstrate the value of multi-response mixture optimization as a practical approach for sustainable dairy by-product valorization.
Supplementary Materials
The following supporting information can be downloaded at https://www.mdpi.com/article/10.3390/app162110966/s1, Table S1: Formulation and physicochemical properties of yogurt samples during storage; Table S2: Optimization goals, response limits, weights, and relative importance values used in the numerical desirability optimization of the yogurt formulation; Table S3: Model fit statistics for water-holding capacity (WHC); Table S4: Model fit statistics for syneresis; Table S5: Fitted mixture-model equations; Table S6: Coefficient estimates and 95% confidence intervals.
Author Contributions
Conceptualization, A.H. and V.K.; methodology, B.T.; software, A.H.; validation, G.N., V.K. and A.H.; formal analysis, A.H.; investigation, A.H., V.K. and B.T.; resources, B.T.; data curation, V.K.; writing—original draft preparation, A.H.; writing—review and editing, V.K., G.N. and B.T.; visualization, G.N.; supervision, V.K.; project administration, G.N. All authors have read and agreed to the published version of the manuscript.
Funding
This research received no external funding.
Data Availability Statement
All data generated and analyzed during this study are included in the article and its Supplementary Materials.
Acknowledgments
This article/publication is based upon work from COST Action FoodWaStop, CA22134, supported by COST (European Cooperation in Science and Technology). The authors gratefully acknowledge VITA NOVA-ZA d.o.o. for providing the skimmed milk powder used in this study. The authors also sincerely thank Agan Shakir, owner of the dairy farm, for providing the raw milk and whey used in this study.
Conflicts of Interest
The authors declare no conflicts of interest.
Abbreviations
The following abbreviations are used in this manuscript:
| TPC | Total Phenolic Content |
| WHC | Water-Holding Capacity |
| SMP | Skim Milk Powder |
References
- Gupta, C.; Prakash, D. Therapeutic potential of milk whey. Beverages 2017, 3, 31. [Google Scholar] [CrossRef] [Scilit]
- Comunian, T.A.; Silva, M.P.; Souza, C.J.F. The use of food by-products as a novel source of functional foods: Their use as ingredients and for the encapsulation process. Trends Food Sci. Technol. 2021, 108, 269–280. [Google Scholar] [CrossRef] [Scilit]
- Moslemi, M.; Moayedi, A.; Khomeiri, M.; Maghsoudlou, Y. Development of a whey-based beverage with enhanced levels of conjugated linoleic acid (CLA) as facilitated by endogenous walnut lipase. Food Chem. X 2023, 17, 100547. [Google Scholar] [CrossRef] [Scilit]
- Meo Zilio, D.; Vasmara, C. Circular bioeconomy in dairy production: Ricotta cheese exhausted whey, from a byproduct to bioproducts, a case study. Anim. Front. 2025, 15, 38–43. [Google Scholar] [CrossRef] [Scilit]
- Mirzakulova, A.; Sarsembaeva, T.; Suleimenova, Z.; Kowalski, Ł.; Gajdzik, B.; Wolniak, R.; Bembenek, M. Whey: Composition, Processing, Application, and Prospects in Functional and Nutritional Beverages—A Review. Foods 2025, 14, 3245. [Google Scholar] [CrossRef] [Scilit]
- Cornell, J.A. Experiments with Mixtures: Designs, Models, and the Analysis of Mixture Data, 3rd ed.; Wiley-Interscience: New York, NY, USA, 2002. [Google Scholar] [CrossRef] [Scilit]
- Galvan, D.; Effting, L.; Cremasco, H.; Conte-Junior, C.A. Recent applications of mixture designs in beverages, foods, and pharmaceutical health: A systematic review and meta-analysis. Foods 2021, 10, 1941. [Google Scholar] [CrossRef] [Scilit]
- Dahlan, H.A.; Sani, N.A. The interaction effect of mixing starter cultures on homemade natural yogurt’s pH and viscosity. Int. J. Food Stud. 2017, 6, 152–158. [Google Scholar] [CrossRef]
- Yılmaz, M.T.; Sert, D.; Karakaya, M. The effect of interaction on the functional properties of dairy powder solutions. Aust. J. Dairy Technol. 2010, 65, 15–22. [Google Scholar]
- Garcia-Fontanals, L.; Llorente, R.; Valderrama, J.; Bravo, S.; Talens, C. Hybrid spreadable cheese analogues with faba bean and mealworm (Tenebrio molitor) flours: Optimisation using desirability-based mixture design. Foods 2023, 12, 1522. [Google Scholar] [CrossRef] [Scilit]
- Baskar, N.; Varadharajan, S.; Rameshbabu, M.; Ayyasamy, S.; Velusamy, S. Development of plant-based yogurt. Foods Raw Mater. 2022, 10, 274–282. [Google Scholar] [CrossRef] [Scilit]
- Homayouni Rad, A.; Rasouli Pirouzian, H.; Toker, O.S.; Konar, N. Application of simplex lattice mixture design for optimization of sucrose-free milk chocolate produced in a ball mill. LWT 2019, 115, 108435. [Google Scholar] [CrossRef] [Scilit]
- Fakhraei, S.; Amini Sarteshnizi, R.; Borhani, B.; Gholami, R.; Jafari Asl, M.; Soltani, A. Optimization of a stabilizer mixture for stirred yogurt formulation using native starch, acetylated distarch phosphate, and gelatin. Sci. Rep. 2026, 16, 20292. [Google Scholar] [CrossRef] [Scilit]
- Kaumenova, A.; Dautkanova, D.; Dossimova, Z.; Niyazbekova, Z.; Seisenbikyzy, B.; Suleimenova, Z.; Myrzabayeva, N.; Zagypan, A.; Serikov, M.; Kenenbay, G.; et al. Integrated multivariate analysis and desirability-based optimization of milk–whey mixtures: Effects on physicochemical properties, amino acid profile, and nutritional quality. Foods 2026, 15, 1759. [Google Scholar] [CrossRef] [Scilit]
- Arab, M.; Yousefi, M.; Khanniri, E.; Azari, M.; Ghasemzadeh-Mohammadi, V.; Mollakhalili-Meybodi, N. A comprehensive review on yogurt syneresis: Effect of processing conditions and added additives. J. Food Sci. Technol. 2023, 60, 1656–1665. [Google Scholar] [CrossRef] [Scilit]
- Bierzuńska, P.; Cais-Sokołińska, D.; Yiğit, A. Storage stability of texture and sensory properties of yogurt with the addition of polymerized whey proteins. Foods 2019, 8, 548. [Google Scholar] [CrossRef] [Scilit]
- Brodziak, A.; Król, J.; Barłowska, J.; Teter, A.; Florek, M. Changes in the physicochemical parameters of yoghurts with added whey protein in relation to the starter bacteria strains and storage time. Animals 2020, 10, 1350. [Google Scholar] [CrossRef] [Scilit]
- Hyseni, A. Formulations and Processing of Functional Yogurt, Microbiological, Rheological, Sensory and Nutritional Characterization during Storage. Ph.D. Thesis, University “St. Kliment Ohridski”–Bitola, Faculty of Technology and Technical Sciences, Veles, North Macedonia, 2023. [Google Scholar]
- Hyseni, A.; Kalevska, T.; Nikolovska-Nedelkoska, D.; Dimitrovska, G.; Knights, V.; Stamatovska, V.; Hyseni, V. Textural and sensory properties of yogurt obtained by bioconversion of milk-liquid whey mixture and Aronia melanocarpa supplementation. Agric. For. 2024, 70, 115–126. [Google Scholar] [CrossRef] [Scilit]
- Hyseni, A.; Kalevska, T.; Nikolovska-Nedelkoska, D.; Dimitrovska, G.; Knights, V.; Stamatovska, V.; Hyseni, V. Textural and sensory characteristics of yogurt manufactured with liquid whey and strawberry supplementation. J. Food Sci. Technol. 2024, 21, 139–150. [Google Scholar] [CrossRef]
- Hyseni, A.; Kalevska, T.; Nikolovska-Nedelkoska, D.; Dimitrovska, G.; Knights, V.; Stamatovska, V.; Hyseni, V. Proximate composition and microbiological safety of yogurts produced by fermentation of a milk-whey mixture and supplemented with fruits. Asian J. Dairy Food Res. 2025, 1, 1–6. [Google Scholar] [CrossRef] [Scilit]
- Damin, M.R.; Alcântara, M.R.; Nunes, A.P.; Oliveira, M.N. Effects of milk supplementation with skim milk powder, whey protein concentrate and sodium caseinate on acidification kinetics, rheological properties and structure of nonfat stirred yogurt. LWT—Food Sci. Technol. 2009, 42, 1744–1750. [Google Scholar] [CrossRef] [Scilit]
- Sodini, I.; Montella, J.; Tong, P.S. Physical properties of yogurt fortified with various commercial whey protein concentrates. J. Sci. Food Agric. 2005, 85, 853–859. [Google Scholar] [CrossRef] [Scilit]
- Zhao, L.; Wang, X.; Tian, Q.; Mao, X. Effect of casein to whey protein ratios on the protein interactions and coagulation properties of low-fat yogurt. J. Dairy Sci. 2016, 99, 7768–7775. [Google Scholar] [CrossRef] [Scilit]
- Chua, D.; Deeth, H.C.; Oh, H.E.; Bansal, N. Altering the casein to whey protein ratio to enhance structural characteristics and release of major yoghurt volatile aroma compounds of non-fat stirred yoghurts. Int. Dairy J. 2017, 74, 63–73. [Google Scholar] [CrossRef] [Scilit]
- Karam, M.C.; Gaiani, C.; Hosri, C.; Burgain, J.; Scher, J. Effect of dairy powders fortification on yogurt textural and sensorial properties: A review. J. Dairy Res. 2013, 80, 400–409. [Google Scholar] [CrossRef] [Scilit]
- Khadka, S.; Timsina, A. Study on optimization of proportion of skim milk powder and stabilizer in preparation of whey yoghurt and evaluation of its quality. Acta Univ. Cibiniensis Ser. E Food Technol. 2024, 28, 65–78. [Google Scholar] [CrossRef] [Scilit]
- Lee, W.J.; Lucey, J.A. Formation and physical properties of yogurt. Asian-Australas. J. Anim. Sci. 2010, 23, 1127–1136. [Google Scholar] [CrossRef] [Scilit]
- ISO 6091:2010; Dried Milk—Determination of Titratable Acidity (Reference Method). International Organization for Standardization: Geneva, Switzerland, 2010.
- Korkmaz, I.O.; Bilici, C.; Korkmaz, S. Sensory, pH, synaeresis, water-holding capacity, and microbiological changes in homemade yogurt prepared with maca (Lepidium meyenii) powder and propolis extract. Int. J. Gastron. Food Sci. 2021, 23, 100291. [Google Scholar] [CrossRef] [Scilit]
- Nakov, G.; Trajkovska, B.; Atanasova-Pancevska, N.; Daniloski, D.; Ivanova, N.; Lučan Čolić, M.; Jukić, M.; Lukinac, J. The Influence of the Addition of Hemp Press Cake Flour on the Properties of Bovine and Ovine Yoghurts. Foods 2023, 12, 958. [Google Scholar] [CrossRef] [Scilit]
- Derringer, G.; Suich, R. Simultaneous optimization of several response variables. J. Qual. Technol. 1980, 12, 214–219. [Google Scholar] [CrossRef] [Scilit]
- Guzmán-González, M.; Morais, F.; Ramos, M.; Amigo, L. Influence of skimmed milk concentrate replacement by dry dairy products in a low fat set-type yoghurt model system. I: Use of whey protein concentrates, milk protein concentrates and skimmed milk powder. J. Sci. Food Agric. 1999, 79, 1117–1122. [Google Scholar] [CrossRef]
- Platzer, M.; Kiese, S.; Herfellner, T.; Schweiggert-Weisz, U.; Eisner, P. How Does the Phenol Structure Influence the Results of the Folin–Ciocalteu Assay? Antioxidants 2021, 10, 811. [Google Scholar] [CrossRef] [Scilit]
- Sánchez-Rangel, J.C.; Benavides, J.; Heredia, J.B.; Cisneros-Zevallos, L.; Jacobo-Velázquez, D.A. The Folin–Ciocalteu assay revisited: Improvement of its specificity for total phenolic content determination. Anal. Methods 2013, 5, 5990–5999. [Google Scholar] [CrossRef] [Scilit]
- Rasouli Pirouzian, H.; Khaleghi, M. Safety perspective of probiotic and non-probiotic yoghurts: A review. Food Qual. Saf. 2019, 3, 9–14. [Google Scholar] [CrossRef] [Scilit]
- Sattin, E.; Andreani, N.A.; Carraro, L.; Lucchini, R.; Fasolato, L.; Telatin, A.; Balzan, S.; Novelli, E.; Simionati, B.; Cardazzo, B. A Multi-Omics Approach to Evaluate the Quality of Milk Whey Used in Ricotta Cheese Production. Front. Microbiol. 2016, 7, 1272. [Google Scholar] [CrossRef] [Scilit]
- Dogan, B.; Boor, K.J. Short communication: Growth characteristics of Streptococcus uberis in UHT-treated milk. J. Dairy Sci. 2004, 87, 813–815. [Google Scholar] [CrossRef] [Scilit]
- Giraffa, G. Functionality of enterococci in dairy products. Int. J. Food Microbiol. 2003, 88, 215–222. [Google Scholar] [CrossRef] [Scilit]
- Sar, T.; Harirchi, S.; Ramezani, M.; Bulkan, G.; Yesilcimen Akbas, M.; Pandey, A.; Taherzadeh, M.J. Potential utilization of dairy industries by-products and wastes through microbial processes: A critical review. Sci. Total Environ. 2022, 810, 152253. [Google Scholar] [CrossRef] [Scilit]

Disclaimer/Publisher’s Note: The statements, opinions and data contained in all publications are solely those of the individual author(s) and contributor(s) and not of MDPI and/or the editor(s). MDPI and/or the editor(s) disclaim responsibility for any injury to people or property resulting from any ideas, methods, instructions or products referred to in the content. |
© 2026 by the authors. Licensee MDPI, Basel, Switzerland. This article is an open access article distributed under the terms and conditions of the Creative Commons Attribution (CC BY) license.