


Abstract
To facilitate the high-value recycling of composite materials from decommissioned wind turbine blades, three recycled fiber products, RFA, RFB, and RFC, were investigated. Their macro- and micromorphological characteristics were examined, and their effects on asphalt mastic and asphalt mixtures were evaluated. A three-factor Box–Behnken design (BBD) considered mastic fiber content, mixing speed, and mixing time. The reported RFC candidate setting was 3.45% fiber by total mastic mass, 600 r/min, and 40 min; the BBD preparation temperature was not documented. Mixtures were evaluated separately at 0.3% fiber by total mixture mass and formulation-specific Marshall optimum asphalt–aggregate ratios. RFC had a dynamic stability of 2266 cycles/mm, 53.2% above the fiber-free reference, a flexural tensile strain at failure of 2651 με, and a freeze–thaw tensile strength ratio (TSR) of 91.46%. BF had the highest reported dynamic stability and residual Marshall stability; RFC had the highest reported flexural strain and TSR. At the stated prices, RFC added CNY 1.71/t in fiber-material expenditure. Incomplete preparation and specimen-level records limit reproducibility and uncertainty assessment. These laboratory observations concern complete formulations and do not establish statistical superiority, long-term durability, environmental safety, or lower total production costs.
1. Introduction
Large-scale resource recovery from the growing stock of decommissioned wind turbine blades is an urgent challenge for end-of-life solid-waste management in the clean-energy supply chain and the coordinated development of low-carbon road construction materials [1,2]. By 2025, China’s cumulative grid-connected wind power capacity had reached 640 million kW, and turbines installed during the initial period of large-scale deployment were beginning to reach their 20-year design service life. Approximately 12,000 t of blades were decommissioned in China in 2025. Annual blade waste is projected to rise to 450,000–500,000 t by 2030, with blade retirement expected to peak between 2031 and 2035. The pressure to manage large volumes of end-of-life composite blades is also increasing worldwide [3]. Wind turbine blades are composed primarily of glass-fiber-reinforced thermosetting polymer (GFRP) composites. After curing, the resin forms an irreversible three-dimensional cross-linked molecular network and cannot degrade naturally [2]. Conventional landfilling occupies land for prolonged periods, whereas incineration releases organic gases from resin decomposition and ultrafine glass-fiber dust. Both disposal routes therefore pose persistent environmental risks [4,5]. The resource-recovery value of recycled blade fibers stems chiefly from the high proportion of glass fibers in the load-bearing structure of the blades [4,5]. Glass fibers are mature and reliable reinforcing modifiers for asphalt pavements, and their mechanical properties and weather resistance are well suited to applications that currently use basalt fibers and virgin commercial glass fibers [6,7]. Recycled fibers (RF) produced through low-energy physical crushing and graded grinding can retain the key mechanical properties of the original glass fibers [8,9]. In line with China’s carbon-peaking and carbon-neutrality targets, incorporating recycled fibers into asphalt mixtures can recycle large quantities of wind-industry waste [10,11] and directly replace road-grade mineral fibers, including basalt and virgin glass fibers. This approach may support waste diversion and material substitution, but reductions in life-cycle resource consumption or carbon emissions and improvements in long-term pavement durability require separate evaluation.
International researchers have conducted foundational studies on recycling composites from decommissioned wind turbine blades and their secondary applications. Jensen and Skelton [1] reviewed European treatment technologies and a Danish consortium’s experience with secondary composite applications, identifying practical barriers to maintaining material value. In Spain, Diez-Cañamero and Mendoza [4] compared the circularity performance and carbon footprints of seven blade-waste management alternatives. U.S. research by Cousins et al. [8] examined grinding and dissolution of glass-fiber thermoplastic blade composites; these recovery findings cannot be transferred directly to the cured thermoset fragments studied here. Khalid et al. [3] reviewed modern blade-recycling technologies, Tan et al. [12] investigated chemically recovered blade waste in asphalt mortar, while Luo et al. [13] investigated physicochemically treated blade waste in asphalt binders and mixtures. Cooperman et al. [14], working at the U.S. National Renewable Energy Laboratory, estimated blade-waste quantities and disposal-stage costs. These studies frame blade-fiber asphalt as a potential secondary application requiring separate verification of pavement performance, processing expenditure, and environmental effects.
Researchers in China have focused on multistage mechanical crushing, techniques for enhancing the pavement performance of asphalt mixtures, and field demonstration projects. Ma et al. [15] systematically reviewed resource-recovery technologies for large volumes of decommissioned wind turbine blades and identified mechanical crushing and graded separation as the dominant processes for cost-effective, large-scale treatment. To address structural variability in mixtures caused by the geometric heterogeneity of recycled fibers, Gao [16] systematically evaluated the preparation and technical performance of asphalt modified with composite fibers from waste wind turbine blades under different aggregate gradations. The study identified processing parameters as critical to stabilizing the initial rheological state of the mastic. To facilitate the transition from laboratory research to full-scale pavement construction, Chen et al. [17] reviewed waste-material applications in low-carbon asphalt pavements, while Long [18] investigated the pavement performance of mixtures containing blade-derived composite fibers. These studies provide a basis for further laboratory and application-specific evaluation of blade-derived modifiers.
Related waste-derived modifiers provide a broader context. Khedaywi et al. [19] studied waste glass powder in binder and mixtures, reporting improved binder rutting parameters and mixture dynamic-creep responses. Their review of waste polyethylene (PE) [20] summarized binder consistency and rheology alongside mixture deformation and moisture resistance. For waste polyethylene terephthalate (PET), the binder study [21] combined conventional and rheological tests, whereas the mixture study [22] examined Marshall properties, dynamic creep, and fatigue. Recycled blade fragments contain glass fibers and cured resin and differ from glass powder and thermoplastics; their mechanisms and optimum dosages cannot be transferred directly.
Khedaywi et al. [23] compared waste fillers using Marshall and dry/wet wheel-tracking tests: glass filler increased permanent deformation, whereas toner, rubber, and electric arc furnace dust reduced it. Haddad and Khedaywi [24] evaluated olive husk ash by dynamic creep at different temperatures and loading frequencies. Their moisture study [25] considered wet conditioning and subsequent drying, highlighting the influence of conditioning history. Differences in material function, dosage basis, binder, aggregate, and test conditions preclude direct numerical ranking against the present blade-fiber formulations.
Taken together, studies in China and elsewhere have made progress in the preparation, basic characterization, and engineering application of recycled fibers from decommissioned wind turbine blades, indicating their potential value in asphalt pavements. Nevertheless, important gaps remain relative to practical engineering needs and the need for better-controlled material development. Fiber-length effects have also been investigated for conventional fiber-reinforced asphalt concrete [26]. First, the effects of fiber-processing methods and the resulting technical characteristics have not been examined in sufficient depth. Most studies directly test finished fibers produced through a single process and do not systematically evaluate how differences in fiber length, aspect ratio, and surface morphology resulting from crushing and grinding affect asphalt mastic performance. Second, the effects of fiber products obtained through different processing routes on mixture performance have not been comprehensively compared. Existing studies often conduct single-scale tests on either the mastic or the mixture, with few parallel comparisons of fiber modification behavior in both material systems. To address these gaps, this study selected three recycled wind turbine blade fibers, designated RFA, RFB, and RFC, which were produced using different processes. Basalt fibers (BF) and virgin glass fibers (GF) were used as controls. A Box-Behnken response surface design was used to optimize the mixing and shearing conditions, and the Marshall mix design method was used to determine the optimum asphalt content for each fiber system. The contribution is the parallel comparison of three supplied recycled products against BF and GF at both mastic and mixture scales, together with a limited fiber-material cost calculation. Because the recycled products came from different manufacturers, supplier, feedstock, resin chemistry, processing, and pretreatment are confounded. The comparison therefore concerns the tested products and complete formulations rather than an independent processing-route or fiber-only effect.
2. Materials and Methods
2.1. Materials
2.1.1. Asphalt Binder
Donghai 70# asphalt binder was used in this study. Its main technical properties are presented in Table 1. The ductility at 15 °C was 149 cm.
Table 1.
Technical properties of the asphalt binder.
2.1.2. Aggregates
Hard, angular diabase was used for both the coarse and fine aggregates. Key properties, including the aggregate crushing value and abrasion value, met the technical requirements for surface-course materials of high-grade highways specified in the Technical Specifications for Construction of Highway Asphalt Pavements (JTG F40-2004).
2.1.3. Recycled Wind Turbine Blade Fibers
Three types of recycled fibers produced from wind turbine blades using different processing methods, designated RFA, RFB, and RFC, were selected for testing. Commercial basalt fibers (BF) and glass fibers (GF) were used for comparison. The recycled fibers were obtained from different manufacturers, while the two industrial fibers were commercially available products conforming to the relevant requirements. The basic properties of the fibers are presented in Table 2.
Table 2.
Basic properties of the fibers.
Table 2 reports nominal dimensions rather than measured size distributions. Measured particle- or fiber-size distributions and bulk resin-chemistry data are not provided. Supplier, feedstock, processing, and pretreatment are confounded; consequently, differences among these products cannot identify an independent grinding or crushing effect.
2.2. Mix Design of the AC-13 Asphalt Mixture
The Marshall mix design was carried out in accordance with the Standard Test Methods of Bitumen and Bituminous Mixtures for Highway Engineering (JTG E20-2011). The reference mixture contained no added fiber;The aggregate graduation used for the AC-13 asphalt mixture is presented in Table 3. the RFA-, RFB-, RFC-, GF-, and BF-modified mixtures each contained 0.3% fiber by total mixture mass. The bulk specific gravity, air void content, voids in mineral aggregate (VMA), voids filled with asphalt (VFA), Marshall stability, and flow value were measured at different asphalt–aggregate ratios. Curves relating each parameter to the asphalt–aggregate ratio were then plotted. The characteristic asphalt–aggregate ratios corresponding to the maximum bulk specific gravity, maximum Marshall stability, and the midpoints of the specified ranges for air void content and VFA were determined and averaged to obtain OAC1. The range of asphalt–aggregate ratios within which all volumetric parameters met the specification requirements was identified, and its midpoint was taken as OAC2. The mean of OAC1 and OAC2 was defined as the optimum asphalt–aggregate ratio for each mixture. The resulting values were 4.70% for the fiber-free reference mixture, 4.87% for the RFA-modified mixture, 4.99% for the RFB-modified mixture, 4.99% for the RFC-modified mixture, 4.82% for the GF-modified mixture, and 4.85% for the BF-modified mixture.
Table 3.
Aggregate gradation design for the AC-13 asphalt mixture.
Mastic fiber content (%) = 100 × added fiber mass/total mastic mass, including the fiber and all other mastic constituents. The BBD levels of 2%, 4%, and 6%, the separate comparison contents of 2%, 3%, and 4%, and the selected contents use this denominator. Mixture fiber content (%) = 100 × added fiber mass/total mixture mass, including the fiber. Asphalt–aggregate ratio (%) = 100 × binder mass/aggregate mass. The mastic settings have not been validated as mixture-production conditions, and the fixed 0.3% mixture comparison does not establish an optimum mixture fiber dosage. Different OACs and volumetric structures mean that performance comparisons concern complete designs rather than an isolated fiber effect. Table 4 reports the supplied Marshall design measurements at the tested asphalt–aggregate ratios. These measurements do not establish measured volumetric properties at every adopted OAC.
Table 4.
Marshall design measurements at the investigated asphalt–aggregate ratios.
2.3. Performance Tests on Asphalt Mastic and Mixtures
2.3.1. Asphalt Mastic Performance Tests
Penetration, softening point, and ductility were measured as the principal performance indicators of the asphalt mastic. All test procedures were conducted in accordance with the relevant provisions of the Standard Test Methods of Bitumen and Bituminous Mixtures for Highway Engineering (JTG 3410-2025).
Temperature was not a BBD factor, and the available preparation description does not document the BBD temperature. A separate mastic comparison series was reported at 170 ± 5 °C, 800 r/min, and 30 min, with fiber contents of 2%, 3%, and 4% of total mastic mass. These conditions cannot be retrospectively assigned to the BBD.
2.3.2. Asphalt Mixture Performance Tests
The high-temperature performance, low-temperature cracking resistance, and moisture stability of the asphalt mixtures were evaluated in accordance with the Standard Test Methods of Bitumen and Bituminous Mixtures for Highway Engineering (JTG 3410-2025). The wheel-tracking test (T 0719-2025) was conducted at 60 °C under a wheel pressure of 0.7 MPa and a tracking rate of 42 passes/min, with dynamic stability (DS) used to evaluate high-temperature resistance to permanent deformation. The low-temperature bending test (T 0715-2025) was performed at −10 °C and a loading rate of 50 mm/min, with the flexural tensile strain at failure used to assess cracking resistance. The immersion Marshall test (T 0709-2025) and freeze–thaw splitting test (T 0729-2025) were conducted to evaluate moisture stability using retained Marshall stability and the tensile strength ratio (TSR), respectively.
Mixture results are compared descriptively. Reliable specimen counts, individual measurements, and independent batch identities are not supplied, so within-formulation standard deviations, confidence intervals, and between-formulation statistical tests cannot be established. Averages across different formulations do not estimate within-formulation variability. The preparation description also lacks a complete formulation-specific production sequence, mixing temperature and duration, and batch traceability. These omissions limit reproducibility and interpretation of the comparisons.
3. Results and Discussion
3.1. Morphology, Elemental Composition, and Thermal Behavior
3.1.1. Macroscopic Morphology
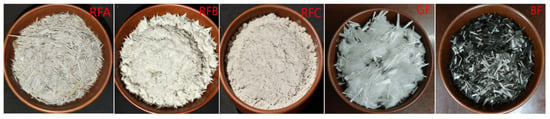
As shown in Figure 1, the three supplied recycled products exhibited distinct macroscopic morphologies. RFA consisted of elongated, block-like fragments that formed a compact mass with little dust. RFB exhibited a loose, fluffy structure from which fiber bundles were easily detached. RFC was a fine powder that formed a loosely packed mass and readily generated dust when poured. Among the commercial fibers, BF exhibited an orderly, compact arrangement and a relatively dark color. GF consisted of randomly intertwined clusters of milky-white short fibers with a large specific surface area and low weight. These fibers were prone to becoming airborne and agglomerating under electrostatic forces when added during mixing.
Figure 1.
Macroscopic morphology of the fibers.
3.1.2. Scanning Electron Microscopy
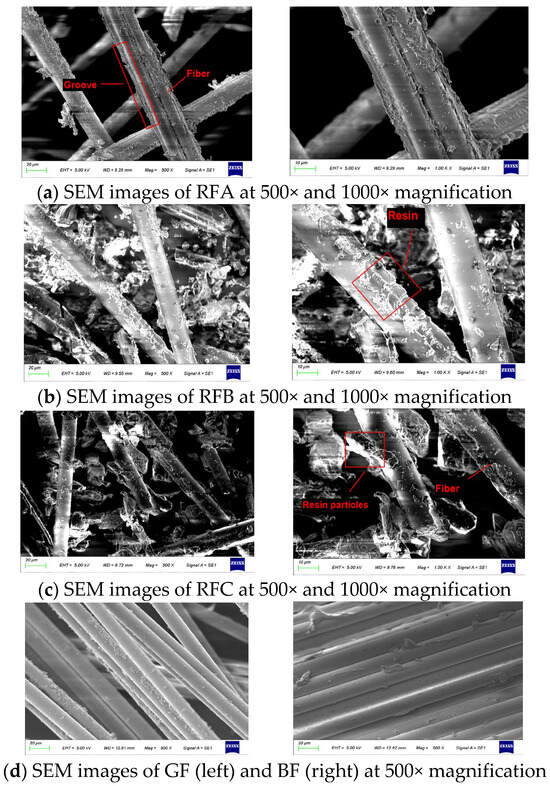
The microscopic morphology of the fibers was examined using a ZEISS EVO MA15 field-emission scanning electron microscope at magnifications of 500× and 1000× (in Figure 2). Before examination, the specimens were sputter-coated with a 10 nm conductive platinum layer at a sputtering current of 20 mA for 60 s to prevent image distortion caused by charging.
Figure 2.
SEM images of the recycled products and commercial fibers.
Elemental characterization used an Oxford X-MaxN50 EDS detector at 15 kV, a 10 mm working distance, and a 60 s acquisition time; three representative regions per sample were examined. Thermal analysis used a TA Instruments Q500 under nitrogen, heating from room temperature to 800 °C at 10 °C/min.
The SEM images showed distinct morphological differences among the supplied recycled fibers. RFA exhibited an elongated composite-fragment structure with a relatively continuous surface layer. RFB showed loose fiber bundles with surface fragments, whereas RFC consisted mainly of fine fiber and resin-bearing fragments. All three recycled fiber types showed glass-fiber/cured-resin composite features. In contrast, BF and GF were melt-drawn inorganic fibers with comparatively smooth surfaces and regular bundled morphologies. These local observations do not quantify bulk resin content, establish resin removal, identify bulk resin chemistry, or demonstrate a connected reinforcing network inside a mixture. Differences among suppliers and feedstocks also prevent attribution of these morphologies solely to crushing or grinding.
EDS identified C, O, and Si as the principal elements in the recycled products, consistent with their composite origin. This local elemental information does not quantify bulk resin content, identify resin chemistry, or demonstrate a connected reinforcing network within a mixture. EDS spectra and elemental maps are not reproduced here.
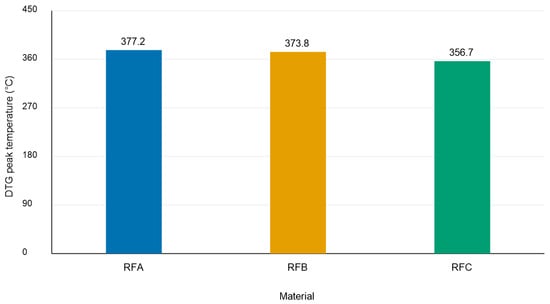
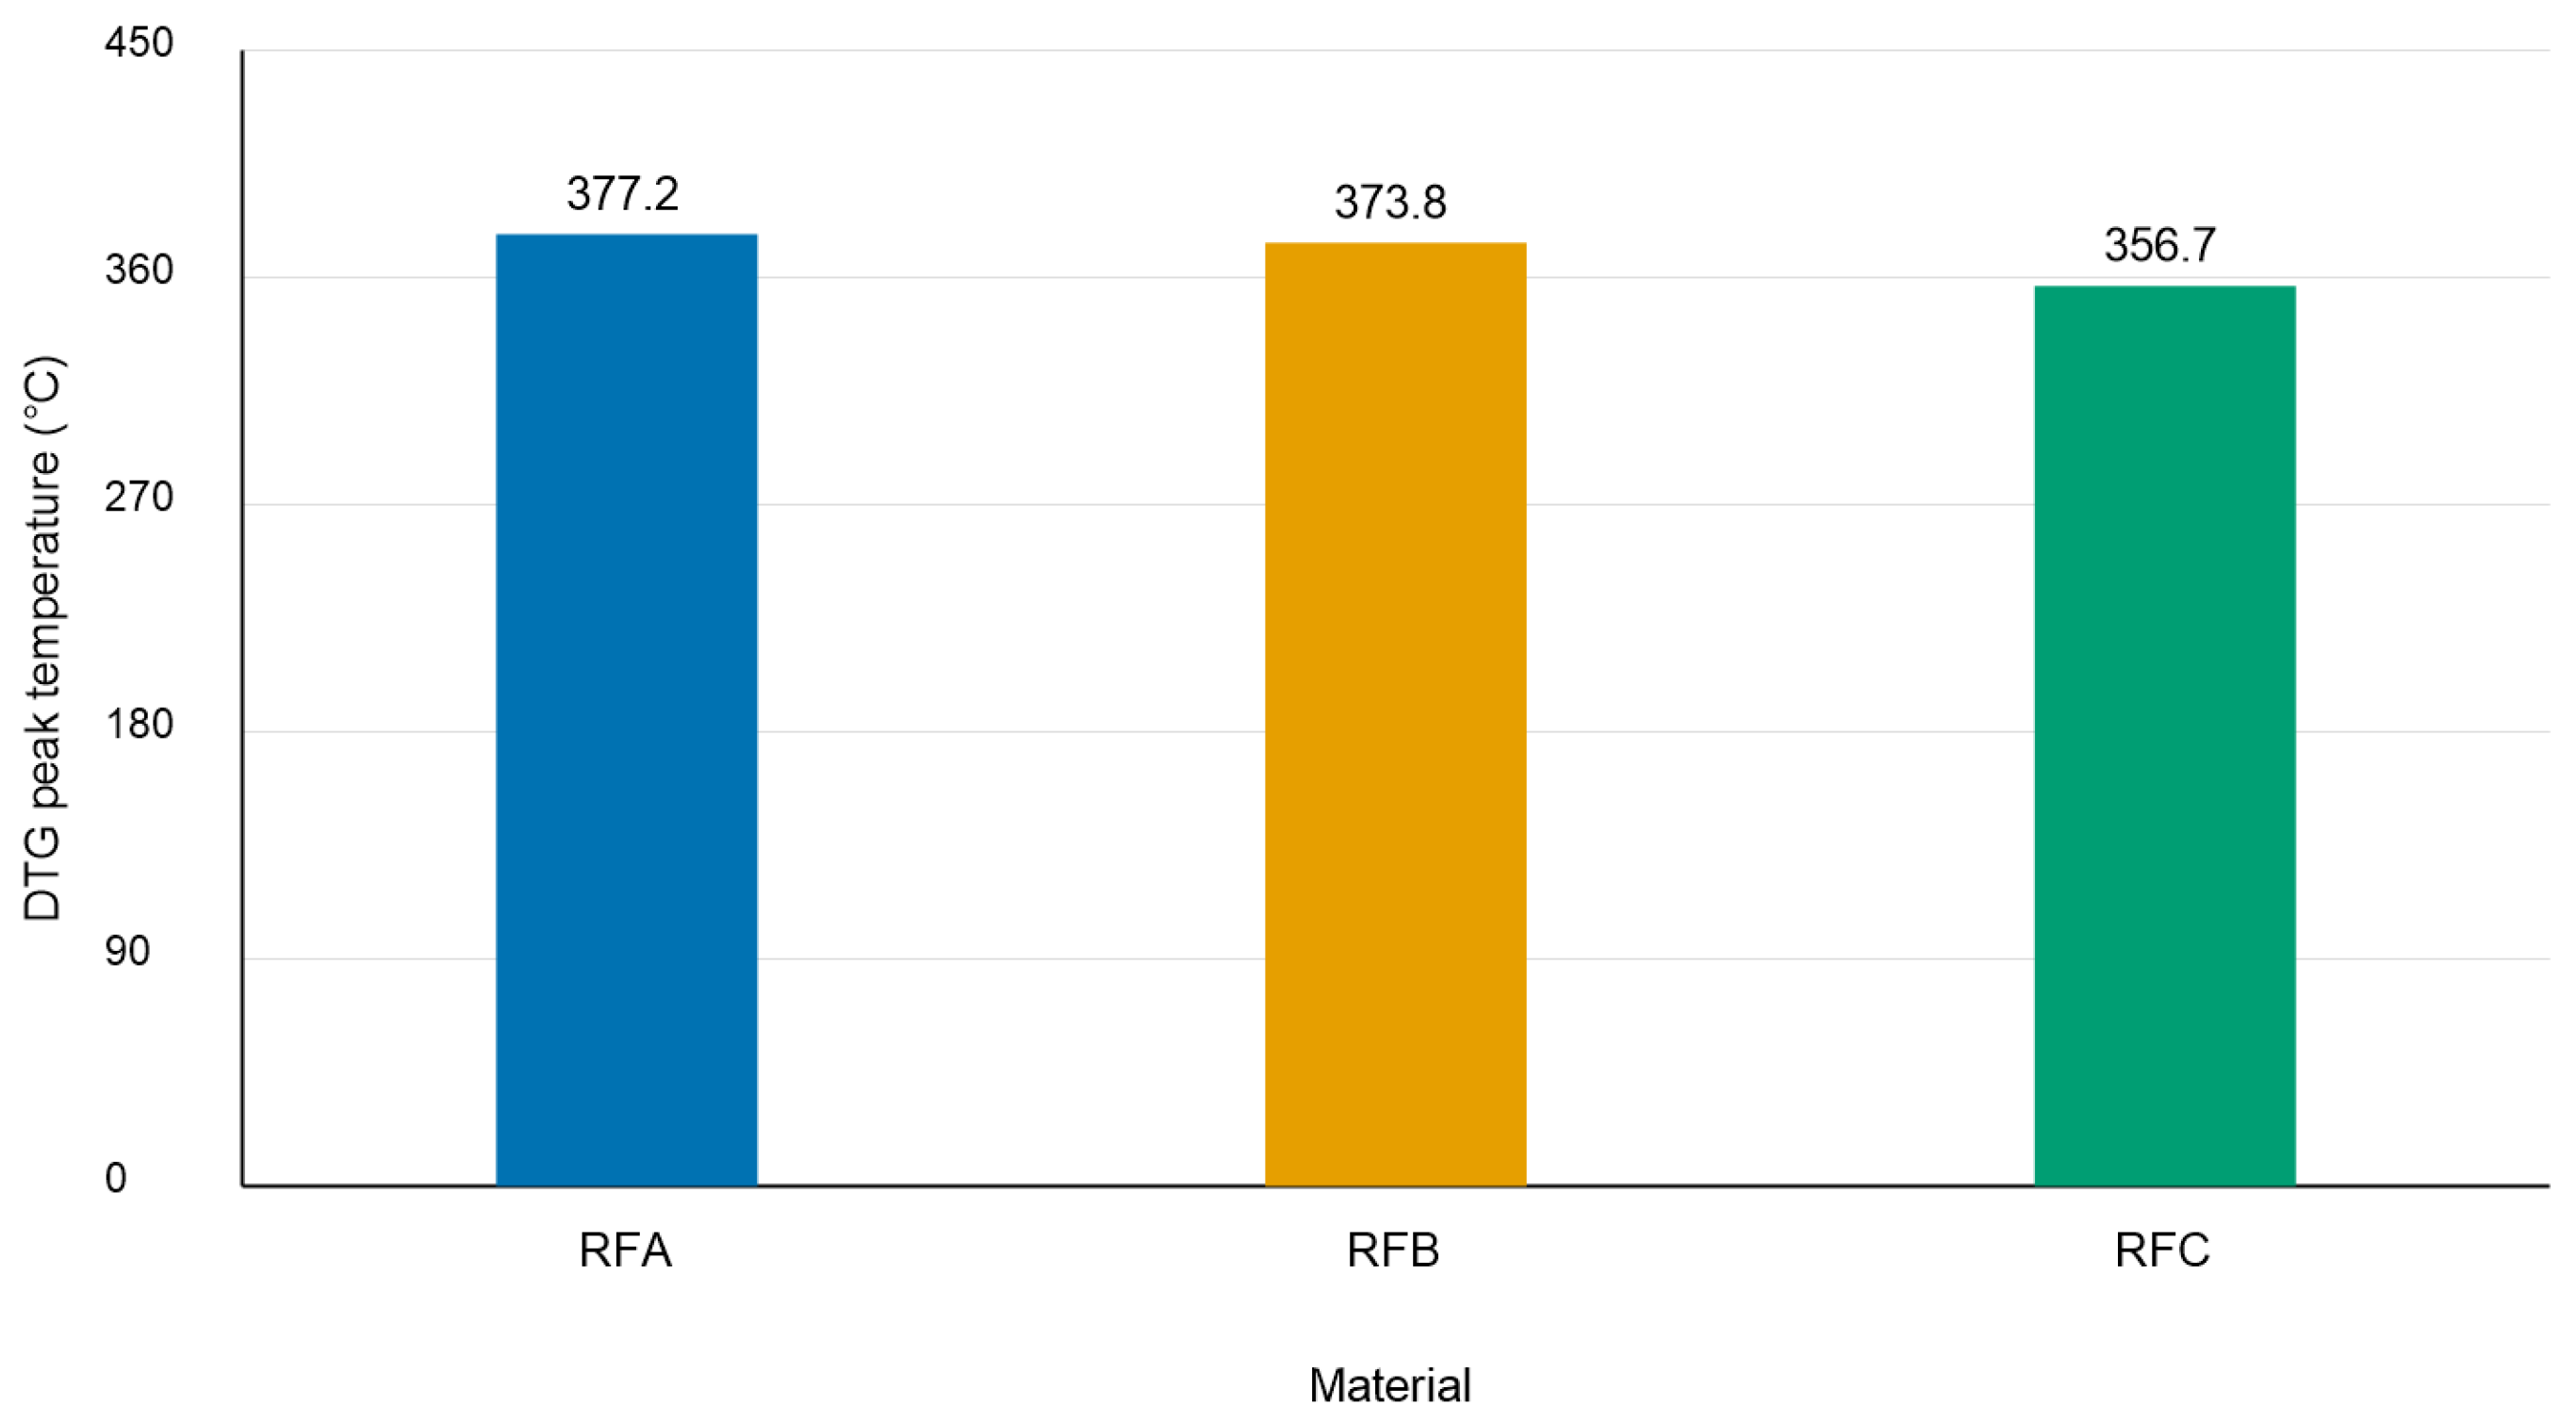
The recycled products exhibited their principal DTG peaks between 300 and 400 °C. Peak temperatures were 377.2 °C for RFA, 373.8 °C for RFB, and 356.7 °C for RFC (Figure 3). The supplied thermal-analysis description reported mass losses below 1% over approximately 160–180 °C. The lower RFC peak characterizes the supplied product; it does not establish a grinding-induced chemical change, waste classification, or environmental safety. Figure 3 summarizes peak temperatures rather than full TGA/DTG curves.
Figure 3.
Reported DTG peak temperatures of the recycled products.
3.2. Properties of Asphalt Mastics
3.2.1. Box–Behnken Experimental Design and Performance Results
A Box–Behnken design (BBD) was used to develop response surface models for evaluating the effects of recycled wind turbine blade fiber content (X1), mixing speed (X2), and mixing time (X3) on asphalt mastic properties [18]. Penetration, softening point, and ductility were selected to characterize mastic consistency, high-temperature stability, and low-temperature ductility, respectively. The factor levels were 2%, 4%, and 6% of total mastic mass; 600, 800, and 1000 r/min; and 20, 30, and 40 min. The experimental design comprised 17 runs, including 12 edge-midpoint conditions and five center-point repeat entries, and was applied to the RFA-, RFB-, and RFC-modified mastics. These repeat entries do not establish independent batch replication. The experimental results are presented in Table 5. In this table, A, B, and C denote the RFA, RFB, and RFC products, respectively; they are not replicate measurements of one product.
Table 5.
Box–Behnken experimental design and response data.
The experimental data were fitted using the least-squares method to develop nine second-order polynomial regression models, covering the three responses for each fiber type. Response-surface approaches have also been used for asphalt-related and pavement-material optimization [27,28,29]. The general model is expressed as follows:
where Y is the asphalt mastic response; X1, X2, and X3 are coded fiber content, mixing speed, and mixing time, respectively; β0 is the intercept; and βi, βij, and βii are the linear, interaction, and quadratic coefficients. The coding used for the RFA illustration is defined in Section 3.2.2.
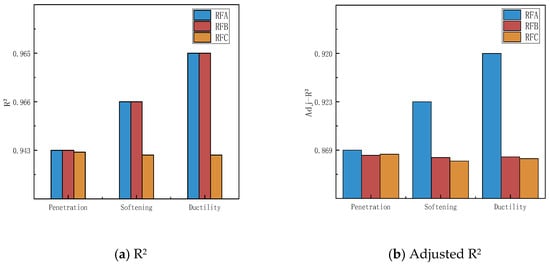
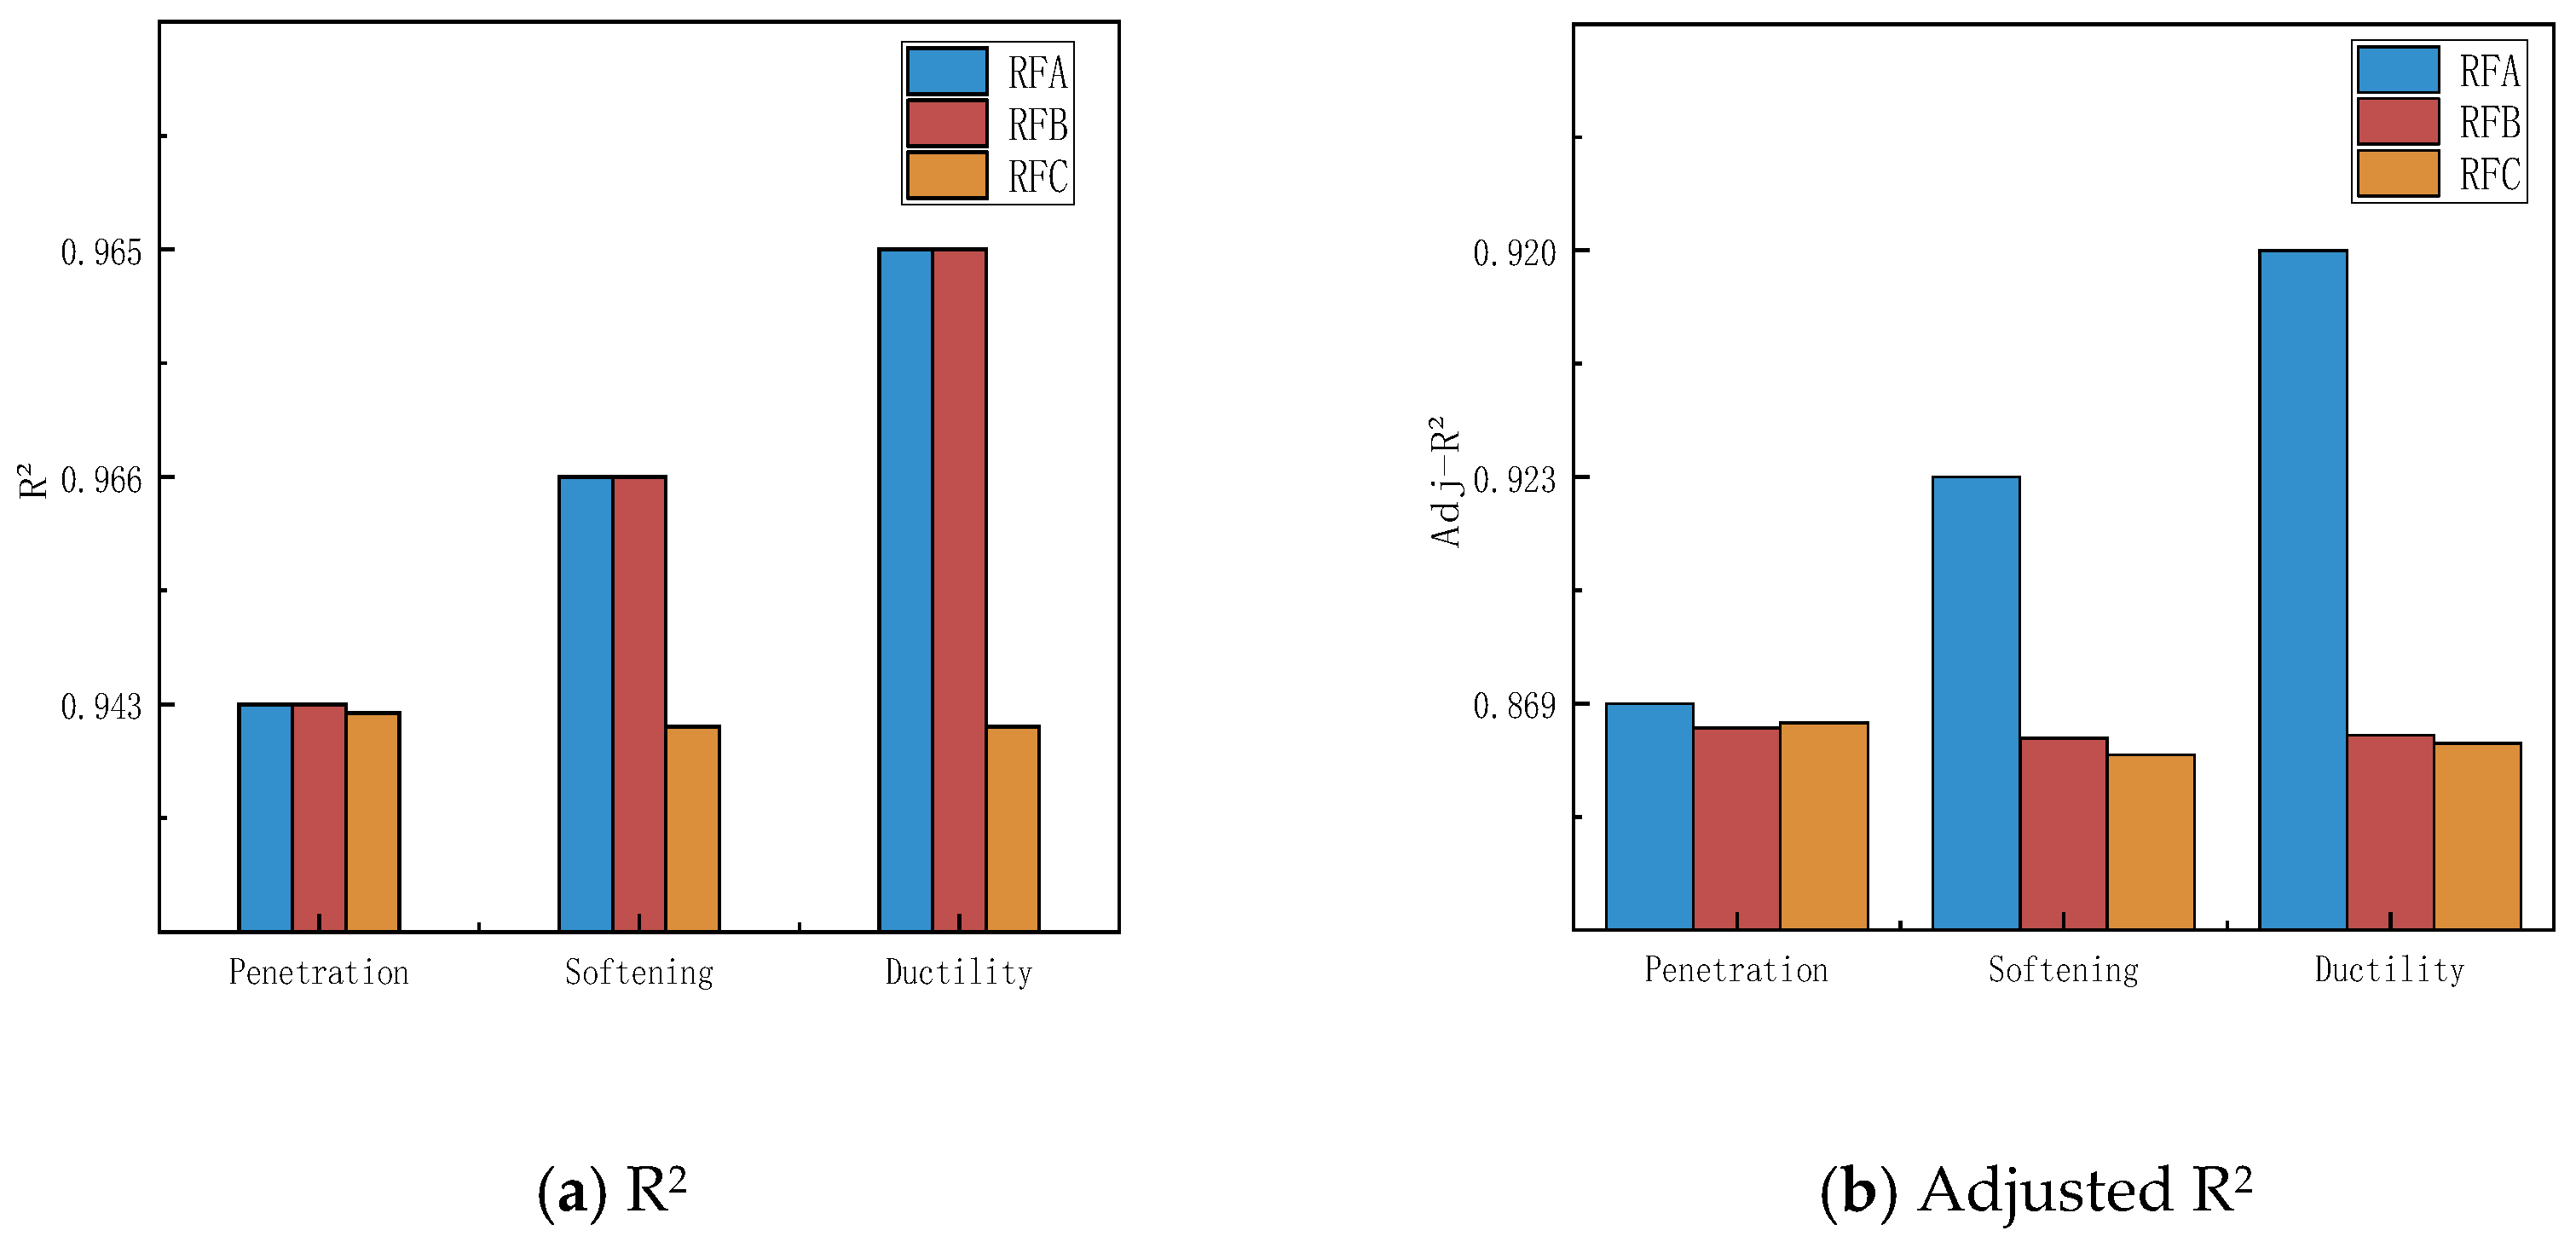
Analysis of variance (ANOVA) was performed to assess model significance, with terms considered statistically significant at p < 0.05. The coefficient of determination (R2) and adjusted coefficient of determination (Adj-R2) were also calculated to evaluate model fit. The significant terms and model fit statistics are summarized in Table 6 and Figure 4.
Table 6.
Reported significant model terms (p < 0.05).
Figure 4.
Reported model-fit statistics for the three recycled-fiber mastics: (a) R2 and (b) adjusted R2.
Fiber content was the main factor governing penetration, whereas mixing speed and time had secondary effects that depended on fiber type. Table 6 identifies X1 and X2 for RFA penetration, X1 and X12 for RFB, and X1 and X3 for RFC. Penetration ranged from 45.8 to 65.2 (0.1 mm). Increasing fiber content from 2% to 6% reduced penetration by up to 15.4 (0.1 mm), compared with variations of only 2–3 (0.1 mm) associated with mixing speed and time, consistent with the significance analysis. Penetration reflects mastic hardness at ambient temperature. Greater solid loading and a reduction in freely deformable binder may contribute to increased mastic hardness; adsorption was not measured independently. Mixing conditions primarily affect fiber dispersion and contact at the fiber–bitumen interface, with a much smaller influence on overall hardness.
Fiber content was the main factor controlling the softening point. Mixing time also contributed to high-temperature performance, whereas mixing speed had no significant effect. Table 6 identifies X1, X3, and X32 for the RFA softening point, X1 and X3 for RFB, and X1 for RFC. No significant mixing-speed term was identified in any of the three models. Softening points ranged from 46.8 to 61.2 °C. Increasing fiber content from 2% to 6% raised the softening point by up to 10.7 °C, whereas varying mixing speed from 600 to 1000 r/min produced changes of less than 1 °C. The softening point characterizes resistance to flow at elevated temperatures. Higher solid contents may restrict local flow, but a connected reinforcing network was not demonstrated. Mixing time may influence dispersion, although dispersion and its causal contribution to the measured response were not quantified directly.
Fiber content governed ductility, while mixing time affected only the RFA and RFB mastics. Table 6 identifies X1, X12, and X32 for RFA ductility, and X1, X3, and X12 for RFB. For RFC, only X1 was significant, with neither mixing speed nor mixing time showing a significant effect. Mixing speed was statistically insignificant in all ductility models. Ductility ranged from 7.79 to 16.83 cm and generally exceeded 10 cm at a fiber content of 2%, but decreased to as low as 7.79 cm at 6%. These results indicate that increasing fiber content reduces the low-temperature deformation capacity of the mastic. At low contents, fibers can redistribute internal stresses caused by thermal contraction. Excessive fiber contents, however, promote agglomeration and create weak regions that impair tensile deformation capacity. Adequate mixing can disperse agglomerates, reduce internal defects, and improve low-temperature ductility. The weaker mixing-condition dependence reported for RFC in these models does not establish batch-to-batch process stability or tolerance during field production.
The PE review [20] and PET-binder study [21] likewise considered consistency changes alongside rheological performance. These studies provide context for the conventional mastic tests but do not establish identical modification mechanisms for thermoplastics and glass/cured-resin fragments.
3.2.2. Response Surface Analysis
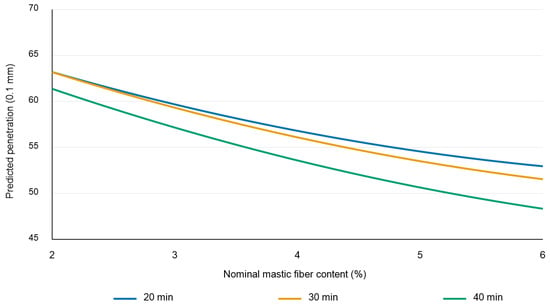
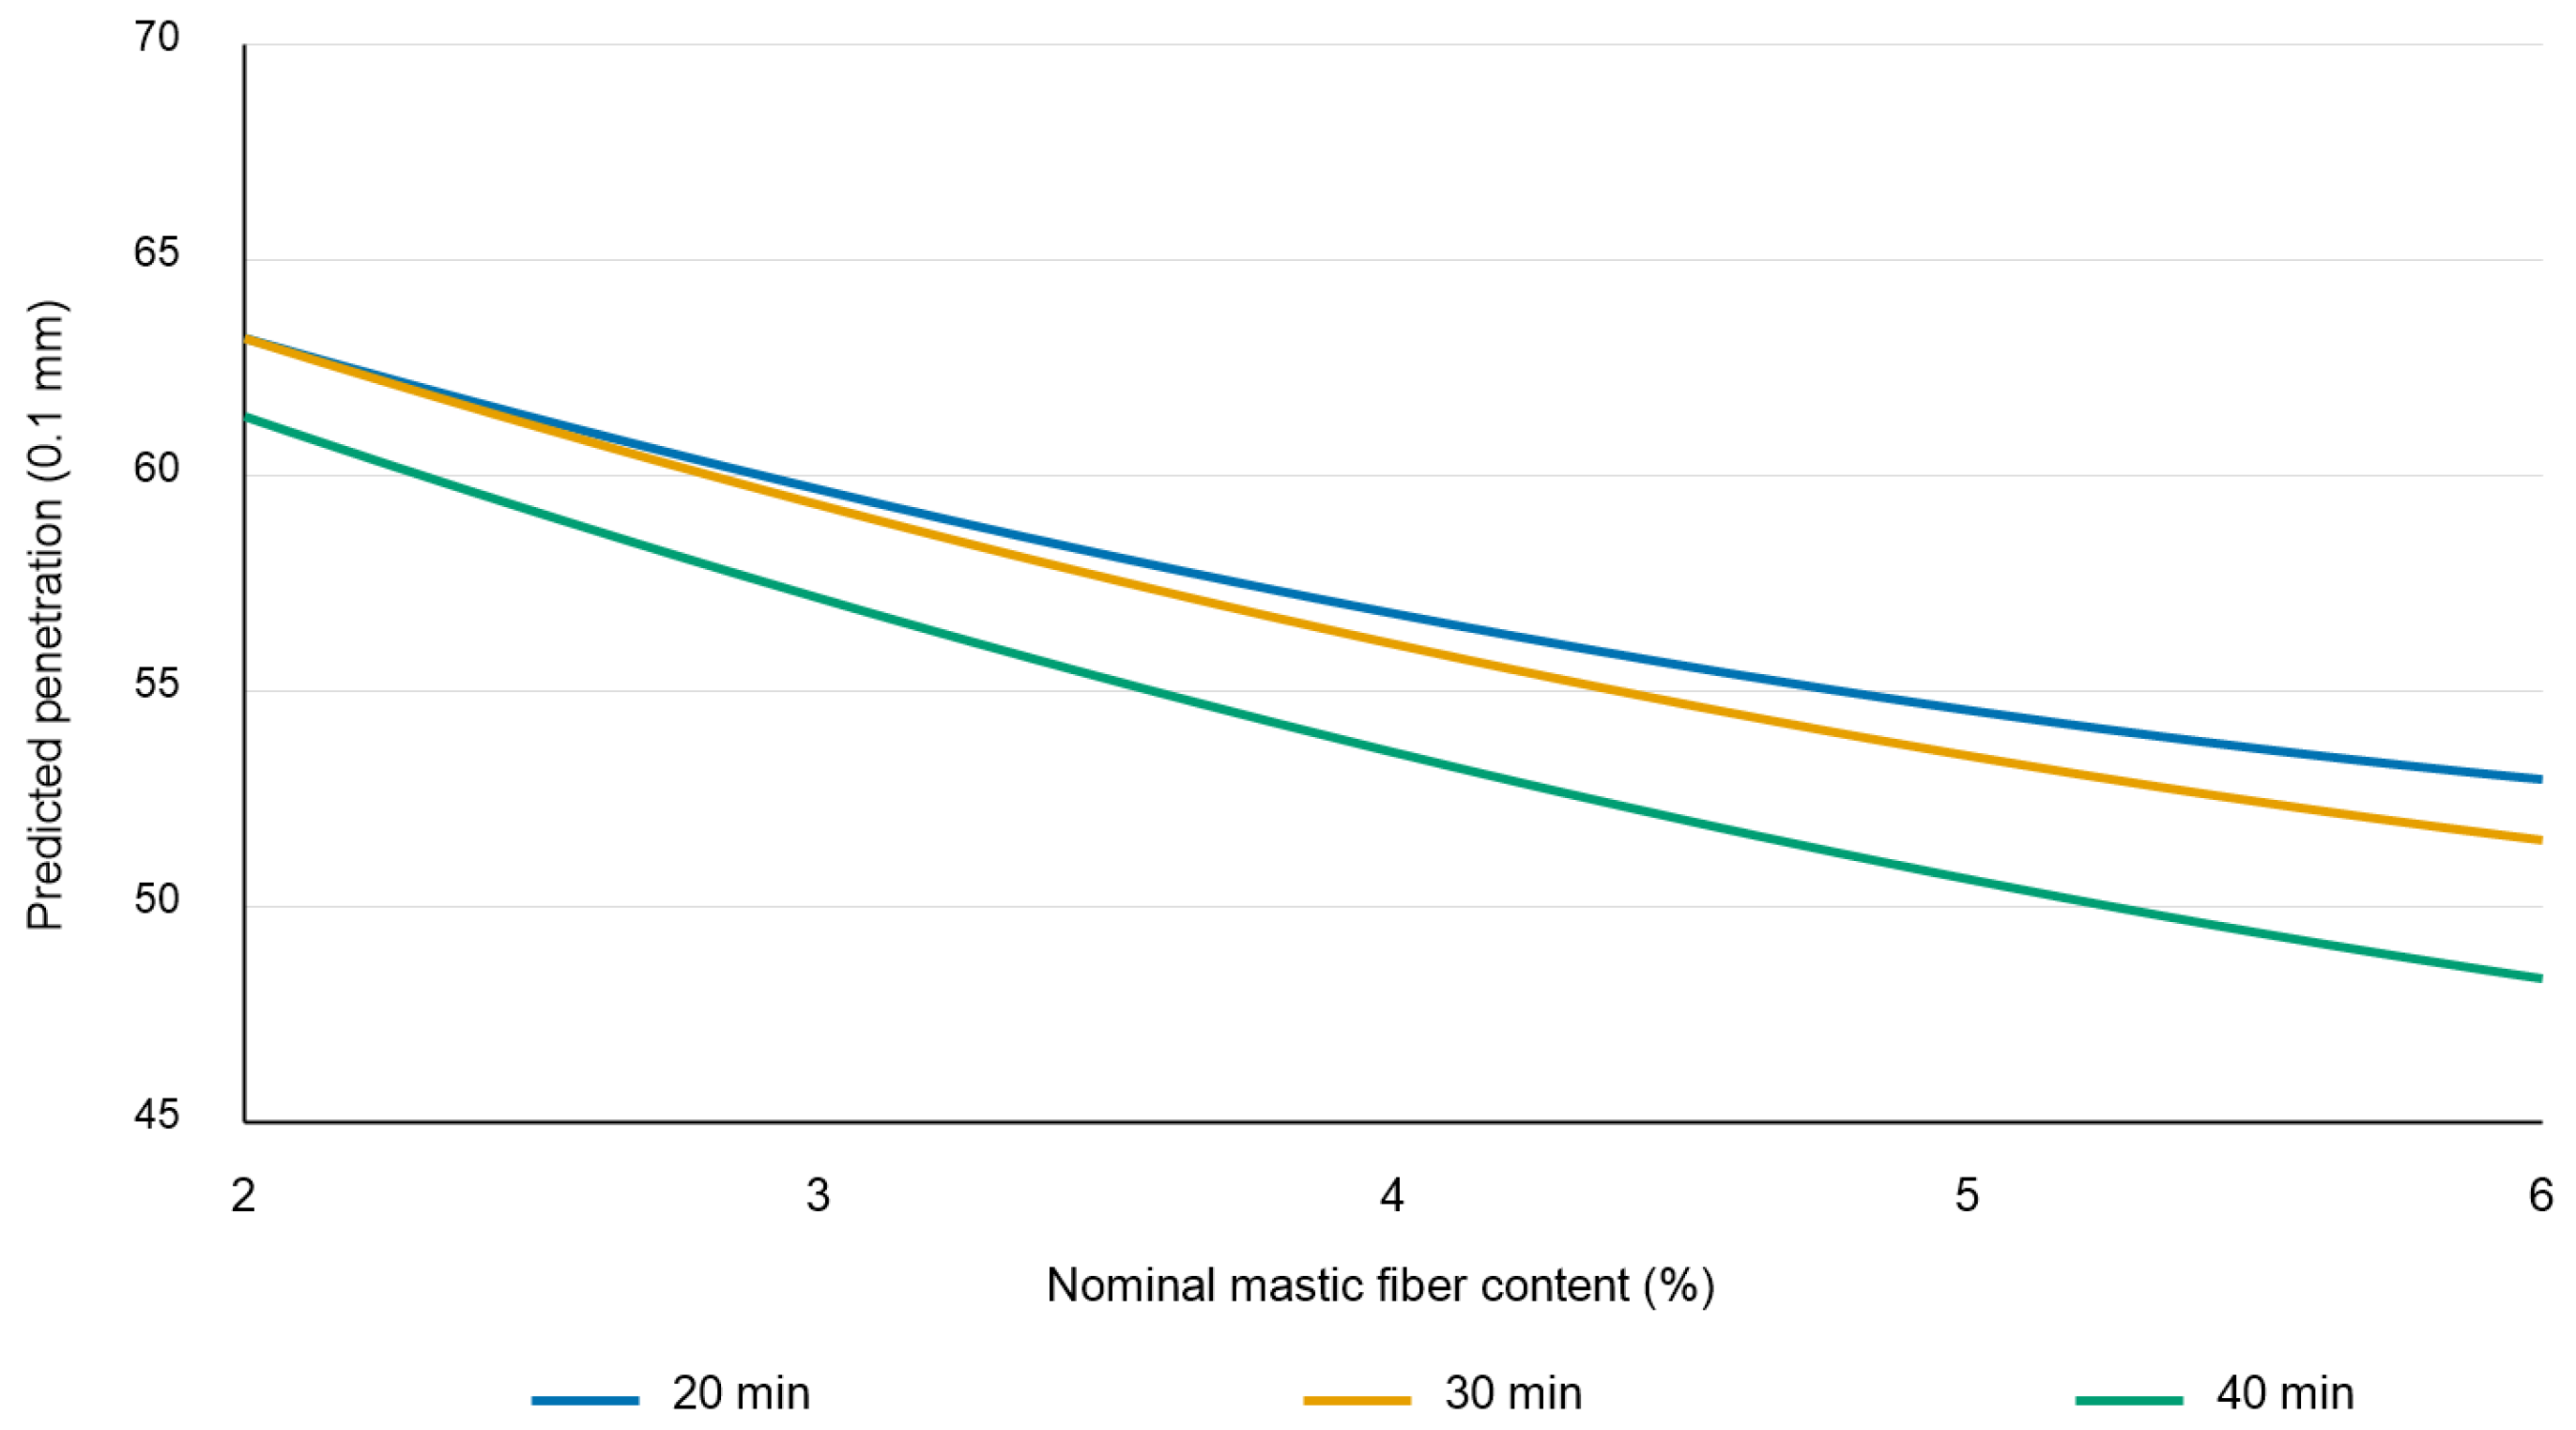
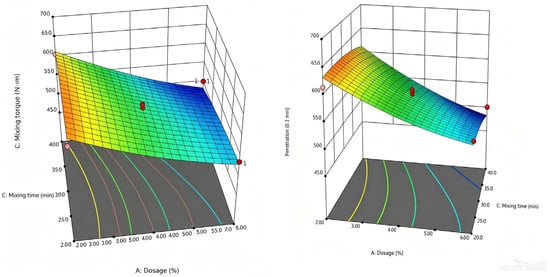
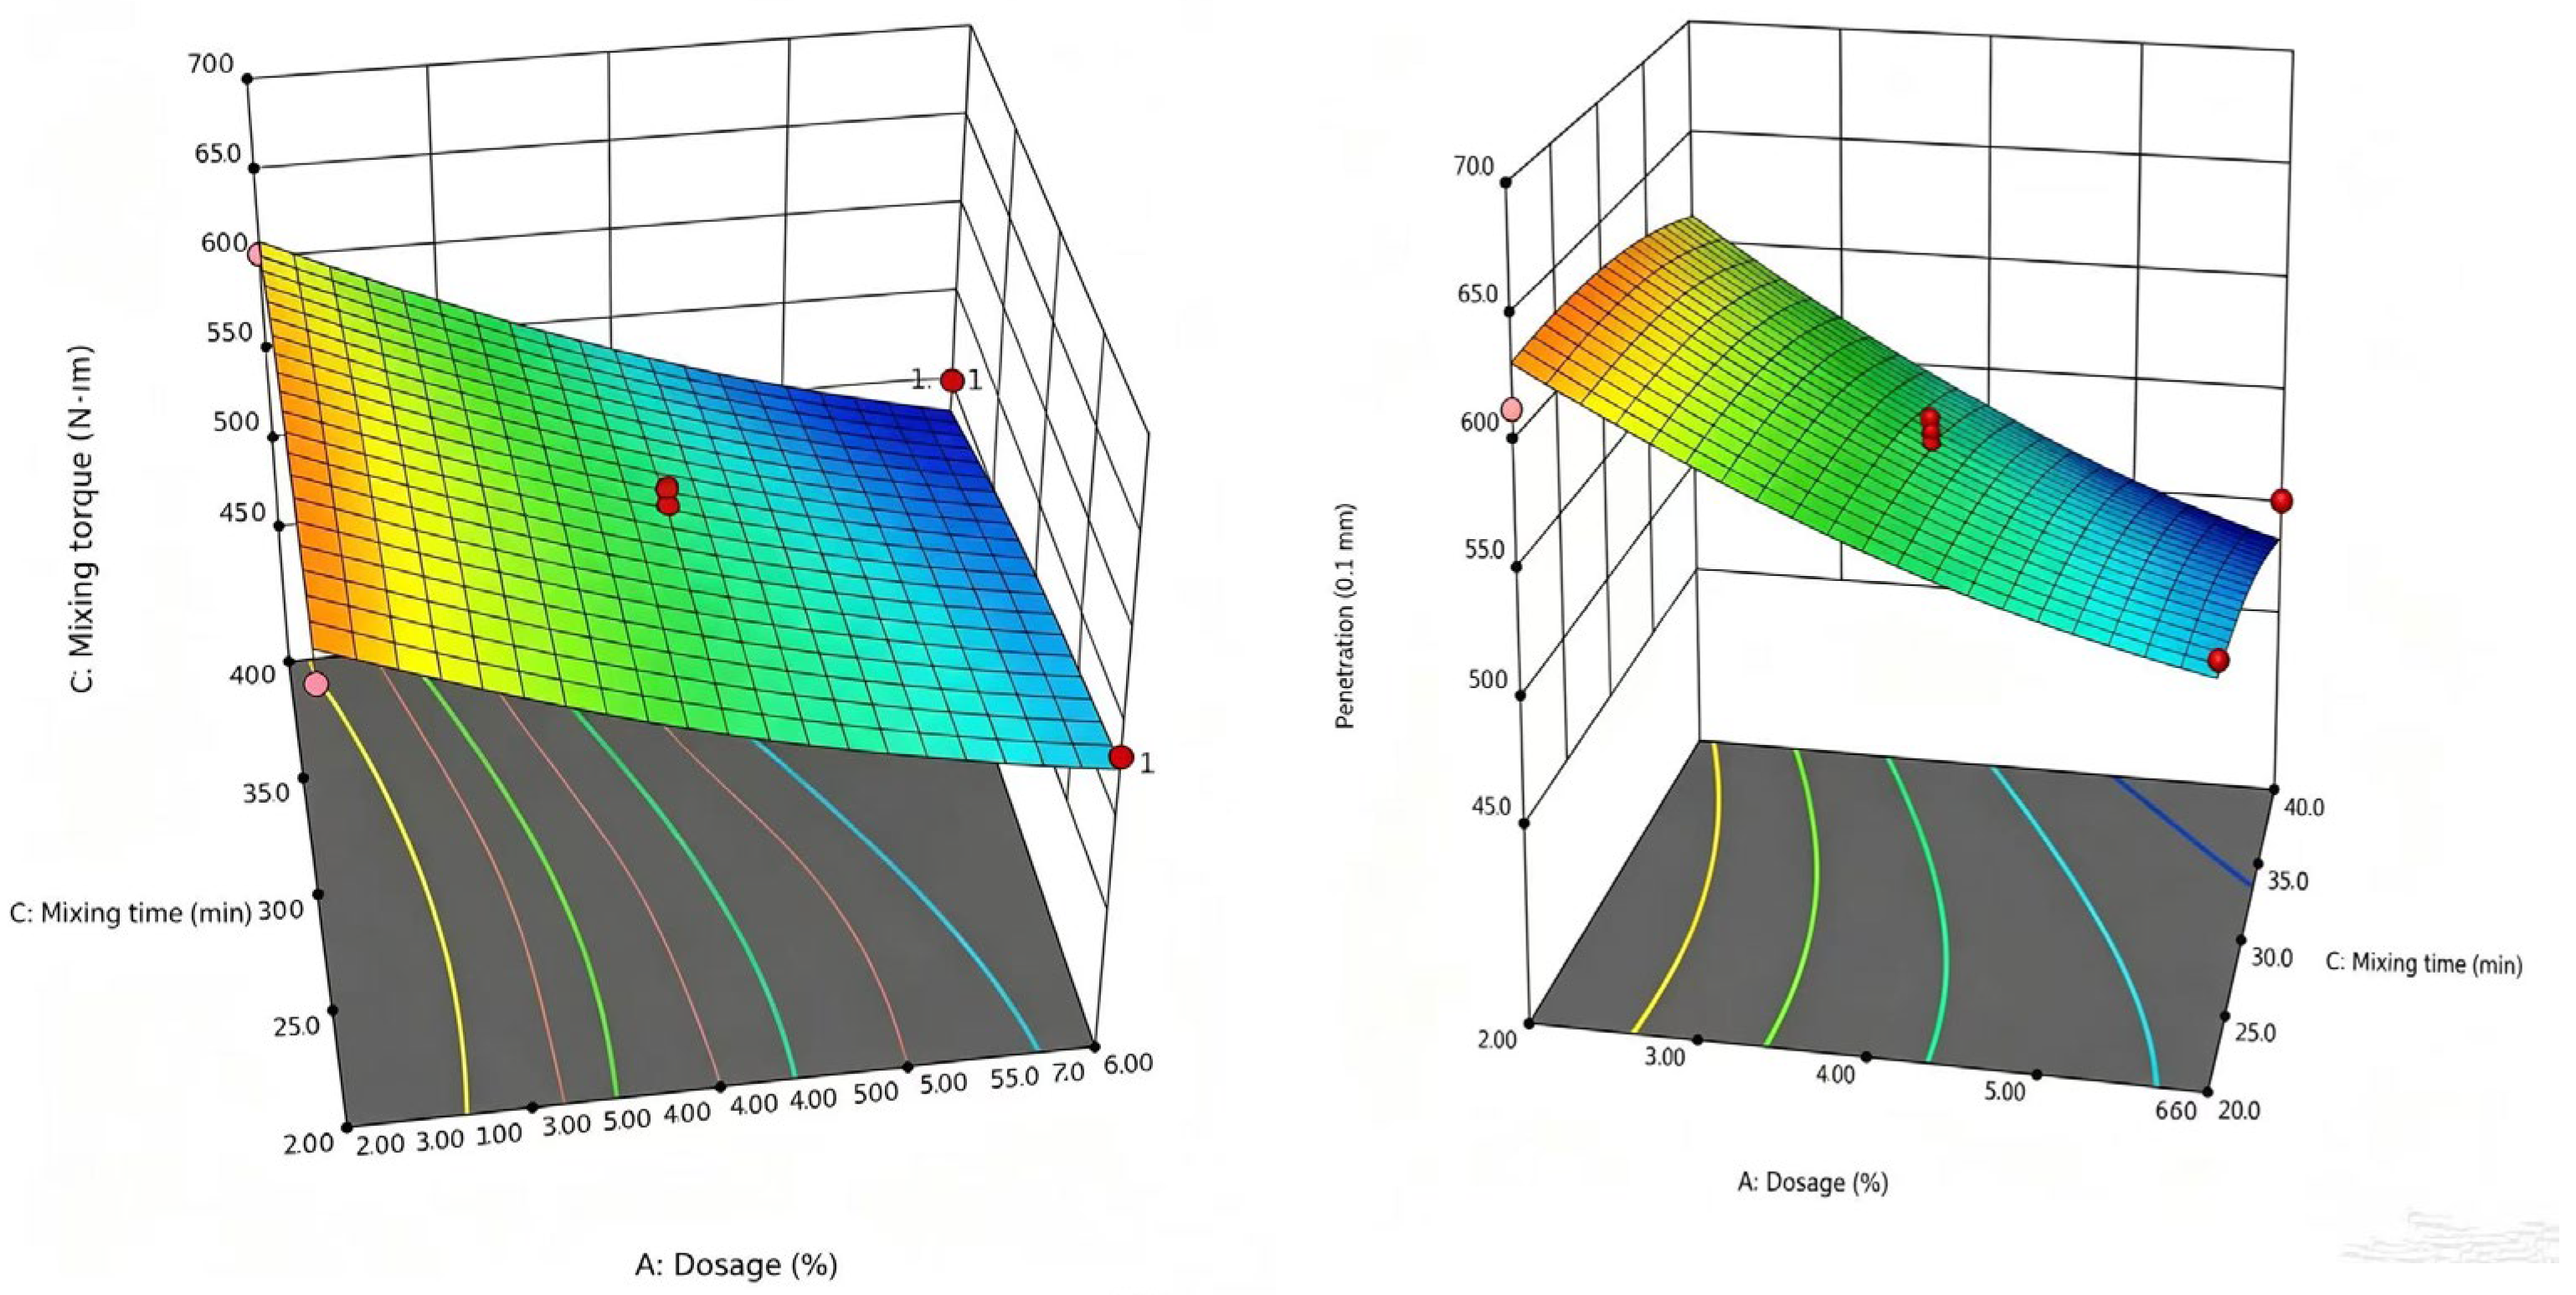
Figure 5 illustrates predicted RFA penetration at a fixed mixing speed of 800 r/min and mixing times of 20, 30, and 40 min. The curves use the supplied RFA polynomial and coded factors: X1 = (fiber content in % − 4)/2, X2 = (mixing speed in r/min − 800)/200, and X3 = (mixing time in min − 30)/10. These curves are model predictions rather than additional measurements. The corresponding response surfaces are shown in Figure 6
Figure 5.
Predicted RFA penetration versus fiber content by total mastic mass at 800 r/min.
Figure 6.
Response surfaces for RFA mastic penetration versus fiber content and mixing time at a fixed mixing speed of 800 r/min. (Colors indicate predicated penetration (blue: low; orange: high).Base-plane contours show equal values. Red and pale-pink circle mark design points above and below the fitted surface, respectively).
Within the illustrated factor range, increasing fiber content reduces predicted penetration. Curvature reflects the terms in the supplied polynomial. This illustration supports interpretation within the modeled domain but does not establish independent predictive validation, model adequacy for every product, or transferability to mixture production. Dispersion, wetting, and fragmentation remain possible explanations for mixing-condition effects rather than directly demonstrated mechanisms.
3.2.3. Selected Processing Conditions and Prediction Comparison
Multi-response optimization was performed using the second-order regression models to optimize the overall performance of asphalt mastics containing recycled fibers. Penetration was constrained to 40–60 (0.1 mm), while the softening point and ductility at 15 °C were maximized to balance consistency and high- and low-temperature performance. A desirability function approach was adopted, in which each response was normalized to an individual desirability value. The overall desirability D was calculated as their geometric mean, with values closer to 1 indicating better satisfaction of the optimization objectives. The reported candidate mixing parameters and predicted responses for the three fiber types were obtained through calculations in Design-Expert, as presented in Table 7. Complete numerical desirability limits and weights are not provided, and independent replicate-level validation is not established. These settings are therefore candidates rather than demonstrated optima.
Table 7.
Reported candidate preparation conditions and predicted responses.
A pronounced trade-off existed between the high- and low-temperature properties of the recycled fiber mastics. Multi-response optimization therefore identified a compromise among the performance objectives. Overall desirability ranged from 0.473 to 0.619, indicating that the objectives could not be fully satisfied simultaneously. This limitation arose because fiber contents and mixing times that improved high-temperature stability could reduce low-temperature flexibility, creating competing requirements within the optimization.
Differences in macroscopic and microscopic fiber morphology affected the response to processing conditions and the potential for optimization. RFA achieved the highest overall desirability, followed by RFC and RFB. The RFA-modified mastic had the highest reported desirability under the specified objectives; this does not establish an independently validated optimum. In contrast, the conflicting responses of RFB mastic properties to processing parameters limited its optimization potential, consistent with the preceding response surface analysis.
Table 8 compares reported experimental and predicted responses at the candidate settings in Table 7. The specimen counts, batch identities, and independence from model-fitting preparations are not documented. The table is therefore a numerical comparison rather than independent validation of predictive performance.
Table 8.
Comparison of reported experimental and predicted responses.
Absolute relative error (%) = 100 × |experimental value—predicted value|/predicted value. From the displayed values in Table 8, errors round to 1.6–3.9%, with a mean of approximately 2.7%. This numerical agreement does not quantify predictive uncertainty. Without replicate-level dispersion and independently documented validation batches, model adequacy and optimum-setting reproducibility remain unestablished. The selected fiber contents were 3.94% for RFA, 4.27% for RFB, and 3.45% for RFC, by total mastic mass. These mastic settings are distinct from the fixed 0.3% fiber dosage by total mixture mass and have not been validated as AC-13 production conditions.
3.3. High-Temperature Stability
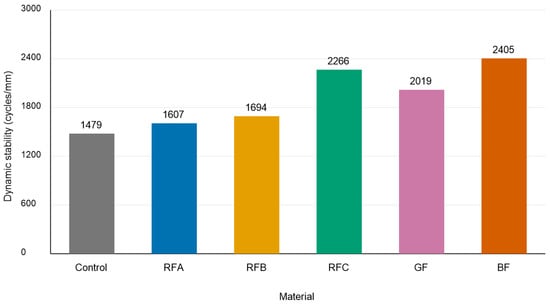
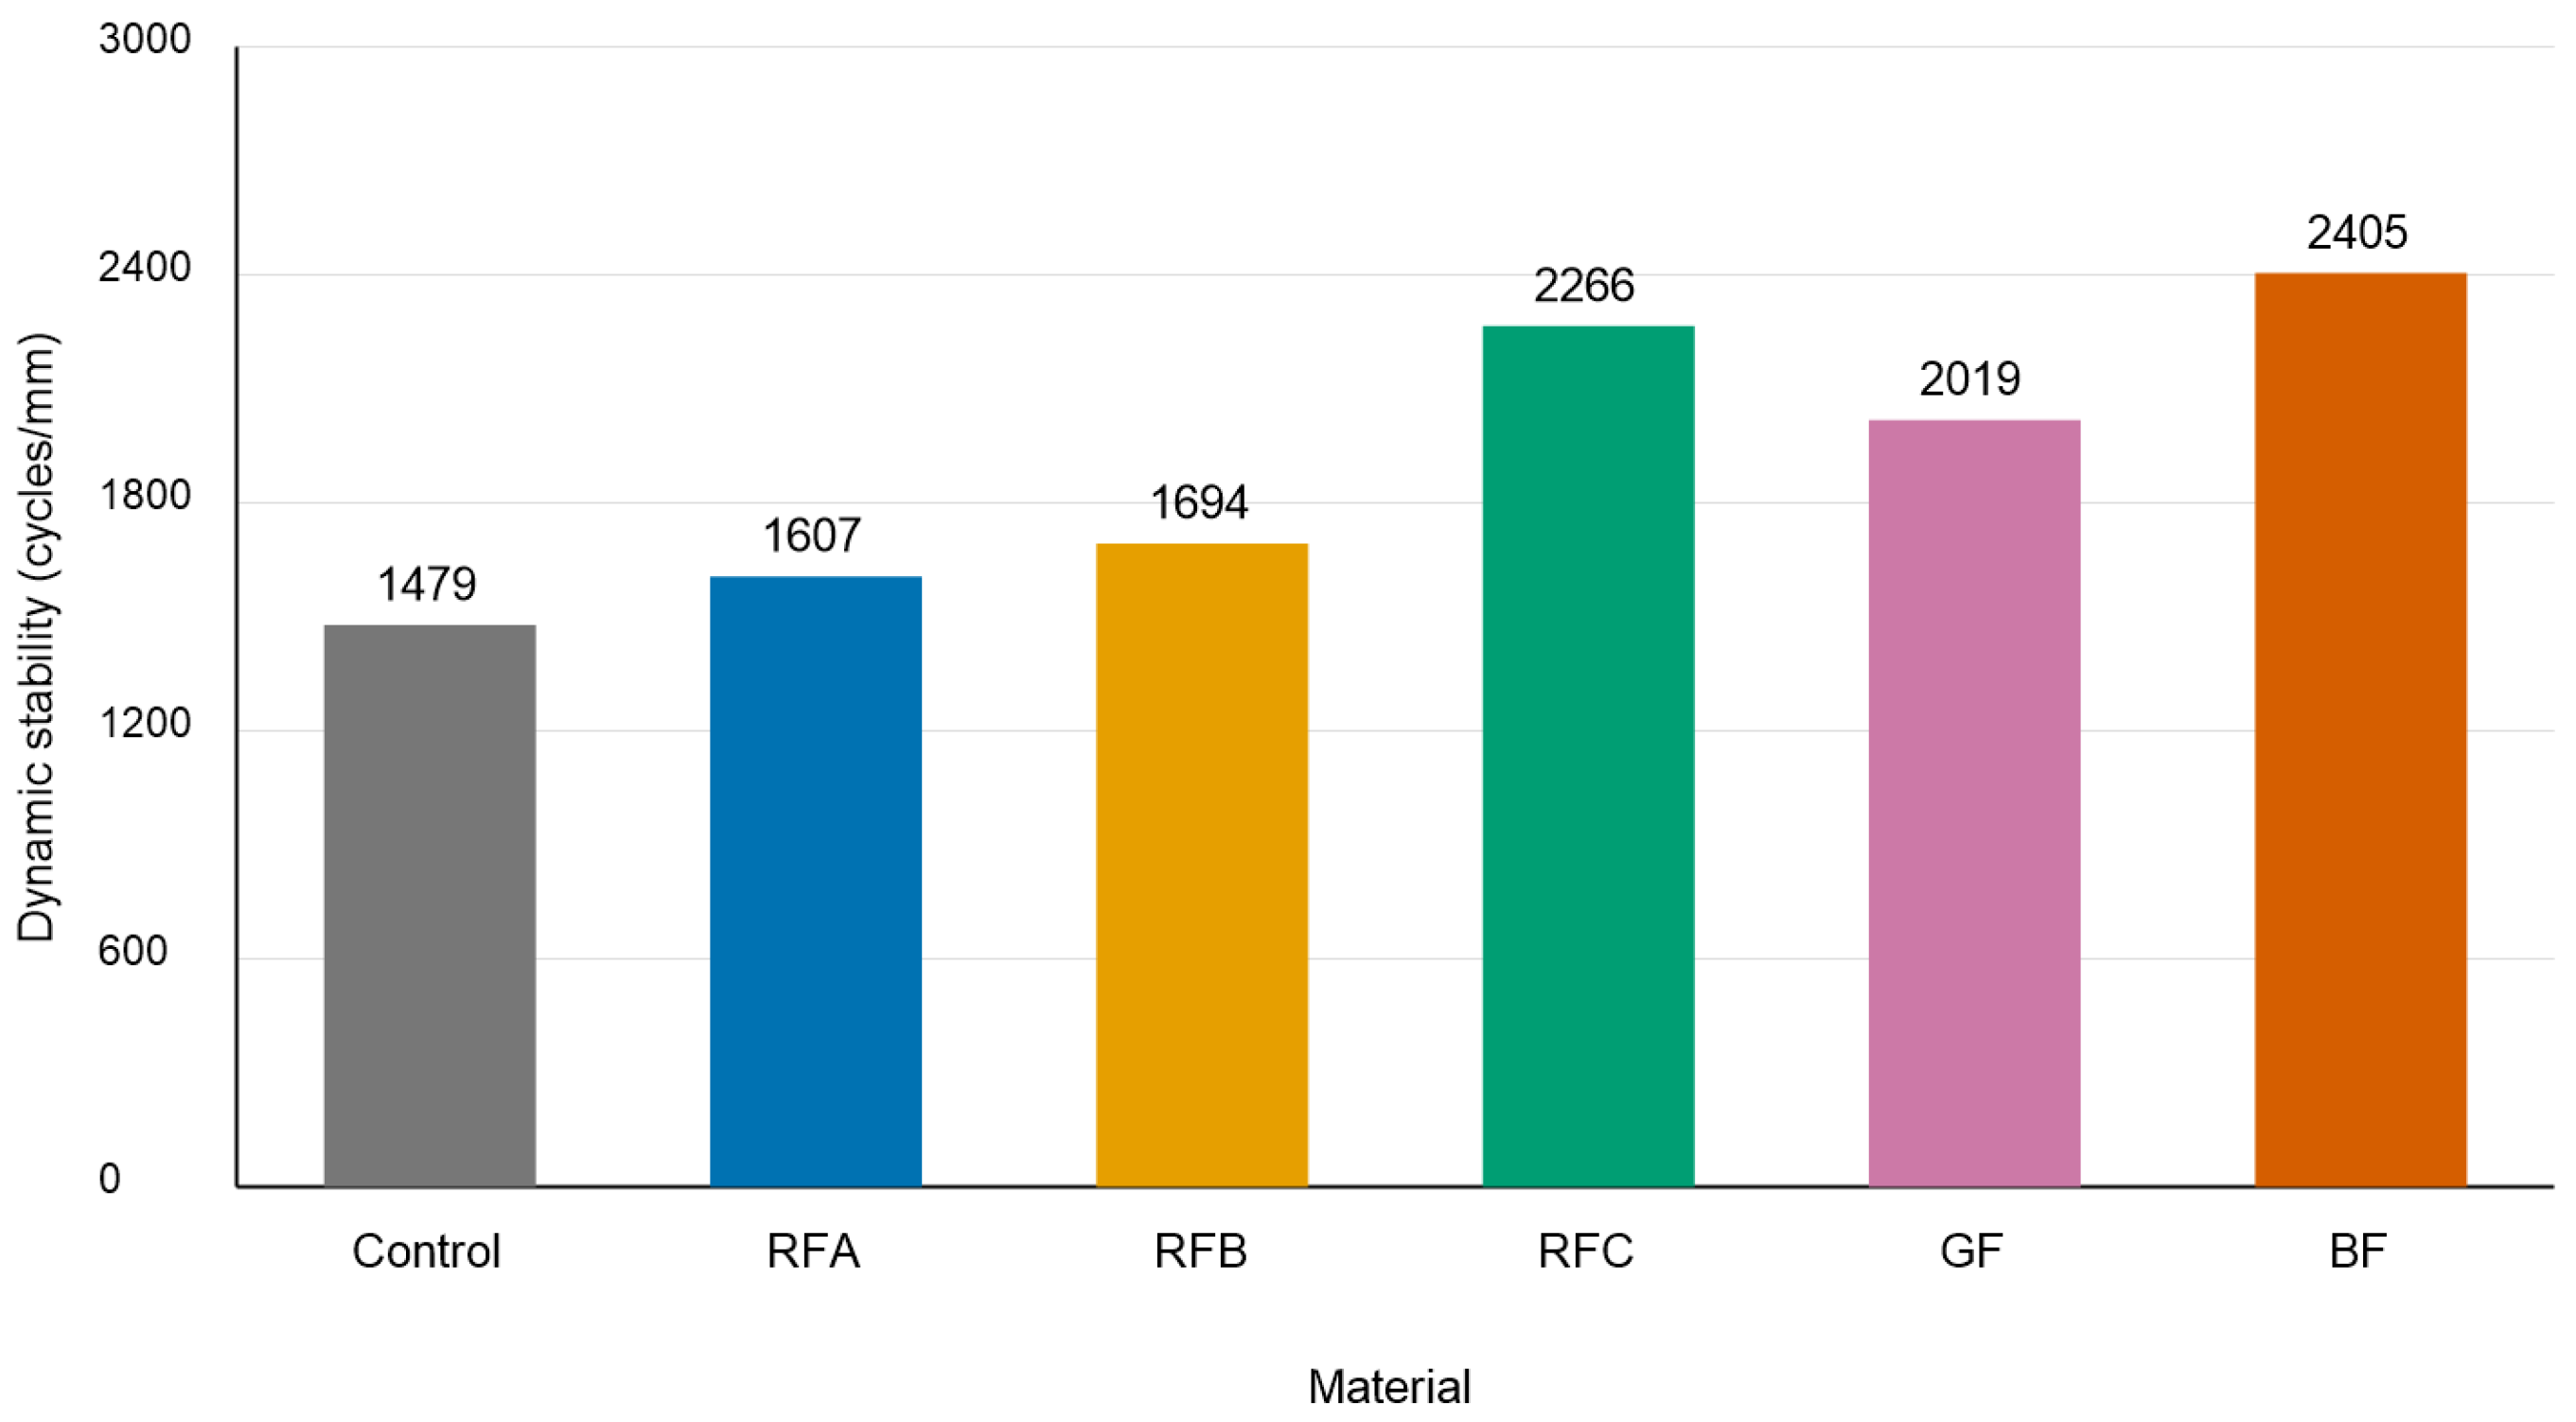
The wheel-tracking test results are shown in Figure 7.
Figure 7.
Dynamic stability of the reference and fiber-modified mixtures.
The five fiber-modified mixtures had higher reported dynamic stability than the fiber-free reference under the wheel-tracking conditions. These differences are descriptive and do not establish statistical significance. Fiber–mastic contact, local filling, and stress redistribution may contribute to the observed response, but a continuous reinforcing network, binder adsorption, and crack bridging were not demonstrated directly.
The recycled products produced different high-temperature responses. RFA and RFB gave smaller increases than RFC. RFC had a reported dynamic stability of 2266 cycles/mm versus 1479 cycles/mm for the reference, an increase of 53.2%. Its finer fragments may improve contact with the mastic and contribute to local filling or stress redistribution. SEM observations support product-specific morphological differences but do not isolate which feature caused the performance change.
BF had the highest reported dynamic stability, followed by RFC and GF. RFC therefore exceeded GF while remaining below BF in this comparison. Different OACs and volumetric structures may also contribute to this ordering, which cannot be attributed entirely to fiber morphology. The filler comparison [23] similarly showed material-dependent rutting responses, including increased deformation with glass filler. Although the glass-powder study [19] reported improved rutting parameters and creep responses, those findings do not imply that every glass-containing modifier improves wheel-tracking performance. PET-mixture [22] and olive-husk-ash [24] dynamic-creep studies provide complementary evidence on repeated-load deformation, but their test conditions and dosage bases differ from the present 0.3% fiber dosage by total mixture mass.
3.4. Low-Temperature Cracking Resistance
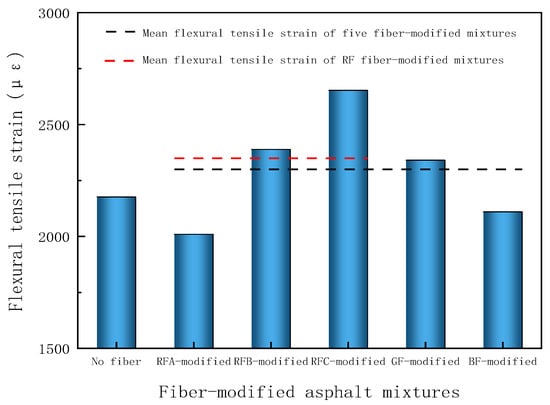
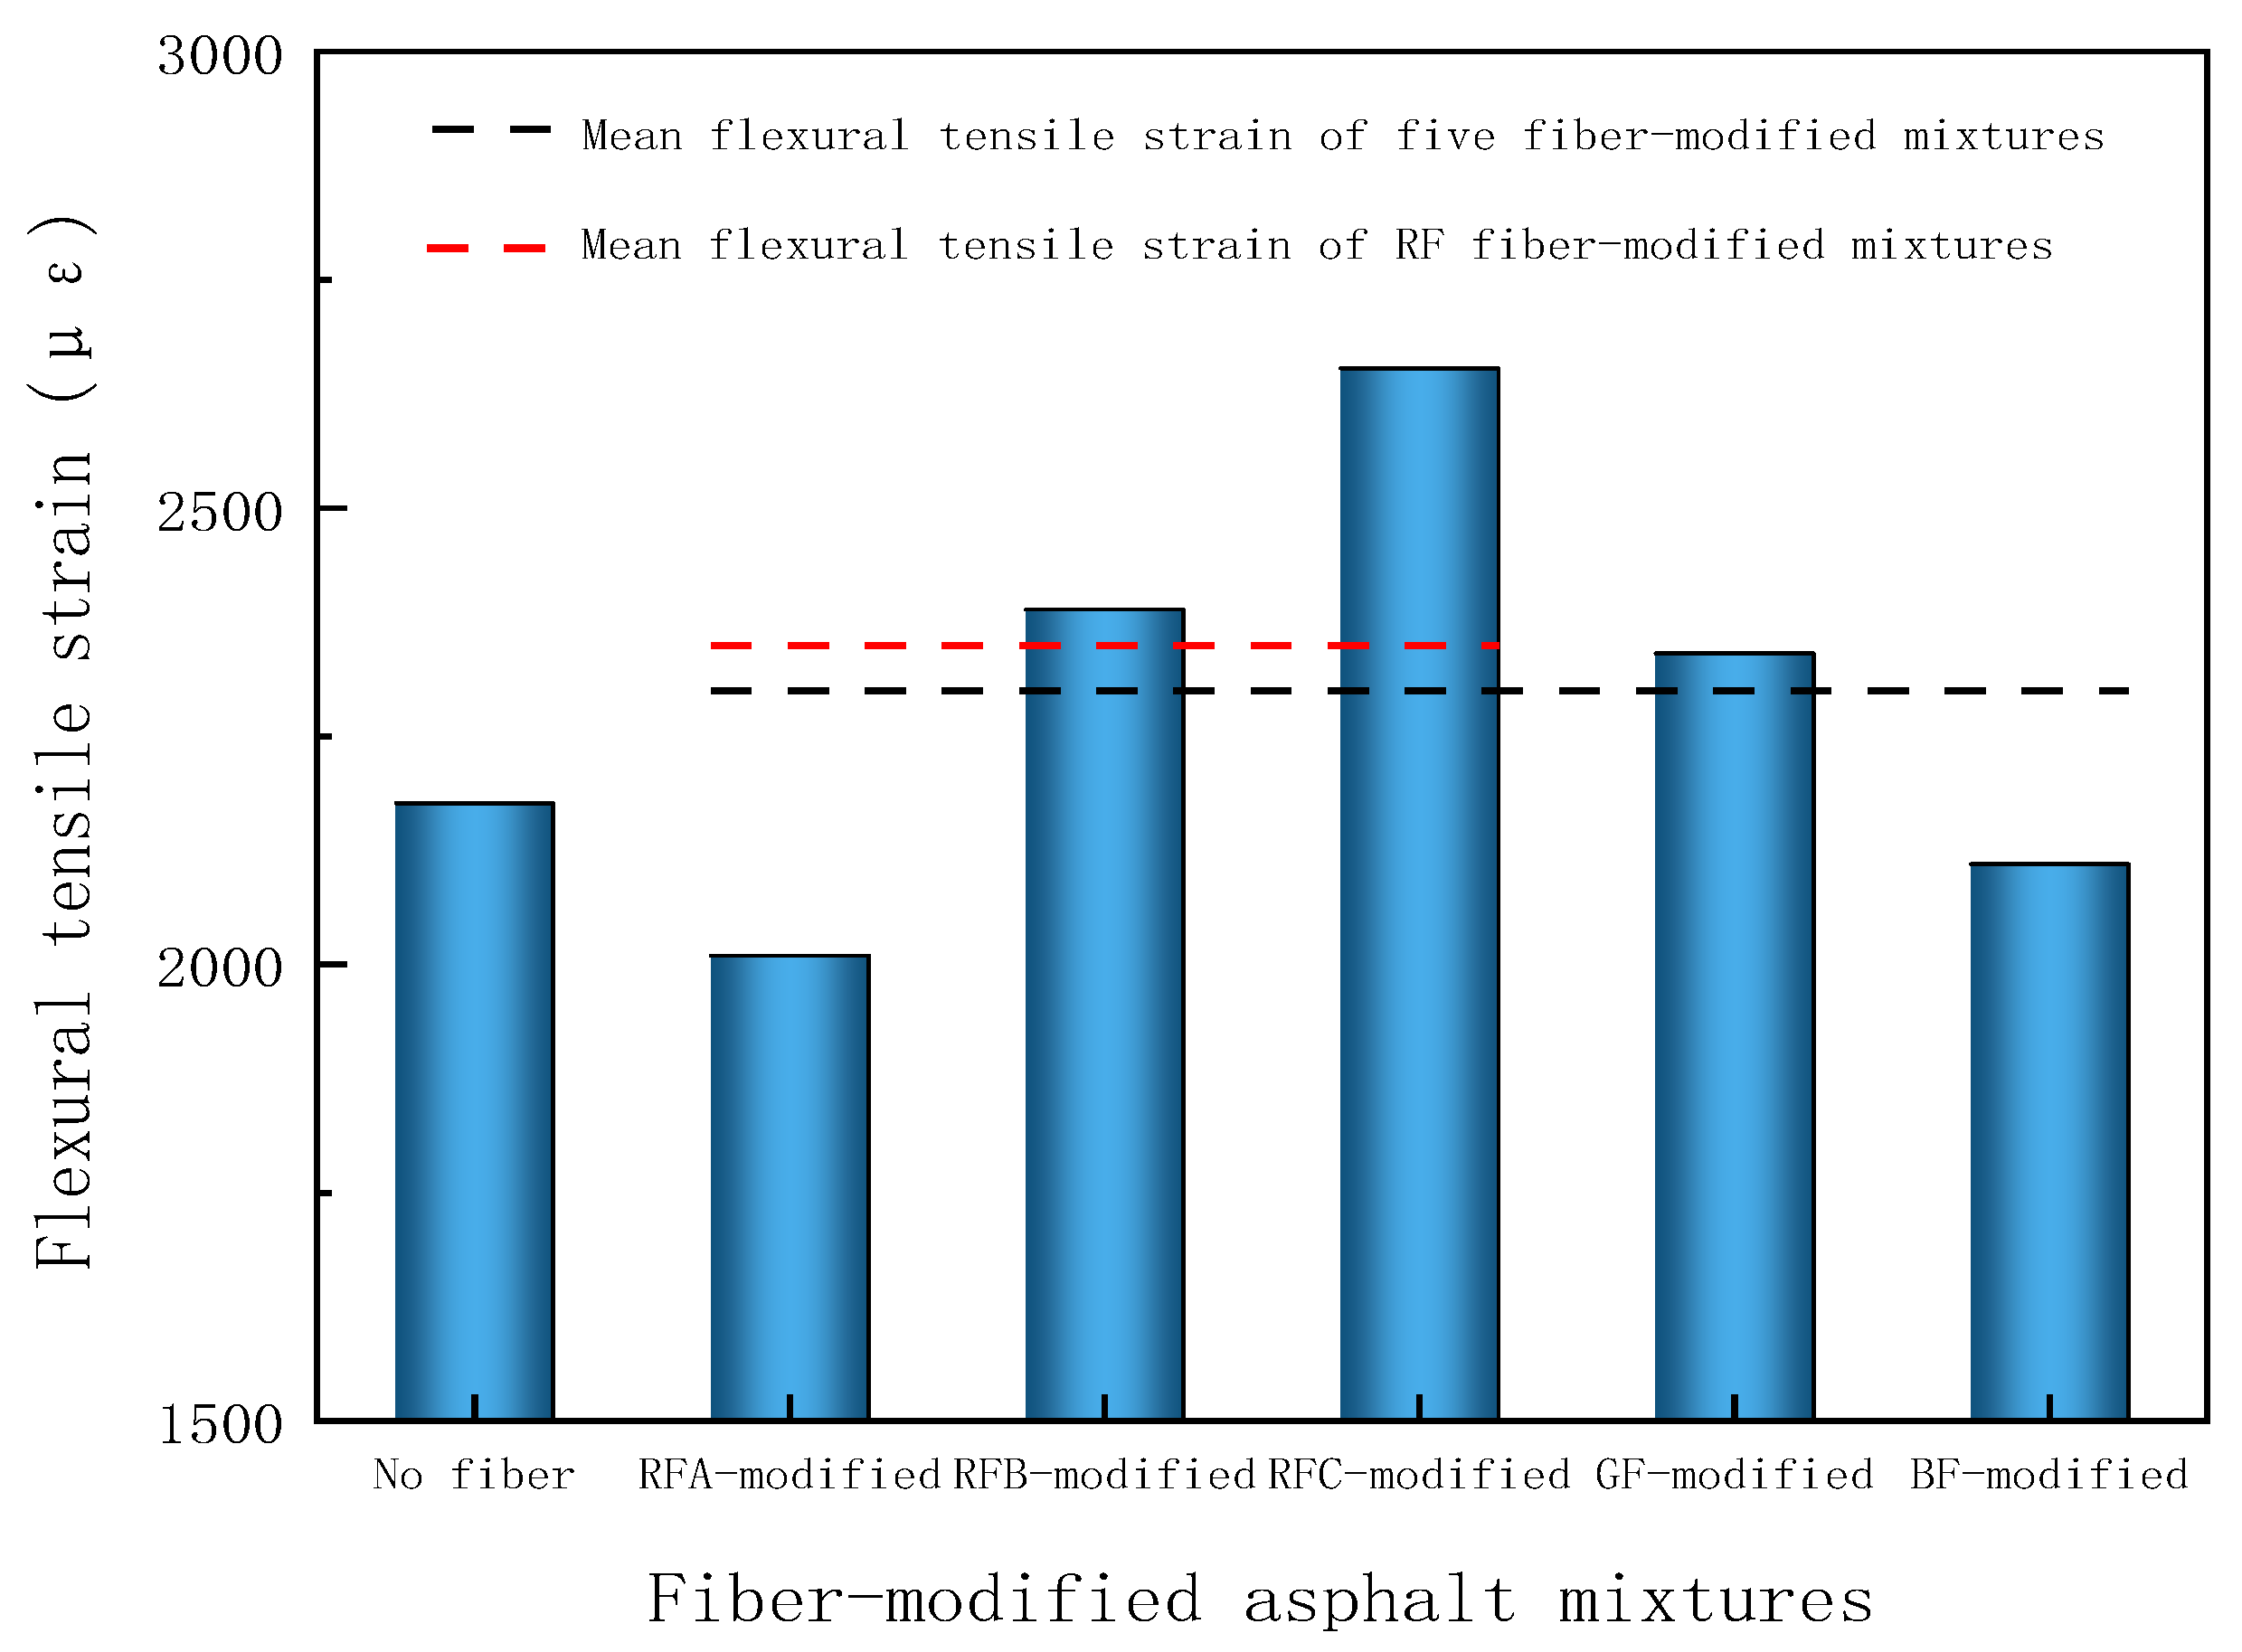
The results of the low-temperature beam bending test are shown in Figure 8.
Figure 8.
Flexural tensile strain at failure.
The low-temperature responses differed among formulations, so fiber incorporation did not uniformly improve cracking resistance. Averages across different formulations summarize the tested group but do not estimate repeatability or uncertainty within each formulation. Fine fragments may redistribute local bending stresses; the present tests do not demonstrate a continuous reinforcing network or directly quantify crack propagation.
RFC had the highest reported flexural tensile strain at failure, 2651 με. RFA and BF were below the fiber-free reference, whereas RFB, RFC, and GF were above it in Figure 8. The fine RFC fragments may facilitate dispersion and local stress redistribution, while elongated RFA fragments may be more susceptible to clustering. These explanations remain qualitative because dispersion, interfacial stress transfer, and crack propagation were not independently quantified.
The results concern deformation at failure under the specified low-temperature bending conditions and do not establish long-term cracking life or statistical superiority. Mastic behavior cannot be assumed to transfer directly to mixtures containing an aggregate skeleton. The PET-mixture study [22] included fatigue testing in addition to Marshall and dynamic-creep measurements, illustrating the value of complementary loading modes; its fatigue findings cannot validate blade-fiber fatigue resistance.
3.5. Moisture Resistance
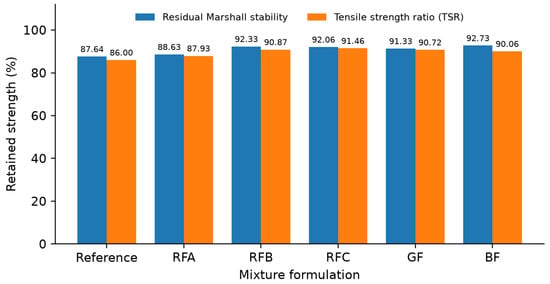
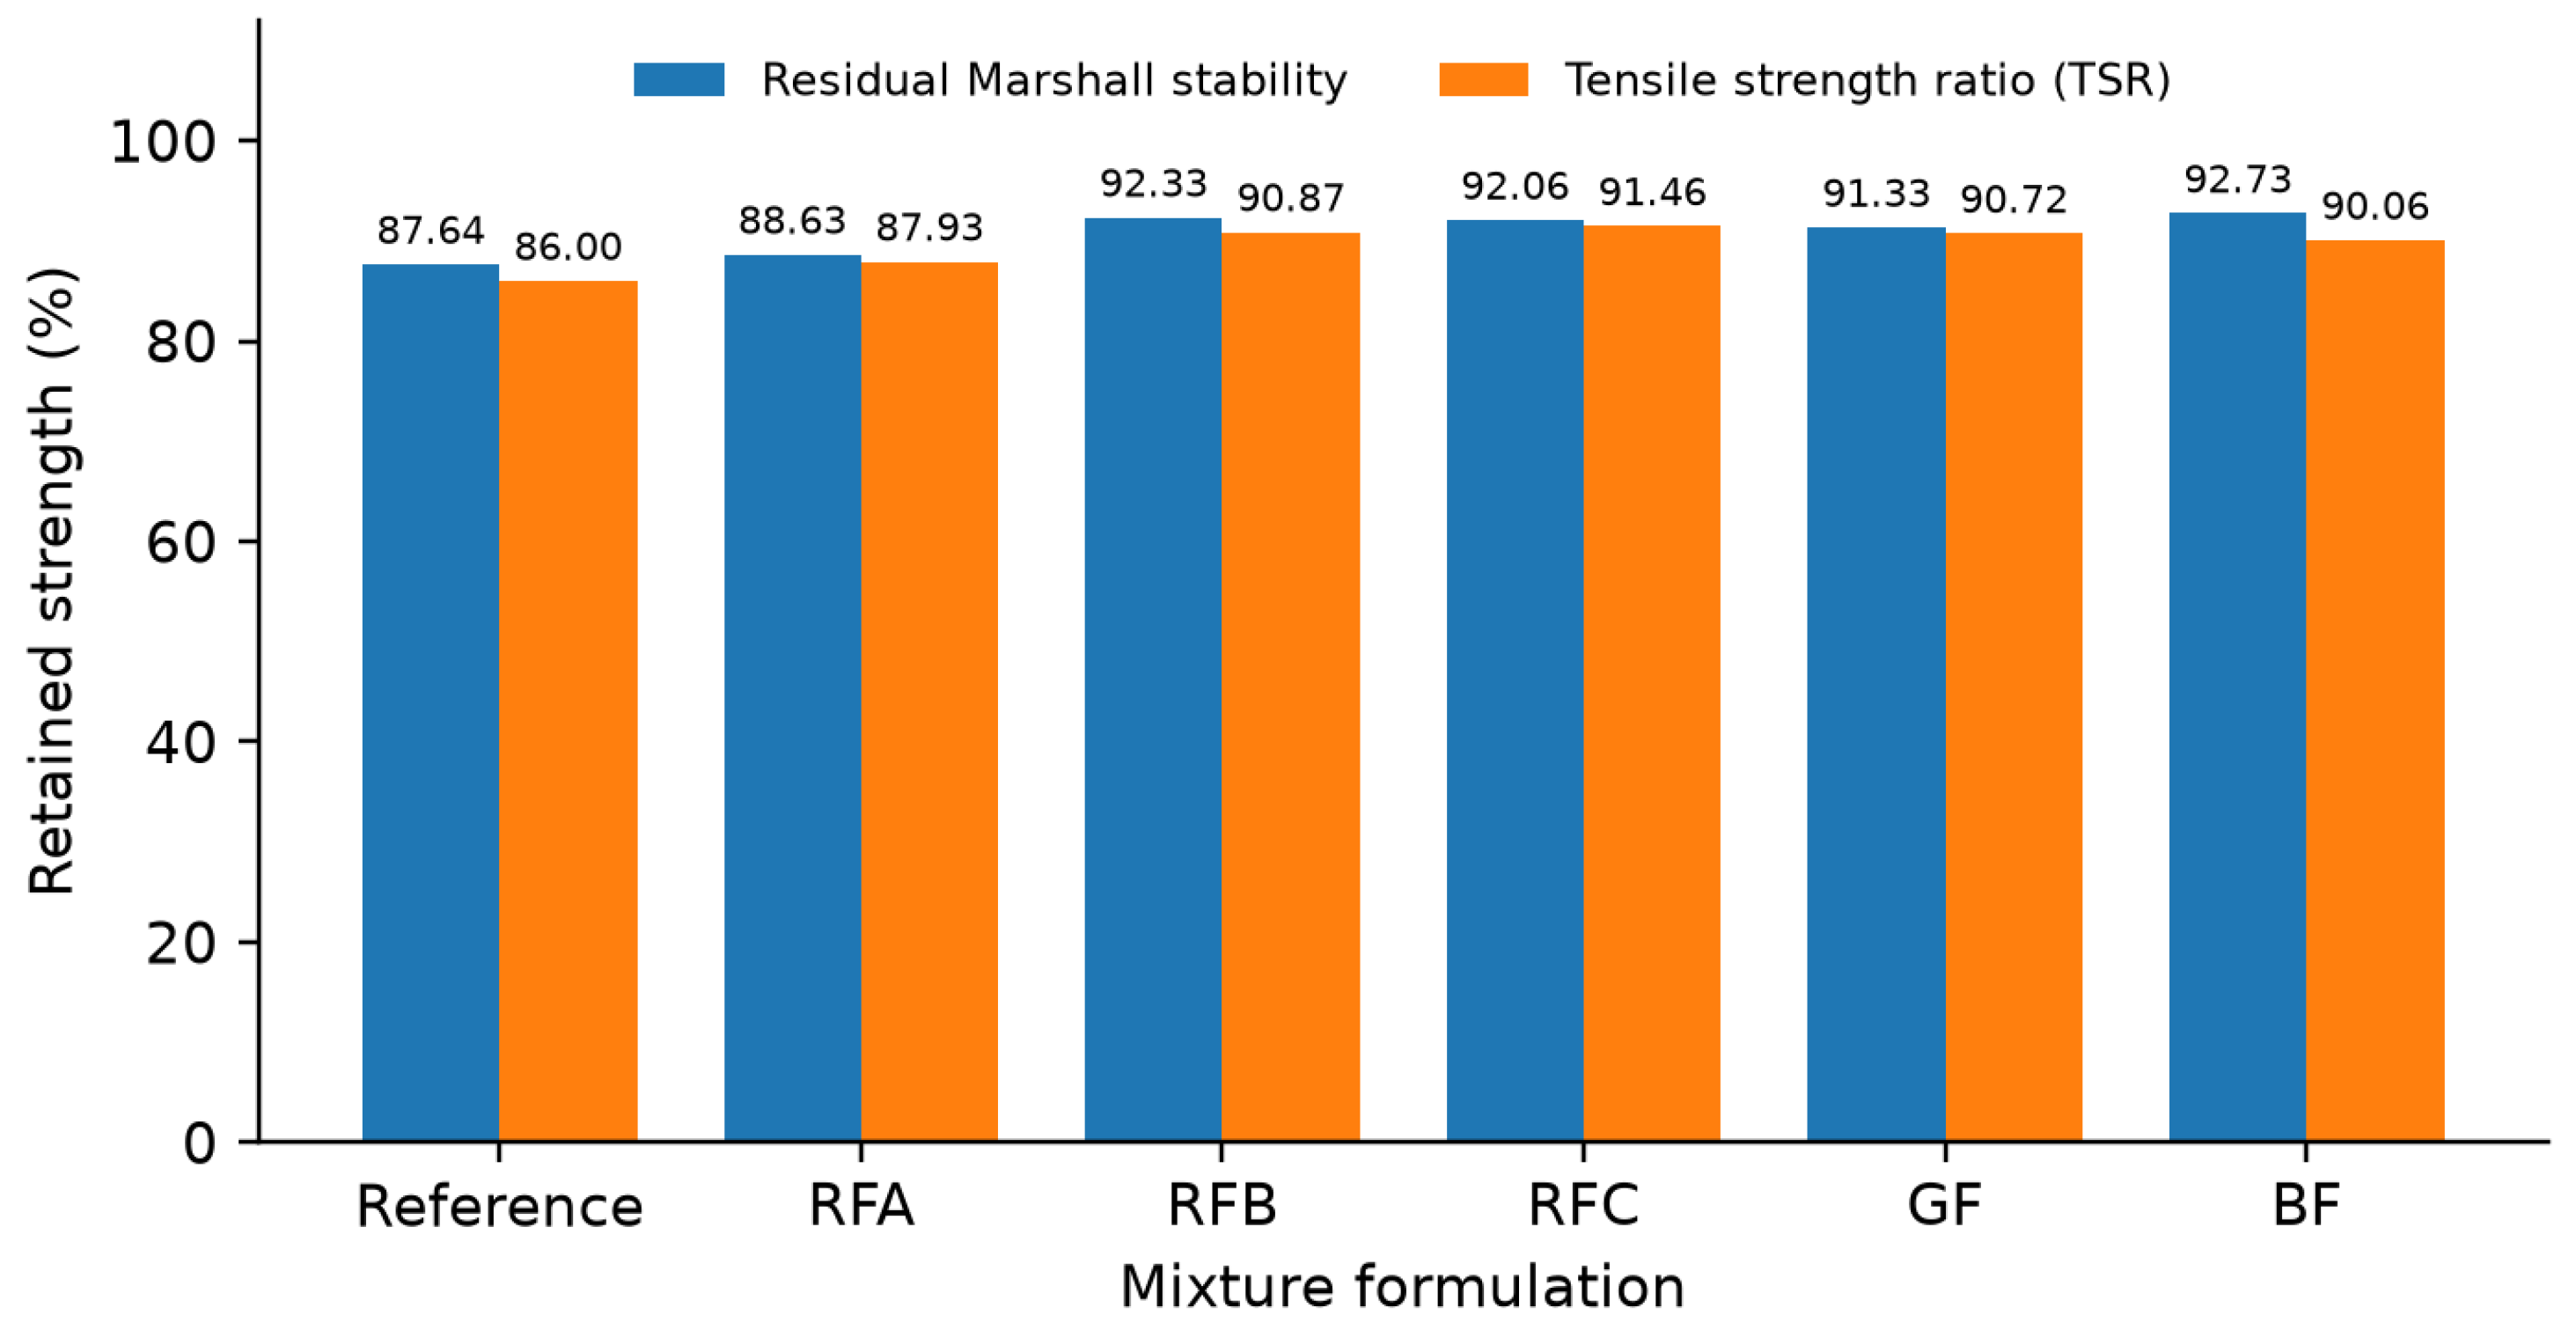
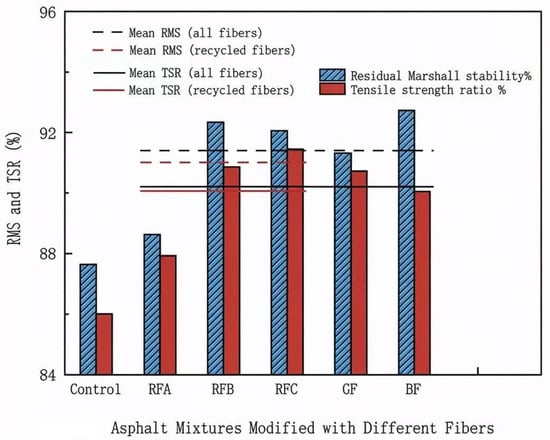
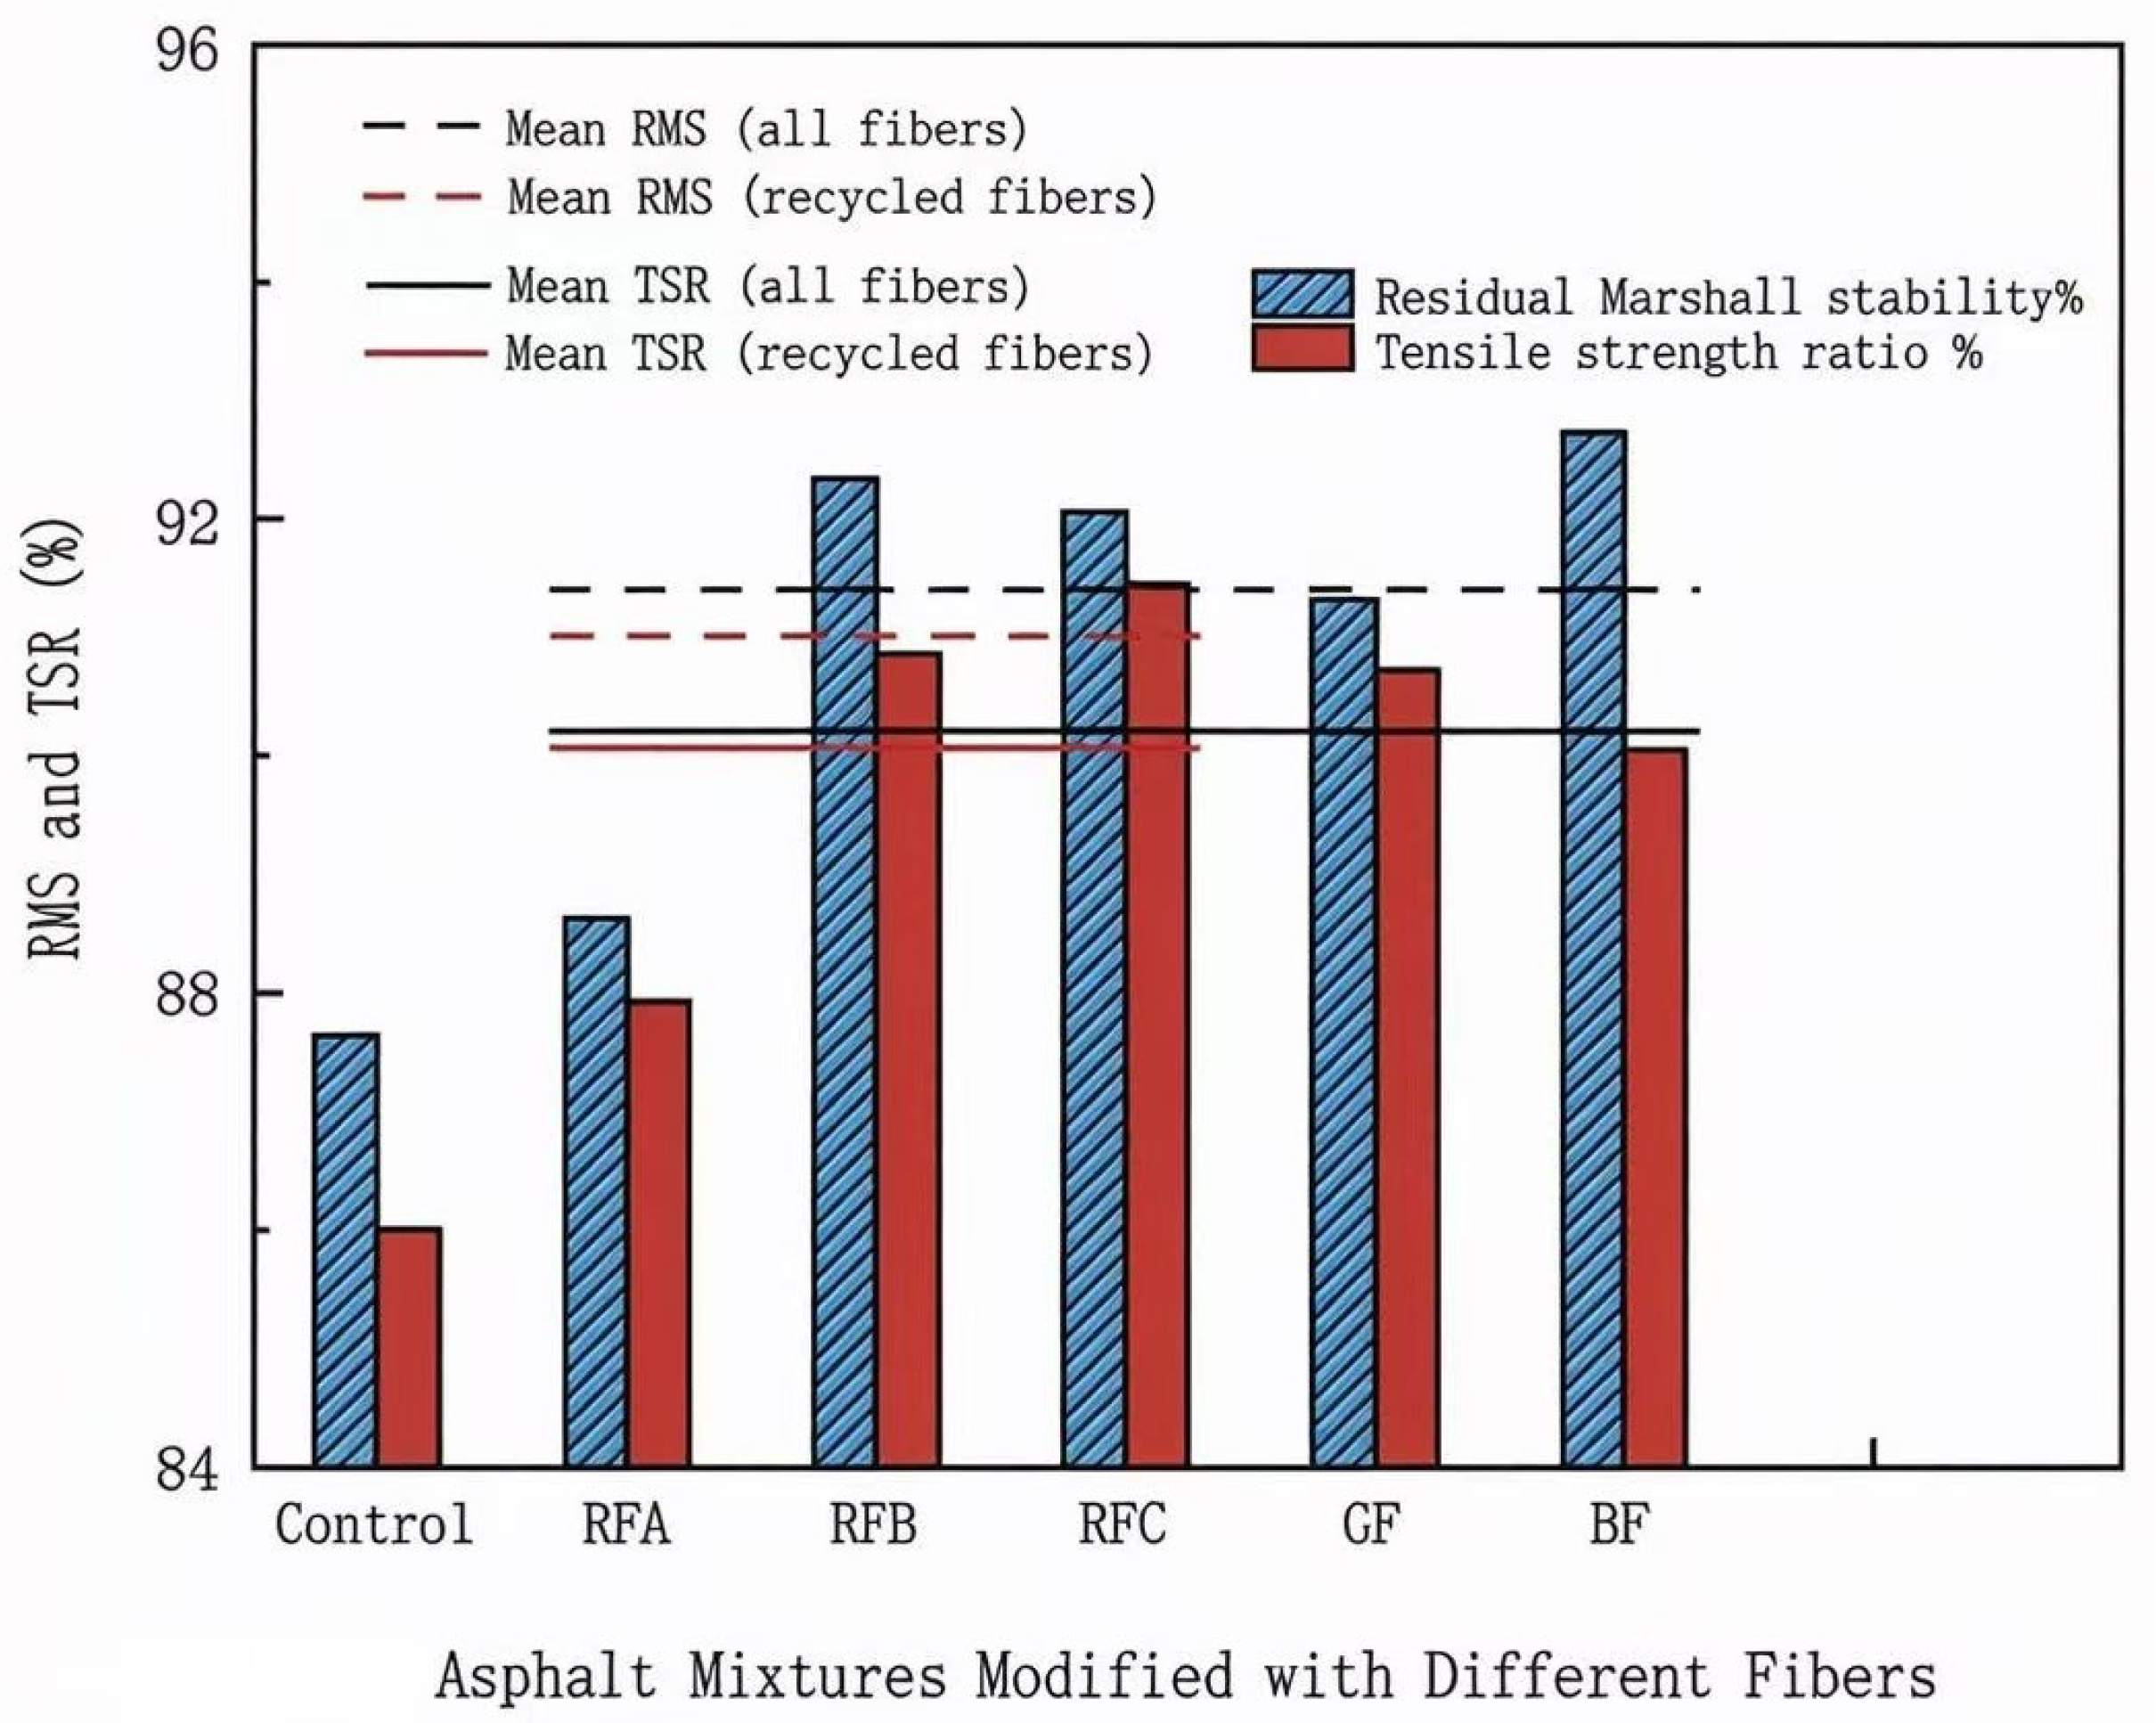
The results of the immersion Marshall and freeze–thaw splitting tensile tests are shown in Figure 9 and Figure 10.
Figure 9.
Residual Marshall stability and tensile strength ratio (TSR).
Figure 10.
Residual Marshall stability and freeze–thaw tensile strength ratio.
All five fiber-modified formulations exceeded the reference in the reported moisture-resistance indices. Residual Marshall stability/TSR values were 87.64%/86.00% for the reference, 88.63%/87.93% for RFA, 92.33%/90.87% for RFB, 92.06%/91.46% for RFC, 91.33%/90.72% for GF, and 92.73%/90.06% for BF. These are summary ratios; no specimen-level uncertainty is inferred from them.
The two tests gave different rankings. BF had the highest residual Marshall stability, whereas RFC had the highest TSR. RFB exceeded RFC in residual stability, so this index did not increase monotonically from RFA through RFB to RFC. The RFC TSR was 5.46 percentage points above the reference, but this difference is not evidence of statistical significance without within-formulation variability.
Fine fragments and fiber–mastic contacts may restrict local moisture damage, but pore connectivity and interfacial adhesion were not measured directly. The results describe resistance to the stated laboratory conditioning and do not establish long-term moisture durability. In the olive-husk-ash study [25], strength and stiffness decreased during wet conditioning and substantially recovered after drying. This conditioning dependence cautions against treating retained-strength ratios as evidence of a single irreversible damage mechanism; a comparable dryback assessment is not reported here.
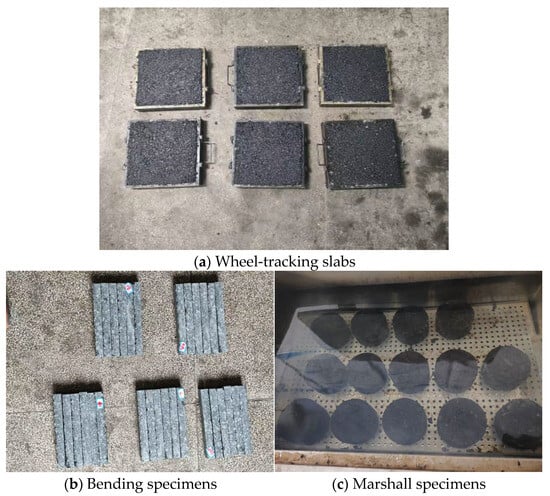
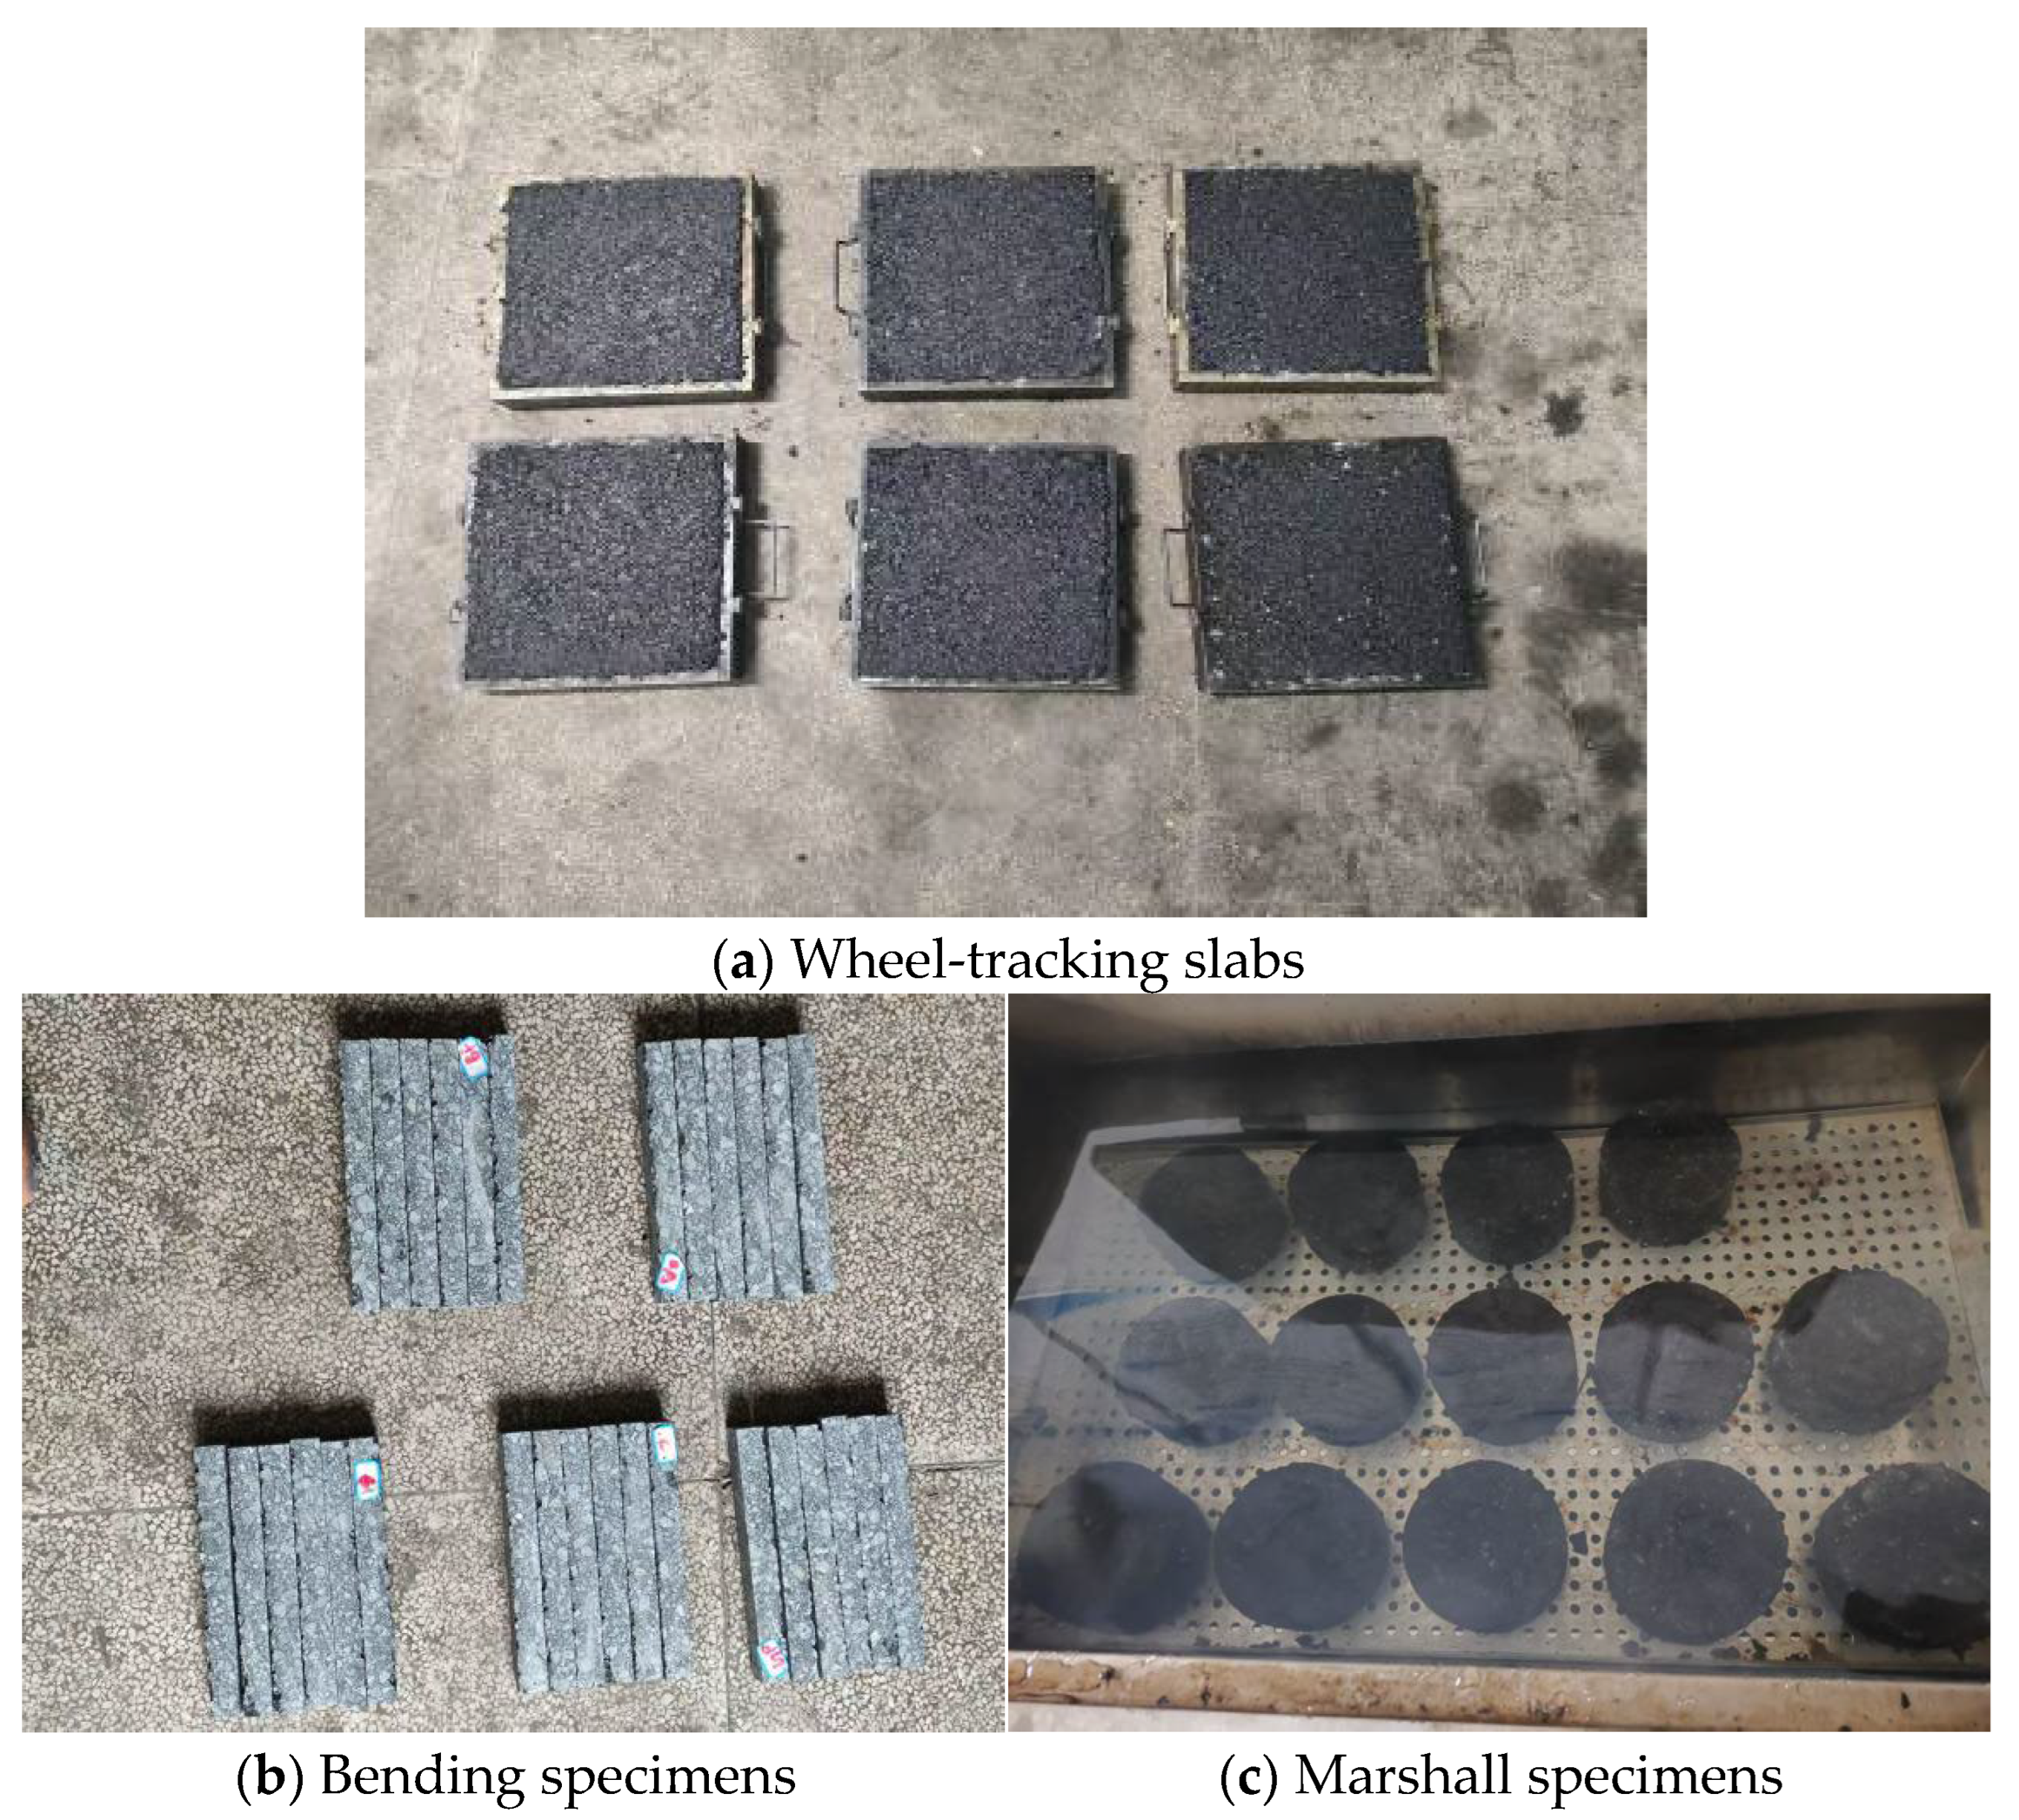
Figure 11 shows representative wheel-tracking slabs, bending specimens, and Marshall specimens from the supplied study. These photographs document specimen types; they do not establish independent replicate counts, batch traceability, measurement accuracy, or statistical reproducibility.
Figure 11.
Representative specimens used in the mixture tests.
3.6. Performance Profile and Fiber-Material Cost Comparison
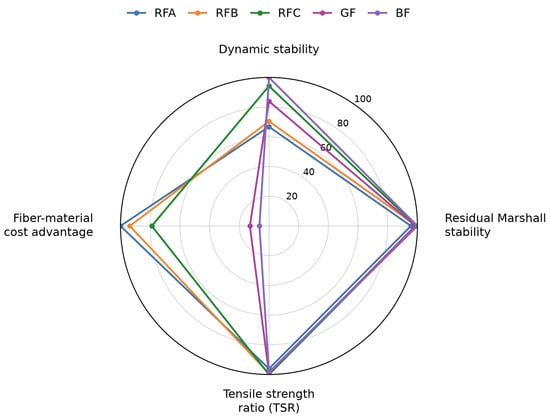
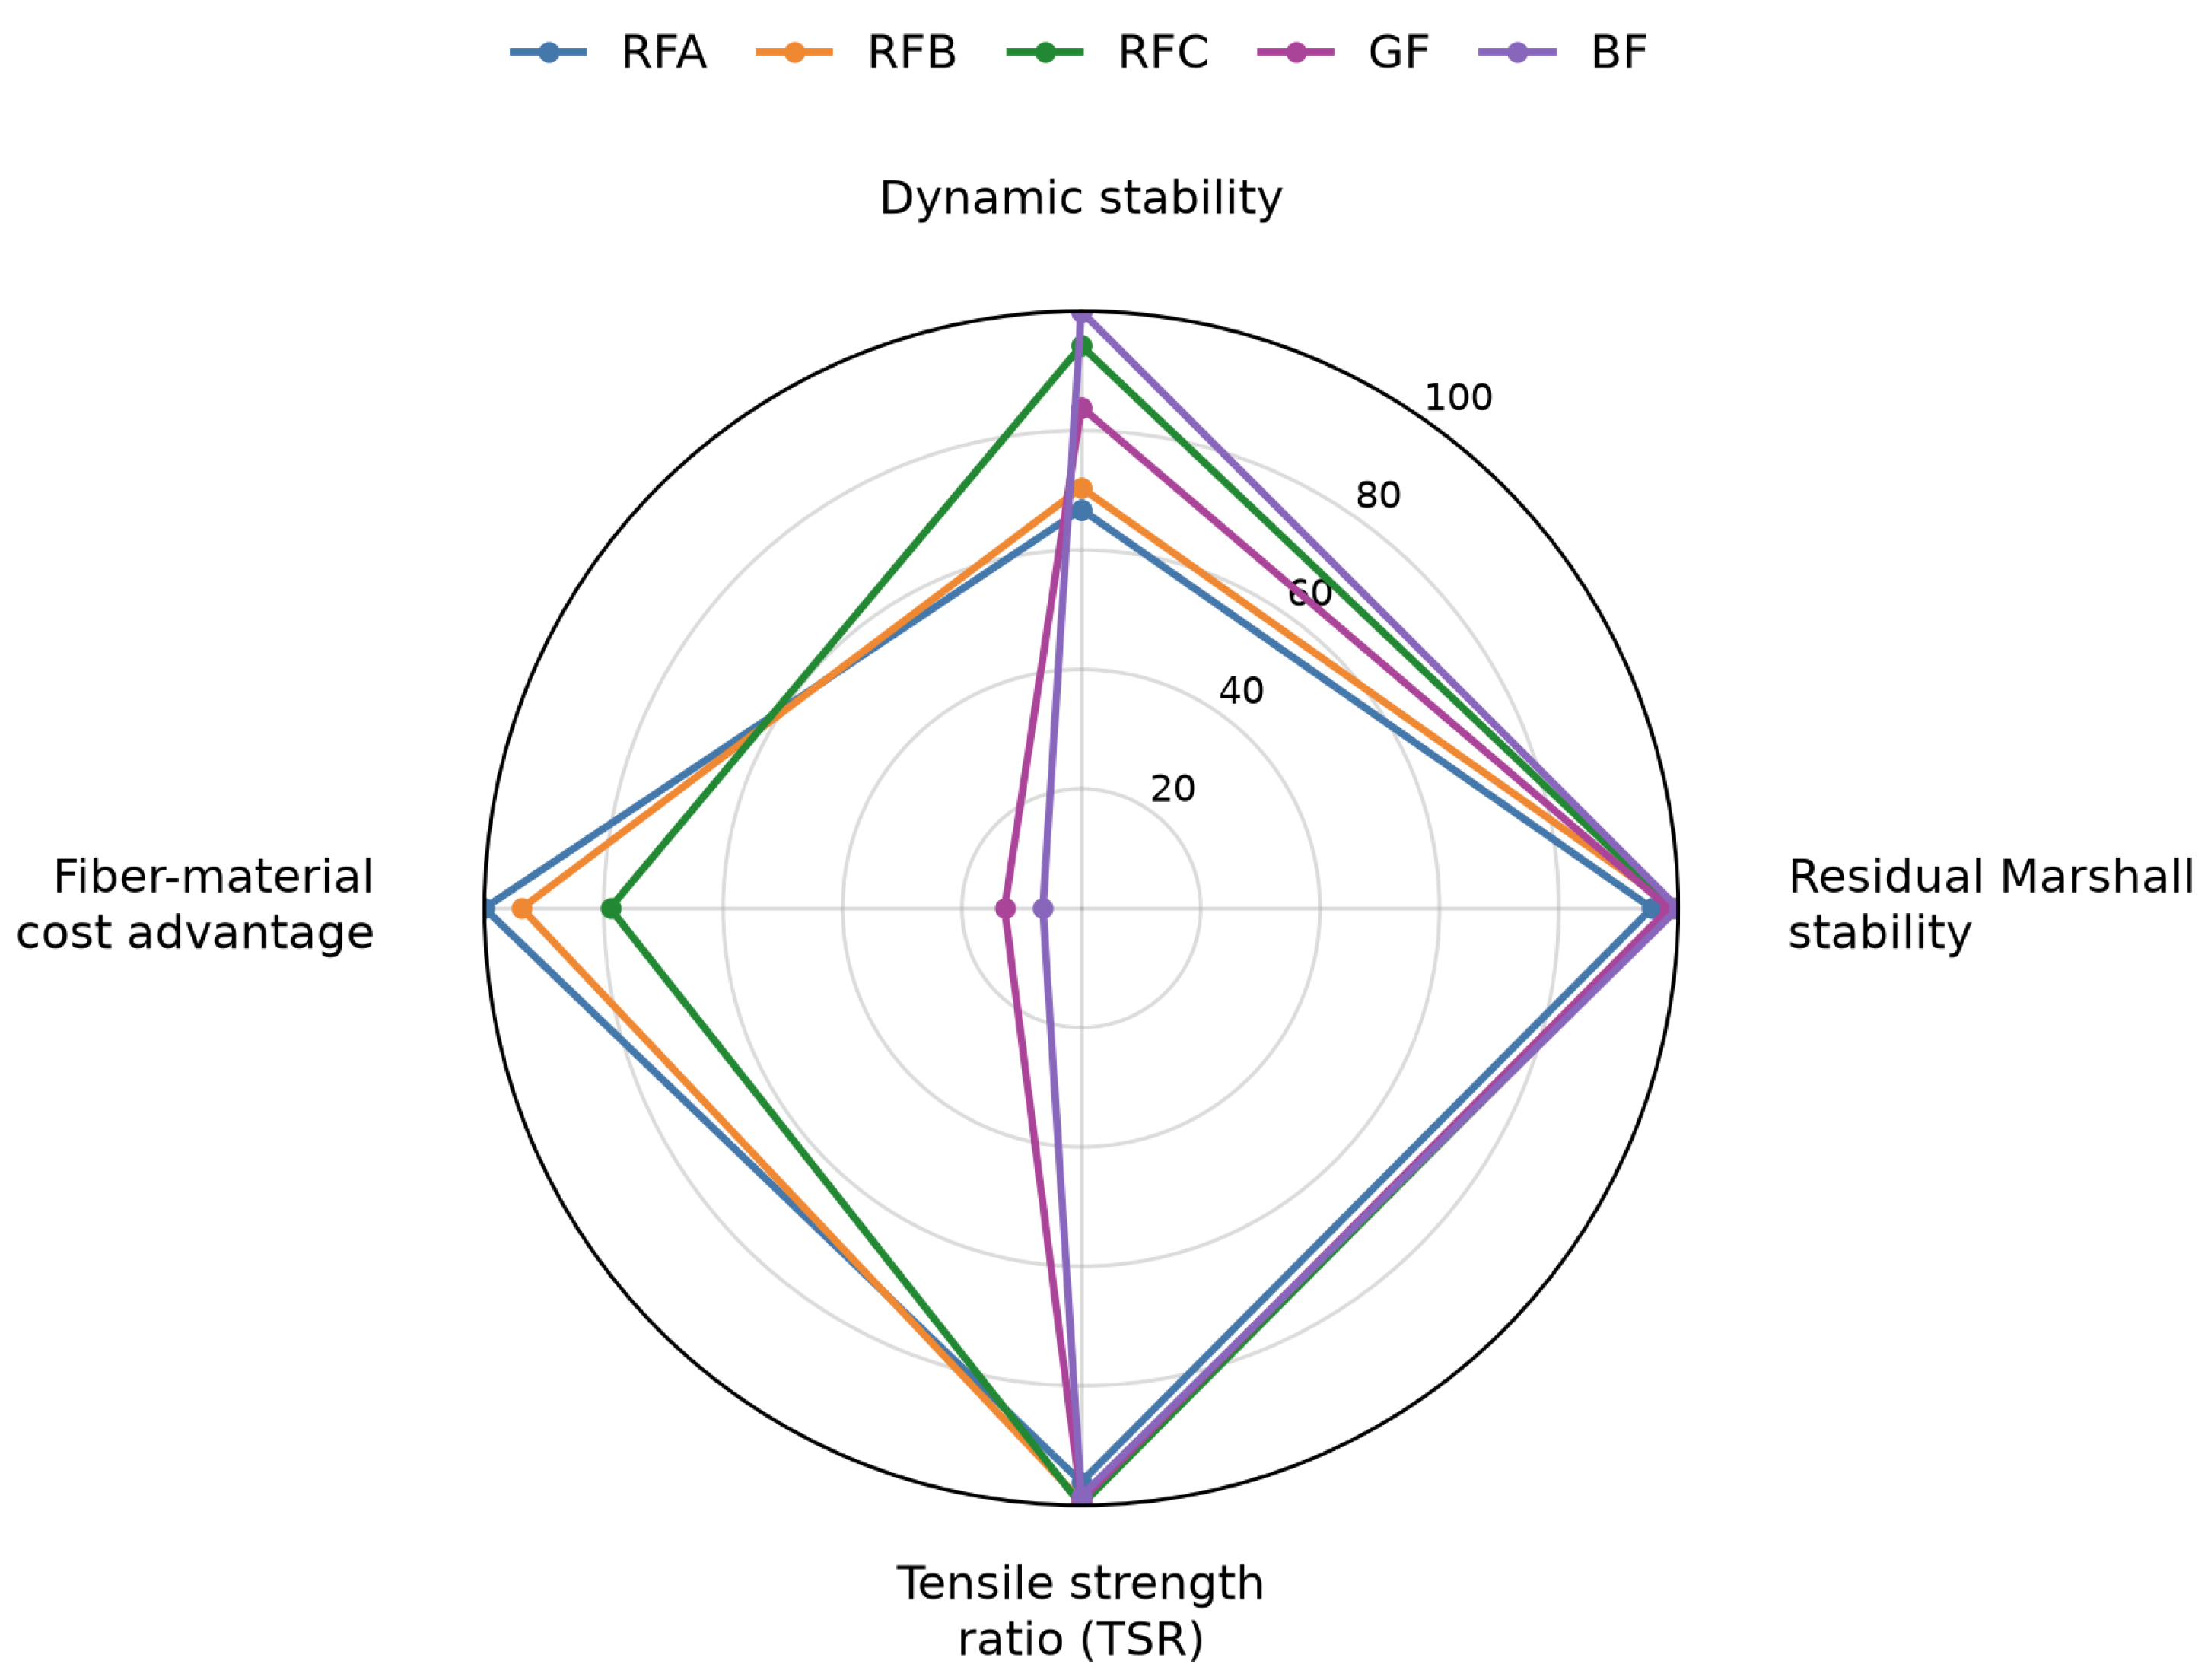
The economic comparison is restricted to incremental fiber-material expenditure. At 0.3% of total mixture mass, each modified formulation requires 3 kg of fiber per tonne of mixture. The unit prices were CNY 0.45/kg for RFA, 0.48/kg for RFB, 0.57/kg for RFC, 3.50/kg for GF, and 7.00/kg for BF. Incremental expenditure is calculated as unit price × 3 kg/t. Table 9 reports this material-price comparison. Figure 12 presents a normalized profile of selected measured responses and fiber-material expenditure; no combined performance or cost-effectiveness score is calculated.
Table 9.
Fiber unit prices and incremental fiber-material expenditure at 0.3% mixture dosage.
Figure 12.
Radar profile of the five fiber-modified formulations.
RFA has the lowest stated fiber-material expenditure and BF the highest; RFC is the most expensive recycled product but remains below both commercial fibers. Collection, sorting, grinding, transportation, and processing are not separately itemized, and any charges embedded in supplier prices cannot be separated. Additional binder, mixing energy, construction, maintenance, and life-cycle costs are outside this comparison. A production-cost breakdown for the recycled fibers is not provided; lower fiber-material expenditure does not establish lower total preparation costs or full cost-effectiveness.
For dynamic stability, residual Marshall stability, and TSR, the plotted index is 100 × formulation value/highest value among the five modified formulations. For fiber-material expenditure, the index is 100 × lowest expenditure/formulation expenditure, so a higher value denotes a lower material cost. The reference mixture is excluded from this normalization. Complete confirmed numerical values for the low-temperature response of every formulation are not available in the supplied records; that response remains in Figure 8 and is not reconstructed for the radar plot. Each performance axis represents a different test, and a high radar index does not establish statistical superiority. The cost axis excludes binder adjustments, processing, energy, transport, maintenance, and life-cycle expenditure.
Ei = 3pi
In Equations (2) and (3), Ei is the incremental fiber-material expenditure (CNY/t mixture), pi is the fiber unit price (CNY/kg), 3 is the fiber dosage (kg/t mixture), and Emin is the lowest expenditure among the five fiber-modified formulations. Si,cost is the dimensionless cost index on the 0–100 scale used in Figure 12; all expenditures are positive.
Figure 12 shows trade-offs among the tested complete formulations. BF had the highest reported dynamic stability and residual Marshall stability, RFC had the highest reported TSR, and RFA had the lowest stated fiber-material expenditure. RFC combined relatively low fiber-material expenditure with favorable reported responses, but the radar profile does not identify a statistically validated overall optimum. The U.S. disposal-stage cost analysis [14] and Spanish comparison of blade-waste management alternatives [4] show why processing expenditure, circularity, and environmental impacts require separate assessment. Material-specific waste-status and environmental-hazard assessments remain unresolved; SEM observations and visible handling dust do not establish exposure levels or environmental safety.
4. Conclusions
This study compared the morphology and performance of recycled fibers from decommissioned wind turbine blades in asphalt mastics and mixtures through macroscopic and microscopic morphological characterization, mastic property testing, and mixture performance evaluation. The main conclusions are as follows:
Macroscopic observations and SEM revealed distinct morphologies among RFA, RFB, and RFC, ranging from elongated composite fragments to fine fiber/resin-bearing fragments. These local observations characterize the supplied products but do not quantify bulk resin content, establish resin removal, or demonstrate a connected reinforcing network within mixtures. Supplier, feedstock, processing, and pretreatment remain confounded.
A three-factor BBD was used to examine mastic fiber content, mixing speed, and mixing time. Fiber content was an important factor governing the reported mastic responses. The RFC candidate setting was 3.45% fiber by total mastic mass, 600 r/min, and 40 min. Table 8 gives numerical discrepancies of 1.6–3.9%, but the BBD preparation temperature, complete optimization specifications, and independent replicate-level validation are not documented. The setting is therefore not an independently validated optimum or a transferable mixture-production condition.
At 0.3% fiber by total mixture mass and formulation-specific OACs, RFC had a dynamic stability of 2266 cycles/mm, 53.2% above the reference, a flexural tensile strain at failure of 2651 με, and a TSR of 91.46%. BF had the highest reported dynamic stability and residual Marshall stability; RFC had the highest reported flexural strain and TSR. Different OACs and volumetric structures prevent isolation of a fiber-only effect, and missing specimen-level variability prevents conclusions about statistically reproducible superiority.
At the stated prices and a dosage of 3 kg/t, incremental fiber-material expenditures were CNY 1.35, 1.44, 1.71, 10.50, and 21.00/t for RFA, RFB, RFC, GF, and BF, respectively. RFC therefore had lower fiber-material expenditure than the commercial benchmarks. Total preparation and life-cycle costs were not evaluated. Ageing, fatigue, field performance, independent batch reproducibility, a fiber-production cost breakdown, waste classification, and sample-specific environmental-hazard evaluation remain unassessed; the results do not establish long-term durability, environmental safety, or industrial viability.
Author Contributions
Conceptualization, J.H. and P.L.; methodology, J.H. and P.L.; formal analysis, J.H. and M.M.; investigation, M.M., W.S., L.H., J.L., Z.Z. and F.B.; resources, W.S., J.L. and Z.Z.; data curation, M.M., L.H. and F.B.; writing—original draft preparation, J.H. and M.M.; writing—review and editing, J.H., W.S., P.L. and F.B.; visualization, M.M. and L.H.; supervision, P.L.; project administration, J.H. All authors have read and agreed to the published version of the manuscript.
Funding
This research was funded by National Key R&D Program of China (No. 2024YFB2605100 and 2024YFB2605102), Guangxi Science and Technology Program (LT2504240009), Science and Technology Major Project of Guangxi (AA23062054), Innovation Fund of Research Institute for Innovative Development of Transportation and Energy Integration (Changsha University of Science & Technology, grant number JNRH05), and a Key Project of the Hunan Provincial Department of Education’s Scientific Research Program (24A0246).
Data Availability Statement
The original contributions presented in this study are included in the article. Further inquiries can be directed to the corresponding authors.
Conflicts of Interest
Junhui He is employed by Pinglu Canal Group Co., Ltd. Weidi Su, Jiakun Lu and Zhitai Zhang are employed by Guangxi Pinglu Canal Construction Co., Ltd. Fan Bai is employed by Yueyang Goaland Energy Saving Equipment Manufacturing Co., Ltd. The authors declare no other conflicts of interest. The funders provided financial support only and were not involved in study design, data collection, analysis or interpretation, manuscript preparation, or the decision to publish.
References
- Jensen, J.P.; Skelton, K. Wind turbine blade recycling: Experiences, challenges and possibilities in a circular economy. Renew. Sustain. Energy Rev. 2018, 97, 165–176. [Google Scholar] [CrossRef] [Scilit]
- Rani, M.; Choudhary, P.; Krishnan, V.; Zafar, S. A review on recycling and reuse methods for carbon fiber/glass fiber composites waste from wind turbine blades. Compos. Part B 2021, 215, 108768. [Google Scholar] [CrossRef] [Scilit]
- Khalid, M.Y.; Arif, Z.U.; Hossain, M.; Umer, R. Recycling of wind turbine blades through modern recycling technologies: A road to zero waste. Renew. Energy Focus 2023, 44, 373–389. [Google Scholar] [CrossRef] [Scilit]
- Diez-Cañamero, B.; Mendoza, J.M.F. Circular economy performance and carbon footprint of wind turbine blade waste management alternatives. Waste Manag. 2023, 164, 94–105. [Google Scholar] [CrossRef] [Scilit] [PubMed]
- Hasheminezhad, A.; Nazari, Z.; Yang, B.; Ceylan, H.; Kim, S. A comprehensive review of sustainable solutions for reusing wind turbine blade waste materials. J. Environ. Manag. 2024, 366, 121735. [Google Scholar] [CrossRef] [Scilit] [PubMed]
- Shen, F. Effects of glass fibers on the cracking resistance of asphalt mixtures containing reclaimed asphalt pavement. Transpo World 2024, 8, 41–43. (In Chinese) [Google Scholar]
- Feng, J.; Wang, S.; He, F.; Wu, C.; Wang, Z.; Du, F.; Huston, D.; Dewoolkar, M.; Tan, T. Molecular Adhesion Between Asphalt and Glass Fiber-Reinforced Composites from Recycled Wind Turbine Blades in Dry and Hydrated Conditions. Materials 2025, 18, 3936. [Google Scholar] [CrossRef] [Scilit] [PubMed]
- Cousins, D.S.; Suzuki, Y.; Murray, R.E.; Samaniuk, J.R.; Stebner, A.P. Recycling glass fiber thermoplastic composites from wind turbine blades. J. Clean. Prod. 2019, 209, 1252–1263. [Google Scholar] [CrossRef] [Scilit]
- Nie, Y.; Liu, Q.; Xiang, Z.; Zhong, S.; Huang, X. Performance and Modification Mechanism of Recycled Glass Fiber of Wind Turbine Blades and SBS Composite-Modified Asphalt. Appl. Sci. 2023, 13, 6335. [Google Scholar] [CrossRef] [Scilit]
- Zhang, R.; Nie, Y.; He, B.; He, L.; Long, L. Performance Enhancement of Asphalt Mixtures Using Recycled Wind Turbine Blade Fiber. Sustainability 2025, 17, 8112. [Google Scholar] [CrossRef] [Scilit]
- Wang, C.H.; Zhu, F.; Chen, D.Z.; Hong, L. Optimization of the process and parameters for recovering reinforcing fibers from waste wind turbine blades. Adv. New Renew. Energy 2025, 13, 97–106. (In Chinese) [Google Scholar]
- Tan, Z.; Guo, Y.; Hu, G.; Chen, R.; Wang, Y.; Yin, B.; Leng, Z. Upcycling waste wind turbine blades into fiber-reinforced asphalt mortar: A chemical recycling approach and performance assessment. Constr. Build. Mater. 2025, 489, 142352. [Google Scholar] [CrossRef] [Scilit]
- Luo, Y.; Huang, J.; Wang, Y.; Hu, T.; Xu, X.; Yin, B. Enhancing the properties and engineering performance of asphalt binders and mixtures with physicochemically treated waste wind turbine blades. Constr. Build. Mater. 2025, 473, 141023. [Google Scholar] [CrossRef] [Scilit]
- Cooperman, A.; Eberle, A.; Lantz, E. Wind turbine blade material in the United States: Quantities, costs, and end-of-life options. Resour. Conserv. Recycl. 2021, 168, 105439. [Google Scholar] [CrossRef] [Scilit]
- Ma, W.J.; Zhang, Y.T.; Yang, C.Z.; Hu, Z.F.; Wang, Z.Q.; Sun, J.Y.; Tan, H.Z.; Wang, X.B. Research progress in technologies for large-scale recycling and resource recovery of decommissioned wind turbine blades. Clean Coal Technol. 2023, 29, 17–26. (In Chinese) [Google Scholar]
- Gao, W.J. Preparation and Technical Performance of Asphalt Modified with Composite Fibers from Waste Wind Turbine Blades. Master’s Thesis, Hunan University of Science and Technology, Xiangtan, China, 2022. (In Chinese) [Google Scholar]
- Chen, L.L.; Zhu, J.K.; Ye, Q.; Zhao, X.Y.; Qian, Z.D. Progress and trends of low-carbon application of waste materials in asphalt pavements. J. Traffic Transp. Eng. 2026, 26, 93–115. (In Chinese) [Google Scholar]
- Long, L.X. Pavement Performance of Asphalt Mixtures Incorporating Composite Fibers from Waste Wind Turbine Blades. Master’s Thesis, Hunan University of Science and Technology, Xiangtan, China, 2023. (In Chinese) [Google Scholar]
- Khedaywi, T.; Haddad, M.; Khaldi, N.A.H. Study on the feasibility of using waste glass in binder and asphalt mixture. Innov. Infrastruct. Solut. 2024, 9, 227. [Google Scholar] [CrossRef] [Scilit]
- Khedaywi, T.; Haddad, M.; Al-Migdady, A. Waste polyethylene effect on asphalt binder and mixture properties: State of the art. Adv. Sci. Technol. Res. J. 2025, 19, 234–251. [Google Scholar] [CrossRef] [Scilit] [PubMed]
- Khedaywi, T.; Haddad, M.; Bataineh, H. Effect of waste plastic polyethylene terephthalate on properties of asphalt cement. Innov. Infrastruct. Solut. 2023, 8, 232. [Google Scholar] [CrossRef] [Scilit]
- Khedaywi, T.; Baker, M.B.; Haddad, M.; Bataineh, H. Effect of Waste Plastic Polyethylene Terephthalate on Properties of Asphalt Concrete Mixtures. Int. J. Pavement Res. Technol. 2026, 19, 625–639. [Google Scholar] [CrossRef] [Scilit]
- Khedaywi, T.; Haddad, M.; Alyaseen, S. Effect of filler materials on Marshall properties and rutting of asphalt mixtures using wheel tracking test: A comparative study. J. Eng. Sci. Technol. 2023, 18, 1915–1935. Available online: https://jestec.taylors.edu.my/Vol%2018%20Issue%204%20August%202023/18_4_07.pdf (accessed on 28 October 2026).
- Haddad, M.; Khedaywi, T. Investigating the effect of olive husk ash on dynamic creep of asphalt concrete mixtures. J. Eng. Sci. Technol. 2023, 18, 931–948. Available online: https://jestec.taylors.edu.my/Vol%2018%20Issue%202%20April%202023/18_2_7.pdf (accessed on 28 October 2026).
- Haddad, M.A.; Khedaywi, T.S. Moisture Resistance of Olive Husk Ash Modified Asphalt Mixtures. Ann. Chim. Sci. Mater. 2023, 47, 141–149. [Google Scholar] [CrossRef] [Scilit]
- Noorvand, H.; Mamlouk, M.; Kaloush, K. Evaluation of Optimum Fiber Length in Fiber-Reinforced Asphalt Concrete. J. Mater. Civ. Eng. 2022, 34, 04021494. [Google Scholar] [CrossRef] [Scilit]
- Shaikh, S.; Gupta, A.; Lokhande, V. Prediction and Optimization of Bituminous Mixture Performance Using Response Surface Methodology. J. Mater. Civ. Eng. 2026, 38, 04026310. [Google Scholar] [CrossRef] [Scilit]
- Liu, J.Y.; Xu, N.; Jing, L.L.; Li, Y.; Chen, Y. Optimization of preparation parameters for an oil-rich crumb rubber rejuvenator using response surface methodology. J. Highw. Transp. Res. Dev. 2023, 40, 74–81. (In Chinese) [Google Scholar]
- Qu, G.L.; Liu, Z.S.; Liu, G.P.; Zheng, M.L.; Tang, D. Material optimization and cross-scale enhancement mechanism of porous concrete based on response surface method. J. Traffic Transp. Eng. 2025, 25, 36–50. (In Chinese) [Google Scholar]

Disclaimer/Publisher’s Note: The statements, opinions and data contained in all publications are solely those of the individual author(s) and contributor(s) and not of MDPI and/or the editor(s). MDPI and/or the editor(s) disclaim responsibility for any injury to people or property resulting from any ideas, methods, instructions or products referred to in the content. |
© 2026 by the authors. Licensee MDPI, Basel, Switzerland. This article is an open access article distributed under the terms and conditions of the Creative Commons Attribution (CC BY) license.