


Abstract
In real-coded genetic algorithms (RCGAs), search performance often deteriorates when the true global optimum lies outside the initial search range because crossover-based sampling remains concentrated around the initial population. We define this problem as outside-range optimization and introduce the outside-range ratio, representing the proportion of dimensions whose true optimum lies outside the initial search range. We extend Adaptive Real-coded Ensemble Crossover/Just Generation Gap (AREX/JGG) by explicitly decoupling search-region expansion and search-distribution update. Specifically, enhanced Chaotic Search (e-CS) expands the search region through extrapolation, AREX updates the search distribution, and Combinational Mutation (CM) generates candidates with heavy-tailed perturbations. Experiments on 10 benchmark functions with 20–80 dimensions showed lower expected running time (ERT) than AREX/JGG under many outside-range conditions examined. For 40-dimensional Sphere, Cigar, and k-tablet, ERT was lower than HIRCGA across all tested outside-range ratios and distances. Furthermore, for parameter estimation of an ordinary differential equation (ODE) model of Escherichia coli glycolysis, the proposed method achieved a higher success rate than AREX/JGG in three of four initial-range settings. These results suggest that the proposed method can improve search efficiency under many tested outside-range conditions and enhance the robustness of search success to initial-range settings.
1. Introduction
High-dimensional, continuous optimization is a fundamental problem in fields such as engineering, information science, and systems biology. In general, a continuous optimization problem is formulated as , where is an n-dimensional, real-valued vector and f(x) is the objective function. In practical problems, the nonlinearity, multimodality, and variable dependencies frequently exhibited by the objective function make gradient-based methods prone to premature convergence or stagnation. Evolutionary computation (EC), particularly use of real-coded genetic algorithms (RCGAs), has thus been widely used because of its capability to search globally.
RCGAs are widely used for continuous optimization because of their flexibility and robustness in handling complex landscapes. In particular, the generation of offspring based on the distribution of selected parents by representative methods such as AREX/JGG [1], which combines Adaptive Real-coded Ensemble Crossover (AREX) with the Just Generation Gap (JGG) model, enables efficient exploration of the search space.
These methods generate an initial population based on an initial search range [L, U], for example, as
where denotes the j-th variable of the i-th individual, and Lj and Uj are the j-th components of L and U, respectively. The initial search range is specified with the expectation that it contains the true optimum. However, in practice, such bounds are often based on uncertain prior knowledge and do not necessarily contain the true optimum.
Previous studies have proposed mutation operators and diversity-preservation mechanisms [2,3,4,5]. However, these approaches do not explicitly address the mismatch between the assumed search range and the true global optimum. In particular, in AREX/JGG, offspring are generated around the centroid of the selected parents. As the spread of the parent population decreases during the search, candidates far from the parent population become less likely to be generated.
In this study, the initial search range is treated as an uncertain starting range specified from prior knowledge, rather than as a strict constraint defining solution feasibility. Exploration outside this range is therefore permitted; problems in which physical or operational constraints prohibit exploration beyond these bounds are outside the scope of this study. We define optimization problems in which the true global optimum lies outside the initial search range as outside-range optimization. When the true optimum lies outside the initial range, the tendency of crossover-based sampling to remain near the initial region can substantially degrade search performance. To quantitatively describe the spatial relationship between the initial search range and the true global optimum, we introduce the outside-range ratio (rout), representing the proportion of dimensions whose optimum lies outside the initial range, and the normalized outside-range distance (dout), which normalizes the distance from the boundary of the initial range to the optimum (see Section 4.1 for formal definitions). These measures describe experimental conditions and are not used as algorithm inputs.
To improve search performance when the true optimum lies outside the initial search range, we propose an extension of AREX/JGG that explicitly separates the search process into two components: (i) search-region expansion and (ii) search-distribution update. Specifically, AREX is retained for updating the search distribution, while enhanced Chaotic Search (e-CS) expands the search region through extrapolation and Combinational Mutation (CM) generates candidates with heavy-tailed perturbations.
The proposed framework preserves the search-distribution update performed by AREX while allowing the number of generations for which the candidate-generation mechanism for search-region expansion is applied and the number of candidates it generates to be specified separately.
The main contributions of this study are as follows:
- We formulate outside-range optimization and introduce the outside-range ratio rout and normalized outside-range distance dout as quantitative measures of aspects of the mismatch between the assumed search range and the true optimum.
- We propose an extended AREX/JGG framework that explicitly decouples search-region expansion from search-distribution update, thereby enabling controlled exploration beyond the initial search range.
- Through benchmark experiments and a parameter estimation problem based on an ordinary differential equation (ODE) model of the Escherichia coli glycolytic pathway, we show that the proposed method improves robustness against uncertainty in the initial search range.
2. Related Work
2.1. RCGA Crossover Evolution
RCGAs [6] have been extensively studied as effective methods for continuous optimization problems. Their performance largely depends on how the search distribution is constructed and updated during the search process [6,7,8,9,10,11].
Early crossover methods, such as BLX-α (Blend Crossover) [6], treat each variable independently, limiting their ability to exploit inter-variable dependencies. To address this limitation, UNDX (Unimodal Normal Distribution Crossover) [7] and SPX (Simplex Crossover) [8] generate offspring based on geometric relationships among multiple parents. This strategy enables approximation of the distributions of promising solutions and incorporation of variable correlations.
UNDX-m [9] has subsequently been proposed to improve scale invariance and thereby enhance the robustness of the distribution shape. Furthermore, REX (Real-coded Ensemble Crossover) [10] has introduced a mechanism for generating offspring based on the centroid of the parent population and thereby explicitly defines the center of the search distribution. REXstar [11] has further extended this idea by adaptively shifting the crossover center according to fitness values to enable adaptive control of the search center.
These developments indicate a transition in RCGA research from simple variable-wise sampling to adaptive control of both the shape and center of the search distribution. In particular, the combination of REXstar with the JGG model (REXstar/JGG) has demonstrated practical performance in parameter optimization of metabolic models [12,13].
2.2. AREX/JGG
AREX [1] is a multi-parent crossover operator that incorporates the concept of step-size adaptation [14,15] into the crossover-center descent mechanism of REXstar [11]. In AREX, offspring are generated using the centroid and covariance structure of the parent population:
Individuals are ranked from best to worst according to their evaluation. Here, Ci denotes the i-th offspring, ⟨P⟩ denotes the centroid of the Np parents, and represents the j-th best individual among the Np parents in terms of fitness. The coefficient wj denotes the weight assigned to the j-th ranked parent. The vector m denotes the crossover center, which is a weighted average calculated by assigning larger weights to higher-ranked parents. The parameter α represents the expansion rate, and ε denotes an i.i.d. random variable with mean 0 and variance σ2. The crossover center m in Equation (4) emphasizes high-fitness parents and serves as a search center directed toward promising regions. Furthermore, the linear combination of deviation vectors in Equation (2) generates search directions that reflect the covariance structure of the parent population.
To adaptively adjust the exploration scale according to the search progress, AREX further introduces Adaptation of Expansion Rate (AER) [10], which controls the expansion rate α of the offspring generation region:
where g denotes the generation number, and cα is the learning rate for updating the expansion rate α. In the standard setting, the initial expansion rate is set to α(0) = 1. The crossover descent path Lcdp is defined as the squared Mahalanobis distance between the crossover center m and the centroid of the top μα selected offspring. In addition, the expected squared Mahalanobis distance under random selection is denoted by Lavg. These quantities are defined as follows [1]:
where i:Nc denotes the index of the i-th best offspring among the Nc generated offspring. The coefficient is the random coefficient multiplying the deviation vector of the j-th parent in Equation (2) when generating that offspring.
AREX is typically combined with JGG, a generation replacement model [1,16,17,18]. In JGG, a set of parents is selected from the population, crossover is applied to generate offspring, and the individuals with high fitness values are selected to replace the parents and thereby update the population.
In this update mechanism, the search distribution is adaptively updated according to the variance structure of the parent population. As a consequence, the region in which offspring are concentrated also changes. Because of this property, when the optimum lies far outside the initial search range, many generations may be required before the center of the search distribution reaches a promising region.
2.3. Extended Methods for RCGAs
In RCGAs, crossover is generally designed to play the central role in updating the search distribution. However, extension methods that introduce diversity or perturbations from outside the search distribution have also been proposed to avoid search stagnation and to enhance global search capability. These include chaotic-map-based search methods and mutation-based operators [2,3,4,5].
For example, Song et al. [2] proposed a chaotic search framework that introduces diversity using deterministic sequences. Saraçoğlu and Kazankaya [3] have introduced an adaptive update mechanism to adjust the search direction based on the best individual. Mutation strategies have been proposed to control the direction and amplitude of perturbations according to the generation [4,5]. These methods mainly enhance diversity and adaptability within the existing search distribution, but systematic formulations that explicitly treat and control the evolution of the search region itself remain limited.
2.4. Structural Comparison with HIRCGA
The Hybrid Real-Coded Genetic Algorithm (HIRCGA) [2] integrates tent-map-based chaotic search (CS), combinational mutation (CM) using multiple mutation strategies, combinational crossover (CX), and an operation for reducing similarity among individuals. In contrast, the present study extends the AREX/JGG-based RCGA framework by introducing a mechanism for extrapolative search-region expansion. The following summarizes the main differences between the two methods.
First, the parent-selection, crossover, and generation-replacement procedures differ. HIRCGA adopts Steady-State Generation Strategy (SGS), in which elite individuals are preserved and crossover is applied to the entire population. In contrast, AREX/JGG applies multi-parent crossover AREX to parents selected from the population and replaces these parents with generated offspring. This allows AREX/JGG to generate and evaluate fewer candidates per generation than HIRCGA.
Second, the relationship between search-region expansion and search-distribution update differs. In HIRCGA, candidates outside the search range may be generated implicitly through chaotic search, crossover, and mutation, but search-region expansion and search-distribution update are not controlled as independent mechanisms. In contrast, the proposed method performs search-region expansion using enhanced Chaotic Search (e-CS) separately from the search-distribution update by AREX. This enables exploration outside the initial search range through a separate candidate-generation mechanism without directly modifying the expansion rate of AREX.
Third, the mutation strategies differ. CM in HIRCGA includes Lévy mutation, Cauchy mutation, and differential mutation (DM). The proposed method adopts Lévy and Cauchy mutation from these strategies. These operators are shared with HIRCGA and are not themselves novel contributions of this study. DM was not adopted because its addition did not produce a clear, consistent improvement and degraded performance for some functions. The corresponding ablation results are presented in Section 4.3.
Thus, the structural novelty of the proposed method lies in decoupling search-region expansion from search-distribution update within AREX/JGG, rather than in the individual mutation operators used in HIRCGA.
2.5. Position of This Study
Existing studies of RCGAs can be broadly categorized based on two strategies. One focuses on adaptively updating the search distribution based on the statistical structure of the parent population, as exemplified by AREX/JGG. The other introduces diversity or perturbations through mechanisms such as mutation operators and chaotic search.
In RCGA search, two fundamentally different concepts have generally been treated in an integrated manner: the search region, which describes the spatial extent of candidate generation, and the search distribution, which determines how candidates are sampled. In conventional RCGAs, these two components are implicitly coupled because both are determined through crossover.
Unlike previous RCGA extensions, which have mainly focused on improving exploration by modifying the search distribution or introducing perturbations, this study is distinguished by treating search-region expansion as a mechanism distinct from search-distribution update. Specifically, the proposed framework preserves the crossover-based update of the search distribution, while introducing extrapolative expansion of the search region as a separate candidate-generation mechanism. This configuration allows the settings of candidate generation for search-region expansion to be adjusted without directly changing the expansion rate of AREX, providing a systematic framework for robust optimization under uncertainty in the initial search range.
Although CMA-ES (Covariance Matrix Adaptation Evolution Strategy) has been widely recognized as a strong baseline for continuous optimization [15,19], the objective of this study is not to establish superiority over general-purpose optimizers but to evaluate the structural effect of explicitly introducing search-region expansion within the RCGA framework. Therefore, the comparison in this study was restricted to RCGA-based methods. A broader comparison with general-purpose continuous optimizers, including CMA-ES, remains an important direction for future research.
3. Materials and Methods
3.1. Overview of the Proposed Method
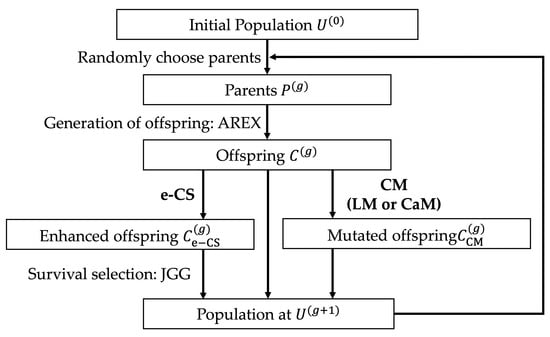
In this section, we propose an extended method based on AREX/JGG to improve robustness against uncertainty in the initial search range. The proposed framework explicitly separates search-region expansion and search-distribution update. Specifically, AREX updates the search distribution, enhanced Chaotic Search (e-CS) expands the search region through extrapolation, and Combinational Mutation (CM) adds perturbations based on heavy-tailed distributions to offspring generated by AREX. Figure 1 illustrates the overall framework. Here, this separation refers to introducing e-CS as a separate candidate-generation mechanism without directly changing the expansion rate of the AREX search distribution, while retaining the search-distribution update performed by AREX. Since selected candidates generated by e-CS affect the subsequent parent population and search-distribution updates, this separation does not imply that the two mechanisms are independent throughout the search process.
Figure 1.
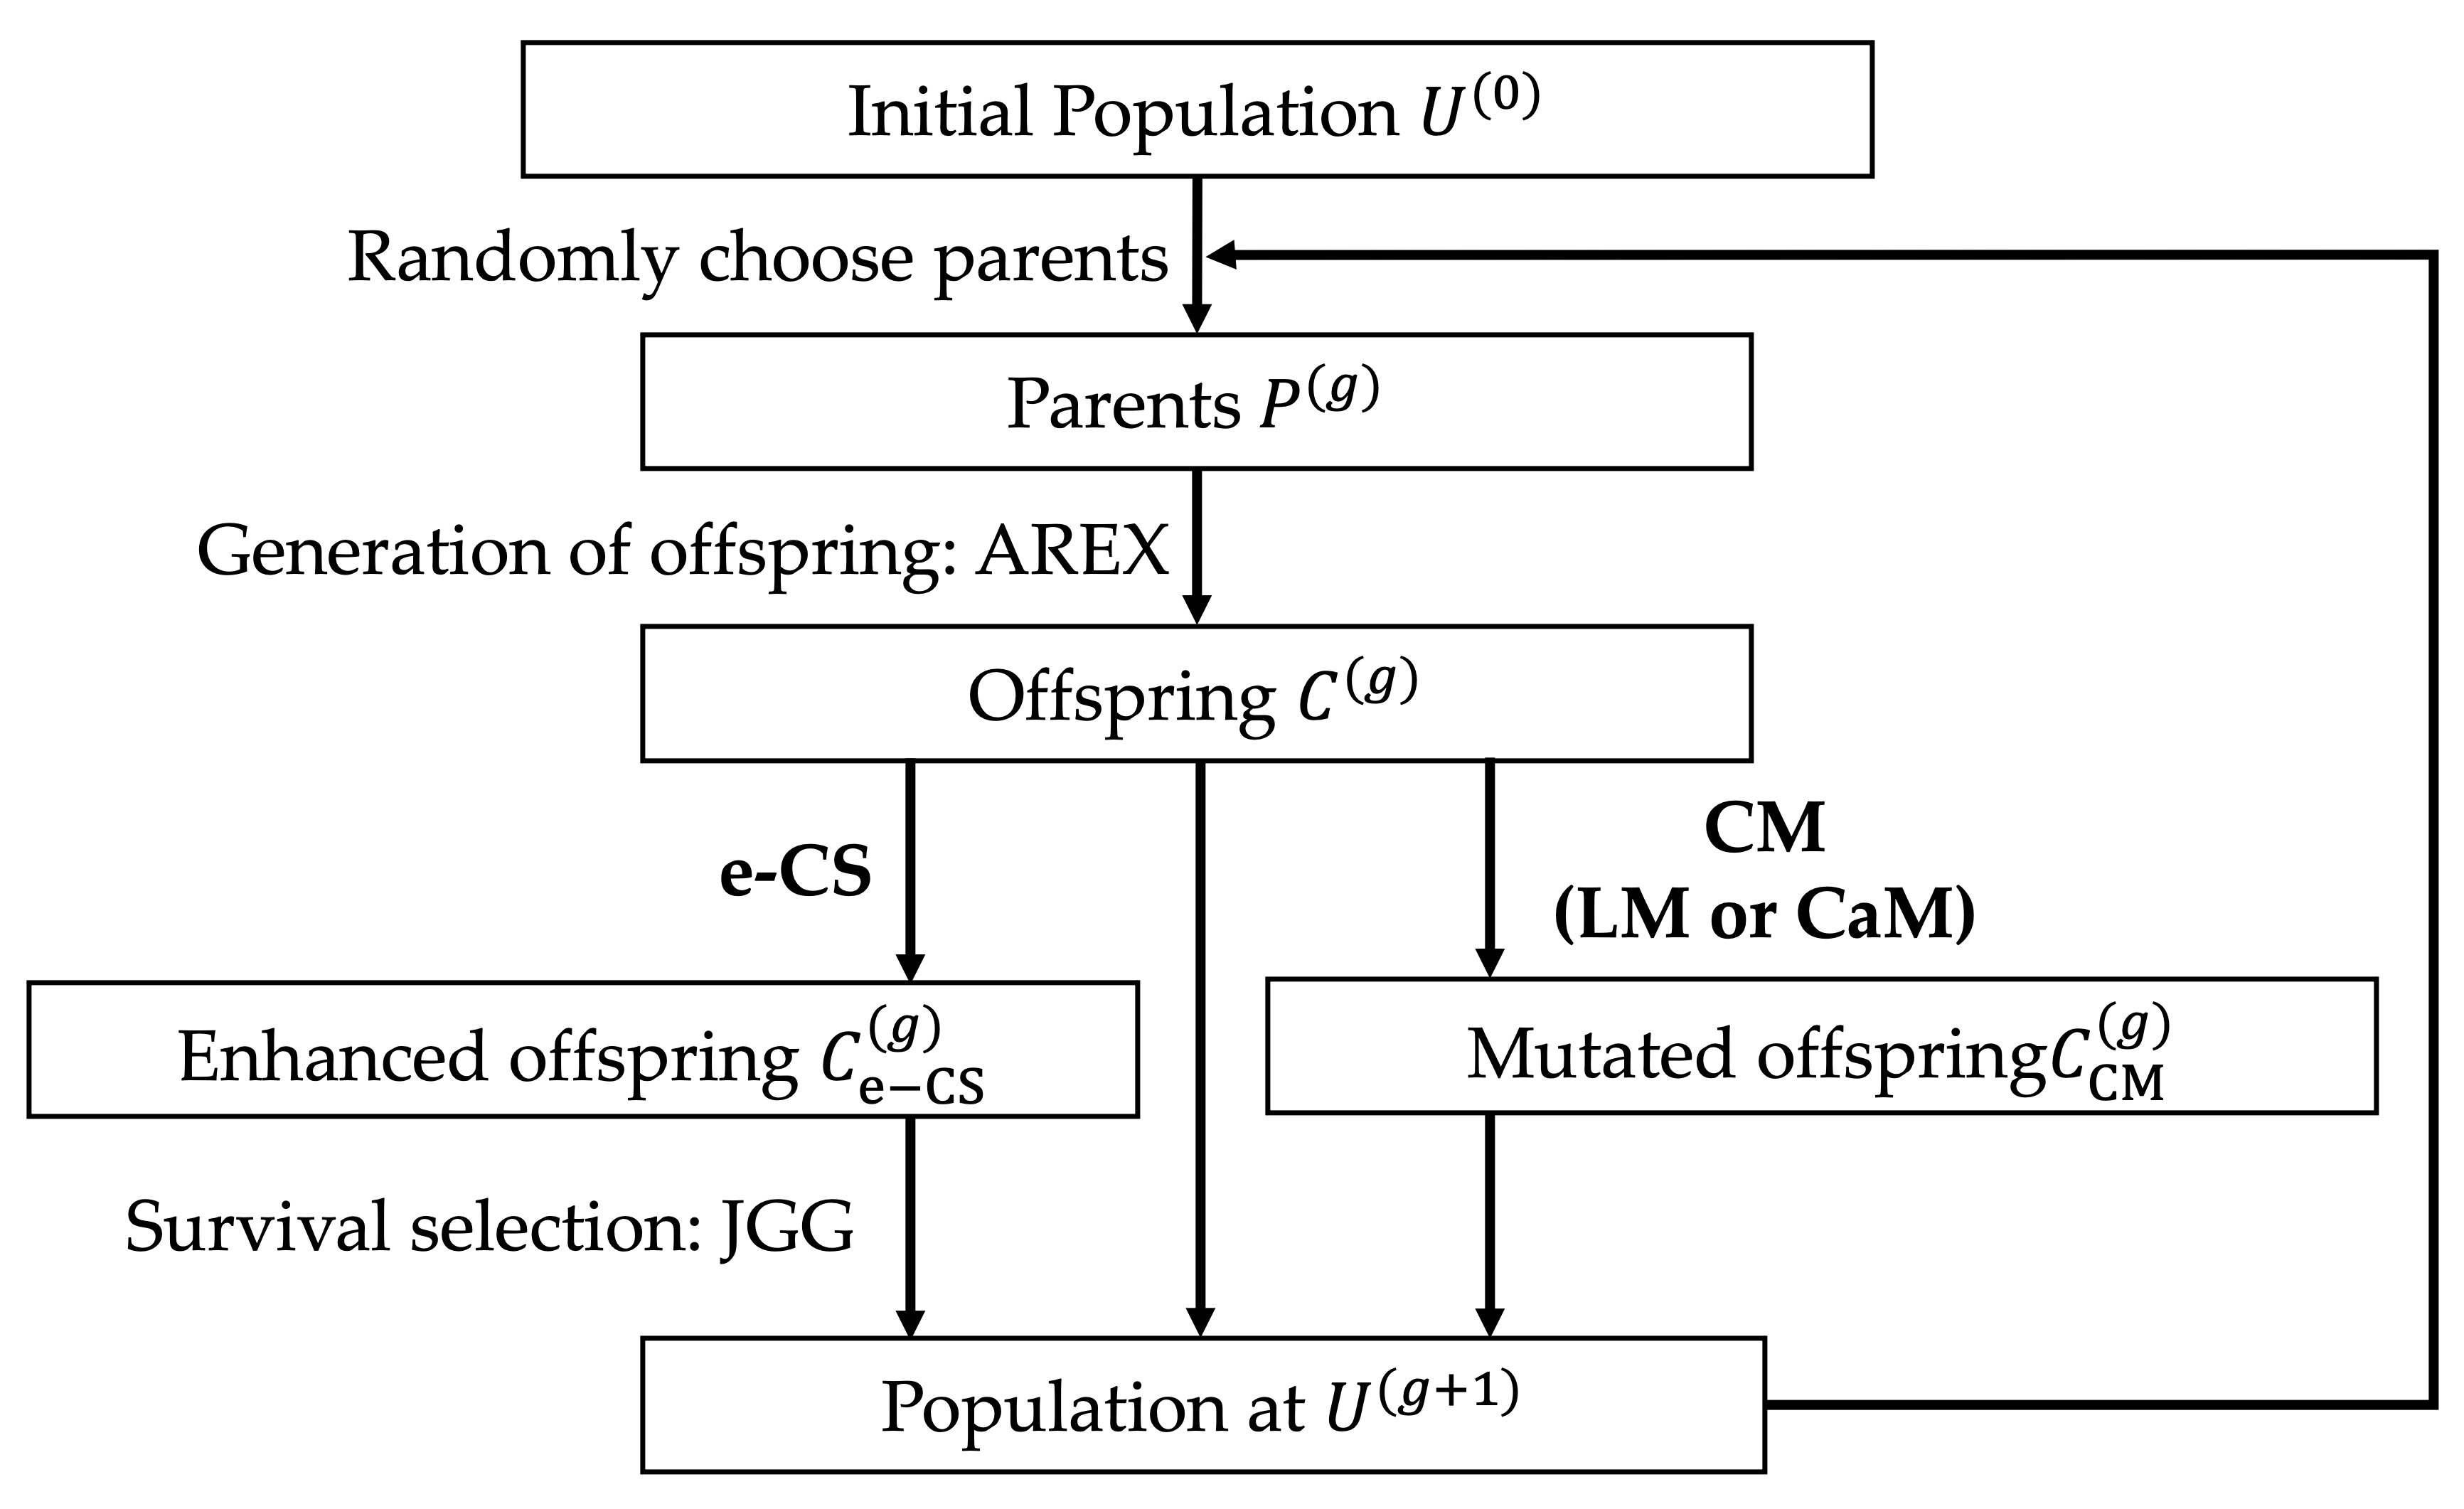
Overview of the proposed method based on AREX/JGG, combining search-distribution update by AREX, search-region expansion by enhanced Chaotic Search (e-CS), and heavy-tailed mutation by Combinational Mutation (CM).
Let U(g) denote the population at generation g. Let Np be the number of parents, and let Nc be the number of offspring generated by AREX. The offspring generated by AREX at generation g are denoted by C(g). In addition to C(g), the proposed method employs the following two auxiliary search mechanisms to generate additional offspring populations:
- enhanced Chaotic Search (e-CS), which generates an auxiliary offspring population by following the crossover center and extrapolating the search region.
- Combinational Mutation (CM), which generates an auxiliary offspring population through heavy-tailed perturbations.
Survivor selection based on JGG is then applied to the extended offspring population . Assuming that the initial search range is uncertain and may not contain the true optimum, e-CS is applied during a predetermined early period of the search. Whether candidates generated from the expanded region are useful is determined by fitness-based selection in JGG. Expansion is not initiated in response to an explicit assessment of the need for extrapolation before or during the search.
3.2. Search-Region Expansion Using Enhanced Chaotic Search
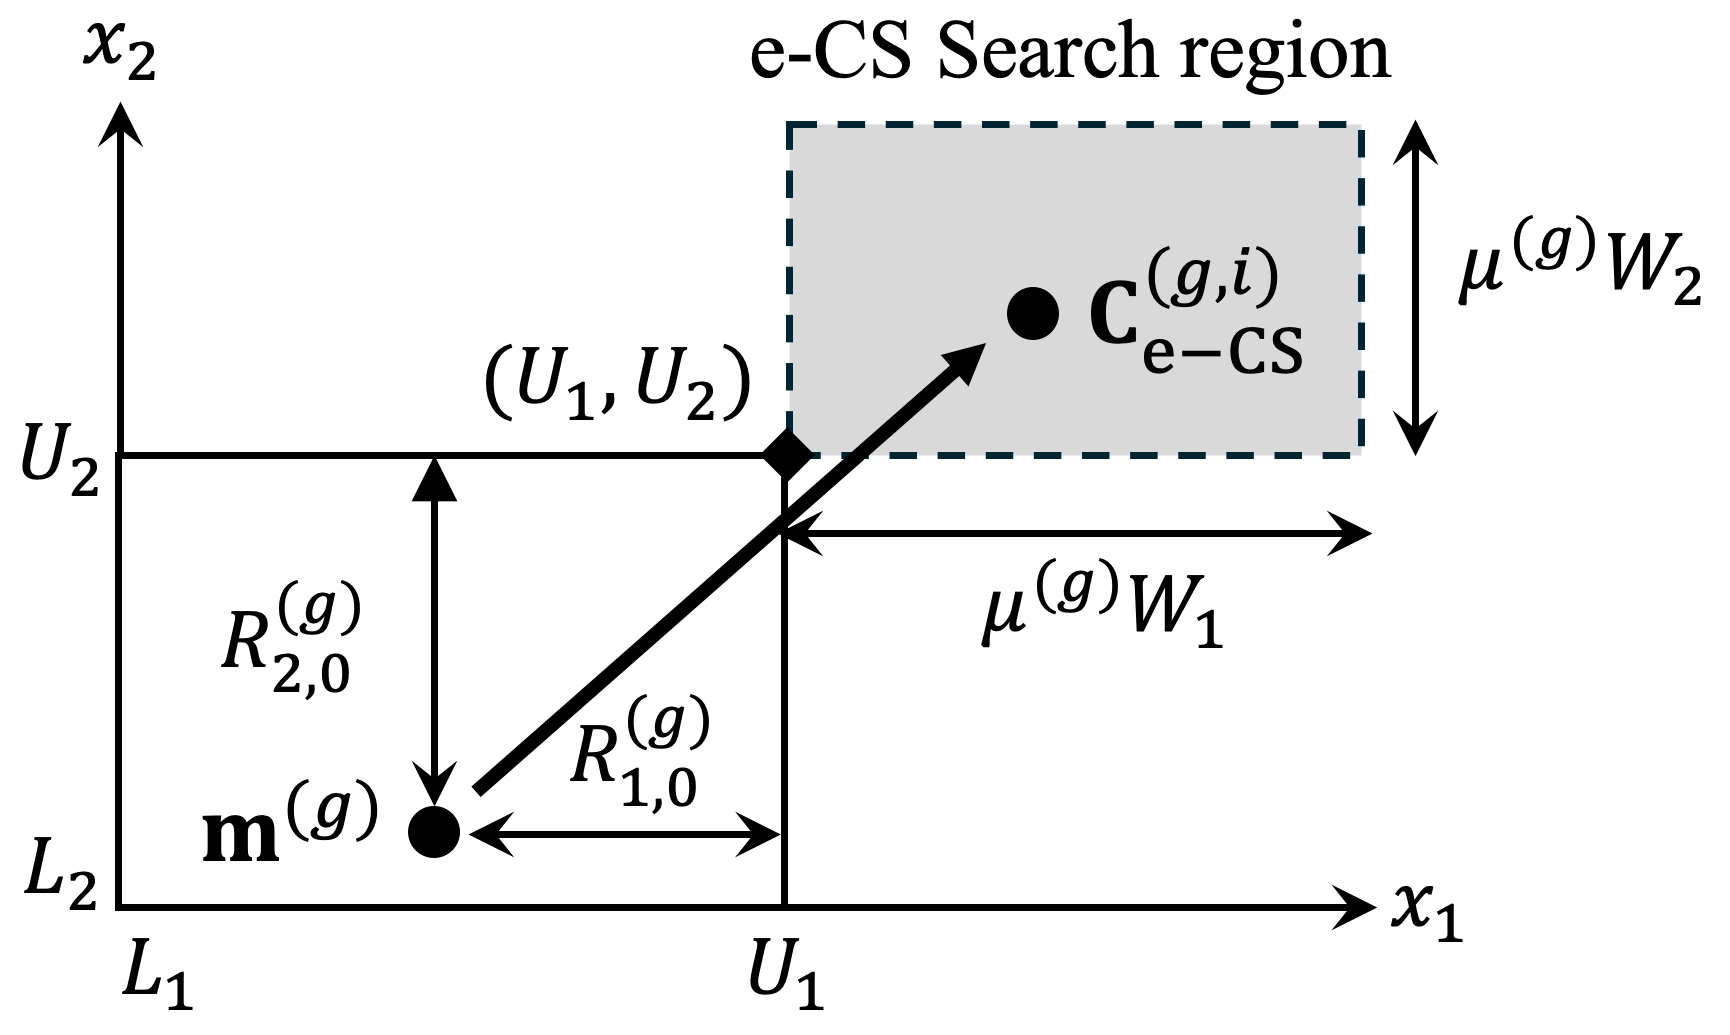
In AREX, the crossover center m(g) ∈ ℝn is updated at each generation based on the statistical structure of the parent population. In this study, we introduce enhanced Chaotic Search (e-CS), which generates candidates on the upper-bound side of the initial search range through extrapolation from this crossover center.
The width vector of the initial search range is defined as
where j denotes the dimension index, and Wj = Uj − Lj. The lower bound of the displacement from the crossover center in the j-th dimension is defined using the upper bound Uj of the initial search range as follows:
The upper bound of the displacement is defined as follows:
where μ(g) is the exploration weight coefficient that controls the interval between the displacement bounds. It decreases linearly with the generation index during the e-CS application period 0 ≤ g < Ge−CS:
where Ge−CS denotes the number of generations for which e-CS is applied. The interval between the displacement bounds in the j-th dimension is expressed as follows:
Candidates are generated by adding positive-direction displacements to the crossover center. The candidate-generation range in the j-th dimension is given by:
where denotes the j-th component of the i-th offspring generated by e-CS at generation g. Because the lower bound in Equation (15) is always at least Uj, candidates are generated on the upper-bound side of the initial search range (Figure 2).
A tent-map sequence is generated for each offspring i = 1, …, Ne−CS, and its values are used to determine the displacement in each dimension. The sequence is generated as
where j = 0, …, n − 1 indexes the map iterations, and the initial value is sampled as . If equals any of 0, 0.25, 0.5, 0.75, or 1, the following stochastic correction is used in place of Equation (16) to avoid degeneration of the sequence:
where r∼(0,1) is a uniform random variable used for the correction. To rescale the values of the finite-length sequence to the interval [0, 1], the following normalization is performed for each offspring:
Using the normalized value, the displacement in the j-th dimension is determined as
The offspring is then generated by adding this displacement to the j-th component of the crossover center:
Figure 2.
Conceptual illustration of candidate generation beyond the upper bounds of the initial search range by e-CS. The crossover center m(g) is shown within the initial search range. The shaded region indicates the candidate-generation range, and the arrow represents the displacement from the crossover center to a candidate.
3.3. Combinational Mutation
We introduced Combinational Mutation (CM) to assist local search and exploration through large perturbations. CM adopts two mutation operators proposed in HIRCGA [2]: Lévy Mutation (LM) and Cauchy Mutation (CaM). LM is applied to each offspring generated by AREX in even-numbered generations, and CaM in odd-numbered generations.
In LM, the j-th component of each offspring is mutated as
where αLM = 0.01 is a scaling coefficient, and s(βLM)∼Lévy(βLM) is a random variable drawn independently for each dimension of each offspring from a Lévy distribution with stability parameter βLM = 1.5 [2].
In CaM, mutation is performed as
where ξ is drawn independently for each dimension of each offspring from a Cauchy distribution with location parameter 0 and scale parameter 1.
Candidates generated by CM undergo objective-function-based survivor selection together with those generated by AREX and e-CS.
3.4. Proposed Algorithm
Algorithm 1 summarizes the proposed method. The implementation is publicly available on GitHub for reproducibility (https://github.com/tohsato-lab/RCGA.git) (accessed on 1 November 2026). Algorithm 1 uses a maximum generation count as a stopping criterion. In the benchmark experiments in Section 4, a common maximum number of objective function evaluations was used across methods; the metabolic-model experiments used a maximum of 2000 objective function evaluations. The termination criterion is specified for each problem. The success criteria and stopping limits used in the experiments are described in Section 4.
| Algorithm 1 Proposed Method (AREX/JGG + e-CS + CM) | |
| Input: | |
| n: number of parameters L, U: lower and upper bounds of the initial search range Nu: population size Np: number of parents selected by JGG Nc: number of offspring generated by AREX f(x): objective function Ne−CS: number of individuals generated by e-CS NCM: number of individuals generated by CM Ge−CS: number of generations for which e-CS is applied GCM: number of generations for which CM is applied αLM, βLM: parameters for Lévy mutation Gmax: maximum number of generations Termination criterion | |
| Output: | |
| xbest: best solution found | |
| 1: | g ← 0 |
| 2: | U(g) ← UniformRandom(L, U, Nu) |
| 3: | Evaluate f(x) for all x ∈ U(g) |
| 4: | Set xbest as the best individual in U(g) |
| 5: | while g < Gmax and the termination criterion is not met do |
| 6: | P(g) ← SelectParents(U(g), Np) |
| 7: | C(g), m(g) ← AREX(P(g), Nc) |
| 8: | |
| 9: | if g < Ge−CS then |
| 10: | |
| 11: | end if |
| 12: | |
| 13: | if g < GCM then |
| 14: | if g mod 2 = 0 then |
| 15: | |
| 16: | else |
| 17: | CaM(C(g), NCM, g) |
| 18: | end if |
| 19: | end if |
| 20: | |
| 21: | Evaluate f(x) for all unevaluated x |
| 22: | ) |
| 23: | Update xbest if a better solution is found |
| 24: | g ← g + 1 |
| 25: | end while |
| 26: | return xbest |
3.5. Application Periods and Objective Function Evaluations per Generation
Preliminary experiments compared Ge−CS = 5, 10, 20 for the number of generations for which e-CS is applied (Table A1). Based on these results, Ge−CS = 10 was used in all experiments. This setting is based on preliminary experiments and is not guaranteed to be optimal for all optimization problems. The number of generations for which CM is applied was set to GCM = 1000. In AREX/JGG, the number of objective function evaluations per generation is Nc. In the proposed method, e-CS and CM generate Ne−CS = Nc and NCM = Nc additional individuals, respectively, during their application periods. Thus, the number of objective function evaluations at generation g is expressed as follows:
4. Results
4.1. Experimental Setup for Outside-Range Benchmark Problems
The search performance of the proposed method was evaluated using standard benchmark functions. To clarify the effect of the proposed extension to AREX/JGG, we compared it with the baseline AREX/JGG and HIRCGA, an RCGA-based method that combines chaotic search and mutation-based exploration.
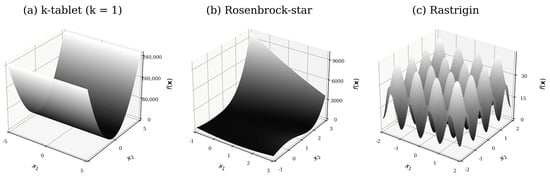
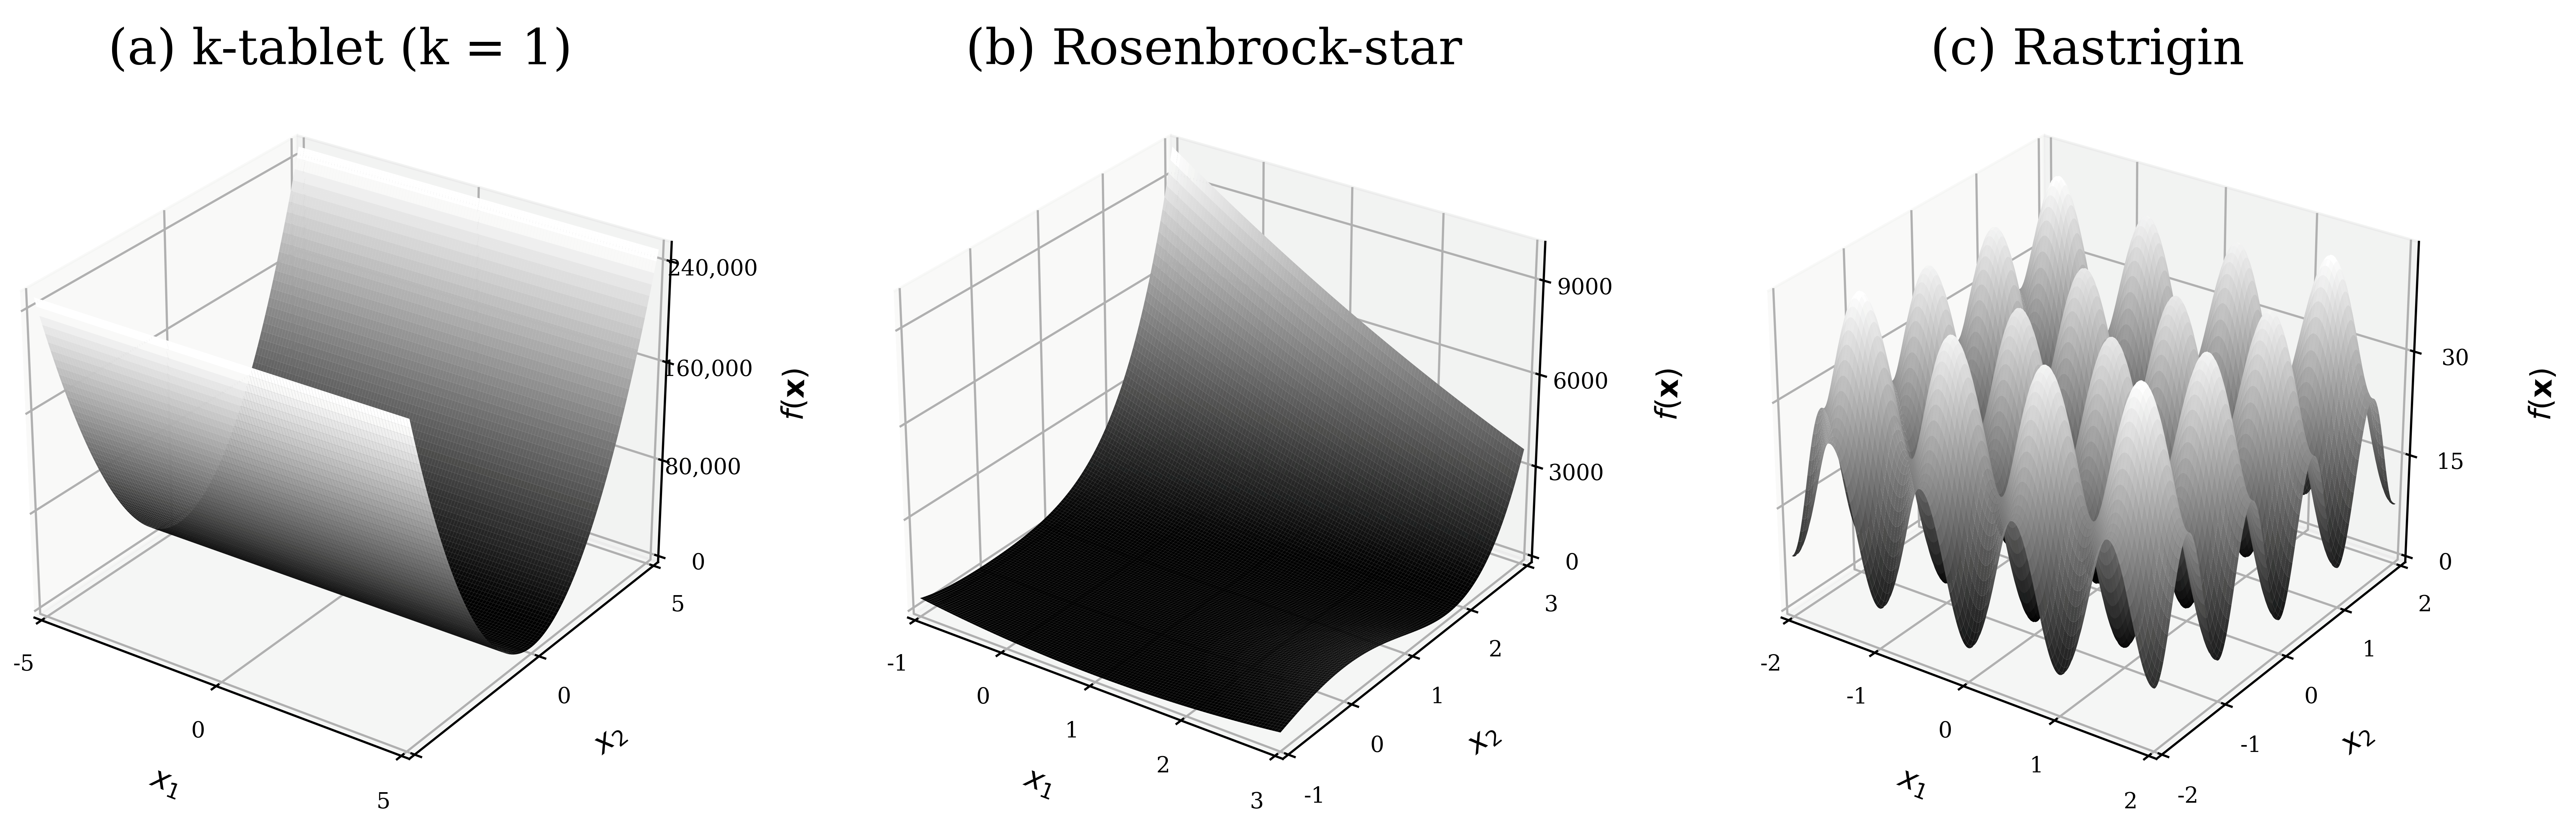
The standard benchmark functions listed in Table 1 were used as objective functions. These functions have been widely adopted for evaluating RCGAs such as BLX-α [6], REXstar [11], and AREX [1]. Their diverse landscape characteristics (Figure 3) make them suitable for analyzing performance and convergence properties. Specifically, Cigar and k-tablet represent ill-conditioned problems, Rosenbrock-star and Rosenbrock-chain involve strong variable dependencies, and Bohachevsky, Schaffer, and Rastrigin exhibit multimodality. To evaluate the effect of variable dependencies introduced by orthogonal rotation, Rotated Rastrigin and Rotated Griewank were added with reference to the rotated functions used in the CEC 2014 benchmark [20]. To match the initial search-range settings used in this study, shifts and function-value biases were omitted. Instead, a fixed orthogonal matrix was applied to define the rotated function as frot(x) = f(Mx). Here, M was obtained by QR decomposition of a matrix generated from standard normal random variables. A separate matrix was generated for each dimensionality (20, 40, and 80), and the same matrix was used for all methods and independent runs at each dimensionality. For these two rotated functions, the global optimum remains x∗ = 0, with f∗ = 0.
Table 1.
Definitions and initial search ranges of the benchmark functions used in the experiments.
Figure 3.
Landscapes of representative benchmark functions in two dimensions: (a) k-tablet (ill-scaling), (b) Rosenbrock-star (strong variable dependencies), and (c) Rastrigin (multimodality). For the two-dimensional k-tablet function, k = 1 was used to illustrate ill-scaling.
The definitions and dimensionalities (20, 40, and 80) of the eight benchmark functions excluding the rotated functions followed Akimoto et al. [1]. The same dimensionalities were used for the two additional rotated functions, allowing us to evaluate how search performance changes with increasing dimensionality across all 10 functions.
The outside-range ratio rout is defined as the proportion of dimensions in which the true global optimum x∗ lies outside the initial search range:
where I(⋅) is the indicator function, which takes the value 1 if the condition is satisfied and 0 otherwise. Thus, rout = 0 indicates that the optimum lies within the initial search range in all dimensions, whereas rout = 1 indicates that it lies outside the range in all dimensions.
The outside-range ratio represents the proportion of dimensions in which the optimum lies outside the initial search range, but does not describe its distance from that range. We therefore define the Euclidean distance between the initial search region and the global optimum x∗ as follows:
For each benchmark function, a common initial-range width W is used across all dimensions. To account for differences in width among functions, the normalized outside-range distance dout is defined as
where nout > 0 is the number of dimensions in which the optimum lies outside the initial search range.
To distinguish the effect of initial-range width from that of distance to the optimum, the width W was fixed for each benchmark function while the position of the range was varied. For dimensions in which the optimum was inside the initial range, the range was set to . For outside-range dimensions, it was set to . The optimum therefore lies beyond the upper bound, at a distance doutW from that bound. Table 1 lists the initial search ranges for each function.
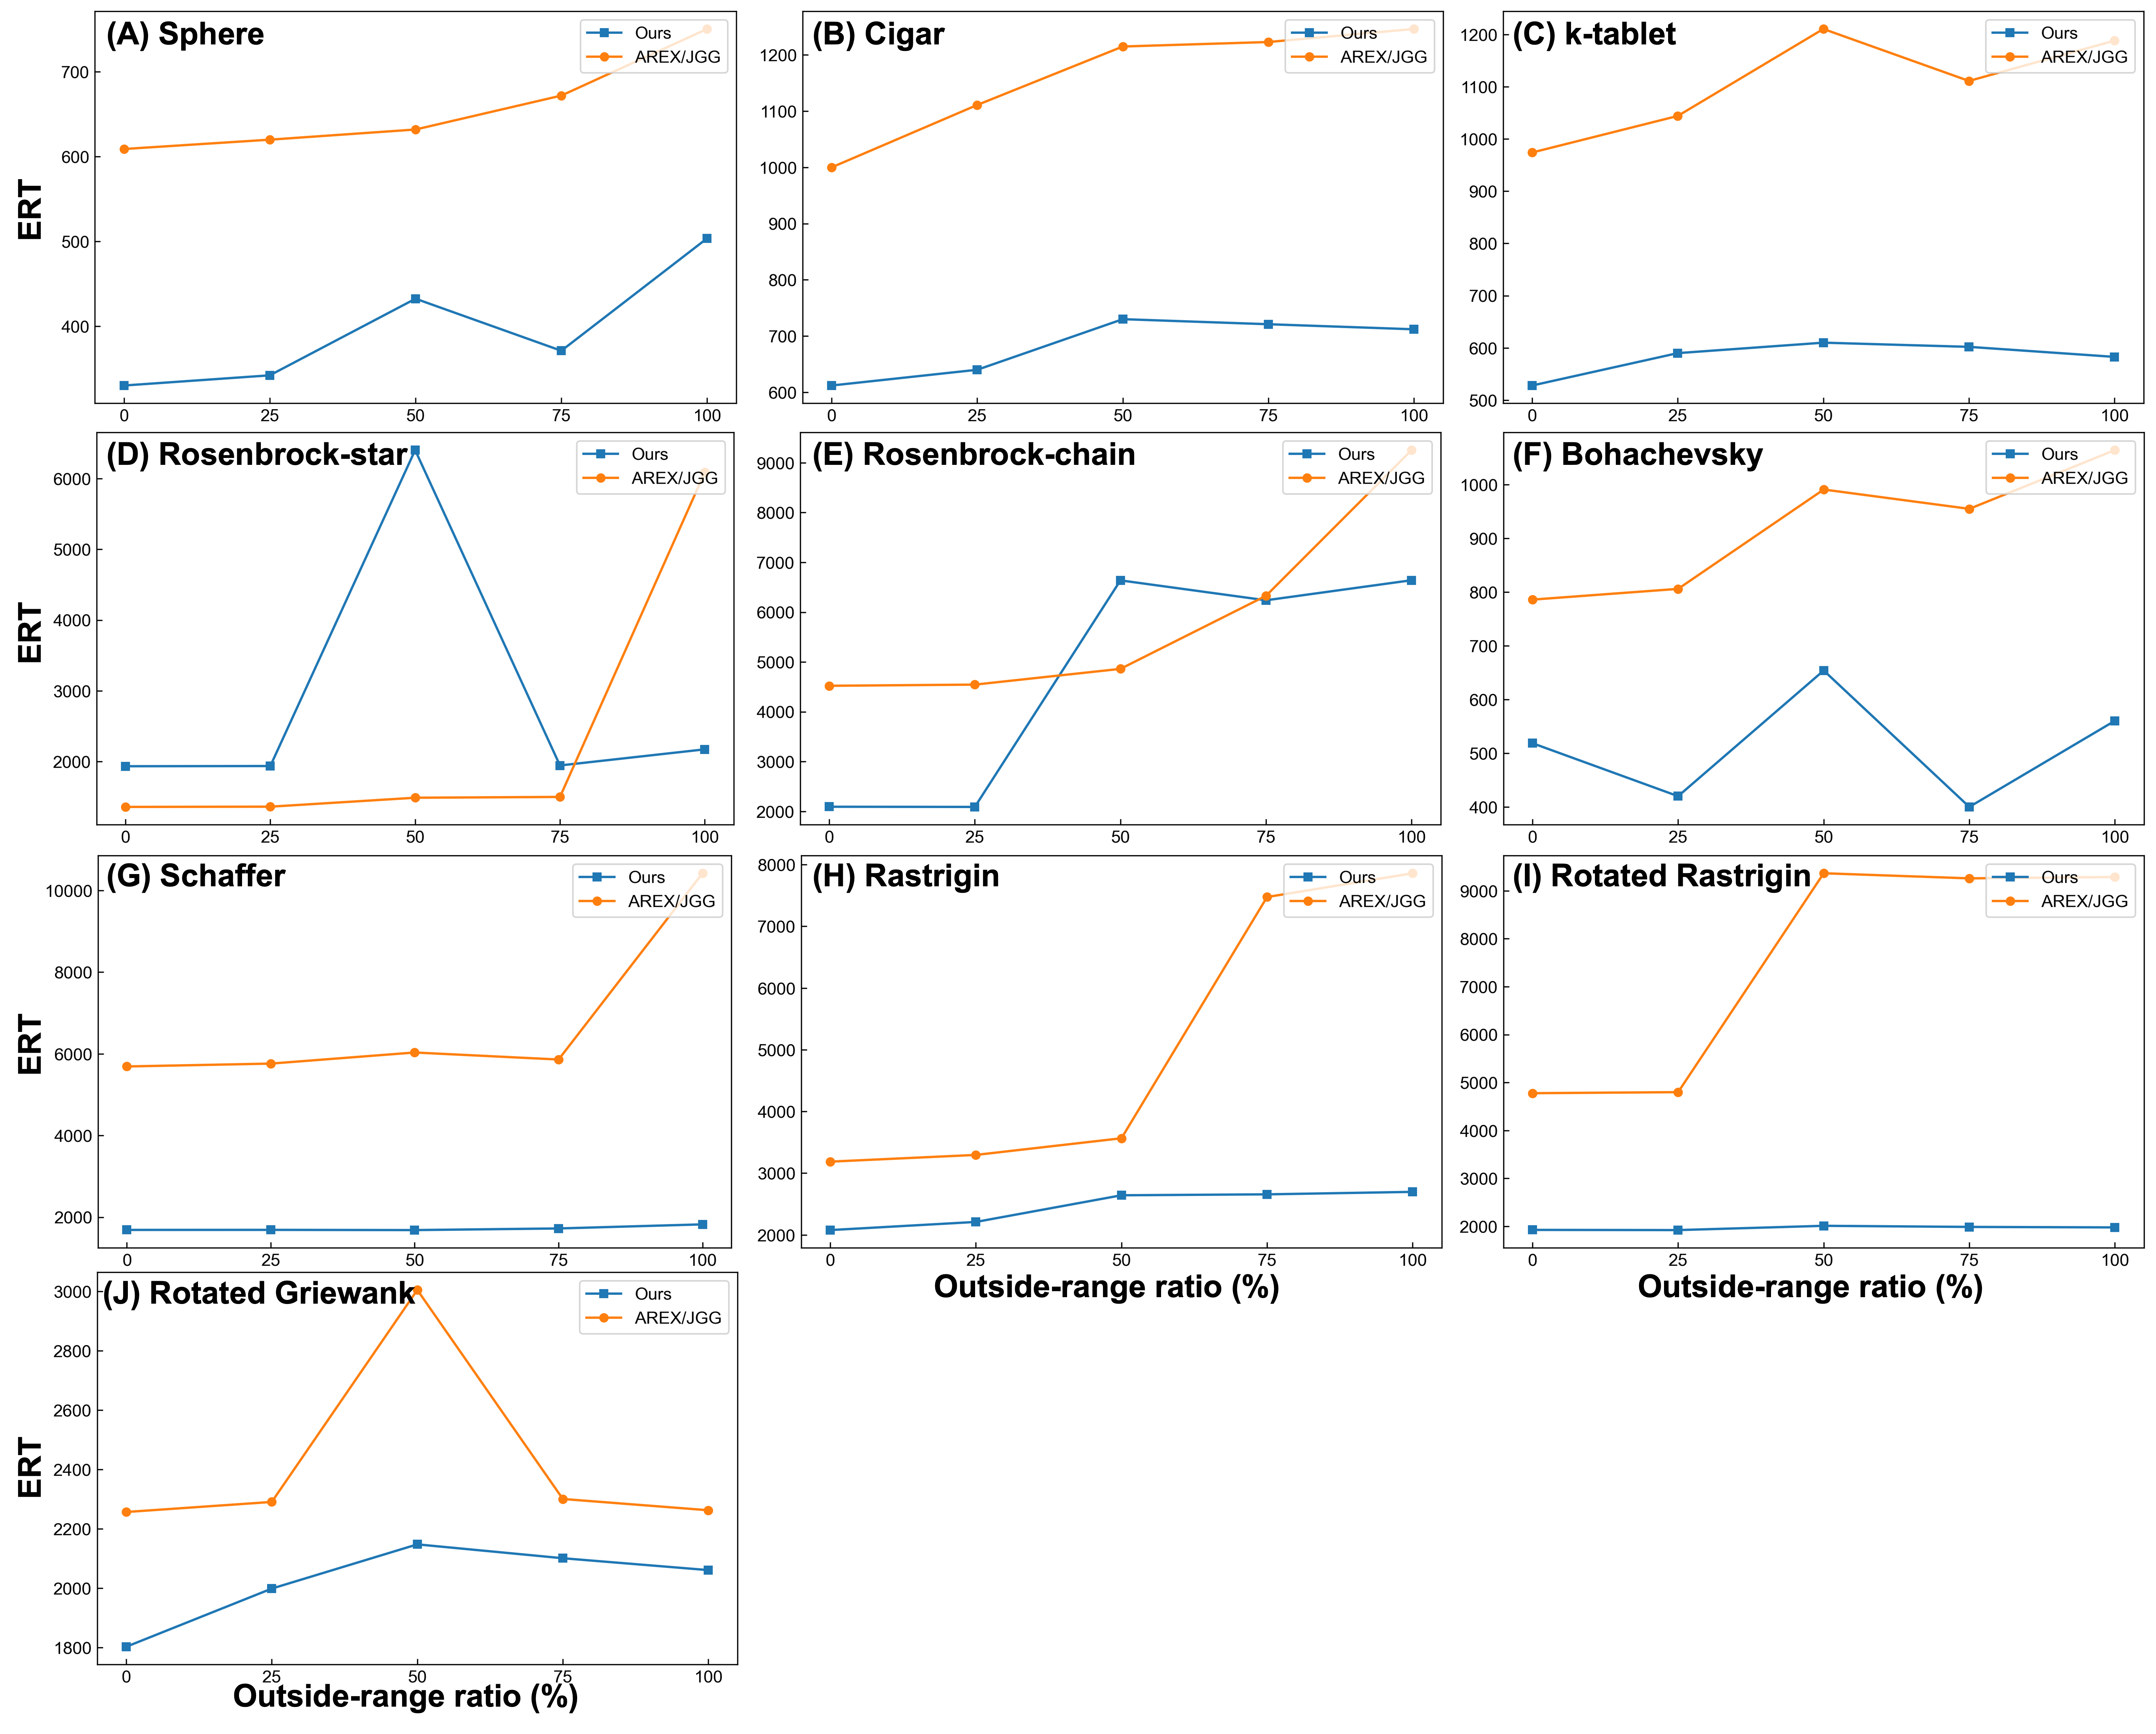
To evaluate the effect of the outside-range ratio, rout was set to 0%, 50%, and 100% for the 20-, 40-, and 80-dimensional benchmark functions. Additional settings of 25% and 75% were examined for the 40-dimensional comparison between the proposed method and AREX/JGG shown in Figure 4. For conditions containing outside-range dimensions, their normalized outside-range distance was fixed at dout = 1. Outside-range dimensions were selected at random, and ranges containing the optimum were used for the remaining dimensions. For example, Sphere has W = 10; at rout = 50% and dout = 1.0, half of the dimensions used [−20,−10] and the remainder used [−5,5]. Next, to evaluate the effect of normalized outside-range distance, dimensionality was fixed at 40 and the outside-range ratio at rout = 100%, while dout = 0.25, 0.5, 1.0 were compared.
Figure 4.
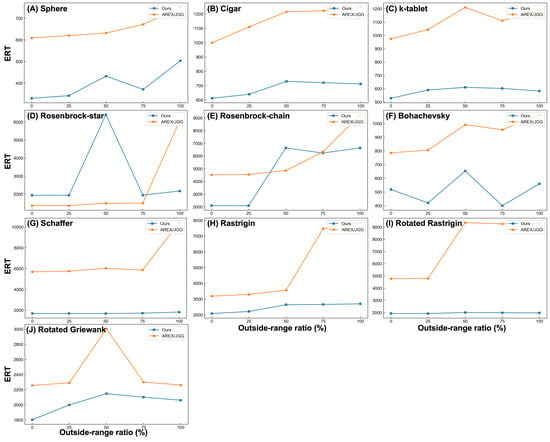
Relationship between outside-range ratio and ERT for 40-dimensional benchmark functions, comparing the proposed method with AREX/JGG. The normalized outside-range distance was set to dout = 1.0 for conditions containing outside-range dimensions.
The proposed method and HIRCGA require more objective function evaluations per generation than AREX/JGG during generations in which additional search mechanisms are applied. Search efficiency was therefore compared using cumulative objective function evaluations, including evaluations of additional offspring, rather than generation counts. For the benchmark experiments, the termination criterion in Algorithm 1 was defined by the success condition and the objective function evaluation budget specified below. Ten independent runs were performed for each experimental condition for which a population size was selected, and expected running time (ERT) was used as the performance metric.
For each run, the cumulative number of objective function evaluations until the best-so-far objective value fbest first satisfied |fbest − f∗| < 10−7 was recorded, where f∗ is the known optimal objective value. The maximum number of evaluations was set to Fmax = 1000n for all methods in the benchmark experiments, where n is the problem dimensionality. A run that reached this limit without satisfying the success criterion was classified as unsuccessful. ERT was calculated as
where N is the total number of runs, Nsucc is the number of successful runs, and Fi is the objective function evaluation count for run i. For successful runs, Fi is the cumulative evaluation count until first attainment of the success criterion; for unsuccessful runs, it is the cumulative evaluation count actually consumed up to termination. These counts include evaluations of the initial population and additional candidates. Including evaluations spent on unsuccessful runs, this metric estimates the expected number of evaluations needed to achieve success through independent repeated runs. When no run succeeded, a finite ERT could not be estimated and was reported as “—(0)”. The success count is reported alongside ERT for each condition evaluated. A dash without a success count denotes a condition in which the main experiment was not performed because no population size met the preliminary selection criterion.
Statistical comparisons were restricted to conditions in which both the proposed method and baseline AREX/JGG succeeded in all 10 runs. Under these conditions, the paired evaluation counts until first attainment of the success criterion were compared using a two-sided Wilcoxon signed-rank test with a significance level of 0.01. When all runs succeed, ERT equals the arithmetic mean of the first-attainment evaluation counts.
Table 2 lists the hyperparameter settings inherited from AREX/JGG and those specific to the proposed method. Population size was selected through preliminary experiments following the procedure in [1]. For both the proposed and comparative methods, the candidate sizes were Nu ∈ {5n, 10n, 15n, 20n, 25n}. For each benchmark function and experimental condition, the population size yielding the smallest average generation count among settings with at least nine successful runs out of 10 in the preliminary experiments was adopted (Table A2). When no candidate population size met this criterion, the main experiment was not performed for that method and condition.
Table 2.
Hyperparameter settings for the proposed method and AREX/JGG.
All experiments were implemented in Python 3.11.4 using NumPy 1.23.5 and Matplotlib 3.3.2. Experiments were conducted on a Windows 11 system equipped with an Intel Core i9-13900 CPU (5.60 GHz) and 64 GB of memory. Experiments were conducted on a Windows 11 (Microsoft Corporation, Redmond, WA, USA) system equipped with an Intel Core i9-13900 CPU (Intel Corporation, Santa Clara, CA, USA; 5.60 GHz) and 64 GB of memory.
4.2. Comparison Between the Proposed Method and Conventional Methods Under Outside-Range Conditions
Table 3 reports ERT and success counts for 40-dimensional benchmark functions at rout = 0%, 50%, 100%. For conditions containing outside-range dimensions, dout = 1.0 was used. Results for 20 and 80 dimensions are reported in Table A3. Table 4 reports the effect of varying normalized outside-range distance at 40 dimensions and rout = 100%.
Table 3.
ERT and number of successful trials at different outside-range ratios for the 40-dimensional benchmark functions. For conditions containing outside-range dimensions, dout = 1.0 was used. Values are ERTs, with success counts out of 10 runs in parentheses. “—(0)” indicates that all 10 runs failed and a finite ERT could not be estimated; “—” without a success count indicates that the main experiment was not performed because no population size met the preliminary selection criterion. Boldface indicates the lowest ERT under each condition. Paired first-attainment evaluation counts were compared between the proposed method and AREX/JGG using the Wilcoxon signed-rank test only where both methods succeeded in all 10 runs (*: p < 0.01).
Table 4.
ERT and number of successful trials at different normalized outside-range distances for the 40-dimensional benchmark functions. The outside-range ratio was set to 100%. Values are ERTs, with success counts out of 10 runs in parentheses. “—(0)” indicates that all 10 runs failed and a finite ERT could not be estimated; “—” without a success count indicates that the main experiment was not performed because no population size met the preliminary selection criterion. Boldface indicates the lowest ERT under each condition. Paired first-attainment evaluation counts were compared between the proposed method and AREX/JGG using the Wilcoxon signed-rank test only where both methods succeeded in all 10 runs (*: p < 0.01).
As shown in Table 3, both the proposed method and AREX/JGG succeeded in all 10 runs at every outside-range ratio for Sphere, Cigar, k-tablet, Bohachevsky, and Rotated Griewank, with lower ERT for the proposed method. Both methods also succeeded in all runs for Schaffer and Rastrigin at rout = 0%, 50% and for Rotated Rastrigin at rout = 0%, again with lower ERT for the proposed method. In particular, for Schaffer at rout = 0%, 50%, its ERT was 29.7% and 27.9% of that of AREX/JGG, respectively.
For Rosenbrock-star at rout = 0%, both methods succeeded in all 10 runs, but ERT was higher for the proposed method (1943.8) than for AREX/JGG (1357.6). For Rosenbrock-chain at rout = 0%, both methods succeeded in all runs, with ERTs of 2092.4 and 4521.5 for the proposed method and AREX/JGG, respectively. Thus, even when all runs succeeded, the relative search efficiency of the two methods varied across functions.
Success counts also varied with the condition. The proposed method succeeded in nine runs for Rosenbrock-star at rout = 50% and Rosenbrock-chain at rout = 50%, 100%, and in all 10 runs otherwise. AREX/JGG succeeded in nine runs for Rosenbrock-star, Rosenbrock-chain, Schaffer, and Rastrigin at rout = 100%, and for Rotated Rastrigin at rout = 50%, 100%. AREX/JGG succeeded in all 10 runs under the remaining conditions. Thus, the proposed method did not consistently achieve at least as many successful runs as AREX/JGG across all conditions.
Figure 4 compares the proposed method and AREX/JGG at outside-range ratios of 0%, 25%, 50%, 75%, and 100% for the 40-dimensional benchmark functions. In Table 3 and Table A3, AREX/JGG had higher ERT at rout = 50% or 100% than at 0% for many functions. However, ERT did not consistently increase with the outside-range ratio. For example, for 20-dimensional Schaffer, AREX/JGG had its lowest ERT at rout = 50%. The proposed method also achieved lower ERT than AREX/JGG under many conditions in 20 and 80 dimensions, although the relative performance of the two methods varied with the function, dimensionality, and outside-range ratio (Table A3).
In Table 4, for Sphere, Cigar, k-tablet, and Bohachevsky, both the proposed method and AREX/JGG succeeded in all 10 runs at every distance, with lower ERT for the proposed method. For Schaffer and Rastrigin, the proposed method had lower ERT at dout = 0.25, 0.5, where both methods succeeded in all runs. For Schaffer, its ERT was 30.3% and 31.8% of that of AREX/JGG at these distances, respectively. For Rosenbrock-star at dout = 0.25, both methods succeeded in all runs, but ERT was higher for the proposed method. For Rotated Griewank, both methods succeeded in all runs at every distance; the proposed method had higher ERT at dout = 0.25, 0.5 and lower ERT at 1.0.
The relationship between normalized outside-range distance and ERT also differed among functions and methods. Among Sphere, Cigar, k-tablet, and Bohachevsky, for which both methods succeeded in all runs at every distance, the proposed method had its lowest ERT at dout = 0.5 for Sphere and Bohachevsky, but its highest ERT at that distance for Cigar and k-tablet. For AREX/JGG, ERT increased with distance for Cigar, k-tablet, and Bohachevsky.
In comparisons with HIRCGA, both methods succeeded in all runs under every condition for Sphere, Cigar, and k-tablet in Table 3 and Table 4, with lower ERT for the proposed method throughout. For Bohachevsky, HIRCGA succeeded in nine runs at rout = 0% in Table 3 and dout = 0.25 in Table 4, but in no runs under the other conditions. For Schaffer, Rastrigin, Rotated Rastrigin, and Rotated Griewank, HIRCGA achieved no successful runs in either table. For Rosenbrock-star and Rosenbrock-chain, no HIRCGA population size met the preliminary selection criterion, and the main experiments were not performed. In contrast, the proposed method succeeded in at least nine runs under every condition in both tables.
To examine the effect of expanding the search distribution on search performance, we conducted additional comparisons using AREX/JGG with initial expansion rates of α(0) = 1, 1.5, 3 for 40-dimensional Sphere, Rosenbrock-star, and Schaffer. The outside-range ratio was set to rout = 0%, 100%, and the expansion rate was adaptively updated during the search in all settings, with its lower bound fixed at 1. Table A4 presents the results. For Sphere, setting α(0) = 1.5 yielded lower ERT than the default setting of α(0) = 1 at rout = 0%, but higher ERT at rout = 100%. For Rosenbrock-star, α(0) = 1.5, 3 yielded higher ERT than the default setting at both outside-range ratios. The proposed method achieved lower ERT than AREX/JGG with α(0) = 1.5, 3 under all tested conditions for these two functions. For Schaffer, both larger initial expansion rates yielded higher ERT than the default setting at both outside-range ratios, whereas the proposed method achieved lower ERT than all three AREX/JGG settings.
The next section examines the contribution of each component to search performance through an ablation analysis.
4.3. Ablation Analysis of the Proposed Method
To evaluate the contribution of each component, an ablation study compared four variants based on AREX/JGG: (1) the proposed method combining e-CS and CM, (2) e-CS only, (3) CM only, and (4) CM combined with DM. The experiments used 40-dimensional benchmark functions with rout = 100% and dout = 1.0. Table 5 reports ERT and success counts for each configuration.
In Table 5, the proposed method combining e-CS and CM achieved the lowest ERT among the four variants for five functions: k-tablet, Bohachevsky, Schaffer, Rastrigin, and Rotated Rastrigin. For Schaffer, e-CS alone required 5962.2 evaluations and CM alone required 2011.0, compared with 1824.0 for the proposed method. For Bohachevsky, Rastrigin, and Rotated Rastrigin, the differences between the proposed method and CM alone were small: 6.4, 5.0, and 21.0 evaluations, respectively.
In contrast, the CM-only configuration achieved the lowest ERT for Sphere, Cigar, and Rosenbrock-chain, the e-CS-only configuration for Rosenbrock-star, and the CM+DM configuration for Rotated Griewank. Thus, the proposed method combining e-CS and CM did not consistently achieve the lowest ERT.
Comparing the CM-only and CM+DM configurations, ERT decreased from 2108.3 to 2052.8 for Rotated Griewank. For the remaining nine functions, however, adding DM increased ERT. Thus, under the tested conditions, adding DM did not consistently improve search efficiency.
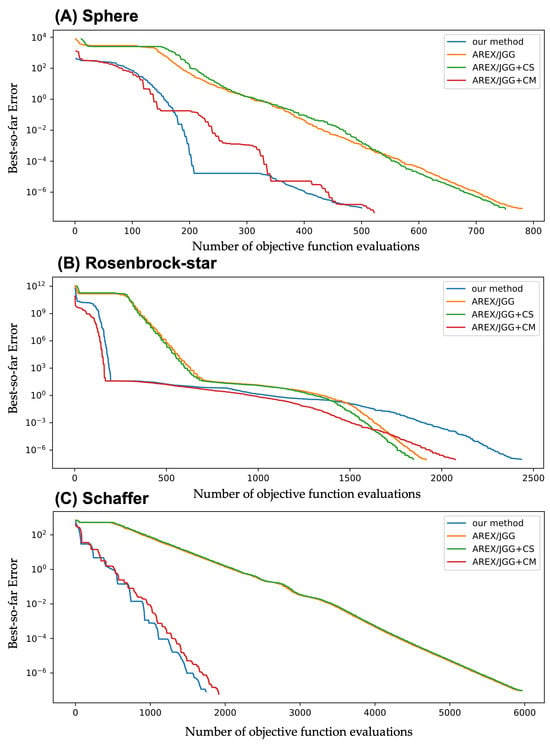
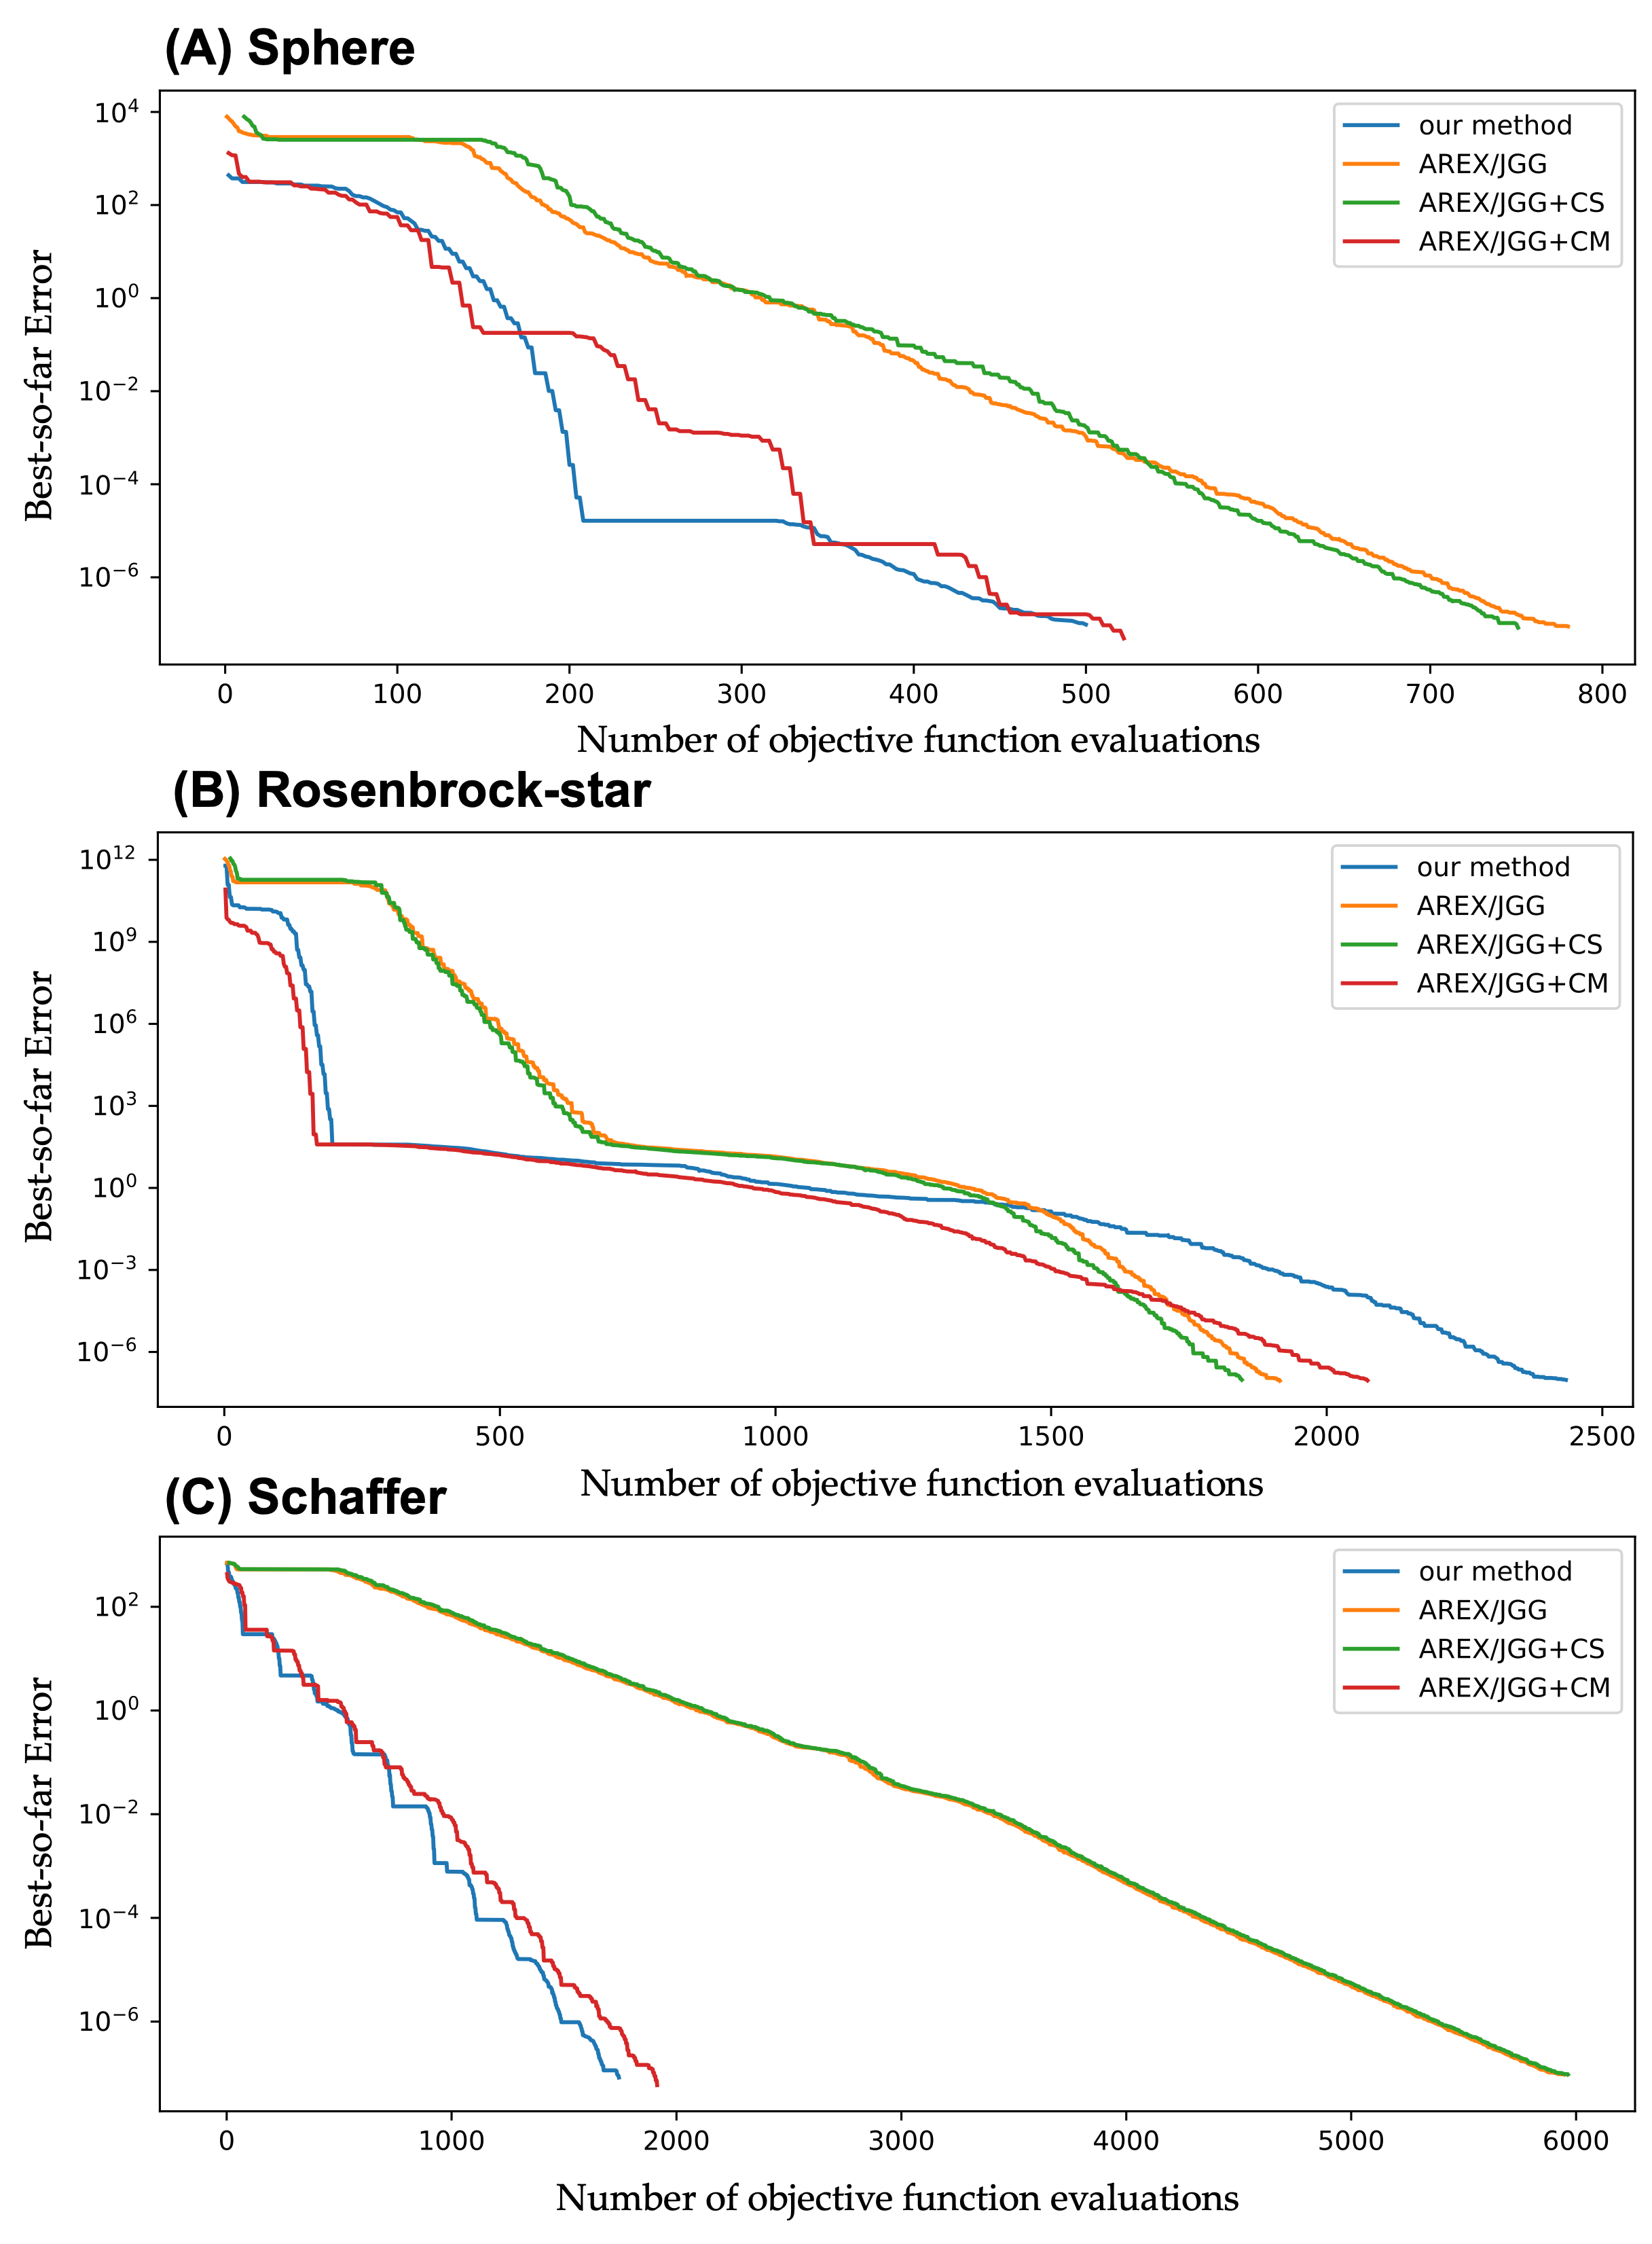
Figure 5 shows convergence curves for Sphere, Rosenbrock-star, and Schaffer. For Sphere and Schaffer, the proposed method and CM-only variant reduced the error with fewer evaluations than AREX/JGG and the e-CS-only variant. For Rosenbrock-star, the proposed method and CM-only variant rapidly reduced the error early in the search, whereas AREX/JGG and the e-CS-only variant achieved smaller errors later.
Figure 5.
Convergence curves for 40-dimensional (A) Sphere, (B) Rosenbrock-star, and (C) Schaffer at an outside-range ratio of 100% and normalized outside-range distance of 1.0. The proposed method (e-CS + CM), AREX/JGG, the e-CS-only variant, and the CM-only variant are compared. The horizontal axis shows cumulative objective function evaluations; the vertical axis shows the mean difference between the best-so-far objective value and the known optimum over 10 runs, on a logarithmic scale.
Figure A1 shows the generation-wise numbers of individuals generated by LM and CaM that were selected into the next generation. These counts differed among functions and search stages. However, selection counts alone do not identify objective-value improvements attributable to each operator or their contributions to local and global search.
Table 5.
Ablation analysis for 40-dimensional benchmark functions at rout = 100% and dout = 1.0. The proposed method (e-CS + CM), e-CS only, CM only, and CM+DM are compared. Ten independent runs were performed under each condition. Values are ERTs, with success counts out of 10 runs in parentheses. Boldface indicates the lowest ERT for each function.
4.4. Application to an Escherichia coli Metabolic Model
Following the evaluation of benchmark functions with relatively low objective-evaluation cost, this section considers a parameter-estimation problem involving numerical integration of ODEs. Specifically, the search performance of the proposed method was evaluated using an ODE model of Escherichia coli glycolysis [21].
The model comprises 18 metabolite concentrations, 30 enzymatic reactions, and 119 model parameters and is expressed by the following ODE system:
where, t is time, c(t; x) ∈ ℝ18 is the metabolite concentration vector, S ∈ ℝ18×30 is the stoichiometric matrix, v ∈ ℝ30 is the reaction-rate vector, x ∈ ℝ119 is the model parameter vector, and c0 is the initial concentration vector. In Equations (29) and (30), x represents the full set of 119 model parameters. Only 15 components are treated as optimization variables, while the remaining 104 components are fixed at their reference values.
Of the 119 model parameters, 15 were optimized and the remaining 104 were fixed at their reference values. Initially, 30 maximum reaction-rate parameters, which directly determine the scales of the corresponding reaction fluxes, were considered for estimation. Preliminary experiments optimizing all 30 simultaneously did not obtain a solution satisfying the success criterion within the specified evaluation budget. The estimation targets were therefore progressively reduced through preliminary optimization attempts to construct a 15-parameter problem. This selection was not based on quantitative sensitivity or identifiability analysis, and neither the exclusion criteria nor the exclusion order was specified in advance. The experiment is therefore treated as a case study of the reduced 15-parameter problem constructed through this procedure.
Table A5 lists the optimized parameters and their reference values. State variables, reaction-rate equations, initial conditions, and other parameter values were taken from the model available in BioModels (BIOMD0000000051).
For each candidate parameter vector, the ODEs were integrated from the specified initial conditions using the fourth-order Runge–Kutta method with a time step of Δt = 0.01 s over 0 ≤ t ≤ 40 s. Concentrations of the 18 metabolites at five time points (8, 16, 24, 32, and 40 s) were extracted to obtain 90 model predictions. Values generated using the same procedure with the reference parameter vector x∗ served as pseudo-observations. The objective function was the root mean squared error (RMSE) between predicted and pseudo-observed concentrations:
where Nm = 18 is the number of metabolites, Nt = 5 is the number of observation times, and tj = 8j s (j = 1, …, Nt) is the j-th observation time. Here, ci(tj; x) is the predicted concentration of metabolite i at time tj for candidate parameter vector x, and ci(tj; x∗) is the corresponding pseudo-observed concentration.
The number of optimized parameters was n = 15, and the population size was Nu = 5n = 75; the remaining algorithm parameters were set as in Table 2. Because the reference parameter values span 0.001–7829, the lower bound of the initial range was fixed at 0 and the upper bound was set to 100, 1000, 5000, or 10,000 for all optimized parameters. Some reference parameter values lie outside the initial range in each of the three settings other than [0, 10,000].
For each setting, the proposed method and AREX/JGG were each executed in 10 independent runs. A run was considered successful when the best-so-far RMSE fell below 10−7. Performance was evaluated using success counts and ERT, calculated according to Equation (28) from first-attainment evaluation counts for successful runs and evaluation counts consumed by unsuccessful runs. The maximum number of objective function evaluations was Fmax = 2000. Each run terminated upon success or upon reaching this limit. Evaluation counts actually consumed by unsuccessful runs were used to calculate ERT.
Table 6 reports success counts and ERT for each initial range. For [0, 5000], both methods succeeded in all runs, but the proposed method had higher ERT (1140.6) than AREX/JGG (898.2). For [0, 10,000], [0, 1000], and [0, 100], the proposed method achieved nine, 10, and eight successful runs, respectively, compared with zero, six, and zero for AREX/JGG. The proposed method therefore achieved more successful runs in three of the four settings examined.
Table 6.
Comparison of methods across initial search ranges for the 15-parameter estimation problem in the Escherichia coli glycolysis model. Values are ERTs, with success counts out of 10 runs in parentheses. “—” indicates that no run succeeded and a finite ERT could not be estimated. Boldface indicates the lowest ERT under each condition. Paired first-attainment evaluation counts were compared between the proposed method and AREX/JGG using the Wilcoxon signed-rank test only where both methods succeeded in all 10 runs (*: p < 0.01).
Success-count improvements occurred both where some reference values lay outside the initial range and for [0, 10,000], which contains all reference values. However, changing the upper bound simultaneously changes the range width, the number of reference parameters outside the range, and their distances from its boundary. Differences in success counts therefore cannot be attributed solely to the outside-range ratio or normalized outside-range distance.
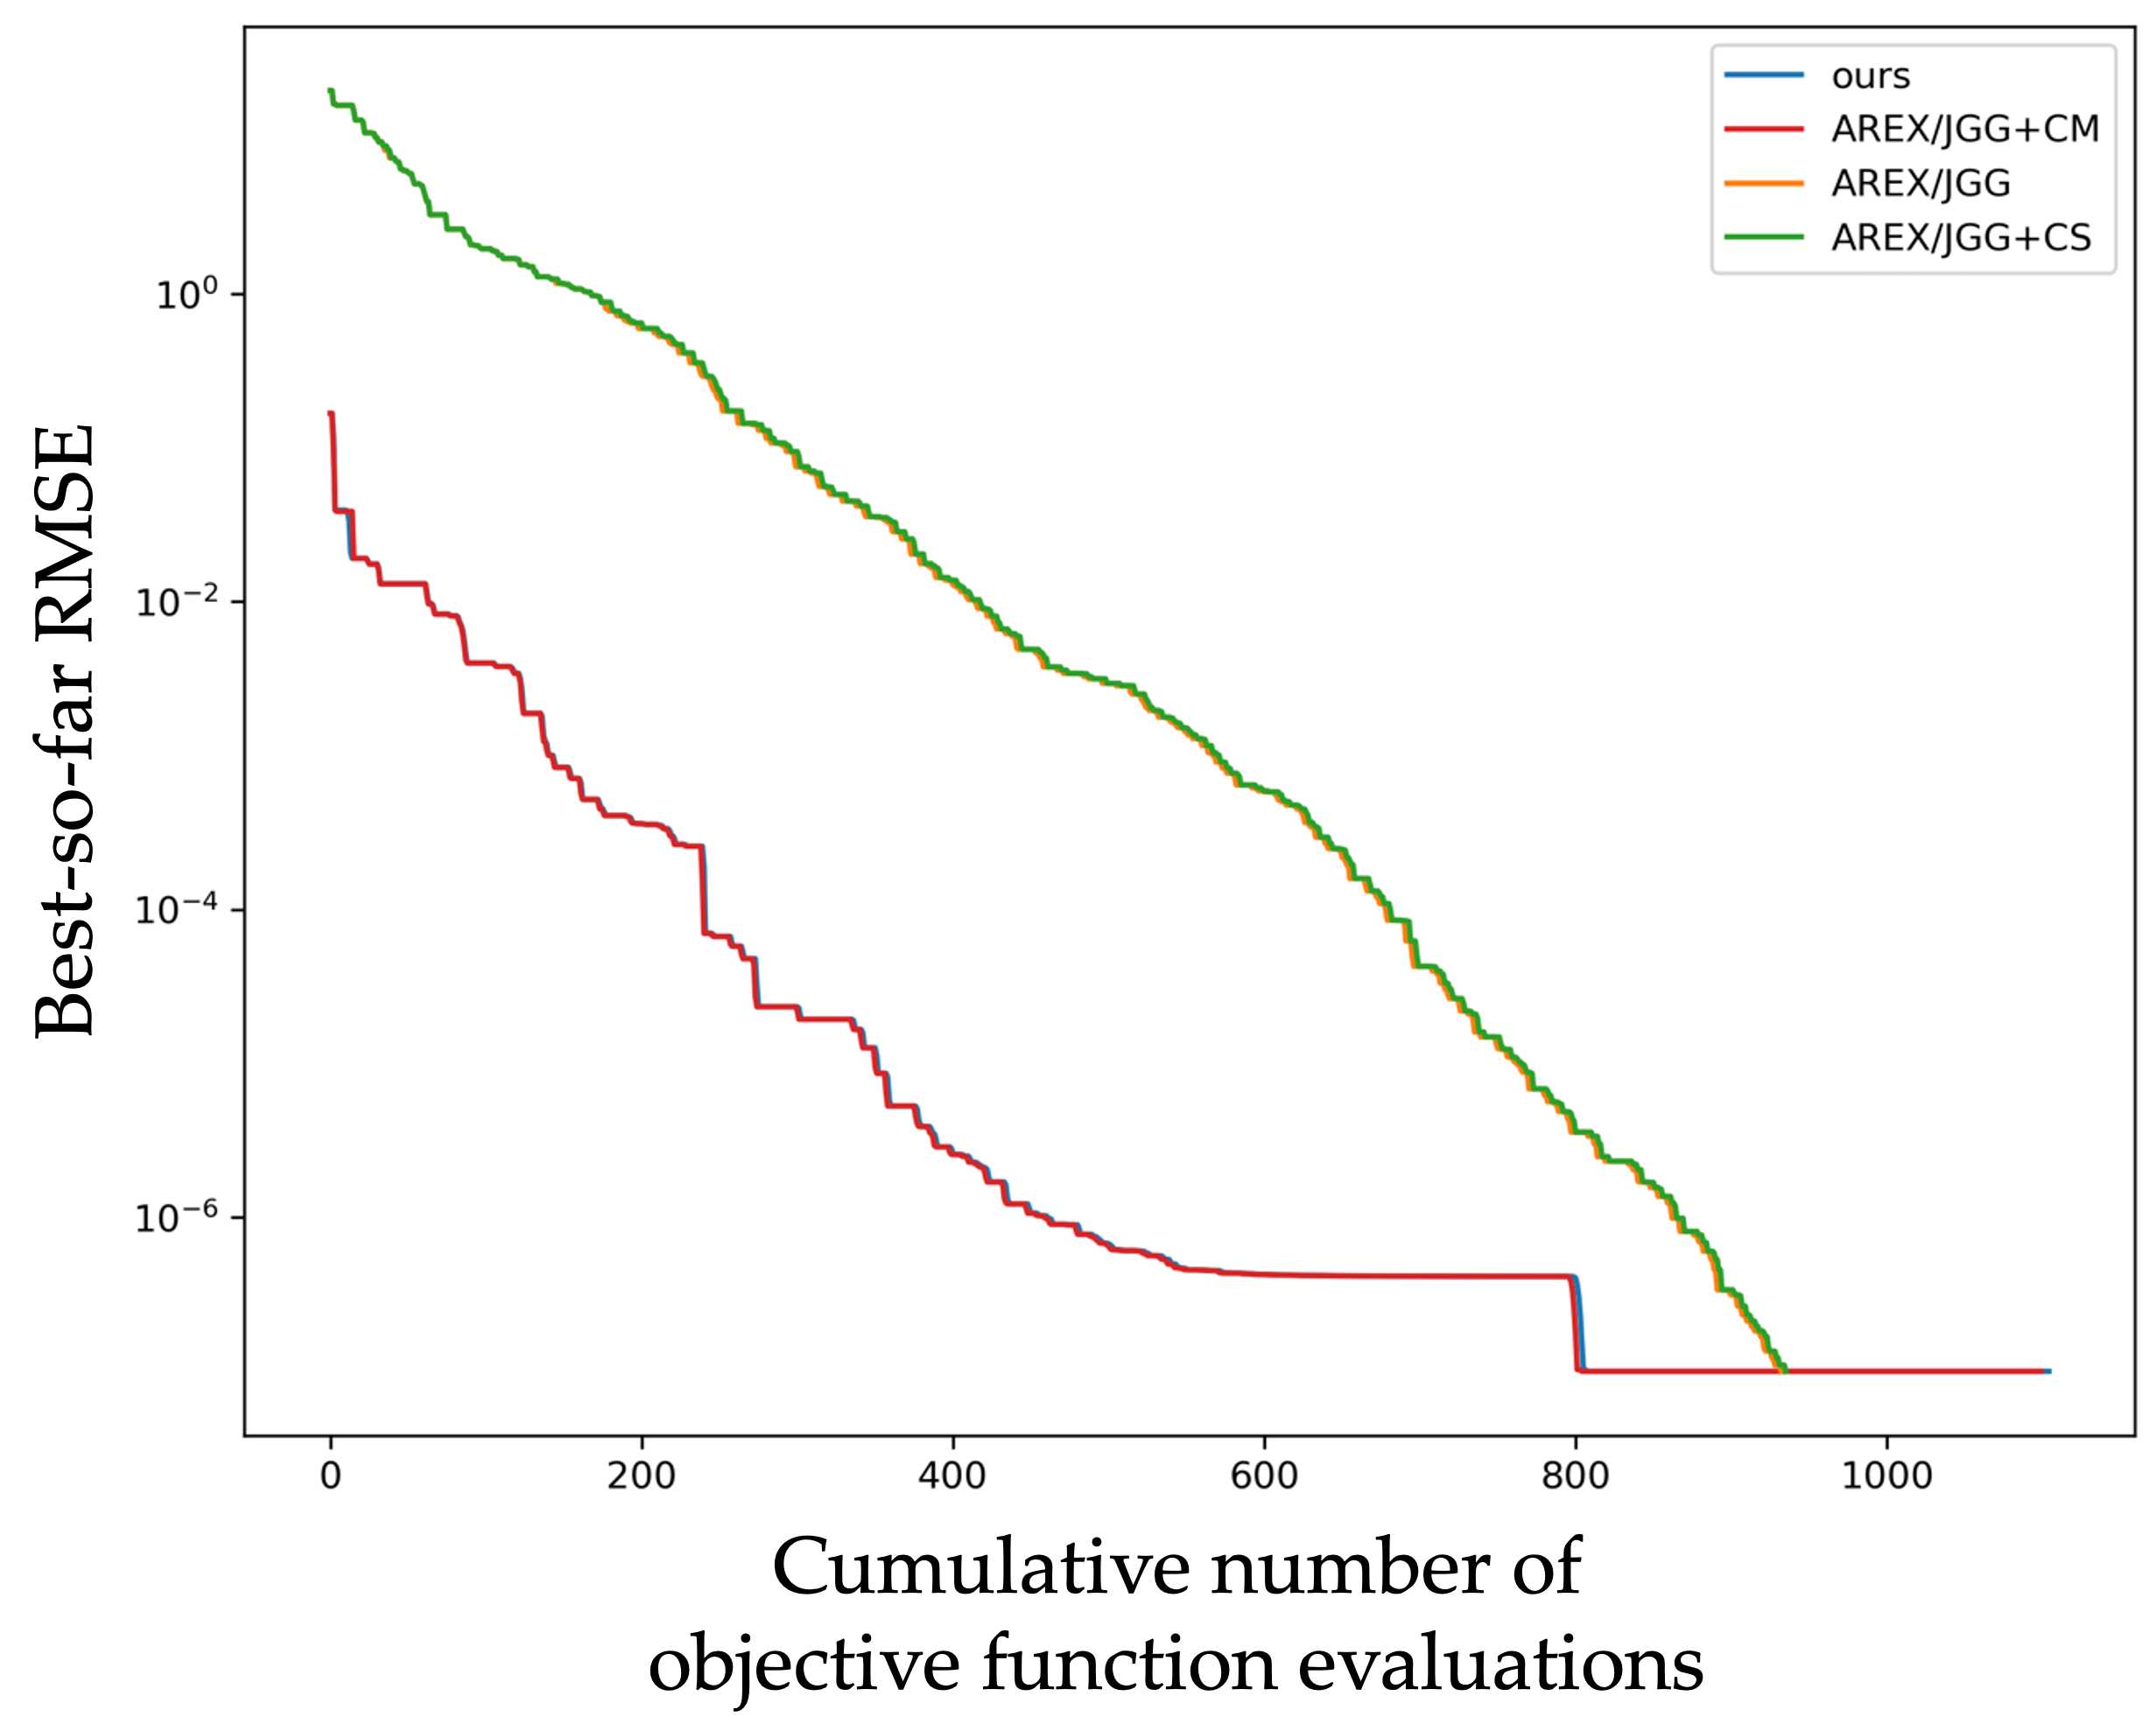
Figure A2 shows simulations using the reference parameters and the pseudo-observations sampled from those simulations. Figure A3 illustrates examples of the search process. Each curve shows the relationship between cumulative objective function evaluations and best-so-far RMSE in a single run. Quantitative comparisons between methods are based on the 10 independent runs reported in Table 6.
5. Discussion
5.1. Effect of the Proposed Mechanisms in Benchmark Functions
The proposed method introduces search-region expansion as a candidate-generation mechanism separate from the search-distribution update by AREX. Specifically, e-CS generates candidates through extrapolation, while CM generates candidates with heavy-tailed perturbations. This retains the crossover mechanism of AREX while allowing the application generations and offspring counts of the additional mechanisms to be specified individually. This separation concerns the design of candidate-generation mechanisms and does not imply statistical independence during search. Individuals generated by all mechanisms undergo common survivor selection and influence the subsequent AREX search distribution through the next parent population.
In the benchmark experiments, the proposed method had lower ERT than AREX/JGG under many conditions. However, its ERT was higher for some Rosenbrock-star conditions and for 80-dimensional Rosenbrock-chain. Additional candidate-generation mechanisms can therefore improve search efficiency for multiple problems, but their effects depend on the function and experimental conditions. These comparisons alone do not establish decoupling itself as the cause of the improvement.
The proposed method increases objective function evaluations during generations in which additional candidates are generated. Nevertheless, under many conditions in Table 3 and Table 4 where both methods succeeded in all 10 runs, its ERT was lower than that of AREX/JGG even when additional offspring evaluations were included. Because ERT equals the mean first-attainment evaluation count under these conditions, this indicates improved search efficiency after accounting for the cost of additional evaluations. When unsuccessful runs are present, ERT reflects both evaluations needed to reach the target and the success rate, and should be interpreted alongside success counts.
ERT did not consistently increase with outside-range ratio or normalized outside-range distance. The proposed method also had lower ERT than AREX/JGG under some conditions where the optimum was inside the initial range. Its improvements are therefore not restricted to outside-range conditions and cannot be explained solely by its ability to reach regions outside the initial range.
The outside-range ratio and normalized outside-range distance describe the geometric relationship between the initial range and the optimum; they do not alone determine search difficulty or performance differences. Although range width was fixed in these experiments, changing its position also changes the region containing the initial population. Differences between distance conditions may therefore reflect differences in local objective-function geometry as well as distance to the optimum.
Interactions between the search distribution constructed by AREX from the parent population and the additional candidate-generation mechanisms may explain why effects vary with function and dimensionality. Additional candidates increase opportunities to explore promising regions, but also incur evaluations of candidates that do not contribute to attaining the success criterion. They therefore do not necessarily reduce total evaluation counts. Their incorporation into the parent population through survivor selection may also affect subsequent search distributions. However, objective-value improvements attributable to each mechanism and covariance structures during search were not directly analyzed, so the absence of improvement cannot be attributed specifically to these interactions.
The proposed method also had lower ERT than AREX/JGG for some conditions of Rotated Rastrigin and Rotated Griewank, indicating that the presence or absence of variable dependencies alone does not explain performance differences. Identifying conditions in which the proposed mechanisms are useful requires examining the locations and selection of additional candidates and changes in the subsequent search distribution, alongside function characteristics and dimensionality.
In the ablation analysis, the combined e-CS and CM method achieved the lowest ERT for five of the 10 functions in Table 5. For Schaffer, the combined variant reached the success criterion with fewer evaluations than either e-CS or CM alone. For Rastrigin and Rotated Rastrigin, however, differences between the combined variant and CM alone were small. CM alone performed best for Sphere, Cigar, and Rosenbrock-chain, whereas e-CS alone performed best for Rosenbrock-star. These results indicate that combining the mechanisms can be useful for multiple problems, but do not show that both are necessary for every problem or that their combination provides a universal synergistic effect.
Figure 5 also shows that the relative errors of variants can change with search stage. For Rosenbrock-star, the proposed method and CM-only variant reduced the error rapidly early in the search, whereas AREX/JGG and the e-CS-only variant achieved smaller errors later. Early error reduction alone therefore does not establish search efficiency through attainment of the success criterion. Likewise, differences in the selection counts of LM- and CaM-generated individuals in Figure A1 show that their use depends on function and search stage, but selection counts alone cannot quantify their contributions to performance improvements.
Adding DM did not consistently reduce evaluation counts. Compared with CM alone, ERT decreased for Rotated Griewank but increased for functions including Sphere, Cigar, and Schaffer. Adding a search mechanism therefore does not necessarily improve search efficiency under the settings used here. The causes of these changes cannot be isolated because the evaluation costs of additional candidates and their effects on the search distribution through survivor selection were not examined separately.
In the additional AREX/JGG comparison, increasing the initial expansion rate did not consistently improve search efficiency (Table A4). Under the conditions examined, simply adopting a wider search-distribution setting does not necessarily improve efficiency. However, this comparison alone does not isolate the effect of decoupling search-region expansion from search-distribution update.
5.2. Parameter Estimation for the Escherichia coli Glycolysis Model
For the 15-parameter estimation problem, the proposed method achieved more successful runs than AREX/JGG in three of four initial-range settings. In particular, for [0, 100] and [0, 10,000], AREX/JGG achieved no successful runs, whereas the proposed method succeeded in eight and nine out of 10 runs, respectively. For [0, 5000], where both methods succeeded in all runs, the proposed method had higher ERT. Thus, although the proposed method improved success counts in this case study, it did not reduce evaluation counts for every initial range.
Because success counts also improved for [0, 10,000], which contains all reference values, the effect cannot be explained solely by reaching reference values outside the initial range. Changing the upper bound simultaneously changes the range width, the number of reference parameters outside the range, and their distances from its boundary. These results therefore describe performance for individual initial-range settings rather than separately evaluating the effects of outside-range ratio and normalized outside-range distance.
The success criterion is based on errors between model-predicted and pseudo-observed concentrations. Satisfying it indicates that parameters reproducing the observed concentrations were obtained, but does not imply unique recovery of the reference parameters. Furthermore, the 15 estimation targets were selected from preliminary optimization results rather than quantitative sensitivity or identifiability analysis. Therefore, the possibility that the choice of parameter subset influenced the comparison between methods cannot be excluded. These findings are therefore limited to the estimation problem constructed through that procedure and the initial ranges examined. General conclusions about metabolic-model parameter estimation require tests with other estimation targets and observation conditions.
5.3. Limitations and Future Work
Several limitations remain in this study.
First, the ranges of outside-range ratios and normalized distances evaluated were limited. Experiments varying the outside-range ratio used a normalized distance of 1.0 in outside-range dimensions; experiments varying distance compared three distances at 40 dimensions and an outside-range ratio of 100%. Combinations of ratio, distance, and dimensionality were therefore not evaluated exhaustively. Although two rotated functions were added, the function set remains limited, and comparisons are restricted to RCGA-based methods. Broader problem settings and comparative methods are needed to establish the scope of applicability.
Second, in the benchmark experiments the optimum lay beyond the upper bound of the initial range in outside-range dimensions. Cases where the optimum lies below the lower bound or where outside-range directions differ among dimensions were not examined. Generalization to these conditions requires further evaluation.
Third, the proposed method does not explicitly determine the need for extrapolation during search, and the application periods and settings of e-CS and CM are fixed. The e-CS application period is a practical setting based on preliminary experiments and is not guaranteed to be optimal for all problems. Since individual mechanisms performed better for some functions in the ablation analysis, future work should adjust application periods and offspring counts using indicators such as stagnation, candidate selection counts, and contributions to objective-value improvements.
Fourth, the numerical experiments in this study evaluated the performance of the proposed method and the contributions of its components under the conditions examined; they did not isolate the effect of decoupling search-region expansion from search-distribution updating itself. The comparison with AREX/JGG using different initial expansion rates also does not vary only the presence or absence of decoupling, so performance differences cannot be attributed solely to decoupling. Furthermore, we have not conducted a theoretical analysis of the convergence of the proposed method or the conditions under which a decoupled configuration outperforms other configurations.
Fifth, objective function evaluation counts were used as the primary computational-cost metric, but this metric excludes costs such as candidate generation and survivor selection. For the metabolic model, numerical behavior depending on candidate parameters may also affect runtime. Practical computational efficiency should be assessed under consistent implementations by distinguishing time spent on objective evaluations from other processing costs.
Sixth, the metabolic-model experiment used pseudo-observations generated from the model; performance with observation noise or discrepancies between the model and real data was not examined. Such conditions must be tested to assess applicability to real data.
6. Conclusions
In this study, we addressed optimization problems in which the true global optimum may lie outside the initially specified search range. To handle this outside-range optimization setting, we extended AREX/JGG by introducing search-region expansion as a candidate-generation mechanism separate from search-distribution update. The proposed method combines enhanced Chaotic Search (e-CS) for extrapolative candidate generation, AREX for search-distribution update, and Combinational Mutation (CM) for heavy-tailed perturbations.
Experiments on 10 benchmark functions evaluated search performance while varying the outside-range ratio and normalized outside-range distance. The proposed method had lower ERT than AREX/JGG under many conditions examined. However, improvement was not obtained for some Rosenbrock-star conditions or for 80-dimensional Rosenbrock-chain; relative performance depended on function, dimensionality, and initial-range setting. ERT also did not consistently increase with outside-range ratio or normalized outside-range distance.
The ablation analysis identified functions for which combining e-CS and CM achieved lower ERT than either mechanism alone, as well as functions for which an individual mechanism performed better. Combining additional search mechanisms can therefore be useful for multiple problems, but is not superior for every problem.
For the 15-parameter estimation problem in the Escherichia coli glycolysis model, the proposed method achieved more successful runs than AREX/JGG in three of four initial-range settings. However, the estimation targets were selected through preliminary optimization attempts, and generalizing these results requires evaluation using other parameter subsets and observation conditions.
Overall, the proposed AREX/JGG extension improved search efficiency under many outside-range conditions examined in this study and increased success counts across multiple initial-range settings in the metabolic-model case study. Future work will identify conditions in which each search mechanism is effective and clarify their interactions, while investigating adaptive control based on search progress.
Author Contributions
Conceptualization, Y.K. and Y.T.; methodology, Y.K.; software, Y.K.; validation, Y.K. and Y.T.; formal analysis, Y.K.; investigation, Y.K. and Y.T.; writing—original draft preparation, Y.K.; writing—review and editing, Y.K. and Y.T.; visualization, Y.K.; supervision, Y.T.; project administration, Y.T. All authors have read and agreed to the published version of the manuscript.
Funding
This research received no external funding.
Institutional Review Board Statement
Not applicable.
Informed Consent Statement
Not applicable.
Data Availability Statement
The implementation of the proposed method is publicly available at https://github.com/tohsato-lab/RCGA (accessed on 1 November 2026). The Escherichia coli glycolysis model Chassagnole2002_Carbon_Metabolism is available from BioModels in Systems Biology Markup Language (SBML) format (accession BIOMD0000000051; https://www.biomodels.org/BIOMD0000000051). The 15 optimized parameters and their reference values are listed in Table A5 in Appendix A. Other state variables, reaction-rate equations, initial conditions, and parameter values were taken from the published model.
Conflicts of Interest
The authors declare no conflict of interest.
Abbreviations
The following abbreviations and symbols are used in this manuscript:
| EC | Evolutionary Computation |
| RCGA | Real-Coded Genetic Algorithm |
| AREX | Adaptive Real-coded Ensemble Crossover |
| JGG | Just Generation Gap |
| rout | Outside-range ratio |
| dout | Normalized outside-range distance |
| e-CS | enhanced Chaotic Search |
| CM | Combinational Mutation |
| ODE | Ordinary Differential Equation |
| BLX-α | Blend Crossover |
| UNDX | Unimodal Normal Distribution Crossover |
| SPX | Simplex Crossover |
| REX | Real-coded Ensemble Crossover |
| AER | Adaptation of Expansion Rate |
| HIRCGA | Hybrid Real-Coded Genetic Algorithm |
| SGS | Steady-State Generation Strategy |
| DM | Differential Mutation |
| CMA-ES | Covariance Matrix Adaptation Evolution Strategy |
| LM | Lévy Mutation |
| CaM | Cauchy Mutation |
| CPU | Central Processing Unit |
| ERT | Expected Running Time |
| SD | Standard Deviation |
| RMSE | Root Mean Squared Error |
Appendix A
Table A1.
Comparison of search performance for Ge−CS = 5, 10, 20 in 40 dimensions at an outside-range ratio of 100%. Values are ERTs, with success counts out of 10 runs in parentheses. Boldface indicates the lowest ERT for each function.
Table A2.
Population sizes used for 20-, 40-, and 80-dimensional benchmark functions under outside-range ratios of 0%, 50%, and 100%. For each condition, the population size yielding the smallest average number of generations among settings with at least nine successful runs out of 10 in the preliminary experiments was selected. If different population sizes were selected across outside-range ratios, they are reported separated by slashes. “—” indicates that no candidate population size met this criterion and the main experiment was not performed.
Table A3.
Comparison of the proposed method, AREX/JGG, and HIRCGA for 20- and 80-dimensional benchmark functions at outside-range ratios of 0%, 50%, and 100%. Values are ERTs, with success counts out of 10 runs in parentheses. “—(0)” indicates that all 10 runs failed and a finite ERT could not be estimated; “—” without a success count indicates that the main experiment was not performed because no population size met the preliminary selection criterion. Boldface indicates the lowest ERT under each condition. Paired first-attainment evaluation counts were compared between the proposed method and AREX/JGG using the Wilcoxon signed-rank test only where both methods succeeded in all 10 runs (*: p < 0.01).
Table A4.
Comparison of the proposed method with AREX/JGG using different initial expansion rates α(0) for 40-dimensional Sphere, Rosenbrock-star, and Schaffer. Outside-range ratios of 0% and 100% were used. Adaptive updating was retained for every initial-rate setting, with the lower bound fixed at 1. The standard setting is α(0) = 1.0. Values are ERTs, with success counts out of 10 runs in parentheses. “—” indicates that no run succeeded and a finite ERT could not be estimated. Boldface indicates the lowest ERT under each condition.
Table A5.
The 15 optimized parameters and their reference values in the Escherichia coli glycolysis model used for the parameter-estimation experiments.
Figure A1.
Generation-wise numbers of individuals generated by Lévy mutation (LM) and Cauchy mutation (CaM) that were selected into the next generation. The left column (blue) corresponds to LM, and the right column (red) to CaM. Results are shown for 40-dimensional (A) k-tablet, (B) Rosenbrock-star, (C) Rosenbrock-chain, and (D) Schaffer.
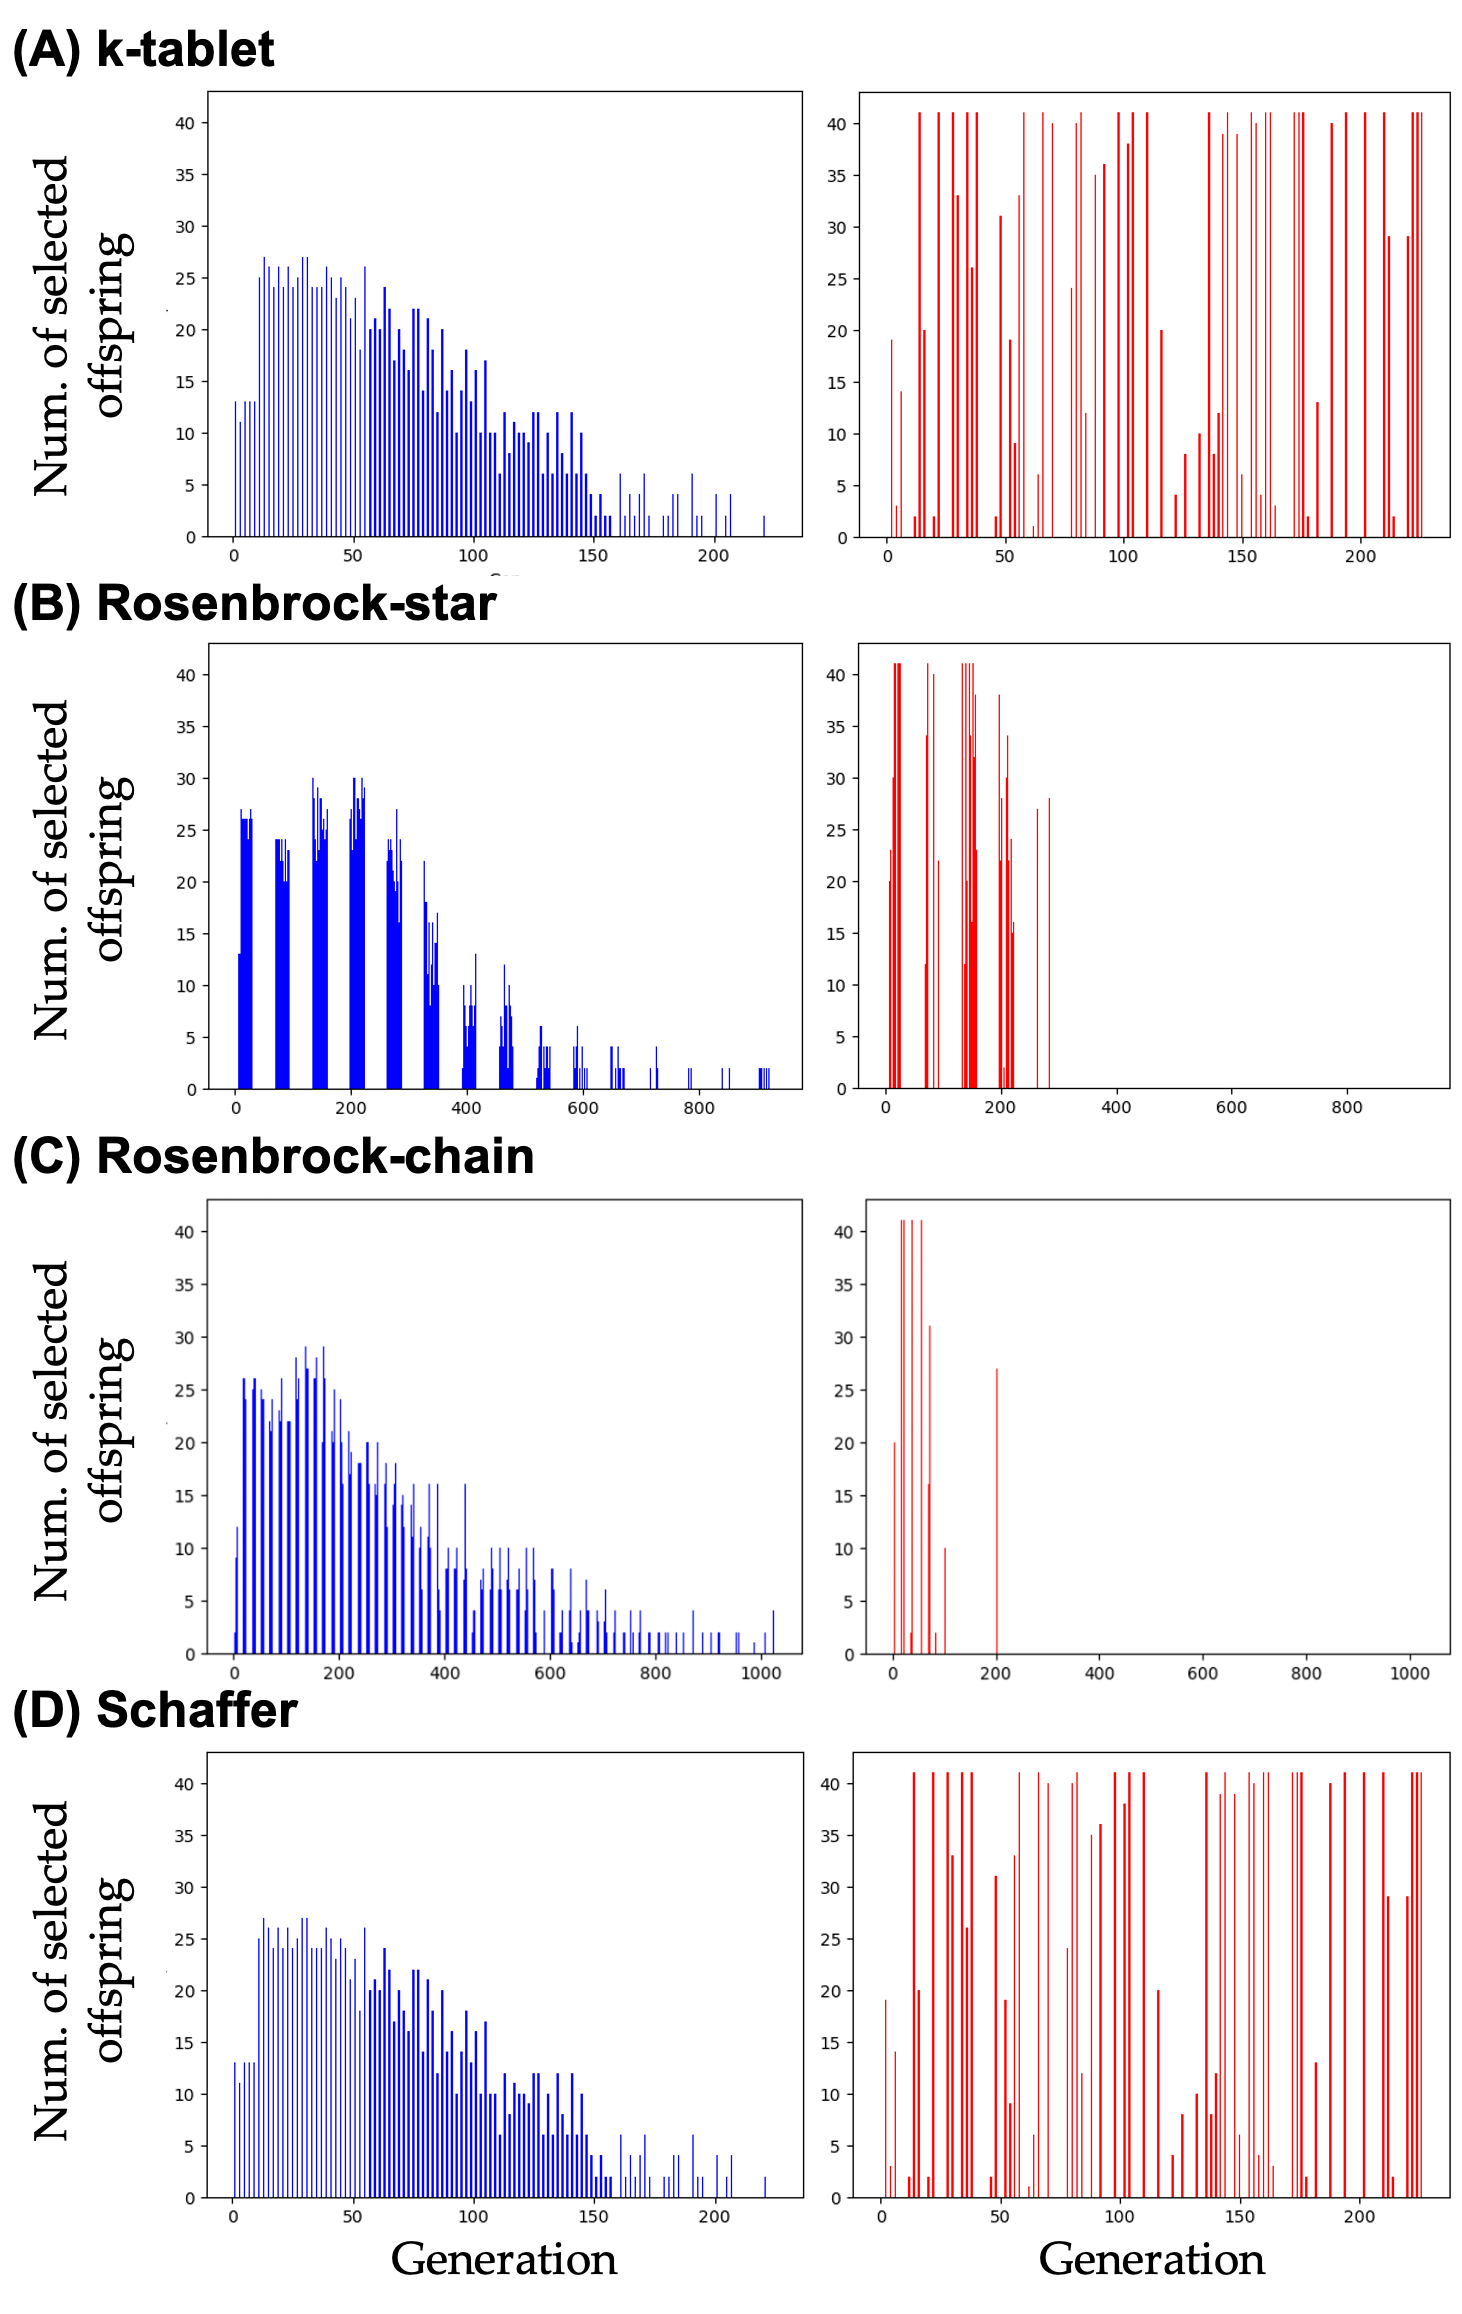
Figure A2.
Simulations of the Escherichia coli glycolysis model using reference parameters published in BioModels. Dots indicate the pseudo-observations used for parameter estimation. Variable names used in Figure A2: cpep, phosphoenolpyruvate; cglcex, extracellular glucose; cg6p, glucose-6-phosphate; cpyr, pyruvate; cf6p, fructose-6-phosphate; cg1p, glucose-1-phosphate; cpg, 6-phosphogluconate; cfdp, fructose-1,6-bisphosphate; csed7p, sedoheptulose-7-phosphate; cgap, glyceraldehyde-3-phosphate; ce4p, erythrose-4-phosphate; cxyl5p, xylulose-5-phosphate; crib5p, ribose-5-phosphate; cdhap, dihydroxyacetone phosphate; cpgp, 1,3-bisphosphoglycerate; cpg3, 3-phosphoglycerate; cpg2, 2-phosphoglycerate; cribu5p, ribulose-5-phosphate.
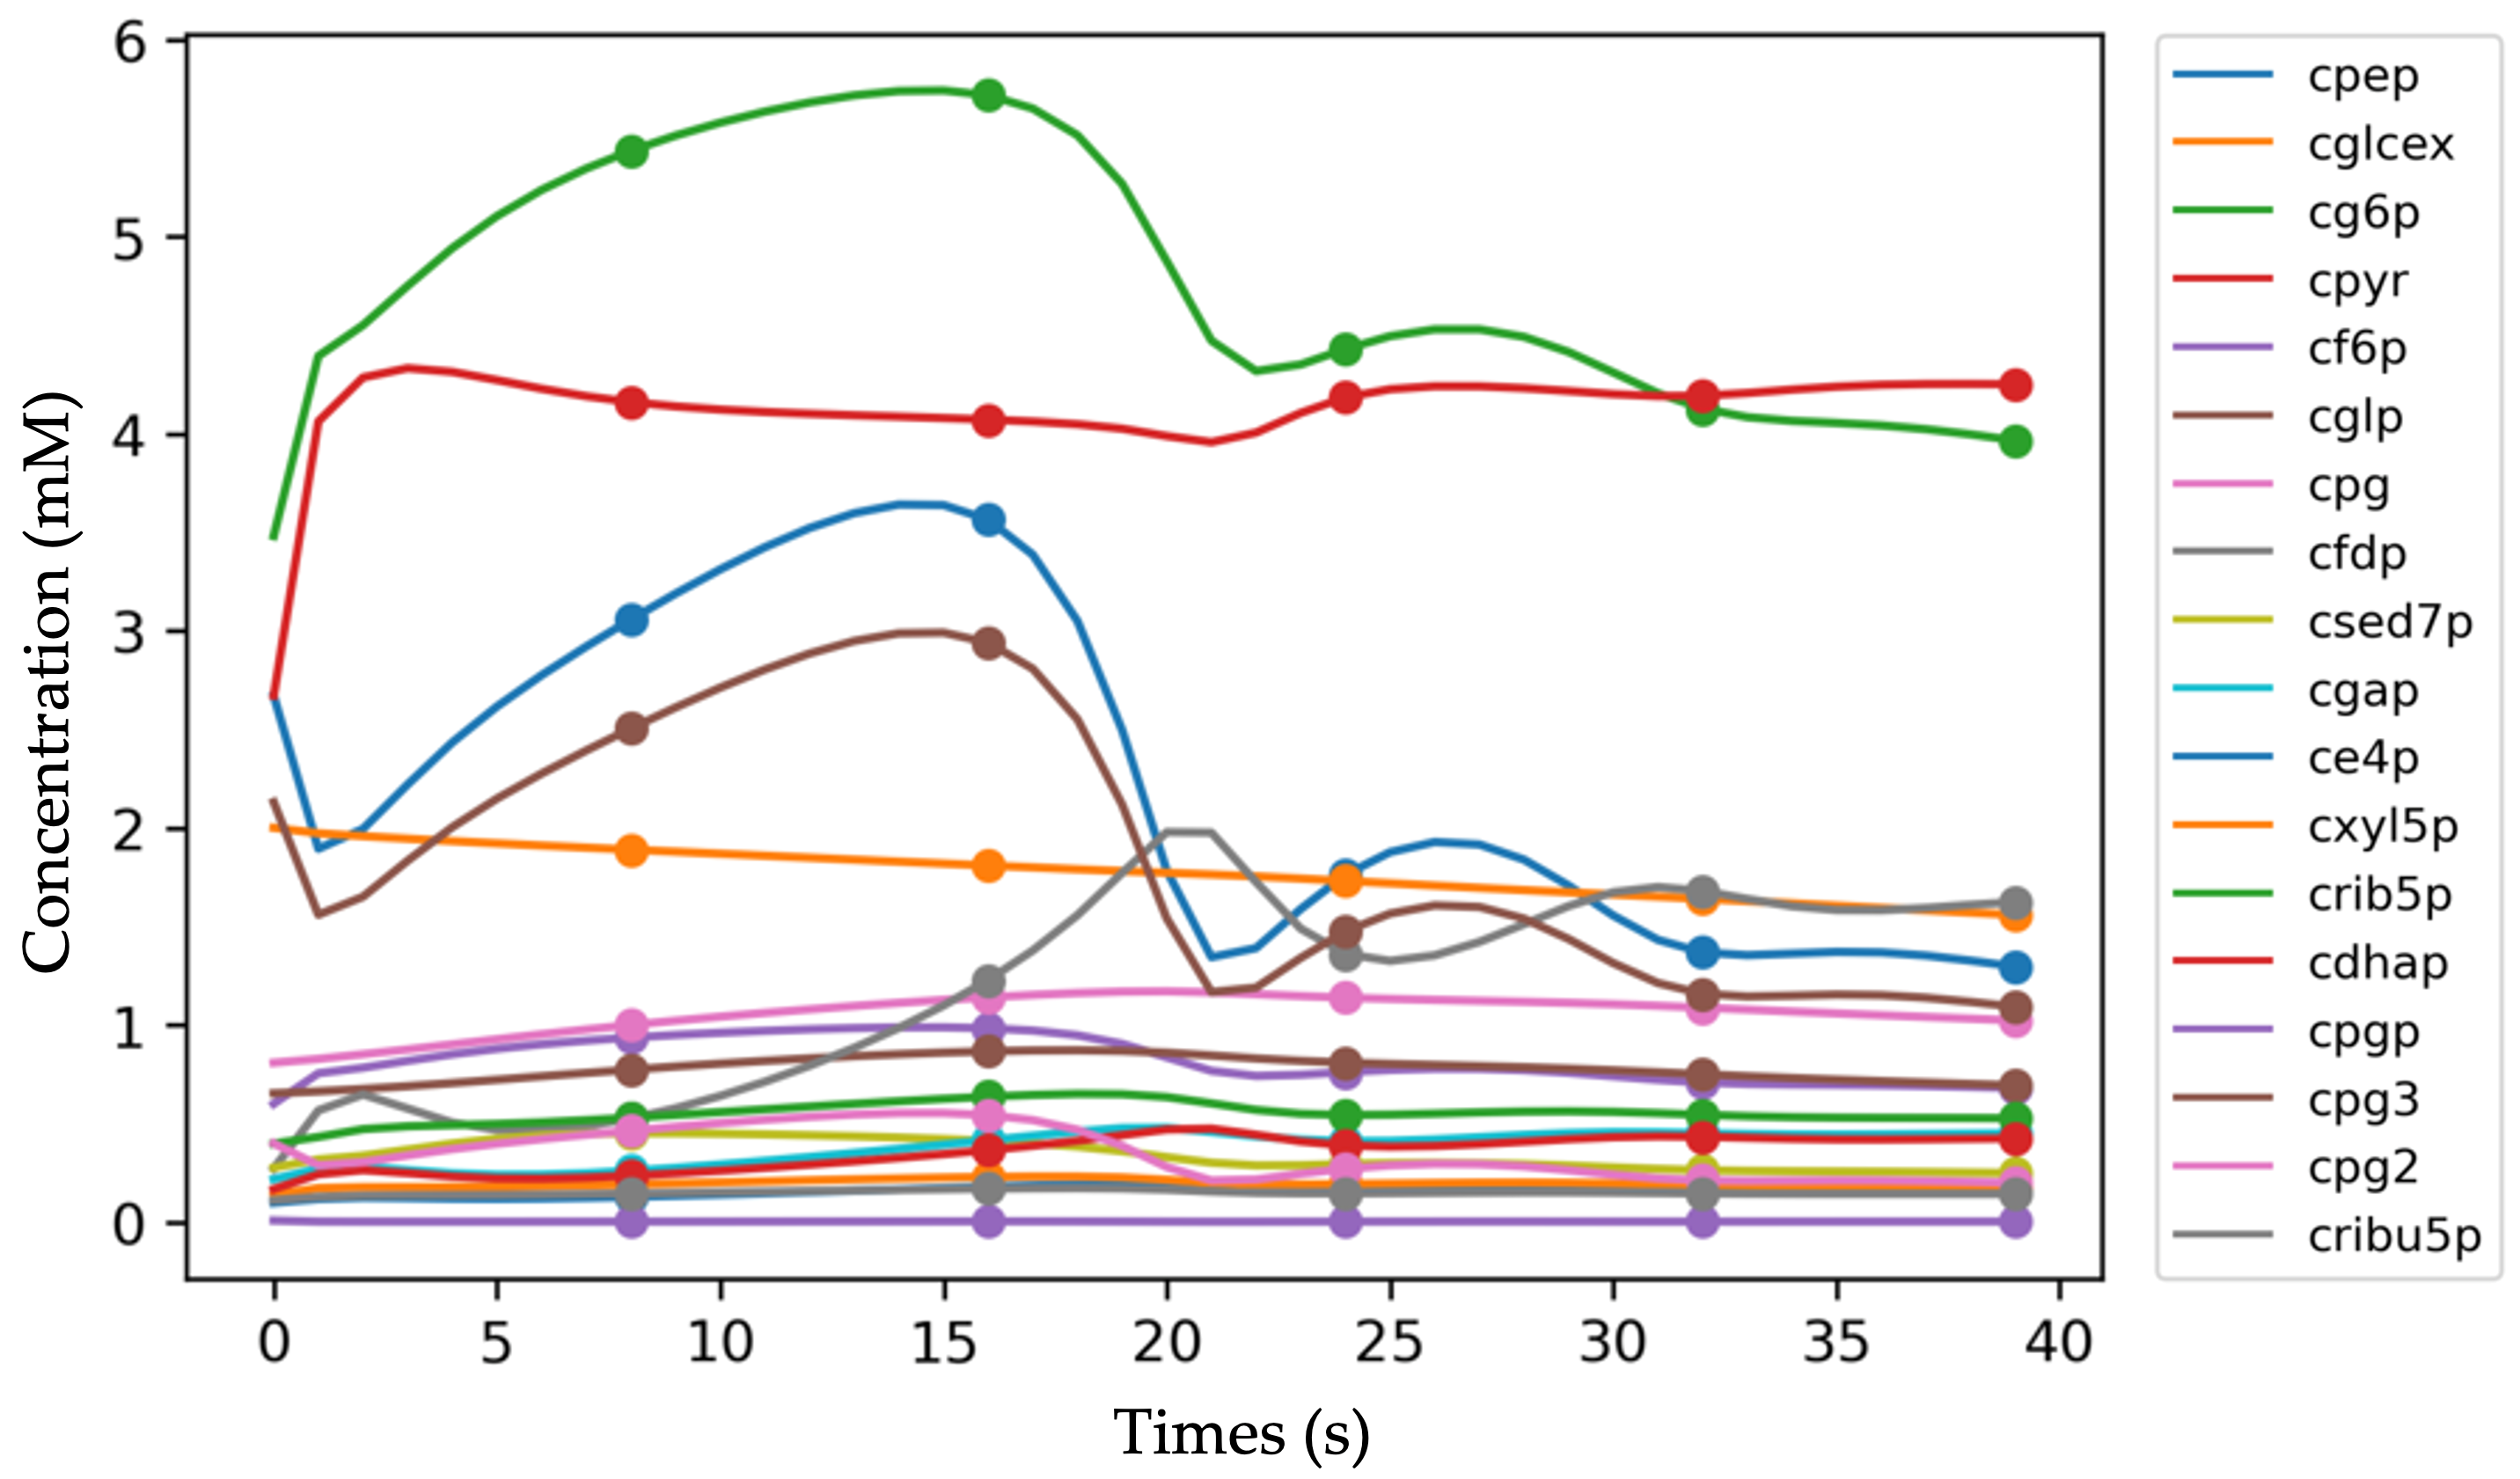
Figure A3.
Example convergence curves for the reduced 15-parameter estimation problem in the E. coli glycolysis model with an initial range of [0, 5000]. The proposed method, AREX/JGG, the e-CS-only variant, and the CM-only variant are compared. Each curve shows best-so-far RMSE against cumulative objective function evaluations in a single run. The horizontal axis is cumulative objective function evaluations and the vertical axis is the lowest RMSE obtained up to that point.
References
- Akimoto, Y.; Nagata, Y.; Sakuma, J.; Ono, I.; Kobayashi, S. Proposal and Evaluation of Adaptive Real-Coded Crossover AREX. J. Jpn. Soc. Artif. Intell. 2009, 24, 446–458. [Google Scholar] [CrossRef] [Scilit]
- Song, H.; Wang, J.; Song, L.; Zhang, H.; Bei, J.; Ni, J.; Ye, B. Improvement and Application of Hybrid Real-Coded Genetic Algorithm. Appl. Intell. 2022, 52, 17410–17448. [Google Scholar] [CrossRef] [Scilit]
- Saraçoğlu, R.; Kazankaya, A.F. Developing an Adaptation Process for Real-Coded Genetic Algorithms. Int. J. Comput. Syst. Sci. Eng. 2020, 35, 13–19. [Google Scholar] [CrossRef] [Scilit]
- Harifi, S.; Mohamaddoust, R.; Mutation, Z. A New Mutation Operator to Improve the Genetic Algorithm. Multimed. Tools Appl. 2023, 82, 45411–45432. [Google Scholar] [CrossRef] [Scilit]
- Akopov, A.S.; Beklaryan, L.A. Traffic Improvement in Manhattan Road Networks with the Use of Parallel Hybrid Biobjective Genetic Algorithm. IEEE Access 2024, 12, 19532–19552. [Google Scholar] [CrossRef] [Scilit]
- Eshelman, L.J.; Schaffer, J.D. Real-Coded Algorithms and Interval-Schemata. In Foundations of Genetic Algorithms 2; Morgan Kaufmann: San Mateo, CA, USA, 1993; pp. 187–202. [Google Scholar]
- Ono, I.; Kobayashi, S. A Real-Coded Genetic Algorithms for Function Optimization Using Unimodal Normal Distribution Crossover. In Proceedings of the 7th International Conference on Genetic Algorithms, East Lansing, MI, USA, 19–23 July 1997; pp. 246–253. [Google Scholar]
- Tsutsui, S.; Yamamura, M.; Higuchi, T. Multi-Parent Recombination with Simplex Crossover in Real Coded Genetic Algorithms. In Proceedings of the Genetic and Evolutionary Computation Conference (GECCO-1999), Orlando, FL, USA, 13–17 July 1999; pp. 657–664. [Google Scholar]
- Kita, H.; Ono, I.; Kobayashi, S. Multi-Parental Extension of the Unimodal Normal Distribution Crossover for Real-Coded Genetic Algorithms. In Proceedings of the 1999 Congress on Evolutionary Computation (CEC 1999), Washington, DC, USA, 6–9 July 1999; pp. 1581–1588. [Google Scholar]
- Akimoto, Y.; Sakuma, J.; Ono, I.; Kobayashi, S. Adaptation of Expansion Rate for Real-Coded Crossovers. In Proceedings of the Genetic and Evolutionary Computation Conference (GECCO 2009), Montreal, QC, Canada, 8–12 July 2009; pp. 739–746. [Google Scholar]
- Kobayashi, S. The Frontiers of Real-Coded Genetic Algorithms. Trans. Jpn. Soc. Artif. Intell. 2009, 24, 147–162. [Google Scholar] [CrossRef] [Scilit]
- Maeda, K.; Boogerd, F.C.; Kurata, H. RCGAToolbox: A Real-Coded Genetic Algorithm Software for Parameter Estimation of Kinetic Models. IPSJ Trans. Bioinform. 2021, 14, 30–35. [Google Scholar] [CrossRef] [Scilit]
- Maeda, K.; Hatae, A.; Sakai, Y.; Boogerd, F.C.; Kurata, H. MLAGO: Machine Learning-Aided Global Optimization for Michaelis Constant Estimation of Kinetic Modeling. BMC Bioinform. 2022, 23, 455. [Google Scholar] [CrossRef] [Scilit] [PubMed]
- Ostermeier, A.; Gawelczyk, A.; Hansen, N. Step-Size Adaptation Based on Non-Local Use of Selection Information. In Parallel Problem Solving from Nature III (PPSN III); Lecture Notes in Computer Science; Springer: Berlin/Heidelberg, Germany, 1994; Volume 866, pp. 189–198. [Google Scholar]
- Hansen, N.; Ostermeier, A. Completely Derandomized Self-Adaptation in Evolution Strategies. Evol. Comput. 2001, 9, 159–195. [Google Scholar] [CrossRef] [Scilit] [PubMed]
- Komori, A.; Maki, Y.; Nakatsui, M.; Ono, I.; Okamoto, M. Efficient Numerical Optimization Algorithm Based on New Real-Coded Genetic Algorithm, AREX + JGG, and Application to the Inverse Problem in Systems Biology. Appl. Math. 2021, 3, 1463–1470. [Google Scholar]
- Nakajima, N.; Nagata, Y.; Ono, I. A Real-Coded Genetic Algorithm Taking Account of the Weighted Mean of the Population. In Proceedings of the International Symposium on Artificial Life and Robotics (AROB2013), Beppu, Japan, 16–18 January 2013; pp. 325–328. [Google Scholar]
- Garcia, J.C.S.; Tanaka, H.; Giannetti, N.; Sei, Y.; Saito, K.; Houfuku, M.; Takafuji, R. Multiobjective Geometry Optimization of Microchannel Heat Exchanger Using Real-Coded Genetic Algorithm. Appl. Therm. Eng. 2022, 202, 117801. [Google Scholar] [CrossRef] [Scilit]
- Akimoto, Y.; Sakuma, J.; Ono, I.; Kobayashi, S. Functionally Specialized CMA-ES: A Modification of CMA-ES Based on the Specialization of the Functions of Covariance Matrix Adaptation and Step Size Adaptation. In Proceedings of the 10th Annual Conference on Genetic and Evolutionary Computation (GECCO 2008), Atlanta, GA, USA, 12–16 July 2008; pp. 479–486. [Google Scholar]
- Liang, J.J.; Qu, B.Y.; Suganthan, P.N. Problem Definitions and Evaluation Criteria for the CEC 2014 Special Session and Competition on Single Objective Real-Parameter Numerical Optimization; Technical Report 201311; Computational Intelligence Laboratory, Zhengzhou University: Zhengzhou, China; Nanyang Technological University: Singapore, 2013. [Google Scholar]
- Chassagnole, C.; Noisommit-Rizzi, N.; Schmid, J.W.; Mauch, K.; Reuss, M. Dynamic Modeling of the Central Carbon Metabolism of Escherichia coli. Biotechnol. Bioeng. 2002, 79, 53–73. [Google Scholar] [CrossRef] [Scilit] [PubMed]

Disclaimer/Publisher’s Note: The statements, opinions and data contained in all publications are solely those of the individual author(s) and contributor(s) and not of MDPI and/or the editor(s). MDPI and/or the editor(s) disclaim responsibility for any injury to people or property resulting from any ideas, methods, instructions or products referred to in the content. |
© 2026 by the authors. Licensee MDPI, Basel, Switzerland. This article is an open access article distributed under the terms and conditions of the Creative Commons Attribution (CC BY) license.