


Abstract
A hybrid infrared (IR)–heat pump (HP) drying system was investigated for vertically suspended kelp under four operating conditions, including infrared drying alone (IR) and three heat pump-assisted drying conditions with low (IR–HP-L), medium (IR–HP-M), and high (IR–HP-H) dehumidification intensities. The effects of heat pump operation on drying kinetics, energy performance, and product quality were evaluated under a fixed nominal infrared power density and airflow condition. The results showed that heat pump integration effectively reduced the humidity of the circulating air and accelerated moisture removal without substantially altering the drying temperature. The drying time decreased from 6.00 h for IR to 5.25, 4.65, and 4.40 h for IR–HP-L, IR–HP-M, and IR–HP-H, respectively. However, the improvement obtained by increasing the heat pump intensity from medium to high was limited compared with the additional compressor energy input. The specific energy consumption (SEC) decreased from 7.46 kWh kg−1 water for IR to 5.82 kWh kg−1 water for IR–HP-M, whereas it increased to 6.05 kWh kg−1 water under IR–HP-H. Thin-layer drying models showed good agreement with the experimental moisture-ratio profiles, and model evaluation indicated that fitting accuracy should be considered together with model complexity. Quality evaluation showed that IR–HP-M provided favorable mean values for color retention, rehydration performance, moisture uniformity, and mechanical characteristics, although the statistical significance of individual quality indicators should be interpreted based on batch-level variability. A comprehensive performance evaluation incorporating drying efficiency, energy utilization, and quality characteristics identified IR–HP-M as a favorable compromise under the tested conditions. Sensitivity analysis further indicated that the preferred operating condition depended on the weighting scheme and normalization method. These results provide experimental evidence for selecting appropriate heat pump dehumidification intensity in infrared-assisted drying of high-moisture sheet-like marine biomass.
1. Introduction
Kelp is a typical type of large, sheet-like marine biomass with high moisture content. After harvest, its tissue contains a high moisture content; if it is not promptly dehydrated, it is prone to tissue softening, microbial proliferation, and quality deterioration. Therefore, drying is a critical unit operation in the storage, transportation, and subsequent processing of kelp. Compared to granular agricultural products or fruits and vegetables with regular geometric shapes, kelp is characterized by soft tissue, uneven thickness distribution, a slippery surface, and a tendency to shrink and curl during drying. Its dehydration process is influenced by multiple factors, including external heat input, surface moisture evaporation, internal moisture migration, and changes in ambient humidity. Traditional natural sun-drying requires low equipment investment and is simple to operate; however, it is highly dependent on ambient temperature, relative humidity, solar radiation, and natural wind speed, leading to issues such as long drying cycles, poor process controllability, and significant fluctuations in batch quality [1,2,3,4]. Although conventional hot-air drying improves the controllability of temperature and time, heat is primarily transferred through air convection. When airflow within the drying chamber is uneven or moist air cannot be exhausted in a timely manner, localized areas of high humidity can easily form, increasing external mass transfer resistance. This results in reduced drying rates, increased energy consumption, and the coexistence of localized over-drying and residual moisture. Consequently, existing research has gradually shifted from simply shortening drying time to a comprehensive approach that simultaneously addresses drying efficiency, energy consumption, spatial uniformity, and product quality [5]. This shift is particularly important for high-moisture marine biomass, where rapid dehydration must be balanced with energy efficiency and preservation of structural characteristics. Infrared drying, which delivers energy directly to the material’s surface and near-surface regions via radiation, features rapid temperature response, short heat transfer paths, and easily adjustable heat input intensity. In recent years, it has been widely applied in the enhanced dehydration of food, agricultural products, and aquatic products. For high-moisture-content sheet-like kelp, infrared radiation can rapidly increase the surface temperature of the material, enhancing the thermodynamic driving force for surface moisture evaporation; at the same time, an appropriate forced airflow can reduce the thickness of the surface boundary layer and promote the migration of water vapor into the ambient air, thereby creating a synergistic effect between radiative heating and convective mass transfer. Previous studies on suspended infrared kelp drying have shown that when the infrared power density is 1.2 kW·m−2 and the air flow velocity is 3.0 m·s−1, the temperature in the drying zone can be maintained at approximately 55–62 °C, and the relative humidity can be reduced from about 80% to 20–30%. The Page model fit achieved a coefficient of determination of 0.987, while also yielding high rehydration performance and keeping the composite color difference at a low level. Previous studies have demonstrated that infrared-assisted drying can improve dehydration efficiency of kelp and other high-moisture biological materials by providing rapid surface heating and reducing heat-transfer limitations [6]. However, infrared radiation primarily enhances the heat input process and cannot, on its own, resolve the issue of removing the large amounts of water vapor generated by continuous evaporation [7]. The spatial distribution of the infrared array, localized air recirculation, and low-velocity zones may also cause inconsistencies in radiant heat flux and the capacity to remove moist air, increasing the risk of localized overheating and uneven drying. Therefore, infrared drying performance does not depend solely on an increase in radiant power, but rather on the coordination among heat input, water vapor removal, internal moisture migration, and quality preservation.
From the perspective of heat and mass transfer mechanisms, the rate-limiting steps in the kelp drying process exhibit distinct phases. In the initial stage, a large amount of free water is present on the material’s surface; at this point, heat input and surface evaporation capacity have a significant impact on the overall drying rate. As surface moisture gradually decreases, the migration of internal moisture toward the surface and the timely removal of water vapor from around the material become increasingly important. If water vapor generated by evaporation continues to accumulate near the material’s surface, the resulting increase in local air relative humidity will reduce the partial pressure difference of water vapor between the material surface and the drying medium, thereby weakening the external mass transfer driving force [8,9,10,11,12]. Under these conditions, simply increasing infrared power may further raise the surface temperature of the kelp but will not result in a corresponding increase in dehydration rate proportional to the increased heat input; instead, it may increase the risk of color deterioration, tissue hardening, and localized thermal damage. Existing research indicates that effective control of kelp drying should simultaneously consider the radiation field, airflow, moisture migration, and material structural response, rather than relying on a single process parameter. Therefore, further reducing the humidity of the drying medium while maintaining a sustained moisture transfer driving force—in addition to rapid infrared heating—is a key approach to improving the efficiency of infrared kelp drying. Heat pump drying uses a refrigeration cycle to condense and dehumidify moist air, while recovering some of the latent heat released during the condensation of water vapor [9,10]. This enables continuous dehumidification and heat reuse under relatively mild temperature conditions. Compared to simply raising the drying temperature, the core advantage of a heat pump system lies in reducing air humidity and enhancing moisture removal; therefore, it is particularly suitable for foods and seafood that are sensitive to color, texture, and rehydration performance. Existing research has shown that heat pump drying can maintain stable humidity control within a lower temperature range, which helps reduce quality losses caused by prolonged exposure to high temperatures; however, when operating independently, a heat pump’s heating rate and its ability to rapidly dehydrate materials with high moisture content in the early stages may be limited, while the compressor, fan, and refrigeration circuit introduce additional energy consumption [11,12,13,14,15]. Therefore, combining infrared heating with heat pump dehumidification may provide complementary advantages by coupling rapid heat input with continuous control of drying-air humidity. Nevertheless, the appropriate heat pump operating intensity remains unclear because higher dehumidification capacity can simultaneously increase compressor energy consumption while providing diminishing improvements in moisture removal [16,17,18].
However, combined infrared–heat pump drying does not mean that higher dehumidification intensity necessarily results in better overall performance. Although increasing the heat pump’s operating intensity can reduce the relative humidity of the drying medium, enhance external mass transfer, and potentially shorten drying time, it also increases the compressor’s operating power and the energy consumption of auxiliary equipment [19,20,21,22]. Therefore, there may be a nonlinear trade-off between reduced drying time and additional energy input. Excessive moisture removal may also alter the moisture gradient between the material’s surface and interior, causing the surface to dehydrate too rapidly and thereby affecting its tissue structure, color, and subsequent rehydration capacity [23,24,25]. Consequently, the evaluation of combined drying systems should not rely solely on drying time or final moisture content as a single indicator, but should also consider moisture decay kinetics, energy consumption per unit of moisture removed, energy utilization efficiency, and product quality. Existing studies on kelp drying have mainly focused on infrared power, airflow characteristics, heat transfer behavior, and product quality changes under individual drying technologies. However, systematic evaluation of infrared-assisted heat pump drying considering drying kinetics, actual electricity consumption, and quality retention remains limited. In particular, the relationship between heat pump dehumidification intensity and the trade-off among drying acceleration, energy consumption, and product quality requires further clarification.
In addition, previous studies generally evaluate drying performance based on individual indicators, such as drying time or energy consumption, while comprehensive assessments involving multiple performance dimensions remain relatively scarce. Therefore, a systematic investigation of different heat pump operating intensities is necessary to determine whether increasing dehumidification capacity can provide proportional improvements in overall drying performance.
Based on the above issues, this study introduced a heat pump dehumidification unit into the previously developed suspended infrared kelp drying platform to construct a combined infrared–heat pump drying system, with a focus on investigating the effects of heat pump-assisted dehumidification intensity on the kelp dehydration process, energy utilization, and product quality. To avoid additional interference from variations in infrared power and airflow velocity on the analysis of the combined mechanism, this study fixed the infrared power density and airflow velocity at 1.2 kW·m−2 and 3.0 m·s−1, respectively. Single-infrared drying was used as the reference condition, and comparative experiments were conducted with different heat pump dehumidification intensities. Specific research objectives include: (1) analyzing the dynamic characteristics of chamber temperature, relative humidity, moisture content, and drying rate under different combined drying conditions to elucidate the impact of active dehumidification on the moisture migration process in kelp; (2) applying typical thin-layer drying models—such as those proposed by Lewis, Henderson–Pabis, Page, and Midilli—to describe the drying kinetics under different operating conditions, and comparing model parameters and fitting performance; (3) calculating the specific energy consumption (SEC) and specific moisture extraction rate (SMER) based on the system’s actual electricity consumption to evaluate energy efficiency under different dehumidification intensities; (4) analyzing the impact of combined drying on product quality through a comprehensive assessment of color difference and rehydration rate, and further discussing the trade-offs among drying rate, energy consumption, and quality retention. This study aims to elucidate the synergistic mechanisms between rapid infrared heating and heat pump-based low-humidity air control, and to determine an optimal operating range that balances dehydration efficiency, energy utilization, and quality retention, thereby providing experimental evidence for the design of combined drying processes and energy-efficient operation of high-moisture-content flake seafood products [26,27,28,29].
2. Materials and Methods
2.1. Raw Materials and Sample Preparation
Fresh kelp (Saccharina japonica) was selected as the raw material for drying in this experiment; the samples were collected from local kelp farming areas in Dalian, Liaoning Province. To minimize the impact of individual variations in the raw material on the drying results, kelp specimens with intact appearance, no obvious mechanical damage, no signs of spoilage or localized browning, and relatively uniform leaf thickness were selected as test samples. Upon arrival at the laboratory, the fresh kelp was immediately rinsed with clean water to remove surface salt, silt, and other impurities. It was then placed on a stainless steel mesh screen to drain naturally for approximately 15 min, after which residual free water on the surface was gently blotted with absorbent paper. Throughout the pretreatment process, the kelp tissue was not squeezed to avoid damage to the cellular structure and to prevent initial moisture loss from affecting subsequent drying kinetics. Given that natural kelp leaves vary in length, width, and thickness, this study cut samples of similar dimensions from the central region of each leaf. The length of each sample was controlled at 300 ± 5 mm, the width at 80 ± 3 mm, and the average thickness at 2.6 ± 0.3 mm [30,31,32]. The initial mass of each sample was controlled at 118 ± 6 g to ensure comparability of initial loading conditions under different operating conditions. After pretreatment, the samples were randomly assigned to different drying conditions and secured to drying rods using the same method as in the previous study involving a suspended infrared drying system, ensuring that the kelp surfaces were fully exposed to infrared radiation and circulating air. Since previous studies had already employed the suspended method for infrared drying of kelp and described the dehydration process under different conditions using the moisture ratio, this study continued to use the same material arrangement to minimize additional effects caused by variations in loading configurations [33].
The initial moisture content of fresh kelp was determined using the oven-drying method until constant weight. Five representative samples were randomly selected; approximately 10.0 ± 0.2 g was taken from each sample and placed in a constant-temperature drying oven at 105 ± 2 °C until the mass change between two consecutive weighings was less than 0.01 g. The initial moisture content was calculated on a wet basis, with an average value of 80.2 ± 1.1%; the corresponding dry-basis moisture content was approximately 4.05 ± 0.28 kg water/kg dry matter. This value is close to the initial dry-basis moisture content M0 = 4.0 kg water/kg dry matter used in previous suspended infrared drying studies; therefore, it can be concluded that the raw materials used in this study exhibit good continuity with previous experiments in terms of initial moisture content. Additionally, to minimize moisture migration and tissue changes caused by storage time, all samples were used for the formal drying experiment within 24 h after pretreatment was completed [33,34,35,36]. Prior to the experiment, if samples required short-term storage, they were sealed and kept at 4 ± 1 °C; before the experiment began, they were equilibrated at room temperature for approximately 30 min to restore the initial sample temperature to 23 ± 1 °C. All drying conditions utilized raw materials from the same batch or adjacent batches, which were randomly grouped to minimize the impact of batch-to-batch variations on the experimental results. Each drying condition was tested in three independent experimental batches. The independent batch, rather than an individual kelp piece, longitudinal sampling position, or repeated instrument reading, was the experimental unit. Measurements were summarized within each batch before treatment-level analysis. Treatment means and standard deviations were used for presentation and did not replace the independent observations required for statistical inference [37,38,39].
2.2. Infrared–Heat Pump Combined Drying System
Building upon the previously developed suspended infrared kelp drying platform, this study incorporated a heat pump dehumidification and air reheating unit to construct a closed-loop infrared–heat pump combined drying system. The overall laboratory arrangement of the system is shown in Figure 1. The drying chamber was located in the main section of the system, where kelp samples were vertically suspended and infrared heating modules were installed above the samples to provide radiant heating. A circulation fan and air duct system were arranged between the drying chamber and the heat pump air-handling unit to maintain continuous air circulation.
Figure 1.
Visualization of the laboratory arrangement of the hybrid infrared–heat pump drying system for suspended kelp.
As illustrated in Figure 2, the combined drying system mainly consisted of a drying chamber, infrared heating modules, a circulation fan, a heat pump dehumidification unit, a condensate collection device, temperature and humidity sensors, a data acquisition and control module, and independent electrical energy monitoring channels. Unlike standalone infrared drying, humid air leaving the drying chamber was circulated through the heat pump unit rather than directly discharged. The air first passed through the evaporator for cooling and condensation dehumidification, followed by reheating through the condenser before returning to the drying chamber. During operation, moisture evaporated from the kelp surface entered the circulating air. When the humid air passed through the evaporator, part of the water vapor condensed and was collected through the condensate drainage system. The dehumidified air was subsequently reheated by the condenser and returned to the drying chamber, forming a closed-loop circulation process of “drying chamber–evaporator dehumidification–condenser reheating–drying chamber”. The heat pump unit employed a vapor-compression refrigeration cycle consisting of a compressor, condenser, expansion valve, and evaporator. The refrigerant absorbed heat from the circulating air in the evaporator and released heat through the condenser after compression. The refrigerant circulated continuously within the heat pump loop and did not directly contact the drying air or kelp samples. In Figure 2, the red and blue arrows represent the refrigerant flow paths on the high-pressure hot side and low-pressure cold side, respectively, while the light blue and orange arrows indicate the circulation directions of the high-humidity air and the reheated low-humidity air, respectively.
Figure 2.
Schematic diagram of the hybrid infrared–heat pump drying system for suspended kelp, including the air circulation, refrigerant loop, condensate collection, sensing, control, and energy-monitoring units.
In this study, the rated cooling capacity of the heat pump unit was 2.8 kW, the rated input power of the compressor is 1.10 kW, and the rated air flow rate of the air handling circuit is approximately 600 m3·h−1. During steady-state operation, the evaporator surface temperature is maintained at approximately 8–12 °C to ensure effective condensation and dehumidification of the circulating air as it passes through the heat exchanger. After being reheated by the condenser, the air exits at a temperature of approximately 42–48 °C. It should be noted that the primary function of the heat pump in this system is not to replace the infrared module as the main heat source, but rather to regulate the state of the drying medium through active dehumidification and condensation heat recovery [40,41,42]. The main heat input to the kelp surface still comes from infrared radiation. This laboratory-scale infrared-heat pump hybrid drying system was assembled in-house. The system consists of a custom-built infrared heating module, a heat pump dehumidifier and air reheater with a rated cooling capacity of 2.8 kW and a compressor rated input power of 1.10 kW, and a variable-speed circulation fan. The nominal airflow rate is approximately 600 m3·h−1. Air temperature and relative humidity were monitored using a KZWS/B temperature and humidity transmitter (Kunlun Zhongda, Beijing, China). Sample mass was monitored using a 5 kg PPM225-LS1-1 Type S load cell (Shenghongchuang, Xi’an, China). Condensate mass and sample mass were measured using a JA5002 electronic balance (Shanghai Puchun, Shanghai, China; maximum capacity 5000 g; resolution 0.01 g). The power consumption of the infrared heating module, heat pump compressor, and circulation fan was monitored separately using independent ADL200 single-phase electricity meters (Acrel, Shanghai, China). Measurement signals were acquired via the USB3131 data acquisition module (ART Technology Development Co., Ltd., Beijing, China). Finally, data analysis was performed using MATLAB 2025b. Furthermore, to investigate the effects of different dehumidification levels on kelp drying behavior, the heat pump system was configured with three operating intensities: low, medium, and high. These three levels correspond to approximately 40%, 70%, and 100% of the rated operating capacity, respectively, while the average compressor input power was 0.48 ± 0.03, 0.77 ± 0.04, and 1.08 ± 0.05 kW. The corresponding average condensation dehumidification capacities are approximately 0.31, 0.52, and 0.65 kg·h−1, respectively. When using standalone infrared drying as the control group, the heat pump compressor and refrigeration cycle were shut off, but the circulation fan and infrared module were maintained at the same baseline parameters to minimize interference from variations in airflow conditions during comparisons of different operating conditions. The infrared heating side employed an effective operating power density of 1.2 kW·m−2, and the characteristic air velocity in the drying zone was controlled at 3.0 ± 0.1 m·s−1. The infrared modules operated in adjustable-power mode; when the average temperature in the drying chamber approached the set upper limit, the output power was reduced to prevent the material surface from remaining at excessively high temperatures. Based on previous infrared drying experiments on kelp, this study set 55–62 °C as the primary operating temperature range and 65 °C as the upper limit for overheating control. A common nominal infrared power-density setting, temperature-feedback control rule, and airflow target were maintained across treatments. Actual infrared power could vary in response to temperature feedback and was accounted for using the measured electrical-energy records. The comparison therefore evaluates the assigned operating conditions rather than an isolated humidity effect [43,44,45,46,47].
To monitor changes in air conditions throughout the integrated system, multiple temperature and humidity measurement points have been installed inside the drying chamber and in the heat pump’s air circuit. Temperature and humidity sensors are installed at the top and bottom of the drying chamber to characterize the environmental conditions in the material zone; separate measurement points are installed at the drying chamber outlet, evaporator inlet, evaporator outlet, and condenser outlet to record changes in temperature and humidity before the humid air enters the heat pump, after condensation dehumidification, and after reheating. The measurement accuracy of the temperature sensors is tentatively set at ±0.3 °C, while that of the relative humidity sensors is ±2% RH; the data sampling interval is 1 min [48,49,50]. All measurement signals are transmitted to the data acquisition and control module to enable continuous recording of air conditions during different drying stages. Condensate generated by the evaporator is collected via a dedicated pipeline, and the cumulative mass of condensate is recorded using an electronic scale with a weighing accuracy of ±1 g. The mass of condensate is recorded every 30 min to characterize the actual air dehumidification capacity at different heat pump intensities. This data is also compared with the mass loss of the kelp samples to assist in determining the response relationship between moisture removal from the material and condensation-based dehumidification on the air side. Energy consumption is recorded using a sub-metering approach. The infrared heating module, heat pump compressor, and circulation fan are each connected to independent power monitoring channels, and real-time power consumption and cumulative electricity consumption are simultaneously recorded via the data acquisition system [51]. Energy consumption for infrared heating is denoted as E_IR, energy consumption for the heat pump system as E_HP, energy consumption for the circulation fan as E_fan, and energy consumption for control and data acquisition equipment as E_aux. The system’s total energy consumption is calculated by summing the actual electricity consumption of each component and is subsequently used to calculate the energy consumption per unit of moisture removed and the moisture removal rate per unit of energy consumed. Compared to recording only the total power, sub-metering allows for a more precise identification of the relationship between the additional energy consumption of the heat pump and the reduction in drying time during the combined drying process [52,53,54,55,56,57,58].
Overall, the system separates infrared radiation heating and heat pump-based air conditioning into two relatively independent functional components [59]. The infrared module primarily provides rapid heat input, while the heat pump reduces air humidity through the evaporation and condensation process and reheats the air by recovering heat from the condenser. By adjusting the heat pump’s operating intensity while keeping the infrared power and main airflow conditions essentially constant, it is possible to more directly analyze the impact of air dehumidification levels on kelp moisture migration, drying time, energy consumption, and final product quality.
2.3. Experimental Design and Operating Conditions
A single-factor experimental design was employed to investigate the influence of heat pump dehumidification intensity on the drying performance of kelp. Four categorical operating conditions were compared: standalone infrared drying (IR) and three hybrid infrared–heat pump conditions with low, medium, and high heat pump operating levels (IR–HP-L, IR–HP-M, and IR–HP-H). The nominal infrared power density, target airflow velocity, loading configuration, and initial sample preparation procedure were maintained consistently among all treatments. Only the heat pump operating intensity was varied. The infrared power density was set at 1.2 kW·m−2, and the airflow velocity in the drying zone was maintained at 3.0 ± 0.1 m·s−1, based on previous suspended infrared kelp drying studies.
The IR condition was used as the reference treatment, with the heat pump refrigeration cycle switched off while the infrared module and circulation fan operated under the same baseline conditions. The IR–HP-L, IR–HP-M, and IR–HP-H conditions corresponded to low, medium, and high heat pump operating intensities, respectively, representing approximately 40%, 70%, and 100% of the rated compressor capacity. The corresponding operating parameters are summarized in Table 1. Each experimental batch consisted of approximately 30 kelp samples with a total initial loading mass of 3.50 ± 0.12 kg. All samples were arranged using the same vertical suspension configuration. Each operating condition was conducted in three independent experimental batches, resulting in a total of 12 drying experiments.
Table 1.
Experimental conditions used for infrared and hybrid infrared–heat pump drying of kelp.
Each experimental batch consisted of approximately 30 pieces of kelp with similar dimensions and initial mass, with the total initial loading mass controlled at 3.50 ± 0.12 kg. All samples were arranged using the same vertical suspension method, maintaining a fixed suspension position and material orientation to minimize variations in radiation and airflow caused by differences in sample arrangement. Prior to the start of the experiment, the kelp samples were equilibrated at room temperature for approximately 30 min to bring their initial temperature to 23 ± 1 °C. The initial wet-basis moisture content of each group of samples was controlled at 80.2 ± 1.1%. If the deviation in initial moisture content between experiments exceeded 2%, new samples were selected to ensure comparable initial moisture conditions across all test conditions [60,61,62,63,64,65]. Prior to the formal experiment, the drying system underwent a no-load pre-run for approximately 20 min. For the IR condition, only the infrared heating module and circulation fan were activated; for the combined drying condition, the heat pump dehumidification unit was also activated at the corresponding intensity. Once the chamber temperature and airflow had stabilized, the samples were quickly placed into the drying chamber, and the timer was started. During the experiment, the infrared system adjusted its power based on temperature feedback to maintain the primary drying temperature within the range of 55–62 °C. When the monitored temperature reached 65 °C, the control system reduced the infrared output to minimize the risk of localized overheating. This temperature control range was consistent with the process window used in previous studies on suspended infrared kelp drying. To continuously obtain data on kelp mass changes, load cells were installed in the suspension system to record the mass of representative sample groups in real time. The weighing system has a range of 0–5 kg and a measurement accuracy of ±1 g; mass data were collected every 5 min [66,67,68]. To minimize the impact of transient airflow disturbances on the weighing results, the average of 30 consecutive seconds of measurements was used as the sample mass at each corresponding time point during data processing. The drying chamber temperature, relative humidity, and the air conditions at the heat pump’s inlet and outlet were continuously recorded at 1 min intervals. The cumulative mass of condensate was recorded every 30 min, while the instantaneous power and cumulative electricity consumption of each electrical component in the system were continuously logged via an energy monitoring module. In addition, the drying endpoint was determined based on both the final moisture content on a wet basis and mass stability. When the average moisture content of the sample on a wet basis decreased to 20 ± 1% and the change in sample mass over a continuous 30 min period was less than 0.5%, the experiment for that batch was considered to have reached the drying endpoint. Upon reaching the endpoint, the timer was stopped immediately, and the total drying time, cumulative energy consumption, and mass of heat pump condensate were recorded. The samples are then removed and cooled to approximately 25 °C at room temperature for the determination of comprehensive color difference, rehydration rate, and final moisture content. To minimize systematic errors caused by experimental sequence and environmental fluctuations, the four operating conditions are conducted in a randomized order, with each condition repeated independently three times, resulting in a total of 12 sets of formal drying experiments [69,70,71,72]. Before the start of each experiment, the operational status of the infrared heating module, circulation fan, heat pump system, and temperature and humidity sensors was checked, and the electronic weighing system and electricity meter were zero-calibrated. The laboratory ambient temperature was maintained at 24 ± 2 °C, and the relative humidity was kept at 50 ± 5% to minimize the impact of external environmental changes on the closed-loop air circulation system. Consequently, the experimental design of this study used the IR operating condition as a baseline and compared the dehydration behavior of kelp under different air humidity levels by gradually increasing the heat pump dehumidification intensity [73,74,75,76]. Since the infrared power density and airflow velocity were kept constant across all experiments, differences in drying kinetics, energy consumption, and quality indicators between operating conditions primarily reflect the effects of the heat pump dehumidification process and its additional energy input. This design also facilitates further assessment of whether a nonlinear relationship exists between heat pump operating intensity and reduced drying time, rather than simply assuming that maximum dehumidification capacity corresponds to optimal overall performance.
2.4. Moisture Content, Moisture Ratio, and Drying Rate
To quantitatively describe the dehydration process of kelp under different drying conditions, this study calculated the moisture content on a wet basis, moisture content on a dry basis, moisture ratio (MR), and drying rate (DR) based on changes in sample mass. The mass of the kelp during the drying process was continuously recorded by an online weighing system, and the moisture state at each time point was calculated based on the initial dry matter mass. Previous studies on infrared drying of kelp have also used moisture ratio and the Page model to describe the dehydration process; therefore, this study adopts the same basic methods for characterizing moisture content to ensure comparability across different studies. The wet-basis moisture content of the sample at any given time is given by Equation (1).
In this equation, is the moisture content of the sample on a wet basis at time (%); is the total mass of the sample at time (kg); and is the absolutely dry mass of the sample (kg). The corresponding moisture content on a dry basis is given by Equation (2).
In the equation, represents the moisture content on a dry-matter basis at time , expressed in kg water/kg dry matter. Since thin-layer drying kinetic models typically use moisture content on a dry-matter basis to describe moisture migration processes, subsequent calculations of the moisture ratio and drying rate are based on this moisture content. Furthermore, the absolute dry mass of the sample is determined by the initial mass and initial moisture content and verified using the constant-weight method in an oven at 105 ± 2 °C. Based on the raw material conditions specified in this study, the initial wet-basis moisture content of kelp was approximately 80.2 ± 1.1%, corresponding to an initial dry-basis moisture content of approximately 4.05 ± 0.28 kg water/kg dry matter. This range is close to the initial dry-basis moisture content of approximately 4.0 kg water/kg dry matter used in previous infrared drying studies. Therefore, to eliminate the impact of differences in initial moisture content among different experimental groups on the comparison of kinetic curves, the dimensionless moisture ratio MR was introduced, as shown in Equation (3).
In Equation (3), M0, M(t), and Me denote the initial, instantaneous, and equilibrium dry-basis moisture contents, respectively, expressed in kg water·kg−1 dry matter. The conventional drying endpoint and equilibrium moisture content are distinct quantities. The equilibrium-moisture protocol involved extending drying beyond the conventional endpoint until the mass change remained below 0.1% for 60 consecutive minutes. The previously stated equilibrium-moisture range of 0.18–0.22 kg water·kg−1 dry matter remains provisional. For the explicitly identified numerical transport scenario, Me = 0.20 kg water·kg−1 dry matter was assumed. This assumption is not presented as a verified equilibrium measurement and does not replace condition-specific experimental values.
The average drying rate of kelp between two adjacent measurement time points is shown in Equation (4).
Time was expressed in hours, giving DR in kg water·kg−1 dry matter·h−1. A three-point moving average was applied to the mass records before calculating the displayed drying-rate profiles to reduce short-term weighing fluctuations. Drying behavior was evaluated using both DR–time and DR–moisture-content profiles [77,78,79]. The independent-batch profiles were summarized at matched observation times for presentation. Routine drying observations and measurements obtained during the separate extended-drying assessment were distinguished. Empirical model comparisons used the same documented MR observations within each operating condition; the number of fitted time points was not treated as the number of independent experimental replicates [80,81,82,83].
2.5. Thin-Layer Drying Models and Evaluation of Model Fit
To compare differences in the moisture decay patterns of kelp under various heat pump dehumidification intensities, this study employed a thin-layer drying model to perform nonlinear fitting of the MR–t data for each operating condition. Previous studies on suspended infrared kelp drying have used the Page model to describe moisture changes and achieved high fitting accuracy [83,84,85,86,87,88,89]. However, under combined infrared–heat pump drying conditions, changes in the humidity of the circulating air and external mass transfer conditions mean that a single model may not maintain the same applicability throughout the entire drying phase. Therefore, this study selected four commonly used thin-layer drying models—Lewis, Henderson–Pabis, Page, and Midilli—for comparison. The Lewis model has a simple structure, containing only a single drying rate parameter, and can be used to describe the basic exponential decay of the moisture fraction over time, as shown in Equation (5).
In this equation, k is the drying rate constant, with units of h−1; t is the drying time, with units of h. Furthermore, the Henderson–Pabis model introduces a scaling factor a based on the Lewis model, allowing the model to make certain adjustments to actual moisture decay curves; its expression is shown in Equation (6).
In this equation, a is the dimensionless model coefficient, and k is the drying rate constant. Additionally, the Page model improves its ability to describe the nonlinear behavior during the decelerating drying phase by introducing an exponential parameter n into the time term. This model is widely used in studies on the drying of kelp and other biomaterials with high moisture content, and it was also the primary kinetic model employed in previous studies on infrared drying of kelp. Its expression is shown in Equation (7).
In this equation, k is the drying constant in the Page model, and n is an empirical parameter reflecting the degree of nonlinearity in the drying curve. When heat pump dehumidification alters the external mass transfer conditions, changes in k and n can be used to aid in comparing differences in the moisture removal process under various operating conditions; however, these two parameters are primarily interpreted as empirical fitting parameters and are not directly equivalent to the physical diffusion coefficient within the material. However, the Midilli model adds a linear time term to the Page model, enabling further correction for moisture changes during the middle and late stages of drying; therefore, its expression is shown in Equation (8).
In the Lewis and Henderson–Pabis models, k has units of h−1. In the Page and Midilli models, k has units of h−n, while a and n are dimensionless. The Midilli coefficient b has units of h−1. These coefficients describe empirical drying-curve characteristics and are not interpreted as intrinsic moisture-diffusion properties.
The original nonlinear least-squares analysis used the treatment-mean MR profiles obtained from three independent experiments. Within each operating condition, candidate models were compared over the same observation times and response values. The number of fitted observations, Nt, denotes the number of time points in the fitted profile, not the number of independent drying batches, as shown in Equation (9).
Here, is the observed moisture ratio at the th fitted time point, is the corresponding prediction, and is the mean of the observations included in that fit. Its calculation formula is shown in Equation (10).
Here, is the observed moisture ratio at the th fitted time point, is the corresponding prediction, and is the mean of the observations included in that fit. The residual mean square was calculated as shown in Equation (11).
where is the number of curve parameters: 1, 2, 2, and 4 for the Lewis, Henderson–Pabis, Page, and Midilli models, respectively. Because the residuals were not scaled by independently specified observation variances, this quantity is termed the residual mean square rather than interpreted as a formal reduced chi-square statistic. Model complexity was evaluated using the Akaike information criterion and its small-sample correction. Under the working assumption of independent Gaussian residuals with a common unknown variance, the total parameter count was , including the residual variance, after omitting the additive constant shared by models fitted to the same dataset. The AIC is calculated as shown in Equation (12).
We then define RSS as the sum of squared residuals, as shown in Equation (13).
Comparisons were made only among models fitted to the same data within an operating condition. Absolute AICc values were not used to compare treatments with different observation counts or response profiles. Residual patterns and parameter plausibility were considered alongside fitting error. Temporal dependence or nonconstant residual variance would limit information-criterion comparisons based on the simplified residual assumption, and Table 2 reports a conditional recalculation using the original rounded RMSE values and assumed observation counts of 73, 64, 57, and 54 for IR, IR–HP-L, IR–HP-M, and IR–HP-H, respectively. These counts represent a nominal 5 min grid with an additional endpoint observation where required; they have not been recovered from the original fitting files. This calculation checks the arithmetic and parameter penalty but is not a new fit of experimental trajectories. A plane-sheet approximation was considered for interpreting falling-rate moisture transport. Assuming predominantly through-thickness transport, approximately constant diffusivity over the selected interval, and an equilibrated surface boundary, the long-time approximation is shown in Equation (13a).
where is the half-thickness in meters and (t) is in seconds. For a regression using time in hours, is calculated as shown in Equation (13b).
Table 2.
Conditional AICc recalculation using the originally reported RMSE values and assumed observation counts.
The reported initial thickness of 2.6 mm corresponds to m. An experimental estimate requires batch-specific falling-rate observations, a documented fitting interval, and examination of the logarithmic-regression residuals. Estimates based on initial thickness would be apparent coefficients because shrinkage, changing environmental conditions, and external mass-transfer resistance are not independently resolved.
For numerical illustration only, , , and kg water·kg−1 dry matter were prescribed, giving . For each synthetic endpoint time , a late-stage exponential tail was specified as shown in Equation (13c).
The scenario coefficient was calculated as . This construction is not a complete trajectory beginning at , does not reproduce the separate mass-stability stopping criterion, and does not constitute an experimental estimate of effective diffusivity.
2.6. Energy Consumption and Energy Performance Evaluation
The energy performance of a combined infrared–heat pump drying system depends not only on the operating power of the equipment but is also influenced by both the drying time and the actual amount of moisture removed. To determine the actual energy consumption of each electrical component under different operating conditions, this study employed a sub-metering approach to independently monitor the infrared heating module, heat pump compressor, circulation fan, and auxiliary control system. The energy measurement and evaluation framework is shown in Figure 3, which presents a diagram of energy measurement and performance evaluation for infrared and combined infrared–heat pump kelp drying [90]. Letter (a) represents the energy consumption measurement and calculation framework; (b) represents the total energy consumption under different drying conditions; (c) represents energy consumption per unit of moisture removed; (d) represents moisture removal per unit of energy consumption and the energy savings rate; and (e) represents the energy consumption composition of different equipment. The instantaneous power and cumulative electricity consumption of each branch were continuously recorded throughout the entire drying cycle, with integration ceasing when the sample reached the preset drying endpoint. This method enables the distinction between the contributions of infrared heating and heat pump dehumidification to total energy consumption and avoids evaluating energy performance based solely on the rated power of the equipment.
Figure 3.
Energy consumption and energy performance of infrared and hybrid infrared–heat pump drying of kelp.
For any electrical unit j, the cumulative electrical energy consumption over the entire drying cycle can be obtained by integrating the instantaneous input power over time, as shown in Equation (14).
In the equation, represents the cumulative electricity consumption of the jth power-consuming unit, in kWh; represents the instantaneous input power at time t, in kW; and t represents the drying time required to reach the specified final moisture content under these operating conditions, in h. Since the electricity metering system records power data at fixed time intervals, the actual data processing uses trapezoidal integration to calculate the cumulative energy consumption, as shown in Equation (15).
Here, is the measured input power of electrical unit at observation , expressed in kilowatts, and is the number of power observations. Time differences are expressed in hours, giving in kilowatt-hours. The symbol is distinguished from the number of fitted moisture-ratio observations, , and the number of batch-level records, . Second, the system’s total electrical energy consumption consists of the cumulative power consumption of the infrared heating module, the heat pump unit, the circulation fan, and the auxiliary control system, as shown in Equation (16).
In the equation, represents the energy consumption of the infrared heating module, represents the energy consumption of the heat pump system, represents the energy consumption of the circulation fan, and represents the auxiliary energy consumption of the sensing, data acquisition, and control systems [91]. For the single infrared drying condition (IR), the heat pump is turned off, so . Furthermore, to ensure the comparability of energy metrics across different drying conditions, the actual moisture removal for the entire drying cycle is first calculated based on the initial and final masses of the sample, as shown in Equation (17).
In this equation, and represent the initial mass of the sample and the mass at the end of drying, respectively, in kilograms. It follows that when expressed in terms of moisture content on a dry basis, the amount of moisture removed can also be calculated using Equation (18).
In the equation, represents the mass of absolute dry matter, and and represent the initial and final moisture contents on a dry basis, respectively. The results from both methods were used to cross-check each other, thereby minimizing the impact of weighing errors or moisture content measurement errors on the energy consumption metrics. Based on the average initial load of 3.50 kg, initial wet-basis moisture content of 80.2%, and target final wet-basis moisture content of 20% established in this study, the moisture removal for a typical single batch experiment was approximately 2.63 kg. In actual calculations, each replicate experiment uses the corresponding measured initial and final masses rather than a uniform theoretical value [91,92,93,94,95]. The energy input required to remove a unit mass of moisture is defined as the specific energy consumption (SEC), as shown in Equation (19).
The unit of SEC is kWh·kg−1 water. For the same feedstock and target final moisture content, a lower SEC indicates that the system consumes less electrical energy to remove a unit mass of moisture. At the same time, the specific moisture extraction rate (SMER) is used to characterize the moisture removal capacity per unit of electrical energy, as shown in Equation (20).
The unit of SMER is kg water·kWh−1. Unlike SEC, a higher SMER value indicates that more moisture can be removed per unit of electrical energy. Under the same computational boundary conditions, the two satisfy the functional relationship shown in Equation (21).
SEC and SMER are exact reciprocals for an individual batch when identical electrical-energy and moisture-removal boundaries are used. Both are reported as alternative representations of energy performance, but they are not independent indicators. Each is calculated at the batch level before treatment means are obtained; therefore, the mean SMER need not equal the reciprocal of the mean SEC. SMER is excluded from the primary correlation matrix and CPI to avoid deterministic duplication. To quantify the energy savings achieved by various combined infrared–heat pump operating conditions relative to standalone infrared drying, we use the IR operating condition as a baseline to calculate the energy savings rate per unit of moisture removed (ESR), as shown in Equation (22).
In the equation, represents the energy consumption per unit of moisture removed under the single-infrared drying condition, and represents the SEC for the corresponding combined drying condition. When ESR is greater than 0, it indicates that the electrical energy required per unit of moisture removed is lower with heat pump dehumidification than with single-infrared drying. However, since heat pump operation increases compressor power consumption, while the reduced drying time may decrease the cumulative operating time of the infrared modules and circulation fans, comparing only the system’s total energy consumption cannot fully explain the sources of energy consumption changes. Average system input power was calculated to distinguish changes in operating power from changes in drying duration as shown in Equation (23).
The contribution of electrical unit to total energy consumption was calculated separately as shown in Equation (23a).
The energy and moisture-removal measurements used in SEC and SMER refer to the same material-loading boundary. A representative-sample mass loss must not be combined directly with whole-system electricity consumption without a documented scaling procedure.
The average system input power was used to help distinguish the combined effect of “increased power” and “shortened operating time” under different operating modes. Furthermore, a higher instantaneous or average operating power does not necessarily imply an increase in total energy consumption. For example, although high-intensity heat pump operation increases the compressor input power, the system’s cumulative electricity consumption may still decrease if the corresponding drying time is significantly shortened. Therefore, this paper uses SEC and SMER as the primary energy performance evaluation metrics, with total energy consumption, average input power, and the proportion of energy consumption attributable to the equipment serving as supplementary metrics. All energy consumption metrics were calculated separately based on actual electricity consumption records from three independent experiments [88,89,90,91]. This allows for a further assessment of whether the reduction in drying time resulting from heat pump dehumidification can offset the additional electricity consumption of the compressor, thereby avoiding the determination of optimal operating conditions based solely on the fastest drying conditions.
2.7. Quality Characteristics Evaluation
To evaluate the effects of different dehumidification intensities on the appearance and textural recovery of kelp during the combined infrared–heat pump drying process, this study assessed product quality based on three aspects: sample appearance, color changes, and rehydration performance. Given that kelp is a large, sheet-like material, radiation, airflow, and moisture migration conditions may vary across different sections. Therefore, in addition to calculating the overall average quality indices for each drying condition, measurements were also taken in distinct zones along the length of the kelp blade. This design was used to characterize the spatial variation of quality indices along the length of the kelp and to provide an experimental data foundation for subsequent three-dimensional layered surface visualization.
2.7.1. Sample Appearance Documentation and Spatial Measurement Point Division
After the kelp had finished drying, the samples were cooled to 25 ± 1 °C at room temperature, and appearance observations and color measurements were completed within 30 min. All samples were photographed under identical lighting conditions against a white background, with the camera position, shooting distance, and exposure parameters kept consistent to minimize the impact of variations in lighting and imaging conditions on the comparison of sample appearance. Fresh kelp was used as the appearance reference, and representative dried samples were recorded separately under the IR, IR–HP-L, IR–HP-M, and IR–HP-H operating conditions. For each operating condition, three pieces of kelp with intact appearance were randomly selected from three independent experiments for subsequent quality analysis. To analyze changes in quality along the length of the kelp blade, the longitudinal length of the kelp was normalized to 0–100%. The normalized position was defined as shown in Equation (24).
In the equation, ξ represents the normalized longitudinal position; x represents the distance from the measurement point to the base of the blade; and L represents the total length of the specimen. Comprehensive color and rehydration performance were measured at normalized positions of approximately 10%, 30%, 50%, 70%, and 90%. Data from each position were first analyzed independently and then used to evaluate spatial variations in quality indicators under the same drying conditions.
2.7.2. Color Measurement
In this study, the CIELAB coordinates , , and were measured at five normalized longitudinal positions. These coordinates represent lightness, the red–green component, and the yellow–blue component, respectively. Three instrument readings were averaged at each position. Total color difference relative to fresh kelp was calculated as shown in Equation (25):
The subscript 0 denotes the corresponding fresh-sample reference. Position-level values were summarized within each independent drying batch before calculating treatment means and standard deviations. Repeated instrument readings and sampling positions were not treated as independent drying replicates.
2.7.3. Determination of Rehydration Properties
To evaluate the ability of dried kelp tissue to reabsorb water and recover its structure, samples measuring approximately 50 mm × 50 mm were cut from five longitudinal positions corresponding to the color measurements. Each sample was weighed at 2.00 ± 0.05 g and completely submerged in distilled water at 25 ± 1 °C, with a solid-to-liquid mass ratio of no less than 1:50. The rehydration time was set at 30 min. After the set time elapsed, the samples were removed, allowed to drain naturally on a stainless steel mesh for 2 min, and then gently blotted with absorbent paper to remove surface-adhered free water, after which the sample mass was immediately weighed. The rehydration rate was calculated according to Equation (26).
denotes rehydration mass gain, expressed as the percentage increase relative to the dried-product mass before immersion. The mass is the product mass before rehydration and is distinct from the oven-dry solids mass . does not represent the percentage recovery of the original fresh-sample moisture content. Measurements from the five longitudinal positions were summarized within each independent batch before treatment means and standard deviations were calculated. All treatment comparisons and CPI inputs require a common immersion duration, temperature, drainage procedure, and mass definition.
The stated experimental protocol specifies 30 min of rehydration. The time associated with the previously reported RR summaries remains to be verified; the working numerical analysis uses those summaries without interpreting them as equilibrium values or evidence of a 60–90 min rehydration trajectory.
2.8. Statistical Analysis and Comprehensive Performance Evaluation
To evaluate differences among the four drying conditions and to further examine the relationships among drying efficiency, energy performance, and product quality, a statistical and comprehensive performance evaluation framework was established, as shown in Figure 4. Figure 4a presents the overall statistical analysis workflow, including the definition of the experimental unit, within-batch data aggregation, treatment comparison, correlation analysis, and comprehensive performance evaluation. Figure 4b presents the Pearson correlation matrix among the selected process, energy, and quality indicators. Figure 4c presents the comprehensive performance index (CPI) obtained under the primary weighting scheme. The sensitivity of the CPI to alternative weighting and normalization procedures is further evaluated in Section 3.6 [96,97,98,99,100]. The independent drying batch was regarded as the experimental unit. Each of the four operating conditions, namely IR, IR–HP-L, IR–HP-M, and IR–HP-H, was repeated independently three times, resulting in a total of 12 independent drying batches. Measurements obtained from different kelp pieces, longitudinal sampling positions, or repeated instrument readings within the same batch were treated as subsamples or technical replicates and were summarized at the batch level before statistical analysis. Unless otherwise specified, experimental results are expressed as the mean ± standard deviation of three independent batches. For batch-level response variables, including drying time, specific energy consumption (SEC), specific moisture extraction rate (SMER), total color difference (ΔE), and rehydration mass gain (RR), differences among the four operating conditions were evaluated using one-way analysis of variance (ANOVA). When the overall ANOVA indicated a significant treatment effect, Tukey’s honestly significant difference (HSD) test was applied for pairwise comparisons. The significance level was set at (p < 0.05). Different lowercase letters in the figures and tables indicate statistically significant differences among treatments, whereas treatments sharing the same letter were not significantly different under the specified test. The four operating conditions were treated as categorical experimental treatments rather than as values of a continuously varying independent variable.
Figure 4.
Statistical analysis and comprehensive performance evaluation of infrared and hybrid infrared–heat pump drying of kelp. (a) Statistical analysis workflow; (b) Pearson correlation matrix; (c) primary comprehensive performance index (CPI).
For time-dependent variables, including moisture ratio and drying rate, repeated significance tests were not performed independently at each sampling time. Instead, comparisons focused on the overall drying trajectories, the time required to reach the specified drying endpoint, and the kinetic characteristics obtained from model fitting. The evaluation of thin-layer drying models, including complexity-adjusted information criteria, was conducted according to the procedures described in Section 2.5.
To explore the statistical associations among the drying environment, drying efficiency, energy consumption, and product quality, Pearson correlation analysis was performed using the paired batch-level observations from the 12 independent drying experiments. The variables included in the primary correlation analysis were average drying-chamber relative humidity, drying time, SEC, ΔE, and RR, as illustrated in Figure 4b. SMER was not included as an additional variable in the primary correlation matrix because, under the same energy-consumption and moisture-removal boundaries, SMER is mathematically reciprocal to SEC and therefore does not provide an independent energy-performance dimension.
The Pearson correlation coefficient between two variables (x) and (y) was calculated as shown in Equation (27):
where and are the values of the two variables obtained from the independent drying batch, respectively; and are the corresponding arithmetic means; and is the number of independent batch-level observations. In the present experimental design, . For each pair of variables, a two-sided significance test and a 95% confidence interval were calculated. Because multiple pairwise correlations were evaluated simultaneously, the resulting -values were adjusted using the Holm procedure to reduce the risk of false-positive findings associated with multiple testing. The correlation analysis was used as an exploratory tool for identifying statistical associations rather than for establishing causal relationships. In particular, correlations calculated from the pooled 12-batch dataset may reflect both differences among operating conditions and variability among individual batches because the four treatments represent discrete operating levels rather than continuous changes in a single process variable. Therefore, a significant correlation does not necessarily represent a within-treatment relationship or demonstrate that one variable directly causes changes in another. This limitation was considered when interpreting the correlation results.
To compare the overall performance of the four drying conditions, a comprehensive performance index was established based on drying efficiency, energy utilization, and product quality. Four indicators were included in the CPI: drying time, SEC, ΔE, and RR. Although both SEC and SMER were retained in the energy-performance analysis, only SEC was incorporated into the CPI because the two indicators are mathematically reciprocal when evaluated using identical system boundaries. Including both indicators in the same composite index would therefore result in repeated weighting of the same energy-performance information.
Because the selected indicators differ in units and numerical scales, they were normalized before calculating the CPI. Drying time, SEC, and ΔE are cost-type indicators for which lower values represent better performance. Their normalized values were calculated as shown in Equation (28):
where is the value of indicator under operating condition , and and are the maximum and minimum values of indicator , respectively, among the four operating conditions. After normalization, a larger represents better performance.
RR is a benefit-type indicator for which a higher value represents better performance. Its normalized value was calculated as shown in Equation (29):
To balance drying efficiency, energy utilization, and product quality, equal importance was assigned to these three performance dimensions. Drying time and SEC were therefore assigned weights of each, while the product-quality dimension was divided equally between ΔE and RR, giving each quality indicator a weight of . The CPI for operating condition was calculated as shown in Equation (30):
In the equation, , , , and represent the normalized drying time, SEC, total color difference, and rehydration mass gain, respectively. A higher CPI indicates more favorable overall performance under the specified weighting and normalization scheme. Figure 4c presents the CPI values obtained using this primary dimension-balanced weighting scheme. Because the selection of indicator weights is inherently dependent on the intended decision objective, sensitivity analysis was further conducted using four alternative weighting schemes: equal indicator weighting, time-prioritized weighting, energy-prioritized weighting, and quality-prioritized weighting. In addition, ratio-based normalization was introduced as an alternative to min–max normalization. For the ratio-based procedure, cost-type indicators were normalized as , whereas the benefit-type RR indicator was normalized as .
To further evaluate the robustness of the treatment ranking to changes in indicator weights, 100,000 sets of non-negative weights satisfying a total weight of one were generated from a Dirichlet(1, 1, 1, 1) distribution. The same weight vectors were applied to both normalization procedures. The proportion of scenarios in which each treatment ranked first was then calculated. This analysis changes only the weighting and normalization assumptions while retaining the treatment-mean inputs; consequently, the resulting ranking frequencies represent sensitivity to evaluation preferences rather than experimental confidence probabilities. The detailed sensitivity results are presented in Section 3.6 [101,102,103,104,105,106,107]. Overall, Figure 4 summarizes the revised statistical and comprehensive evaluation framework used in this study. Figure 4a distinguishes independent experimental batches from within-batch measurements, Figure 4b illustrates the batch-level correlation analysis, and Figure 4c summarizes the primary CPI comparison among the four operating conditions. The correlation and CPI analyses are used to complement, rather than replace, the individual kinetic, energy, and product-quality results [108].
3. Results and Discussion
3.1. Temperature and Humidity Trends and Heat Pump Dehumidification Characteristics
Figure 5 presents the evolution of temperature and relative humidity in the drying chamber and the dehumidification characteristics of the heat pump under different operating conditions. Overall, the introduction of heat pump dehumidification mainly affected the humidity state of the circulating air, whereas the temperature profiles remained relatively similar among treatments [109,110,111,112,113,114,115,116]. As shown in Figure 5a, all treatments experienced a rapid heating stage after the beginning of drying and reached a relatively stable temperature range within approximately 30–45 min. The average temperatures of the IR, IR–HP-L, IR–HP-M, and IR–HP-H conditions were 59.1 ± 1.4, 58.8 ± 1.3, 58.5 ± 1.2, and 58.2 ± 1.3 °C, respectively. The relatively small temperature differences among treatments indicate that the heat pump primarily regulated the moisture condition of the drying medium rather than substantially changing the thermal environment established by infrared heating. Similar temperature behavior has been reported in previous infrared-assisted drying studies, where infrared radiation was mainly responsible for rapid heat input while airflow and humidity control influenced the subsequent moisture-removal process. Therefore, under the present experimental configuration, differences in drying performance were mainly associated with changes in air-side moisture-transfer conditions rather than differences in average drying temperature. Figure 5b shows the variation in relative humidity during drying. The initial relative humidity was approximately 80% for all treatments and gradually decreased as drying proceeded. Under standalone infrared drying, the humidity reduction was relatively slow, and the final relative humidity remained approximately 30.4%. After introducing heat pump dehumidification, the final relative humidity decreased to 24.9%, 20.8%, and 18.5% for IR–HP-L, IR–HP-M, and IR–HP-H, respectively. The average relative humidity values during the entire drying process were 48.7 ± 2.6%, 43.2 ± 2.1%, 38.5 ± 1.9%, and 34.6 ± 1.8% for IR, IR–HP-L, IR–HP-M, and IR–HP-H, respectively (Figure 5c). The continuous reduction in humidity with increasing heat pump intensity confirms that the compressor operating level effectively regulated the moisture content of the circulating air.
Figure 5.
Evolution of drying-chamber temperature and relative humidity and dehumidification performance of the heat pump under different drying conditions. (a) Drying-chamber temperature; (b) drying-chamber relative humidity; (c) average relative humidity; (d) air-state changes in the heat-pump unit under IR–HP-M; (e) cumulative condensate water; (f) condensate water recovery ratio.
From a heat and mass transfer perspective, reducing the humidity of the drying medium increases the vapor pressure difference between the kelp surface and surrounding air, thereby improving the external moisture-removal driving force. However, the effect of further reducing air humidity depends on the ability of internal moisture to migrate toward the material surface. Therefore, a lower air humidity level does not necessarily result in a proportional improvement in drying performance. Figure 5d illustrates the air-state changes through the heat pump unit under IR–HP-M operation. The humid air from the drying chamber entered the evaporator at approximately 54.8 ± 1.2 °C and 60.3 ± 3.1% RH. After passing through the evaporator, the air temperature decreased to approximately 13.6 ± 0.8 °C, while the relative humidity approached saturation due to condensation. After reheating in the condenser, the outlet air temperature increased to approximately 45.2 ± 1.1 °C and the relative humidity decreased to 22.6 ± 2.8%, allowing the treated air to return to the drying chamber.
The cumulative condensate production under different heat pump intensities is shown in Figure 5e. The condensate masses for IR–HP-L, IR–HP-M, and IR–HP-H were 1.63 ± 0.08, 2.16 ± 0.10, and 2.29 ± 0.11 kg, respectively. Increasing heat pump intensity therefore enhanced the condensation-based moisture removal capacity of the air-handling system. To further evaluate the contribution of heat pump dehumidification to overall moisture removal, the condensate recovery ratio was calculated according to Equation (31). As shown in Figure 5f, the condensate recovery ratios were approximately 62.0%, 82.1%, and 87.1% for IR–HP-L, IR–HP-M, and IR–HP-H, respectively. However, the increase in condensate recovery became less pronounced when the operating intensity increased from medium to high. This indicates that once the circulating air reaches a relatively low humidity state, further enhancement of dehumidification capacity provides limited additional improvement in air-side moisture removal.
Similar nonlinear responses have been observed in other heat pump drying systems, where increasing compressor capacity initially improves drying performance but may produce diminishing returns when external mass-transfer resistance has been sufficiently reduced. In the present infrared-assisted system, infrared radiation provided the primary thermal input, whereas the heat pump mainly adjusted the humidity conditions of the drying medium. The interaction between these two functions determines the overall drying behavior, which is further analyzed through drying kinetics and energy performance in the following sections [117,118,119,120,121].
3.2. Drying Kinetics and Thin-Layer Model Fitting
The changes in moisture ratio (MR) and drying rate (DR) of kelp under different drying conditions are shown in Figure 6. Figure 6a presents the MR profiles and Page-model fitting curves, while Figure 6b illustrates the corresponding drying-rate variations. The error bars represent the standard deviation obtained from three independent experiments. Overall, the introduction of heat pump dehumidification accelerated moisture removal compared with standalone infrared drying. Under IR conditions, the drying time required to reach the target moisture content was approximately 6.00 h, whereas the corresponding times for IR–HP-L, IR–HP-M, and IR–HP-H were reduced to 5.25, 4.65, and 4.40 h, respectively. The reduction in drying time was associated with the decrease in circulating-air humidity shown in Figure 5, which improved the external moisture-transfer conditions around the kelp surface. Similar effects have been reported in heat pump-assisted drying systems, where controlling air humidity can enhance moisture removal without requiring excessive increases in drying temperature. In previous studies on suspended infrared kelp drying, the drying time under conditions of 1.2 kW·m−2 and 3 m·s−1 was approximately 6 h, and the Page model was able to describe the moisture decay process well; therefore, using these infrared operating conditions as the benchmark for combined drying in this study ensures continuity. Figure 6b shows that none of the four operating conditions exhibited a sustained and stable constant-rate drying phase. DR rapidly reached a high level after the initial temperature rise and then continued to decline as the material’s moisture content decreased, indicating that kelp drying under the conditions of this study primarily exhibited decelerating drying characteristics. The average drying rates for IR, IR–HP-L, IR–HP-M, and IR–HP-H were 0.633 ± 0.028, 0.724 ± 0.031, 0.817 ± 0.034, and 0.864 ± 0.036 kg water·kg−1 dry matter·h−1, representing increases of approximately 14.4%, 29.1%, and 36.5%, respectively, compared to the IR treatment. Differences in drying rate among the heat-pump-assisted conditions were most apparent during the early and intermediate stages and became smaller at lower moisture contents. Similar falling-rate behavior has also been reported for kelp and other high-moisture biological materials, where moisture movement gradually becomes more difficult as drying proceeds. This convergence is consistent with an increasing contribution of internal moisture-transport resistance. However, the drying-rate profiles alone do not quantitatively distinguish internal diffusion, external mass transfer, and shrinkage-related effects. The diminishing response to stronger dehumidification is therefore interpreted as compatible with increasing internal transport limitations rather than as identification of a unique rate-controlling mechanism.
Figure 6.
Drying kinetics of kelp under the four operating conditions. (a) Moisture ratio (MR) and Page-model fitting; (b) drying rate (DR).
The originally reported RMSE values were used for a conditional audit of the information-criterion calculation. Table 2 presents the resulting AICc values under the observation-count assumptions specified in Section 2.5.
The originally reported fitting errors were smaller for the Page and Midilli models than for the Lewis and Henderson–Pabis models. Midilli provided the lowest residual errors but required four curve parameters, compared with two for Page. Its smaller RMSE therefore represents closer in-sample agreement and does not, by itself, establish superior predictive performance. Under the conditional calculation in Table 2, Midilli showed the lowest AICc value within each operating condition. The ΔAICc values for Page were 32.144, 23.928, 28.072, and 14.921 for IR, IR–HP-L, IR–HP-M, and IR–HP-H, respectively. These results demonstrate the numerical effect of consistently accounting for parameter complexity, but they remain conditional on the assumed observation counts and original rounded residual errors.
The Page parameters were interpreted as empirical curve descriptors. Because the units of depend on , percentage differences in across fits with different exponents were not interpreted as percentage changes in a physical drying-rate constant. A characteristic time was calculated as , corresponding to . The parameter pairs were (0.589, 1.086), (0.646, 1.104), (0.712, 1.124), and (0.763, 1.117), giving characteristic times of approximately 1.628, 1.486, 1.353, and 1.274 h, respectively. The explicitly prescribed transport scenarios gave values of , , , and , respectively. The standard deviations summarize three synthetic scenarios per condition, with nominal thickness held fixed. These are not experimental diffusivity estimates: their ordering follows from the imposed endpoint times and geometry and cannot independently establish diffusion-controlled drying.
In the reported treatment means, increasing heat-pump operation from medium to high shortened drying time from 4.65 to 4.40 h, a further reduction of approximately 5.4%. This was smaller than the approximately 11.4% reduction from low to medium operation. Consequently, the highest operating level gave the shortest drying time, but its additional benefit over medium operation was limited. The associated energy trade-off is evaluated in Section 3.3.
The Page-model parameters further describe the changes in empirical drying behavior under different operating conditions. The value of increased from 0.589 for IR to 0.646, 0.712, and 0.763 for IR–HP-L, IR–HP-M, and IR–HP-H, respectively, while the parameter varied within a relatively narrow range. These results indicate that heat pump dehumidification mainly influenced the apparent drying rate level rather than substantially changing the nonlinear characteristics of the moisture-ratio curves. Because depends on the fitted exponent , it should be interpreted as an empirical parameter rather than a direct physical drying-rate constant. Therefore, the characteristic drying time was used for comparison, giving values of approximately 1.628, 1.486, 1.353, and 1.274 h for IR, IR–HP-L, IR–HP-M, and IR–HP-H, respectively. The decreasing trend of agrees with the observed reduction in drying time.
Although IR–HP-H showed the shortest drying time, the additional reduction from IR–HP-M to IR–HP-H was limited compared with the increase from IR–HP-L to IR–HP-M. This suggests that increasing dehumidification intensity provides diminishing kinetic benefits at higher operating levels. Therefore, the kinetic advantage of high-intensity operation should be evaluated together with its additional energy requirement and quality effects.
3.3. Energy Consumption and Energy Efficiency
The total electricity consumption, specific energy consumption (SEC), specific moisture extraction rate (SMER), and energy distribution of the drying system are shown in Figure 7. The error bars represent the standard deviation of three independent experiments. The sub-metering approach allowed the contributions of infrared heating, heat pump operation, circulation fan, and auxiliary systems to be evaluated separately.
Figure 7.
Energy consumption and energy performance of kelp under infrared and hybrid infrared–heat pump drying conditions. (a) Energy measurement and performance evaluation framework; (b) total energy consumption; (c) specific energy consumption (SEC); (d) specific moisture extraction rate (SMER); (e) energy consumption distribution.
As shown in Figure 7b, the IR condition exhibited the highest total electricity consumption (19.65 kWh). After introducing heat pump dehumidification, the total energy consumption decreased to 16.80 and 15.33 kWh for IR–HP-L and IR–HP-M, respectively. However, increasing the heat pump intensity to IR–HP-H increased the total energy consumption to 15.93 kWh. This result indicates that the relationship between heat pump capacity and energy performance was not linear. Although higher compressor operation enhanced moisture removal, the additional electrical input gradually reduced the energy-saving benefit obtained from shortening the drying period. Similar trends have been reported in heat pump drying systems, where increasing compressor capacity can reduce drying time but may increase specific energy consumption when the additional moisture-removal benefit becomes limited. However, the present system differs from conventional heat pump dryers because infrared radiation provided the primary heat input, while the heat pump mainly regulated air humidity and recovered condensation heat. Therefore, the energy performance was determined by the balance among infrared energy reduction, compressor consumption, and moisture-removal efficiency. In contrast, the IR–HP-H configuration only further reduced the drying time from 4.65 h to 4.40 h, while requiring the compressor to operate at a higher load; the resulting increase in energy consumption began to outweigh the energy-saving benefits derived from the further reduction in drying time. The specific energy consumption per unit of water removed further corroborates this trend. Figure 7c shows that the SEC under IR conditions is 7.46 kWh·kg−1 water, while the IR–HP-L and IR–HP-M modes reduce this to 6.38 and 5.82 kWh·kg−1 water, respectively. Notably, the SEC of the IR–HP-M mode decreases by 22.0% compared to the IR mode, indicating that the system requires significantly less electrical energy to remove the same mass of water. However, the SEC for the IR–HP-H condition rose to 6.05 kWh·kg−1 water, an increase of approximately 4.0% compared to IR–HP-M. Therefore, increasing dehumidification intensity beyond the medium level did not further improve the energy efficiency of the system under the present operating conditions [12,20,21,22,23]. Corresponding to the SEC, the SMER exhibited a trend of first increasing and then decreasing (Figure 7d). The SMER for the IR operating condition was 0.134 kg water·kWh−1; after introducing low- and medium-intensity heat pump dehumidification, it increased to 0.157 and 0.172 kg water·kWh−1, respectively. The IR–HP-M showed an increase of approximately 28.4% compared to IR, indicating a significant increase in the mass of water removed per unit of electrical energy. When the heat pump operating intensity was increased to the IR–HP-H level, the SMER decreased to 0.165 kg water·kWh−1; although this value remained higher than that of the IR and IR–HP-L conditions, it was lower than that of the medium dehumidification condition. The changes in SEC and SMER indicate that the medium dehumidification condition provided the most favorable relationship between electrical input and moisture removal among the tested conditions. The breakdown of energy consumption shown in Figure 7e further explains this phenomenon. Under IR conditions, infrared heating accounts for approximately 72% of the system’s total energy consumption, while the circulation fan and auxiliary systems account for approximately 20% and 8%, respectively. As the heat pump became operational, the proportion of energy consumption attributed to infrared heating gradually decreased, falling to approximately 58%, 49%, and 45% in the IR–HP-L, IR–HP-M, and IR–HP-H scenarios, respectively. This change primarily resulted from heat pump dehumidification accelerating moisture removal, thereby reducing the cumulative operating time of the infrared module. At the same time, the proportion of total energy consumption accounted for by the heat pump compressor increased from approximately 18% in the IR–HP-L configuration to 28% in the IR–HP-M configuration, and further rose to 34% in the IR–HP-H configuration. The proportion of energy consumption attributable to the circulation fan gradually decreased from 20% under IR conditions to 17%, 16%, and 14%, primarily due to the shortening of the overall drying cycle. The proportion accounted for by the auxiliary control system remained largely stable at around 7% across different combined operating conditions, exerting a relatively limited influence on the differences in total energy consumption between these conditions. This demonstrates that the energy savings achieved by the combined drying system do not stem from a reduction in the power consumption of any single piece of equipment, but rather from a redistribution of the energy input structure. Although the heat pump compressor adds some electrical energy consumption, its active dehumidification reduces mass transfer resistance on the air side, thereby decreasing the cumulative operating time required for infrared heating and the fan. In the low- to medium-dehumidification-intensity range, this time-saving effect outweighs the additional energy consumption of the compressor; consequently, the system’s total energy consumption and SEC continue to decrease. At high dehumidification intensities, the increase in compressor energy consumption remains significant, while Figure 5 and Figure 6 have already shown that the improvement in drying time resulting from further reductions in air humidity gradually diminishes, ultimately leading to a rise in SEC. This change also illustrates that, when evaluating infrared–heat pump combined systems, simply comparing drying times may yield conclusions that differ from those based on energy assessments. From a kinetic perspective, IR–HP-H provided the shortest drying time and the highest empirical drying-rate parameters; however, from an energy perspective, IR–HP-M showed the lowest SEC and the highest SMER under the tested conditions. Therefore, the highest dehumidification intensity does not necessarily correspond to the highest overall energy efficiency, because the additional compressor input may offset the benefit obtained from further reducing drying time. For kelp with high moisture content, once the recirculated air humidity has been reduced to a range capable of effectively maintaining the external mass transfer driving force, further increasing the heat pump load primarily results in an increase in electrical power input rather than a proportional increase in the moisture removal rate. Considering the combined effects of drying time, energy consumption, and air-side dehumidification behavior, the results suggest that the tested system approached a condition where further reduction in air humidity provided limited additional drying benefits. When the average relative humidity decreased from approximately 38.5% under IR–HP-M to 34.6% under IR–HP-H, the drying time reduction was relatively small, while the compressor energy contribution continued to increase. This trend suggests that excessive dehumidification may have limited marginal benefits under the present experimental conditions.
Therefore, the medium heat pump operating condition showed the most favorable energy performance within the investigated range, characterized by the lowest SEC and highest SMER. However, this conclusion is limited to the tested infrared setting, airflow condition, material loading, and laboratory-scale system. A broader optimization considering different infrared intensities, airflow velocities, loading densities, and compressor capacities is required before extending this operating recommendation to other drying systems.
3.4. Quality Retention, Drying Uniformity, and Structural Integrity
Figure 8 summarizes representative appearance, CIELAB color coordinates and ΔE, fixed-time rehydration mass gain, longitudinal moisture variation, and reported mechanical characteristics. These responses are interpreted separately from the energy indicators because a favorable mean ranking does not establish a statistically significant improvement in every quality attribute. The conceptual schematic illustrates possible process–quality relationships rather than directly measured microscopic mechanisms. Figure 8a shows the appearance of fresh kelp and representative samples under the four drying conditions. Fresh samples have a darker surface color and a distinct luster; after drying, all treatments exhibited varying degrees of color change and surface shrinkage. The IR samples showed more pronounced darkening and surface wrinkling, which may be associated with the longer drying duration and greater cumulative thermal exposure. The surface condition improved after the IR–HP-L treatment, but some darkening and shrinkage were still observable. In contrast, the IR–HP-M samples had a more uniform overall color and relatively fewer surface wrinkles. Although the IR–HP-H treatment had a shorter drying time, localized shrinkage intensified again, indicating that excessive dehumidification did not further improve the appearance quality. The reported mean ΔE values were 6.34 ± 0.28, 6.02 ± 0.25, 5.82 ± 0.22, and 6.11 ± 0.27 for IR, IR–HP-L, IR–HP-M, and IR–HP-H, respectively. Medium heat-pump operation had the smallest mean color difference, whereas increasing the operating level further did not improve the mean value. This is a descriptive ordering rather than independent evidence of a significant pairwise difference. The reported RR values were 92.6 ± 2.8%, 94.0 ± 2.5%, 95.1 ± 2.4%, and 93.8 ± 2.7%, respectively. These values correspond to the fixed-time rehydration protocol described in Section 2.7.3 and should not be interpreted as equilibrium rehydration capacities. Treating the reported error terms as standard deviations of three independent batches gives approximate overall ANOVA statistics of for ΔE and for RR, corresponding to and , respectively. Under that interpretation, the reported summaries do not support the original claims of significant quality improvement. The current interpretation therefore emphasizes mean trends and batch variability. Similar trade-offs between drying acceleration and quality retention have been reported in other biological materials, where excessive drying intensity may shorten processing time but can also increase moisture gradients and structural stress. For high-moisture marine biomass such as kelp, maintaining an appropriate drying rate is therefore important for balancing dehydration efficiency and preservation of functional properties. Reduced thermal exposure, tissue shrinkage, and changes in water accessibility may contribute to the observed responses. However, these explanations remain hypotheses because cellular structure and internal moisture gradients were not directly quantified. Furthermore, in addition to average quality indicators, the moisture distribution at different locations within the kelp also affects product consistency. Figure 8d compares the moisture content on a wet basis at different longitudinal positions during the same drying stage. A certain spatial moisture gradient was observed under all operating conditions, but the magnitude of this gradient varied significantly depending on the dehumidification conditions. When spatial moisture uniformity was evaluated using the coefficient of variation (CV), the CV for the IR condition reached 12.6%, indicating relatively pronounced moisture differences between different positions. After introducing a heat pump, the CV for the IR–HP-L condition decreased to 9.8%, and for the IR–HP-M condition, it further decreased to 7.1%, while the IR–HP-H condition remained at 8.4%. This improvement in moisture uniformity suggests that active dehumidification not only increased the average dehydration rate but also altered the distribution of localized water vapor accumulation within the drying chamber. The IR–HP-M condition exhibited the lowest CV, indicating more balanced moisture removal across all locations under these conditions. Although the IR–HP-H condition had the highest overall dehydration rate, its spatial uniformity was slightly lower than that of IR–HP-M; this may be associated with the stronger external drying conditions under high-intensity dehumidification, although the contribution of local moisture migration and structural changes requires further investigation. Thus, reducing air humidity helps minimize the stagnation of moist air in localized areas, but excessively strong dehumidification does not necessarily result in optimal spatial uniformity. The mechanical properties of the dried kelp are shown in Figure 8e. The tensile strength of fresh kelp is approximately 24.5 MPa, and the elongation at break is approximately 82.4%. After drying treatment, both indicators decreased significantly, indicating that the dehydration process inevitably altered the material’s macrostructure and toughness. The tensile strength of the IR sample dropped to 12.6 MPa, and its elongation at break was only 48.6%, demonstrating a relatively significant loss of structural integrity. For IR–HP-L, these values increased to 16.3 MPa and 60.2%, respectively, while IR–HP-M further reached 19.8 MPa and 68.9%. When the dehumidification intensity was increased to the level of IR–HP-H, the tensile strength and elongation at break decreased to 15.1 MPa and 55.1%, respectively, both of which were lower than those of IR–HP-M. These results show the same trend as the comprehensive color difference, rehydration rate, and moisture uniformity, indicating that the highest dehydration rate does not correspond to the best structural retention. A moderate moisture removal rate can shorten heat treatment time while avoiding the formation of excessive instantaneous moisture gradients between the surface and interior, thereby reducing excessive shrinkage. Conversely, under IR–HP-H conditions, mass transfer capacity on the air side is significantly enhanced, but the internal moisture migration rate cannot increase at the same pace; rapid moisture removal may increase moisture gradients during drying and potentially influence structural integrity. However, the present measurements do not directly identify the underlying structural changes. Figure 8f provides a conceptual interpretation of the possible relationships between drying conditions and product quality. This air-side enhancement was associated with lower ΔE, higher RR, lower CV of moisture distribution, and better tensile properties. Single-infrared drying provides relatively stable heat input; however, due to relatively high air humidity, water vapor removal is limited, resulting in extended drying cycles and increased cumulative heat exposure. With the addition of a heat pump, the humidity of the recirculated air decreases, enhancing the mass transfer driving force of water vapor on the kelp surface and thereby shortening the drying time. For the IR–HP-M process, this air-side enhancement remains at a reasonable level, resulting in a low ΔE, high RR, low CV of moisture distribution, and good tensile properties. In contrast, the IR–HP-H system provides stronger external dehumidification conditions [122]. Although it has the shortest drying time, Figure 6 indicates that the kinetic benefits diminish significantly when moving from IR–HP-M to IR–HP-H, while Figure 7 shows an increase in additional compressor energy consumption. Figure 8 further illustrates that this higher dehumidification intensity did not result in additional quality improvements [123]. The quality summaries are consistent with a trade-off between faster dehydration and retention of product characteristics, but they do not establish a specific transition in the rate-controlling mechanism. Medium heat-pump operation showed favorable mean responses, although the available batch-level statistics do not support claiming superiority for every individual quality indicator. The combined time–energy–quality assessment is therefore considered in Section 3.6 using an explicitly defined CPI and sensitivity analysis, rather than repeating the individual response values as proof of overall optimality.
Figure 8.
Effects of infrared and hybrid infrared–heat pump drying modes on the quality characteristics of kelp. (a) Sample appearance and visual quality; (b) color analysis; (c) rehydration performance; (d) moisture content and drying uniformity; (e) texture and structural integrity; (f) conceptual summary of quality effects. Different lowercase letters (a, ab, b, bc, and c) above the bars indicate statistically significant differences among treatments (p < 0.05), as determined by one-way analysis of variance (ANOVA) followed by Tukey’s honestly significant difference (HSD) test. Treatments sharing at least one letter are not significantly different.
3.5. Exploratory Relationships Among Process, Energy, and Quality Indicators
To further explore the relationships among drying environment, process performance, energy consumption, and quality characteristics, Pearson correlation analysis was performed using batch-level observations from the independent drying experiments, as shown in Table 3. Each independent drying batch was treated as one observation, and variables obtained from the same batch were paired before analysis. The evaluated variables included average drying-chamber relative humidity, drying time, SEC, ΔE, and RR. SMER was not included in the correlation matrix because it is mathematically reciprocal to SEC when calculated using the same energy-consumption and moisture-removal boundaries.
Table 3.
Batch-level observations used for Pearson correlation analysis.
The Pearson correlation coefficients, confidence intervals, and significance levels calculated from the batch-level observations are summarized in Table 4. Five variables were included, giving 10 pairwise tests. SMER was omitted because it is a reciprocal transformation of SEC at the batch level.
Table 4.
Pearson correlation coefficients among batch-level drying, energy, and quality indicators.
The correlation results indicate statistical associations among process, energy, and quality indicators under the investigated operating conditions. The relationships among humidity reduction, drying time, and energy performance should be interpreted together with the treatment comparisons presented in Section 3.1, Section 3.2 and Section 3.3. Because the sample size was limited to 12 independent batches, the correlation analysis is considered exploratory and does not establish causal relationships.
3.6. Comprehensive Performance and Sensitivity Analysis
Using the reported treatment means, the primary dimension-balanced CPI scores were 0.000, 0.572, 0.948, and 0.774 for IR, IR–HP-L, IR–HP-M, and IR–HP-H, respectively. Under this weighting scheme, IR–HP-M obtained the highest descriptive CPI value. When alternative weighting schemes were evaluated using min–max normalization, the ranking remained unchanged, with IR–HP-M followed by IR–HP-H, IR–HP-L, and IR. The relevant data are shown in Table 5.
Table 5.
Sensitivity analysis of the comprehensive performance index (CPI) under different weighting schemes.
The ratio-normalization analysis further demonstrated that the ranking of operating conditions was influenced by the selected evaluation framework. Under the dimension-balanced, equal-indicator, energy-prioritized, and quality-prioritized weighting schemes, IR–HP-M consistently achieved the highest CPI value. Under the dimension-balanced scheme, the CPI values obtained using ratio normalization were 0.9821 and 0.9771 for IR–HP-M and IR–HP-H, respectively. However, when greater importance was assigned to drying time, the time-prioritized weighting scheme resulted in a slightly higher CPI value for IR–HP-H (0.9832) than for IR–HP-M (0.9731). This indicates that the preferred operating condition depends on the practical objective of the drying process and the relative importance assigned to individual performance indicators.
To further examine the robustness of the CPI ranking, 100,000 weight combinations were randomly generated under the constraint that the sum of all weights equaled one. Under the min–max normalization method, IR–HP-M ranked first in 97.3% of the evaluated scenarios, whereas this proportion decreased to 75.1% under ratio normalization. In the remaining scenarios, IR–HP-H obtained the highest ranking. These ranking frequencies were calculated using fixed treatment-mean values and an assumed distribution of indicator preferences; therefore, they should not be interpreted as probabilities that one treatment is experimentally superior to another. Instead, they describe the sensitivity and robustness of the comprehensive evaluation framework under different decision preferences and normalization approaches.
Overall, the sensitivity analysis supports IR–HP-M as a favorable compromise between drying efficiency, energy utilization, and quality retention within the investigated operating range. However, the CPI ranking should be interpreted together with the individual performance indicators and experimental variability. Since the evaluation was conducted using four discrete operating conditions under a laboratory-scale configuration, the results do not represent a global optimization of heat pump capacity or a universal optimum for all drying systems. The analysis does not establish significant color or rehydration improvements independently of the corresponding experimental tests [124].
3.7. Implications for Dynamic Heat-Pump Control and Study Limitations
The fixed-condition comparison suggests that compressor capacity should be matched to the changing moisture-removal demand rather than maintained at the maximum level throughout the entire drying process. The limited additional reduction in drying time and the increased SEC observed when increasing the operating intensity from IR–HP-M to IR–HP-H indicate that a staged adjustment of compressor operation may provide further opportunities for improving energy efficiency. However, this concept represents a potential control strategy derived from the present experimental observations and has not been experimentally validated.
A possible dynamic control approach could use the online mass-loss signal to estimate the instantaneous drying behavior. Considering the current measurement interval of 5 min, a rolling time window could be applied to reduce the influence of short-term measurement fluctuations. The drying rate within a selected window can be estimated according to Equation (31):
where represents the window-based drying rate, is the dry matter mass, and the subscript indicates the selected time window. In addition, a window-based energy indicator can be calculated according to Equation (32):
where represents the total material mass corresponding to the energy-measurement boundary. The calculation of should only be performed when the measured mass reduction exceeds the uncertainty associated with the weighing system to avoid excessive fluctuations caused by small mass differences.
Based on these indicators, a potential operating strategy would initially maintain the heat pump at the medium operating level and reduce compressor intensity when the drying rate decreases below a predefined reference value and the energy consumption per unit of removed moisture increases. The switching threshold, persistence time, and humidity limits should be determined from additional dynamic-response experiments rather than directly adopted from the present fixed-condition comparison.
If the air humidity subsequently increases beyond an acceptable range after load reduction, the previous operating level could be restored. Additional measures, including separate switching thresholds and minimum operating periods, would be required to avoid frequent compressor cycling. The existing temperature protection strategy should remain independent from humidity-based control.
The proposed dynamic strategy has not been experimentally tested in the present study, and no additional energy-saving performance is claimed. Condensate generation may provide additional information regarding air-side moisture removal; however, due to differences in sampling frequency and response delay, it cannot directly replace online material mass-loss measurements.
In addition, the present investigation was conducted under a laboratory-scale configuration with fixed nominal infrared power density, airflow velocity, loading condition, and initial material characteristics. The experimental design focused on the influence of heat pump dehumidification intensity as a single operating factor; therefore, interactions among infrared intensity, airflow velocity, loading density, initial moisture content, and heat pump capacity were not evaluated. Furthermore, only three independent batches were conducted for each condition, which limits the statistical power for comprehensive ranking analyses. Future studies should investigate broader operating ranges, dynamic control validation, and pilot-scale systems before extending the present conclusions to industrial kelp drying applications.
4. Conclusions
This study investigated the effects of different heat pump dehumidification intensities on the drying kinetics, energy performance, and quality characteristics of vertically suspended kelp during hybrid infrared–heat pump drying. By integrating infrared heating with closed-loop heat pump dehumidification, the study evaluated how air-side humidity regulation influenced moisture removal, electrical energy utilization, and product quality under different operating conditions. The results showed that heat pump integration improved drying performance primarily by reducing the humidity of the circulating air and enhancing moisture-removal conditions rather than by substantially increasing the drying temperature. Increasing the heat pump operating intensity accelerated moisture removal; however, the improvement gradually diminished at higher dehumidification levels, indicating that stronger air-side dehumidification did not always provide proportional drying benefits. The thin-layer drying models effectively described the moisture-ratio evolution of kelp under the investigated conditions. The model evaluation demonstrated that fitting accuracy should be considered together with model complexity, as models with additional parameters may achieve lower fitting errors while providing limited additional interpretability. The energy analysis further indicated that the highest dehumidification intensity did not necessarily correspond to the highest energy efficiency because additional compressor input could offset the benefit obtained from further shortening the drying period.
Based on the comprehensive evaluation of drying efficiency, energy utilization, and quality characteristics, medium heat pump operation provided a favorable balance among the evaluated performance indicators within the tested operating range. The sensitivity analysis further showed that the preferred operating condition depended on the selected weighting scheme and normalization method. Therefore, the identified favorable condition should be regarded as a process recommendation under the present experimental framework rather than a universal optimum for all infrared–heat pump drying systems.
The present study was conducted under a laboratory-scale configuration with fixed infrared power-density setting, airflow velocity, loading condition, and initial material characteristics. The effects of interactions among infrared intensity, airflow velocity, loading density, initial moisture content, and heat pump capacity were not investigated. In addition, the proposed dynamic compressor-control strategy based on online mass loss and energy information requires further experimental validation. Future studies should evaluate broader operating conditions and pilot-scale systems to improve the scalability and practical application of hybrid infrared–heat pump drying technology for kelp and other high-moisture marine biomass materials.
Author Contributions
Conceptualization, H.Z. and Y.F.; methodology, H.Z.; validation, K.S.; investigation, K.S., H.Z. and Y.F.; resources, Y.F. and K.S.; data curation, H.Z.; writing—original draft preparation, H.Z.; writing—review and editing, Y.F., H.Z. and K.S.; visualization, Y.F.; supervision, Y.F.; funding acquisition, Y.F.; project administration, Y.F. All authors have read and agreed to the published version of the manuscript.
Funding
This work was financially supported by the Research Project of Liaoning Provincial Applied Basic Research Program Project (2025JH2/101330041) and the National Key R&D Program of China (2018YFD0400800).
Institutional Review Board Statement
Not applicable.
Informed Consent Statement
Not applicable.
Data Availability Statement
The data that support the findings of this study are available on request from the corresponding author. The data are not publicly available due to privacy or ethical restrictions.
Conflicts of Interest
The authors declare no conflicts of interest.
References
- Huang, D.; Yang, P.; Tang, X.; Luo, L.; Sunden, B. Application of Infrared Radiation in the Drying of Food Products. Trends Food Sci. Technol. 2021, 110, 765–777. [Google Scholar] [CrossRef] [Scilit]
- Delfiya, D.S.A.; Prashob, K.; Murali, S.; Alfiya, P.V.; Samuel, M.P.; Pandiselvam, R. Drying Kinetics of Food Materials in Infrared Radiation Drying: A Review. J. Food Process Eng. 2022, 45, e13810. [Google Scholar] [CrossRef] [Scilit]
- Obajemihi, O.I.; Cheng, J.-H.; Sun, D.-W. Novel Sequential and Simultaneous Infrared-Accelerated Drying Technologies for the Food Industry: Principles, Applications and Challenges. Crit. Rev. Food Sci. Nutr. 2023, 63, 1465–1482. [Google Scholar] [CrossRef] [Scilit] [PubMed]
- An, J.; Wicaksana, F.; Liu, P.; Woo, M.W. Optimizing Infrared Wavelengths in Food Drying: A Comprehensive Review of Standalone and Combined Techniques. Food Control 2025, 169, 110991. [Google Scholar] [CrossRef] [Scilit]
- Nowacka, M.; Matys, A.; Witrowa-Rajchert, D. Innovative Technologies for Improving the Sustainability of the Food Drying Industry. Curr. Food Sci. Technol. Rep. 2024, 2, 231–239. [Google Scholar] [CrossRef] [Scilit]
- Santos, A.A.d.L.; Leal, G.F.; Marques, M.R.; Cardoso Reis, L.; Junqueira, J.R.d.J.; Macedo, L.L.; Corrêa, J.L.G. Emerging Drying Technologies and Their Impact on Bioactive Compounds: A Systematic and Bibliometric Review. Appl. Sci. 2025, 15, 6653. [Google Scholar] [CrossRef] [Scilit]
- Teymori-Omran, M.; Askari Asli-Ardeh, E.; Taghinezhad, E.; Motevali, A.; Szumny, A.; Nowacka, M. Enhancing Energy Efficiency and Retention of Bioactive Compounds in Apple Drying: Comparative Analysis of Combined Hot Air–Infrared Drying Strategies. Appl. Sci. 2023, 13, 7612. [Google Scholar] [CrossRef] [Scilit]
- Taghinezhad, E.; Kaveh, M.; Szumny, A. Thermodynamic and Quality Performance Studies for Drying Kiwi in Hybrid Hot Air-Infrared Drying with Ultrasound Pretreatment. Appl. Sci. 2021, 11, 1297. [Google Scholar] [CrossRef] [Scilit]
- Skarżyńska, A.; Gondek, E.; Nowacka, M.; Wiktor, A. Pulsed Electric Fields as an Infrared–Convective Drying Pretreatment: Effect on Drying Course, Color, and Chemical Properties of Apple Tissue. Appl. Sci. 2025, 15, 2348. [Google Scholar] [CrossRef] [Scilit]
- Petković, M.; Lukyanov, A.; Đurović, I.; Miletić, N. A Novel Method for Analyzing the Kinetics of Convective/IR Bread Drying (CIRD) with Sensor Technology. Appl. Sci. 2025, 15, 4964. [Google Scholar] [CrossRef] [Scilit]
- Atmaca, M.; Büyükcan, M.B. Infrared Drying of Banana Slices: Quality Evaluation Using Spectral and Microstructural Analysis. Appl. Sci. 2025, 15, 9632. [Google Scholar] [CrossRef] [Scilit]
- Zhang, Q.; Li, S.; Zhang, M.; Mu, G.; Li, X.; Zhang, G.; Xiong, S. Heat Pump Drying of Kelp (Laminaria japonica): Drying Kinetics and Thermodynamic Properties. Processes 2022, 10, 514. [Google Scholar] [CrossRef] [Scilit]
- Zou, L.; Liu, Y.; Yu, M.; Yu, J. A review of solar assisted heat pump technology for drying applications. Energy 2023, 283, 129215. [Google Scholar] [CrossRef] [Scilit]
- Song, K.; Ji, X.; Zhang, H.; Lu, H.; Feng, Y.; Han, Q. CFD–FEM Coupled Thermal Response Analysis and MATLAB-Based Operating Condition Screening for Edible Kelp Infrared Drying. Processes 2026, 14, 1382. [Google Scholar] [CrossRef] [Scilit]
- Song, K.; Ji, X.; Sun, L.; Zhang, H.; Feng, Y. Design and Development of an Intelligent Kelp Drying System Based on 5G and Infrared Arrays. J. Food Process Eng. 2026, 49, e70515. [Google Scholar] [CrossRef] [Scilit]
- Suzuki, K.; Akiyama, R.; Llave, Y.; Matsumoto, T. Origin and Variety Identification of Dried Kelp Based on Fluorescence Fingerprinting and Machine Learning Approaches. Appl. Sci. 2025, 15, 1803. [Google Scholar] [CrossRef] [Scilit]
- Baek, S.; Cao, L.; Lee, H.; Lee, Y.; Lee, S. Effects of UV and Heating on the Stability of Fucoxanthin, Total Phlorotannin and Total Antioxidant Capacities in Saccharina japonica Ethanol Extract and Solvent Fractions. Appl. Sci. 2021, 11, 7831. [Google Scholar] [CrossRef] [Scilit]
- Li, B.; Zeng, Z.; Zhang, X.; Zhang, Y. Study on the Variable-Temperature Drying Process of Corn Drying in an Industrial Corn-Drying System Equipped with a Self-Adaptive Control Heat Exchanger. Appl. Sci. 2021, 11, 2772. [Google Scholar] [CrossRef] [Scilit]
- Szpicer, A.; Bińkowska, W.; Stelmasiak, A.; Zalewska, M.; Wojtasik-Kalinowska, I.; Piwowarski, K.; Piepiórka-Stepuk, J.; Półtorak, A. Computational Fluid Dynamics Simulation of Thermal Processes in Food Technology and Their Applications in the Food Industry. Appl. Sci. 2025, 15, 424. [Google Scholar] [CrossRef] [Scilit]
- Chang, K.; Li, J.; Jin, Y.; Liu, C. Development of Grain Dryer Control Technology from the Perspective of Low Carbon and Intelligentization. Appl. Sci. 2024, 14, 10587. [Google Scholar] [CrossRef] [Scilit]
- Zhang, W.; Cen, H.; Guo, W.; She, P. A Review of Alfalfa Drying Technology and Equipment Throughout the Whole Process. Appl. Sci. 2025, 15, 12268. [Google Scholar] [CrossRef] [Scilit]
- Aghbashlo, M.; Mobli, H.; Rafiee, S.; Madadlou, A. A review on exergy analysis of drying processes and systems. Renew. Sustain. Energy Rev. 2013, 22, 1–22. [Google Scholar] [CrossRef] [Scilit]
- Hanon, C.; Al Hassan, M.; Nassouh, S.; Abuabdou, S.; Van Engeland, C.; Debaste, F. Modeling and Experimental Analysis of Tofu-Drying Kinetics. Appl. Sci. 2025, 15, 10319. [Google Scholar] [CrossRef] [Scilit]
- Bogusz, R.; Nowacka, M.; Gondek, E.; Delman, M.; Szulc, K. Effect of Drying Method on Selected Physical and Functional Properties of Powdered Black Soldier Fly Larvae. Appl. Sci. 2025, 15, 4097. [Google Scholar] [CrossRef] [Scilit]
- Pacheco, D.; Miranda, G.; Rocha, C.P.; Pato, R.L.; Cotas, J.; Gonçalves, A.M.M.; Santos, S.A.O.; Bahcevandziev, K.; Pereira, L. Portuguese Kelps: Feedstock Assessment for the Food Industry. Appl. Sci. 2021, 11, 10681. [Google Scholar] [CrossRef] [Scilit]
- Cengiz, N.; Abdulvahitoğlu, A.; Abdulvahitoğlu, A. Comparative Analysis of Different Drying Methods on Strawberry Aroma Compounds via Multi-Criteria Decision-Making Techniques. Appl. Sci. 2025, 15, 815. [Google Scholar] [CrossRef] [Scilit]
- Tran, T.T.H.; Nguyen, T.T.D.; Kharaghani, A.; Le, K.H. The Impact of Ultrasound Pre-Treatment on Hot-Air-Drying Kinetics and Quality of Carrot Slices Assessed by Simulations and Experiments. Appl. Sci. 2023, 13, 11865. [Google Scholar] [CrossRef] [Scilit]
- Rashvand, M.; Nadimi, M.; Paliwal, J.; Zhang, H.; Feyissa, A.H. Effect of Pulsed Electric Field on the Drying Kinetics of Apple Slices during Vacuum-Assisted Microwave Drying: Experimental, Mathematical and Computational Intelligence Approaches. Appl. Sci. 2024, 14, 7861. [Google Scholar] [CrossRef] [Scilit]
- Bajoub, A.; Ennahli, N.; Ouaabou, R.; Chaji, S.; Hafida, H.; Soulaymani, A.; Idlimam, A.; Merah, O.; Lahlali, R.; Ennahli, S. Investigation into Solar Drying of Moroccan Strawberry Tree (Arbutus unedo L.) Fruit: Effects on Drying Kinetics and Phenolic Composition. Appl. Sci. 2023, 13, 769. [Google Scholar] [CrossRef] [Scilit]
- Andreou, V.; Ntafoulis, A.; Masouras, P.K.; Giannoglou, M.; Giannakourou, M.; Taoukis, P.; Katsaros, G. Effect of Pulsed Electric Fields on the Drying Process of Orange Peel Waste. Appl. Sci. 2025, 15, 13096. [Google Scholar] [CrossRef] [Scilit]
- Jedlińska, A.; Rybak, K.; Samborska, K.; Barańska-Dołomisiewicz, A.; Skarżyńska, A.; Trusińska, M.; Witrowa-Rajchert, D.; Nowacka, M. Hybrid Drying Method: Influence of Pre-Treatment and Process Conditions of Ultrasound-Assisted Drying on Apple Quality. Appl. Sci. 2025, 15, 5309. [Google Scholar] [CrossRef] [Scilit]
- Nowacka, M.; Dadan, M.; Tylewicz, U. Drying Technologies in Food Processing. Appl. Sci. 2023, 13, 10597. [Google Scholar] [CrossRef] [Scilit]
- Gazda, P.; Glibowski, P. Advanced Technologies in Food Processing—Development Perspective. Appl. Sci. 2024, 14, 3617. [Google Scholar] [CrossRef] [Scilit]
- Krajewska, A.; Dziki, D.; Sobota, A. From Apple By-Product to Shortbread Cookies: Drying Conditions and Their Impact on Product Quality. Appl. Sci. 2025, 15, 10667. [Google Scholar] [CrossRef] [Scilit]
- Ferreira, H.S.; Mouga, T.; Lourenço, S.; Matias, M.H.; Freitas, M.V.; Afonso, C.N. Assessing High-Value Bioproducts from Seaweed Biomass: A Comparative Study of Wild, Cultivated and Residual Pulp Sources. Appl. Sci. 2025, 15, 5745. [Google Scholar] [CrossRef] [Scilit]
- Augusto, A.; Lemos, M.F.L.; Silva, S.F.J. Exploring Marine-Based Food Production: The Challenges for a Sustainable and Fast Biotechnology-Based Development. Appl. Sci. 2024, 14, 8255. [Google Scholar] [CrossRef] [Scilit]
- Zartha Sossa, J.W.; Orozco, G.L.; García Murillo, L.M.; Peña Osorio, M.; Sánchez Suarez, N. Infrared Drying Trends Applied to Fruit. Front. Sustain. Food Syst. 2021, 5, 650690. [Google Scholar] [CrossRef] [Scilit]
- El-Mesery, H.S.; Hu, Z.; Ashiagbor, K.; Rostom, M. A Study into How Thickness, Infrared Intensity, and Airflow Affect Drying Kinetics, Modeling, Activation Energy, and Quality Attributes of Apple Slices Using Infrared Dryer. J. Food Sci. 2024, 89, 2895–2908. [Google Scholar] [CrossRef] [Scilit] [PubMed]
- El-Mesery, H.S.; Ashiagbor, K.; Hu, Z.; Alshaer, W.G. A Novel Infrared Drying Technique for Processing of Apple Slices: Drying Characteristics and Quality Attributes. Case Stud. Therm. Eng. 2023, 52, 103676. [Google Scholar] [CrossRef] [Scilit]
- El-Mesery, H.S.; Huang, H.; Hu, Z.; Kaveh, M.; Qenawy, M. Experimental Performance Analysis of an Infrared Heating System for Continuous Applications of Drying. Case Stud. Therm. Eng. 2024, 59, 104522. [Google Scholar] [CrossRef] [Scilit]
- Akhoundzadeh Yamchi, A.; Sharifian, F.; Khalife, E.; Kaveh, M. Drying Kinetic, Thermodynamic and Quality Analyses of Infrared Drying of Truffle Slices. J. Food Sci. 2024, 89, 3666–3686. [Google Scholar] [CrossRef] [Scilit] [PubMed]
- Zhang, G.; Yu, Y.; Yao, C.; Zhou, L.; Zhu, G.; Lai, Y.; Niu, P. Effect of Far-Infrared Drying on Broccoli Rhizomes: Drying Kinetics and Quality Evaluation. Processes 2024, 12, 1674. [Google Scholar] [CrossRef] [Scilit]
- Geng, Z.; Li, M.; Zhu, L.; Zhang, X.; Zhu, H.; Yang, X.; Yu, X.; Zhang, Q.; Hu, B. Design and Experiment of Combined Infrared and Hot-Air Dryer Based on Temperature and Humidity Control with Sea Buckthorn (Hippophae rhamnoides L.). Foods 2023, 12, 2299. [Google Scholar] [CrossRef] [Scilit] [PubMed]
- Huang, X.; Li, Y.; Zhou, X.; Wang, J.; Zhang, Q.; Yang, X.; Zhu, L.; Geng, Z. Prediction of Apple Slices Drying Kinetic during Infrared-Assisted-Hot Air Drying by Deep Neural Networks. Foods 2022, 11, 3486. [Google Scholar] [CrossRef] [Scilit] [PubMed]
- Zhang, J.; Zheng, X.; Xiao, H.; Li, Y.; Yang, T. Effect of Combined Infrared Hot Air Drying on Yam Slices: Drying Kinetics, Energy Consumption, Microstructure, and Nutrient Composition. Foods 2023, 12, 3048. [Google Scholar] [CrossRef] [Scilit] [PubMed]
- Pandiselvam, R.; Davison, S.; Manikantan, M.R.; Jeevarathinam, G.; Jacob, A.; Ramesh, S.V.; Shameena Beegum, P.P. Infra-red-Aided Hot-Air Drying of Coconut: Impact on Drying Kinetics and Quality Metrics. J. Food Process Eng. 2024, 47, e14668. [Google Scholar] [CrossRef] [Scilit]
- Jeevarathinam, G.; Pandiselvam, R.; Pandiarajan, T.; Preetha, P.; Krishnakumar, T.; Balakrishnan, M.; Thirupathi, V.; Ganapathy, S.; Amirtham, D. Design, Development, and Drying Kinetics of Infrared-Assisted Hot Air Dryer for Turmeric Slices. J. Food Process Eng. 2022, 45, e13876. [Google Scholar] [CrossRef] [Scilit]
- Zhang, Q.; Wan, F.; Yue, Y.; Zang, Z.; Xu, Y.; Jiang, C.; Shang, J.; Wang, T.; Huang, X. Study on Ultrasonic Far-Infrared Radiation Drying and Quality Characteristics of Wolfberry (Lycium barbarum L.) under Different Pretreatments. Molecules 2023, 28, 1732. [Google Scholar] [CrossRef] [Scilit] [PubMed]
- Shang, J.; Zhang, Q.; Wang, T.; Xu, Y.; Zang, Z.; Wan, F.; Yue, Y.; Huang, X. Effect of Ultrasonic Pretreatment on the Far-Infrared Drying Process and Quality Characteristics of Licorice. Foods 2023, 12, 2414. [Google Scholar] [CrossRef] [Scilit] [PubMed]
- El-Mesery, H.S.; ElMesiry, A.H.; Hu, Z.; Zhang, X.; Quaye, E.K. Modeling and Optimization of Infrared-Convection Drying Parameters and Slice Thickness of Onion Slices: Effects on Drying Kinetics and Physicochemical Quality. Food Sci. Nutr. 2025, 13, e70437. [Google Scholar] [CrossRef] [Scilit] [PubMed]
- Stan (Boldea), L.; Mocanu, G.-D.; Turturică, M.; Andronoiu, D.G.; Râpeanu, G.; Stănciuc, N. Potentially Functional Apple Snacks Infused in the Hibiscus sabdariffa Extract Obtained by Convective and Infrared Drying: Kinetics of Drying and Phytochemical Analysis. Food Sci. Nutr. 2025, 13, e70060. [Google Scholar] [CrossRef] [Scilit] [PubMed]
- Davari, O.; Rafati, A.; Nosrati, M. Comprehensive Modeling of Far-Infrared Drying Process for Rough Rice in a Combined FIR Dryer. Discov. Food 2024, 4, 87. [Google Scholar] [CrossRef] [Scilit]
- Jibril, A.N.; Zhang, X.; Wang, S.; Bello, Z.A.; Henry, I.I.; Chen, K. Far-Infrared Drying Influence on Machine Learning Algorithms in Improving Corn Drying Process with Graphene Irradiation Heating Plates. J. Food Process Eng. 2024, 47, e14603. [Google Scholar] [CrossRef] [Scilit]
- Özkan Karabacak, A.; Durgut Malçok, S.; Tunçkal, C.; Tamer, C.E. Hybrid Infrared and Heat Pump Drying Technology for Fruit-Based Nutritious Snack Production: Drying Kinetics and In Vitro Bioaccessibility of Phenolics and Antioxidant Capacity. J. Food Qual. 2025, 2025, 5830780. [Google Scholar] [CrossRef] [Scilit]
- Salehi, F. Recent Applications of Heat Pump Dryer for Drying of Fruit Crops: A Review. Int. J. Fruit Sci. 2021, 21, 546–555. [Google Scholar] [CrossRef] [Scilit]
- Sun, Z.; Chen, J.; Dai, T.; Wang, Y.; Liang, R.; Liu, W.; Liu, C.; Deng, L. Recent Advances in Heat Pump Drying System for the Food Industry: Structure, System Optimization, Applications, and Prospects. Compr. Rev. Food Sci. Food Saf. 2025, 24, e70238. [Google Scholar] [CrossRef] [Scilit] [PubMed]
- Zhu, L.; Ji, X.; Yang, H.; Cao, X.; Wang, W.; Liang, M.; Li, J.; Zhang, Q.; Yang, X.; Geng, Z. Heat Pump Technology in the Field of Fruit and Vegetable Drying: A Review. Foods 2025, 14, 2569. [Google Scholar] [CrossRef] [Scilit] [PubMed]
- Loemba, A.B.T.; Kichonge, B.; Kivevele, T. Comprehensive Assessment of Heat Pump Dryers for Drying Agricultural Products. Energy Sci. Eng. 2023, 11, 2985–3014. [Google Scholar] [CrossRef] [Scilit]
- Tang, Y.; Li, X.; Xu, P.; Yang, J.; Zhang, Z.; Wang, R.; Zhao, D.; Elgamal, R. Performance Evaluation of a Solar-Assisted Multistage Heat Pump Drying System Based on the Optimal Drying Conditions for Solanum lycopersicum L. Foods 2025, 14, 1195. [Google Scholar] [CrossRef] [Scilit] [PubMed]
- Rulazi, E.L.; Marwa, J.; Kichonge, B.; Kivevele, T.T. Techno-Economic Analysis of a Solar-Assisted Heat Pump Dryer for Drying Agricultural Products. Food Sci. Nutr. 2024, 12, 952–970. [Google Scholar] [CrossRef] [Scilit] [PubMed]
- Loemba, A.B.T.; Kichonge, B.; Kivevele, T. Thermal Performance and Technoeconomic Analysis of Solar-Assisted Heat Pump Dryer Integrated with Energy Storage Materials for Drying Cavendish Banana (Musa acuminata). J. Food Process. Preserv. 2024, 2024, 7496826. [Google Scholar] [CrossRef] [Scilit]
- Liu, H.; Yousaf, K.; Yu, Z.; Riaz, A.; Nyalala, I.; Chattha, M.W.A.; Chen, K. Drying Process Optimization of Garlic Slices in Closed-Loop Heat Pump Drying System by Box-Behnken Design. J. Food Process. Preserv. 2022, 46, e16190. [Google Scholar] [CrossRef] [Scilit]
- Wu, L.; Chen, S.; Li, Y.; Xie, W.; Tang, B. Effect of Heat Pump Drying Temperature on Moisture Migration Characteristics and Quality of Instant Tremella fuciformis. Curr. Res. Food Sci. 2024, 9, 100825. [Google Scholar] [CrossRef] [Scilit] [PubMed]
- Yao, Y.; Lu, Z.; Gong, Y.; Guo, S.; Xiao, C.; Hu, W. Drying Characteristics of a Combined Drying System of Low-Pressure Superheated Steam and Heat Pump. Processes 2022, 10, 1402. [Google Scholar] [CrossRef] [Scilit]
- Vu, N.D.; Tran, N.T.Y.; Le, T.D.; Phan, N.T.M.; Doan, P.L.A.; Huynh, L.B.; Dao, P.T. Kinetic Model of Moisture Loss and Polyphenol Degradation during Heat Pump Drying of Soursop Fruit (Annona muricata L.). Processes 2022, 10, 2082. [Google Scholar] [CrossRef] [Scilit]
- Kang, H.; Zhang, G.; Mu, G.; Zhao, C.; Huang, H.; Kang, C.; Li, X.; Zhang, Q. Design of a Greenhouse Solar-Assisted Heat Pump Dryer for Kelp (Laminaria japonica): System Performance and Drying Kinetics. Foods 2022, 11, 3509. [Google Scholar] [CrossRef] [Scilit] [PubMed]
- Walker, C.; Sheehan, M. Drying Kinetics of Macroalgae as a Function of Drying Gas Velocity and Material Bulk Density, Including Shrinkage. Clean Technol. 2022, 4, 669–689. [Google Scholar] [CrossRef] [Scilit]
- Paramasivam, S.; Yoha, K.S.; Moses, J.A. Drying of Seaweed: Approaches, Challenges and Research Needs. Trends Food Sci. Technol. 2023, 138, 153–163. [Google Scholar] [CrossRef] [Scilit]
- Sparvath, J.S.; Cardoso, A.L.; Rustad, T.; Ziemer, N.; Hansen, L.T. Effect of Pre-Drying Storage and Drying Method on the Quality of Dried Kelp. Food Res. Int. 2025, 221, 117568. [Google Scholar] [CrossRef] [Scilit] [PubMed]
- Wang, R.; Han, F.; Wang, G.; Liu, X.; Wang, Y.; Zhang, Y.; Wu, W. Non-Monotonic Regulation of Kelp Quality by Relative Humidity during Hot-Air Drying: Cascade Effects Linking Moisture Migration–Microstructure–Macroscopic Quality. LWT 2025, 237, 118660. [Google Scholar] [CrossRef] [Scilit]
- Khan, N.; Sudhakar, K.; Mamat, R. Seaweed Processing: Efficiency, Kinetics, and Quality Attributes under Solar Drying. Food Chem. Adv. 2025, 6, 100859. [Google Scholar] [CrossRef] [Scilit]
- Khasiya, K.; Jasani, S.; Markam, B.K.; Veeragurunathan, V.; Prasad, K.; Maiti, S. Feasibility of the Mixed-Mode Solar Dryer for Sustainable Seaweed Drying. ACS Sustain. Resour. Manag. 2025, 2, 2314–2326. [Google Scholar] [CrossRef] [Scilit]
- Wu, W.; Li, H.; Chen, Y.; Luo, Y.; Zeng, J.; Huang, J.; Gao, T. Recent Advances in Drying Processing Technologies for Aquatic Products. Processes 2024, 12, 942. [Google Scholar] [CrossRef] [Scilit]
- Zhao, H.; Dai, J.; Wu, K. Simulation of Coupled Heat-Mass Transfer in Sea Cucumbers with Heat Pump Drying. Appl. Sci. 2022, 12, 5508. [Google Scholar] [CrossRef] [Scilit]
- Musielak, G.; Mieszczakowska-Frąc, M.; Mierzwa, D. Convective Drying of Apple Enhanced with Microwaves and Ultrasound—Process Kinetics, Energy Consumption, and Product Quality Approach. Appl. Sci. 2024, 14, 994. [Google Scholar] [CrossRef] [Scilit]
- Tulej, W.; Głowacki, S. Modeling of the Drying Process of Apple Pomace. Appl. Sci. 2022, 12, 1434. [Google Scholar] [CrossRef] [Scilit]
- Barańska, A.; Jedlińska, A.; Wołosiak, R.; Witrowa-Rajchert, D.; Derewiaka, D. Volatile and Antioxidant Compounds of Beetroot Powder Obtained by Dehumidified Air Spray Drying of Cloudy Juice. Appl. Sci. 2024, 14, 7316. [Google Scholar] [CrossRef] [Scilit]
- Piecko, J.; Mieszczakowska-Frąc, M.; Celejewska, K.; Dickinson, N.; Szwejda-Grzybowska, J. Effect of Ultrasound-Assisted Convective Drying on the Content of Bioactive Compounds and Drying Rate of Strawberry Slices. Appl. Sci. 2025, 15, 8947. [Google Scholar] [CrossRef] [Scilit]
- Chaiareekitwat, S.; Nagle, M.; Mahayothee, B.; Khuwijitjaru, P.; Rungpichayapichet, P.; Latif, S.; Müller, J. Drying Behavior and Effect of Drying Temperatures on Cyanide, Bioactive Compounds, and Quality of Dried Cassava Leaves. Appl. Sci. 2025, 15, 2680. [Google Scholar] [CrossRef] [Scilit]
- Wu, L.; Qi, J.; Sun, L.; Li, S.; Wang, Q.; Feng, H. Design of and Experimental Study on Drying Equipment for Fritillaria ussuriensis. Appl. Sci. 2025, 15, 8427. [Google Scholar] [CrossRef] [Scilit]
- Peñuela-Martínez, A.E.; Hower-García, I.P.; Guerrero, A.; Agudelo-Laverde, L.M.; Betancourt-Rodríguez, H.; Martínez-Giraldo, J. Physical, Sensorial, and Physicochemical Characteristics of Arabica Coffee Dried under Two Solar Brightness Conditions. Processes 2023, 11, 3016. [Google Scholar] [CrossRef] [Scilit]
- Amer, B.M.A.; Azam, M.M.; Saad, A. Monitoring Temperature Profile and Drying Kinetics of Thin-Layer Banana Slices under Controlled Forced Convection Conditions. Processes 2023, 11, 1771. [Google Scholar] [CrossRef] [Scilit]
- Jayasuriya, H.; Pathare, P.B.; Al-Attabi, Z.; Al-Hamdani, A. Drying Kinetics and Quality Analysis of Coriander Leaves Dried in an Indirect, Stand-Alone Solar Dryer. Processes 2023, 11, 1596. [Google Scholar] [CrossRef] [Scilit]
- Turan, B.; Tekin-Cakmak, Z.H.; Çakmakoglu, S.K.; Karasu, S.; Kasapoglu, M.Z.; Avci, E. Effect of Different Drying Techniques on Total Bioactive Compounds and Individual Phenolic Composition in Goji Berries. Processes 2023, 11, 754. [Google Scholar] [CrossRef] [Scilit]
- Hossain, M.A.; Shaha, L.C.; Romen, T.I.; Sarkar, A.; Biswas, R.; Ahmed, S.; Islam, M.A.; Muntasir, F.; Patwary, M.A.; Morais, R.M.S.C.; et al. Synergistic Effect of Ultrasound and Osmotic Pretreatment on the Drying Kinetics and Antioxidant Properties of Satkara (Citrus macroptera): A Novel Preservation Strategy. Processes 2025, 13, 384. [Google Scholar] [CrossRef] [Scilit]
- Kraiem, A.; Madiouli, J.; Shigidi, I.; Sghaier, J. Experimental Analysis of Drying Conditions’ Effect on the Drying Kinetics and Moisture Desorption Isotherms at Several Temperatures on Food Materials: Corn Case Study. Processes 2023, 11, 184. [Google Scholar] [CrossRef] [Scilit]
- Yang, Q.; Yi, X.; Xiao, H.; Wang, X.; Liu, L.; Tang, Z.; Hu, C.; Li, X. Effects of Different Drying Methods on Drying Characteristics, Microstructure, Quality, and Energy Consumption of Apricot Slices. Foods 2024, 13, 1295. [Google Scholar] [CrossRef] [Scilit] [PubMed]
- Xiao, A.; Ding, C. Effect of Electrohydrodynamic (EHD) on Drying Kinetics and Quality Characteristics of Shiitake Mushroom. Foods 2022, 11, 1303. [Google Scholar] [CrossRef] [Scilit] [PubMed]
- Jiang, D.; Li, C.; Zheng, Z. Study on Drying Control Strategy of White Radish Slice Based on Monitoring Medium Relative Humidity. Foods 2022, 11, 1197. [Google Scholar] [CrossRef] [Scilit] [PubMed]
- Kian-Pour, N. Effect of Biopolymer Dip-Coating Pretreatments as a Non-Thermal Green Technology on Physicochemical Characteristics, Drying, and Rehydration Kinetics of Santa Maria Pears. Foods 2023, 12, 2466. [Google Scholar] [CrossRef] [Scilit] [PubMed]
- Zhang, J.; Zheng, X.; Xiao, H.; Shan, C.; Li, Y.; Yang, T. Quality and Process Optimization of Infrared Combined Hot Air Drying of Yam Slices Based on BP Neural Network and Gray Wolf Algorithm. Foods 2024, 13, 434. [Google Scholar] [CrossRef] [Scilit] [PubMed]
- Bai, J.-W.; Li, D.-D.; Abulaiti, R.; Wang, M.; Wu, X.; Feng, Z.; Zhu, Y.; Cai, J. Cold Plasma as a Novel Pretreatment to Improve the Drying Kinetics and Quality of Green Peas. Foods 2025, 14, 84. [Google Scholar] [CrossRef] [Scilit] [PubMed]
- Zhao, Y.; Yu, F. Efficient Production of High-Quality Infrared-Assisted Spouted Bed-Dried Areca Taro Based on the Drying Temperature and Cutting Size Control. Foods 2024, 13, 260. [Google Scholar] [CrossRef] [Scilit] [PubMed]
- Xu, H.; Wu, M.; Wang, Y.; Wei, W.; Sun, D.; Li, D.; Zheng, Z.; Gao, F. Effect of Combined Infrared and Hot Air Drying Strategies on the Quality of Chrysanthemum (Chrysanthemum morifolium Ramat.) Cakes: Drying Behavior, Aroma Profiles and Phenolic Compounds. Foods 2022, 11, 2240. [Google Scholar] [CrossRef] [Scilit] [PubMed]
- Sikiru, Y.; Paliwal, J.; Erkinbaev, C. Three-Dimensional Characterization of Potatoes Under Different Drying Methods: Quality Optimization for Hybrid Drying Approach. Foods 2024, 13, 3633. [Google Scholar] [CrossRef] [Scilit] [PubMed]
- Anumudu, C.K.; Onyeaka, H.; Ekwueme, C.T.; Hart, A.; Isaac-Bamgboye, F.; Miri, T. Advances in the Application of Infrared in Food Processing for Improved Food Quality and Microbial Inactivation. Foods 2024, 13, 4001. [Google Scholar] [CrossRef] [Scilit] [PubMed]
- Paul, A.; Martynenko, A. The Effect of Material Thickness, Load Density, External Airflow, and Relative Humidity on the Drying Efficiency and Quality of EHD-Dried Apples. Foods 2022, 11, 2765. [Google Scholar] [CrossRef] [Scilit] [PubMed]
- Zheng, Z.; Wang, S.; Zhang, C.; Wu, M.; Cui, D.; Fu, X.; Gao, L.; Li, A.; Wei, Q.; Liu, Z. Hot Air Impingement Drying Enhanced Drying Characteristics and Quality Attributes of Ophiopogonis Radix. Foods 2023, 12, 1441. [Google Scholar] [CrossRef] [Scilit] [PubMed]
- Fikry, M.; Benjakul, S.; Al-Ghamdi, S.; Tagrida, M.; Prodpran, T. Evaluating Kinetics of Convection Drying and Microstructure Characteristics of Asian Seabass Fish Skin without and with Ultrasound Pretreatment. Foods 2023, 12, 3024. [Google Scholar] [CrossRef] [Scilit] [PubMed]
- Lin, Y.; Gao, Y.; Li, A.; Wang, L.; Ai, Z.; Xiao, H.; Li, J.; Li, X. Improvement of Pacific White Shrimp (Litopenaeus vannamei) Drying Characteristics and Quality Attributes by a Combination of Salting Pretreatment and Microwave. Foods 2022, 11, 2066. [Google Scholar] [CrossRef] [Scilit] [PubMed]
- Fernando, A.J.; Rosentrater, K.A. Optimal Designs of Air Source Heat Pump Dryers in Agro-Food Processing Industry. Food Eng. Rev. 2023, 15, 261–275. [Google Scholar] [CrossRef] [Scilit]
- Abbaspour-Gilandeh, Y.; Kaveh, M.; Fatemi, H.; Aziz, M. Combined Hot Air, Microwave, and Infrared Drying of Hawthorn Fruit: Effects of Ultrasonic Pretreatment on Drying Time, Energy, Qualitative, and Bioactive Compounds’ Properties. Foods 2021, 10, 1006. [Google Scholar] [CrossRef] [Scilit] [PubMed]
- Dajbych, O.; Kabutey, A.; Mizera, Č.; Herák, D. Investigation of the Effects of Infrared and Hot Air Oven Drying Methods on Drying Behaviour and Colour Parameters of Red Delicious Apple Slices. Processes 2023, 11, 3027. [Google Scholar] [CrossRef] [Scilit]
- Selvi, K.Ç.; Alkhaled, A.Y.; Yıldız, T. Application of Artificial Neural Network for Predicting the Drying Kinetics and Chemical Attributes of Linden (Tilia platyphyllos Scop.) during the Infrared Drying Process. Processes 2022, 10, 2069. [Google Scholar] [CrossRef] [Scilit]
- Chang, A.; Zheng, X.; Xiao, H.; Yao, X.; Liu, D.; Li, X.; Li, Y. Short- and Medium-Wave Infrared Drying of Cantaloupe (Cucumis melon L.) Slices: Drying Kinetics and Process Parameter Optimization. Processes 2022, 10, 114. [Google Scholar] [CrossRef] [Scilit]
- Joudi-Sarighayeh, F.; Abbaspour-Gilandeh, Y.; Kaveh, M.; Szymanek, M.; Kulig, R. Response Surface Methodology Approach for Predicting Convective/Infrared Drying, Quality, Bioactive and Vitamin C Characteristics of Pumpkin Slices. Foods 2023, 12, 1114. [Google Scholar] [CrossRef] [Scilit] [PubMed]
- Özkan Karabacak, A.; Çalışkan Koç, G.; Adal, S.; Süfer, Ö.; Tonay, A.N.; Delikanlı Kıyak, B.; Çelebi, Y.; İnan-Çınkır, N. A Review of Emerging Technologies on the Rehydration Behavior of Foodstuffs. J. Food Process Eng. 2025, 48, e70031. [Google Scholar] [CrossRef] [Scilit]
- Kaleta, A.; Górnicki, K.; Obranović, M.; Kosiorek, K. Some Aspects of the Modelling of Dried Red Beets Rehydration Process. Appl. Sci. 2024, 14, 1016. [Google Scholar] [CrossRef] [Scilit]
- Ying, T.; Spang, E.S. Paddy Drying Technologies: A Review of Existing Literature on Energy Consumption. Processes 2024, 12, 532. [Google Scholar] [CrossRef] [Scilit]
- Wang, X.; Song, Z.; Ding, C. Study on the Effect of Ultrasonic and Cold Plasma Non-Thermal Pretreatment Combined with Hot Air on the Drying Characteristics and Quality of Yams. Foods 2025, 14, 2831. [Google Scholar] [CrossRef] [Scilit] [PubMed]
- Hu, X.; Zhang, B.; Du, X.; Zhang, H.; Zhu, T.; Zhang, S.; Yang, X.; Zhang, Z.; Yang, T.; Wang, X.; et al. Recent Advances and Future Perspectives on Heat and Mass Transfer Mechanisms Enhanced by Preformed Porous Media in Vacuum Freeze-Drying of Agricultural and Food Products. Foods 2025, 14, 2966. [Google Scholar] [CrossRef] [Scilit] [PubMed]
- Suo, K.; Feng, Y.; Zhang, Y.; Yang, Z.; Zhou, C.; Chen, W.; Shi, L.; Yan, C. Comparative Evaluation of Quality Attributes of the Dried Cherry Blossom Subjected to Different Drying Techniques. Foods 2024, 13, 104. [Google Scholar] [CrossRef] [Scilit] [PubMed]
- Vega-Galvez, A.; Gomez-Perez, L.S.; Ah-Hen, K.S.; Zepeda, F.; García-Segovia, P.; Bilbao-Sainz, C.; Mejías, N.; Pasten, A. Convective Hot Air Drying of Red Cabbage (Brassica oleracea var. Capitata Rubra): Mathematical Modeling, Energy Consumption and Microstructure. Processes 2024, 12, 509. [Google Scholar] [CrossRef] [Scilit]
- Song, J.; Zhang, P.; ElGamal, R.; ElMasry, G.; Kishk, S.; Peng, J.; Liu, C.; Wang, L. Study on Optimal Operation of Heat Pump Drying System Throughout the Entire Drying Process Based on the Material Drying Characteristics. Processes 2025, 13, 3883. [Google Scholar] [CrossRef] [Scilit]
- Myhan, R.; Markowski, M. Generalized Mathematical Model of the Grain Drying Process. Processes 2022, 10, 2749. [Google Scholar] [CrossRef] [Scilit]
- Zhang, X.; Li, M.; Zhu, L.; Geng, Z.; Liu, X.; Cheng, Z.; Zhao, M.; Zhang, Q.; Yang, X. Sea Buckthorn Pretreatment, Drying, and Processing of High-Quality Products: Current Status and Trends. Foods 2023, 12, 4255. [Google Scholar] [CrossRef] [Scilit] [PubMed]
- Duque-Dussán, E.; Figueroa-Varela, P.A.; Cruz-Ospina, V.; Banout, J. Advances in Coffee Drying: A Comprehensive Review of Traditional, Solar, Mechanical, Hybrid, and Emerging Methods. Foods 2026, 15, 1737. [Google Scholar] [CrossRef] [Scilit] [PubMed]
- Yan, Y.; Ding, T.; Wang, J.; Chen, X.; Xu, J. Research Progress Regarding Heat and Mass Transfer Characteristics of Agricultural Products Under Different Drying Methods, and Associated Applications: A Review. Foods 2026, 15, 2530. [Google Scholar] [CrossRef] [Scilit] [PubMed]
- Yu, P.; Zhu, W.; Shen, C.; Qiao, Y.; Zhang, W.; Zhu, Y.; Gong, J.; Cai, J. Current Status of Grain Drying Technology and Equipment Development: A Review. Foods 2025, 14, 2426. [Google Scholar] [CrossRef] [Scilit] [PubMed]
- Feng, Z.; Zhang, M.; Guo, L.; Shao, R.; Wang, X.; Liu, F. Effect of Direct-Contact Ultrasonic and Far Infrared Combined Drying on the Drying Characteristics and Quality of Ginger. Processes 2024, 12, 98. [Google Scholar] [CrossRef] [Scilit]
- Fernandez-Rosillo, F.; Sánchez-Goycochea, N.A.; Santa Cruz-López, C.; Cabrejos-Barrios, E.M.; Caucha-Iparraguirre, J.; Garcia-Carrión, F.; Quiñones-Huatangari, L. Effect of Temperature on the Drying Kinetics of Caturra Coffee: Correlation with Hyperspectral Imaging and Sensory Quality. Foods 2026, 15, 1284. [Google Scholar] [CrossRef] [Scilit] [PubMed]
- Duque-Dussán, E. Coffee Drying as a Catalytic Gas–Solid Dehydration Analogy: A Desiccant-Assisted Theoretical Framework. ChemEngineering 2025, 9, 112. [Google Scholar] [CrossRef] [Scilit]
- Zhu, X.; Zhang, Z.; Hinds, L.M.; Sun, D.-W.; Tiwari, B.K. Applications of Ultrasound to Enhance Fluidized Bed Drying of Ascophyllum nodosum: Drying Kinetics and Product Quality Assessment. Ultrason. Sonochem. 2021, 70, 105298. [Google Scholar] [CrossRef] [Scilit] [PubMed]
- Sánchez-García, J.; Muñoz-Pina, S.; García-Hernández, J.; Heredia, A.; Andrés, A. Fermented Quinoa Flour: Implications of Fungal Solid-State Bioprocessing and Drying on Nutritional and Antioxidant Properties. LWT 2023, 182, 114885. [Google Scholar] [CrossRef] [Scilit]
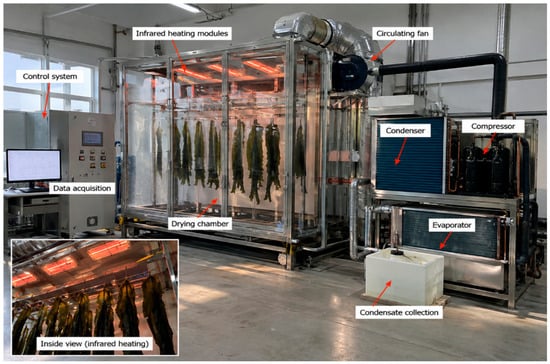
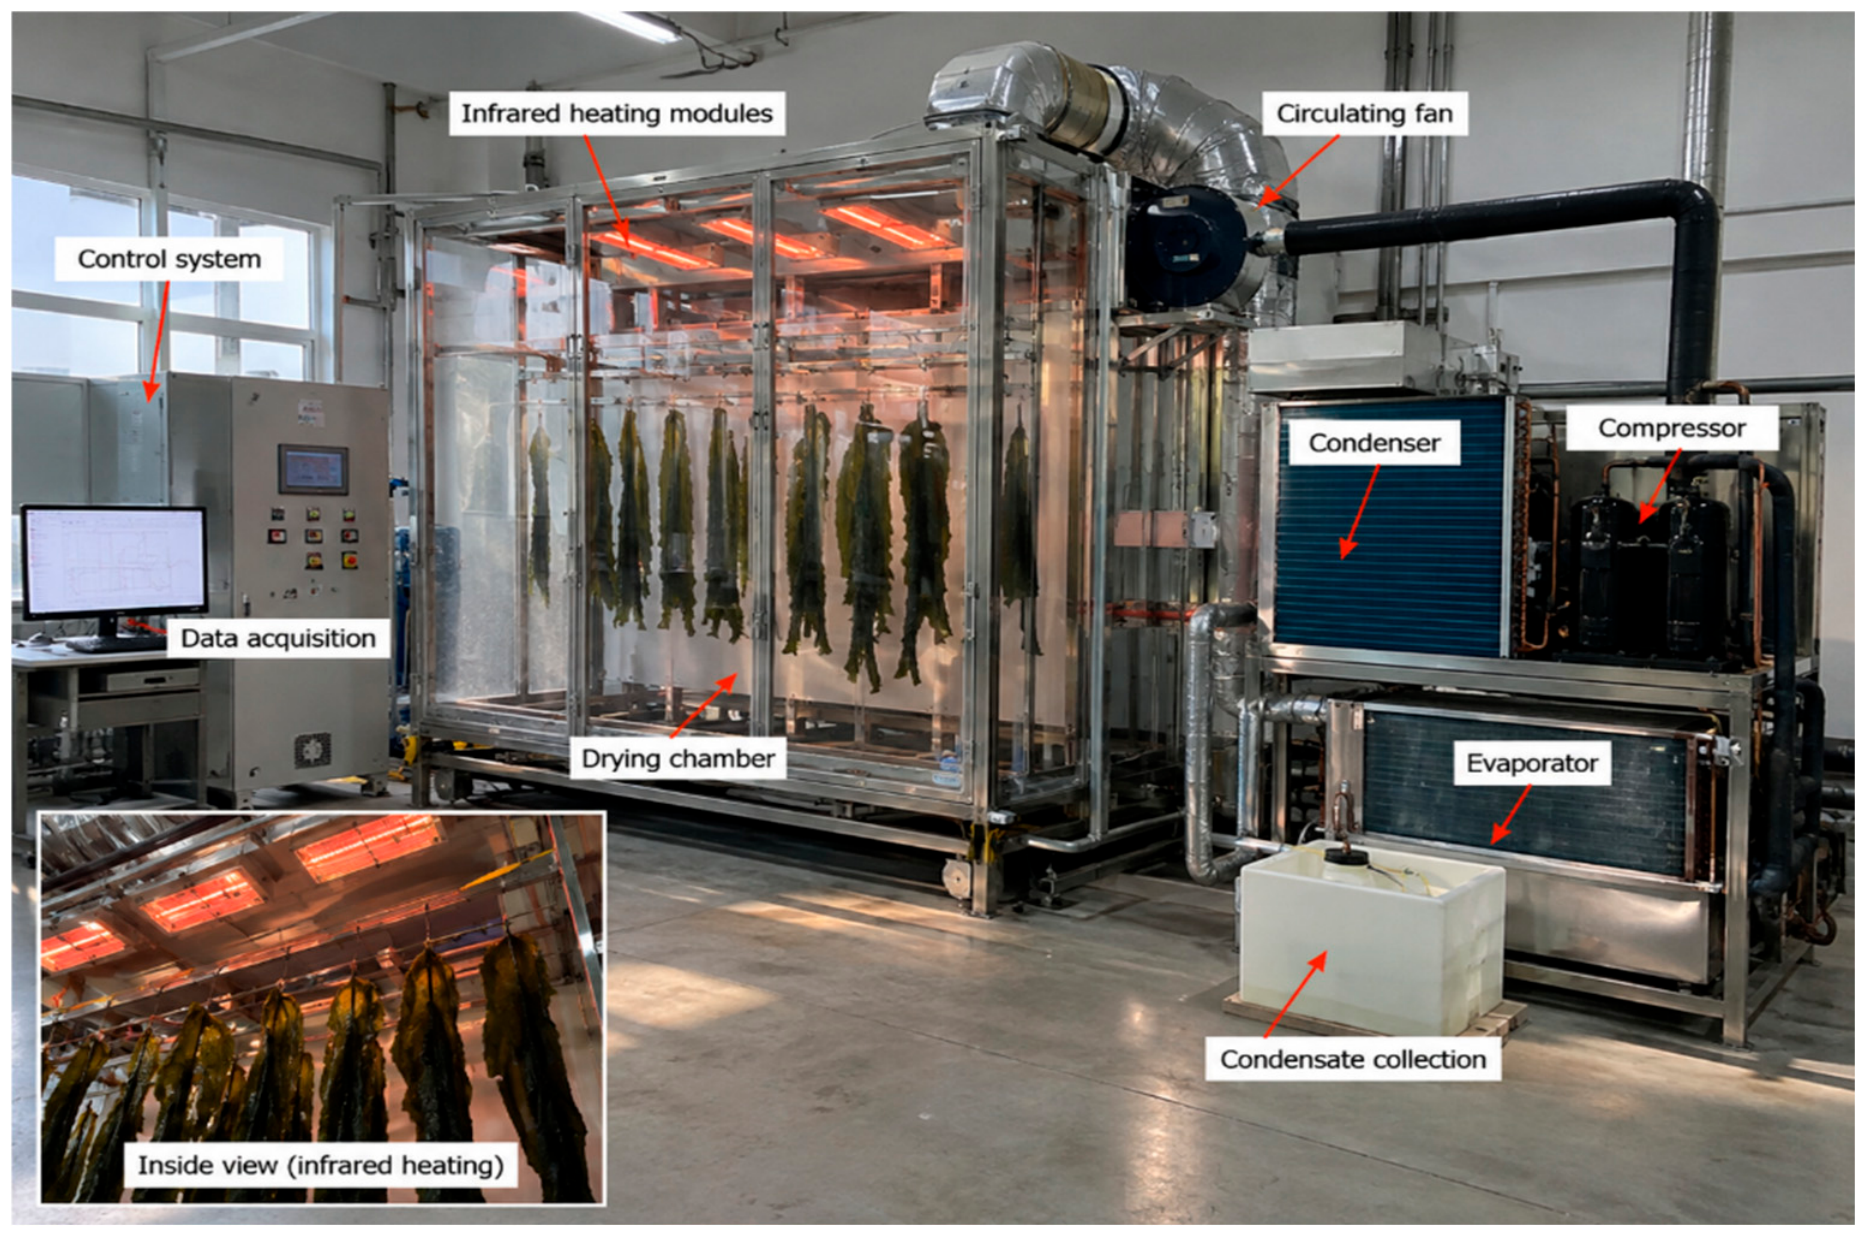
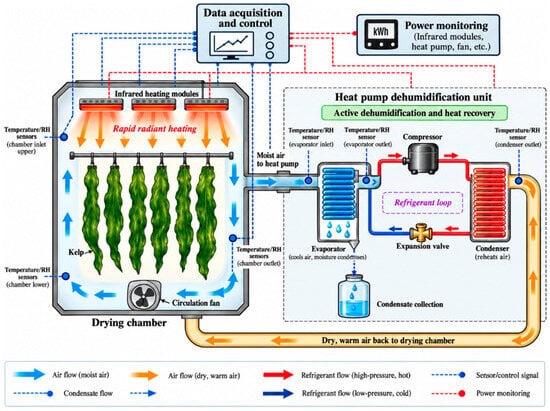
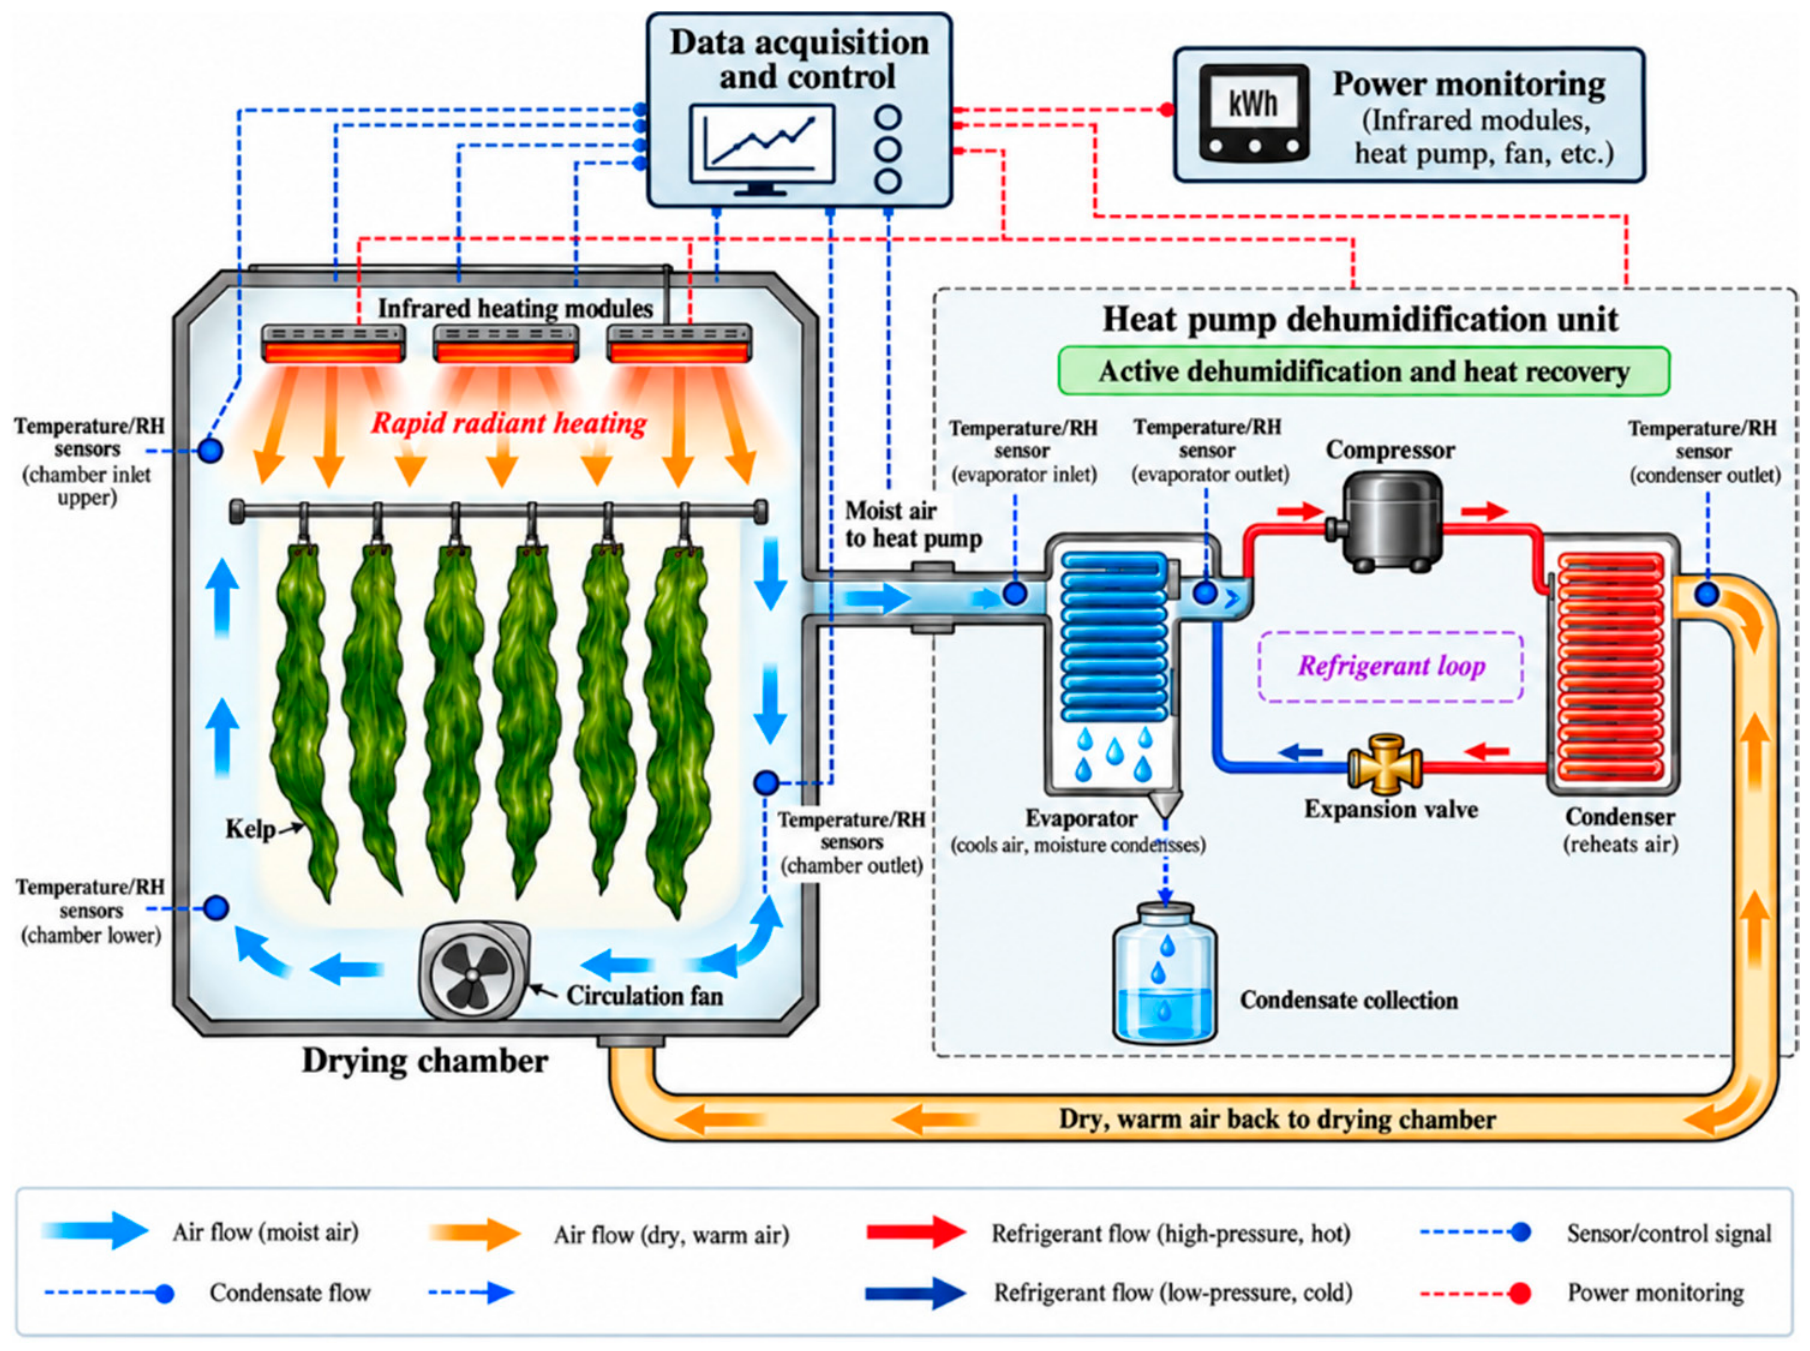
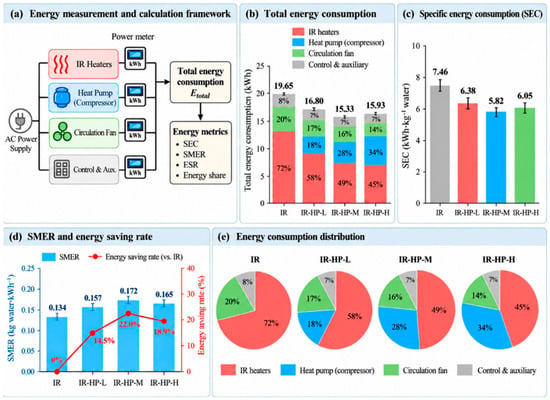
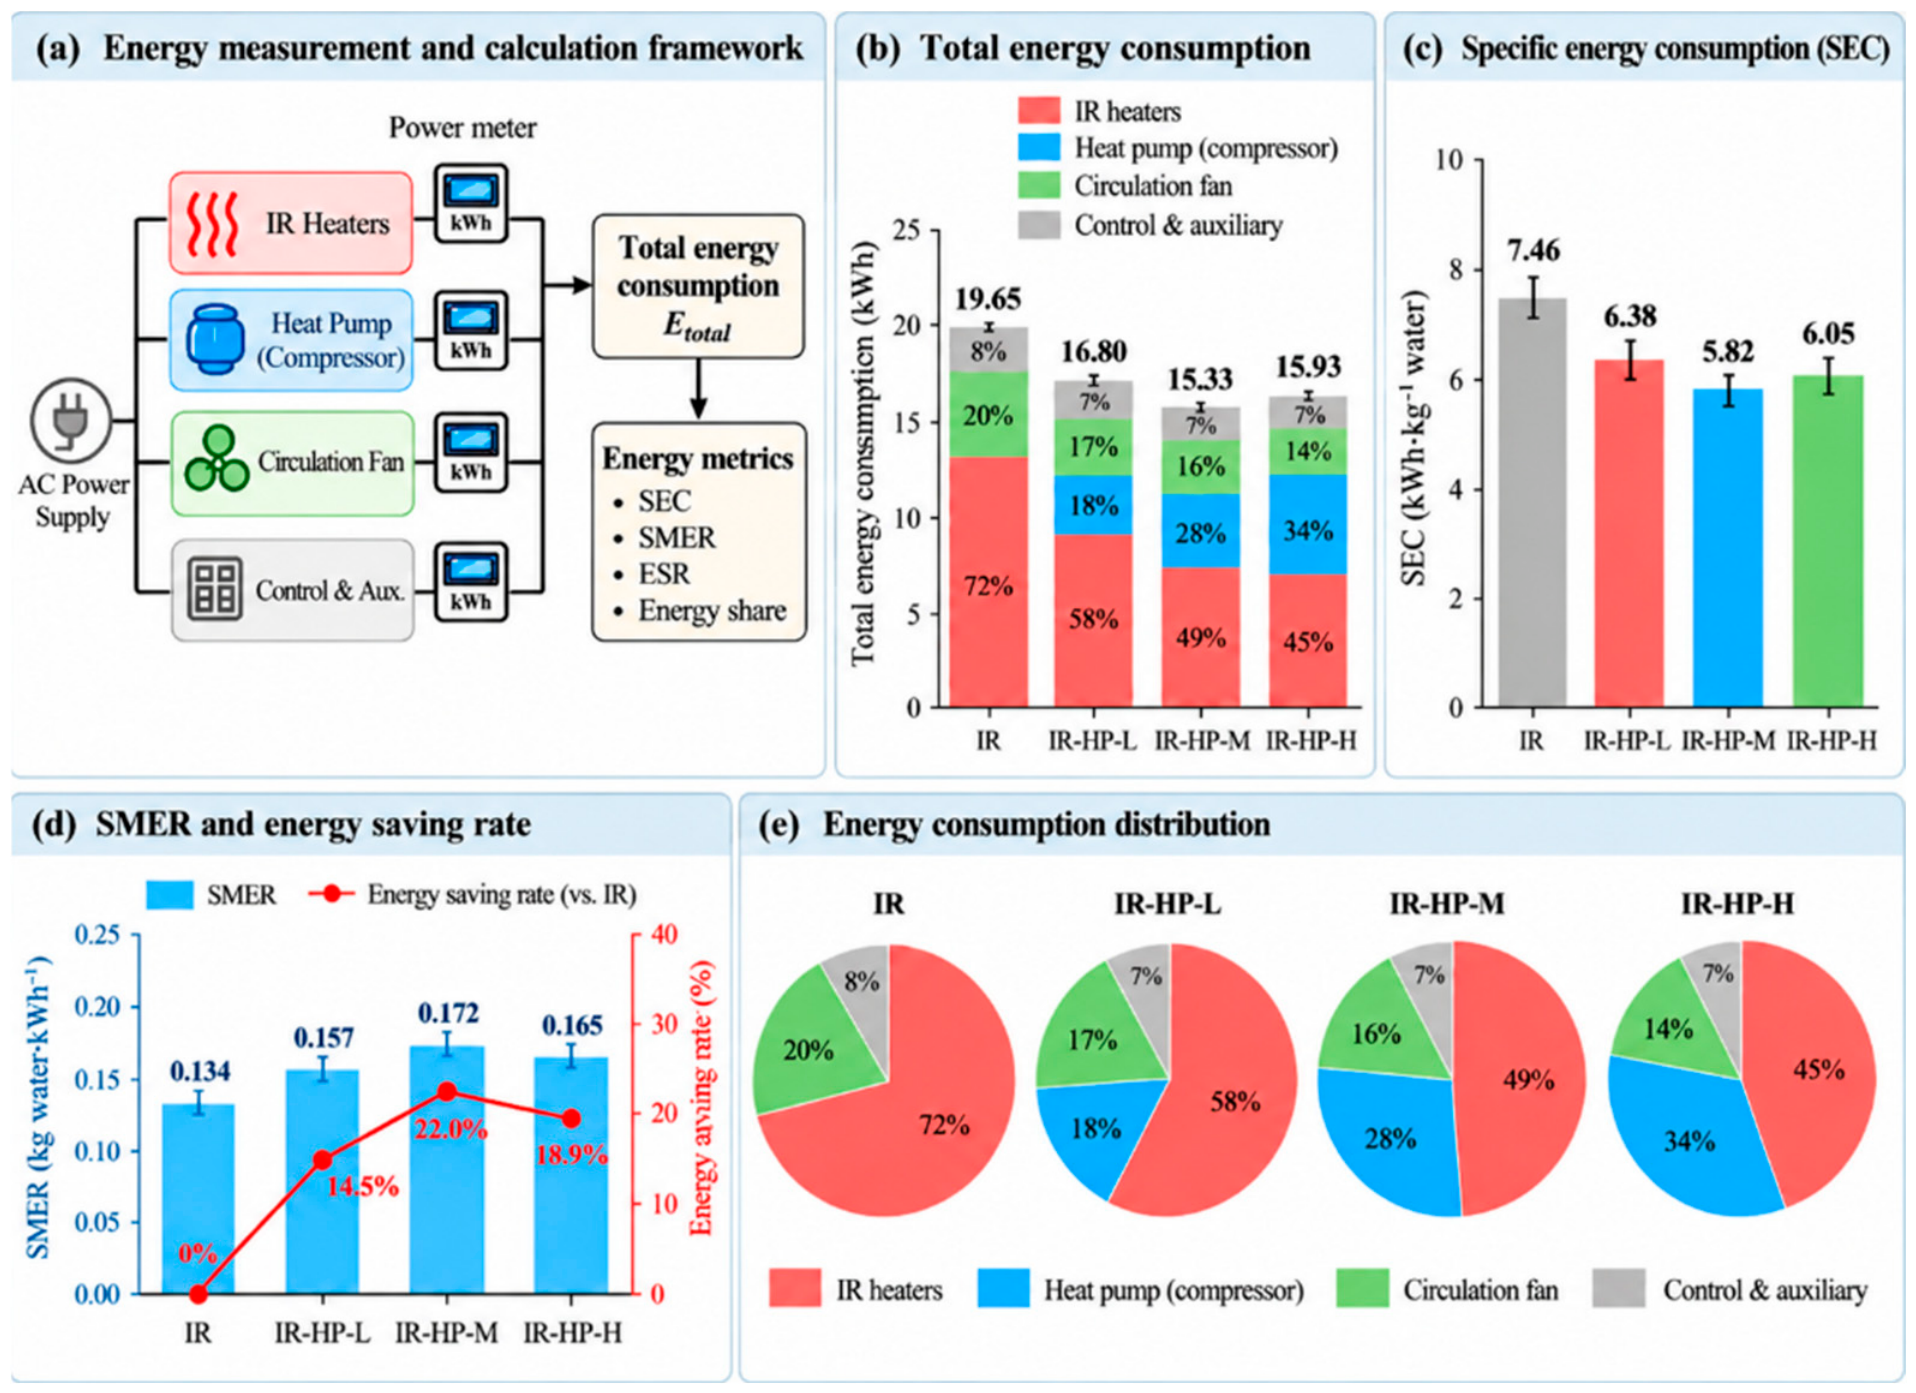
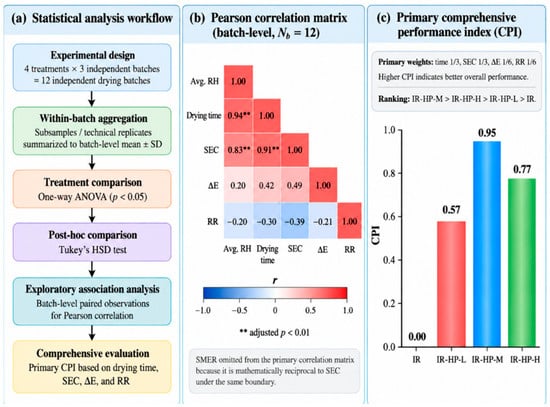
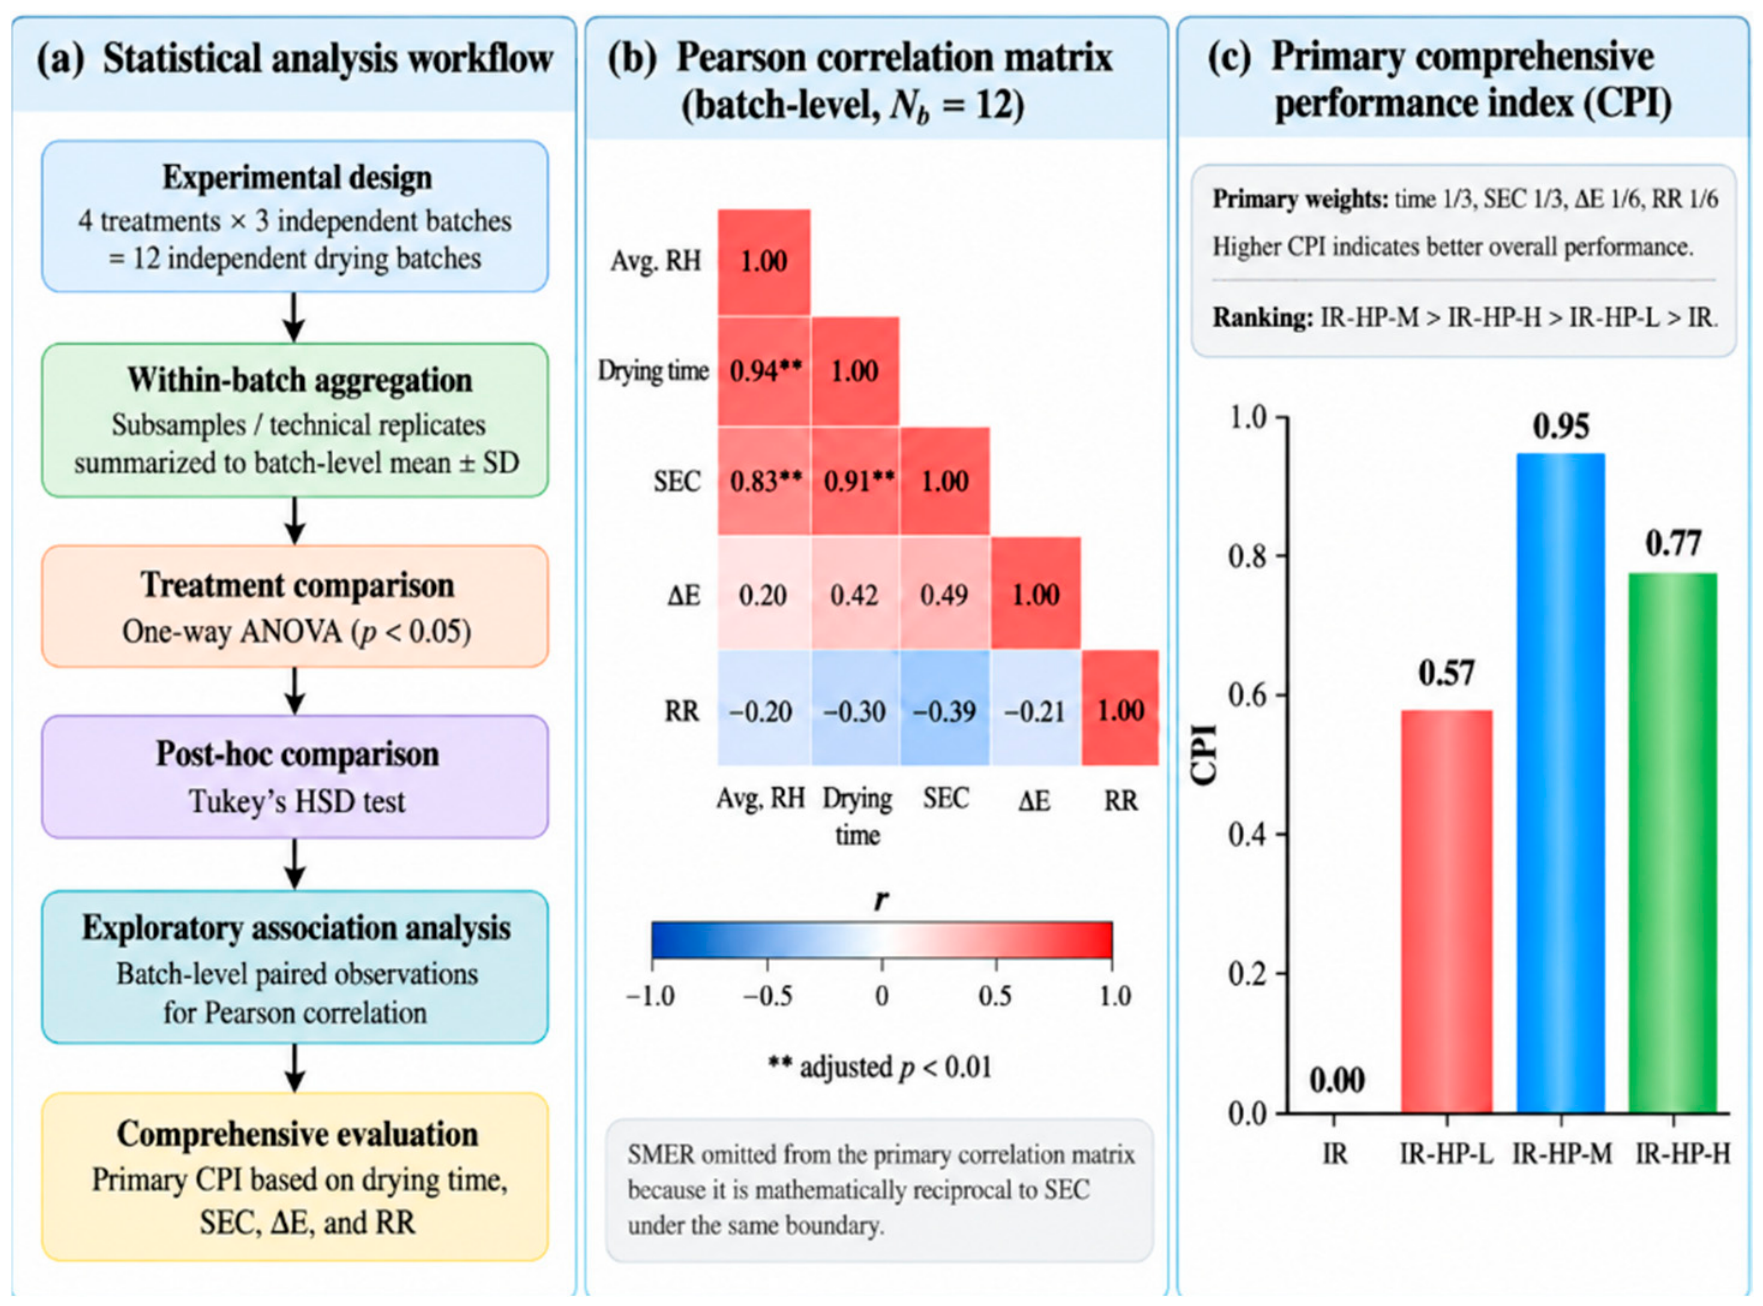
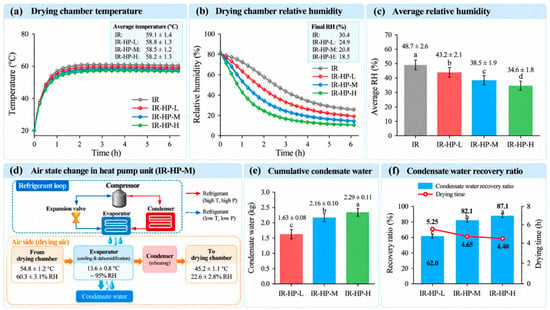
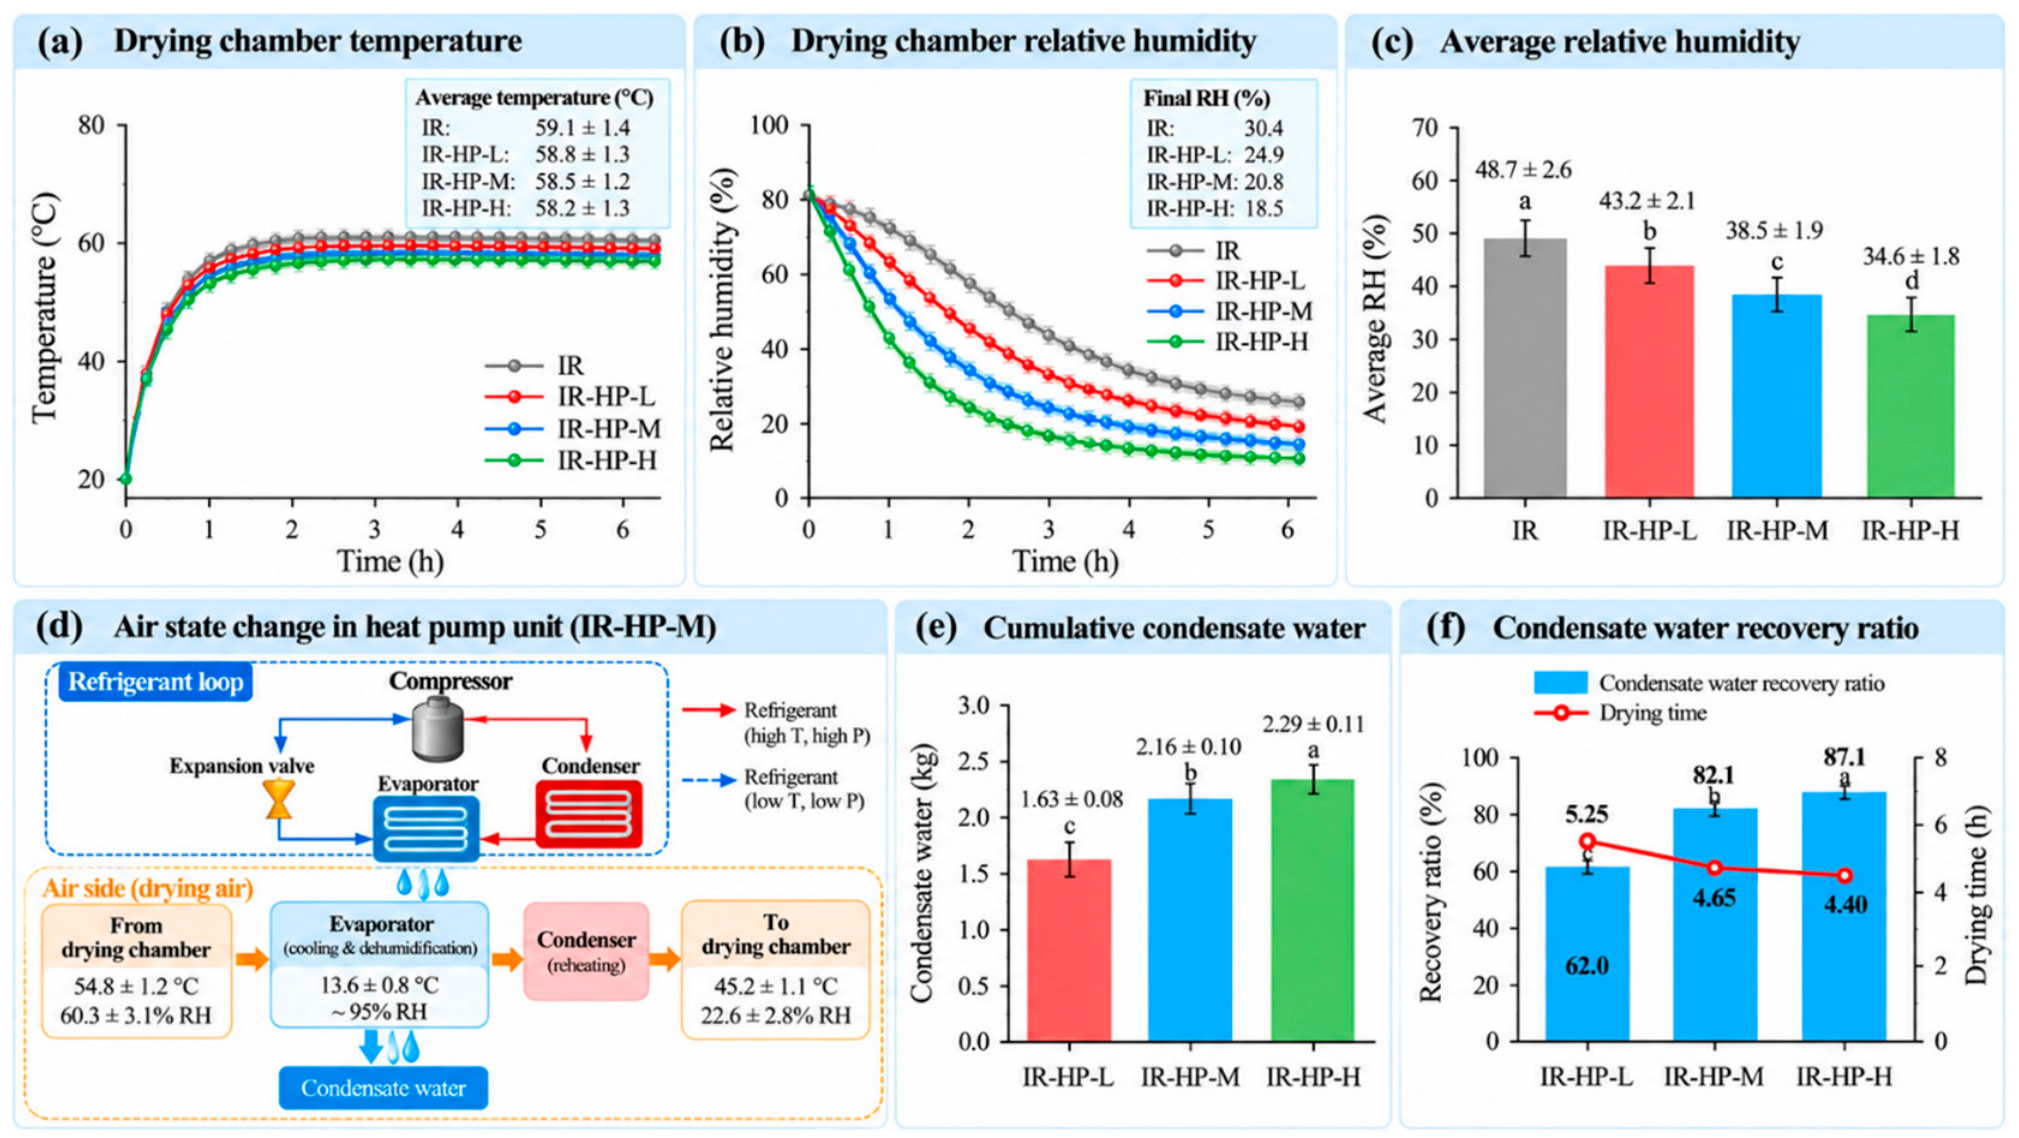
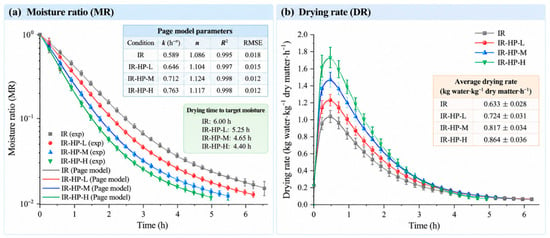
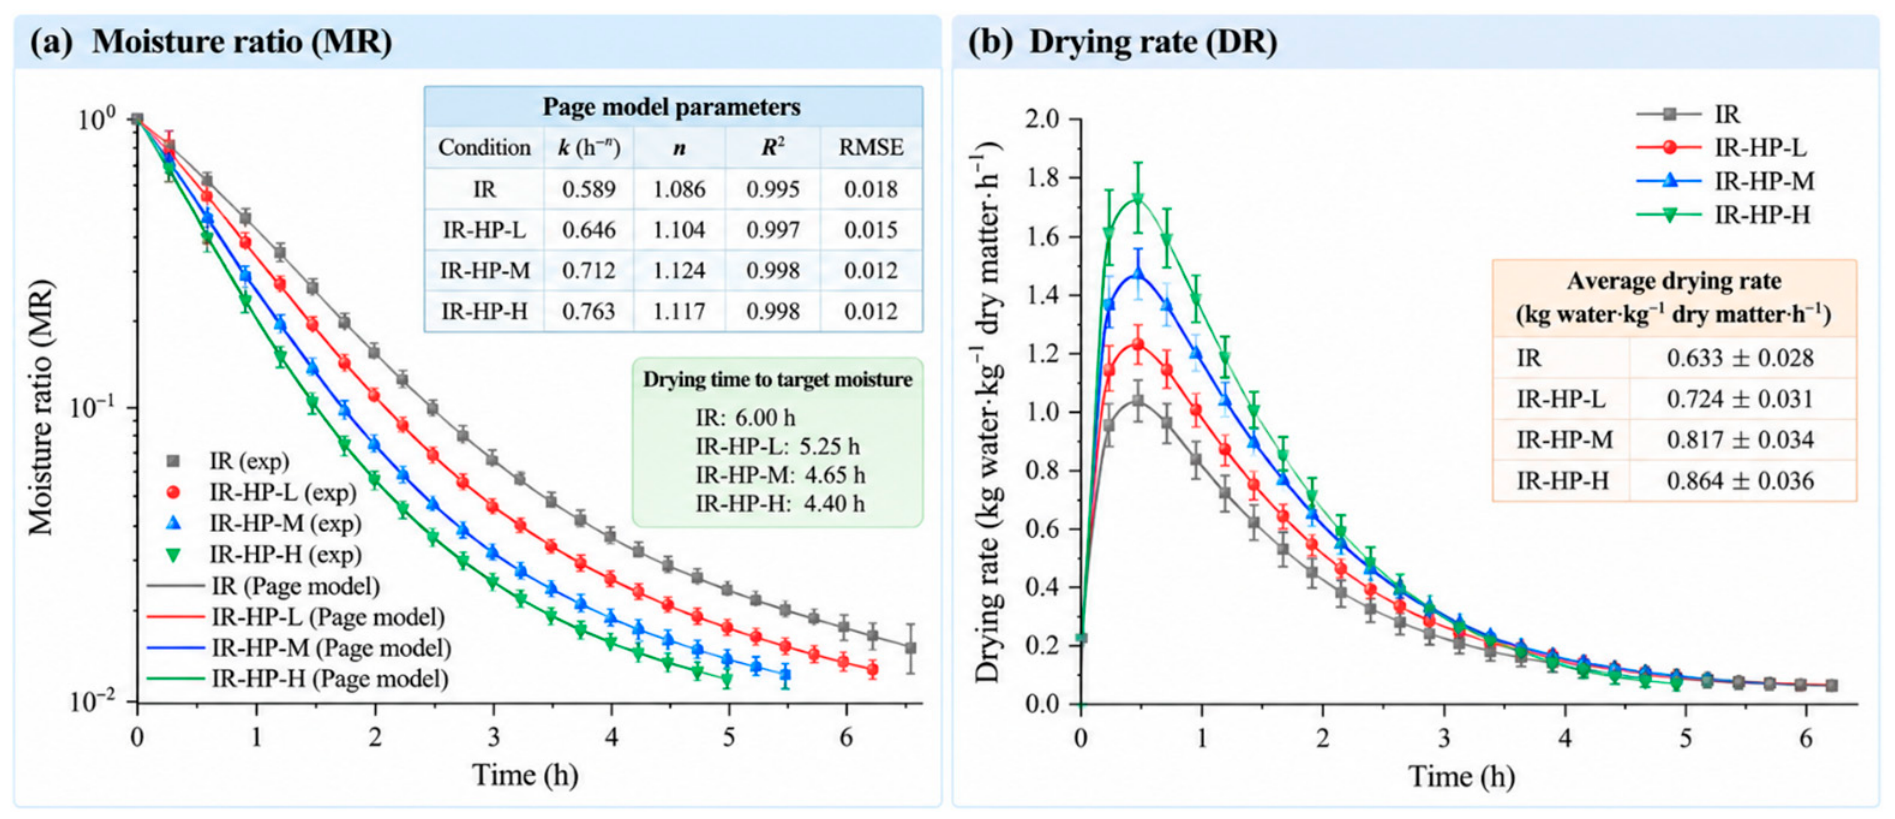
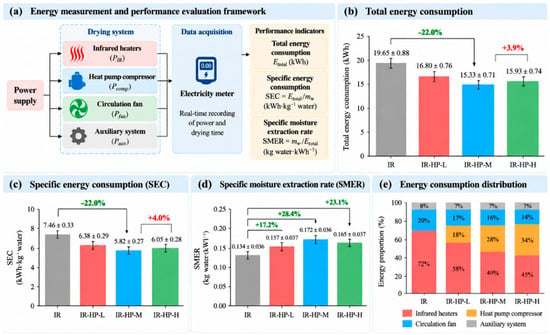
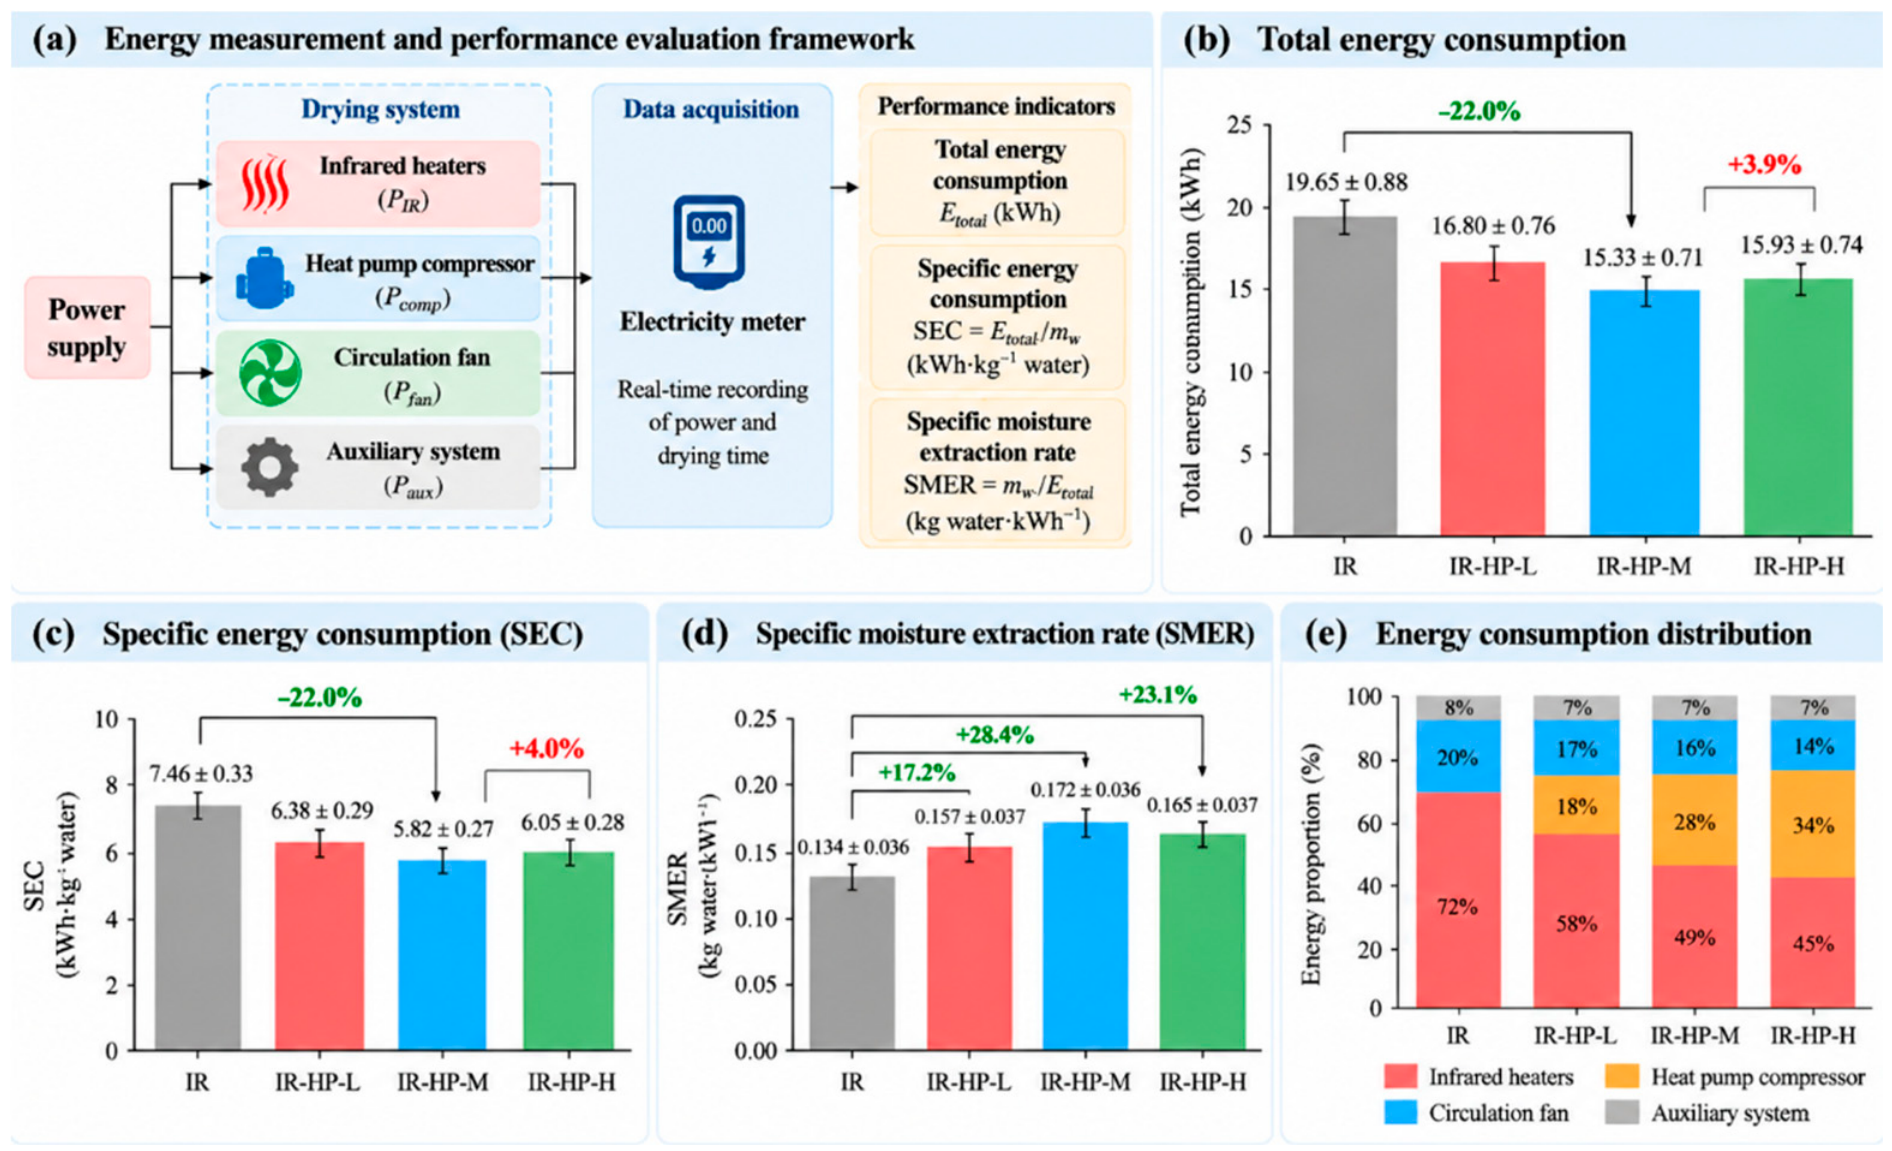
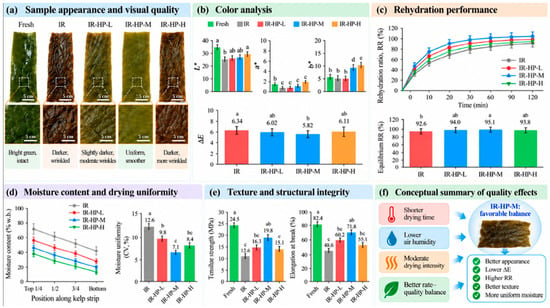
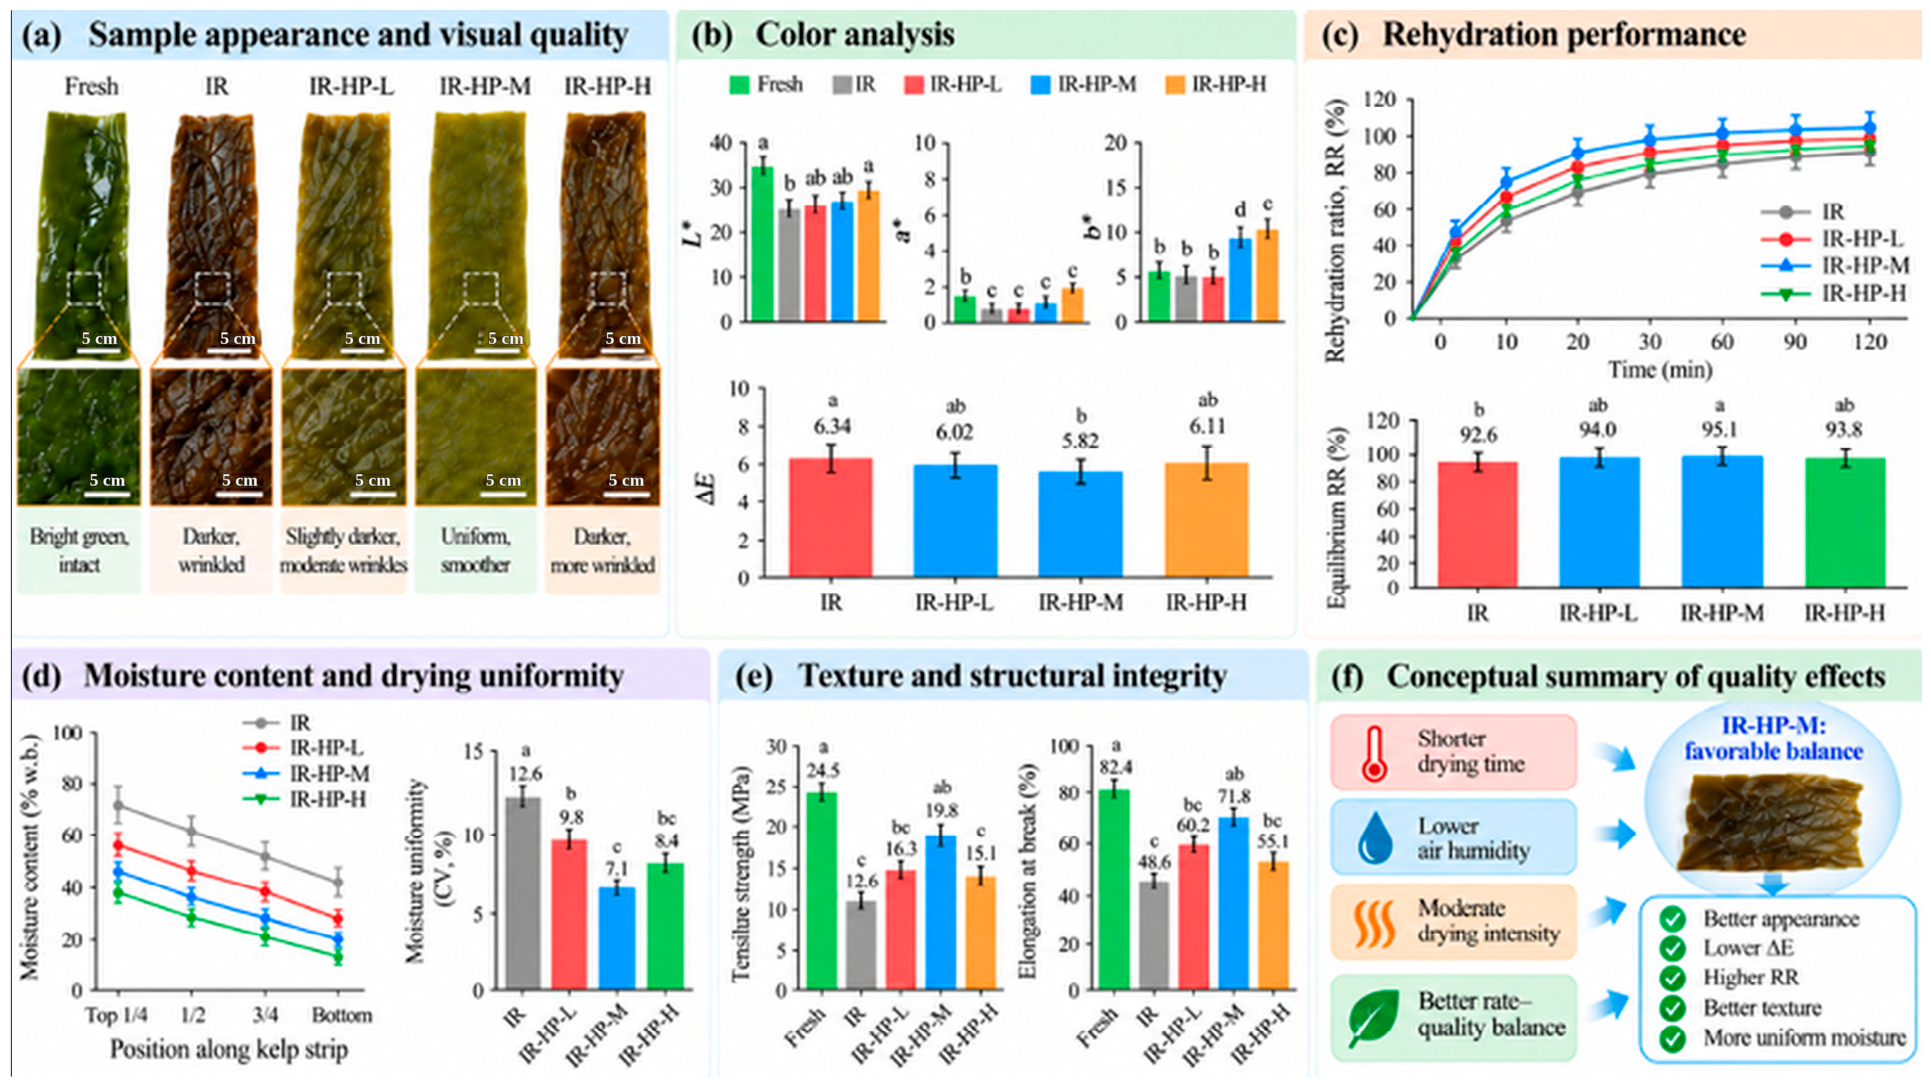

Disclaimer/Publisher’s Note: The statements, opinions and data contained in all publications are solely those of the individual author(s) and contributor(s) and not of MDPI and/or the editor(s). MDPI and/or the editor(s) disclaim responsibility for any injury to people or property resulting from any ideas, methods, instructions or products referred to in the content. |
© 2026 by the authors. Licensee MDPI, Basel, Switzerland. This article is an open access article distributed under the terms and conditions of the Creative Commons Attribution (CC BY) license.