


Abstract
Additive manufacturing enables the fabrication of lightweight composite structures with complex geometries; however, accurately predicting their structural response remains challenging when topology optimization introduces multiple thin load-bearing members and complex deposition paths. This study evaluated the end-to-end accuracy of a simplified engineering workflow that combines coupon-derived anisotropic material properties, isotropic topology generation, laminate shell analysis, geometry reconstruction, FDM fabrication, and component testing for short-carbon-fiber-reinforced PLA structures. In-plane elastic properties were characterized using ASTM D3039 tensile and ASTM D3518 shear tests and implemented in ANSYS Mechanical and ACP (Pre). Baseline and topology-derived brackets with different retained-mass targets were manufactured and tested under tensile loading. Experimental stiffness was determined using linear regression over the 25–60% range of each specimen’s maximum load, which provided highly linear fits across all specimens. The simulations systematically overpredicted experimental stiffness, with errors of approximately 14–52% for the baseline and minimum-compliance configurations. Mesh refinement and variations in the assumed out-of-plane elastic properties produced changes substantially smaller than the largest simulation–experiment discrepancies. The results therefore quantify the limitations of transferring coupon-calibrated homogeneous properties through a simplified topology-optimization and FDM workflow and show that the observed disagreement cannot be attributed to mesh density or the investigated out-of-plane material assumptions alone. The workflow is best interpreted as a preliminary engineering assessment rather than as validation of a high-fidelity constitutive or component model.
1. Introduction
Structural components across many industries require low weight and high strength-to-weight ratios at low production costs. Fiber-reinforced composites are well suited to these applications but generally require expensive and complex manufacturing processes. Additive manufacturing provides a way to produce complex geometries at relatively low cost. Therefore, accurate simulations that predict the mechanical performance of complex parts are essential for efficient engineering design.
Fused deposition modeling (FDM) is a widely used additive manufacturing process in which a continuous filament is extruded layer by layer to produce a final part. Polylactic acid (PLA) is one of the most common thermoplastic materials used in this process for both commercial and hobbyist applications. Commercially available filaments are available as neat polymers or with short-fiber reinforcement. Adding short fibers to the polymer matrix improves mechanical performance by enabling load transfer from the polymer matrix to the stiffer reinforcing fibers, thereby increasing composite stiffness and strength. During extrusion, these short-fiber-infused rasters behave similarly to unidirectional continuous-fiber composites and exhibit strongly direction-dependent mechanical properties, with higher stiffness along the raster direction and lower strength between adjacent layers [1,2,3,4]. Mechanical performance is further influenced by fiber volume fraction, raster orientation, void content, and processing parameters such as nozzle diameter, layer height, and annealing conditions [2,3,4,5,6,7,8,9]. Because of this anisotropic behavior, ASTM composite test methods are commonly used to characterize the orthotropic properties of short-fiber FDM materials [1,10,11].
Finite element analysis (FEA) is widely used to simulate composite structures using experimentally determined anisotropic material properties [12,13,14,15]. More advanced approaches incorporate manufacturing history, local deposition orientation, representative volume elements, or process-dependent material behavior to improve prediction accuracy [4,6,13,14,15,16]. Similarly, topology optimization of composite structures can account for anisotropy and, in more advanced formulations, simultaneously optimize material distribution and fiber orientation [17,18,19]. These approaches can provide greater physical fidelity but generally require specialized modeling procedures or computational tools. In practical engineering workflows, homogeneous laminate models and commercially available topology-optimization tools remain attractive because of their relatively low experimental and computational requirements. However, transferring coupon-derived homogeneous properties to topology-optimized FDM structures is challenging because optimized geometries can contain thin members, curved boundaries, and local deposition directions that differ from the nominal material orientations represented in the finite element model.
Although increasingly sophisticated studies have incorporated anisotropy and deposition orientation into topology optimization of fiber-reinforced composites [17,18,19], simplified commercial workflows remain attractive for preliminary engineering analysis because of their lower experimental and computational requirements. However, the end-to-end accuracy of such workflows remains uncertain when coupon-derived homogeneous material properties are transferred through topology generation, geometry reconstruction, composite analysis, FDM fabrication, and component testing. The objective of this study was therefore to quantify the agreement and systematic discrepancies produced by such a simplified workflow for short-carbon-fiber-reinforced PLA brackets. The study does not seek to validate a new constitutive formulation or topology-optimization algorithm; instead, it examines which investigated assumptions are sufficient or insufficient to account for the observed differences between simulation and experiment. Mesh-convergence, material-property sensitivity, raster-orientation, and regression-window analyses were used to assess selected sources of uncertainty.
2. Materials and Methods
2.1. Materials and Printing
A commercially available fused deposition modeling (FDM) printing system was selected to demonstrate an accessible workflow using readily available hardware and software. The filament chosen for this study was Inland® 1.75 mm carbon-fiber-reinforced PLA [20]. All specimens were manufactured using a Creality K1C printer [21] equipped with a hardened steel nozzle and a textured polyetherimide (PEI) build plate to improve printing performance with carbon-fiber-filled materials. Printing parameters are summarized in Table 1.
Table 1.
3D Printer Properties (Creality 3D Technology, 2024).
Creality Print (Version 5.0) [22] was used to generate the G-code for all specimens. The preloaded carbon-fiber PLA material profile was used with minor modifications. Print speed was reduced from 500 mm/s to 300 mm/s to eliminate skipped extrusion, while a single perimeter wall and 100% infill were selected to maintain consistent mechanical properties throughout the specimens. Before printing, the CF/PLA filament was dried at 50 °C for at least 12 h and was fed directly to the printer from the drying enclosure. Printed specimens were subsequently stored at room temperature under ambient laboratory conditions until testing. Testing was performed several days after printing; no postprint conditioning chamber was used.
2.2. Material Characterization
ASTM D3039 and ASTM D3518 tests were used to determine the experimentally measured elastic properties required for the finite element material model [10,11]. Six specimens were tested for each of the 0° and 90° ASTM D3039 configurations, and seven ±45° specimens were tested according to ASTM D3518. All specimens were included in determining the material properties used in the model; no specimens were excluded. The specimens were not conditioned prior to testing, and tabs were not used. For the 90° D3039 configuration, failures occurred within the gauge region. The 0° specimens failed catastrophically, with failures occurring both within the gauge region and at or near the grips. Because the primary quantity used from these tests was elastic modulus rather than ultimate strength, all specimen modulus values were retained; however, the absence of tabs and the mixed 0° failure locations are acknowledged as additional sources of experimental uncertainty. ASTM D3039 specimens were manufactured with nominal dimensions of approximately 205 × 25.2 × 2.6 mm, corresponding to 13 printed layers at a 0.2 mm layer height. The balanced ±45° ASTM D3518 specimens contained 12 printed layers to maintain equal numbers of +45° and −45° layers (see Table 2 for test configurations).
Table 2.
Tests used to generate mechanical properties.
The 0° and 90° ASTM D3039 configurations were used to obtain the raster-direction modulus and in-plane transverse modulus , respectively. The modulus values were obtained from the automatic modulus calculation provided by the Instron testing software using the specimen geometry entered into the test method. The test system used crosshead extension for the tensile measurements. No local extensometer or strain gauge was used for the D3039 tests. The resulting modulus values therefore include uncertainty associated with machine and grip compliance in addition to specimen response. No independent machine-compliance correction could be confirmed for the Instron test template. Because these coupon-derived values were used directly in the finite element model, this uncertainty is retained as a limitation of the present workflow. The six 0° specimens produced GPa (CV = 17.4%), while the six 90° specimens produced GPa (CV = 3.7%). The seven D3518 specimens produced GPa (CV = 4.9%). The relatively large variability in may reflect combined specimen-to-specimen variability and uncertainty associated with crosshead-based modulus measurement. Toray Advanced Composites performed the ±45° tests according to ASTM D3518 using biaxial strain gauges, and the resulting measurements were used to determine the in-plane shear modulus .
The material coordinate system was defined such that direction 1 corresponded to the primary raster direction, direction 2 represented the in-plane direction transverse to the raster, and direction 3 corresponded to the build or through-thickness direction. The experimentally determined properties were , , and . The remaining elastic constants required by ANSYS were estimated using a transversely isotropic approximation. Specifically, , , and the Poisson ratios were assigned a value of 0.30. This value is consistent with the range of Poisson-ratio values used in published multiscale modeling of FFF PLA/short-carbon-fiber systems [16]. The transverse shear modulus was calculated using Equation (1). These assumptions simplify the behavior of the printed material because the build direction may differ from the in-plane transverse direction due to interlayer bonding and manufacturing-induced defects. Their influence on predicted structural stiffness was therefore evaluated through the sensitivity analysis described in Section 2.3.4.
Using GPa and , Equation (1) gives GPa.
2.3. Finite Element Modeling
2.3.1. Topology Optimization
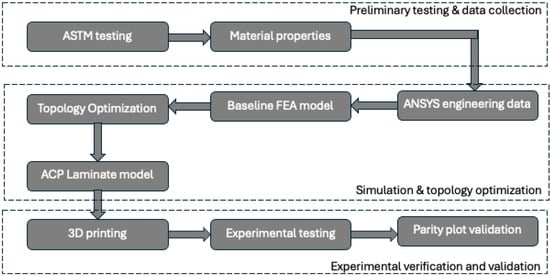
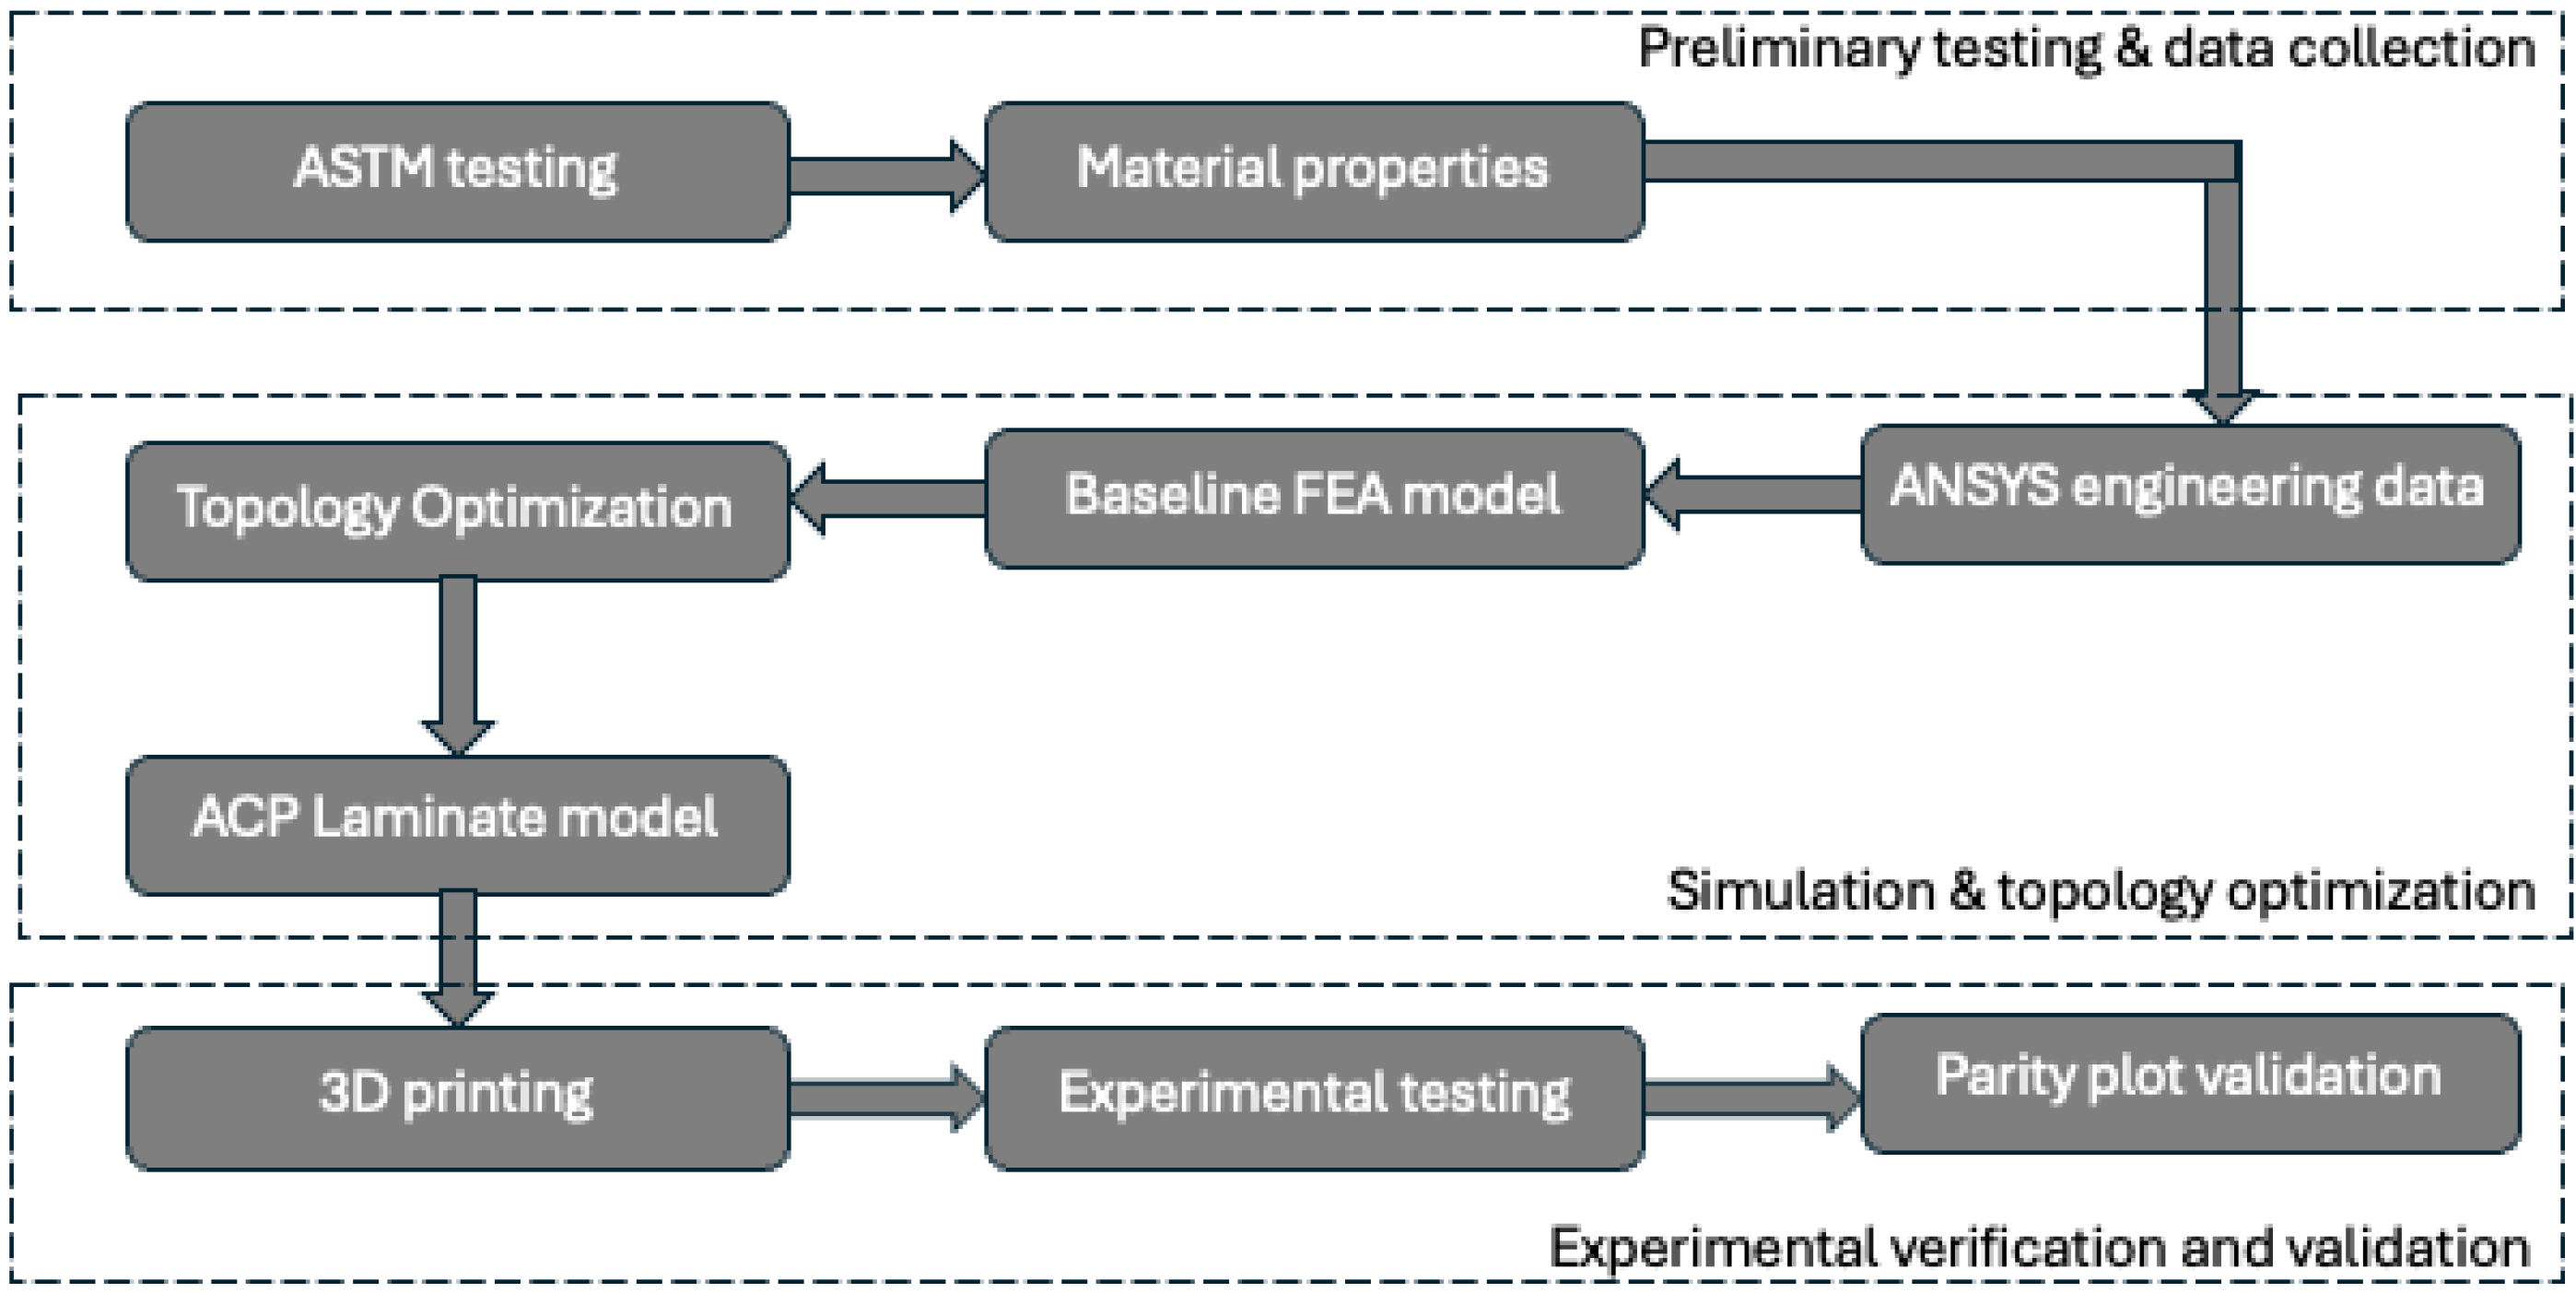
Figure 1 summarizes the overall modeling and validation workflow. Topology optimization was performed in ANSYS Mechanical 2026 R1 using the built-in density-based SIMP formulation [23]. The topology-optimization stage used isotropic structural steel ( ksi, ) solely to generate candidate load-path geometries. The CF/PLA anisotropic properties were applied only during subsequent structural analysis. Accordingly, the optimized geometries should be interpreted as isotropically generated topology candidates subsequently manufactured and analyzed in CF/PLA, rather than as material-specific optimum designs for the anisotropic printed composite. This distinction limits conclusions regarding interaction between anisotropy and topology generation but is consistent with the simplified end-to-end workflow evaluated here.
Figure 1.
Overall workflow for material characterization, topology optimization, finite element stiffness prediction, and experimental validation.
Compliance was minimized subject to nominal retained-mass targets of 40%, 50%, or 60%, depending on the configuration. A separate nominal 50% retained-mass configuration was generated by maximizing compliance to provide a contrasting low-stiffness topology. The maximum number of optimization iterations was 500, and the convergence accuracy was 0.1%. The SIMP penalization, filtering, and optimization algorithm were program-controlled; ANSYS documentation specifies as the default SIMP penalization exponent. No explicit minimum-member-size constraint was applied.
The entire bracket body was defined as the design region, while the cylindrical surfaces of both loading holes were specified as exclusion regions and therefore remained non-design regions throughout optimization. An extrusion manufacturing constraint was imposed along the global Z direction to maintain a uniform cross-section through the bracket thickness. The topology-optimization mesh used a nominal element size of 2.54 mm (0.10 in.) and contained 3825 elements and 20,207 nodes.
2.3.2. Composite Finite Element Model
Following topology optimization, the density-field geometry was manually retraced as a two-dimensional surface in SpaceClaim before import into ANSYS ACP (Pre) 2026 R1. The original topology result and reconstructed outline were overlaid during tracing, and reconstruction was performed visually to preserve the overall load-path geometry while smoothing jagged density-field boundaries. No quantitative dimensional comparison of local ligament widths was performed between the original density field and reconstructed Computer-aided Design (CAD) geometry. Because the tested specimens were no longer available for retrospective dimensional measurement, deviations among the optimized, reconstructed, and printed geometries could not be quantified. This represents an unresolved source of uncertainty, particularly for configurations containing thin load-bearing members.
The reconstructed geometry was modeled using SHELL181 elements. SHELL181 is a four-node, first-order shell element with six degrees of freedom per node. A quad-dominant mesh was used, and large-deflection effects were disabled to maintain consistency with the linear-elastic formulation. The laminate consisted of 32 plies, each with a nominal thickness of 0.2 mm corresponding to the FDM layer height. Thus, the notation represents 16 repetitions of the two-ply [0/90] sequence, resulting in 32 total plies and a modeled laminate thickness of 6.4 mm. This closely matched the nominal printed bracket thickness of 6.35 mm.
All elements were included in a single ACP element set. Material orientations were defined using the global XYZ rosette, with the Z direction corresponding to the through-thickness material direction. For the laminate, alternating layers were assigned 0° and 90° orientations relative to this reference system.
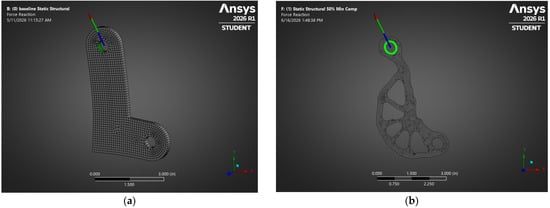
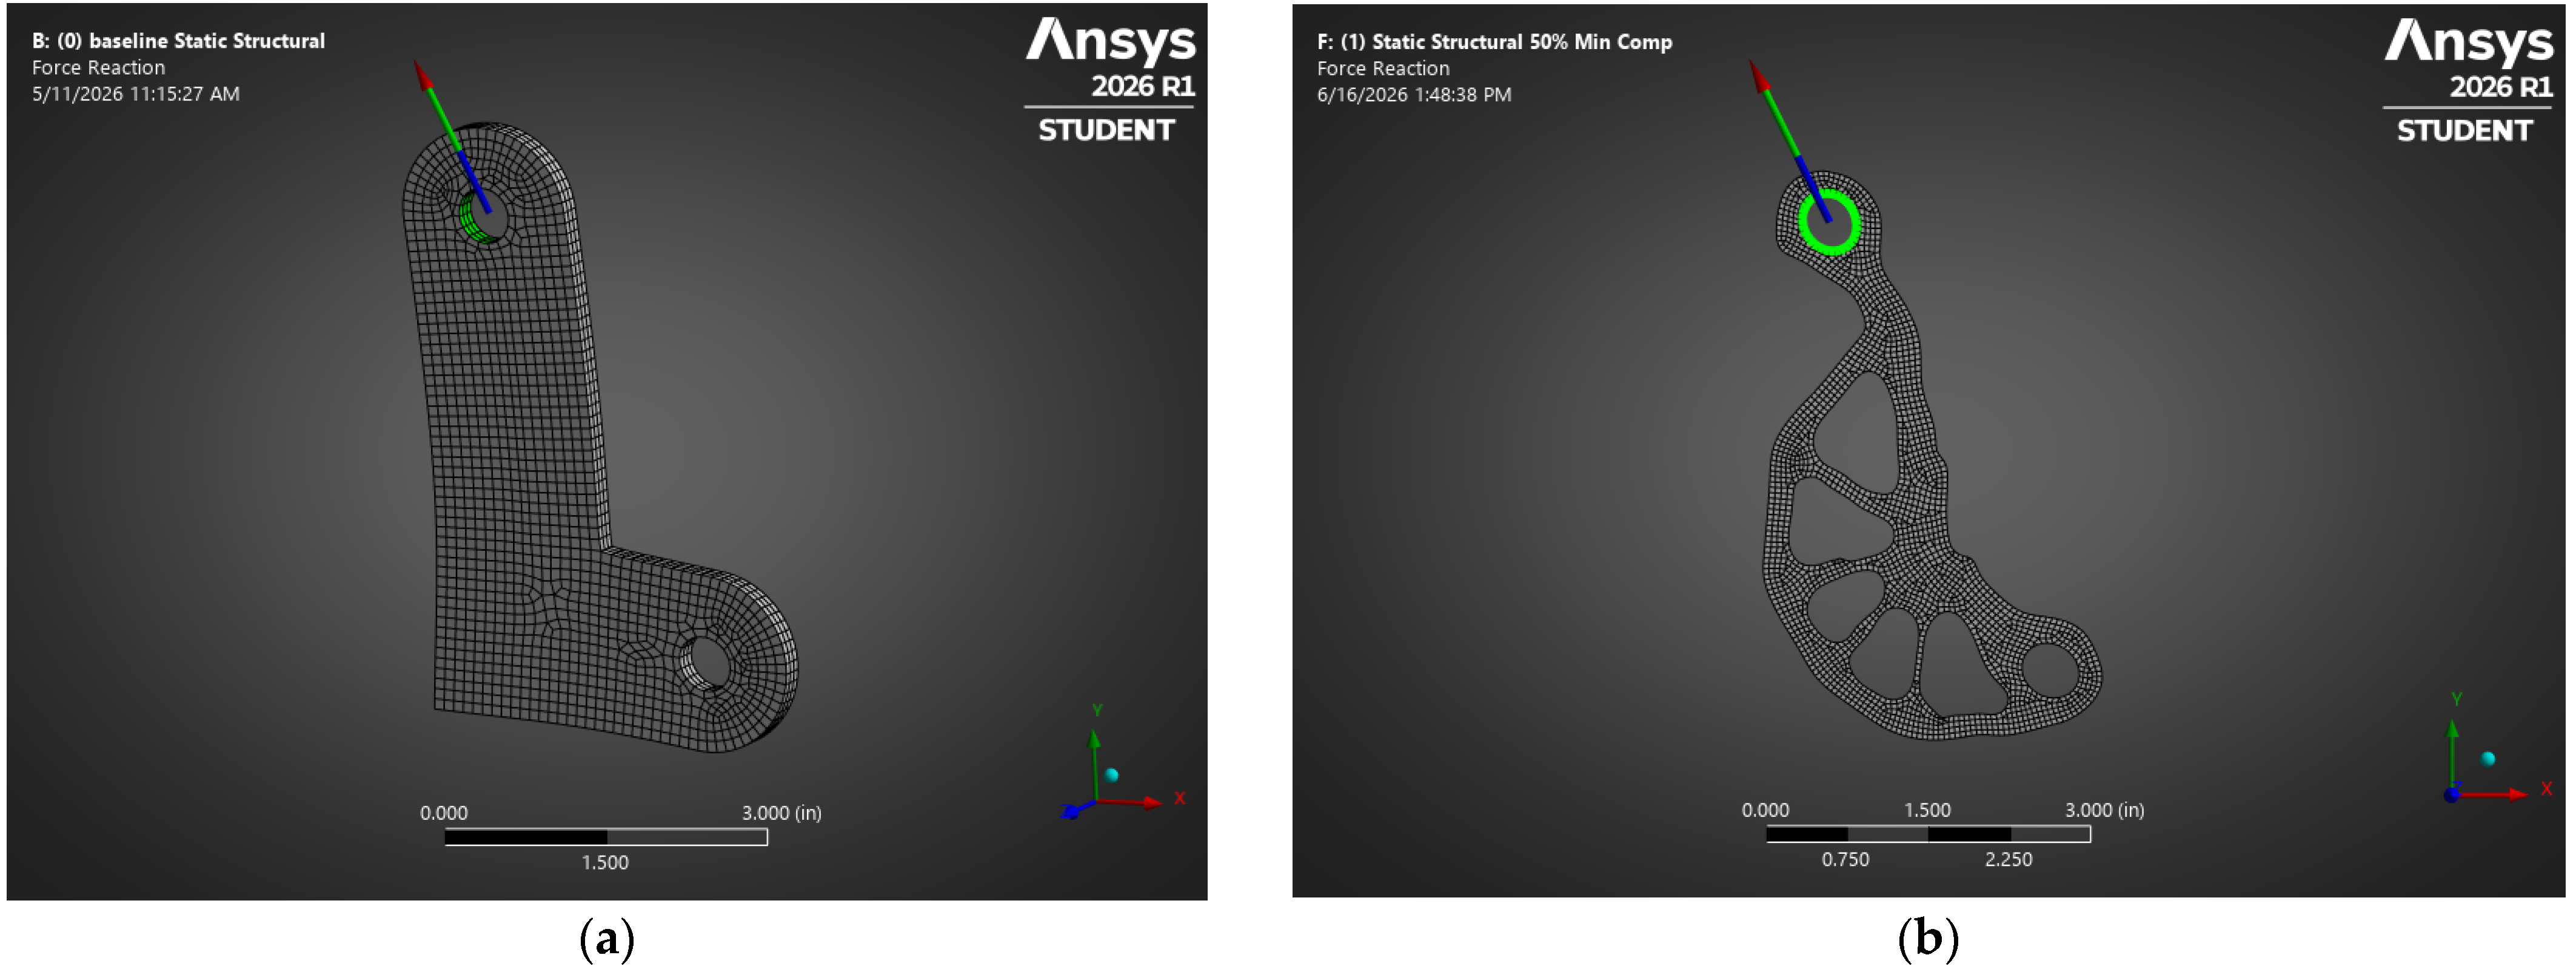
Remote-displacement boundary conditions with deformable coupling to the hole surfaces were applied to both loading holes. Translation of the lower hole was constrained while rotation about the out-of-plane Z axis remained free. A resultant displacement of 2.54 mm (0.100 in.) was applied to the upper hole along the bracket loading axis, with out-of-plane rotation also left free. These conditions approximated rotational freedom associated with pin loading without explicitly modeling pin–hole contact. Pin clearance, friction, pin deformation, and load-frame compliance were not explicitly represented. Figure 2 depicts the baseline bracket geometry and loading configuration.
Figure 2.
Baseline bracket geometry and loading configuration used for topology optimization (a) and representative topology-optimized geometry (b). Arrows indicate the applied loading direction and boundary conditions. The color scale in (b) represents the topology-optimization density field, with red indicating retained material and blue indicating regions targeted for material removal.
2.3.3. Mesh Convergence
Mesh sensitivity was evaluated using the 60% retained-mass minimum-compliance geometry because this configuration contained multiple thin load-bearing members and exhibited the largest simulation-experiment discrepancy. Four quad-dominant meshes with nominal element sizes of 2.54, 1.91, 1.27, and 0.635 mm were compared using the same shell formulation, laminate construction, boundary-condition type, and material-property framework. The analysis was used to assess the relative sensitivity of predicted global stiffness to spatial discretization.
2.3.4. Material-Property Sensitivity Analysis
Because , , and the Poisson ratios were not independently measured, a sensitivity analysis was performed to quantify the influence of these assumed properties on the predicted structural stiffness. The 60% retained-mass minimum-compliance geometry was selected for this analysis because it exhibited the largest discrepancy between simulation and experiment. The experimentally measured , , and values were held constant. and were simultaneously reduced to 75% and 50% of their baseline values, while the Poisson ratio was independently varied from 0.25 to 0.35. The influence of the transverse shear modulus was also evaluated through a separate sensitivity analysis. All sensitivity analyses used the 1.27 mm (0.05 in.) quad-dominant mesh and otherwise identical laminate definitions, boundary conditions, and analysis settings. The specimen-level variability in the experimentally measured in-plane properties was additionally quantified from the original coupon data. However, these variations were not propagated through additional finite element simulations. The sensitivity analysis therefore evaluates uncertainty in the selected assumed out-of-plane properties only and should not be interpreted as a complete material-uncertainty analysis.
2.4. Experimental Testing and Data Analysis
Experimental bracket testing was performed using an Instron load frame. Brackets were loaded through steel pins at a crosshead rate of 0.508 mm/min (0.02 in./min), and force and crosshead-extension data were exported directly from the testing software. Three specimens were tested for the baseline configuration, while two specimens were tested for the quasi-isotropic baseline and each topology-optimized configuration.
Initial fixture seating and pin slack were present in the experimental response. To provide a consistent and reproducible stiffness measure, the raw force–extension data were analyzed using ordinary least-squares linear regression. Regression-window sensitivity was evaluated using 20–50%, 20–60%, 25–60%, and 25–75% of each specimen’s maximum load. The 25–60% interval was selected for the final analysis because it excluded the initial seating region while avoiding the higher-load portion approaching failure and produced highly linear responses for all specimens (). The slope of the fitted force–extension relationship was taken as structural stiffness. Because crosshead extension includes deformation of the test frame, fixture, pins, clearances, and specimen, the reported experimental stiffness represents system-level bracket-test stiffness rather than an isolated local component stiffness. No empty-fixture compliance correction was performed.
3. Results
3.1. Transversely Isotropic Material Model
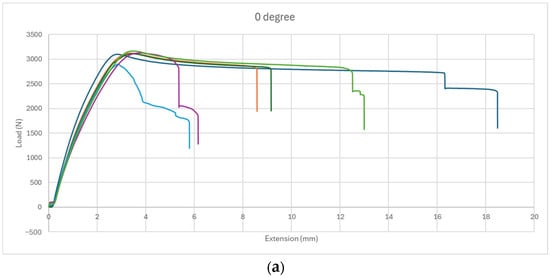
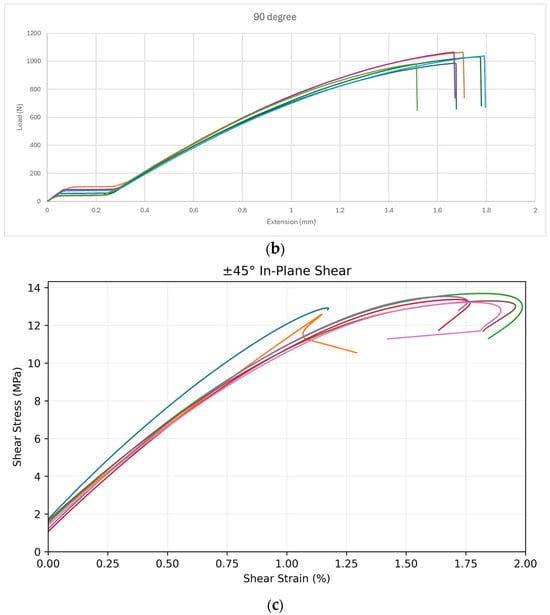
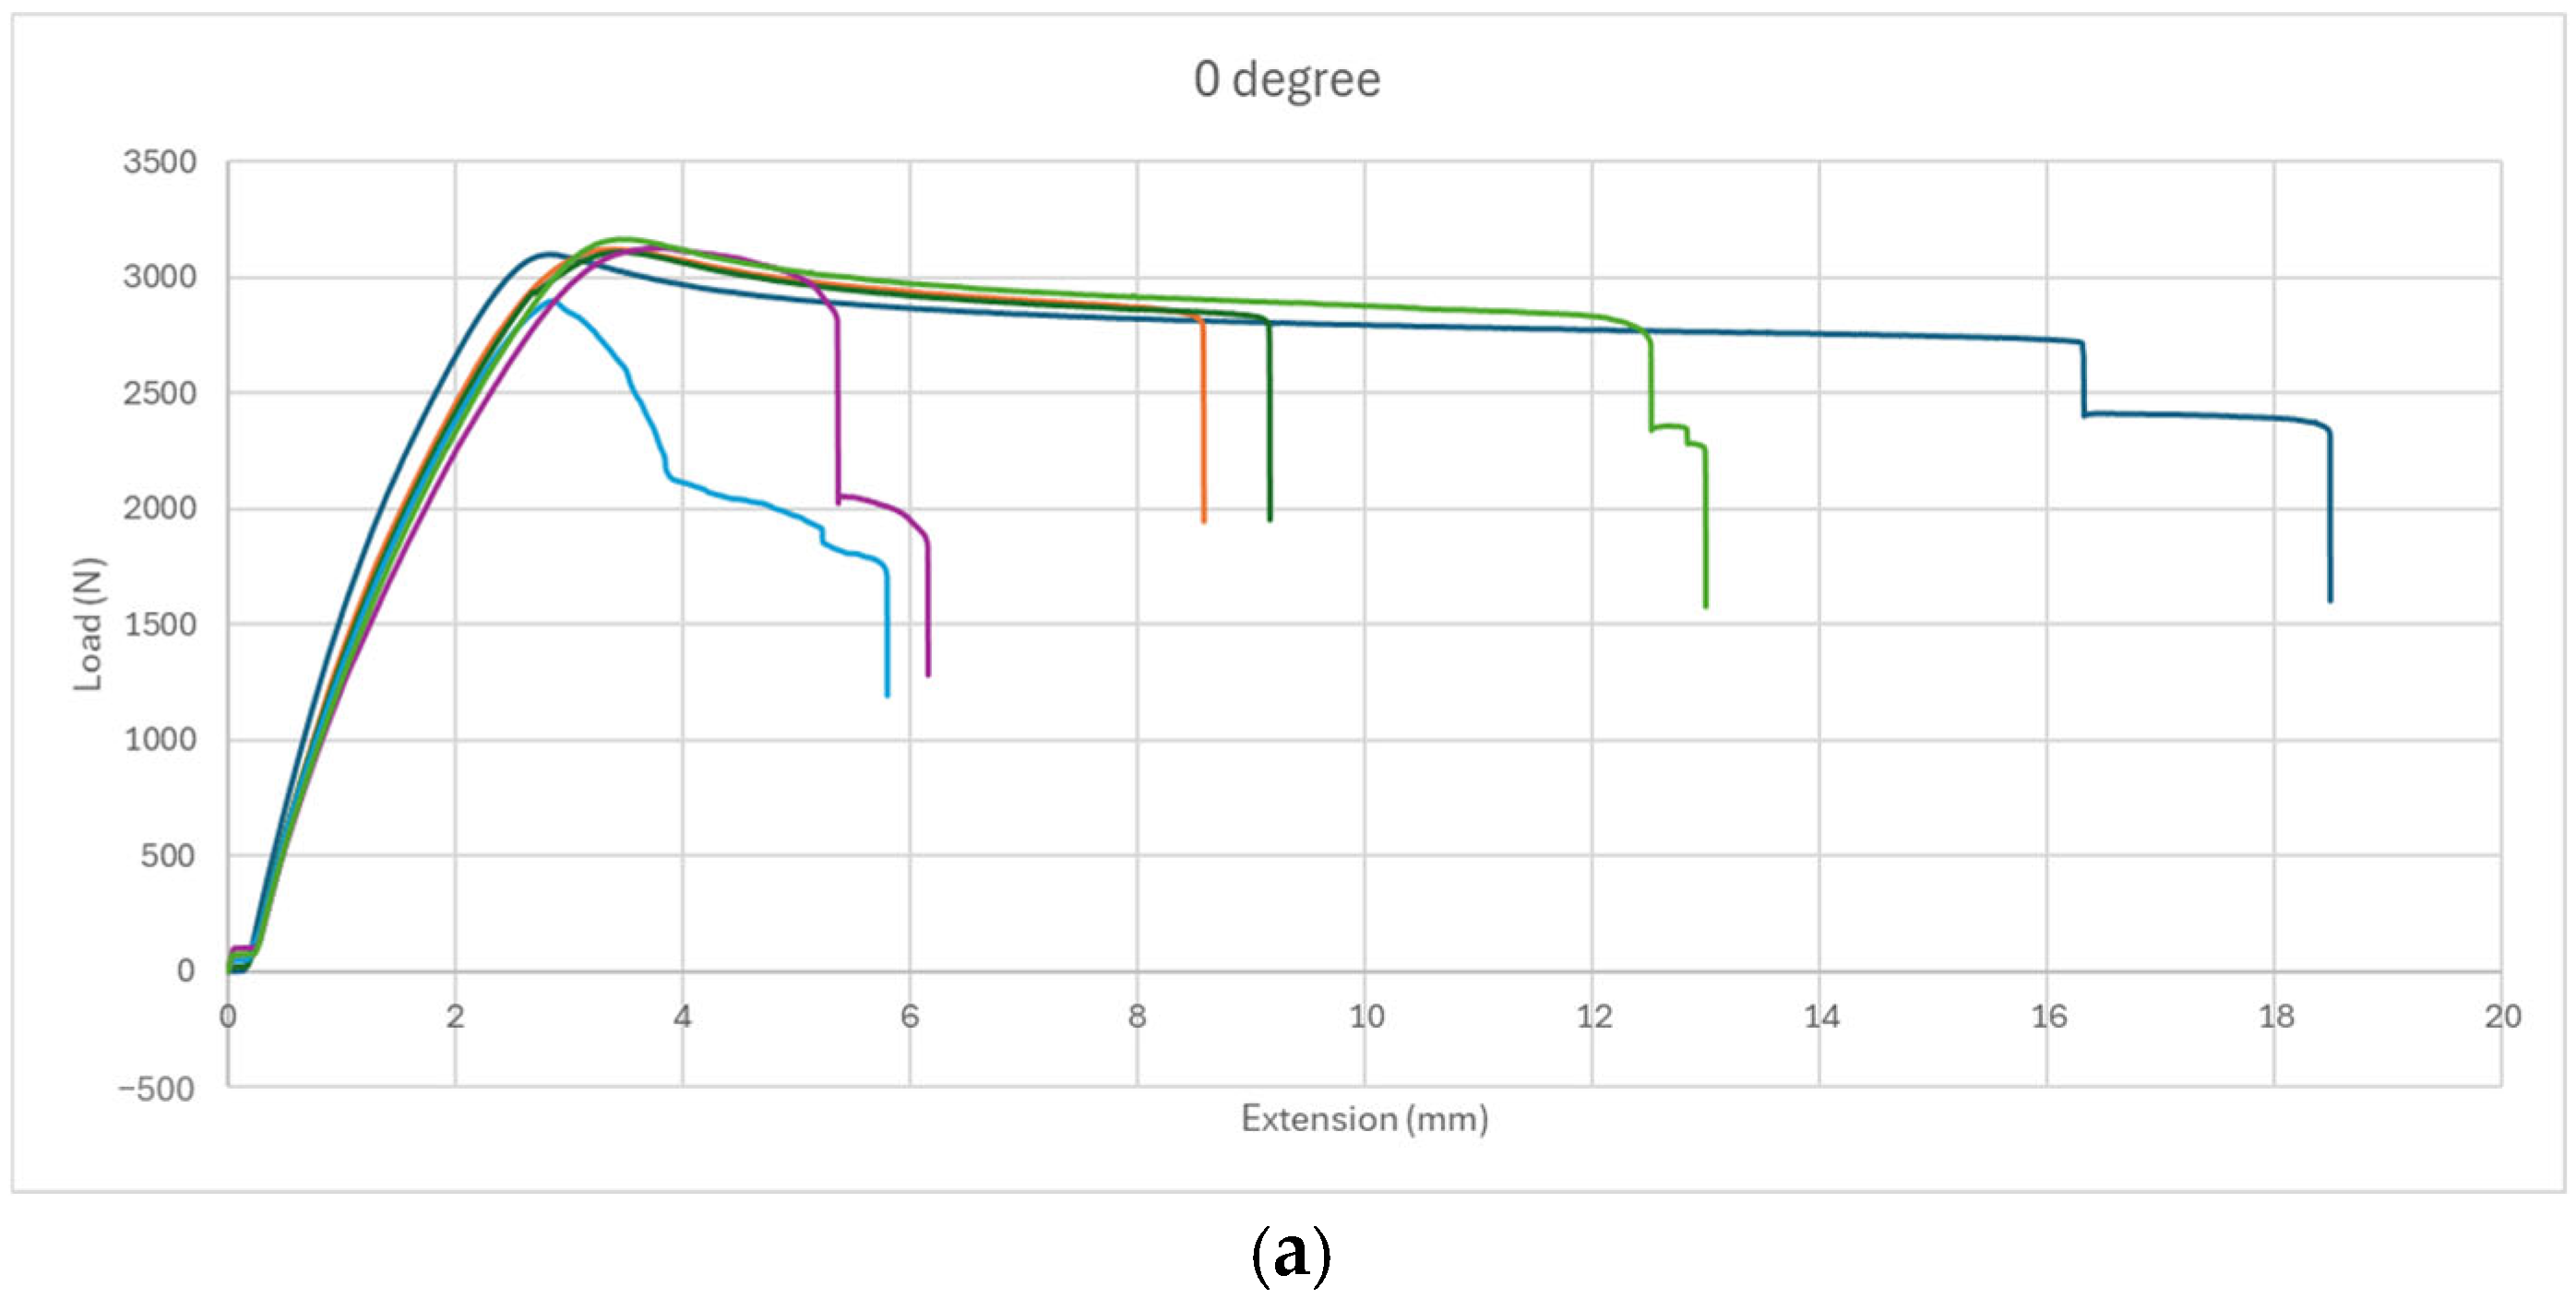
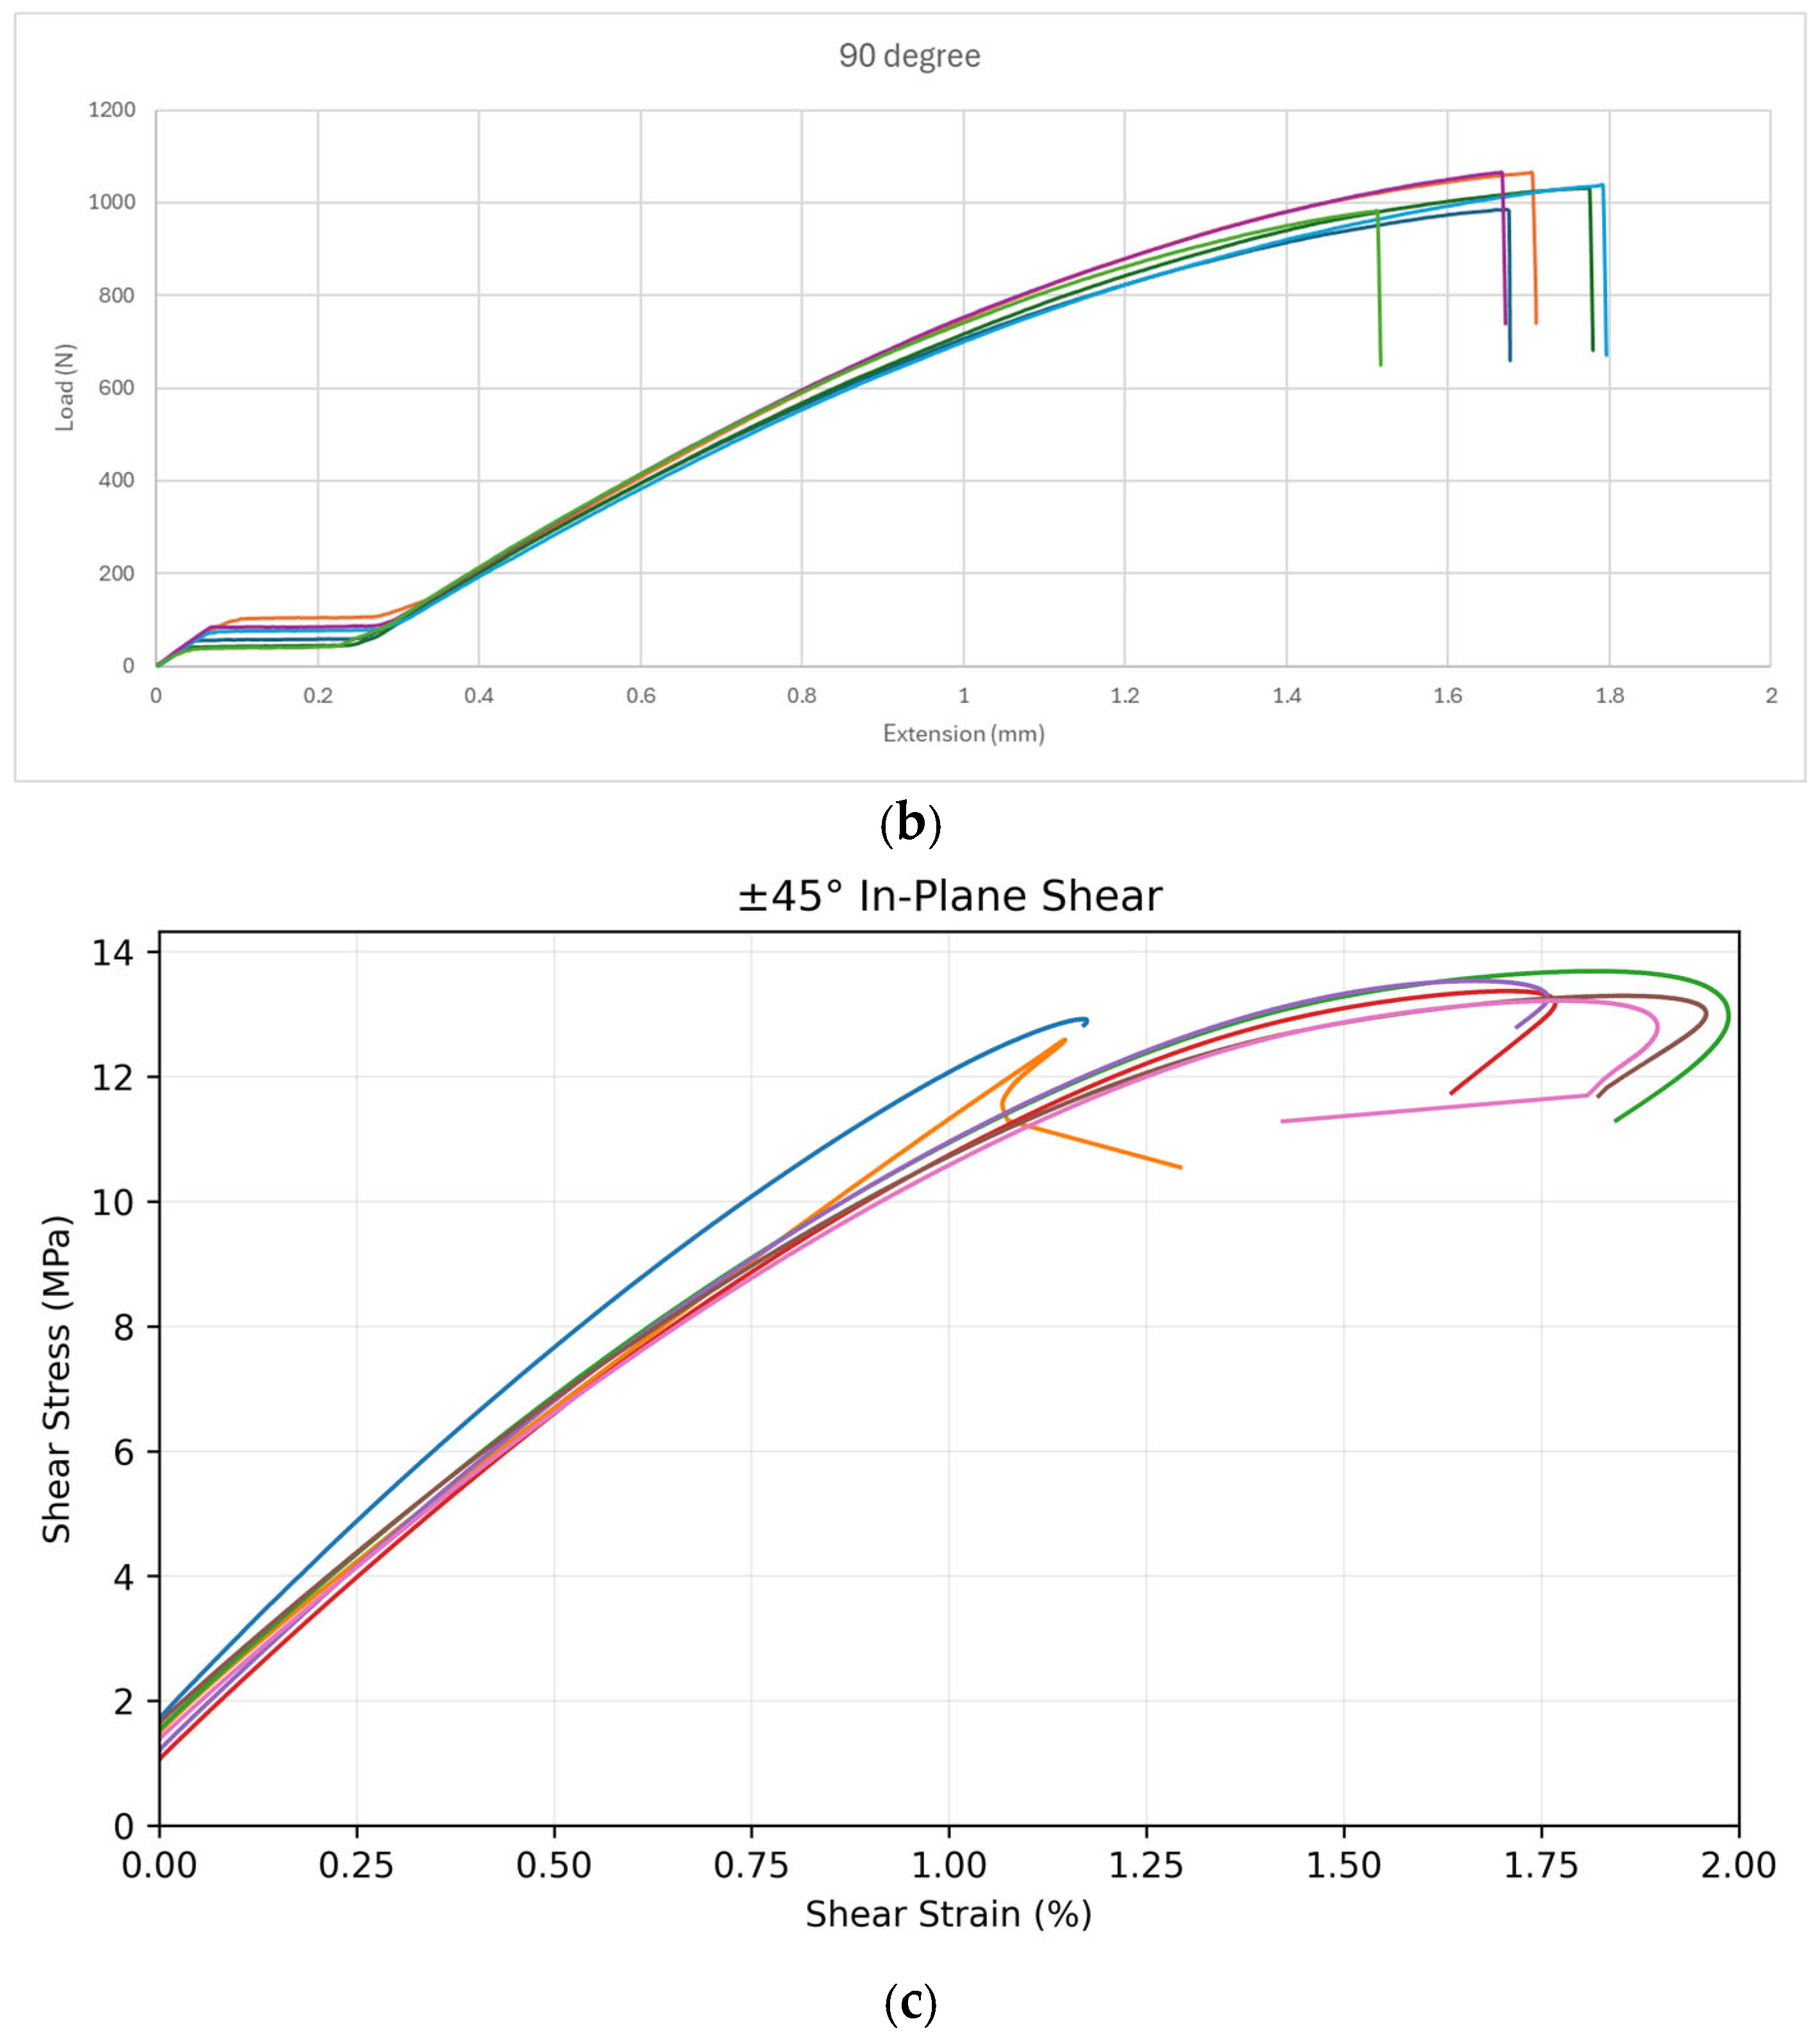
The transversely isotropic material model was developed using the ASTM mechanical tests described in Section 2.2. Representative experimental results are shown in Figure 3, while the resulting elastic constants implemented in ANSYS ACP (Pre) are summarized in Table 3.
Figure 3.
Material-characterization responses for (a) 0° and (b) 90° ASTM D3039 specimens ( for each orientation) and (c) ±45° ASTM D3518 specimens (). Individual curves represent individual specimens; colors are used only to distinguish the specimens and do not represent different test conditions.
Table 3.
Elastic properties used in the anisotropic CF/PLA finite element model.
3.2. Topology-Derived Geometries
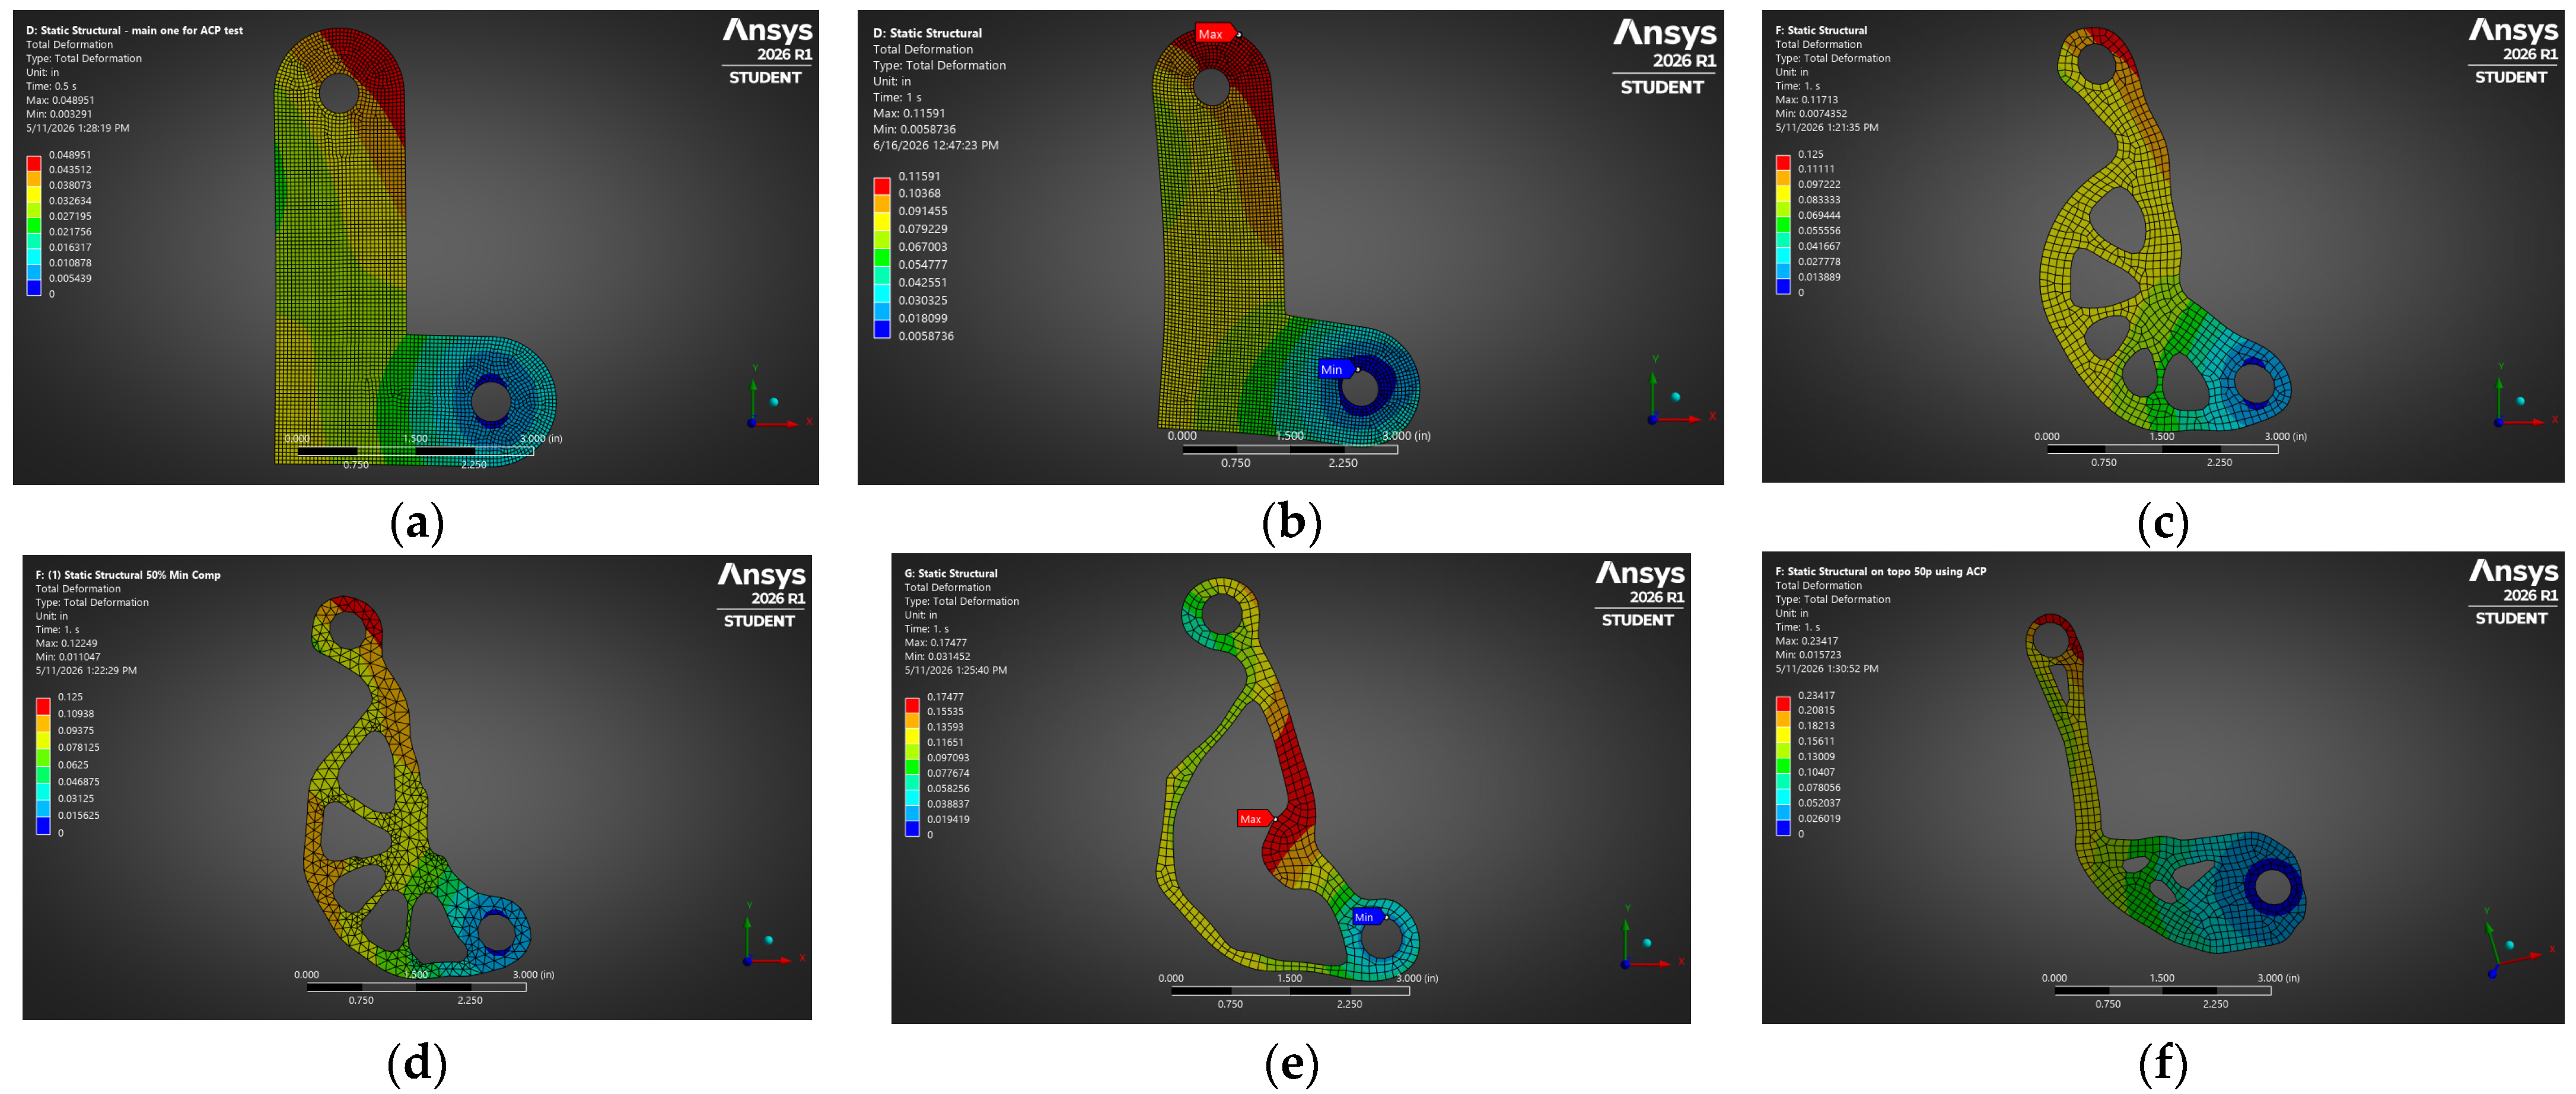
This study evaluated six bracket configurations. Two baseline geometries were considered using different laminate stacking sequences, followed by four topology-derived geometries generated using isotropic topology optimization with different optimization objectives and mass-retention targets. The resulting geometries are shown in Figure 4.
Figure 4.
Geometry variations included in the study: baseline bracket with (a) and (b) quasi-isotropic layups; minimum-compliance topology-derived designs generated using isotropic topology optimization with nominal retained-mass targets of (c) 60%, (d) 50%, and (e) 40%; and (f) maximum-compliance topology-derived design generated using isotropic topology optimization with a nominal 50% retained-mass target.
The six bracket configurations shown in Figure 4 were manufactured using the printing parameters described in Section 2 and tested under tensile loading. The simulated force–displacement responses were compared directly with the experimental results to evaluate the accuracy of the proposed modeling workflow. The two baseline configurations used and stacking sequences, respectively, with both configurations containing 32 plies.
3.3. Mesh Convergence and Material-Property Sensitivity
Across the four mesh levels, predicted stiffness changed by 2.7% from the coarsest to finest meshes, with successive changes of 1.3%, 0.9%, and 0.6%. The mesh-convergence analysis was used to assess the relative sensitivity of global stiffness to spatial discretization, and the small successive changes indicate limited mesh sensitivity over the investigated range. The results from the mesh-convergence study are shown in Table 4.
Table 4.
Mesh-convergence results for the 60% retained-mass minimum-compliance geometry.
The predicted structural stiffness showed relatively low sensitivity to , , and Poisson’s ratio over the ranges investigated. Simultaneously reducing and by 25% and 50% reduced predicted stiffness by 0.9% and 2.4%, respectively. Changing the Poisson ratio from 0.30 to 0.25 or 0.35 changed stiffness by less than 1%.
Sensitivity to was also evaluated because this property was estimated rather than independently measured. A lower-bound value of 0.61 GPa was compared with the baseline value of 1.141 GPa. For the 60% retained-mass configuration, this variation changed the predicted stiffness by approximately 2.9%. Across the investigated material-property variations, the resulting changes in global stiffness remained substantially smaller than the largest simulation–experiment discrepancies. These results indicate that uncertainty in the assumed out-of-plane elastic properties influences the numerical predictions but does not independently account for the magnitude of the largest observed discrepancies (Table 5). The baseline stiffness associated with the sensitivity-study model was 962.4 N/mm.
Table 5.
Sensitivity of predicted global stiffness to assumed material properties for the 60% retained-mass geometry.
3.4. Experimental Validation
The simulated and experimental responses were compared to quantify the agreement and systematic discrepancies produced by the simplified modeling workflow. Representative force–displacement responses are presented first for the baseline geometry and for topology-derived configurations exhibiting the largest and smallest prediction errors.
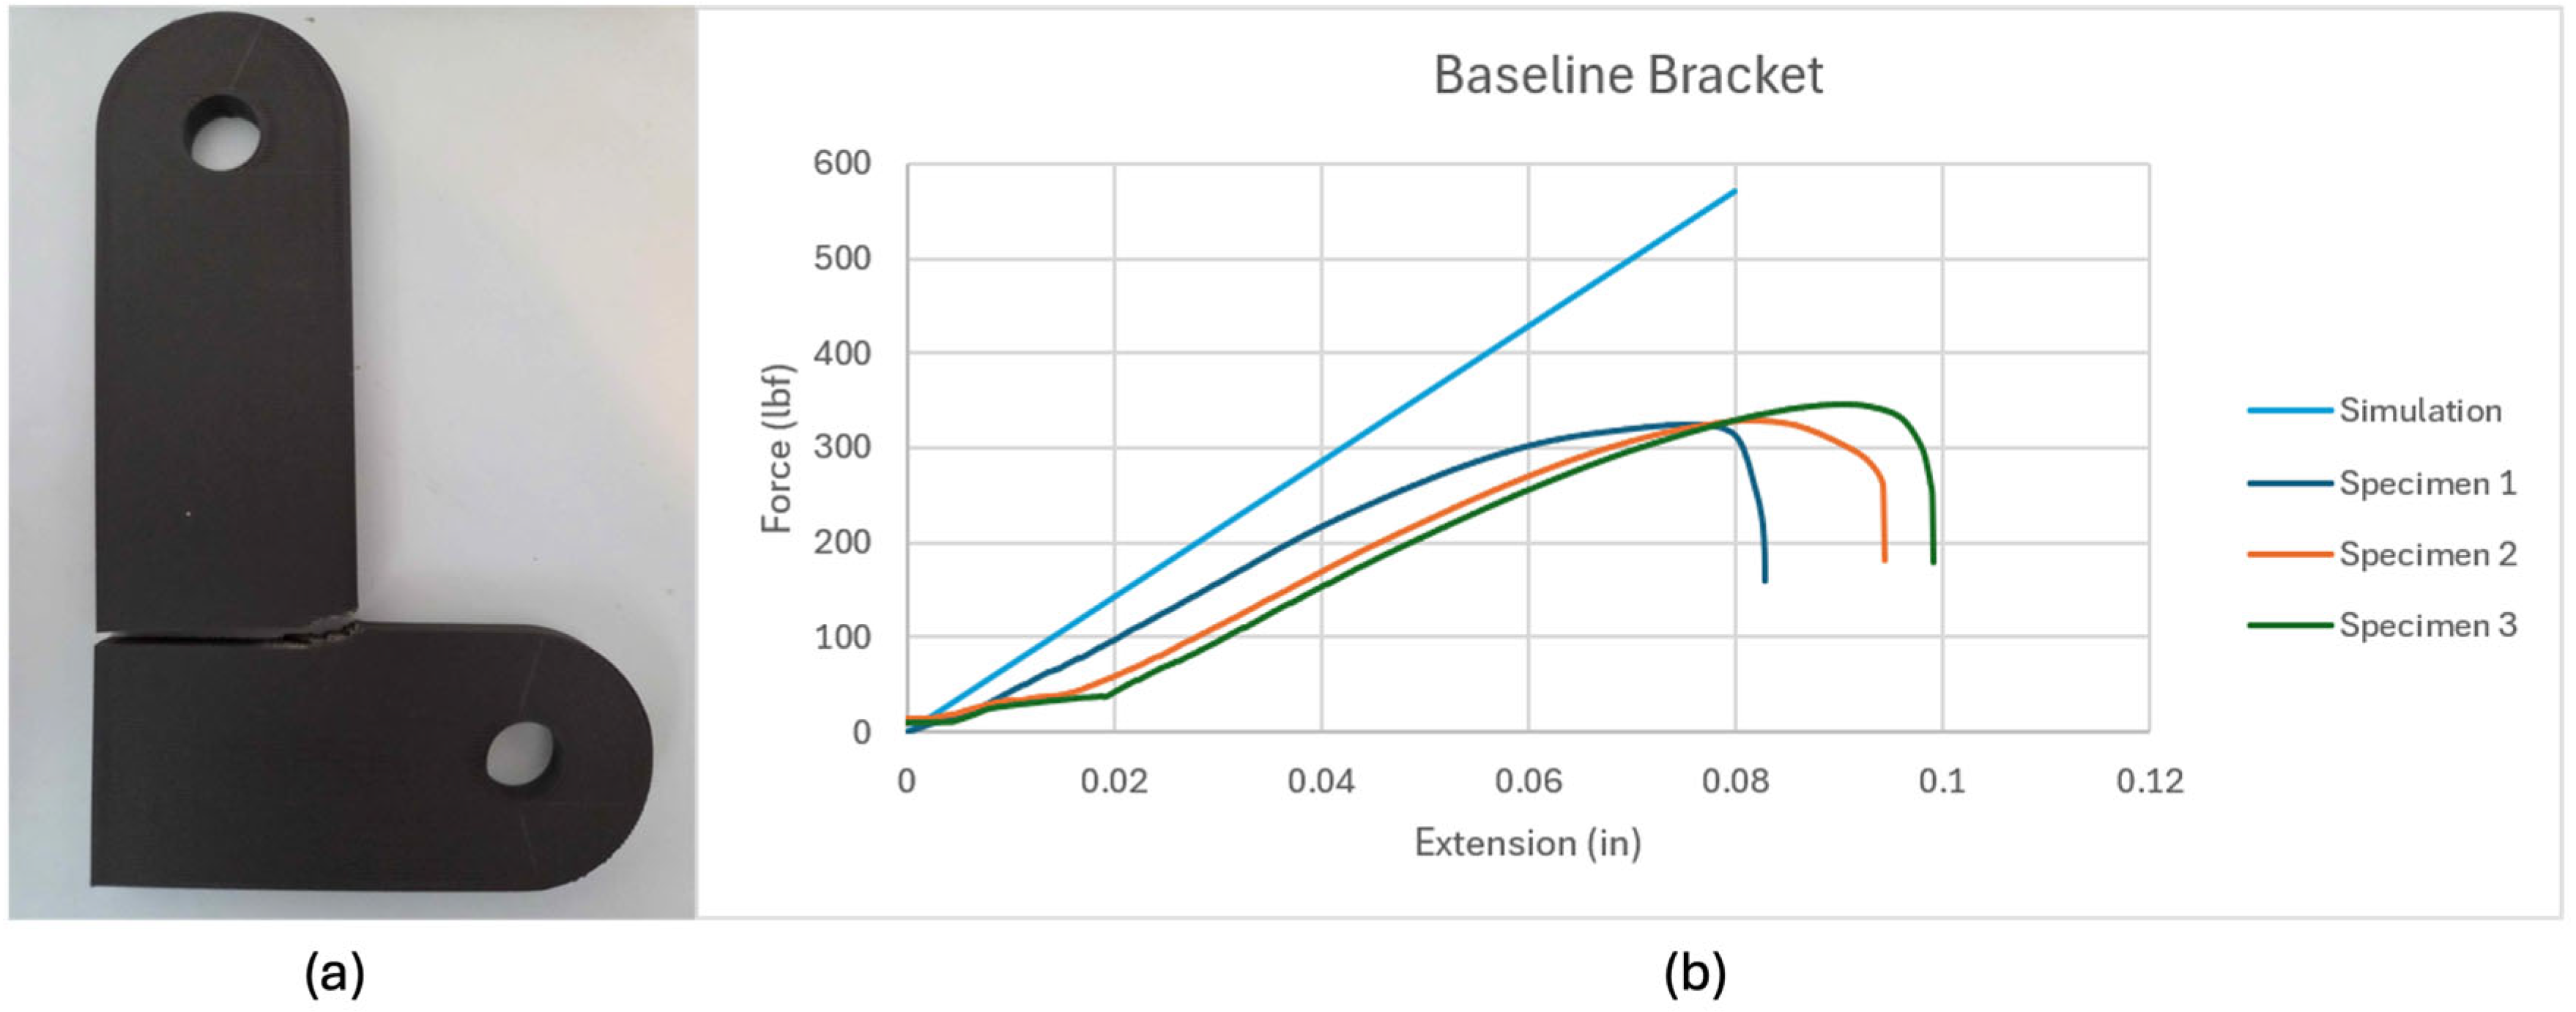
Figure 5 presents the representative response of the baseline bracket geometry. The simulated response captured the overall linear stiffness of the structure but consistently overpredicted the measured stiffness. This baseline result establishes the reference performance of the finite element model before evaluating the topology-optimized geometries.
Figure 5.
Fractured baseline specimen (a) and corresponding simulated and experimental force–displacement responses (b).
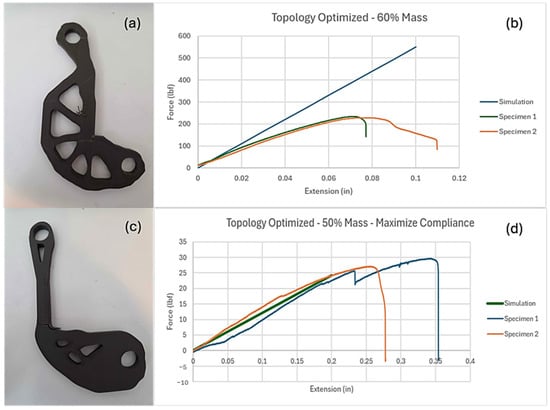
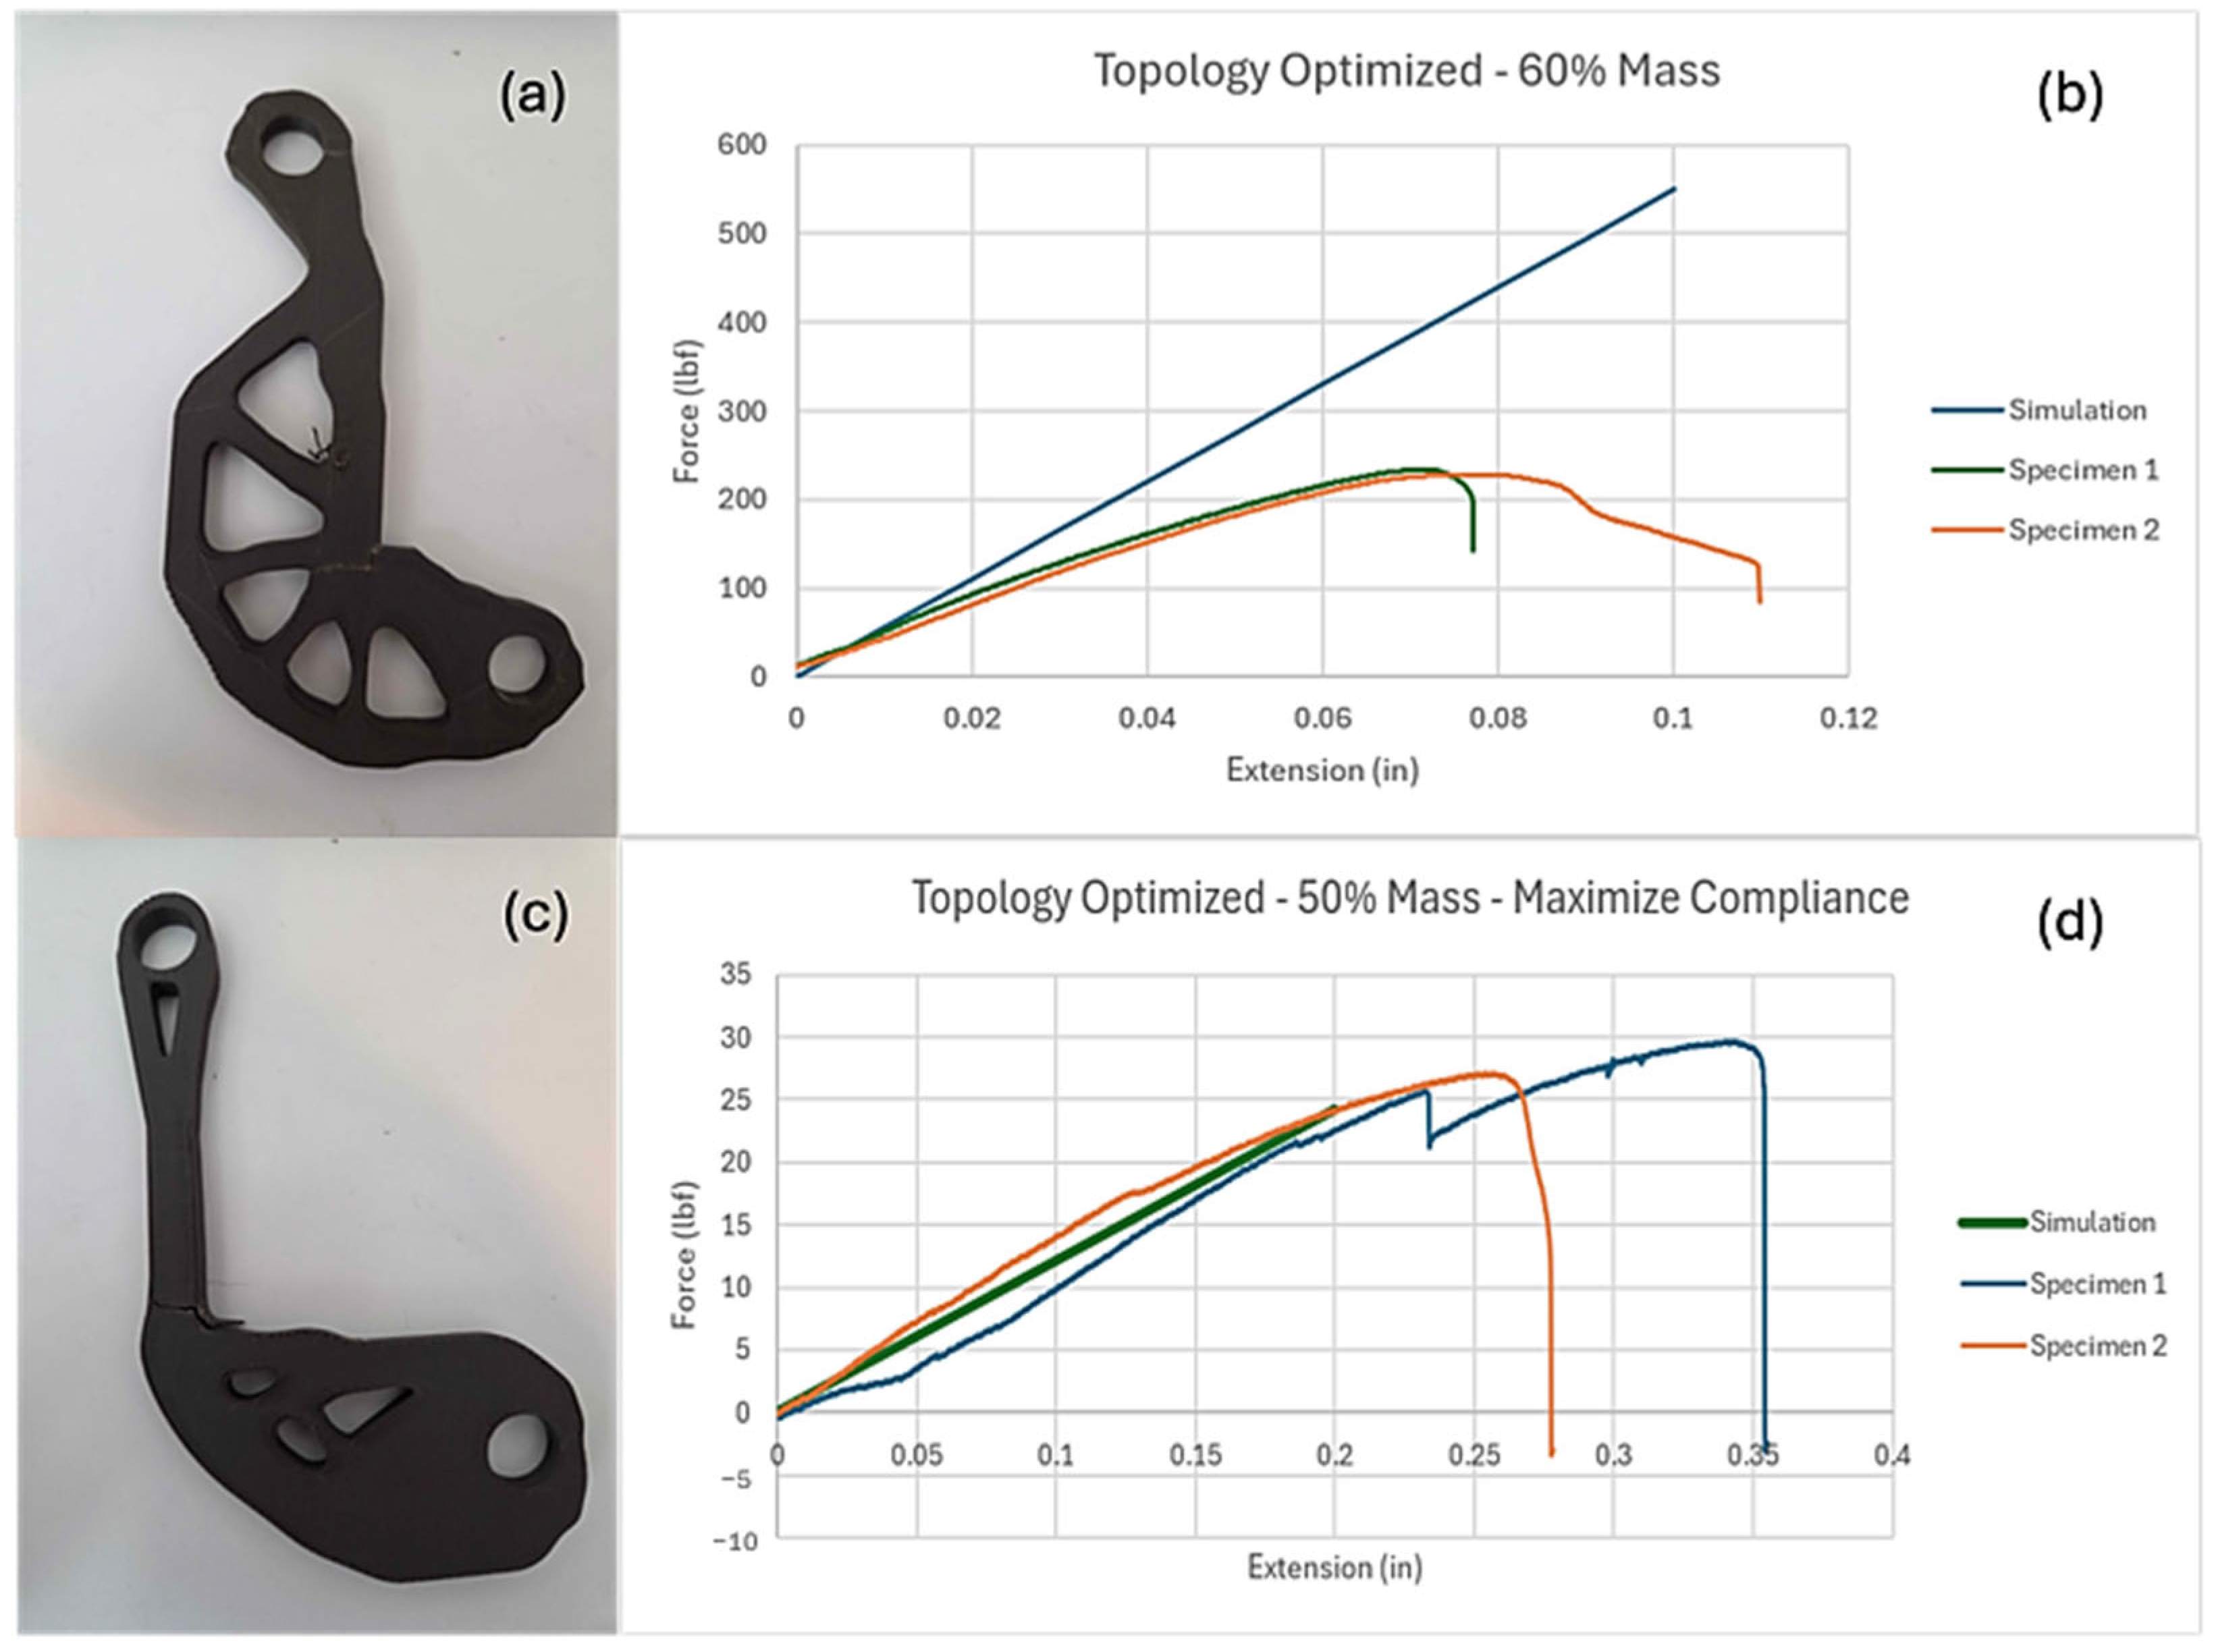
Figure 6 compares the topology-derived configurations exhibiting the largest and smallest prediction errors. The 60% retained-mass minimum-compliance geometry produced the largest discrepancy, whereas the 50% retained-mass maximum-compliance geometry produced the smallest discrepancy among the optimized configurations. The comparison illustrates the substantially different structural responses generated by the two optimization objectives.
Figure 6.
Fractured specimens and simulated/experimental force–displacement responses for the 60% retained-mass minimum-compliance geometry (a,b) and 50% retained-mass maximum-compliance geometry (c,d).
Regression-window sensitivity confirmed that the calculated stiffness depended modestly on the upper regression limit. Compared with the original 25–75% interval, use of the 25–60% interval increased mean stiffness by approximately 2–6% for the baseline and minimum-compliance configurations and by approximately 12% for the exploratory maximum-compliance configuration. Importantly, the 25–60% fits were highly linear for every individual specimen, with . Complete regression-window results and individual regression coefficients are provided in the Supplementary Materials.
3.5. Overall Simulation-Experiment Comparison
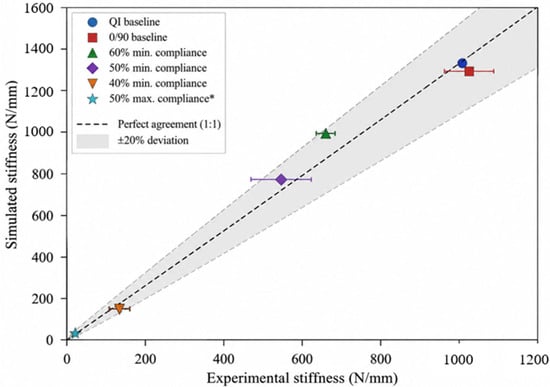
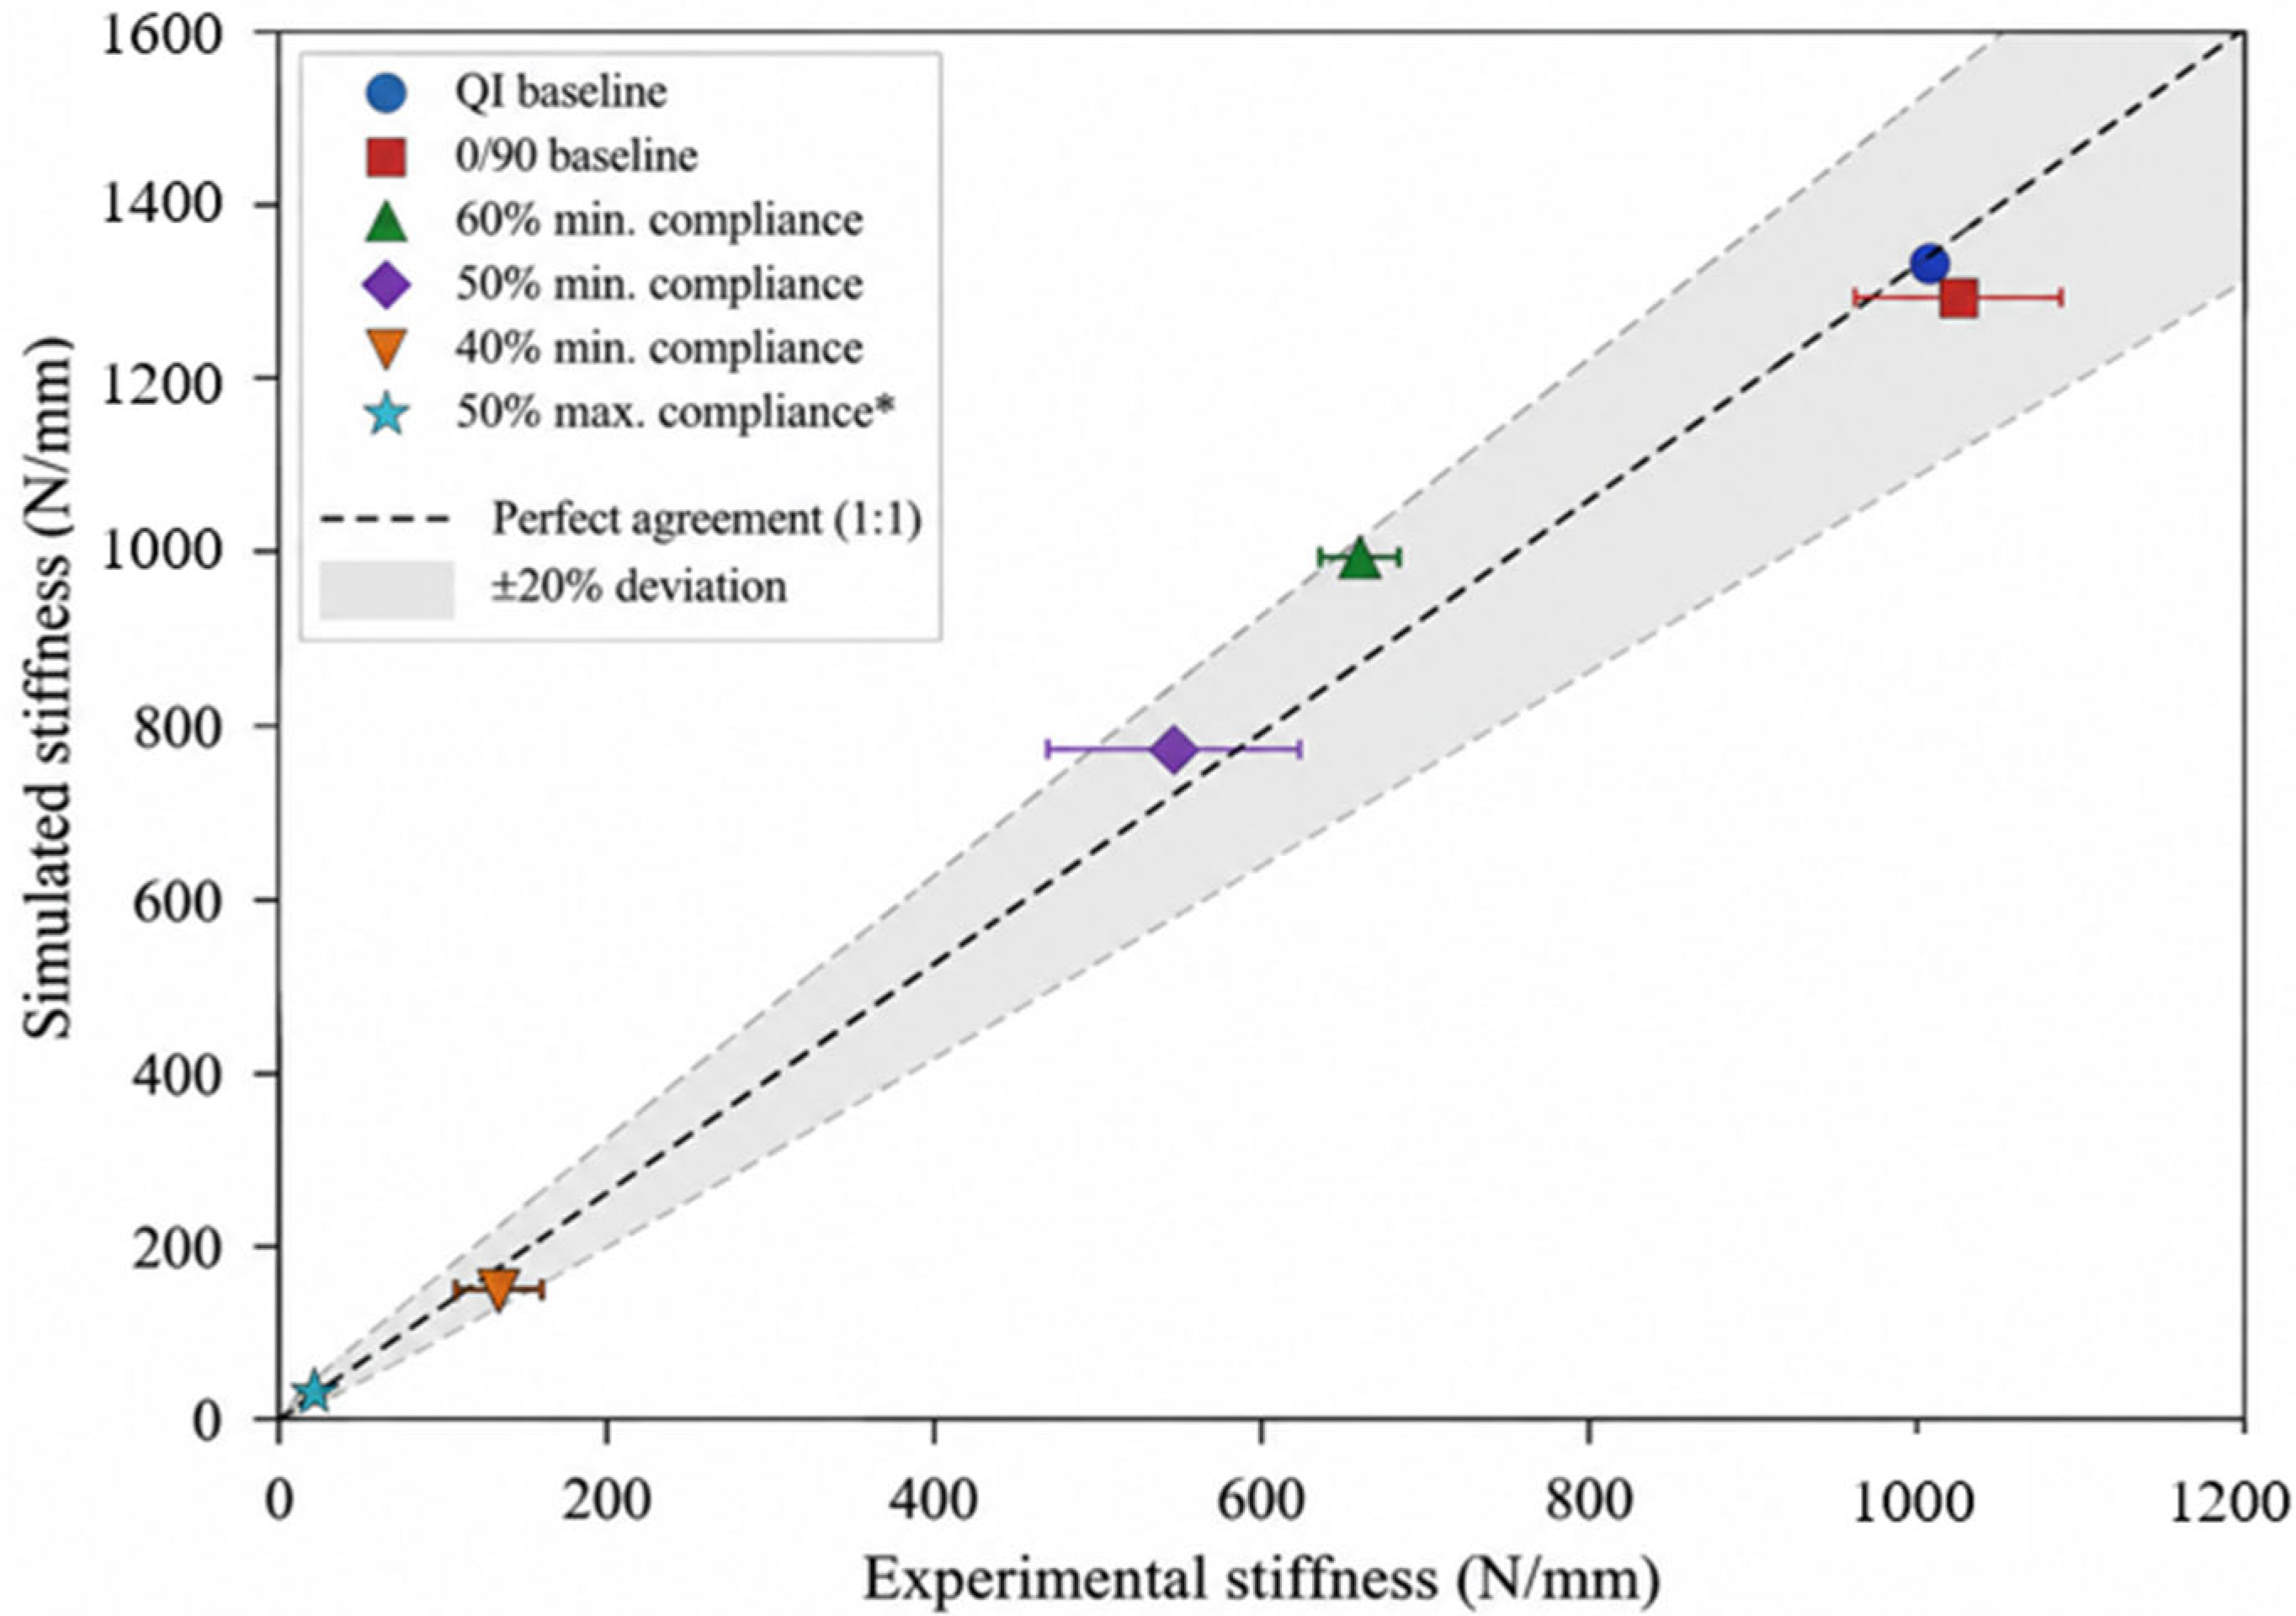
Experimental and simulated stiffness values are summarized in Table 6 and Figure 7. For the baseline and minimum-compliance configurations, the simulations overpredicted mean experimental stiffness by approximately 14–52%. The largest discrepancy occurred for the 60% retained-mass minimum-compliance configuration, followed by the 50% retained-mass minimum-compliance configuration. The 40% retained-mass configuration showed substantially closer agreement.
Table 6.
Comparison of experimentally measured system-level stiffness and simulated structural stiffness. Experimental values represent mean ± one standard deviation.
Figure 7.
Comparison of simulated and experimentally measured structural stiffness for the six bracket configurations using the 25–60% regression interval. Horizontal error bars represent ±1 standard deviation of the experimental measurements. The dashed line represents perfect simulation–experiment agreement; the shaded region indicates ±20% deviation from perfect agreement. * The maximum-compliance configuration is shown as an exploratory contrasting case.
The 50% maximum-compliance configuration produced an approximately 0.4% difference between simulated and experimental stiffness after reanalysis using the 25–60% interval. Because this configuration was intentionally generated using a fundamentally different optimization objective and occupies the extreme low-stiffness end of the dataset, it is treated as an exploratory contrasting case rather than primary evidence of predictive capability.
4. Discussion
The results demonstrate a systematic difference between the idealized finite element response and the experimentally measured system-level stiffness. Because the experimental quantity was derived from crosshead extension, it includes compliance associated with the load frame, fixture, pins, seating, and specimen, whereas the shell model represents only the idealized reconstructed component. The comparison should therefore be interpreted as an end-to-end assessment of the simplified engineering workflow rather than as isolated validation of the homogeneous material model. Additional differences between the idealized and manufactured systems may arise from porosity, interlayer adhesion, fiber orientation, and other process-induced defects, which have been shown to influence the mechanical response of FFF fiber-reinforced polymers [4,16,24,25].
Several evaluated factors were insufficient by themselves to explain the largest discrepancies. Mesh refinement produced relatively small changes in global stiffness, and variations in the investigated assumed out-of-plane elastic properties changed predicted stiffness by less than approximately 3%. However, these analyses do not constitute a complete uncertainty propagation. In particular, the measured in-plane properties exhibited specimen-level variability of 17.4% for , 3.7% for , and 4.9% for , and these variations were not propagated through the finite element model. In addition, the D3039 moduli were derived from crosshead displacement and may include machine and grip compliance. Material uncertainty therefore remains one contributor to the overall prediction uncertainty.
The use of a two-dimensional SHELL181 laminate model also limits the representation of localized three-dimensional behavior. Although the shell formulation is suitable for evaluating the global membrane-dominated stiffness investigated here, it does not explicitly resolve through-thickness bearing stresses, interlayer shear concentrations, pin–hole contact, or local three-dimensional deformation near the loading holes. Consequently, the present model should be interpreted as a global stiffness model rather than as a high-fidelity predictor of local stress or failure initiation.
A further limitation arises from the topology-generation stage itself. Candidate geometries were generated using isotropic structural steel rather than the anisotropic CF/PLA constitutive model. Consequently, the resulting load paths reflect an isotropic strain-energy distribution and do not represent material-specific optimum topologies for the printed composite. The present results therefore characterize the behavior of CF/PLA structures derived from isotropic topology optimization rather than the coupled interaction of anisotropy and topology optimization. Material-aware or deposition-aware topology optimization would be required to address that separate question.
Another potential source of discrepancy is the difference between the idealized ply orientations represented in the finite element model and the actual deposition paths generated by the slicer. In the simulation, each ply was assigned a uniform material orientation, whereas the printed parts required perimeter walls and locally varying raster directions to accommodate curved boundaries and thin topology-optimized members. This type of process-induced fiber-orientation variation has also been identified as an important contributor to the effective properties of short-fiber FDM composites [4,13,16]. More recent G-code-driven modeling approaches have demonstrated that actual slicer-generated deposition paths can be incorporated directly into filament-level finite element representations, providing a route toward more explicit treatment of local toolpath geometry and orientation [26]. To investigate this effect, the G-code for the 60% mass-retained geometry was analyzed using a custom Python (version 3.15.0) script to quantify the deposited raster orientations. Approximately 8% of the deposited filament length was oriented outside the intended 0°/90° directions, with most of the deviation occurring in perimeter regions. Although this percentage is relatively small compared with the magnitude of the observed stiffness error, the present analysis does not eliminate the possibility that local raster reorientation near highly stressed regions influenced the response. The G-code analysis therefore establishes that local deposition paths deviate from the idealized ply orientations but does not establish a quantitative causal relationship between these deviations and stiffness error. Because raster orientation was evaluated globally by deposited-filament length rather than weighted by local stress or strain energy, raster mismatch should be considered one potential contributor rather than the primary demonstrated cause of the discrepancy. The Python script used for this analysis is included in the Supplementary Materials.
Geometry realization also remains an unresolved source of uncertainty. The reconstructed CAD outlines were visually overlaid with the topology-optimization results during manual tracing, but local ligament dimensions were not quantitatively compared. Moreover, the tested specimens were no longer available for retrospective dimensional measurement. The contribution of differences among optimized, reconstructed, and printed geometries therefore cannot be isolated from the observed stiffness error. This limitation is particularly relevant for the thin-member configurations, for which stiffness may be sensitive to relatively small dimensional deviations.
Although these post peak observations do not explain the initial elastic stiffness discrepancy, they provide qualitative information regarding load redistribution after damage initiation. For the 50% and 60% mass-retained minimum-compliance geometries, failure consistently initiated near the regions of maximum simulated stress. After the primary fracture occurred, adjacent supporting members continued to carry load, producing the gradual postpeak load response observed in the experimental force–displacement curves. This behavior suggests that multiple structural members contributed to the overall load transfer, a condition that is not fully represented by the simplified linear elastic model.
The 50% retained-mass maximum-compliance configuration was intentionally generated as an exploratory low-stiffness contrast rather than as a structural design optimized for stiffness. Its close simulation–experiment agreement should therefore not be interpreted as validation of the workflow or included as primary evidence of predictive performance. Its main value in the present study is to illustrate the markedly different structural response created by an opposing optimization objective.
Within the geometries investigated, the two largest discrepancies occurred for the 50% and 60% minimum-compliance configurations containing multiple thin load-bearing members, whereas the 40% and maximum-compliance configurations showed better agreement. This trend coincided with the removal of intermediate supporting ribs and the development of more localized structural load paths. However, the present study considered only a limited set of related geometries and did not define an independent quantitative measure of geometric complexity. This observation should therefore be interpreted as a trend within the present dataset rather than as a general relationship between geometric complexity and simulation accuracy.
5. Conclusions
This study evaluated the end-to-end accuracy of a simplified engineering workflow combining coupon-derived anisotropic properties, isotropic topology generation, laminate shell analysis, geometry reconstruction, FDM fabrication, and component testing for short-carbon-fiber-reinforced PLA brackets. Using a revised 25–60% regression interval that produced highly linear experimental fits, the finite element model overpredicted the measured stiffness of the baseline and minimum-compliance configurations by approximately 14–52%.
The additional analyses narrow, but do not fully resolve, the origin of these discrepancies. Mesh refinement and the investigated assumed out-of-plane elastic properties had comparatively small effects on predicted stiffness. However, uncertainty remains in the experimentally measured in-plane properties, crosshead-based modulus and bracket displacement measurements, geometry reconstruction, printed dimensions, pin/contact behavior, and deposition-path representation. The present experiments therefore assess the practical error of the complete simplified workflow rather than uniquely validating or invalidating the homogeneous material model.
The results show that a low-cost commercial workflow can reproduce the order of magnitude and qualitative stiffness response of the investigated structures, but its quantitative accuracy is not sufficient for high-fidelity prediction without additional characterization and modeling. Future work should incorporate independently measured through-thickness properties, local displacement measurement independent of machine and fixture compliance, explicit pin-contact modeling, G-code-driven local deposition-path representation [26], quantitative dimensional and porosity characterization, material-aware topology optimization, larger experimental sample sizes, and a broader range of optimized geometries.
Supplementary Materials
The following supporting information can be downloaded at: https://www.mdpi.com/article/10.3390/app162010372/s1, Figure S1. Fractured quasi-isotropic baseline bracket (a) and corresponding simulated and experimental force-displacement responses (b). Figure S2. Fractured 50% retained-mass minimum-compliance topology-optimized bracket (a) and corresponding simulated and experimental force-displacement responses (b). Figure S3. Fractured 40% retained-mass minimum-compliance topology-optimized bracket (a) and corresponding simulated and experimental force-displacement responses (b). Figure S4. Baseline geometry equivalent stress plot (a) raster angles in the 0 degree (b) and 90 degree (c) directions. The nominal raster orientations in these regions are consistent with the material orientations assigned in the finite element model. Figure S5. Baseline geometry equivalent stress plot (a). Raster angles in the 45 degree (b), 0 degree (c), −45 degree (d), and 90 degree (e) directions. The raster angles are well represented by the simulation. Figure S6. 40% Mass reduced geometry. Equivalent stress plot (a) raster angles in the 0 degree (b) and 90 degree (c) directions. Figure S7. Static stress results on the 50% mass reduction target (a). Raster angles in the ribs are shown to be parallel mostly with the direction of the rib rather than retaining the orientation of the rest of the ply in the 0 direction (b) and the 90 direction (c). The stress distribution indicates that the ribs participate in load transfer, while the slicer-generated deposition paths locally follow the rib boundaries rather than the nominal global raster directions. Figure S8. Static stress results on the 60% mass reduction target (a). Raster angles in the ribs are shown to be parallel mostly with the direction of the rib rather than retaining the orientation of the rest of the ply in the 0 direction (b) and the 90 direction (c). The stress distribution indicates that the ribs participate in load transfer, while the slicer-generated deposition paths locally follow the rib boundaries rather than the nominal global raster directions. Figure S9. Mass reduction target 50% however the compliance objective was set to maximize and therefore reduce stiffness. The reduced stiffness reflects the maximum-compliance optimization objective. The observed failure location is consistent with the dominant load path identified experimentally. Table S1. Individual experimental structural stiffness values and regression coefficients used in the revised validation analysis. Code S1. Excerpt from the Python script used to determine the deposited raster-angle distribution from slicer-generated G-code.
Author Contributions
Conceptualization, J.S. and V.V.; Methodology, J.S., A.A. and V.V.; Software, V.V.; Validation, J.S., A.A. and V.V.; Formal analysis, J.S., E.C. and V.V.; Investigation, J.S., A.A. and V.V.; Resources, A.A. and V.V.; Data curation, E.C. and V.V.; Writing—original draft, J.S.; Writing—review & editing, A.A., E.C. and V.V.; Visualization, J.S., E.C. and V.V.; Supervision, A.A., E.C. and V.V.; Project administration, A.A., E.C. and V.V.; Funding acquisition, V.V. All authors have read and agreed to the published version of the manuscript.
Funding
This research received no external funding.
Institutional Review Board Statement
Not applicable.
Informed Consent Statement
Not applicable.
Data Availability Statement
The data presented in this study are available on request from the corresponding author.
Acknowledgments
Toray Advanced Composites, Morgan Hill, CA, USA, is acknowledged for performing the tests and providing data for ASTM D3518 in-plane shear with biaxial strain measurement at their Morgan Hill facility. Informed consent was obtained from Toray Advanced Composites, Morgan Hill, CA, USA, to publish the results of their mechanical tests ASTM D3518. The authors acknowledge the use of Claude (Anthropic) for assistance in developing Python scripts for G-code parsing and special raster analysis.
Conflicts of Interest
The authors declare no conflicts of interest.
Abbreviations
The following abbreviations are used in this manuscript:
| PLA | Polylactic acid |
| FDM | Fused deposition modeling |
| TO | Topology optimization |
| QI | Quasi-isotropic |
| CAD | Computer-aided design |
| SIMP | Solid isotropic material penalization |
| PEI | Polyetherimide |
| ASTM | American Society for Testing and Materials (ASTM International) |
References
- Ferreira, R.T.L.; Amatte, I.C.; Dutra, T.A.; Bürger, D. Experimental characterization and micrography of 3D printed PLA and PLA reinforced with short carbon fibers. Compos. Part B Eng. 2017, 124, 88–100. [Google Scholar] [CrossRef] [Scilit]
- Kunc, V.; Velez-Garcia, G.M.; Duty, C.E.; Love, L.J.; Naskar, A.K.; Blue, C.A.; Ozcan, S. Highly oriented carbon fiber–polymer composites via additive manufacturing. Compos. Sci. Technol. 2014, 105, 144–150. [Google Scholar] [CrossRef] [Scilit]
- Gavali, V.C.; Kubade, P.R.; Kulkarni, H.B. Mechanical and thermo-mechanical properties of carbon fiber reinforced thermoplastic composite fabricated using fused deposition modeling method. Mater. Today Proc. 2020, 22, 1786–1795. [Google Scholar] [CrossRef] [Scilit]
- Wang, Z.; Zhang, B.; Sun, J.; Wang, J. Revealing the process-structure-property correlations in fused deposition modeling of short fiber filled composites via fiber orientation analysis. Appl. Compos. Mater. 2025, 32, 493–523. [Google Scholar] [CrossRef] [Scilit]
- Cao, L.; Xiao, J.; Kim, J.K.; Zhang, X. Effect of post-process treatments on mechanical properties and surface characteristics of 3D printed short glass fiber reinforced PLA/TPU using the FDM process. CIRP J. Manuf. Sci. Technol. 2023, 41, 135–143. [Google Scholar] [CrossRef] [Scilit]
- Tanabi, H.; Ndacyayisenga, W.; Ghaziani, M. A multi-objective investigation of warpage and mechanical performance in FDM-printed thermoplastic composites. J. Compos. Mater. 2025, 59, 2465–2483. [Google Scholar] [CrossRef] [Scilit]
- Dubey, D.; Singh, S.P.; Behera, B.K. Mechanical, thermal, and microstructural analysis of 3D printed short carbon fiber-reinforced nylon composites across diverse infill patterns. Prog. Addit. Manuf. 2025, 10, 1671–1689. [Google Scholar] [CrossRef] [Scilit]
- Kumar, C.N.; Venkatesan, S. A review on the fused deposition modelling of fibre-reinforced polymer composites: Influence of process parameters, pre-processing and post processing techniques. Proc. Inst. Mech. Eng. Part L J. Mater. Des. Appl. 2024, 238, 2096–2119. [Google Scholar] [CrossRef] [Scilit]
- Gomez-Gras, G.; Jerez-Mesa, R.; Travieso-Rodriguez, J.A.; Lluma-Fuentes, J. Fatigue performance of fused filament fabrication PLA specimens. Mater. Des. 2018, 140, 278–285. [Google Scholar] [CrossRef] [Scilit]
- ASTM D3039/D3039M-17; Standard Test Method for Tensile Properties of Polymer Matrix Composite Materials. ASTM International: West Conshohocken, PA, USA, 2017.
- ASTM D3518/D3518M-18; Standard Test Method for In-Plane Shear Response of Polymer Matrix Composite Materials by Tensile Test of a ±45° Laminate. ASTM International: West Conshohocken, PA, USA, 2018.
- Dai, S.; Deng, Z.C.; Yu, Y.J.; Zhang, K.; Wang, S.H.; Ye, J. Orthotropic elastic behaviors and yield strength of fused deposition modeling materials: Theory and experiments. Polym. Test. 2020, 87, 106520. [Google Scholar] [CrossRef] [Scilit]
- Lei, M.; Wang, Y.; Wei, Q.; Li, M.; Zhang, J.; Wang, Y. Numerical homogenization calculation of effective stiffness of fused deposition modeling printing carbon fiber reinforced polylactic acid composites. 3D Print. Addit. Manuf. 2024, 11, 1863–1876. [Google Scholar] [CrossRef] [Scilit] [PubMed]
- Behseresht, S.; Park, Y.H. Additive manufacturing of composite polymers: Thermomechanical FEA and experimental study. Materials 2024, 17, 1912. [Google Scholar] [CrossRef] [Scilit] [PubMed]
- Liu, B.; Dong, B.; Li, H.; Lou, R.; Chen, Y. 3D printing finite element analysis of continuous fiber reinforced composite materials considering printing pressure. Compos. Part B Eng. 2024, 277, 111397. [Google Scholar] [CrossRef] [Scilit]
- Mojumder, S.; Suarez, D.; Abbott, T.; Liu, W.K. Multiscale modeling of process-induced defects in fused filament fabrication-printed materials. Adv. Eng. Mater. 2025, 27, 2402592. [Google Scholar] [CrossRef] [Scilit]
- Kurkin, E.; Espinosa Barcenas, O.U.; Kishov, E.; Lukyanov, O. Topology optimization and efficiency evaluation of short-fiber-reinforced composite structures considering anisotropy. Computation 2024, 12, 35. [Google Scholar] [CrossRef] [Scilit]
- Qiu, Z.; Li, Q.; Luo, Y.; Liu, S. Concurrent topology and fiber orientation optimization method for fiber-reinforced composites based on composite additive manufacturing. Comput. Methods Appl. Mech. Eng. 2022, 395, 114962. [Google Scholar] [CrossRef] [Scilit]
- Meng, K.; Fu, J.; Qu, D.; Li, L.; Liu, J. Dynamic topology optimization incorporating the material anisotropy feature for 3D printed fiber composite structures. Finite Elem. Anal. Des. 2025, 243, 104281. [Google Scholar] [CrossRef] [Scilit]
- Micro Center. Inland 1.75 mm PLA Carbon Fiber 3D Printer Filament; Micro Center: Hilliard, OH, USA, 2024; Available online: https://www.microcenter.com (accessed on 1 May 2025).
- Creality 3D Technology Co., Ltd. Creality K1C 3D Printer; Creality 3D Technology Co., Ltd.: Shenzhen, China, 2024. [Google Scholar]
- Creality 3D Technology Co., Ltd. Creality Print, Version 5.0; Creality 3D Technology Co., Ltd.: Shenzhen, China, 2024. [Google Scholar]
- ANSYS Inc. ANSYS Mechanical, Release 2026 R1; ANSYS Inc.: Canonsburg, PA, USA, 2026. [Google Scholar]
- Vălean, E.; Foti, P.; Berto, F.; Marșavina, L. Static and fatigue behavior of 3D printed smooth and notched PLA and short carbon fibers reinforced PLA. Theor. Appl. Fract. Mech. 2024, 131, 104417. [Google Scholar] [CrossRef] [Scilit]
- Singhal, P.; Katiyar, P.; Ramachandran, U.; Davuluri, S.; Sujithra, R. Mode-I and mode-II fracture toughness investigation on FDM-printed PLA/CF-PLA laminate composite. J. Mech. Sci. Technol. 2025, 39, 129–136. [Google Scholar] [CrossRef] [Scilit]
- Li, D.; Dun, Y.; Yang, Z.; Zhou, R.; Chen, Y. A G-Code-Driven Modeling and Thermo-Mechanical Coupling Analysis Method for the FDM Process of Complex Lightweight Structures. Materials 2026, 19, 1200. [Google Scholar] [CrossRef] [Scilit] [PubMed]

Disclaimer/Publisher’s Note: The statements, opinions and data contained in all publications are solely those of the individual author(s) and contributor(s) and not of MDPI and/or the editor(s). MDPI and/or the editor(s) disclaim responsibility for any injury to people or property resulting from any ideas, methods, instructions or products referred to in the content. |
© 2026 by the authors. Licensee MDPI, Basel, Switzerland. This article is an open access article distributed under the terms and conditions of the Creative Commons Attribution (CC BY) license.