


Abstract
Within natural rock masses, discontinuous joints are more prevalent than continuous joints. Discontinuous joints refer to non-persistent structural planes separated by intact rock bridges and can be quantified by the continuity coefficient KA. They significantly affect the macroscopic mechanical properties of rock masses. Therefore, investigating discontinuous jointed rock masses with diverse morphologies carries considerable theoretical and engineering significance. Using 3D printing technology, resin-based specimens with discontinuous joints were subjected to laboratory mechanical tests to explore the evolution of failure mechanisms and mechanical properties of discontinuous jointed rock masses with different inclinations, undulation amplitudes, and structural plane continuity. Results show that under compression, discontinuous jointed rock masses consistently undergo combined tensile and shear stresses, with joint undulation amplitude and continuity governing coplanar crack initiation. As the joint inclination angle ranges from 0° to 90°, the peak compressive strength first decreases and then increases: specimens with continuous joints or discontinuous joints (continuity coefficient KA < 0.25) follow a “V”-shaped trend, while those with KA > 0.25 exhibit a “U”-shaped trend. Joint continuity is a key factor governing rock mass strength: at the same rock column radius, higher continuity results in lower strength, and vice versa. Joint morphology also influences strength, with specimens with regular zigzag joints and rectangular corrugated joints exhibiting 6.7% and 11.2% higher strength than smooth-jointed specimens, respectively. These results clarify the effects of joint continuity and undulation on rock mass strength, providing a theoretical foundation for the rapid determination of KA via borehole imaging and laser scanning in engineering practice, and enabling direct prediction of rock mass strength trends.
1. Introduction
Natural rock masses usually contain both microscale and macroscale joint structures. Compressive instability of such rock masses typically starts with crack initiation and propagation at defect locations, and the geometric characteristics of natural joints play a decisive role in regulating the mechanical behaviors of rock masses [1]. From an engineering perspective, the stability risks induced by discontinuous joints have become increasingly prominent in complex mountainous infrastructure projects, presenting urgent technical challenges: For tunnels, discontinuous joints in surrounding rock easily lead to local collapse or large-scale deformation during excavation, especially in deep or high-stress mountainous areas [2]; for lattice cell towers and support foundations of large structures, the uneven distribution of short discontinuous joints in mountainous rock masses may cause differential settlement of compact foundations, threatening the structural integrity of towers and overhead supports [3]; for long-distance oil and gas pipelines laid in mountainous terrain, the interaction between pipelines and surrounding jointed rock masses (coupled with overpass support loads) can result in pipeline deformation, leakage, or even fracture under long-term geological movement or external loads [4]. In practical engineering, large continuous structural surfaces can be avoided through rational site selection, but short and discontinuous joints are widely distributed and difficult to eliminate, making them a key hazard threatening the stability of underground projects (e.g., tunnels) and above-ground mountainous infrastructures [2,5]. Deeply understanding their deformation and fracture mechanisms is therefore of great theoretical value and practical significance for ensuring the long-term safety and reliability of engineering structures.
Existing studies, including indoor experiments [6] and numerical simulations [7,8,9], have shown that joint dip angle significantly affects the failure modes and mechanical properties of discontinuous jointed rocks. Sun et al. [10] used the steel sheet method to fabricate rock-like specimens with parallel open cracks at different joint dip angles. They conducted triaxial compression tests and found only tensile failure and tensile-shear failure occurred. Liu et al. [11] prepared rock-like specimens with multiple joints at different dip angles and carried out uniaxial compression tests. They observed that the main crack types in multi-joint rock masses are wing cracks and secondary coplanar cracks. Cao et al. [12] fabricated discontinuous jointed rock-like specimens with different joint dip angles by controlling the number and position of inserted mica sheets. They performed compression–shear tests and identified four failure modes: plane shear failure, complete shear failure, oblique shear failure, and step-wise failure.
Regarding the mechanical properties of rocks, Zhao et al. [13] used the water jet cutting method to prepare gypsum specimens with discontinuous joints. They conducted uniaxial compression tests and found that the uniaxial compressive strength showed a “U”-shaped variation with increasing joint dip angle. Han et al. [14] inserted resin sheets to fabricate specimens with discontinuous joints and carried out uniaxial and biaxial compression tests. They observed that the uniaxial compressive strength exhibited a W-shaped trend, while the biaxial compressive strength showed a V-shaped trend with increasing joint dip angle; additionally, cracks mostly appeared in pairs around the joints and were bilaterally symmetrical. Chen et al. [15] used alloy rods to fabricate rock-like specimens with discontinuous joints at different crack dip angles. They conducted uniaxial compression tests and found that crack dip angle significantly influenced the strength and deformation modulus of the specimens. They also identified five failure modes: tensile failure across the crack surface, rotational failure of newly generated blocks, mixed failure mode, shear failure, and splitting failure. It should be clarified that these U-, V-, and W-shaped strength trends reflect distinct relationships between joint dip angle and rock mass strength: the V-shaped trend means strength reaches the minimum at a dip angle of ~45° and is relatively higher at 0° and 90°; the U-shaped trend features a broader low-strength interval around 45°, with gradual strength increase at angles deviating from this range; the W-shaped trend (mostly reported in multi-joint studies) shows two low-strength peaks due to the superposition of multiple joint effects [6].
The number and orientation of discontinuous joints have a profound impact on the energy evolution characteristics of multi-joint rock masses. Cao et al. [12] conducted uniaxial compression tests on rock-like specimens with cross-shaped discontinuous joints. They found that input energy and strain energy were basically consistent with the uniaxial compressive strength of the specimens. In contrast, dissipated energy was the lowest and showed certain fluctuations with increasing joint dip angle. Pan et al. [16] carried out uniaxial compression tests on granite specimens with conjugate joints. They found that compared with intact rock without conjugate joints, the total energy, elastic strain energy, and dissipated energy of jointed specimens were significantly reduced during the failure stage. In another study [17], the team combined numerical simulations with uniaxial compression tests. They further derived and verified the quantitative functional relationship between rock joint density and energy density. The results showed that under the same total input energy, higher joint density led to greater damage-induced dissipated energy of the rock mass. Meanwhile, joint density was significantly correlated with the rock mass’s ability to store elastic strain energy: the higher the density, the weaker the storage capacity.
Previous research has highlighted a key challenge: preparing physical models of fissures is complex. This complexity has constrained indoor experimental research on discontinuous jointed rock masses. Traditional preparation methods, such as the steel sheet insertion method and water jet cutting method, have obvious limitations. They are mostly limited to simple joint configurations, such as double joints, triple joints, or regularly arranged multiple sets of parallel straight joints. More importantly, research on the influence of the joint continuity coefficient (KA) on rock mass mechanical behaviors remains insufficient. In recent years, the emergence of 3D printing technology has provided a new approach for the precise preparation of complex jointed rock masses [18,19,20]. Wang et al. [21] used 3D printing technology to fabricate joint network models with different geometric shapes. They confirmed that this technology can achieve high-precision replication of complex fracture networks. This lays a solid foundation for the repeated production and comparative analysis of samples in indoor experiments. Dong et al. [22] integrated 3D printing technology with artificial casting methods. They fabricated physical model specimens of fractured sandstone rock masses and conducted shear tests under two conditions. The two conditions were: “shear stress parallel to the trace plane” and “shear stress perpendicular to the trace plane”. This approach facilitated the analysis of the shear failure characteristics, shear stress evolution features, and shear strength of fractured rock masses. Yun et al. [23] employed 3D printing technology combined with cement mortar materials. They fabricated standardized specimens with different joint roughness coefficients (JRC) and different inclinations of serrated joints. Subsequently, uniaxial compression tests were conducted on these specimens. The results showed that rough serrated joints exert a strengthening effect on rock masses’ resistance to vertical loads. Additionally, larger joint roughness can effectively mitigate the shear slip failure of jointed rock masses.
To address the aforementioned research gaps, this study employs high-precision 3D printing technology to achieve three key innovations: First, we for the first time develop a controllable preparation method for discontinuous jointed rock masses, realizing gradient design of continuity coefficient KA by precisely regulating the diameter and length of rock bridges—this overcomes the limitation of traditional methods (e.g., steel sheet insertion, water jet cutting) that can only simulate fixed or simple joint continuity. Second, we systematically conduct uniaxial compression tests under five inclination levels on specimens with diverse joint characteristics (discontinuous straight joints with gradient KA, triangular/rectangular corrugated joints), revealing the coupling mechanism between joint inclination angle and KA as well as the quantitative influence mechanism of corrugated surface structures—an integration of multi-parameter synergy rarely explored in existing studies. Third, unlike conventional engineering stability assessments relying on empirical formulas (e.g., Hoek-Brown criterion [24,25,26]) or simplified models, this study establishes a direct quantitative mapping relationship between KA and rock mass strength. This relationship not only provides a theoretical basis for rapid in situ KA determination via borehole imaging or laser scanning but also enables direct prediction of rock mass strength trends, bridging the gap between laboratory tests and engineering practice with distinct practical value.
To further clarify the contribution and originality of this work, we compare its key findings with those of similar experimental and numerical studies, emphasizing both commonalities and differences: Similarities with existing research lie in the adoption of laboratory tests or 3D printing technology to explore the mechanical properties of jointed rock masses. For example, Dong et al. [22] used 3D printing to study the shear failure characteristics of fractured sandstone, confirming the reliability of 3D printing in simulating complex joint structures; Yuan et al. [23] investigated the uniaxial compressive properties of rough jointed rock masses based on 3D printing, highlighting the strengthening effect of joint roughness; Cao et al. [12] analyzed the failure modes of multi-jointed rock-like materials under compressive–shear tests, emphasizing the influence of joint dip angle on strength. Notably, this study differs from and advances existing research in three core aspects: (1) In specimen preparation, most prior studies (e.g., [12,23]) focused on fixed joint continuity or single roughness, while this study realizes gradient control of KA through precise regulation of rock bridge parameters, enabling systematic analysis of continuity-dependent mechanical behaviors. (2) In parameter analysis, existing works mainly explored the independent influence of single factors (dip angle [14], roughness [23], or continuity [5]), whereas this study comprehensively reveals the coupling effect of dip angle, KA, and corrugated morphology, filling the gap in multi-parameter synergy research. (3) In engineering application, while studies like [22,24] provided qualitative failure mechanisms, this study quantifies the strength enhancement effect of corrugated joints (6.7% for triangular, 11.2% for rectangular) and establishes a practical KA-strength mapping relationship, which can directly support in situ strength prediction—an advantage not offered by previous qualitative analyses. In summary, this study not only verifies the general laws of jointed rock mass mechanics observed in similar studies but also breaks through the limitations of existing research in controllable specimen preparation, multi-parameter coupling analysis, and engineering quantification, providing a more comprehensive theoretical and practical basis for jointed rock mass stability assessment.
2. Indoor Tests on Discontinuous Jointed Rock Masses
Leveraging the advantages of concrete—including facile processability, mechanical properties similar to those of rock, a homogeneous internal structure, and excellent controllability—and given that resin can effectively simulate discontinuous joint surfaces with different continuities and inclination angles in rock masses during compression tests, this study achieved indoor experimental simulation of discontinuous jointed rock-like materials.
2.1. Fabrication of Discontinuous Joints
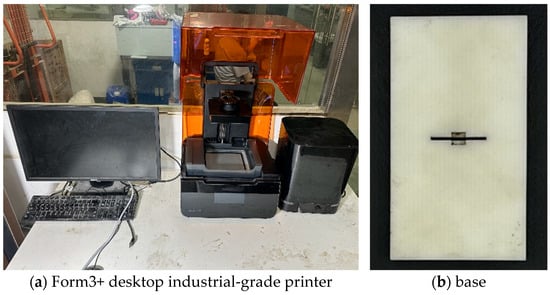
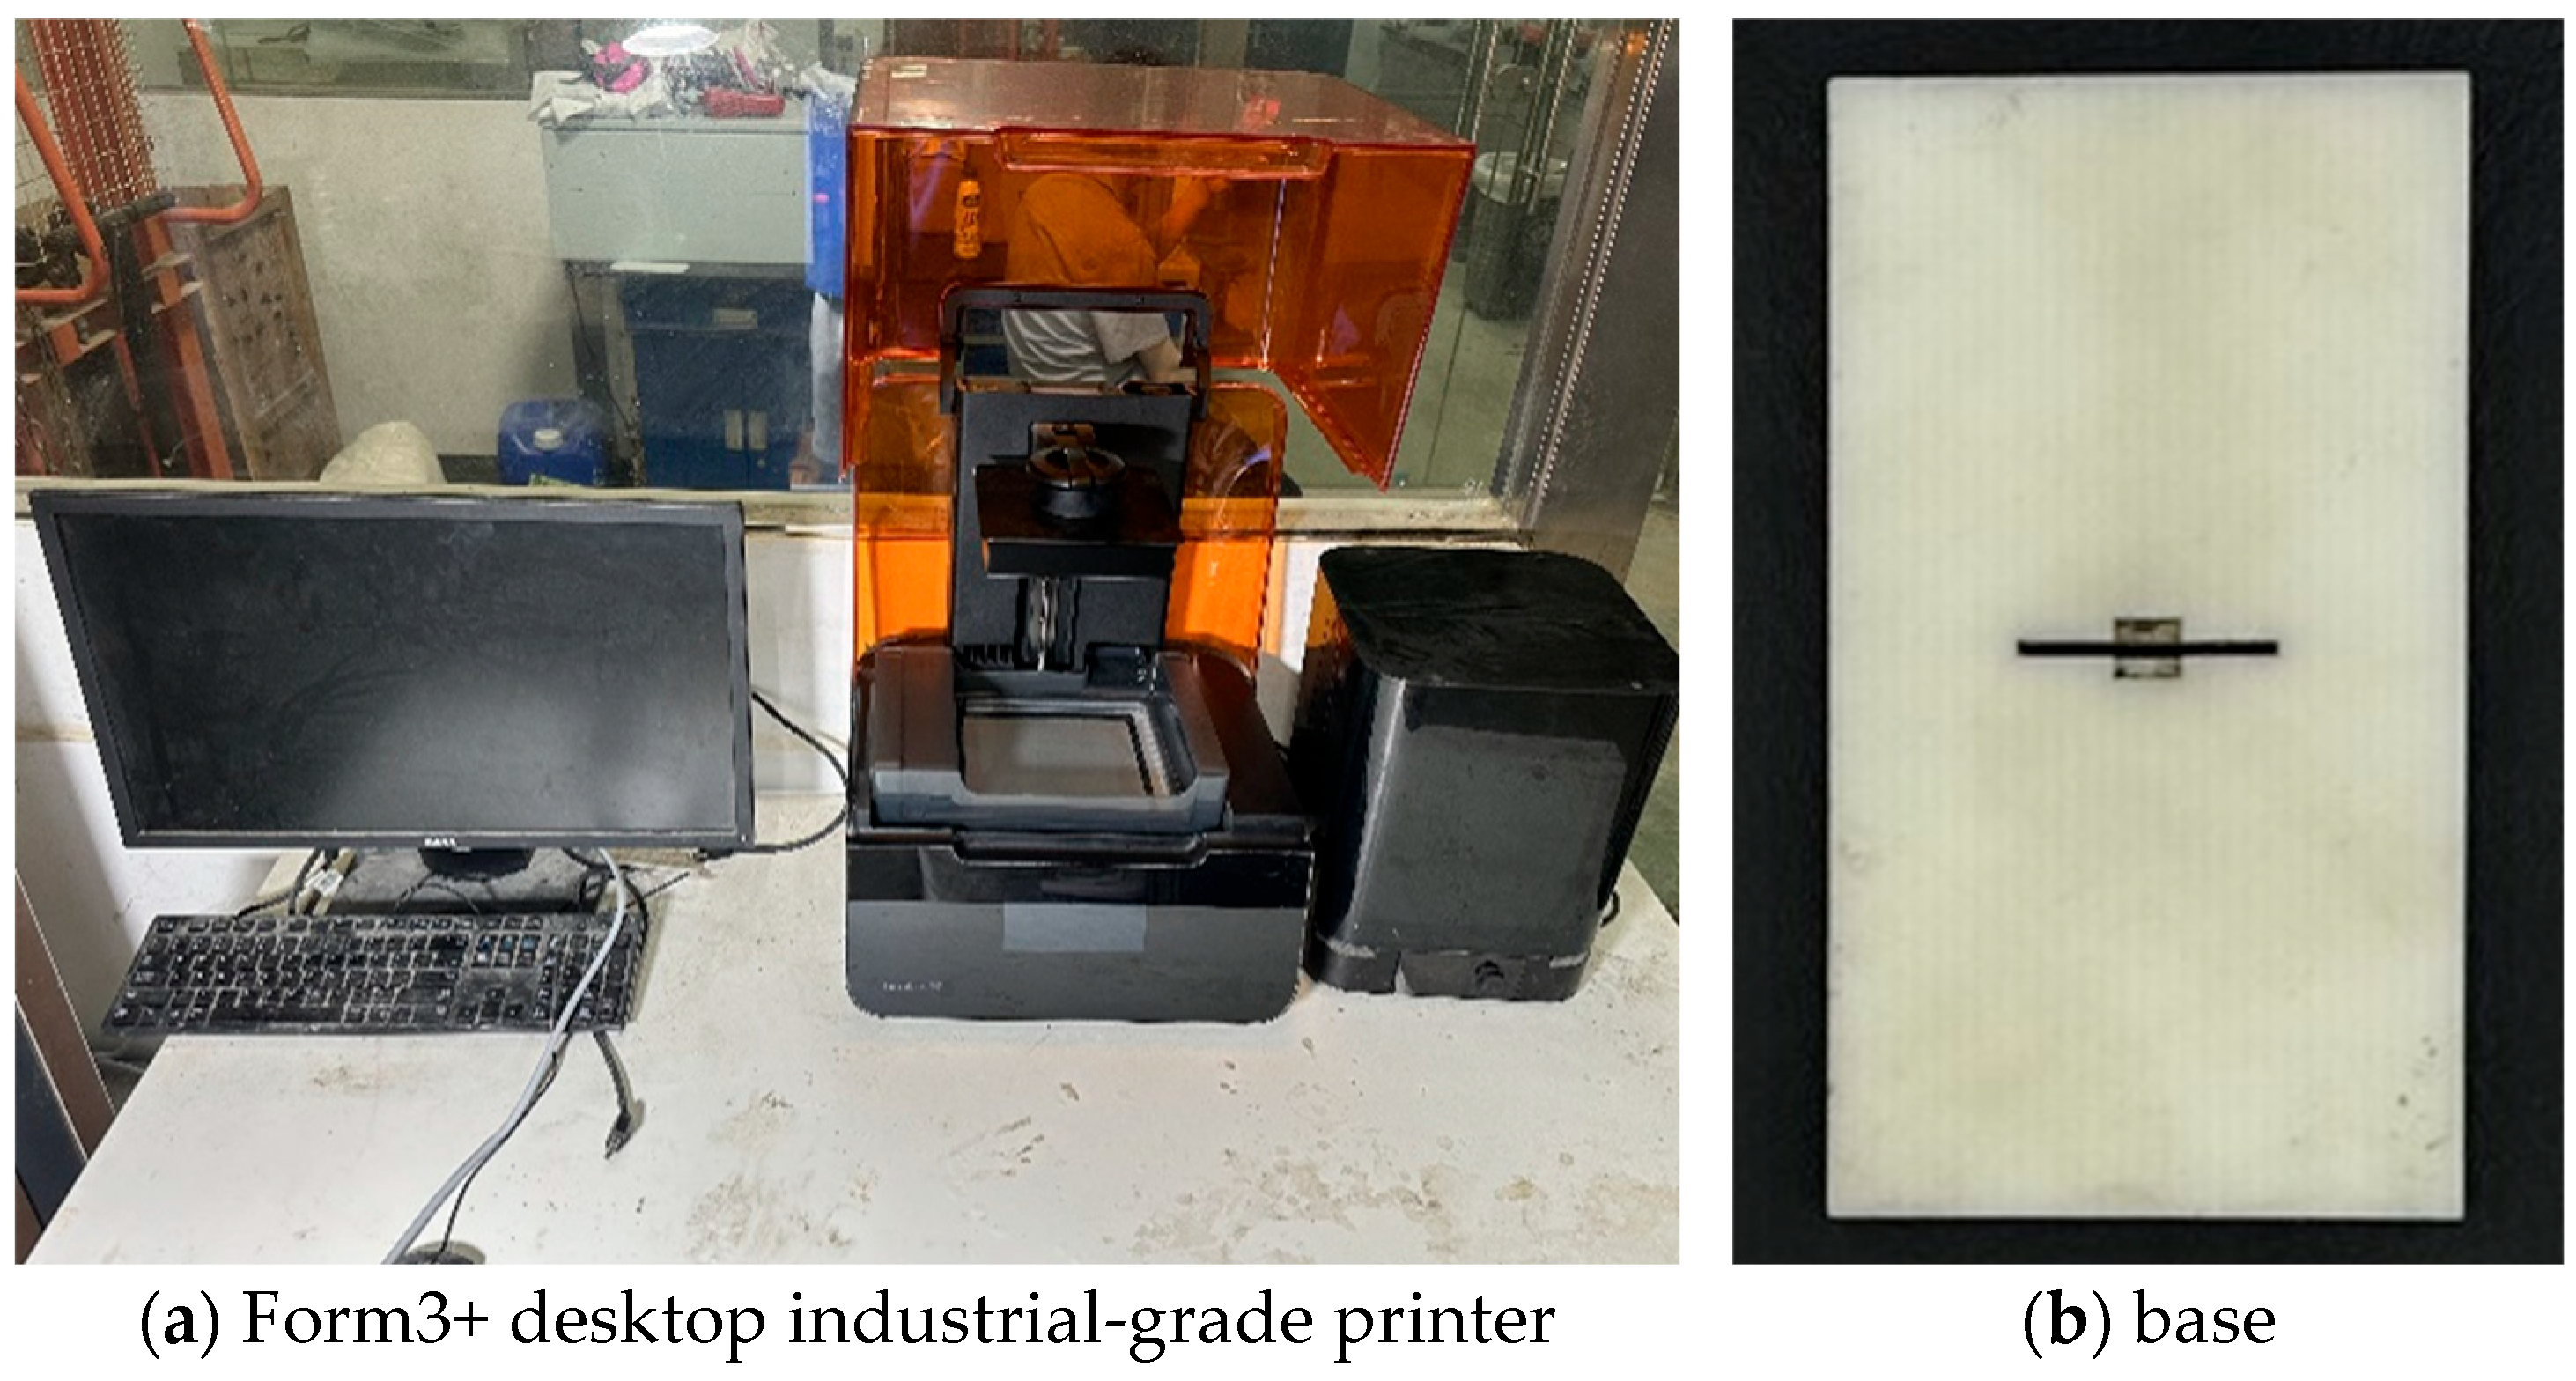
To simulate the joints in rock masses, resin was employed in this experiment, with the joint inclination angle controlled by adjusting the angle between the joint surfaces and the inserts. First, a 3D model was constructed using AutoCAD 2024 and exported as the corresponding STL file, which was then imported into PreForm 4.21.0 for slicing. Subsequent 3D printing was performed using a Form3+ stereolithography 3D printer (Formlabs, Inc., Somerville, MA, USA) (Figure 1a), with white special resin for Form3+ selected as the printing material. To reduce mechanical anisotropy induced by the layered printing process, key process parameters were optimized as follows: an ultra-thin layer height of 0.025 mm, a contact point size of 0.25 mm, and a “flat orientation” of the model (with the lamination direction perpendicular to the specimen loading direction) to minimize its height during preprocessing. Finally, automatic supports were generated, and the printing task was uploaded to the printer for fabrication, with the printed base illustrated in Figure 1b. Supplementary anisotropy verification tests confirmed that the difference in elastic modulus between the lamination direction and the perpendicular direction was 3.2%, and the difference in tensile strength was 2.8%, indicating that the influence of anisotropy is negligible.
Figure 1.
Three-dimensional printing device and finished product.
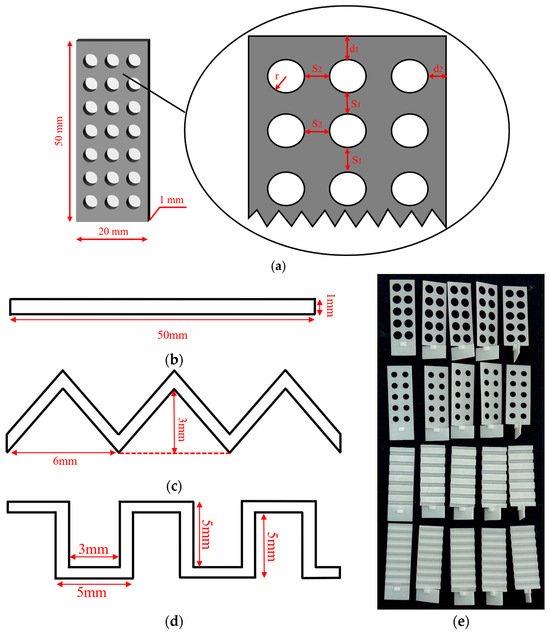
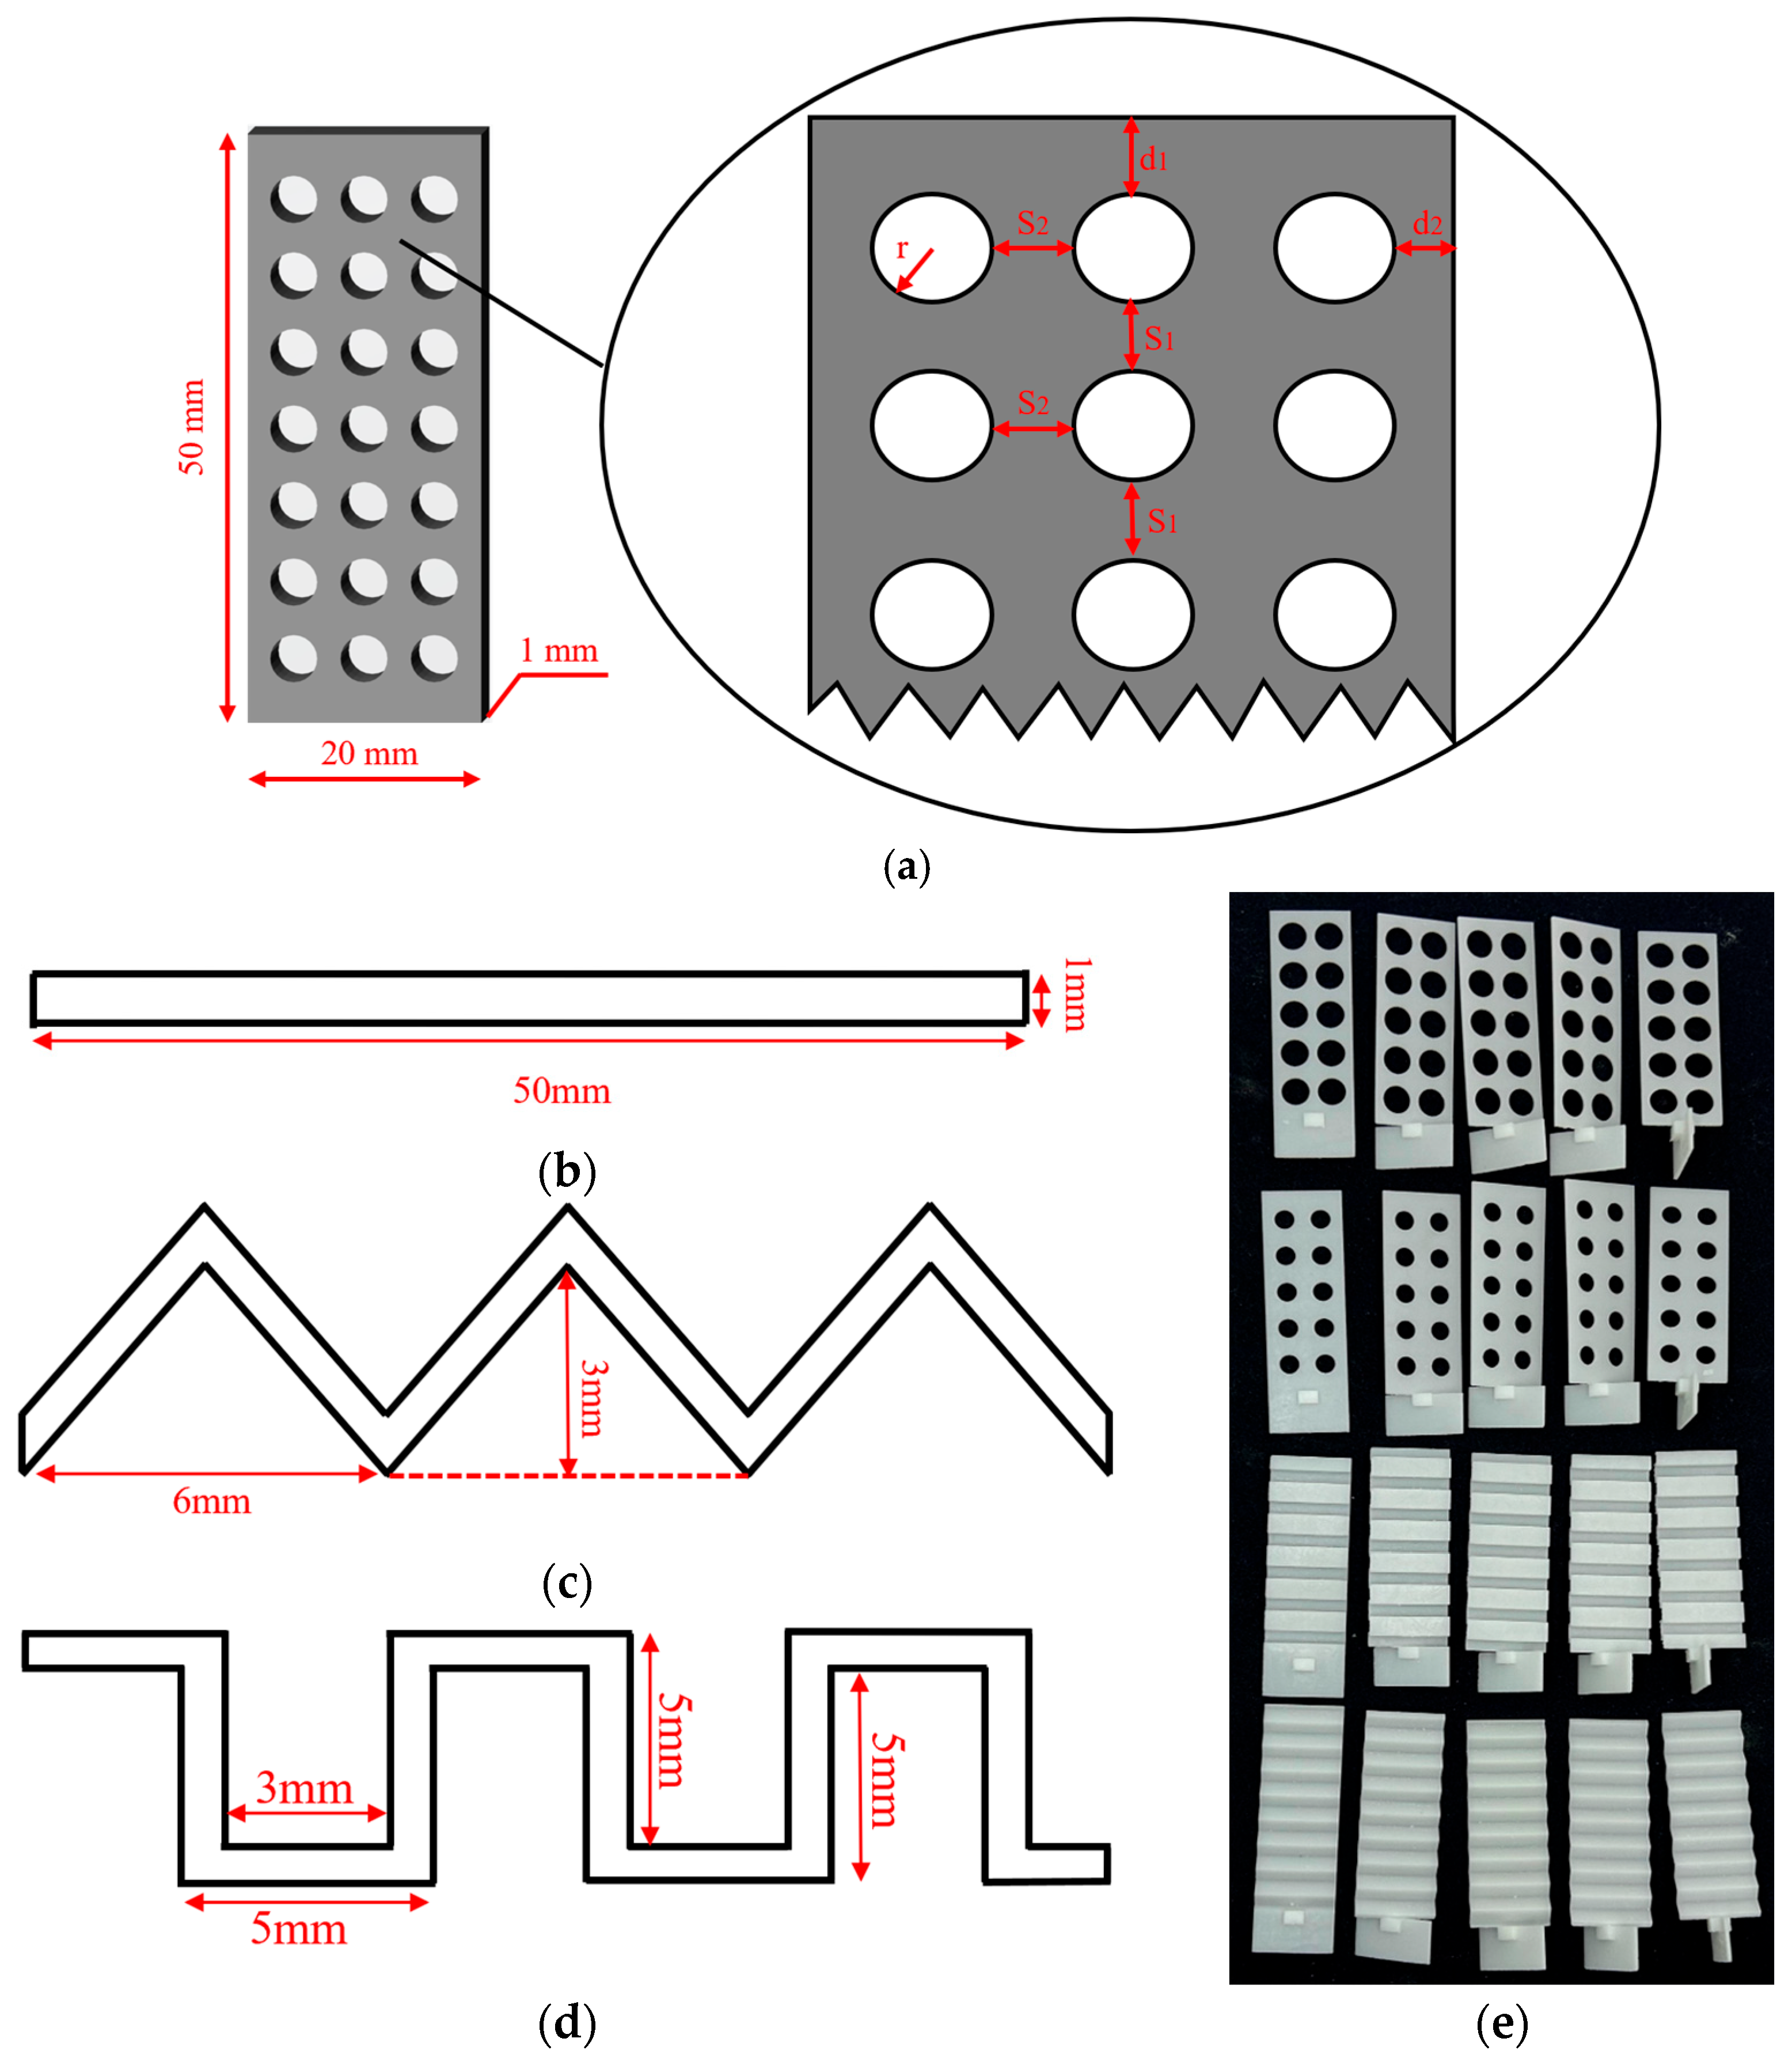
Figure 2 presents schematic diagrams and physical photographs of different joint planes. Specifically, Figure 2a illustrates the distribution of pores on the joint surface—these printed pores form rock columns during the pouring process, thereby disrupting the continuity of the joint surface and forming discontinuous joints. Figure 2b–d (schematic diagrams) show the side views of planar joints, triangular undulating joints, and rectangular undulating joints, respectively. Figure 2e displays the physical photographs of various joints. This experiment consisted of 14 test groups. To investigate the effect of joint continuity on discontinuous jointed rock masses, the joint surfaces of Groups 1–9 and 12–14 were designed as smooth planar surfaces, with the proportion of pore area gradually increasing from 0 to 45.24% of the total joint surface area. To investigate the influence of joint undulation, the joint surfaces of Groups 10 and 11 were designed as triangular and rectangular undulations, respectively, which exhibit a certain degree of roughness and are more consistent with natural joint surfaces, with their proportion of pore area set to 0. To examine the effect of joint dip angle on discontinuous jointed rock masses, five dip angles (0°, 30°, 45°, 60°, and 90°) were adopted for each group. The joint positions and dip angles are illustrated in Figure 3. Three specimens were fabricated for each dip angle, resulting in a total of 210 cast specimens. The specific test conditions are summarized in Table 1.
Figure 2.
Schematic diagrams and physical photographs of various joints. (a) Distribution of joint holes. (b) Discontinuous straight join. (c) Triangular undulating joint. (d) Rectangular undulating joint. (e) Physical photographs of various joints.
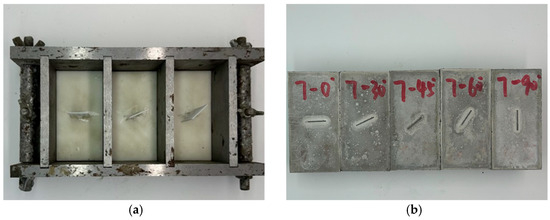
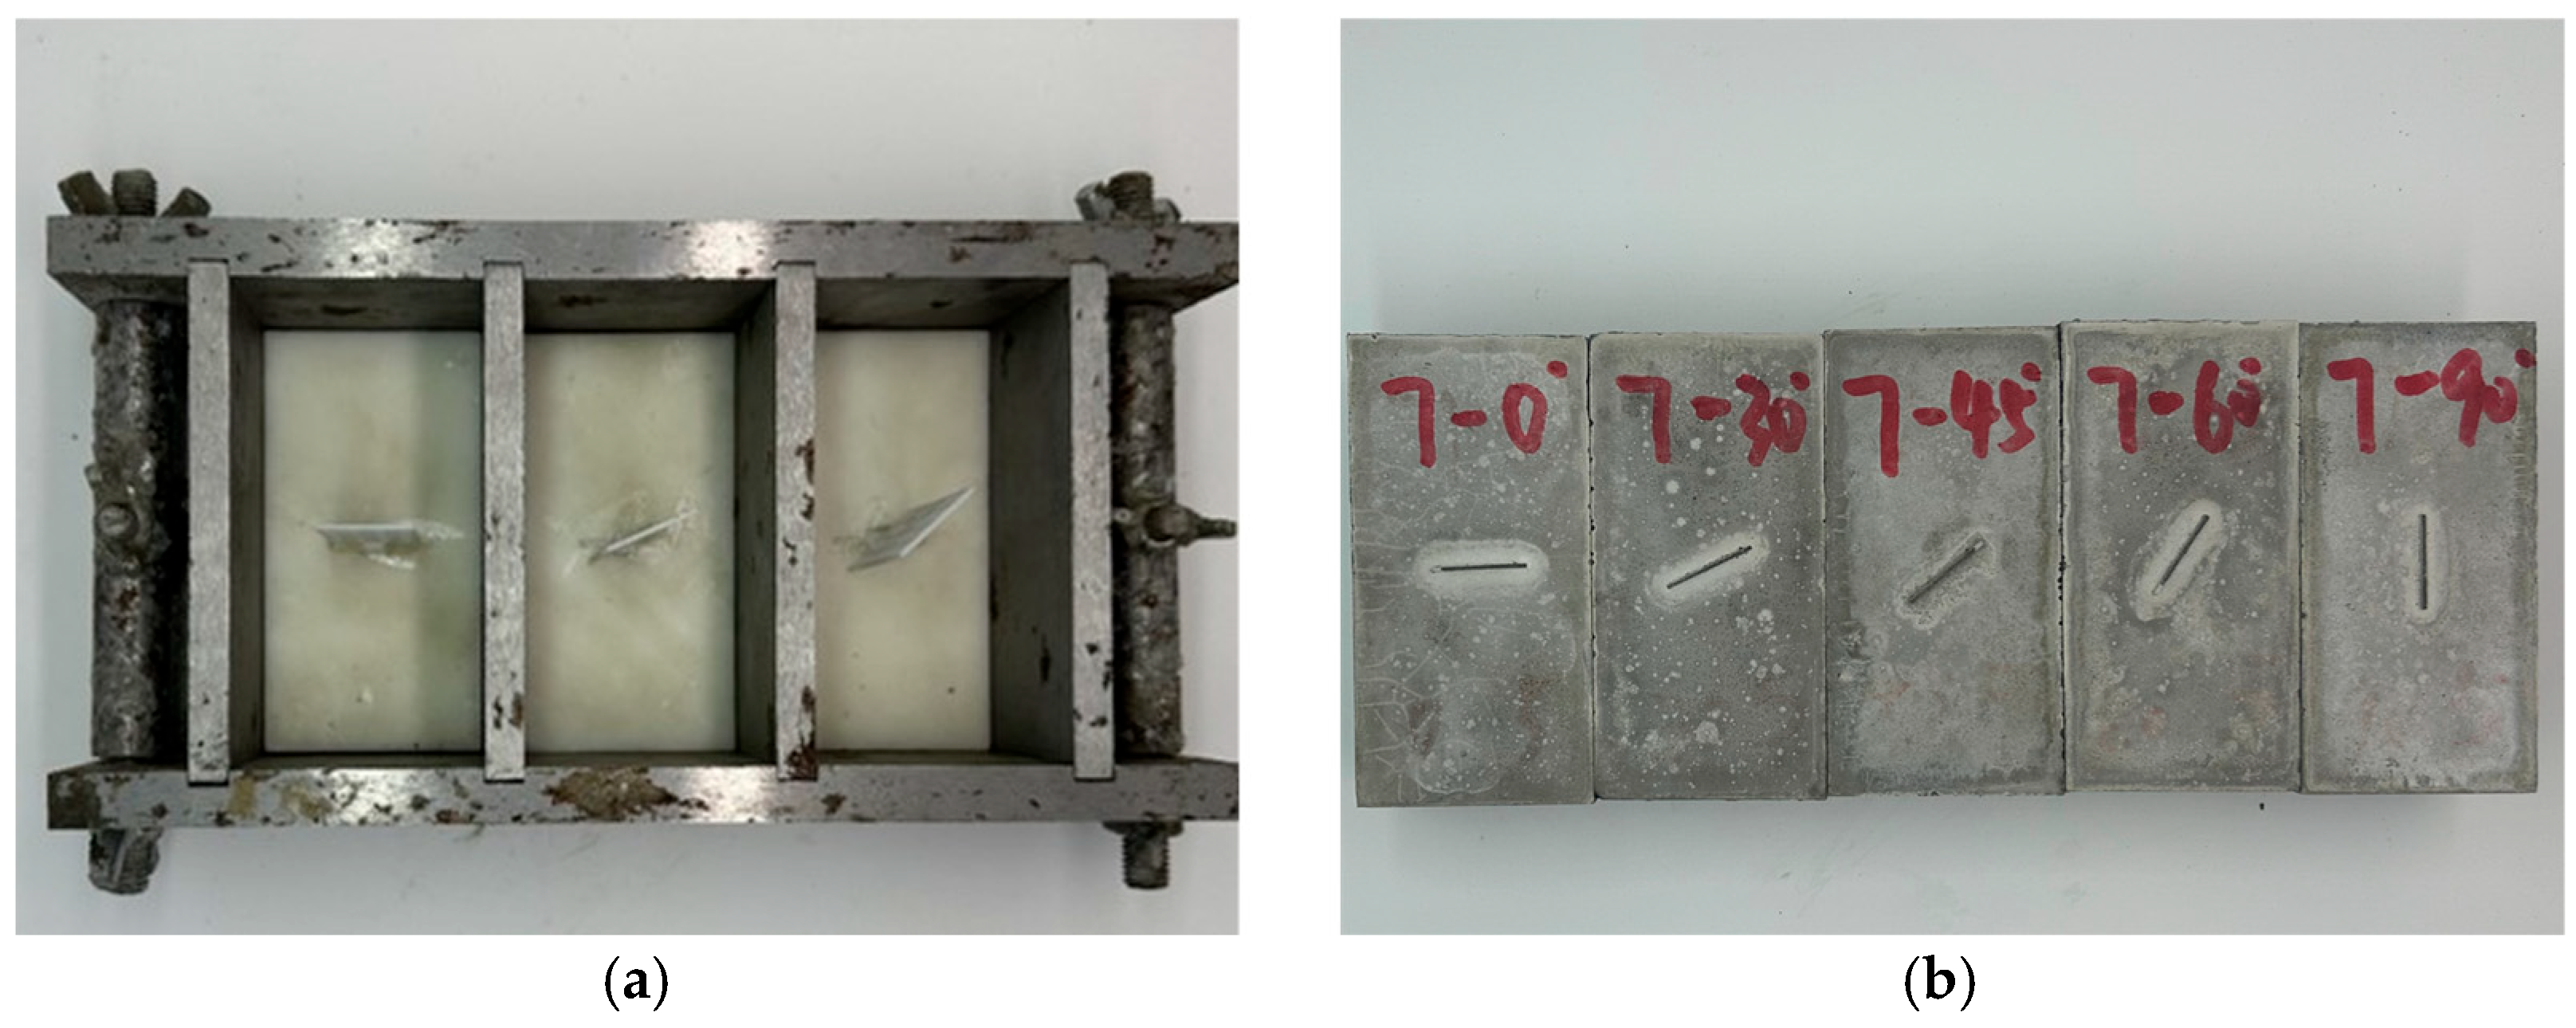
Figure 3.
Pouring mold and sample drawing. (a) Assembled casting mold. (b) Jointed specimens with dimensions of 50 mm × 50 mm × 100 mm.
Table 1.
Test conditions.
2.2. Preparation of Discontinuous Jointed Rock Samples
To meet actual engineering requirements (i.e., rock strength grade), this study employed concrete to simulate rock masses and prepared specimens with standard dimensions of 50 mm (width) × 50 mm (depth) × 100 mm (height), using different water–cement ratios and sand–cement ratios in accordance with relevant standards. A 2-factor, 3-level orthogonal experiment was designed, resulting in 9 test groups. The orthogonal experiment parameters are presented in Table 2. For each group, three non-jointed rock-like specimens were fabricated, and uniaxial compression tests were performed in line with relevant standards to obtain the average peak strength, followed by an analysis of concrete strength. The optimal concrete mix proportion was determined to be cement: quartz sand: water: water reducer = 1:1:0.35:0.01, which satisfied the required strength criteria. The mechanical parameters of the concrete specimens are presented in Table 3. The cementitious material employed in this study was Type I ordinary Portland cement (I-OPC), with a 28-day compressive strength of 42.5 MPa. The quartz sand has a particle size distribution ranging from 0.5 to 1.5 mm, and the water reducer is a polyacrylate-based high-performance type.
Table 2.
Concrete ratio orthogonal test table.
Table 3.
Mechanical parameters of rock-like materials.
When fabricating discontinuous jointed rock-like specimens, the pouring mold—custom-fabricated from cast iron—was first assembled. Secondly, the surface of the joint base was coated with petroleum jelly, and the 3D-printed resin joint inserts (pre-fabricated with preset pore structures) were accurately placed on the base before both were integrated into the mold (Figure 3a). It should be emphasized that the 3D-printed resin inserts were not removed after casting but remained inside the concrete specimens as a simulation medium for the joint interface: due to significant differences in mechanical properties (e.g., stiffness, strength, and Poisson’s ratio) between resin and concrete, the resin itself can effectively simulate the “weak plane” characteristics of natural rock joints [27,28]. The preset pores in the resin inserts are directly filled with concrete during pouring to form intact rock columns, while the resin inserts act as joint surfaces to separate these rock columns—naturally ensuring the discontinuity of the joints and the integrity of the rock columns without the need for cutting or segmenting the resin inserts. This petroleum jelly treatment not only facilitated subsequent extraction and cyclical reuse of the joint base but also effectively prevented concrete slurry from infiltrating the micro-gaps between the resin inserts and the base, avoiding tight bonding that could damage the predefined joint structure.
Then, a layer of lubricating oil was evenly applied to the inner and outer surfaces of both the base and the mold to facilitate the demolding of concrete specimens. Next, an appropriate amount of cement, quartz sand, water, and water reducer were accurately weighed according to the predetermined mix proportion and homogenously blended to ensure uniform consistency. The uniformly mixed slurry was then gradually poured into the mold, with each pouring volume accounting for one-third of the mold capacity. After each layer of slurry was poured, the mold was vibrated to eliminate entrapped air bubbles and ensure full compaction around the resin inserts and rock column regions, completing the pouring process. Finally, after being left to stand for 24 h, the mold was removed, and the specimens were cured for 28 days in a standard curing environment.
2.3. Experimental Setup and Loading Protocol
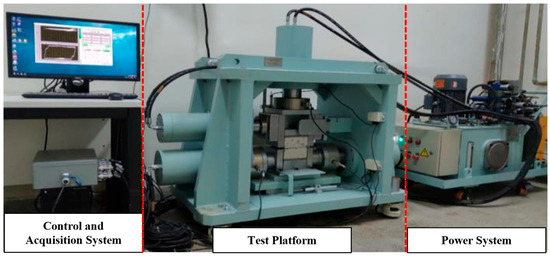
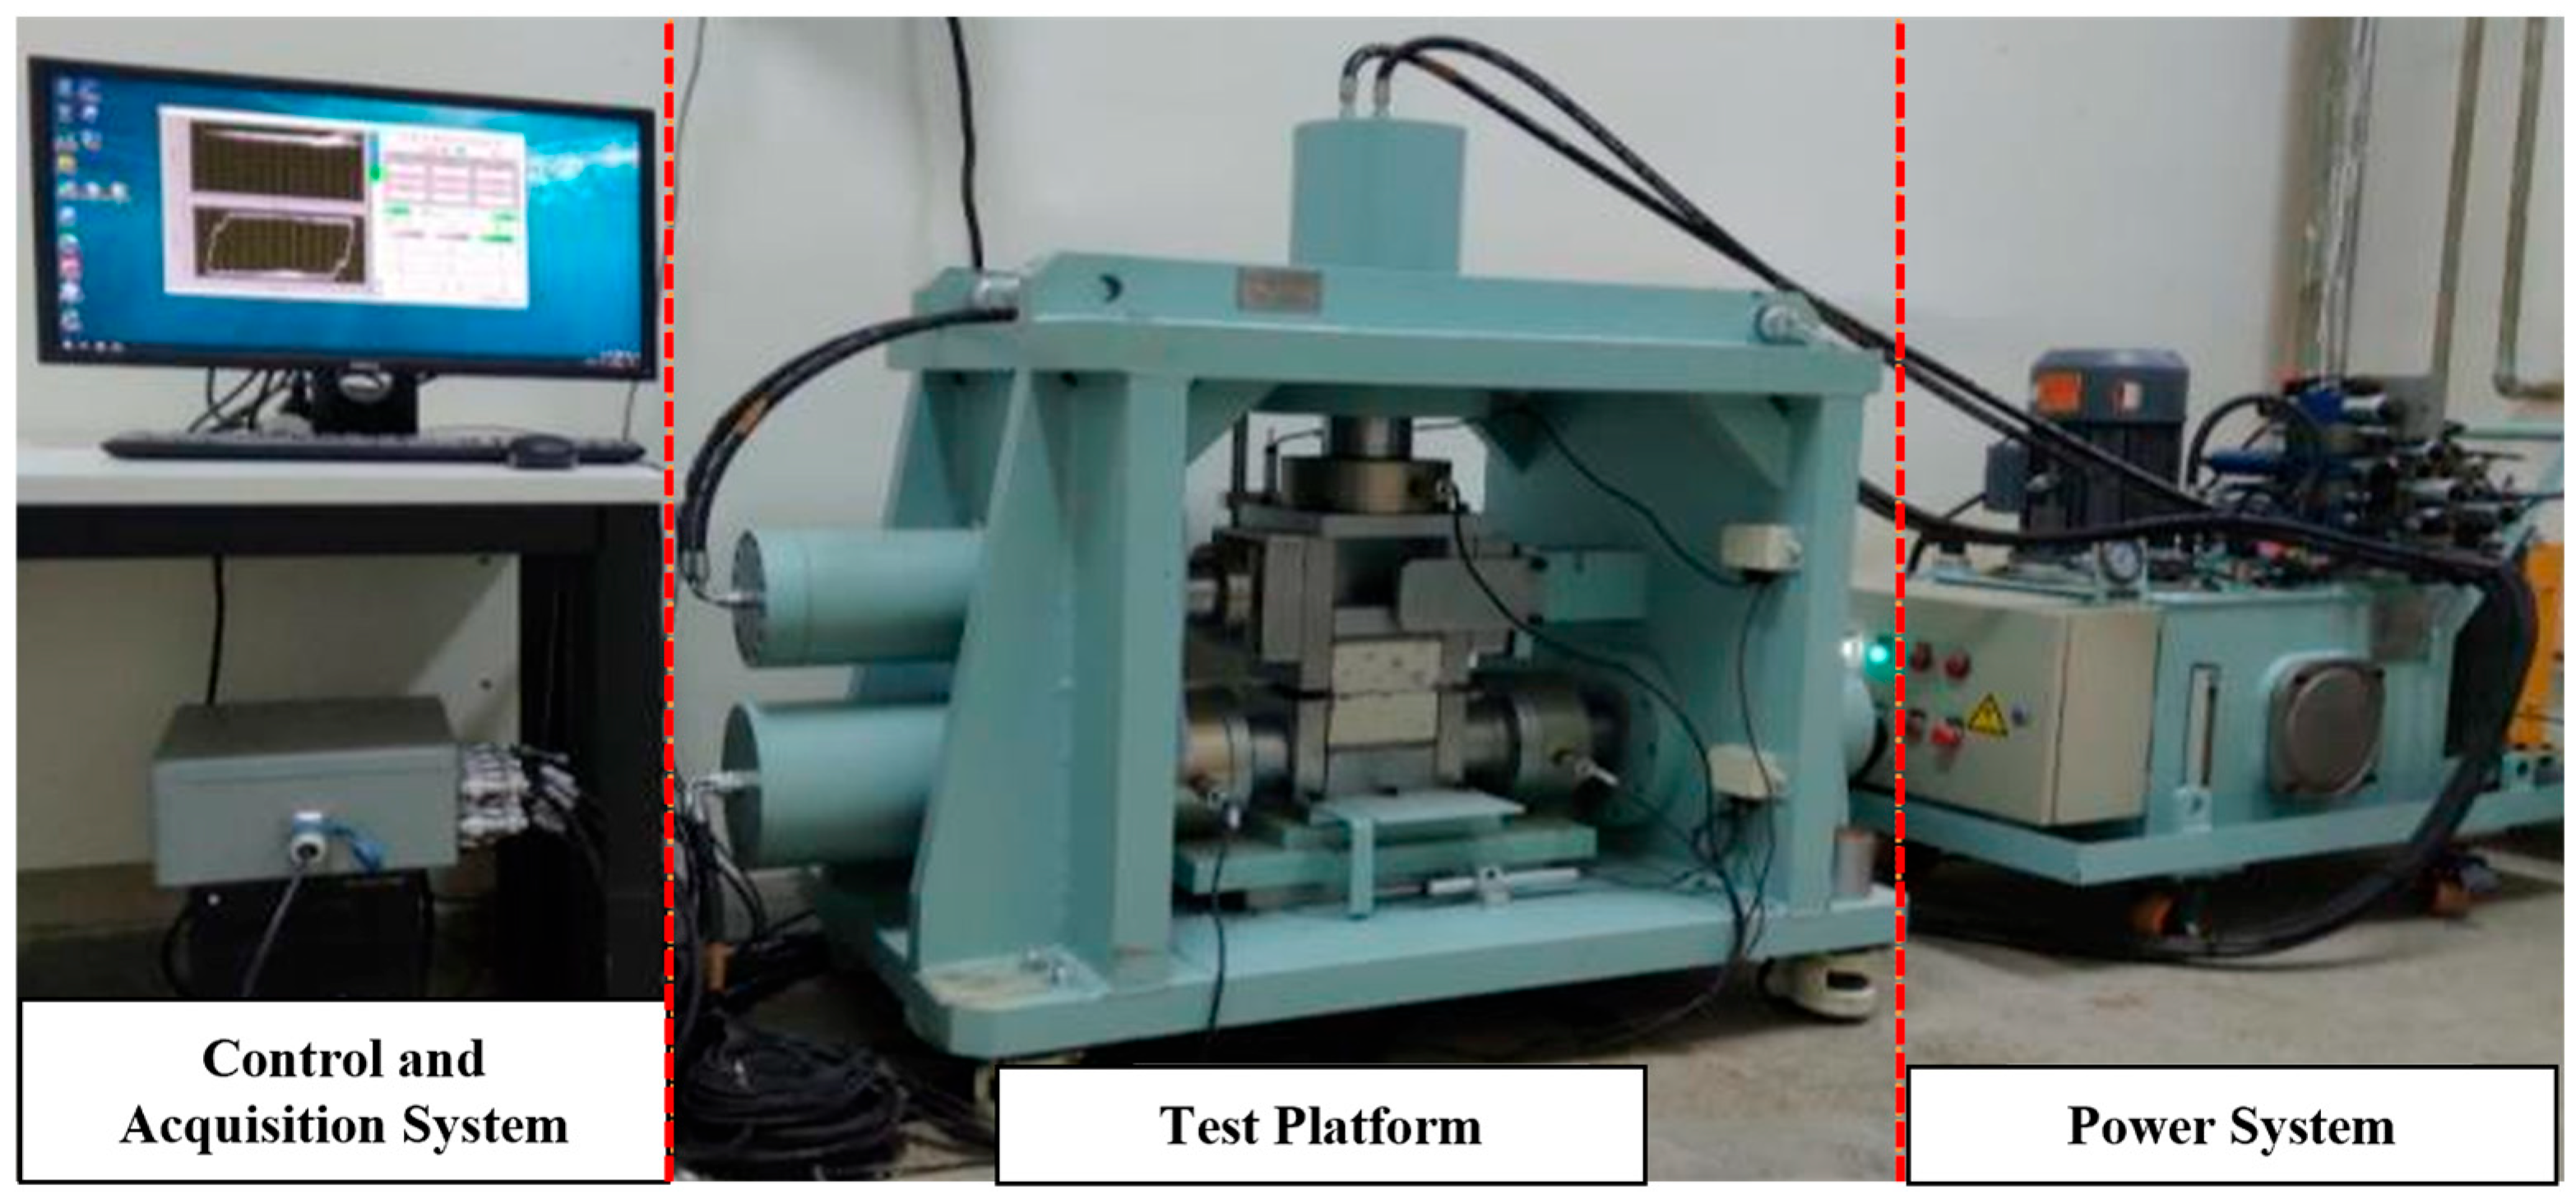
In this study, uniaxial compression tests were performed using the RJCS-600 testing machine independently developed by the Institute of Rock and Soil Mechanics, Chinese Academy of Sciences (Wuhan, China). This machine can perform a wide range of mechanical tests on various rock-like specimens, including uniaxial compression tests and cyclic shear tests. The key components of the testing machine are illustrated in Figure 4. The loading mode employs displacement control, with a loading rate of 0.5 mm/min and a pre-contact force of 0.5 kN.
Figure 4.
Schematic diagram of the experimental apparatus [29,30].
3. Analysis of Failure Characteristics of Discontinuous Jointed Rock Masses
Under loading, the failure mode of rock is a key indicator of its failure mechanism. This mode not only reflects the stress distribution characteristics of rock masses under applied loading but also reveals the influence of different test conditions on their deformation and failure behaviors. Based on the geometric relationship between crack propagation direction and the principal stress field, this study classifies cracks with specific definitions as follows: Tensile cracks are characterized by longitudinal splitting that is perpendicular to the direction of the maximum tensile stress (the crack surface is straight without slippage). Shear cracks are characterized by oblique propagation along the maximum shear stress plane (with an inclination angle of 0–60°, accompanied by slippage and scratches). Coplanar cracks specifically denote tensile cracks propagating along the joint surface [31].
3.1. Influence of Joint Dip Angle on Failure Characteristics
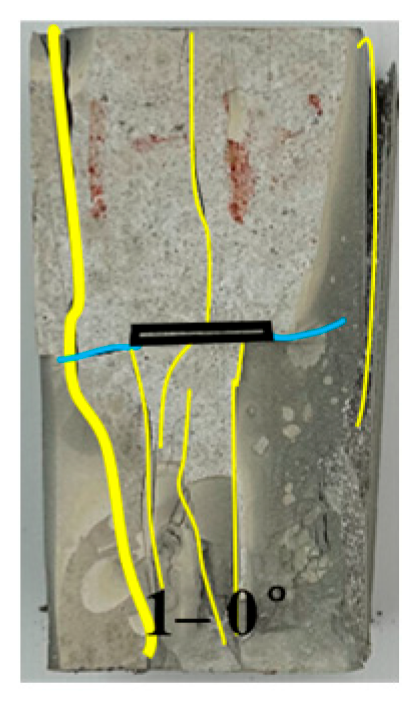
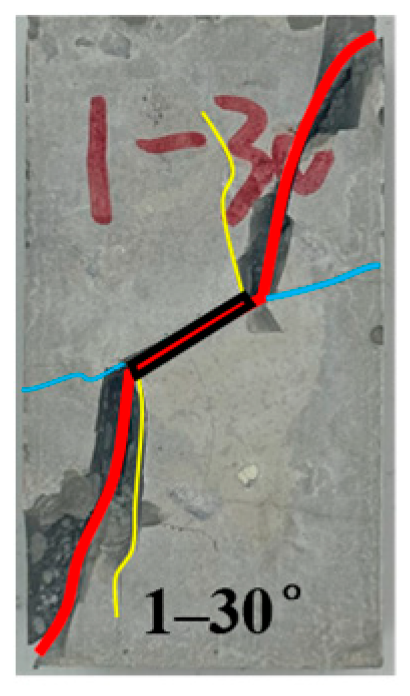
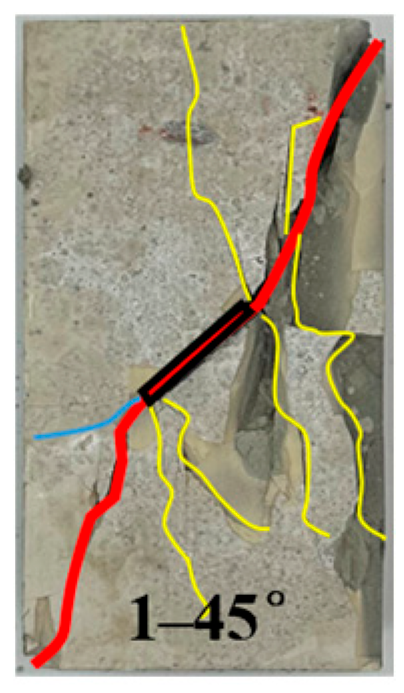
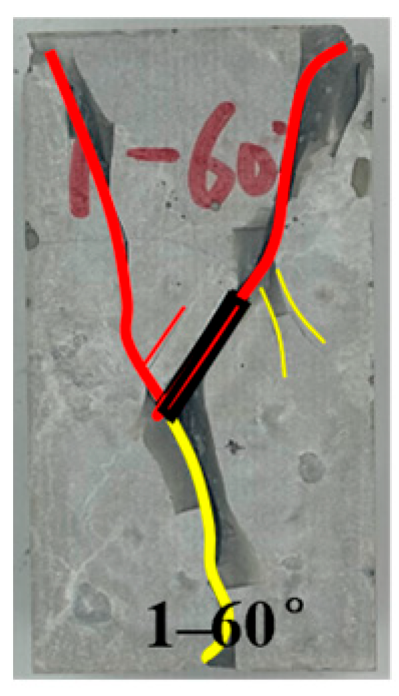
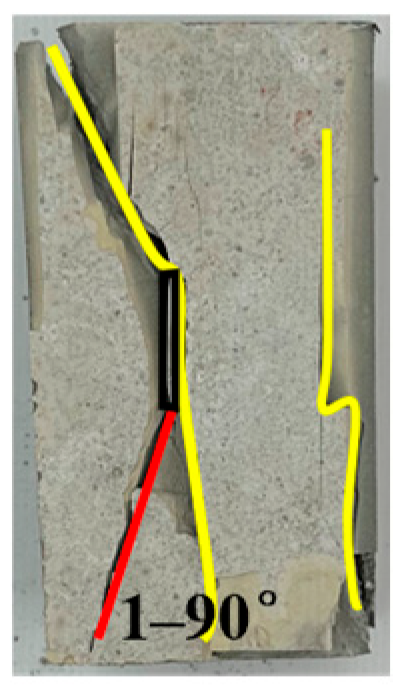
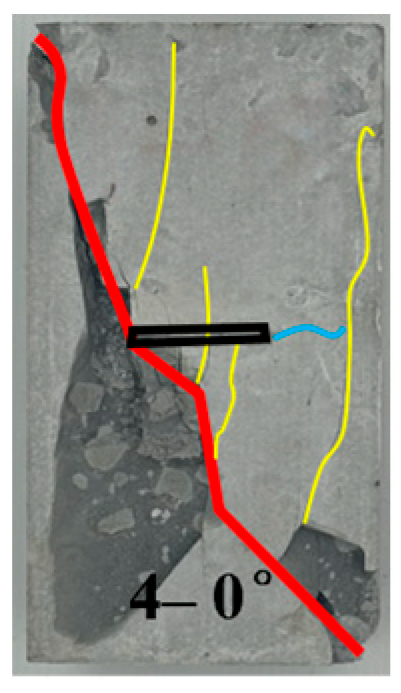
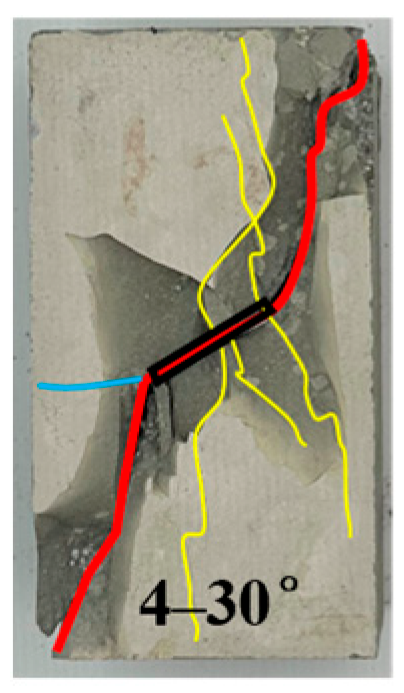
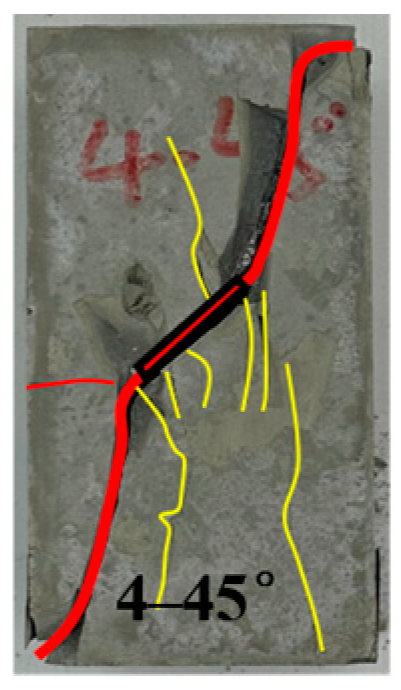
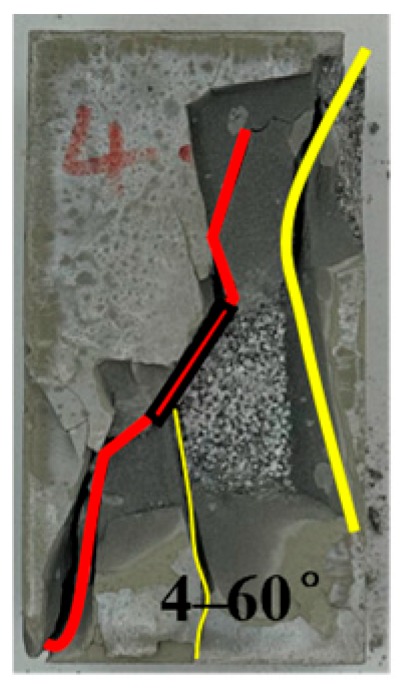
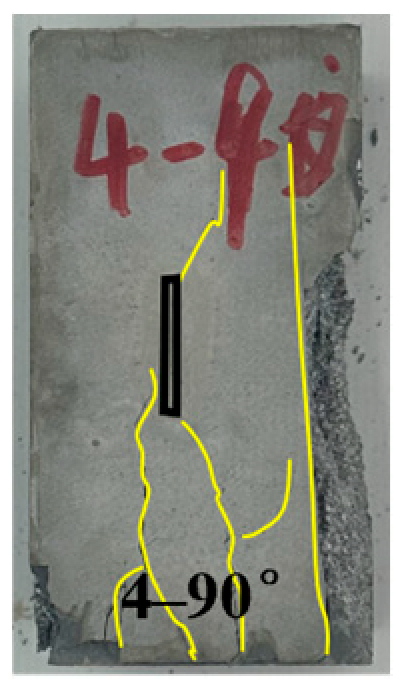
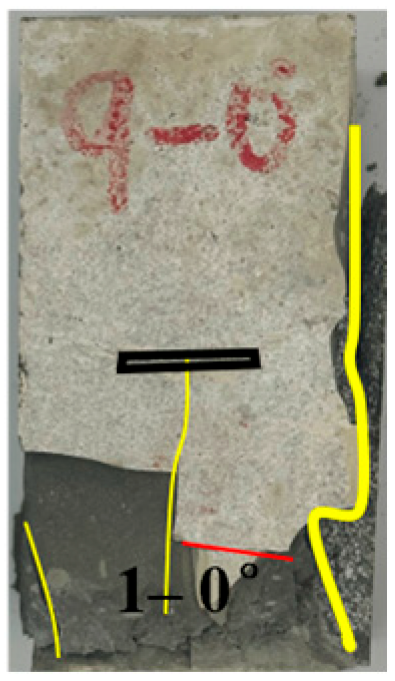
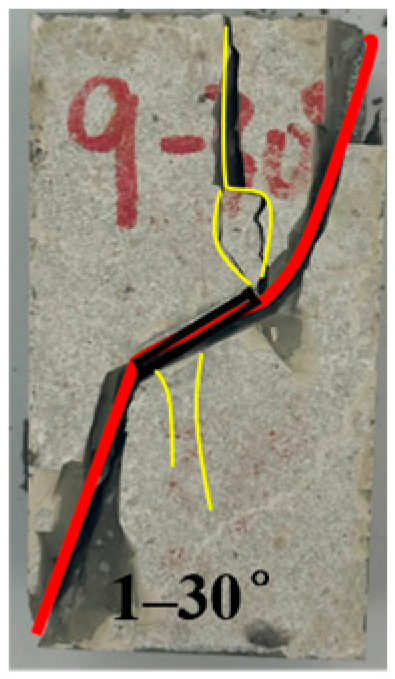
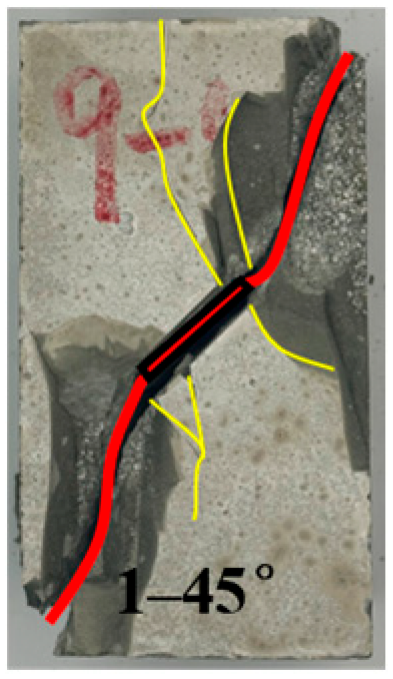
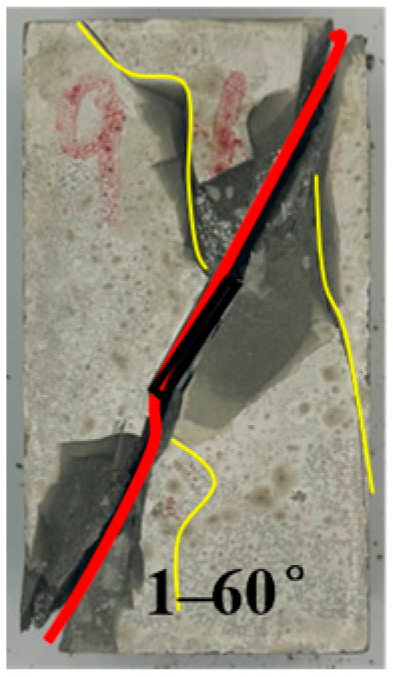
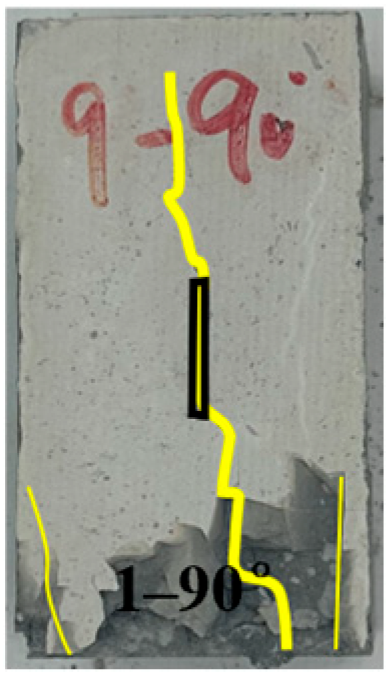
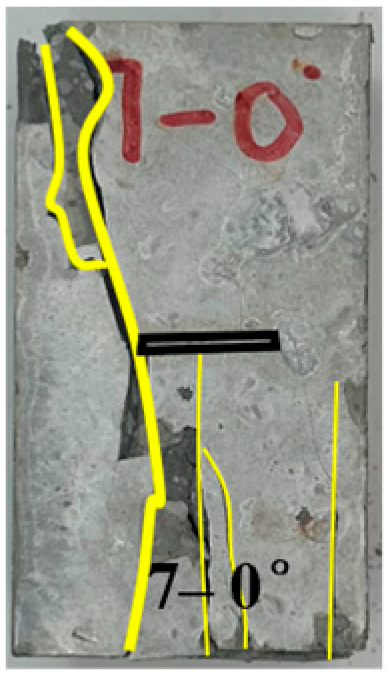
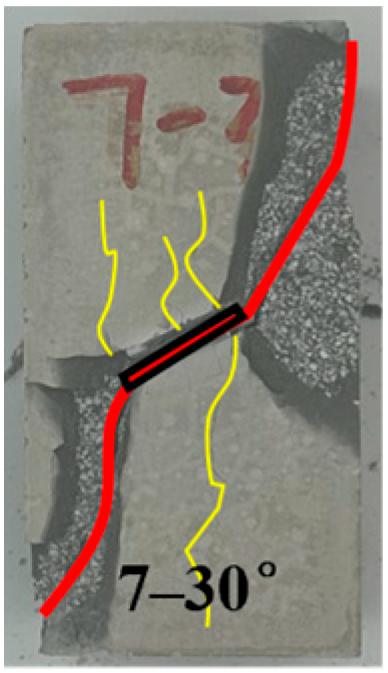
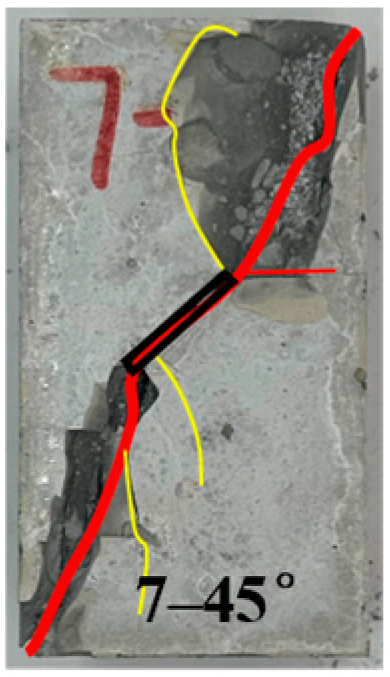
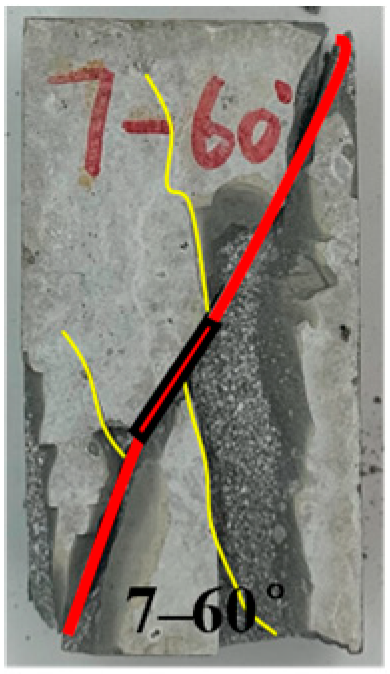
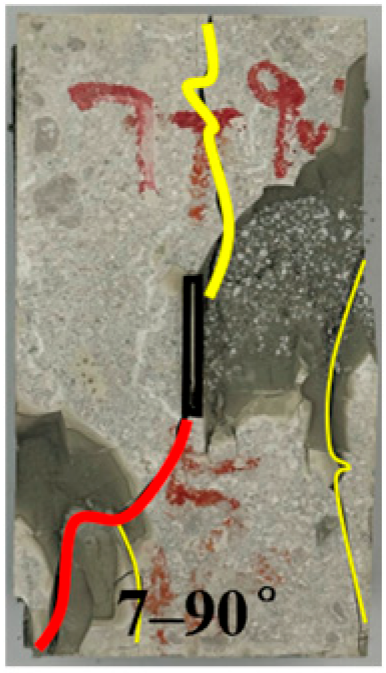
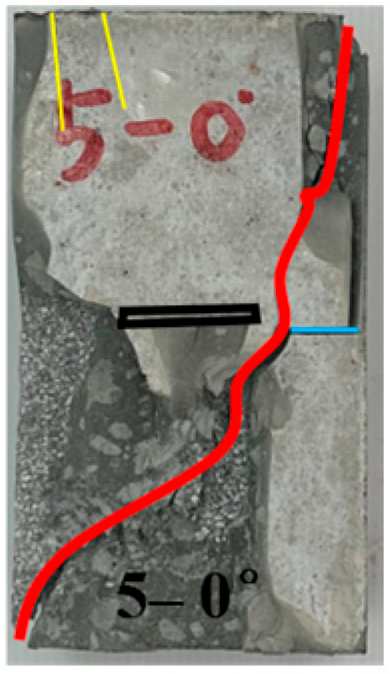
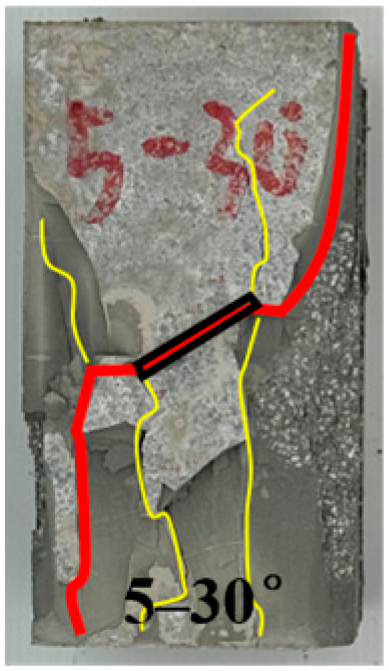
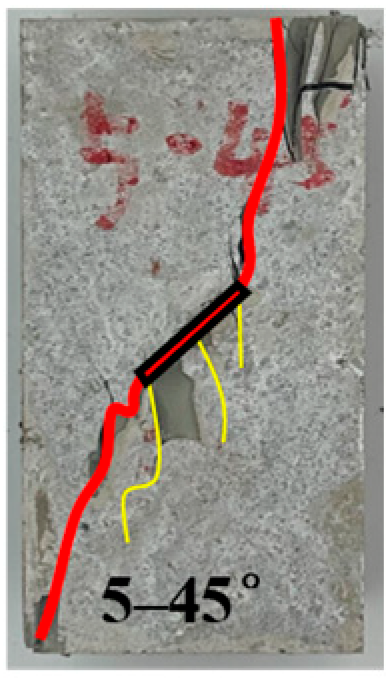
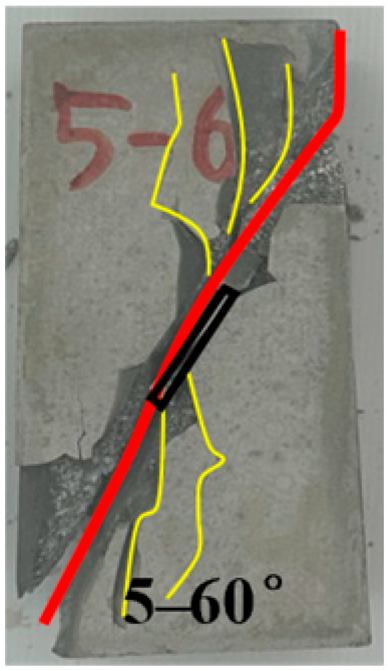
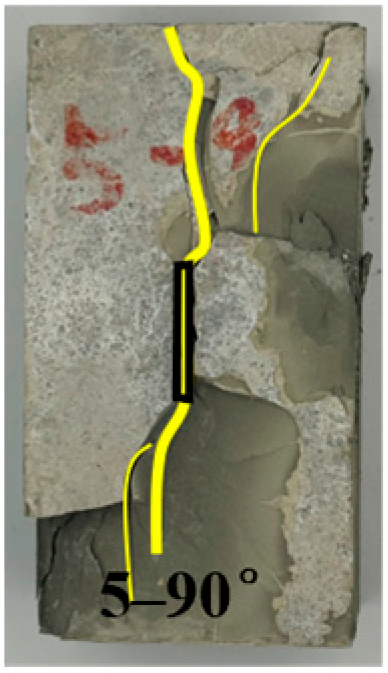
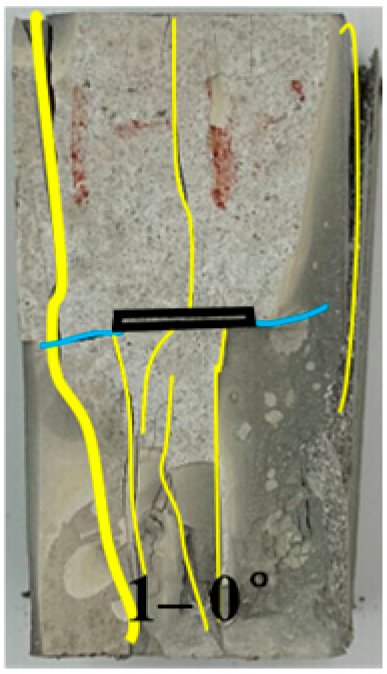
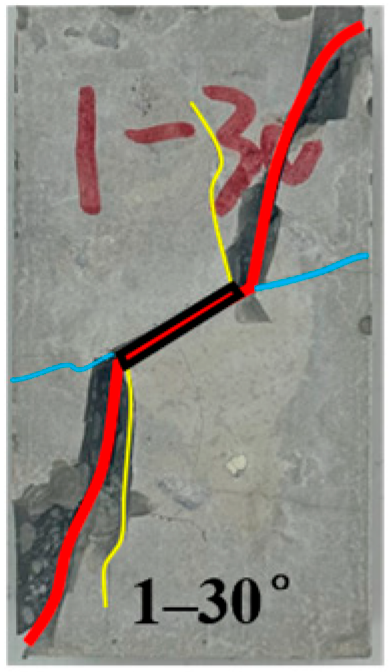
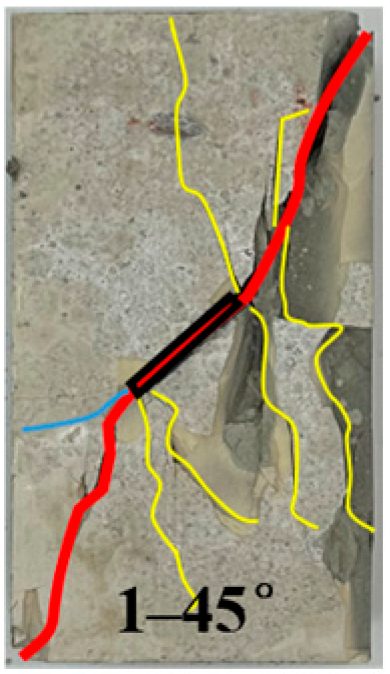
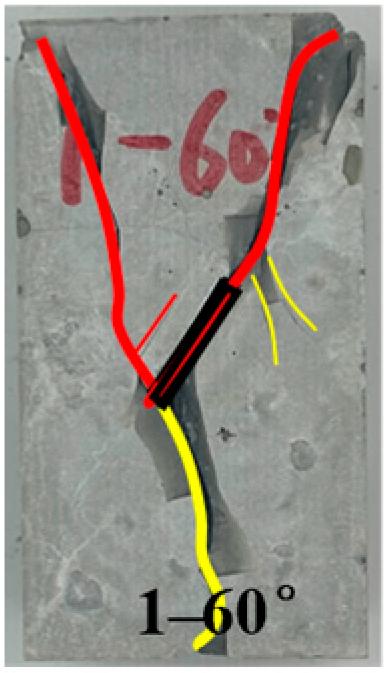
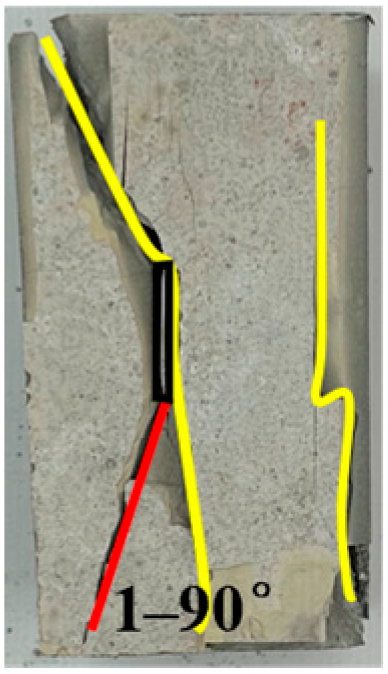
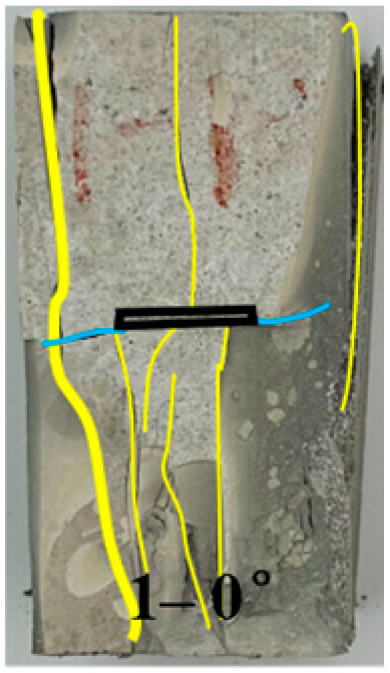
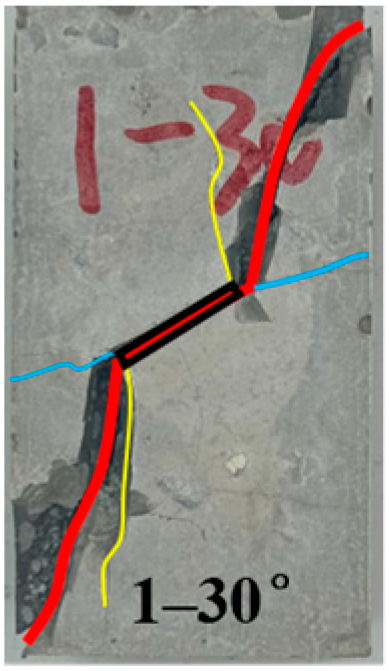
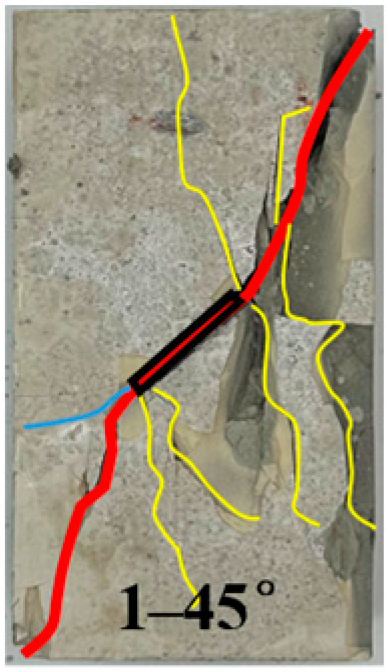
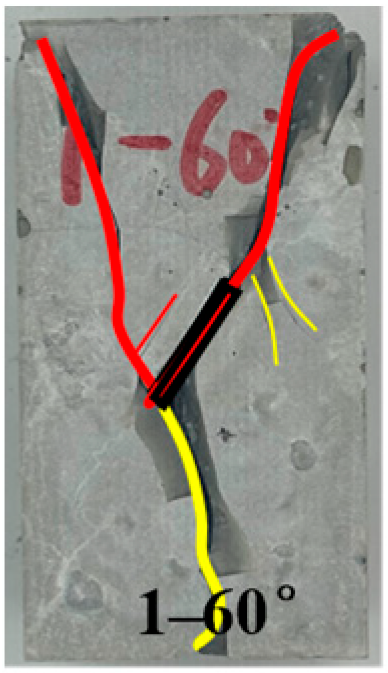
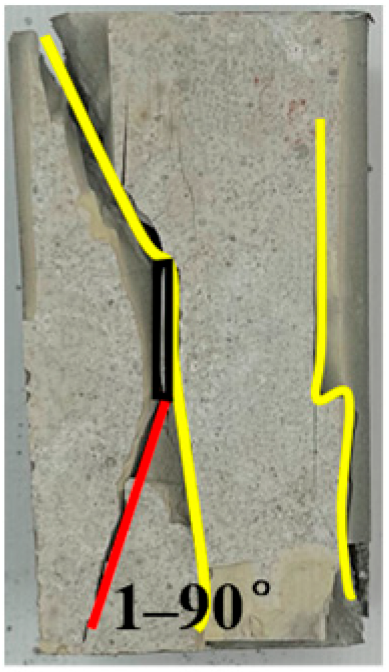
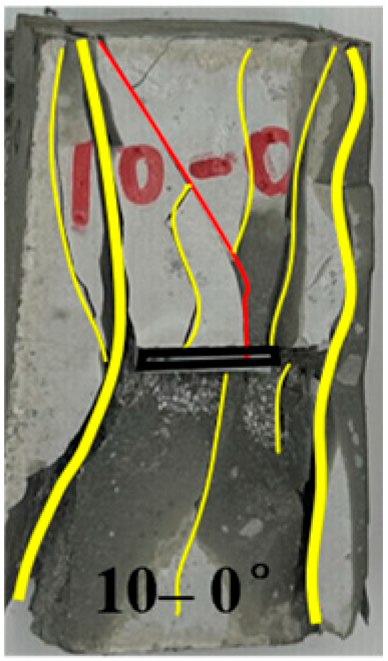
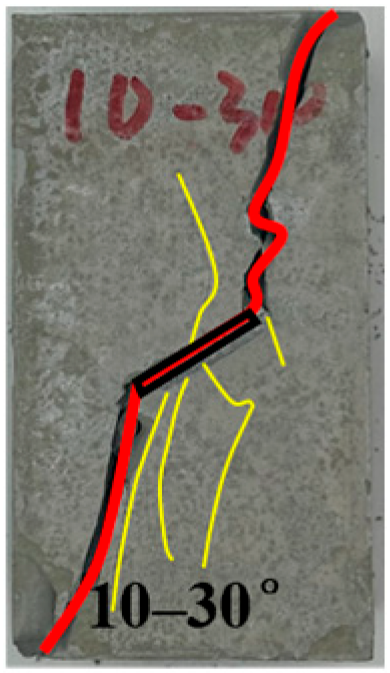
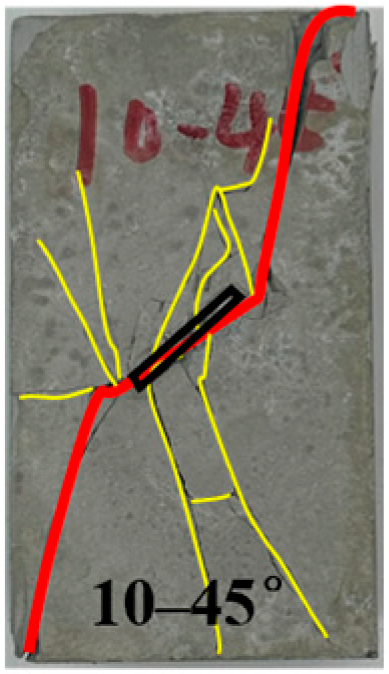
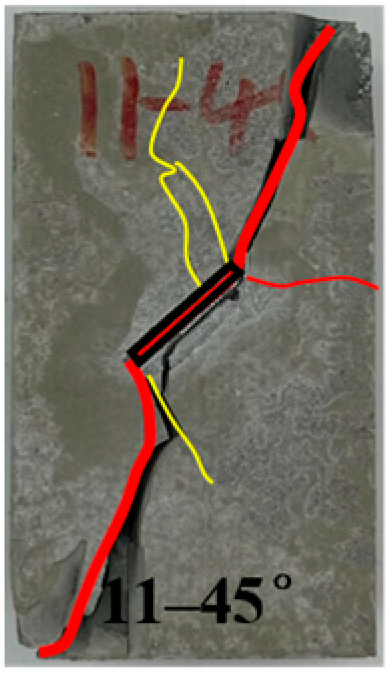
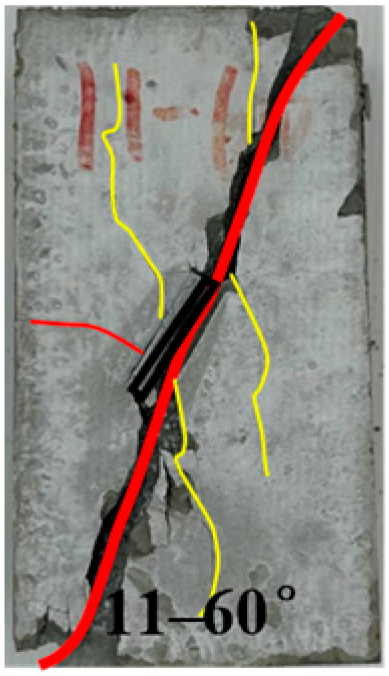
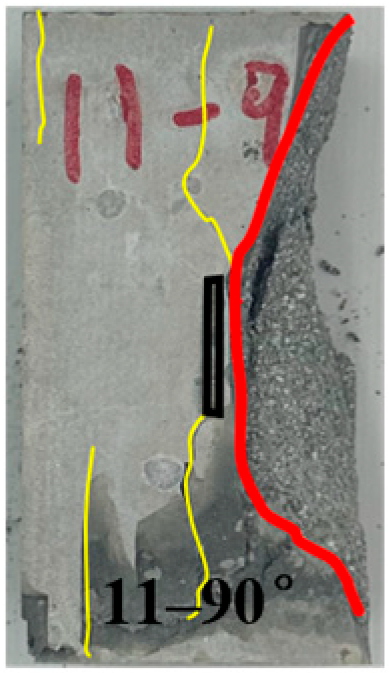
The inclination angle of discontinuous joints directly affects the stability of rock masses. Different inclination angles of joints may cause changes in the strength and deformation characteristics of rock masses in different directions. By studying the inclination angles of discontinuous joints, a better understanding of the failure modes and potential unstable areas of rock masses can be achieved, providing an important basis for engineering design and stability assessment. Due to space limitations, Groups 1, 5, and 9 of typical specimens were selected for comparative analysis. Among them, Group 1 was a rock mass with continuous planar joints, and Groups 5 and 9 were rock masses with discontinuous planar joints. The failure cracks of the specimens are shown in Table 4. The yellow lines represent tensile cracks, the blue lines represent coplanar cracks, and the red lines represent shear cracks. It was found that the cracks mainly consisted of tensile cracks, shear cracks, and coplanar cracks.
Table 4.
Failure characteristics of rock mass with different dip angles.
For discontinuous jointed rock-like specimens with a 0° joint inclination angle (planar joint surfaces), the cracks generated during compression mainly include tensile cracks and a small number of coplanar cracks. Specimen failure is induced by the penetration of tensile cracks, with numerous tensile cracks of varying extents developing internally. For planar-jointed rock mass specimens (0° inclination), wing cracks initiate at both sides of the pre-existing joint tips and propagate along the direction of tensile stress; in contrast, discontinuous jointed rock masses with a 0° inclination develop shear cracks but no wing cracks, yet failure is still caused by the penetration of tensile cracks. This indicates that when the joint inclination angle is 0°, the presence of discontinuous joints under loading results in the coexistence of tensile and shear stresses (with tensile stress being dominant), and no wing cracks form due to the negligible end effect of discontinuous joints during the test.
When the joint inclination angle is 30°, 45°, or 60°, specimens generate large through-going shear cracks that penetrate the joint surfaces, leading to significant displacements along the penetration surfaces after crack propagation. Wing cracks initiate at both sides of the pre-existing joint tips, and small tensile cracks develop in the middle of the pre-existing joints; tensile cracks propagating along the joint surfaces are also denoted as coplanar cracks. Among these, the joint surface cracks show a characteristic distribution: tensile cracks in the upper part and shear cracks in the lower part, with several minor destructive tensile cracks appearing at other locations. This indicates that within the joint inclination angle range of 0–90°, specimens are simultaneously subjected to tensile and shear stresses, and as the joint inclination angle increases, the influence of tensile stress first gradually decreases and then gradually increases.
For specimens with a 90° joint inclination angle, the direction of the maximum principal stress is consistent with the pre-existing joint direction. Tensile cracks penetrate the joint surfaces and propagate along the direction of the maximum principal stress from both sides of the joints until they penetrate the entire specimen, forming an “I”-shaped crack pattern. Tensile cracks propagating along the joint surfaces are also denoted as coplanar cracks, with joint surface cracks showing the same upper tensile/lower shear distribution as those observed at 30–60°, and additional minor destructive tensile cracks at other positions. This confirms that the specimen is subjected to compression–shear mixed stress, with tensile stress being the dominant influencing factor.
Specifically, at joint inclination angles of 0°, 30°, and 45°, coplanar cracks were observed at both sides of the continuous planar joints. This is attributed to the planar and continuous nature of the joint surfaces, which facilitates force transmission. In contrast, for the other discontinuous joint groups, the presence of rock columns on the joint surfaces enables forces to be transmitted through the rock columns to the non-joint surfaces of the rock masses, thus preventing excessive forces from generating coplanar cracks along the joint surfaces. When the joint inclination angle exceeds 30°, the coplanar cracks generated by the continuous joints merge with shear cracks to form through-going fractures. Additionally, as the inclination angle of the pre-existing joints increases, the extension length of the coplanar cracks along the joint direction gradually increases, which is due to the gradual enhancement of the influence of shear stress.
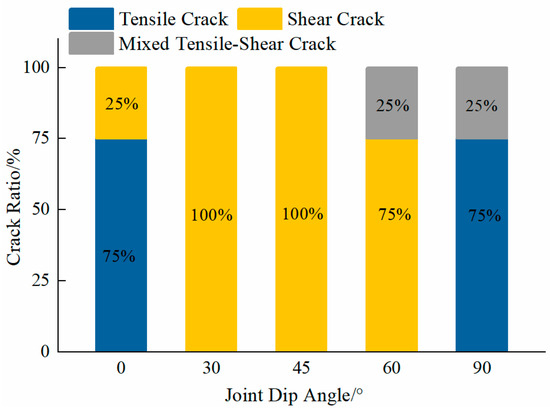
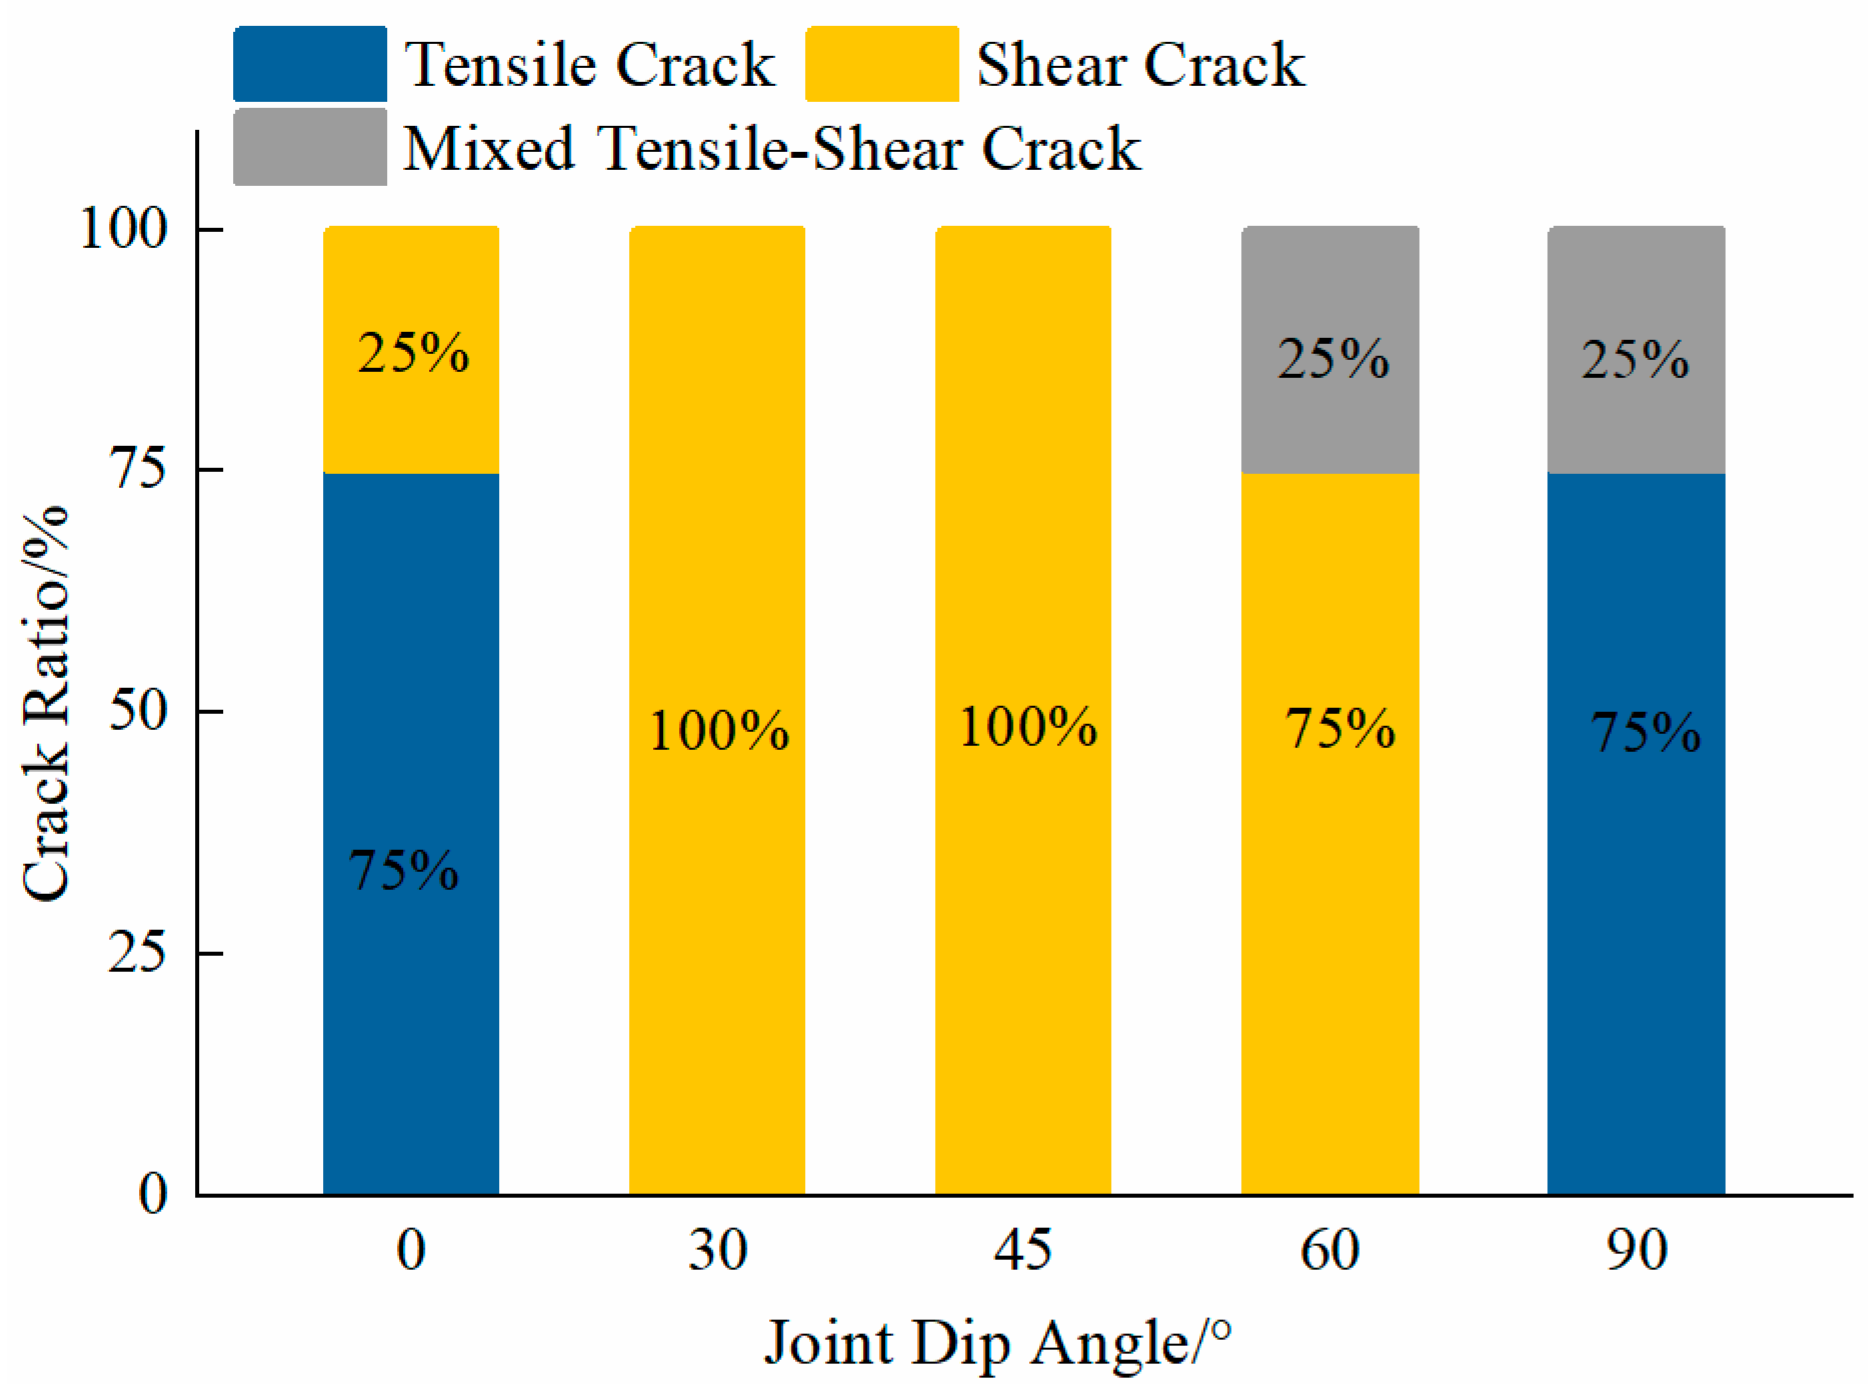
By analyzing the failure characteristics of discontinuous joint cracks and the proportion of tensile and shear cracks among the through-going cracks (Figure 5), it was found that when the joint inclination angle is 0° or 90°, the specimens are mainly subjected to tensile stress and undergo primary tensile failure. In contrast, when the joint inclination angle is 30°, 45°, or 60°, the specimens are subjected to both tensile and shear stresses. Within the joint inclination angle range of 0–90°, as the angle increases, the influence of shear stress first increases and then decreases. This failure mode is denoted as inclined plane shear failure, which is induced by the shear stress acting on the failure surface exceeding the shear strength of the surface. Prior to specimen failure, the maximum shear stress that the failure surface must resist is also related to the normal stress on the surface, and this failure mode is classified as compression–shear mixed failure. Furthermore, as the pre-existing joint inclination angle increases, the influence of tensile stress gradually diminishes, while that of shear stress progressively increases. Specimen failure is caused by the penetration of shear cracks, which indirectly confirms that the tensile strength of rock-like specimens is lower than their shear strength.
Figure 5.
The specimen mainly penetrates the cracks and the proportion of different types of cracks.
3.2. Influence of Joint Continuity on Failure Characteristics
Discontinuous joints are a common type of structural plane in rock masses, whose distribution and characteristics exert a significant influence on the mechanical properties and failure behaviors of rock masses. Joint continuity is also a key factor affecting the properties of structural planes, thus studying the influence of joint continuity on the failure characteristics of rock masses is of considerable significance.
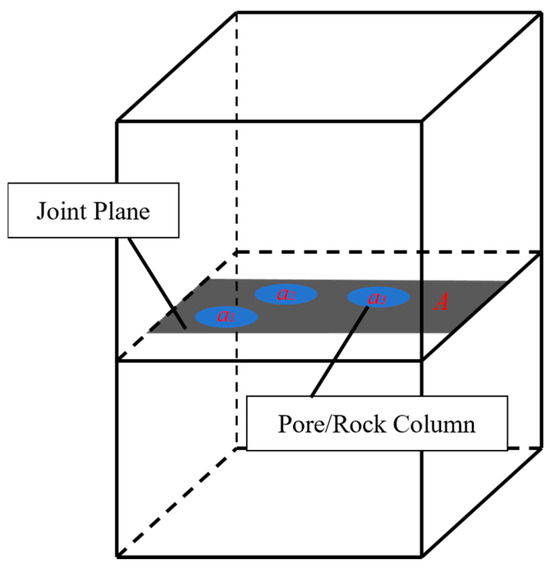
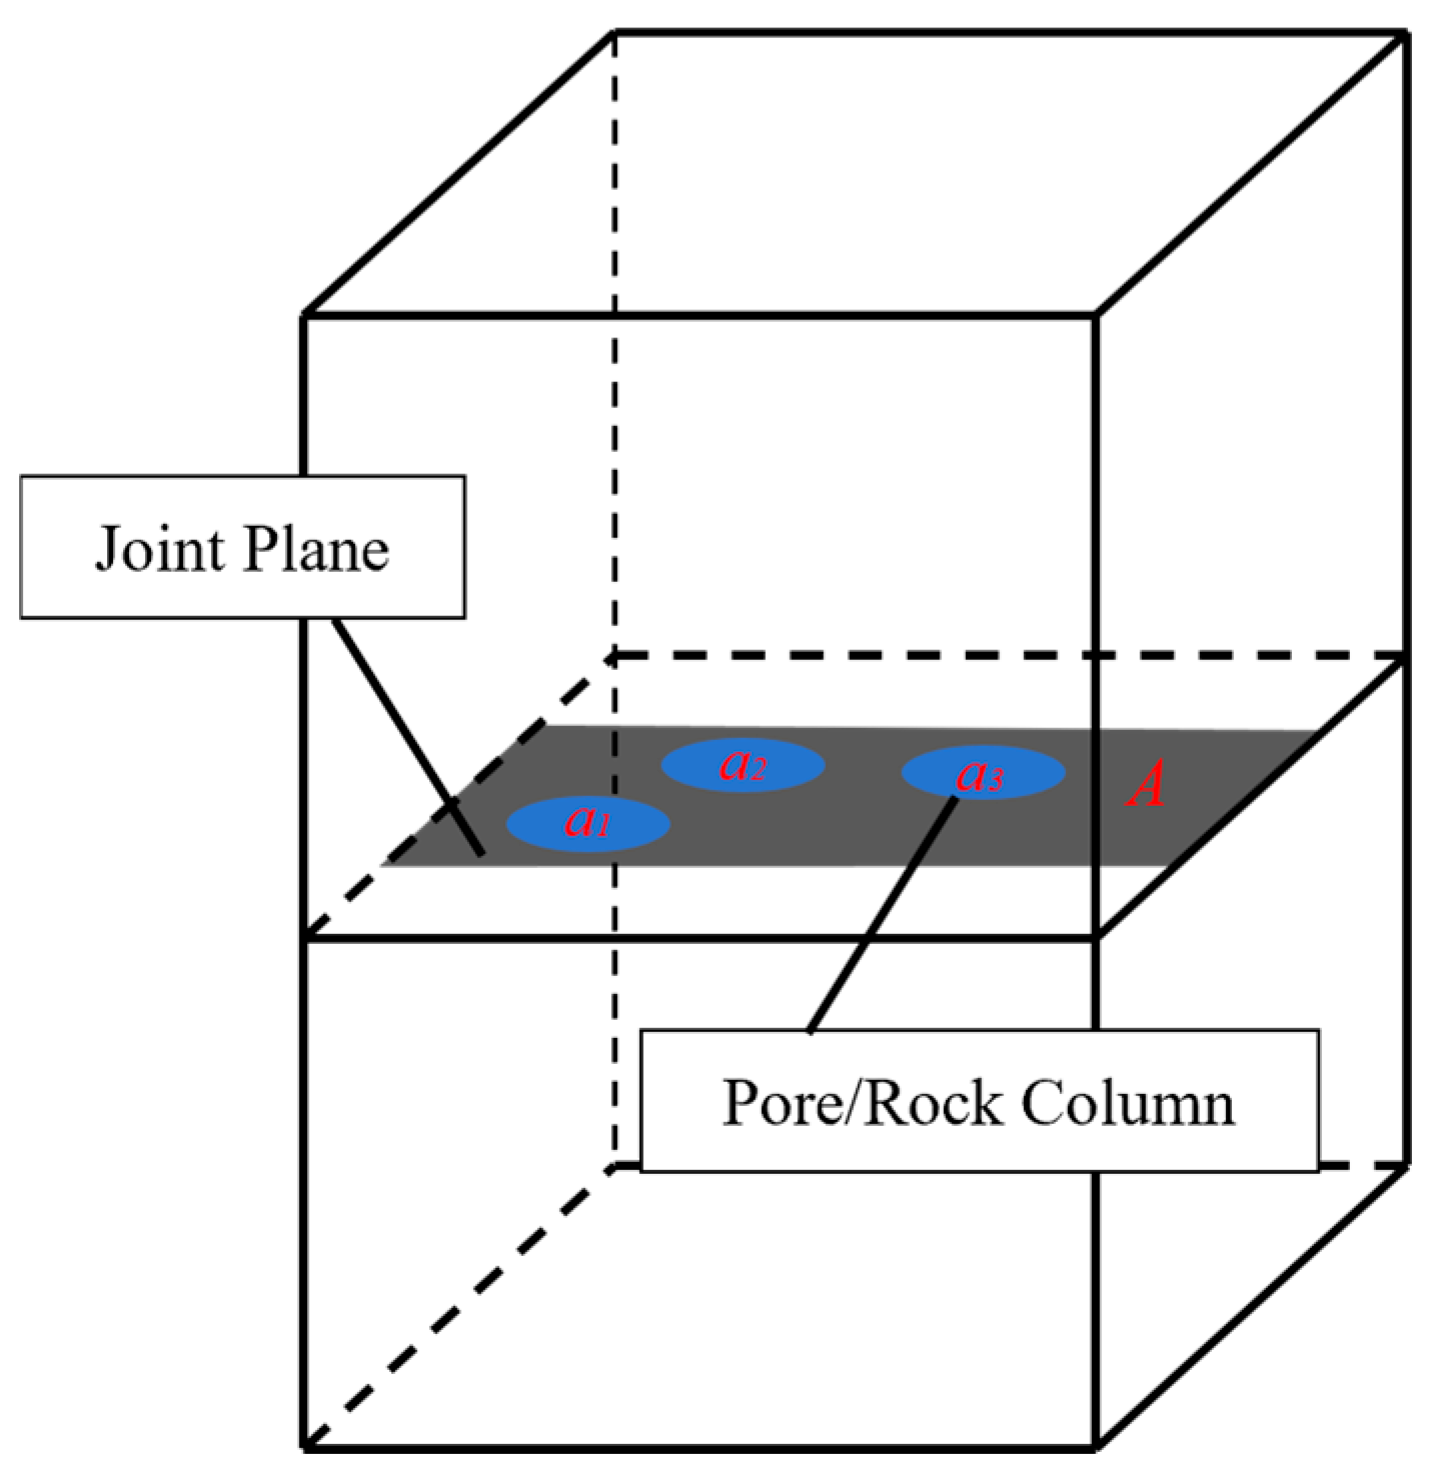
In rock mass engineering, the continuity of structural planes refers to the spatial extent or distribution range of structural planes within a specific plane. Consider a straight cross-section (with an area denoted as A) that fully overlaps with and penetrates the target structural planes, which is fully integrated into the rock mass (as illustrated in Figure 6). The continuity of structural planes can then be quantitatively characterized by the continuity coefficient (also denoted as the cutting degree) KA [32], ranging from 0 to 1: a value of 1 denotes completely continuous structural planes, while 0 denotes completely discontinuous ones. The calculation formula is shown in Equation (1)
where KA denotes the continuity coefficient; A denotes the area of the straight and parallel cross-section that fully overlaps the joint surface; ai represents the area of the i-th rock column.
Figure 6.
Schematic diagram of the calculation of the continuity coefficient.
To investigate the influence of joint continuity on the failure characteristics of rock masses, Groups 1, 5, and 7 with progressively increasing continuity coefficients were selected for the study. The detailed dimensions of rock columns, joint continuity coefficients, and failure characteristics are presented in Table 5 and Table 6: the former two parameters are summarized in Table 5, and the latter in Table 6.
Table 5.
Intermittent joint hole radius and continuity parameters.
Table 6.
Failure characteristics of jointed rock masses with different continuity.
By comparing Table 4 and Table 6, it was observed that the tensile and shear cracks accounting for the failure of discontinuous joint rock masses with different continuity coefficients were nearly identical after compression. Specifically, when the joint inclination angle was 0° or 90°, the specimens were mainly subjected to tensile stress and underwent tensile failure. In contrast, when the joint inclination angle was 30°, 45°, or 60°, the specimens were primarily caused by the penetration of shear cracks, under the combined action of tensile and shear stresses.
The key difference among discontinuous joint rock masses with different continuity coefficients lies in the occurrence of coplanar cracks and the outward extension of shear cracks along the joint direction at joint inclination angles of 30° and 45°. This study refers to such shear cracks extending a certain distance in the middle as “middle-long shear cracks”. Group 7, with a relatively high continuity coefficient, exhibited no coplanar cracks, and the shear cracks at joint inclination angles of 30° and 45° did not extend directly outward along the maximum principal stress direction. In contrast, Groups 1 and 5 (with relatively low continuity coefficients) both exhibited coplanar cracks, with the group with a continuity coefficient KA = 0 exhibiting the highest number of coplanar cracks. For Group 5, the shear cracks initiating at the upper ends of the joints extended outward along the joint direction for a certain distance before propagating along the maximum principal stress direction. This indicates that the smaller the continuity coefficient and the smaller the joint inclination angle, the higher the probability of coplanar crack initiation.
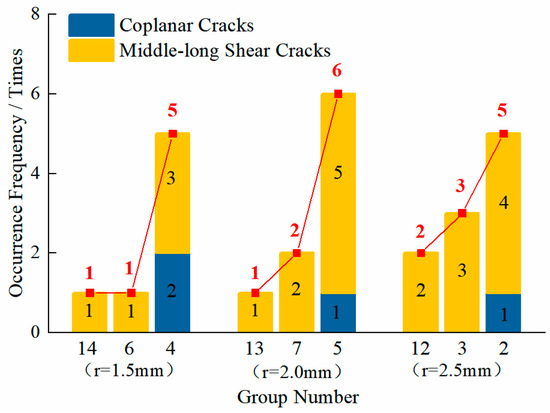
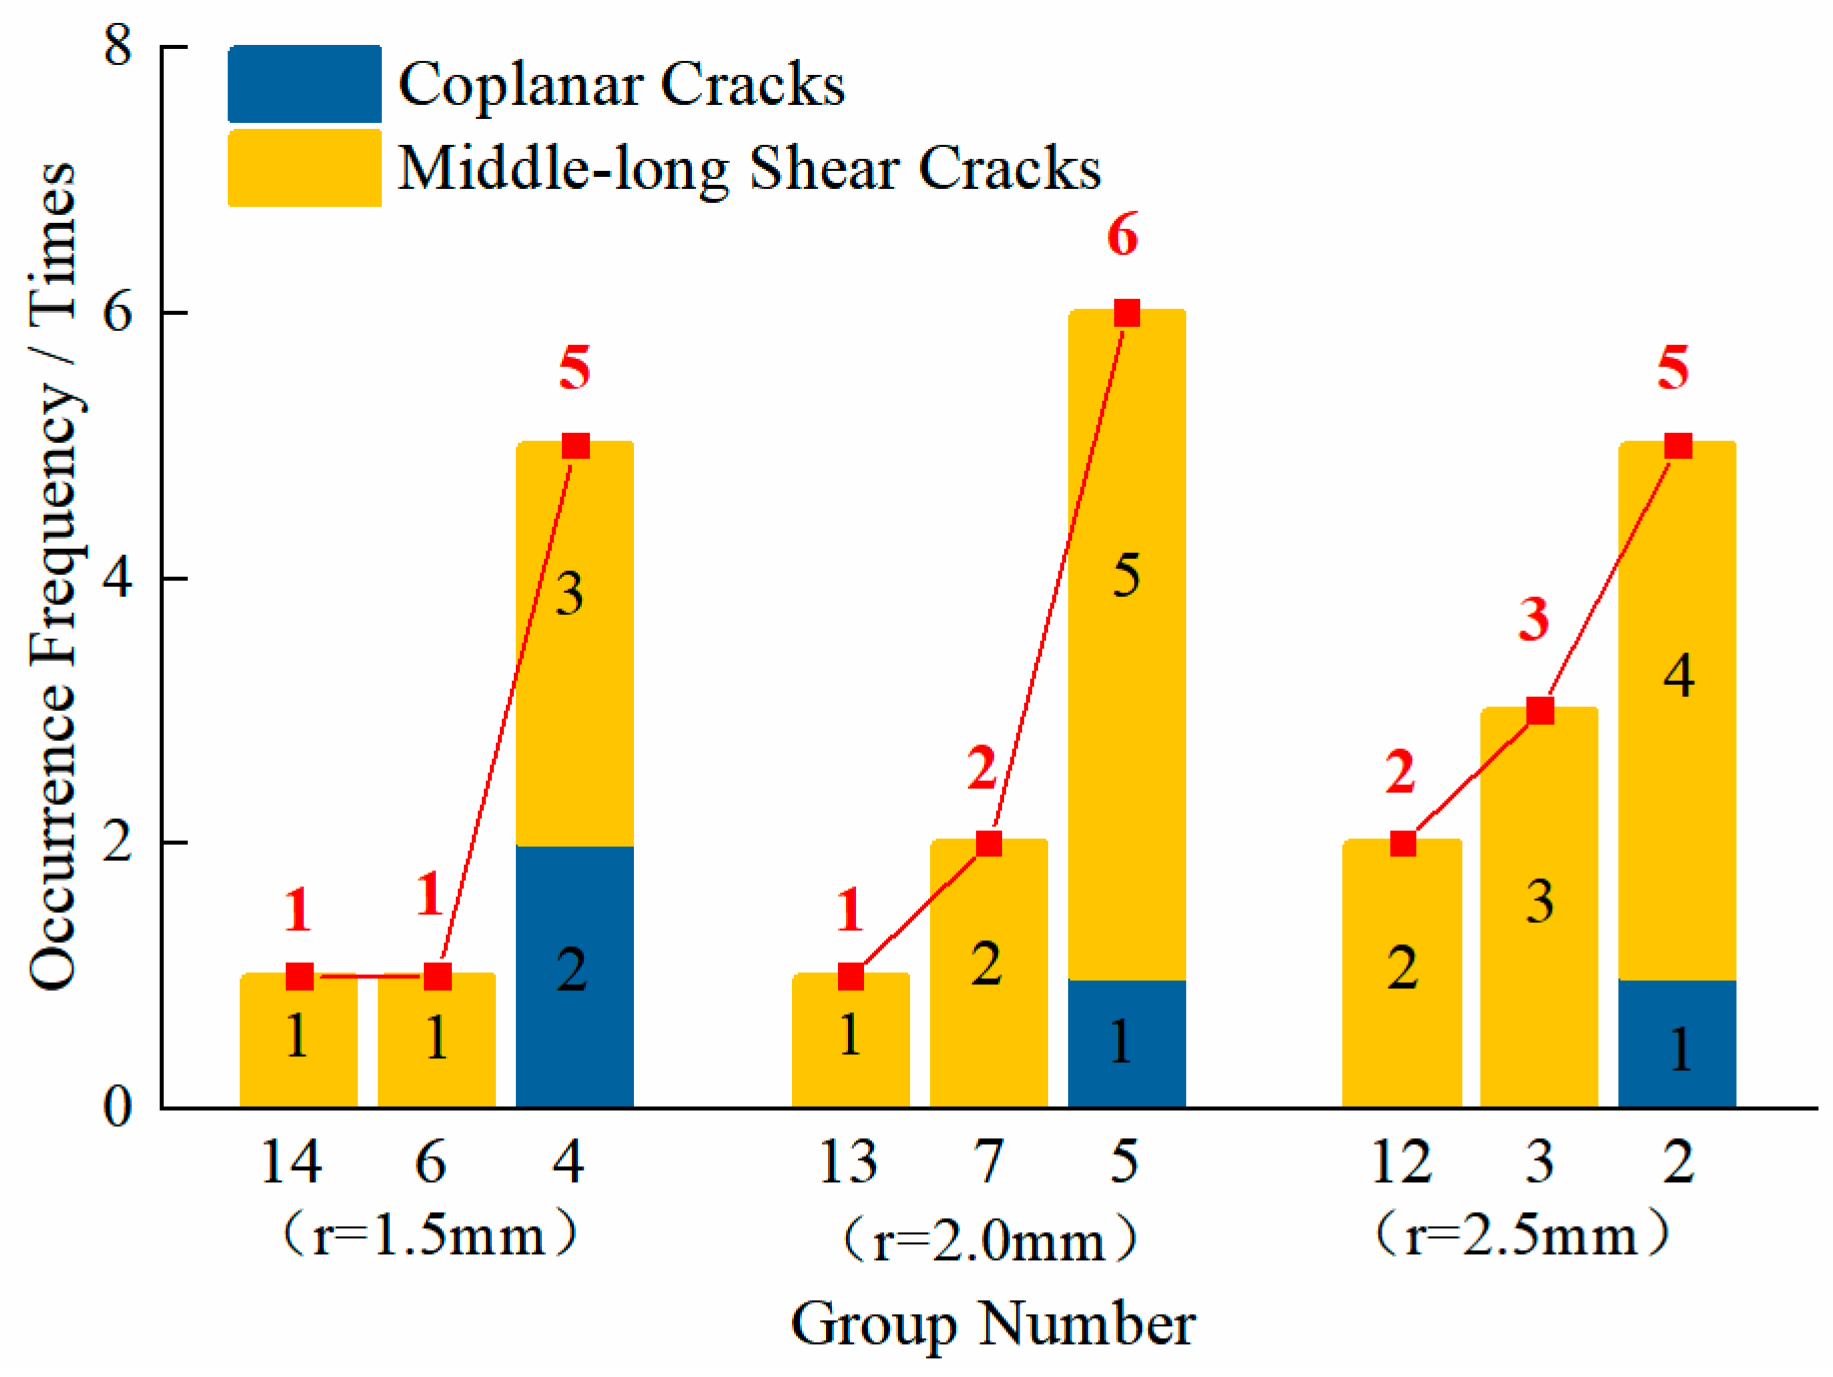
To ensure the accuracy of the results, 14, 6, and 4 groups; 13, 7, and 5 groups; 12, 3, and 2 groups with the same rock column radius and progressively decreasing continuity coefficients were selected for analysis. The number of occurrences of coplanar cracks in specimens at 0°, 30°, 45°, and 60° in each group was counted. The shear cracks that developed outward along the joint surface for a certain distance (referred to as the middle-long shear cracks) were counted together with the coplanar cracks, as both are manifestations of stress propagating outward along the joint surface during compression. Since the coplanar cracks (the tensile cracks causing specimen failure) at 90° were all in an “I” shape regardless of the joint continuity level, they were not incorporated into the statistical analysis. The statistical results are shown in Figure 7.
Figure 7.
The number of associated crack occurrences.
By comparing the crack failure characteristics and the results presented in Figure 7, it should be noted that the red line is the connecting line at the vertices of the bar chart, with an upward direction indicating an upward trend, it was observed that for coplanar cracks, Group 4 exhibited two more coplanar cracks than those of Groups 6 and 14, Group 5 exhibited one more coplanar crack than those of Groups 7 and 13, and Group 2 exhibited one more coplanar crack than those of Groups 3 and 12. In these three comparison groups, coplanar cracks occurred more frequently in specimens with relatively lower continuity coefficients than in those with relatively higher ones. This indicates that under the same rock column radius, the larger the continuity coefficient of rock mass joints, the lower the probability of coplanar crack occurrence.
By examining Table 7, it was observed that coplanar cracks only occurred in jointed specimens with a joint inclination angle less than 60°. For specimens with a joint inclination angle of 0° or 30°, the proportion of coplanar cracks reached 44.44%, while that for specimens with a joint inclination angle of 45° was only 11.11%. No coplanar cracks occurred in specimens with a joint inclination angle of 60° or 90°. This indicates that the larger the joint inclination angle of the rock mass, the lower the probability of coplanar crack occurrence.
Table 7.
The proportion of coplanar cracks in the specimens with different joint inclination angles.
3.3. Influence of Joint Morphology on Failure Characteristics
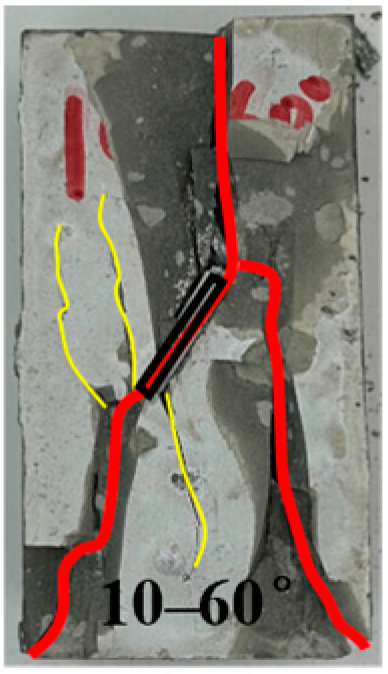
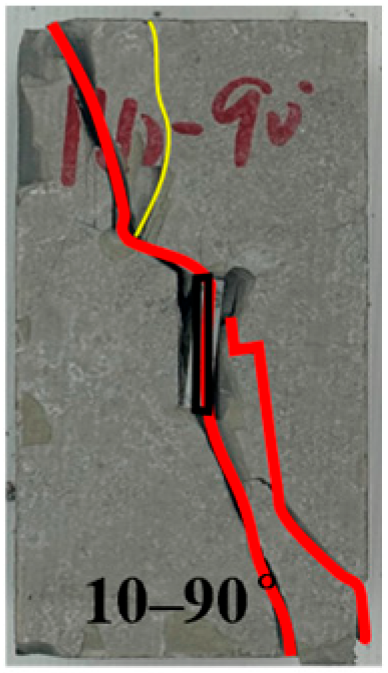
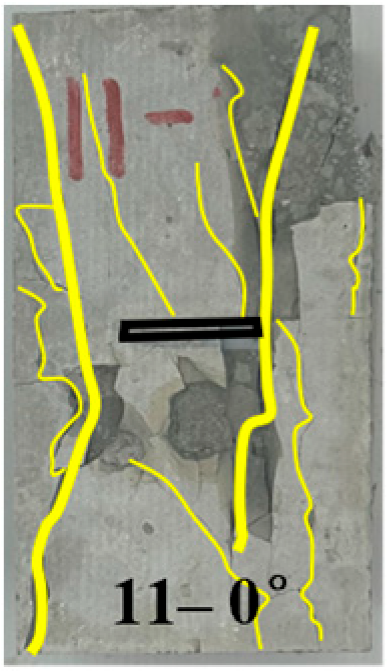
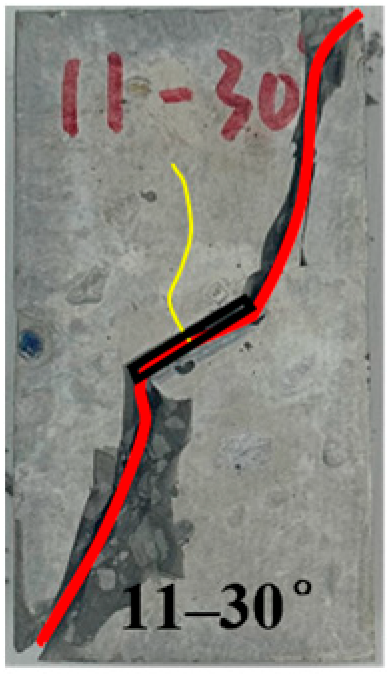
Given that joints in natural rock masses are rarely smooth and straight but exhibit diverse morphological features, joint morphology exerts a significant influence on the mechanical properties and failure characteristics of rock masses. Accordingly, understanding the influence of undulating joints on the macroscopic failure characteristics of rock masses is crucial for a comprehensive grasp of their mechanical properties. To investigate the influence of joint morphology on the failure characteristics of jointed rock masses, Group 1 (straight continuous joints), Group 10 (triangular undulating joints), and Group 11 (rectangular undulating joints) were selected for analysis. The specific surface areas of Group 1, Group 10, and Group 11 are 1000 mm2, 1414 mm2, and 1720 mm2, respectively.
By analyzing the fracture failure characteristics, it was found that joint undulation morphology affects stress transmission across the joint surface, thereby reducing the probability of coplanar cracks and middle-long shear cracks. Furthermore, joint undulation morphology induces more tensile cracks in the middle region of the joint. By comparing Table 4, Table 6 and Table 8, it was observed that the tensile and shear crack characteristics of rock masses with different joint undulation morphologies and discontinuous joint continuity levels were nearly identical after compression. Specifically, at joint inclination angles of 0° and 90°, the specimens were primarily subjected to tensile stress and failed predominantly due to tensile failure; while at joint inclination angles of 30°, 45°, and 60°, the specimens were mainly damaged by shear crack penetration, under the combined action of tensile and shear stresses.
Table 8.
Failure characteristics of jointed rock masses with different undulation states.
By examining Table 7, it was found that at a joint inclination angle of 0°, both straight-joint and undulating-joint rock masses generated predominantly tensile cracks with only a negligible number of shear cracks. Notably, specimens of straight-joint rock masses exhibited coplanar cracks, whereas those of undulating-joint rock masses did not. This signifies that joint undulation morphology influences stress transmission. In Group 10, shear cracks were observed, indicating that tensile stress dominated during the loading process, while the influence of shear stress was relatively minor.
When the joint inclination angle is 30°, 45°, or 60°, both straight-joint and undulating-joint specimens exhibited large through-going shear cracks across the joint surface. However, for straight-joint specimens, coplanar cracks or shear cracks along the joint surface extended a certain distance outward before propagating along the maximum principal stress direction (see Table 8 for Groups 1–45 and 1–60). This further confirmed that joint undulation influences stress transmission: relatively small wing cracks were generated at the ends of predefined straight joints, while almost no cracks occurred in the middle region of the joint. In contrast, the middle part of predefined undulating joints induced numerous small tensile cracks. This was attributed to the presence of joint undulation—undulating-joint rock masses transmitted stress through their undulating surfaces, thereby generating small tensile cracks and preventing excessive stress transmission along the joint, which suppressed the formation of coplanar cracks. When the joint inclination angle is 90°, Groups 10 and 11 exhibited large shear cracks, which differed from the tensile cracks produced by straight-joint specimens in Group 1. This indicated that joint undulation morphology alters the failure mode of joints with a 90° inclination angle under compression.
4. Analysis of Mechanical Properties of Discontinuous Jointed Rock Masses
4.1. Stress–Strain Relationship
The stress–strain curve of rock masses is a fundamental indicator that reflects the general laws of their deformation behavior. It can effectively characterize the strength and deformation characteristics of rock masses. However, the structural heterogeneity and joint development of natural rock masses vary, which renders the stress–strain relationship of rock masses more complex. Therefore, this study conducted stress–strain curve analysis on unjointed rock masses, straight continuous jointed, straight discontinuous jointed, and undulating jointed rock masses.
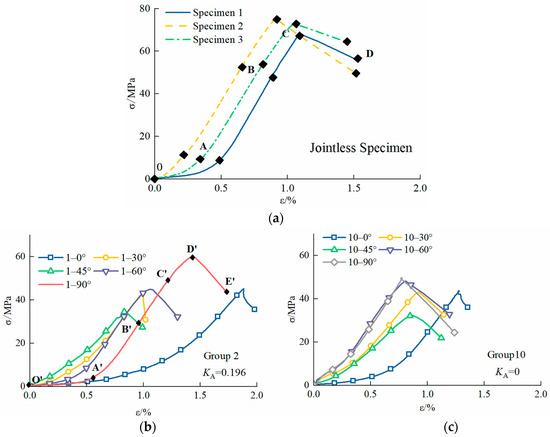
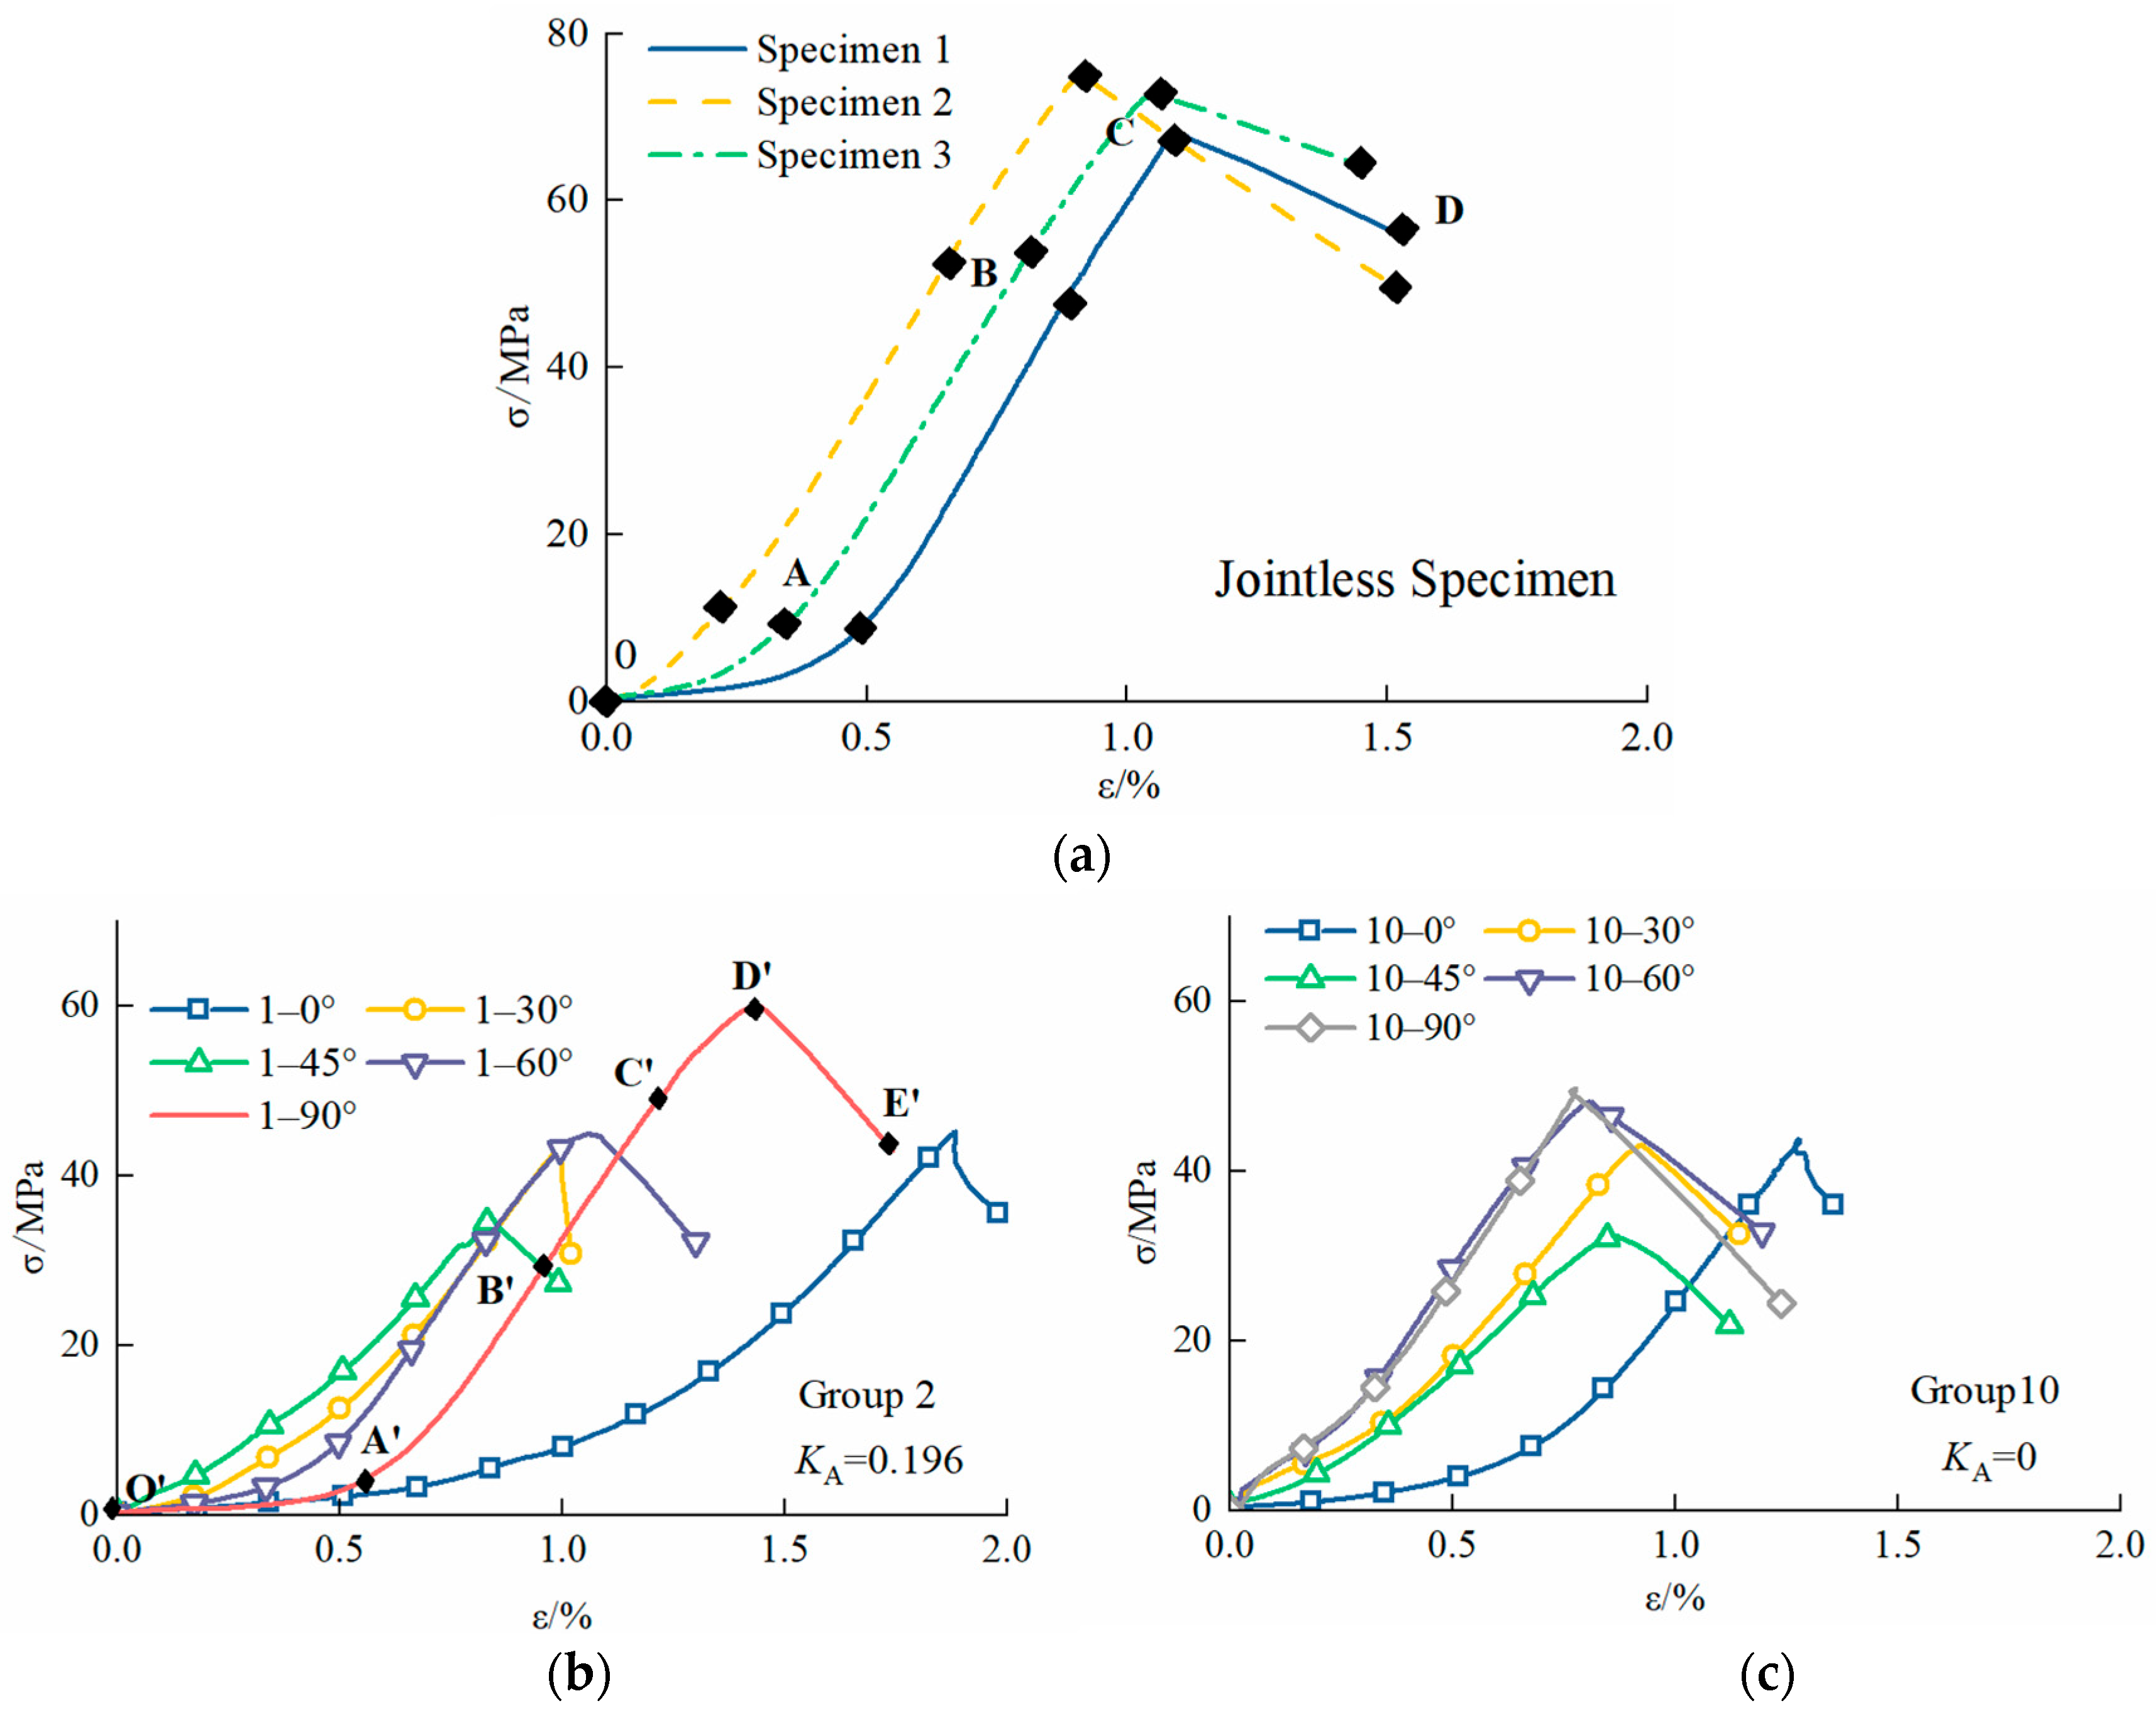
By analyzing the stress–strain curves of unjointed rock specimens presented in Figure 8, it was observed that at low stress levels, the stress–strain curve exhibits a slight upward curvature. As the stress increases to a specific threshold, the curve gradually transitions to a straight line until the specimen fails. This indicates that the specimens prepared in this experiment exhibit elastic-plastic behavior. By comparing all curves in Figure 8, it was found that the stress–strain curves of unjointed rock specimens exhibit four distinct stages: pore-fissure compaction (OA segment in Figure 8a), elastic deformation (AB segment in Figure 8a), stable crack propagation (BC segment in Figure 8a), and failure (CD segment in Figure 8a). In contrast, the stress–strain curves of jointed rock specimens all underwent five stages: compaction (OA segment in Figure 8b), elastic deformation (AB segment in Figure 8b), stable crack propagation (BC segment in Figure 8b), unstable crack propagation (CD segment in Figure 8b), and failure (DE segment in Figure 8b).
Figure 8.
Stress–strain curves of different specimens. (a) Stress–strain curve of jointless specimens. (b) Stress–strain curve of straight discontinuous jointed specimens. (c) Stress–Strain curve of undulating jointed specimens. Note: O’ (O) refers to the initial loading point (the start of compaction stage); A–D in (a) represent the four deformation stages of jointless specimens, corresponding to OA (pore-fissure compaction), AB (elastic deformation), BC (stable crack propagation) and CD (failure) respectively; A’–E’ in (b) represent the five deformation stages of jointed specimens, corresponding to O’A’ (compaction), A’B’ (elastic deformation), B’C’ (stable crack propagation), C’D’ (unstable crack propagation) and D’E’ (failure) respectively.
During the initial loading stage of the rock specimens, the original pores and microcracks within the rock gradually closed, accompanied by compaction of the specimens, resulting in early nonlinear deformation. As stress continued to increase, the rock specimens entered the elastic deformation stage, where the stress–strain curve exhibited a linear relationship. With further increases in stress, the slope of the stress–strain curve gradually decreased. New microcracks initiated within the specimens, and these cracks were constrained by the applied load and underwent stable propagation.
Compared with unjointed specimens, jointed specimens exhibited a distinct unstable crack propagation stage (yield stage), indicating that the introduction of joints enhanced the discontinuity and defect density of the rock, rendering it more susceptible to local yielding and plastic deformation. Additionally, the presence of joints induced uneven stress distribution within the rock, leading to yielding behavior. At this stage, the microcrack development within jointed specimens underwent a qualitative transition, with cracks propagating continuously until the specimens were fully fractured. Upon reaching peak strength, the internal structure of the specimens was compromised, with rock fissures propagating rapidly, intersecting each other, and forming a macroscopic fracture surface. The deformation of the rock was dominated by sliding along the macroscopic fracture surface.
4.2. Influence of Joint Dip Angle on Mechanical Properties
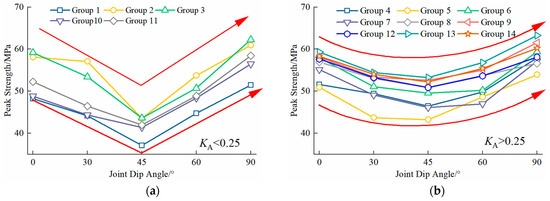
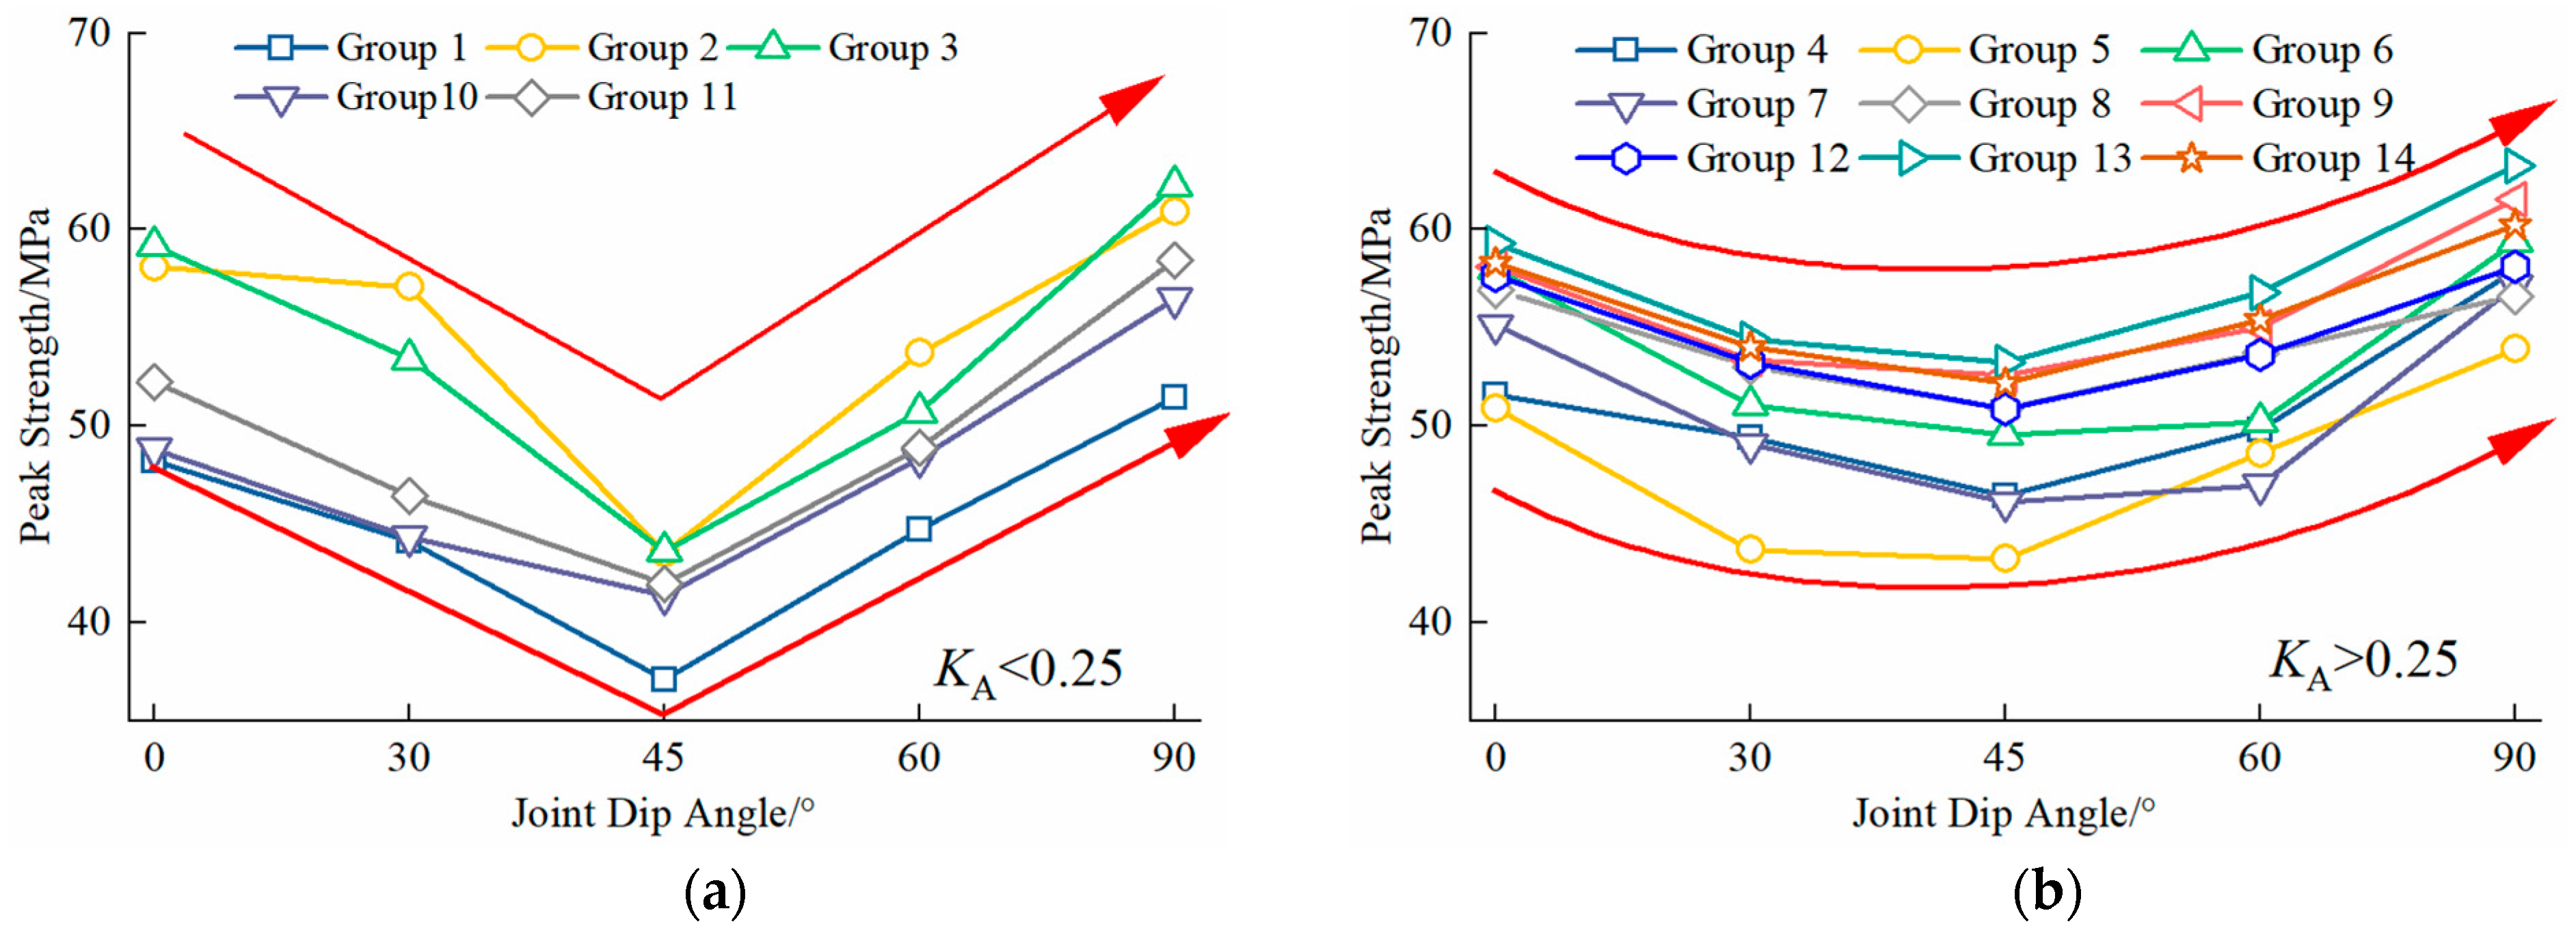
The compressive strength of a rock mass refers to the ability of a rock mass to resist being crushed and fractured under unidirectional compression. In particular, the peak compressive strength denotes the maximum compressive stress that a rock mass can withstand prior to failure. This parameter not only provides guidance for engineering design and construction but also aids in assessing geological stability and mitigating geological hazards. Consequently, research on the compressive strength of rock masses is of great engineering significance. Figure 9 depicts the variation in peak compressive strength of continuous rock masses with joint angles ranging from 0° to 90°.
Figure 9.
Effect of joint dip angle on the peak compressive strength of intermittent jointed rock mass. (a) Variation trend of peak strength of discontinuous jointed rock masses with KA < 0.25 under different joint dip angles. (b) Variation trend of peak strength of discontinuous jointed rock masses with KA > 0.25 under different joint dip angles. Note: The red arrow lines are trend lines, which characterize the trend and morphology of the broken lines in the figure; the trend shows a V-shape in (a) and a U-shape in (b).
As illustrated in Figure 9, when joint morphology and continuity coefficient are held constant, the peak compressive strength of specimens exhibits a decreasing trend followed by an increasing trend with joint inclination angles ranging from 0° to 90°, attaining a minimum at a joint inclination angle of 45° and maxima at 0° and 90°. Furthermore, the peak compressive strength at 90° is higher than that at 0°. Notably, the peak compressive strength of Group 1 is lower than that of the other groups, indicating that for discontinuous joints, the presence of rock columns significantly enhances the peak compressive strength of the rock mass. Further observation shows that for Groups 1–3, 10, and 11 (continuity coefficient KA < 0.25), the peak compressive strength curves exhibit a “V” shape (Figure 9a) as the joint inclination angle varies from 0° to 90°. In contrast, for Groups 4–9 and 12–14 (continuity coefficient KA > 0.25), the curves exhibit a “U” shape (Figure 9b). Notably, Groups 1, 10, and 11 correspond to continuous joints with a continuity coefficient KA = 0. Additionally, the closer KA is to 0, the more closely the curves approximate a horizontal line.
4.3. Influence of Joint Continuity on Mechanical Properties
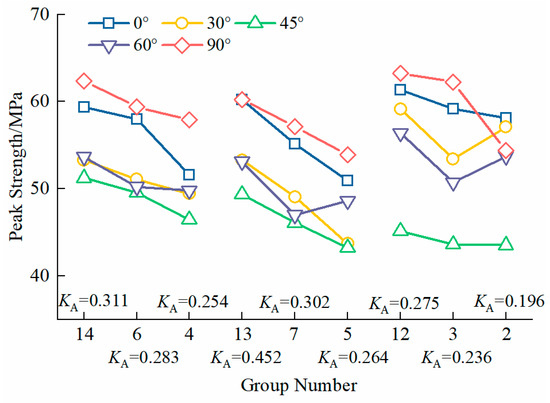
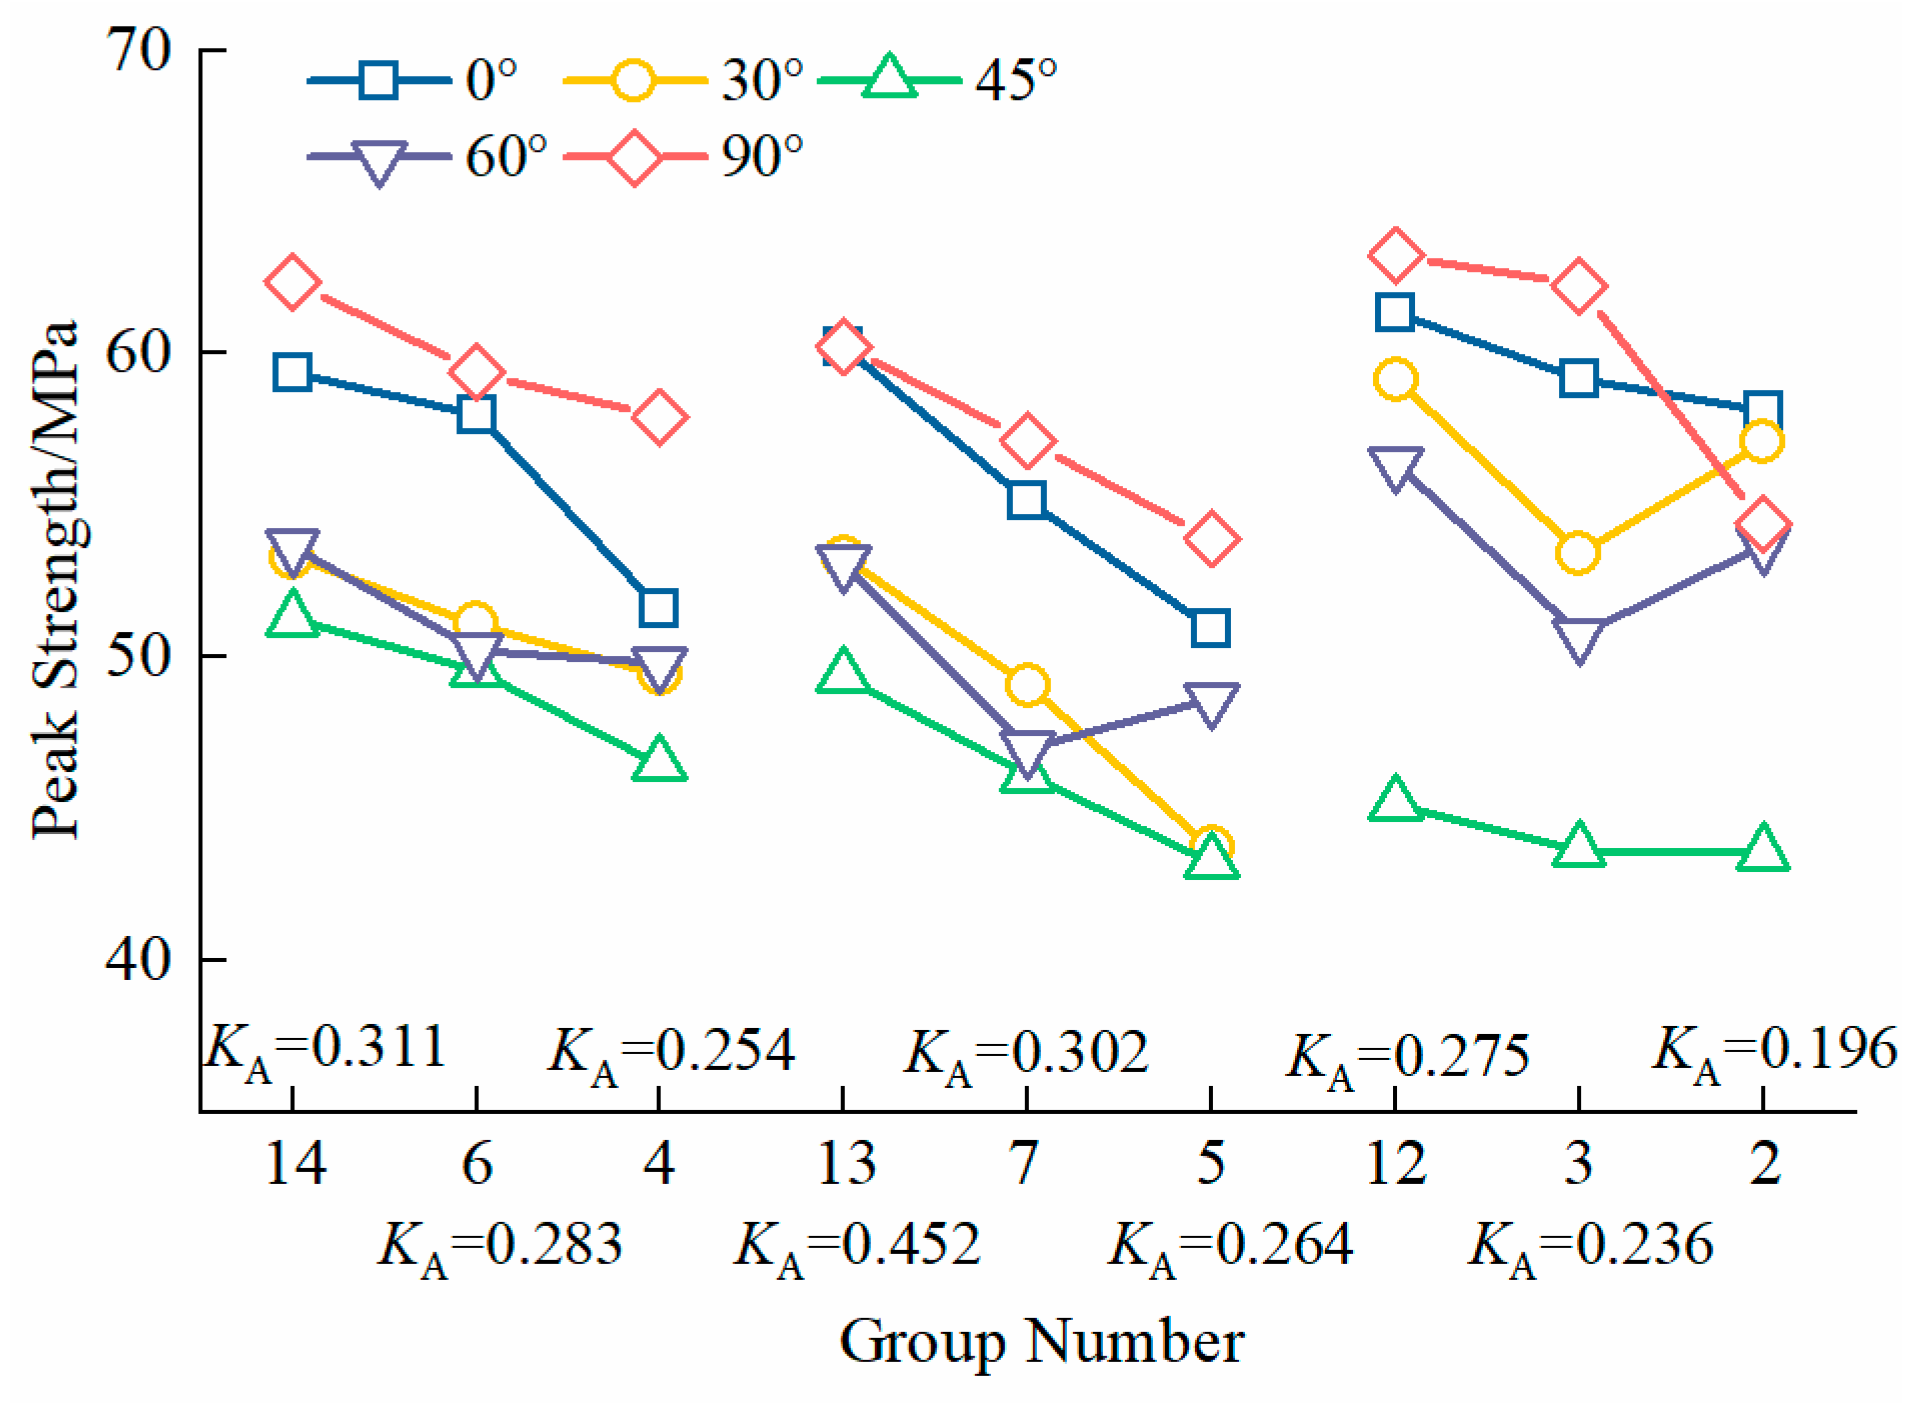
To investigate the sole effect of joint continuity on the peak compressive strength of specimens, three sets of comparative groups with identical rock column radii but increasing continuity coefficients were selected for comparative analysis: Groups 4, 6, and 14 (rock column radius = 1.5 mm); Groups 5, 7, and 13 (rock column radius = 2 mm); and Groups 2, 3, and 12 (rock column radius = 2.5 mm). Each set of comparative groups exhibits a progressive increase in joint continuity. To ensure a valid comparison, the joint inclination angle was held constant across all groups, and the results are plotted in Figure 10.
Figure 10.
Effect of joint continuity on the peak compressive strength of intermittent jointed rock mass.
The results indicated that, with the exception of three specific cases—where the peak compressive strength of Group 5 was higher than that of Group 7 (Group 5 having a lower continuity coefficient than Group 7), where Group 2 exceeded Group 3 at a joint inclination angle of 60° (Group 2 having a lower continuity coefficient than Group 3), and where Group 2 also exceeded Group 3 at a joint inclination angle of 90° (Group 2 having a lower continuity coefficient than Group 3)—the remaining 12 groups exhibited a consistent trend: under identical rock column sizes, the lower the joint continuity of the specimens, the lower their peak compressive strength. Thus, it can be concluded that when the joint inclination angle, joint morphology, and rock column size are held constant, the larger the joint continuity coefficient, the lower the peak compressive strength of the specimens. This further confirms the principle that the higher the proportion of rock bridges, the greater the rock strength, specifically that the presence of rock columns can inhibit crack propagation and coalescence.
4.4. Influence of Joint Morphology on Mechanical Properties
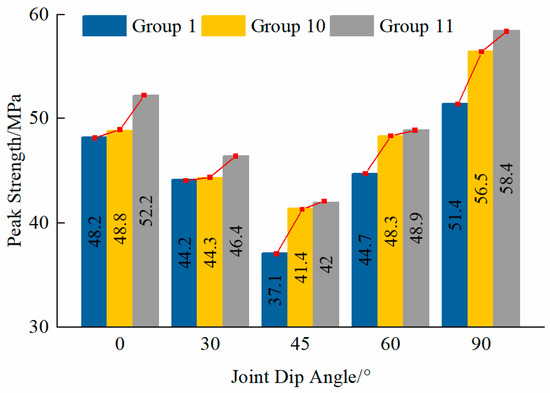
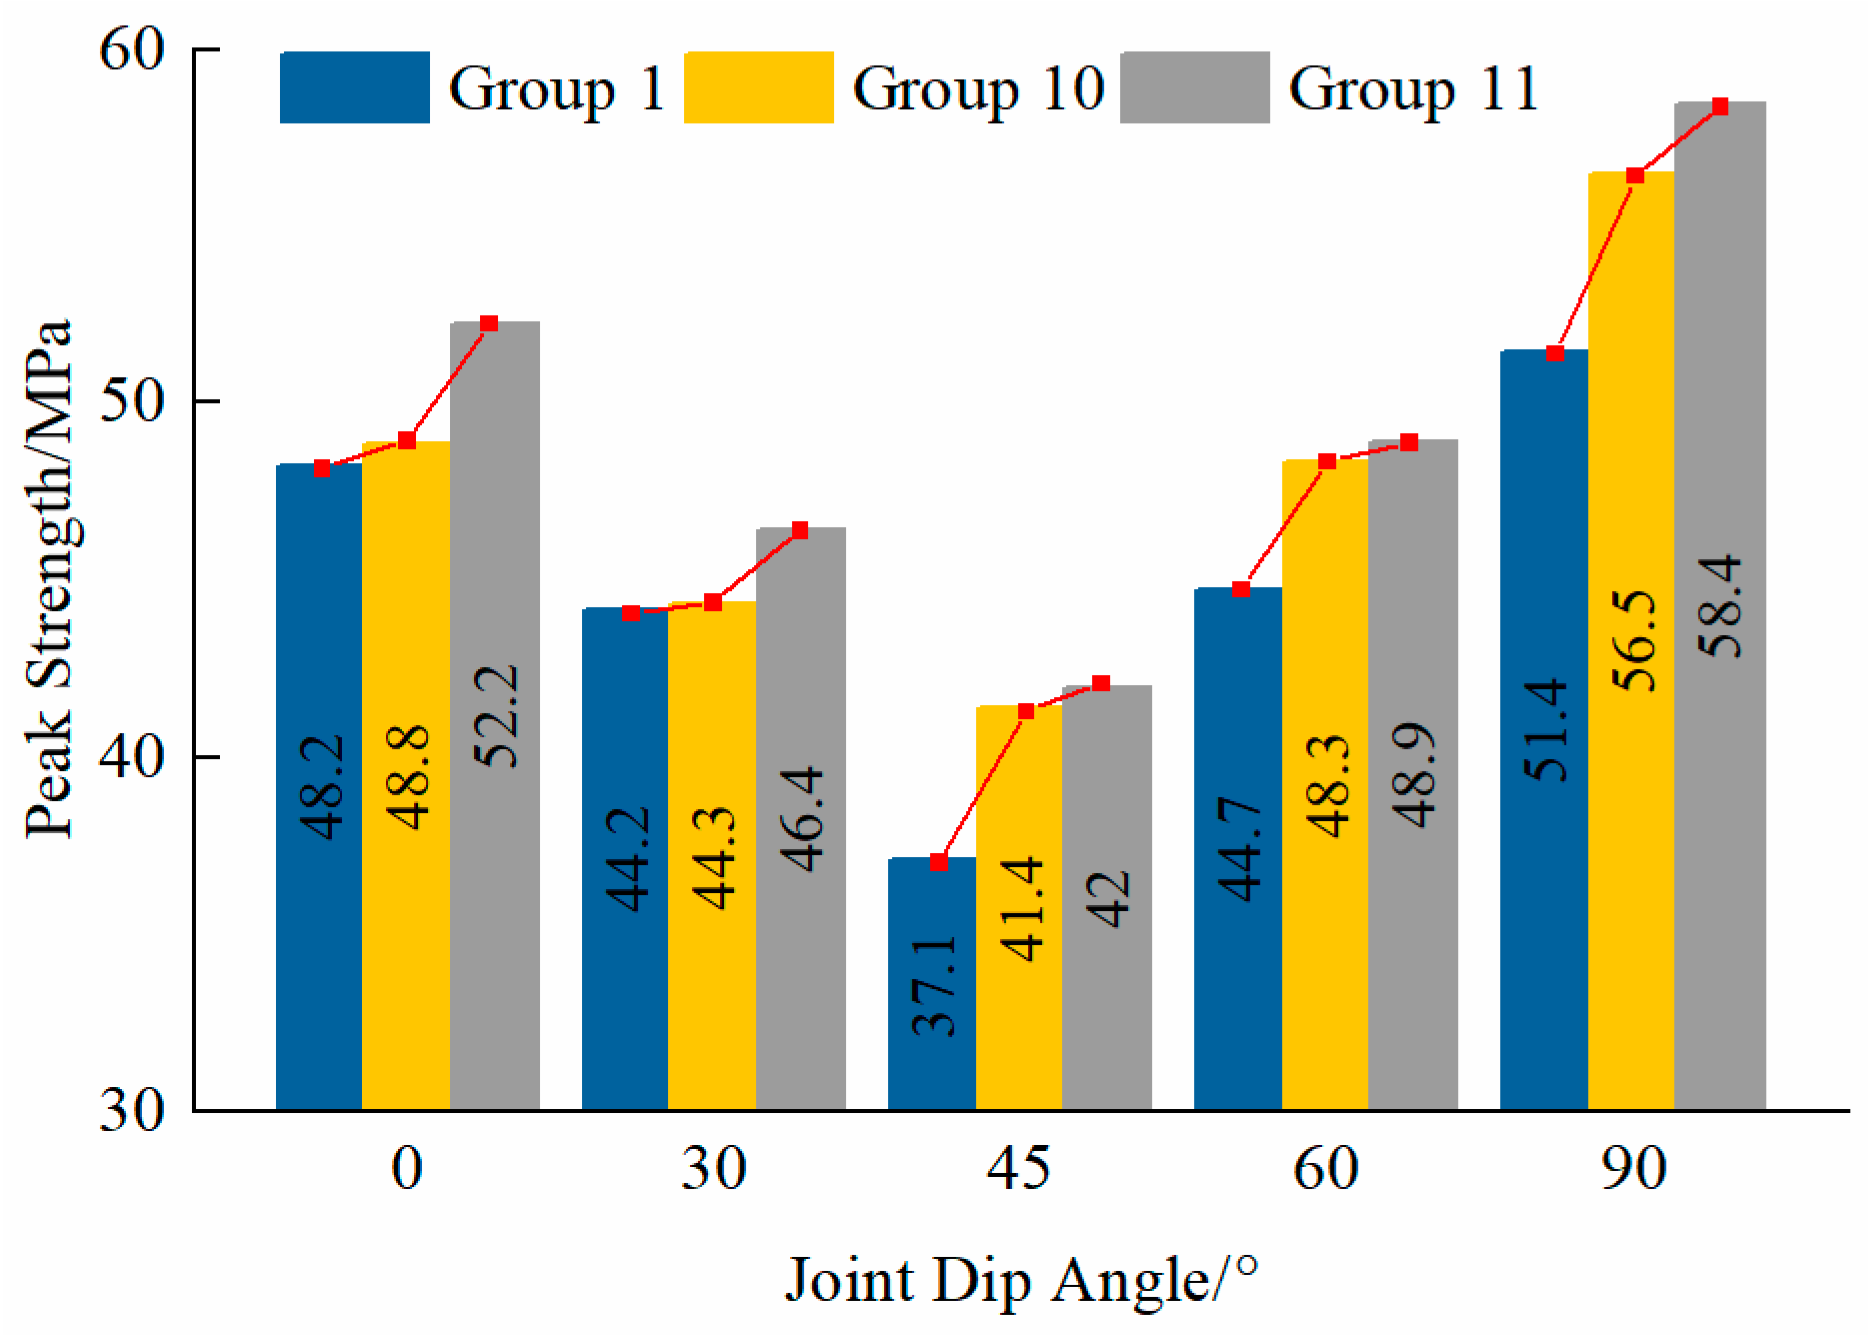
To investigate the influence of different joint corrugated shapes on the mechanical properties of jointed rock masses, the continuity coefficient and joint inclination angle were held constant, and comparative analysis was performed on specimens with distinct joint corrugated shapes. The results are depicted in Figure 11. It is evident that rock masses with rectangular corrugated joints (Group 11) exhibit higher peak compressive strength than those with triangular corrugated joints (Group 10), which in turn surpasses that of specimens with planar joints (Group 1). All specimens have the same projected area of 50 mm × 20 mm (length × width). The serrated asperities of rectangular corrugated joints form a robust mechanical interlocking mechanism; during the shear process, additional resistance due to tooth fracture must be overcome. In contrast, triangular corrugated joints primarily undergo sliding along their inclined surfaces, with an interlocking effect that is significantly weaker than the tooth-induced interlocking of rectangular corrugated joints. This aligns with the generalized model of joint surface undulations, where macroscopic undulating shapes dominate the mechanical response of jointed rocks.
Figure 11.
Effect of joint morphology on the peak compressive strength of jointed rock mass. Note: The red line is the connecting line at the vertices of the bar chart, with an upward direction indicating an upward trend.
Based on the statistical data of five sets of joint inclination angles (0°, 30°, 45°, 60°, and 90°), the average peak compressive strengths of triangular corrugated jointed rock masses and rectangular corrugated jointed rock masses are 6.7% and 11.2% higher than that of planar jointed rock masses, respectively. This strength gain is most significant in the low-to-middle inclination angle range (30–45°) and is closely associated with the stress-induced bending behavior of the joint surfaces.
This phenomenon may be attributed to the increased contact area between joint surfaces and the adjacent rock matrices, thereby enhancing frictional resistance. This indicates that joint surface morphology exerts a significant regulating effect on the mechanical behaviors of jointed rock masses. The undulating morphology modulates the strength evolution process by modifying the shear failure mechanism, providing a theoretical basis for optimizing the stability control of jointed rock masses in engineering applications.
5. Conclusions
Various types of rock-like specimens with distinct joint morphologies, joint inclination angles, and joint continuity coefficients were fabricated using 3D printing technology in this study. Indoor mechanical tests were conducted on these specimens to investigate their failure characteristics and mechanical behaviors. The key findings are as follows:
- (1)
- The propagation patterns of tensile cracks and shear cracks in discontinuous jointed rock-like specimens are consistent with those in continuous jointed rock-like specimens. With the increase in joint inclination angle, tensile and shear cracks consistently coexist, signifying that the specimens are subjected to combined compressive–tensile stresses. At an inclination angle of 0°, specimen failure is dominated by tensile stress; at 30°, 45°, and 60°, shear splitting failure is the primary failure mode; at 90°, failure results from the combined effect of tensile and shear stresses.
- (2)
- The occurrence of coplanar cracks is associated not only with the continuity coefficient of discontinuous joints, rock column size, and joint inclination angle, but also with the joint corrugated morphology. With rock column radius and joint inclination angle held constant, the larger the continuity coefficient, the lower the probability of coplanar crack occurrence; with joint inclination angle and continuity coefficient fixed, the smaller the rock column radius, the higher the probability of coplanar crack occurrence; with continuity coefficient and rock column radius unchanged, the smaller the joint inclination angle, the higher the probability of coplanar crack occurrence. Corrugated joints exhibit a relatively low probability of coplanar crack occurrence.
- (3)
- The peak compressive strength of discontinuous jointed rock-like specimens first decreases and then increases with the increase in discontinuous joint inclination angle. The minimum value is achieved at an inclination angle of 45°, while the maximum values occur at 0° and 90°. When the continuity coefficient KA < 0.25, the peak compressive strength–joint inclination angle curve exhibits a “V” shape, and the curve tends to be horizontal as KA approaches 0; Conversely, when KA > 0.25, the closer KA is to 1, the closer the curve approximates a “U” shape.
- (4)
- With joint inclination angle and rock column radius fixed, the higher the continuity of discontinuous joints, the lower the specimen strength; with consistent joint surface projection size and shape, corrugated jointed rock-like specimens exhibit higher strength than planar jointed rock-like specimens. Specifically, the peak compressive strength of triangular corrugated jointed specimens and rectangular corrugated jointed specimens is approximately 6.7% and 11.2% higher than that of planar jointed specimens, respectively.
- (5)
- This study establishes a quantitative mapping relationship between the continuity coefficient KA and specimen strength, providing a theoretical basis for the rapid identification of KA using borehole imaging or laser scanning in engineering applications. This aligns with the engineering practice of rock mass integrity evaluation based on structural parameter identification.
It should be noted that the conclusions of this study are derived from laboratory tests on small-scale concrete specimens with idealized resin joints, and there are differences from natural rock masses in terms of scale, joint infills, weathering, and spatial variability of mechanical properties. The core mechanisms (e.g., the influence of joint continuity and morphology on strength) revealed in this study are scale-invariant and applicable to real rock masses; however, the quantitative relationships (e.g., KA-strength mapping) need to be modified by integrating site-specific factors (e.g., joint fill type, weathering degree, and rock mass quality) in engineering applications. Future research will focus on large-scale specimens and field tests to further optimize the quantitative model.
Author Contributions
Conceptualization, Y.Y. and J.Y.; methodology, J.Y.; software, Z.C.; validation, J.Z., J.Y. and Z.C.; formal analysis, Y.Y.; investigation, J.Y.; resources, Z.C.; data curation, J.Z.; writing—original draft preparation, J.Z.; writing—review and editing, Y.Y., J.Z., Z.C. and J.Y.; visualization, J.Z.; supervision, Y.Y. and Z.C.; project administration, J.Y.; funding acquisition, Z.C. All authors have read and agreed to the published version of the manuscript.
Funding
Young Scientists Project of the National Key R&D Program (2023YFB2390400), National Natural Science Foundation of China (52379112, U21A20159), Key R&D Project of Hubei Provincial Technology Innovation Program (2024BCB104), Research Topic of Major Science and Technology Project of the Ministry of Water Resources (SKS-2022103), Shenzhen undertakes major national science and technology projects (Grant No. CJGJZD20230724094000002).
Institutional Review Board Statement
Not applicable.
Informed Consent Statement
Not applicable.
Data Availability Statement
The original contributions presented in the study are included in the article; further inquiries can be directed to the corresponding author.
Conflicts of Interest
The authors declare no conflicts of interest.
References
- Cao, R.; Dai, H.; Yao, R.; Lin, H.; Li, K. Failure Behaviour of Jointed Rock Masses with 3D Nonpenetrating Joints under Uniaxial Compression: Insights from Discrete Element Method Modelling. Appl. Sci. 2022, 12, 11027. [Google Scholar] [CrossRef] [Scilit]
- Yang, W.; Luo, G.; Duan, K.; Jing, W.; Zhang, L.; Wang, S.; Zhao, Y. Development of a Damage Rheological Model and Its Application in the Analysis of Mechanical Properties of Jointed Rock Masses. Energy Sci. Eng. 2019, 7, 1016–1031. [Google Scholar] [CrossRef] [Scilit]
- Bahari, A. Numerical Study on the Effect of Foundation Flexibility and Differential Settlement on the Behaviour of Lattice Tower Structures; Université de Sherbrooke: Sherbrooke, QC, Canada, 2024; Available online: http://hdl.handle.net/11143/21767 (accessed on 5 June 2024).
- Chen, P.; Li, R.; Fu, K.; Zhao, X. Research and Method for In-line Inspection Technology of Girth Weld in Long-Distance Oil and Gas Pipeline. J. Phys. Conf. Ser. 2021, 1986, 012052. [Google Scholar] [CrossRef] [Scilit]
- Shang, J.; West, L.J.; Hencher, S.R.; Zhao, Z. Geological discontinuity persistence: Implications and quantification. Eng. Geol. 2018, 241, 41–54. [Google Scholar] [CrossRef] [Scilit]
- Erdogan, F.; Sih, G.C. On the Crack Extension in Plates Under Plane Loading and Transverse Shear. J. Basic Eng. 1963, 85, 519–525. [Google Scholar] [CrossRef] [Scilit]
- Gong, B.; Zhao, T.; Thusyanthan, I.; Tang, C. Modelling Rock Fracturing by a Novel Implicit Continuous to Discontinuous Method. Comput. Geotech. 2024, 166, 106035. [Google Scholar] [CrossRef] [Scilit]
- Liu, X.; Hu, C.; Liu, Q.; He, J. Grout Penetration Process Simulation and Grouting Parameters Analysis in Fractured Rock Mass Using Numerical Manifold Method. Eng. Anal. Bound. Elem. 2021, 123, 93–106. [Google Scholar] [CrossRef] [Scilit]
- Maedo, M.A.; Sánchez, M.; Fabbri, H.; Cleto, P.; Guimarães, L.J.N.; Manzoli, O.L. Coupled Thermo-Hydro-Mechanical Numerical Modeling of Evolving Fractures in Rocks. Rock Mech. Rock Eng. 2021, 54, 3569–3591. [Google Scholar] [CrossRef] [Scilit]
- Sun, S.R.; Wang, J.; Le, H.L.; Fan, H.T.; Wang, W.C. Experimental and Numerical Investigation on Compressive Strength and Crack Behavior of Rock-like Specimens with Open Flaws under Confining Loads. Front. Earth Sci. 2022, 10, 972194. [Google Scholar] [CrossRef] [Scilit]
- Liu, G.; Jiang, Q.H.; Xiong, F.; Zhang, X.B. Experimental Study of Crack Propagation and Deformation Failure of Multiple-jointed Rock Mass. Rock Soil Mech. 2016, 37, 151–158. Available online: http://ytlx.whrsm.ac.cn/CN/10.16285/j.rsm.2016.S1.020 (accessed on 5 June 2024). (In Chinese)
- Cao, R.H.; Cao, P.; Lin, H.; Ma, G.; Zhang, C.; Jiang, C. Failure Characteristics of Jointed Rock-like Material Containing Multi-joints under a Compressive-shear Test: Experimental and Numerical Analyses. Arch. Civ. Mech. Eng. 2018, 18, 784–798. [Google Scholar] [CrossRef] [Scilit]
- Zhao, X.C.; Zhao, X.Y.; Guo, J.Q. Experimental Study on Acoustic and Mechanical Properties of Discontinuous Jointed Rock Mass. Chin. J. Rock Mech. Eng. 2020, 39, 1408–1419. Available online: https://rockmech.whrsm.ac.cn/CN/10.13722/j.cnki.jrme.2020.0008 (accessed on 6 June 2024). (In Chinese)
- Han, G.S.; Jing, H.W.; Jiang, Y.J.; Liu, R.; Su, H.; Wu, J. The Effect of Joint Dip Angle on the Mechanical Behavior of Infilled Jointed Rock Masses under Uniaxial and Biaxial Compressions. Processes 2018, 6, 49. [Google Scholar] [CrossRef] [Scilit]
- Chen, M.; Yang, S.Q.; Gamage, R.P.; Yang, W.; Yin, P.; Zhang, Y.; Zhang, Q. Fracture Processes of Rock-like Specimens Containing Nonpersistent Fissures under Uniaxial Compression. Energies 2018, 12, 79. [Google Scholar] [CrossRef] [Scilit]
- Pan, J.L.; Wu, X.; Guo, Q.F.; Xi, X.; Cai, M.F. Uniaxial Experimental Study of the Deformation Behavior and Energy Evolution of Conjugate Jointed Rock Based on AE and DIC Methods. Adv. Civ. Eng. 2020, 2020, 8850250. [Google Scholar] [CrossRef] [Scilit]
- Pan, J.L.; Ren, F.H.; Cai, M.F. Effect of Joint Density on Rockburst Proneness of the Elastic-Brittle-Plastic Rock Mass. Shock Vib. 2021, 2021, 5574325. [Google Scholar] [CrossRef] [Scilit]
- Xia, Y.J.; Meng, Q.K.; Zhang, C.Q.; Liu, N.; Zhao, Z.X.; Chen, J.; Yang, G. Application of 3D Printing Technology in the Mechanical Testing of Complex Structural Rock Masses. Geofluids 2021, 2021, 7278131. [Google Scholar] [CrossRef] [Scilit]
- Niu, Q.; Jiang, L.; Li, C.; Zhao, Y.; Wang, Q.; Yuan, A. Application and Prospects of 3D Printing in Physical Experiments of Rock Mass Mechanics and Engineering: Materials, Methodologies and Models. Int. J. Coal Sci. Technol. 2023, 10, 5. [Google Scholar] [CrossRef] [Scilit]
- Tan, W.H.; Wang, P.F. Experimental Study on Seepage Properties of Jointed Rock-Like Samples Based on 3D Printing Techniques. Adv. Civ. Eng. 2020, 2020, 9403968. [Google Scholar] [CrossRef] [Scilit]
- Wang, P.T.; Huang, Z.J.; Ren, F.H.; Zhang, L.; Cai, M.F. Research on Direct Shear Behaviour and Fracture Patterns of 3D-Printed Complex Jointed Rock Models. Rock Soil Mech. 2020, 41, 46–56. Available online: https://rockmech.whrsm.ac.cn/CN/10.13722/j.cnki.jrme.2017.1039 (accessed on 6 June 2024). (In Chinese)
- Dong, S.; Lu, Z.; Hu, X. Experimental Study on Strength and Failure Characteristics of Sandstone Rock Mass with Complex Cataclastic Structure Using 3D Printing Models. Sci. Rep. 2023, 13, 4901. [Google Scholar] [CrossRef] [Scilit]
- Yuan, P.; Li, A.; Chen, C.; Lu, X. Experimental Study of Uniaxial Compressive Mechanical Properties of Rough Jointed Rock Masses Based on 3D Printing. Appl. Rheol. 2023, 33, 20230114. [Google Scholar] [CrossRef] [Scilit]
- Chen, Y.; Lin, H.; Li, S.; Cao, R.; Yong, W.; Wang, Y.; Zhao, Y. Shear Expression Derivation and Parameter Evaluation of Hoek–Brown Criterion. Arch. Civ. Mech. Eng. 2022, 22, 77. [Google Scholar] [CrossRef] [Scilit]
- Abderrahmane, T.; Abdelmadjid, B. Analyzing of Slope Stability by Difference Model of Behavior. Asian Eng. Rev. 2016, 3, 1–9. [Google Scholar] [CrossRef] [Scilit]
- Song, Y.; Feng, M.; Chen, P. Modified Minimum Principal Stress Estimation Formula Based on Hoek–Brown Criterion and Equivalent Mohr–Coulomb Strength Parameters. Sci. Rep. 2023, 13, 6409. [Google Scholar] [CrossRef] [Scilit]
- Fu, J.; Liu, S.; Li, L.; Wang, J. A modelling resin material and its application in rock-failure study: Samples with two 3D internal fracture surfaces. Open Geosci. 2020, 12, 1237–1246. [Google Scholar] [CrossRef] [Scilit]
- Hou, G.; Zhou, Y.; Zhao, T.; Tan, J.; Zhao, Q.; Huang, J. Excavation unloading response of cylindrical rock-like specimen with axial joints: Laboratory experiment and numerical simulation. J. Geophys. Eng. 2023, 20, 21–37. [Google Scholar] [CrossRef] [Scilit]
- Cui, Z.; Sheng, Q.; Zhang, M.C.; Cao, J.-F.; Mei, X.-C.; Luo, Q.-Z. A New Direct Shear Apparatus for Rock Joints Specialized in Cyclic Loading. Rock Mech. Rock Eng. 2021, 54, 4321–4327. [Google Scholar] [CrossRef] [Scilit]
- Zhang, M.C. Study on the Mechanical Response of the Surrounding Rock-Lining System of Cross-Fault Tunnel Under the Action of Staggered Fault-Strong Earthquake; University of Chinese Academy of Sciences: Beijing, China, 2022. (In Chinese) [Google Scholar]
- Bahat, D.V. Tensile Fracturing in Rocks: Tectonofractographic and Electromagnetic Radiation Methods; Springer: Berlin/Heidelberg, Germany, 2010. [Google Scholar]
- Wu, S.C. Rock Mechanics; Higher Education Press: Beijing, China, 2021; pp. 102–103. (In Chinese) [Google Scholar]

Disclaimer/Publisher’s Note: The statements, opinions and data contained in all publications are solely those of the individual author(s) and contributor(s) and not of MDPI and/or the editor(s). MDPI and/or the editor(s) disclaim responsibility for any injury to people or property resulting from any ideas, methods, instructions or products referred to in the content. |
© 2026 by the authors. Licensee MDPI, Basel, Switzerland. This article is an open access article distributed under the terms and conditions of the Creative Commons Attribution (CC BY) license.