


Abstract
Indoor WiFi fingerprint localization often suffers from abnormal fluctuations in received signal strength indicator (RSSI) measurements and from the sensitivity of least-squares support vector machine (LSSVM) hyperparameters to local optima. To address these issues, this paper presents an improved end-to-end localization method that integrates fingerprint reconstruction with adaptive model optimization. First, a knowledge-enhanced anomaly detection and spatial fingerprint repair (KADSFR) model is used to enhance fingerprint database consistency by combining robust Mahalanobis distance, median absolute deviation, and local outlier factor for anomaly detection, followed by weighted k-nearest neighbors interpolation based on composite signal–physical distances. Then, an adaptive particle swarm optimization (APSO) scheme with stagnation detection and spatial exclusion mechanisms is employed to tune the LSSVM regularization coefficient and RBF kernel width under five-fold cross-validation. Experiments show that KADSFR improves fingerprint quality by approximately 10 percent, and the proposed method achieves an average error of 0.74 m, outperforming KNN, WKNN, LSSVM, and APSO-LSSVM by 63.5 percent, 62.8 percent, 34.5 percent, and 16.9 percent, respectively. Sensitivity analysis further confirms strong robustness and stability.
1. Introduction
Indoor positioning has gained increasing importance in applications such as smart buildings, warehousing and logistics, and emergency response, which has driven substantial research interest in recent years [1]. Among available technologies, Wi-Fi fingerprinting stands out as an attractive solution because it leverages existing wireless infrastructure and involves low deployment cost [2]. A typical fingerprint-based system comprises two phases: offline fingerprint database construction and online location estimation. The overall performance is primarily determined by two key aspects: the quality of the fingerprint data and the effectiveness of the localization model [3].
At the data level, the received signal strength indicator (RSSI) is highly susceptible to multipath propagation, temporal environmental fluctuations, and device heterogeneity. These factors introduce noise and outliers that significantly degrade the reliability of raw fingerprint data [4]. To mitigate these issues, prior studies have explored anomaly detection and sample filtering methods, including Local Outlier Factor (LOF)-based detection [5] and techniques exploiting spatial and signal-domain correlations to exclude inconsistent samples [6]. More recently, Chen et al. [7] emphasized the benefits of tightly coupling data cleansing with model training. However, most existing methods focus on identifying and discarding anomalous samples rather than repairing them. Direct removal of outliers can cause irreversible information loss and reduced spatial coverage in the fingerprint database. Therefore, there remains a critical need to develop intelligent preprocessing frameworks that can both detect and reconstruct corrupted or missing fingerprint measurements to establish a consistent and comprehensive repository.
In parallel, research on database augmentation and synthetic fingerprint generation has emerged as a complementary direction to address sparse or unevenly distributed reference points. For example, Tang et al. [8] investigated multi-output Gaussian Process (MOGP)-based RSSI augmentation to synthesize additional fingerprint samples and thereby improve spatial coverage without further site surveys; their experiments demonstrate notable improvements in localization performance after augmentation. Similarly, Li et al. [9] proposed AF-DCGAN, a deep convolutional GAN that converts collected Channel State Information (CSI) into amplitude-feature maps and generates synthetic fingerprints, which reduces measurement effort while preserving or improving localization accuracy. These augmentation and synthesis approaches show that database enrichment is a promising avenue for building robust large-scale fingerprinting systems. Nevertheless, most augmentation schemes remain decoupled from anomaly detection and repair: they expand the database but do not explicitly rectify corrupted measurements prior to augmentation. Thus, methods that unify anomaly detection, data repair, and model optimization in an end-to-end framework are still scarce, which motivates the present work.
At the model level, a variety of machine learning methods serve as localization engines. Classical nonparametric techniques—most notably k-nearest neighbors (KNN) and its weighted variant (WKNN)—remain widely used baseline approaches owing to their simplicity, ease of implementation, and low computational cost. Recent studies continue to refine these algorithms: QA-kNN applies quartile-based preprocessing to improve robustness against RSSI variability, while improved WKNN variants combine spatial and signal-domain distance metrics to select and weight reference points more reliably [10,11]. Nonetheless, KNN/WKNN methods are fundamentally sensitive to noise, outliers, and uneven reference-point coverage, and they lack model-level regularization, which limits their robustness in challenging environments. Therefore, while KNN/WKNN are included as baseline comparisons in our experiments, more robust, regularized modeling approaches are desirable.
Least-Squares Support Vector Machines (LSSVM) have been widely adopted in indoor localization due to their strong generalization capability under limited-sample conditions [12] and their computational efficiency resulting from the use of equality-constrained formulations [13]. However, the performance of LSSVM is highly sensitive to the selection of hyperparameters, particularly the regularization coefficient and the kernel parameters [14]. Inappropriate choices may lead to overfitting or underfitting, thereby degrading localization accuracy. To address this hyperparameter optimization challenge, metaheuristic global optimization algorithms, such as Particle Swarm Optimization (PSO), have been extensively employed in recent studies. For example, Bi et al. [15] demonstrated PSO’s effectiveness in tuning Support Vector Regression parameters. Nevertheless, standard PSO often suffers from premature convergence and may become trapped in local optima [16]. Adaptive PSO (APSO) variants mitigate this issue by dynamically adjusting control parameters such as inertia weight to balance exploration and exploitation [17]. Further refinements aim to maintain population diversity; representative efforts incorporate multi-swarm strategies with stagnation detection and spatial repulsion and adaptive PSO with state-learning mechanisms to improve global search performance [18,19].
Beyond standard adaptive mechanisms, a significant research direction has focused on hybridizing PSO with operators from other evolutionary algorithms, particularly Genetic Algorithms (GA). These Hybrid PSO (HPSO) approaches, which incorporate crossover and mutation operators, aim to enhance population diversity, overcome premature convergence, and improve convergence behavior [20]. For example, the Hybrid Multi-Swarm PSO (HMSPSO) combines parallel multi-swarm search with real-coded genetic operators and has demonstrated strong performance in complex optimization scenarios [21]. Comprehensive reviews further indicate that PSO variants equipped with crossover mechanisms often achieve superior empirical performance compared with standard PSO [22].
While these hybrid strategies are effective, they typically introduce additional algorithmic components and parameter dependencies. In contrast, to directly address particle stagnation and local optimum entrapment in LSSVM hyperparameter tuning—without departing from the core PSO framework—this paper proposes a novel adaptive PSO variant that integrates stagnation detection and spatial exclusion mechanisms (SDM-SES-APSO). By enhancing diversity preservation and search adaptability at the swarm level, the proposed strategy retains the structural simplicity of PSO while improving global optimization robustness for indoor localization tasks.
A prominent direction in recent indoor positioning research is the development of integrated frameworks that jointly optimize preprocessing and modeling. For example, Cheng et al. [23] combined stacked autoencoders with a dual-population PSO to construct an end-to-end localization pipeline, demonstrating the benefits of such integration. However, a critical limitation still exists: the fingerprint anomaly repair stage is often treated as an independent, standalone module. This separation reduces the emphasis on repair relative to model optimization and prevents tight end-to-end coupling necessary for deep synergistic interactions between data repair and the downstream positioning model. In light of these limitations, this paper proposes an end-to-end indoor Wi-Fi fingerprint localization framework that unifies robust anomaly detection, intelligent fingerprint repair, and hyperparameter-optimized LSSVM modeling to improve both positioning accuracy and stability in noisy and incomplete fingerprint environments.
To address this issue in a more coherent and unified manner, this paper introduces an end-to-end indoor Wi-Fi fingerprint positioning framework that integrates enhanced data repair with optimized model learning. The main contributions are as follows:
- A Knowledge-Augmented Anomaly Detection and Spatial Fingerprint Repair (KADSFR) method is proposed. It combines multiple complementary detectors, including Robust Mahalanobis Distance, Median Absolute Deviation, and Local Outlier Factor, to achieve consensus-based anomaly identification. Compared with existing fingerprint preprocessing methods, the proposed KADSFR approach not only identifies anomalous fingerprints but also repairs them via a weighted k-nearest neighbors interpolation scheme based on a signal–physical composite distance, thereby improving the quality and spatial consistency of the fingerprint database.
- The proposed SDM-SES-APSO is employed to enhance LSSVM hyperparameter tuning. With the integration of a stagnation detection mechanism (SDM) and a spatial exclusion strategy (SES), this APSO scheme differs from conventional APSO-based optimization approaches by improving robustness and significantly reducing the likelihood of premature convergence in complex, non-convex optimization landscapes.
- A unified positioning framework is established by integrating the proposed data repair module with the APSO-optimized LSSVM localization model. Comprehensive experiments demonstrate that the resulting system achieves superior positioning accuracy and enhanced robustness and stability compared with multiple benchmark algorithms.
2. Proposed Method
2.1. KADSFR
The raw RSSI fingerprints collected in indoor environments are often affected by noise, multipath fading, and device heterogeneity, which may cause abnormal fluctuations and spatial inconsistency in the fingerprint database. Direct utilization of such corrupted data can significantly degrade the performance of indoor localization models. To address this issue, this study proposes the KADSFR preprocessing algorithm, which aims to identify and repair abnormal fingerprints rather than simply discarding them. The design of KADSFR is grounded in principles of robust statistics and local density analysis, enabling reliable anomaly detection while preserving the spatial continuity and integrity of fingerprint data.
To achieve this goal of robust fingerprint enhancement, the KADSFR algorithm is built upon the core principles of robust detection, spatially aware weighted KNN interpolation, and iterative convergence. Its objective is to transform the original fingerprint matrix (where N denotes the number of samples and D the number of access points) into a highly consistent and readily modelable matrix . The overall workflow comprises three primary stages: data preprocessing, anomaly detection and repair, and iterative optimization.
In the data preprocessing stage, the algorithm first applies short-window median imputation to handle missing values, thereby maintaining data continuity. This is followed by a robust normalization of the imputed data, defined as:
where denotes the median absolute deviation of column j. This normalization strategy effectively mitigates the influence of outliers, establishing a reliable metric space for subsequent analysis.
During the anomaly detection phase, a triple-mechanism parallel detection framework is utilized. This framework concurrently computes three distinct anomaly scores: (1) a robust Mahalanobis distance based on the Minimum Covariance Determinant (MCD), (2) a detection threshold based on the Median Absolute Deviation (MAD), and (3) the LOF which captures local density deviations. The outcomes from these detectors are then integrated via a majority voting scheme. Samples flagged as anomalous by at least two of the three methods are assigned to the final anomaly set A.
In the subsequent repair phase, samples within the anomaly set A are reconstructed using a spatially aware KNN interpolation strategy. This approach fuses information from both the signal space and the physical space when identifying the nearest neighbors, calculated through a composite distance metric:
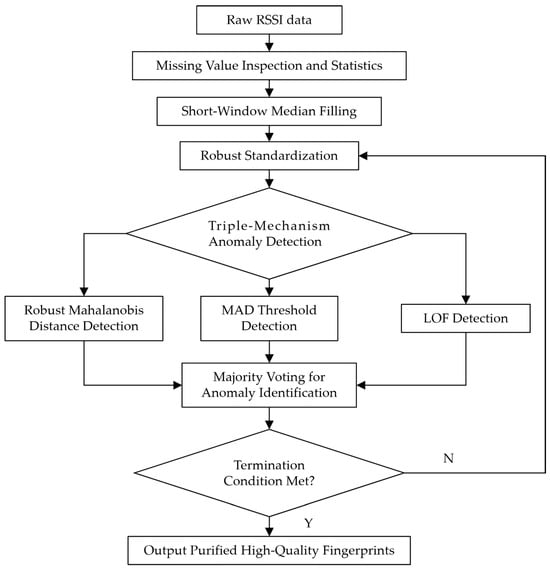
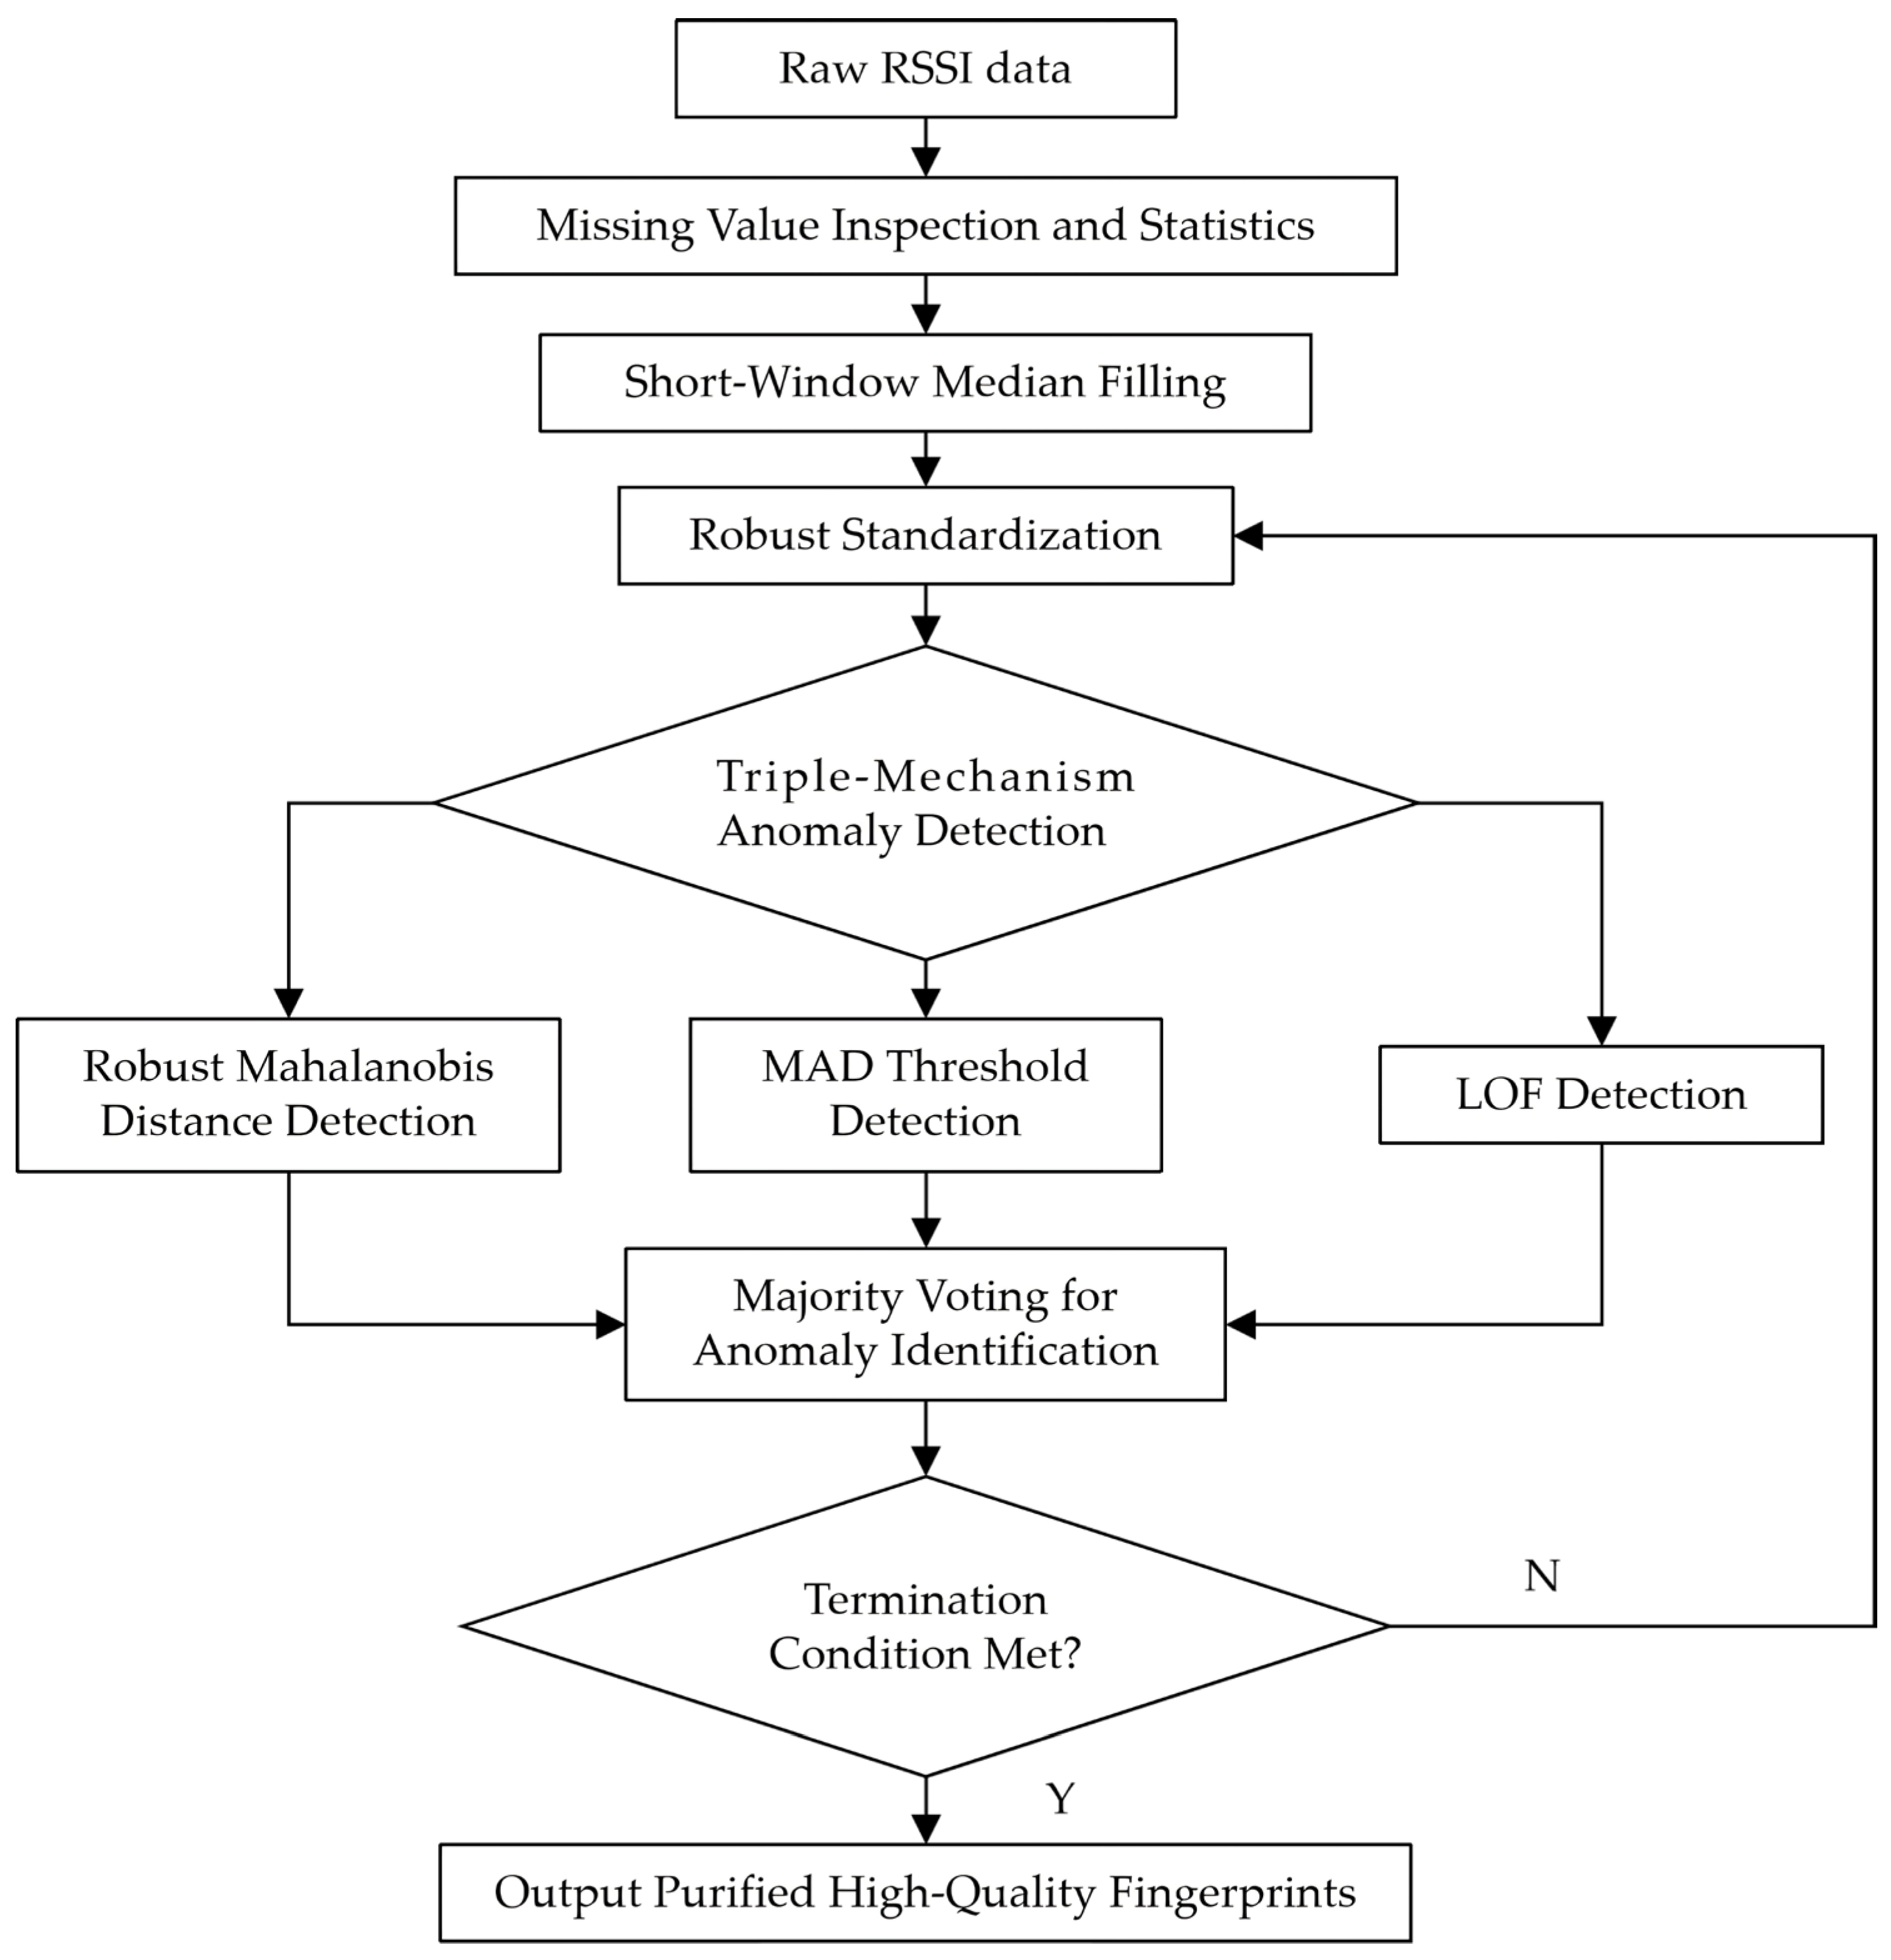
Here, λ ∈ [0, 1] is a fusion weight balancing the two modalities, and denote the Euclidean distances in the signal and physical spaces, respectively, while and are their corresponding distance scales. The repaired value for an anomalous sample is derived from a weighted average of its K nearest neighbors. The weights are computed using a Gaussian kernel function: . The entire detection and repair process is executed iteratively until the number of identified anomalies converges or a predefined maximum iteration count is reached, ensuring robust and optimal processing results. The complete workflow of the KADSFR algorithm is illustrated in Figure 1.
Figure 1.
Flowchart of the KADSFR Algorithm.
Regarding parameter configuration, the MAD threshold is set to 3, which is a commonly adopted value in robust statistical outlier detection. The neighborhood sizes for KNN interpolation and LOF are empirically set to 10 and 20, respectively, to balance local sensitivity and noise robustness in high-dimensional RSSI space. The fusion weight λ is set to 0.7 to emphasize signal similarity while preserving spatial continuity. In addition, the maximum number of repair iterations is limited to 3, as further iterations were observed to yield marginal improvements. The robustness of the proposed preprocessing strategy under these parameter settings is further examined through the ablation analysis presented in Section 3.3.
2.2. SDM-SES-APSO
2.2.1. APSO
PSO is a swarm intelligence algorithm inspired by social behaviors such as bird flocking. In PSO, each particle i symbolizes a potential solution within the search space, characterized by its position and velocity . The particles navigate the search space by updating their velocity and position according to the following equations:
where is the inertia weight, and are the cognitive and social learning factors, respectively, and are random numbers uniformly distributed in (0, 1), and and represent the particle’s personal best position and the swarm’s global best position, respectively.
The standard PSO algorithm is often prone to premature convergence and may become trapped in local optima when tackling complex optimization problems [24]. To alleviate these issues, the APSO dynamically adjusts its key parameters during the iterative process to achieve a better balance between global exploration and local exploitation [25]. The specific APSO strategies employed in this work are detailed below.
(1) Linear Decay of Inertia Weight: A linearly decreasing inertia weight encourages the swarm to prioritize broad exploration in the initial phases and shift towards refined exploitation in the later stages. The inertia weight is updated as:
where denotes the adaptive inertia weight at iteration , and are the maximum and minimum bounds for the inertia weight, and is the maximum number of iterations. In this formulation, and are predefined constants, while the functional dependency on is explicitly captured by on the left-hand side. This approach facilitates a smooth transition from global search to local fine-tuning, thereby enhancing convergence performance.
(2) Dynamic Adjustment of Learning Factors: To better balance the influence of a particle’s individual experience (cognitive) and the swarm’s collective knowledge (social), the cognitive factor and social factor are linearly adjusted as follows:
where and are the initial values for and , while and are their corresponding final values. Consequently, decreases from to , whereas increases from to over iterations. This dynamic reduces the reliance on a particle’s own memory while progressively strengthening the attraction toward the global best position, thereby guiding the swarm from a diverse search toward convergence in the promising regions [26].
While APSO mitigates premature convergence to a certain extent through parameter adaptation, its capacity to maintain population diversity often remains inadequate in highly complex and noisy optimization landscapes. In the context of indoor fingerprint localization, the inherent multipath effects and environmental dynamics give rise to a highly non-convex error surface with numerous local optima [27]. This inherent challenge necessitates the integration of more sophisticated mechanisms to further bolster the algorithm’s robustness and search efficiency, therefore motivating the enhancements proposed in the subsequent section.
2.2.2. SDM and SES
To address the premature convergence and population degeneracy observed in conventional APSO algorithms, this study incorporates the SDM and the SES into the APSO framework, forming the SDM-SES-APSO algorithm. SDM identifies stagnant subpopulations and injects new active particles to restore search activity, while SES prevents excessive particle clustering by enforcing spatial repulsion, thereby enhancing population diversity. The combination of these two mechanisms strengthens global exploration without compromising convergence speed, providing a more robust optimization scheme for LSSVM hyperparameter tuning.
(1) SDM
SDM improves global exploration by dynamically detecting stagnation within subpopulations and introducing vitality particles when necessary. The entire population is first divided into M equally sized subpopulations, each evolving independently until a predefined recombination cycle is triggered.
Let denote the best position of the j-th subpopulation at iteration t, and let be its corresponding fitness. The fitness change between two successive iterations is computed as:
Here, denotes the fitness function. When = 0, the subpopulation fails to obtain a better solution at the current iteration. If this situation persists, the subpopulation is considered stagnant, indicating loss of population diversity.
To monitor stagnation, a counter is introduced, initialized as = 0. Whenever = 0, the counter increments by one. When exceeds a threshold , SDM is activated. The threshold adaptively decreases with the search progress according to:
where = 20, = 10, is the current function evaluation count, and is the maximum allowable function evaluations.
Once stagnation is detected, a vitality particle is generated to replace the particle with the worst fitness in the stagnated subpopulation. The mutation probability is defined by:
where = 0.17 and = 0.12, new particle values are sampled uniformly within the search range of each dimension.
(2) SES
SES maintains population diversity in the early phase of the search process by introducing repulsive perturbations based on the evolutionary state ratio:
At each iteration, a uniformly distributed random number is generated. SES is executed when . For each particle i, the perturbation relative to the global best particle is applied as:
where is the Euclidean distance between particle i and , ηd is a dimension-wise random perturbation coefficient, and = 0.5 is a decay factor. Particles closer to receive stronger repulsion to encourage exploration, while distant particles receive weaker perturbations to maintain local refinement.
Boundary correction is then performed. If the updated coordinate exceeds the search interval [, ], a 10% margin is applied:
2.2.3. APSO Process Integrating SDM and SES
SDM and SES are embedded into the APSO workflow to facilitate both information exchange and diversity preservation. At initialization, the population is randomly divided into M subpopulations. Each subpopulation updates particle velocities and positions, and computes individual and local optimal values.
Stagnation is detected using Equation (8). Upon detection, SDM introduces vitality particles by replacing the worst-performing particle. Meanwhile, the evolutionary state ratio is evaluated, and SES is executed probabilistically based on . SES applies repulsion-based perturbations and boundary correction.
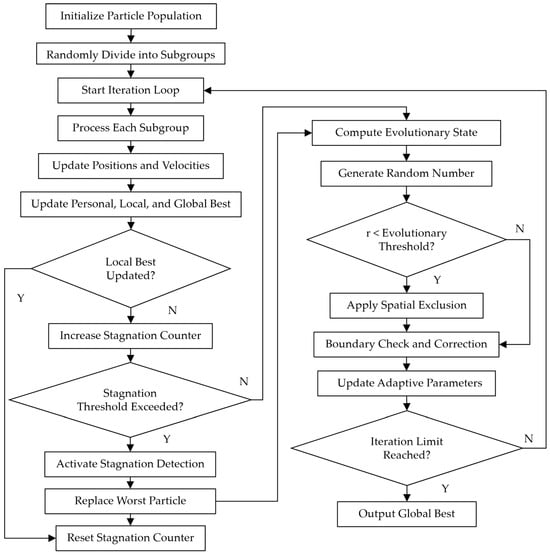
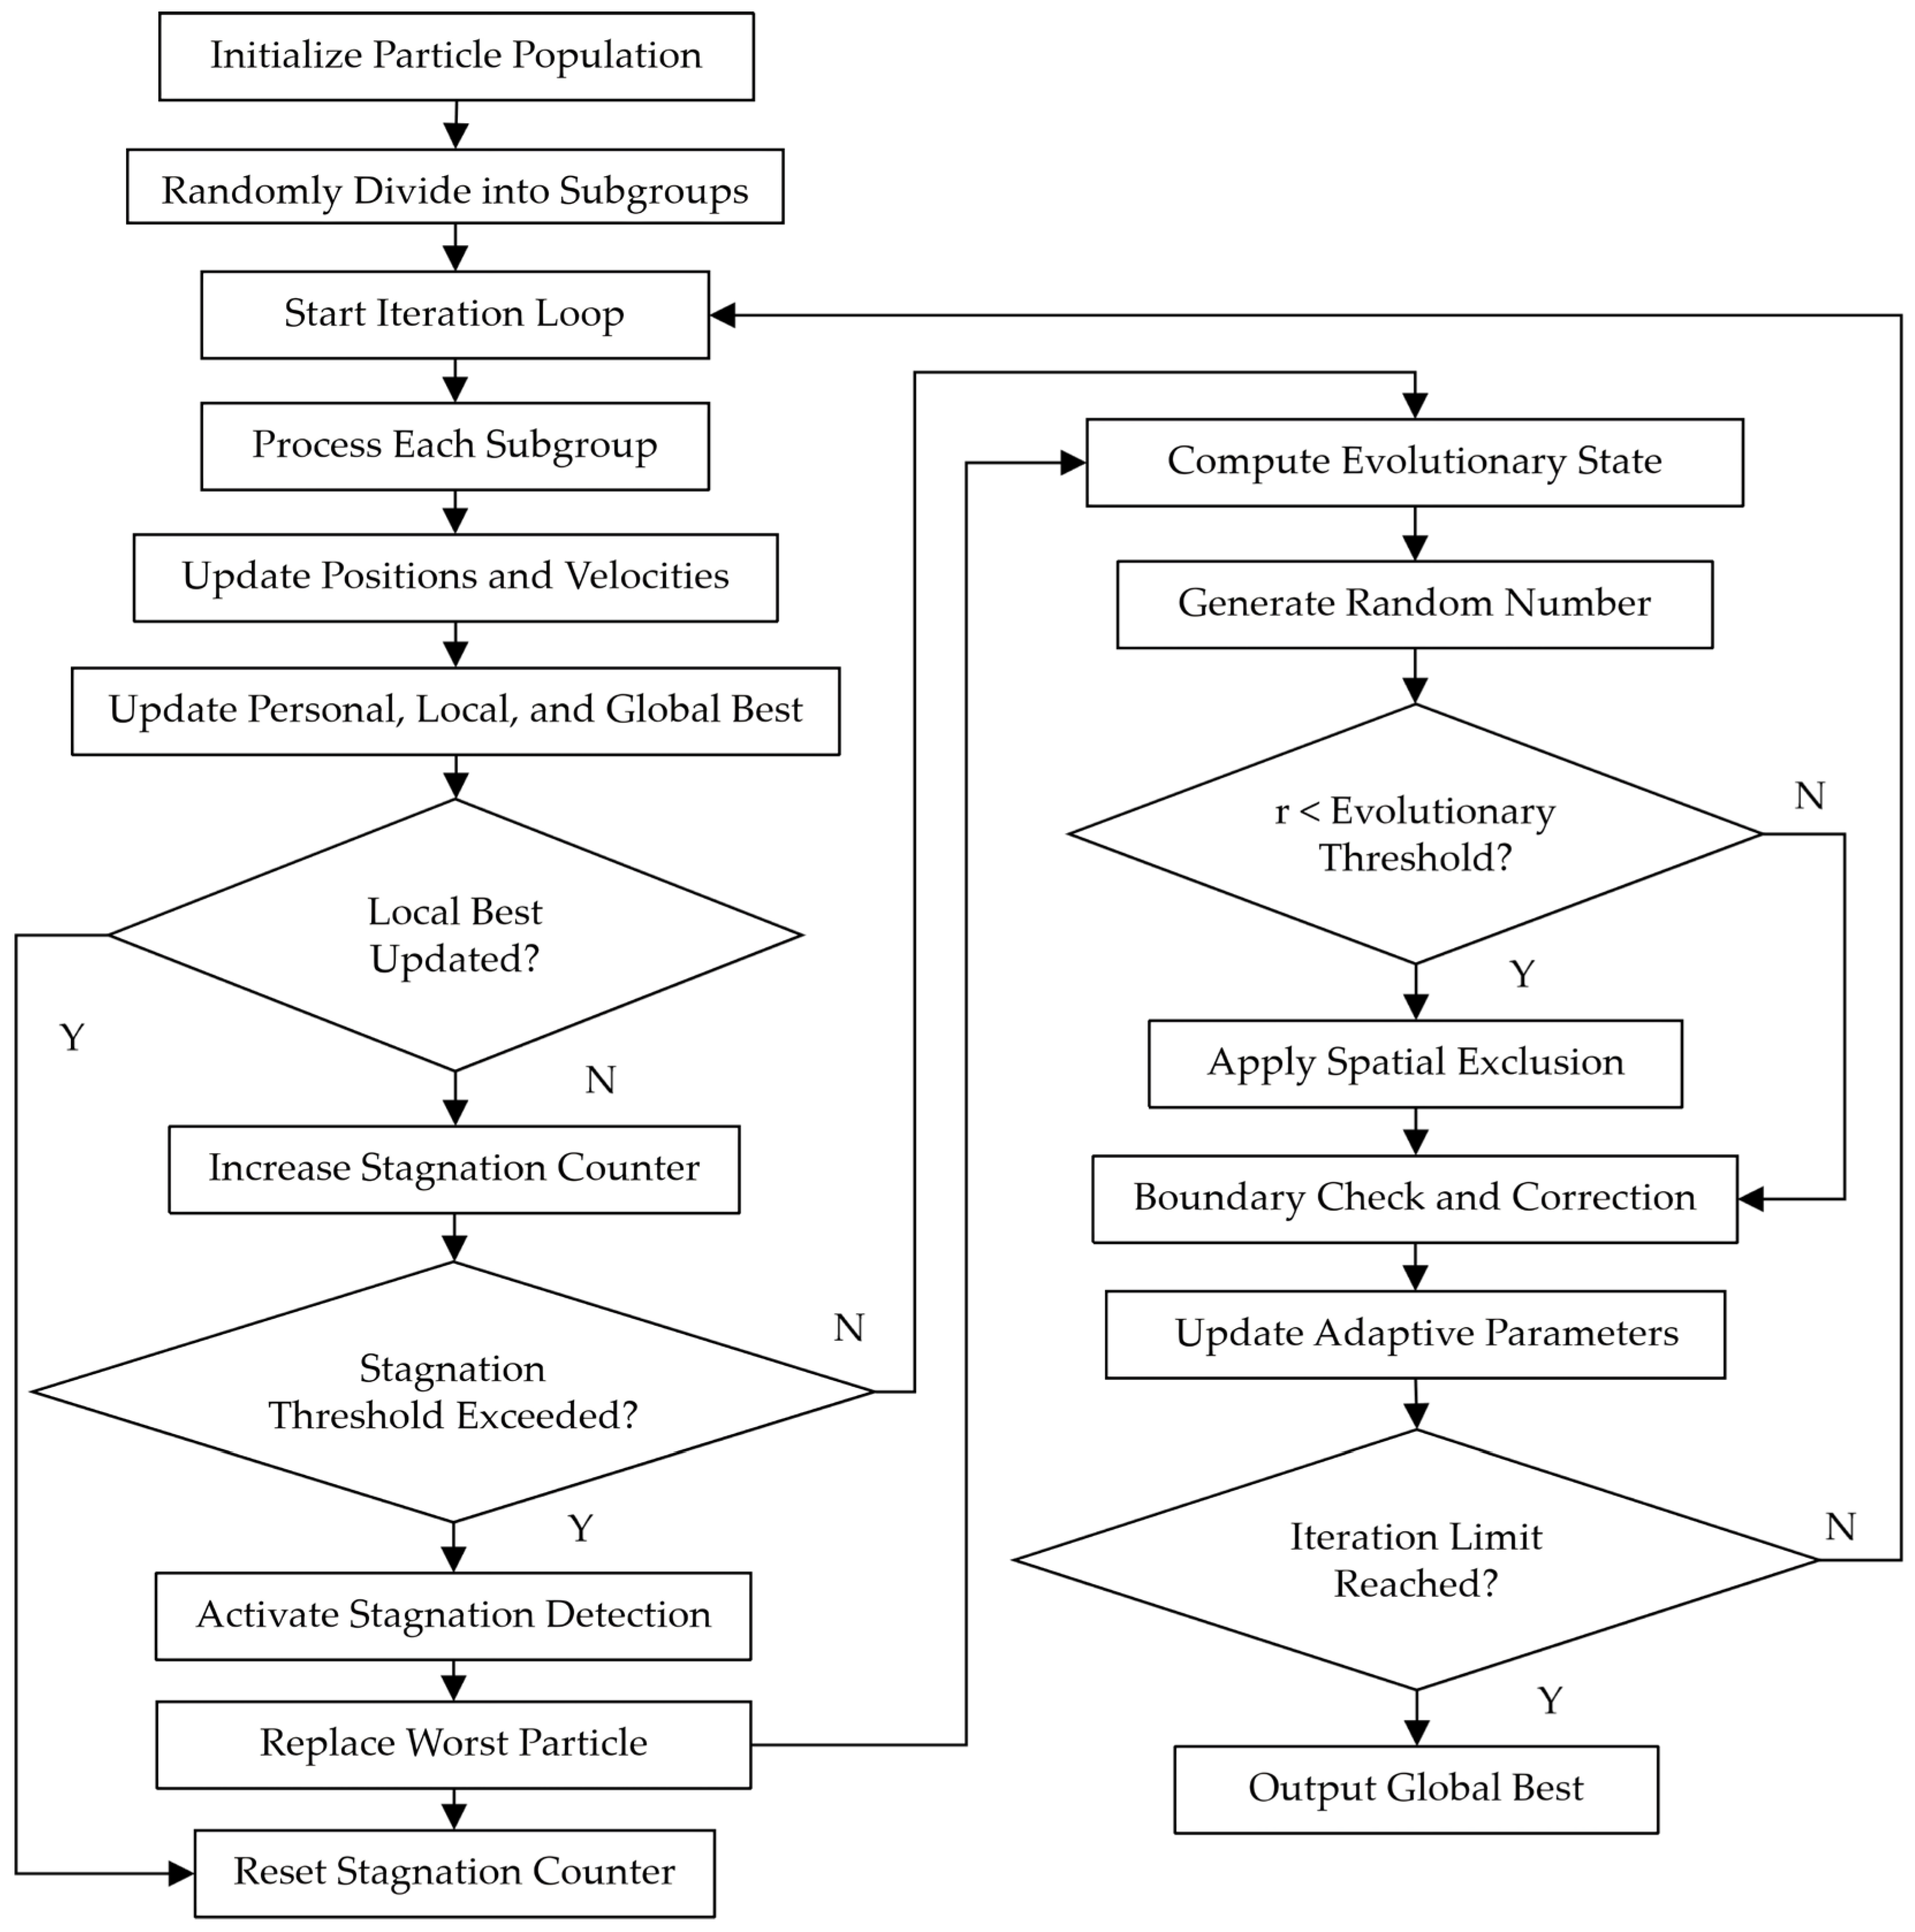
The algorithm continues iterating until reaching the maximum iteration count. This fusion mechanism enables strong global exploration during early iterations through frequent SES activation, while gradually shifting toward intensified local search in later stages. Concurrently, SDM prevents prolonged stagnation by injecting vitality particles, ensuring the search process remains active. The combined effect allows the SDM-SES-APSO algorithm to avoid premature convergence while converging effectively toward the global optimum. The overall workflow is illustrated in Figure 2.
Figure 2.
Flowchart of the SDM-SES-APSO Algorithm.
With respect to parameter settings, the population size and maximum iteration number are set to 20 and 30, respectively, following common practices in particle swarm optimization to balance convergence performance and computational cost. The search ranges of the LSSVM hyperparameters are determined based on prior studies and preliminary experiments to ensure sufficient coverage of the feasible solution space. Moreover, the SDM and SES mechanisms are designed to adapt dynamically during the optimization process, thereby reducing sensitivity to manual parameter tuning. The effectiveness and stability of the adopted optimization strategy under these configurations are further illustrated by the hyperparameter optimization analysis reported in Section 3.4.
2.3. Indoor Fingerprint Localization Algorithm Based on Improved APSO-LSSVM
(1) Localization Model
Indoor Wi-Fi fingerprint localization seeks to learn a nonlinear mapping from the high-dimensional RSSI signal space to the two-dimensional physical coordinate space. Given a training set , where denotes the RSSI vector of D access points and represents the corresponding location label, this study adopts the LSSVM as the regression model.
Unlike classical Support Vector Machines (SVM), LSSVM converts the optimization problem into solving a set of linear equations by introducing least-squares loss and slack variables. This formulation significantly reduces computational complexity while maintaining strong generalization capability, making LSSVM suitable for resource-constrained or real-time positioning scenarios [28,29]. For a new test sample , the predicted location is computed as:
where are the Lagrange multipliers, is the bias term, and is the kernel function. This work employs the radial basis function (RBF) kernel:
where is the kernel bandwidth controlling the feature distribution in the mapped space.
Although LSSVM offers computational advantages, its performance is highly sensitive to outliers and noise. The model’s complexity and generalization ability are primarily governed by two hyperparameters: the regularization coefficient and the kernel width . An improper choice of this parameter pair can lead to overfitting or underfitting, which would substantially degrade the localization accuracy.
To overcome this challenge, the SDM-SES-APSO algorithm is utilized to determine the optimal hyperparameter pair. The optimization objective is defined as the 5-fold cross-validation root mean square error (RMSE):
where K = 5 is the number of folds, denotes the sample set of the k-th validation fold, represents the true coordinate, and is the corresponding prediction. The proposed SDM-SES-APSO algorithm performs global search to minimize (16) and returns the optimal hyperparameters for constructing a high-precision localization model.
(2) Algorithm Flow and Steps
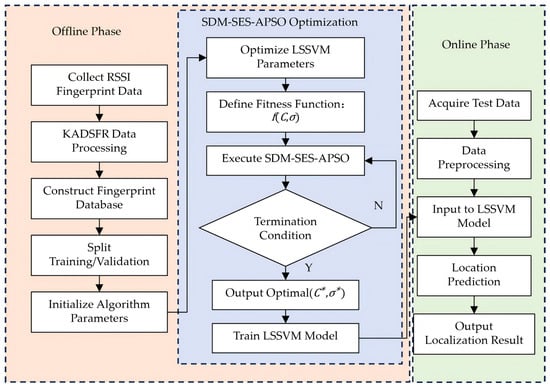
Indoor Wi-Fi fingerprint localization consists of two phases. In the offline phase, raw fingerprint data are collected and processed using the KADSFR method to build the fingerprint database. Then, SDM-SES-APSO is used to optimize the LSSVM hyperparameters . In the online phase, the optimized model is used to estimate locations for test samples.
The complete procedure is summarized as follows:
Step 1: Offline phase
Collect indoor Wi-Fi RSSI measurements. Apply the KADSFR method to obtain a high-quality fingerprint database. Partition the processed data into training and validation sets.
Step 2: Parameter initialization
Set the particle swarm size M, maximum iteration count, initial inertia weight, learning factors, and APSO parameters such as , and . Initialize the LSSVM model.
Step 3: Define the fitness function
Specify the fitness function based on Equation (16).
Step 4: SDM-SES-APSO iterative optimization
Iteratively evaluate particle fitness, update , and , and apply SDM when subpopulation stagnation is detected. When activated, SDM replaces the worst particle in the stagnated subpopulation with a vitality particle. SES is probabilistically triggered based on the evolutionary state ratio to introduce spatial repulsion and maintain diversity. APSO parameters and particle positions/velocities are updated accordingly.
Step 5: Model retraining
After convergence, obtain the optimal hyperparameters and retrain the LSSVM model using these parameters.
Step 6: Online phase
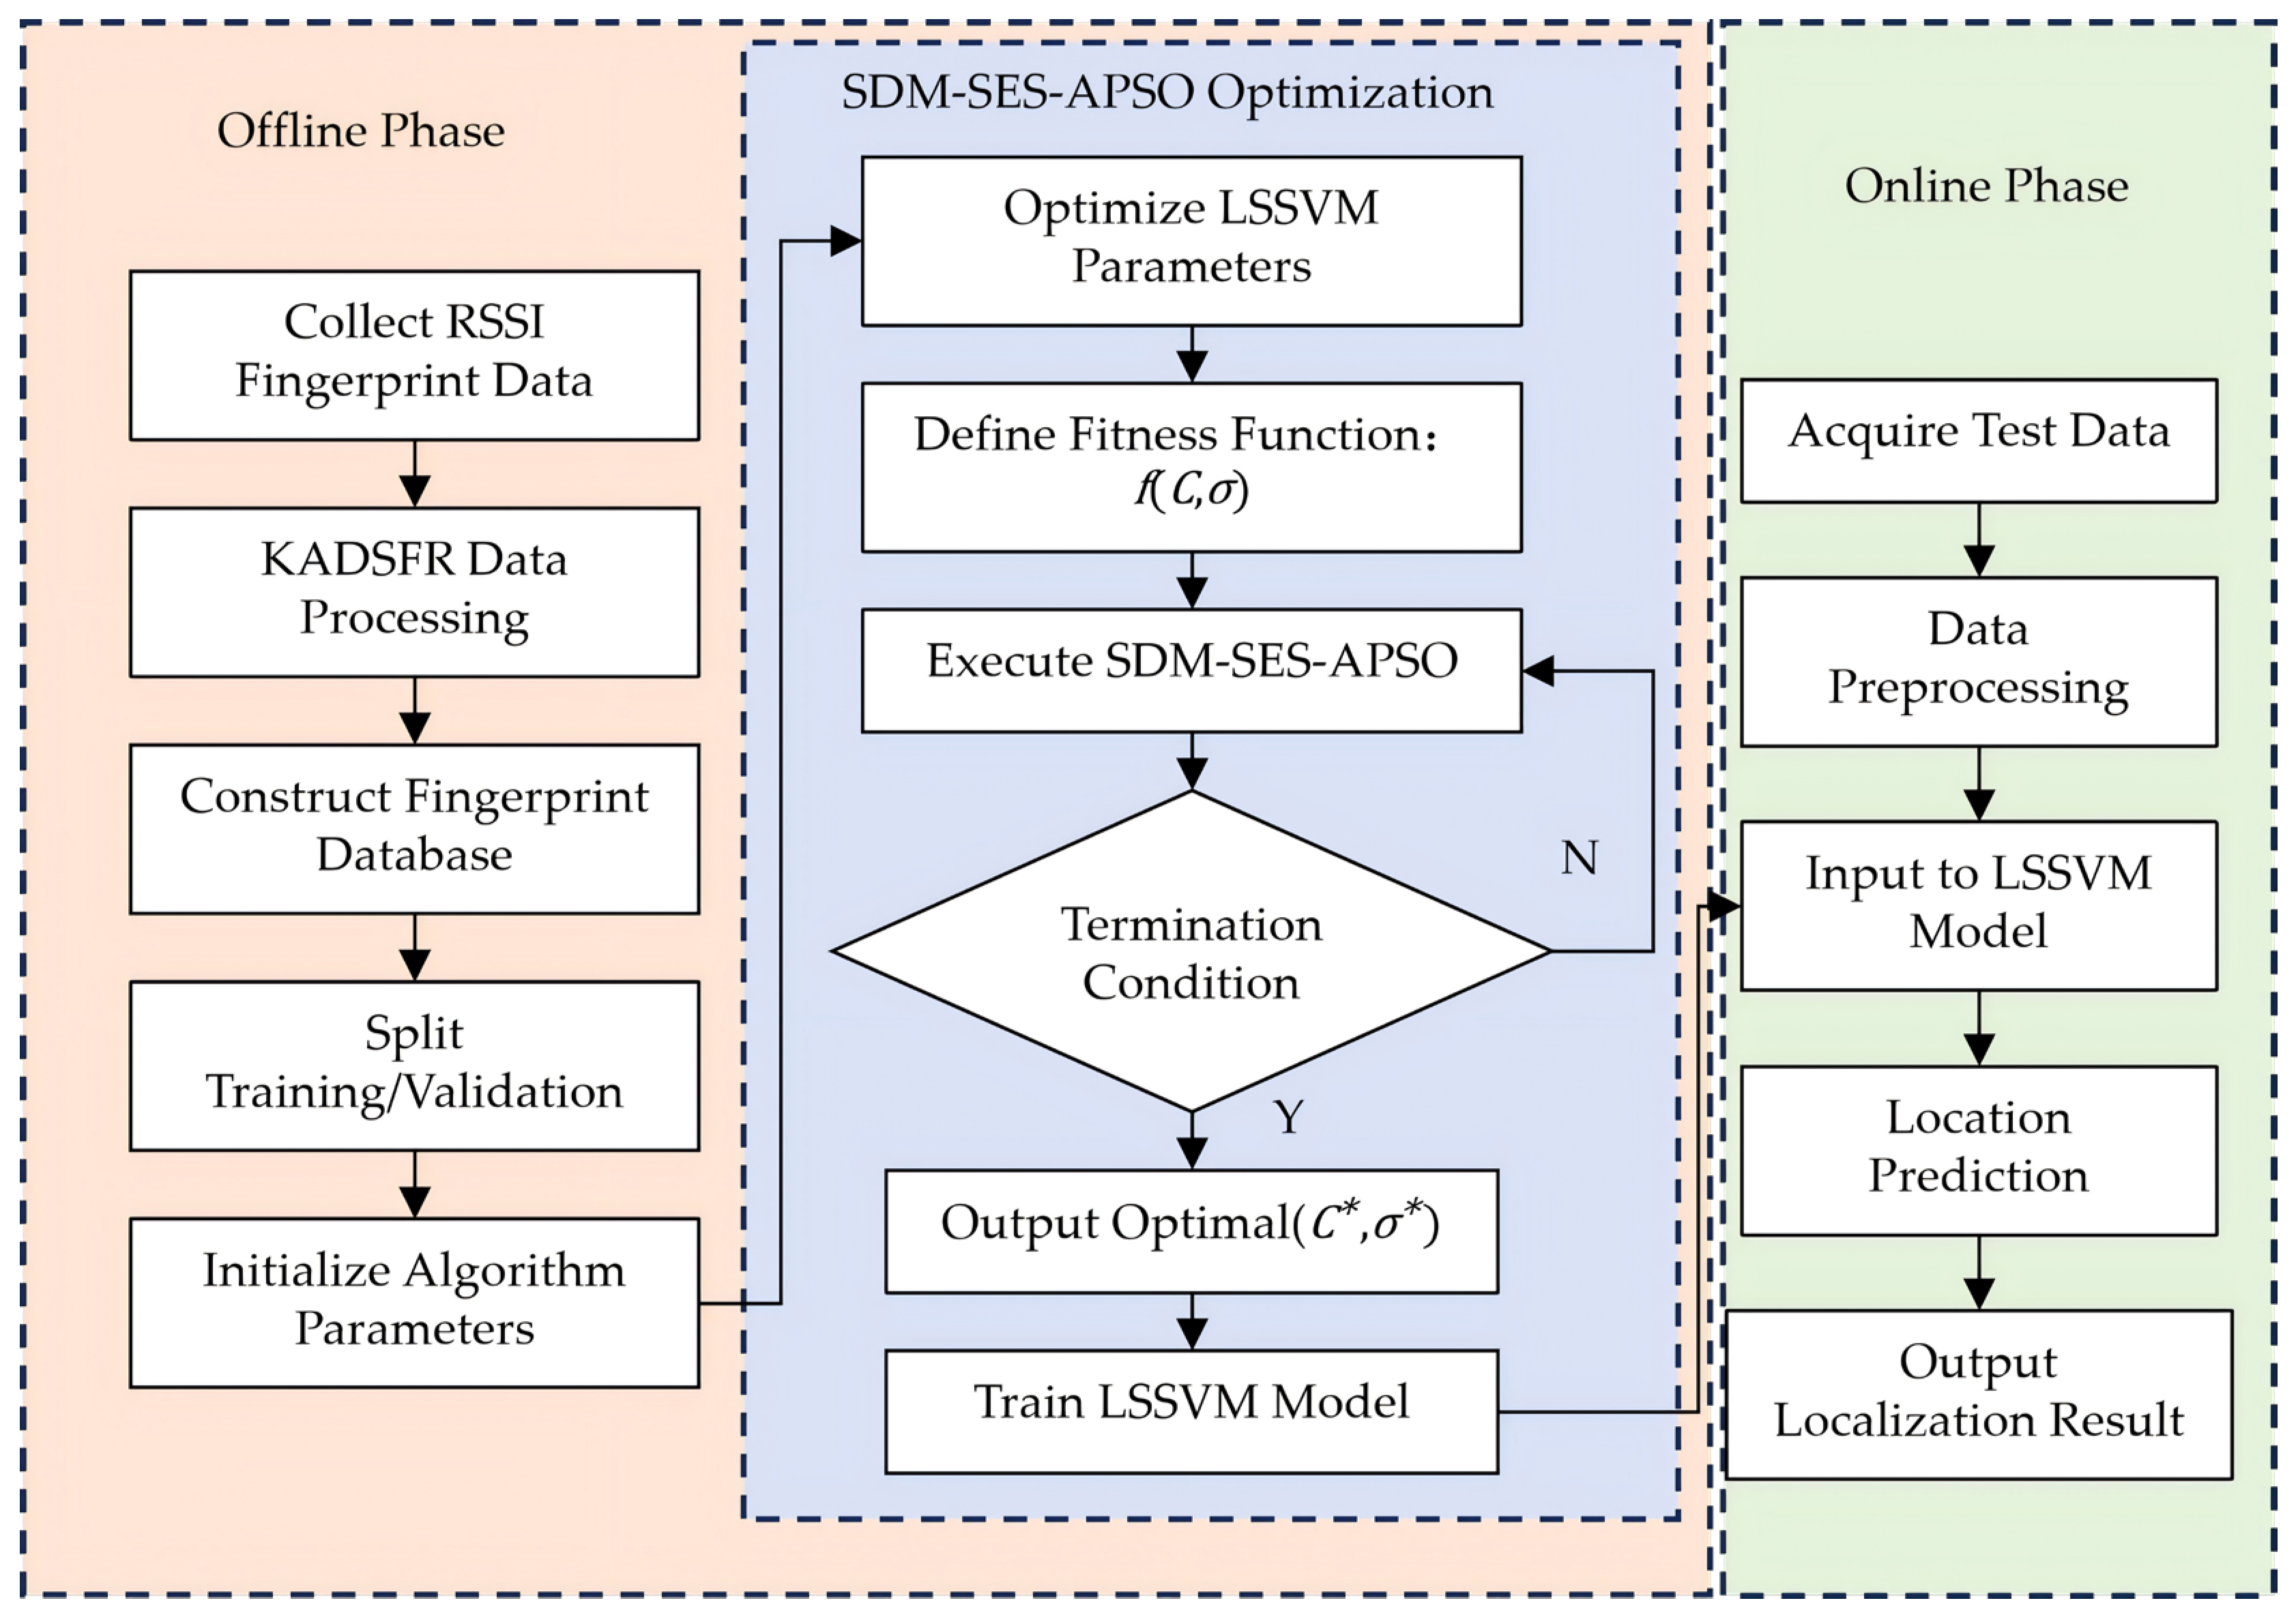
Input the RSSI features of a test point into the trained LSSVM model to obtain the predicted location. The incorporation of SDM and SES ensures robust convergence and improved positioning accuracy. The flowchart of the proposed APSO-LSSVM-based localization framework is shown in Figure 3.
Figure 3.
Flowchart of the proposed APSO-LSSVM-based indoor fingerprint localization algorithm.
3. Experiments and Results Analysis
3.1. Experimental Environment and Dataset Construction
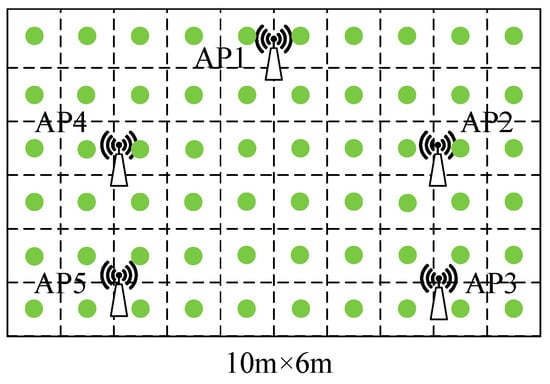
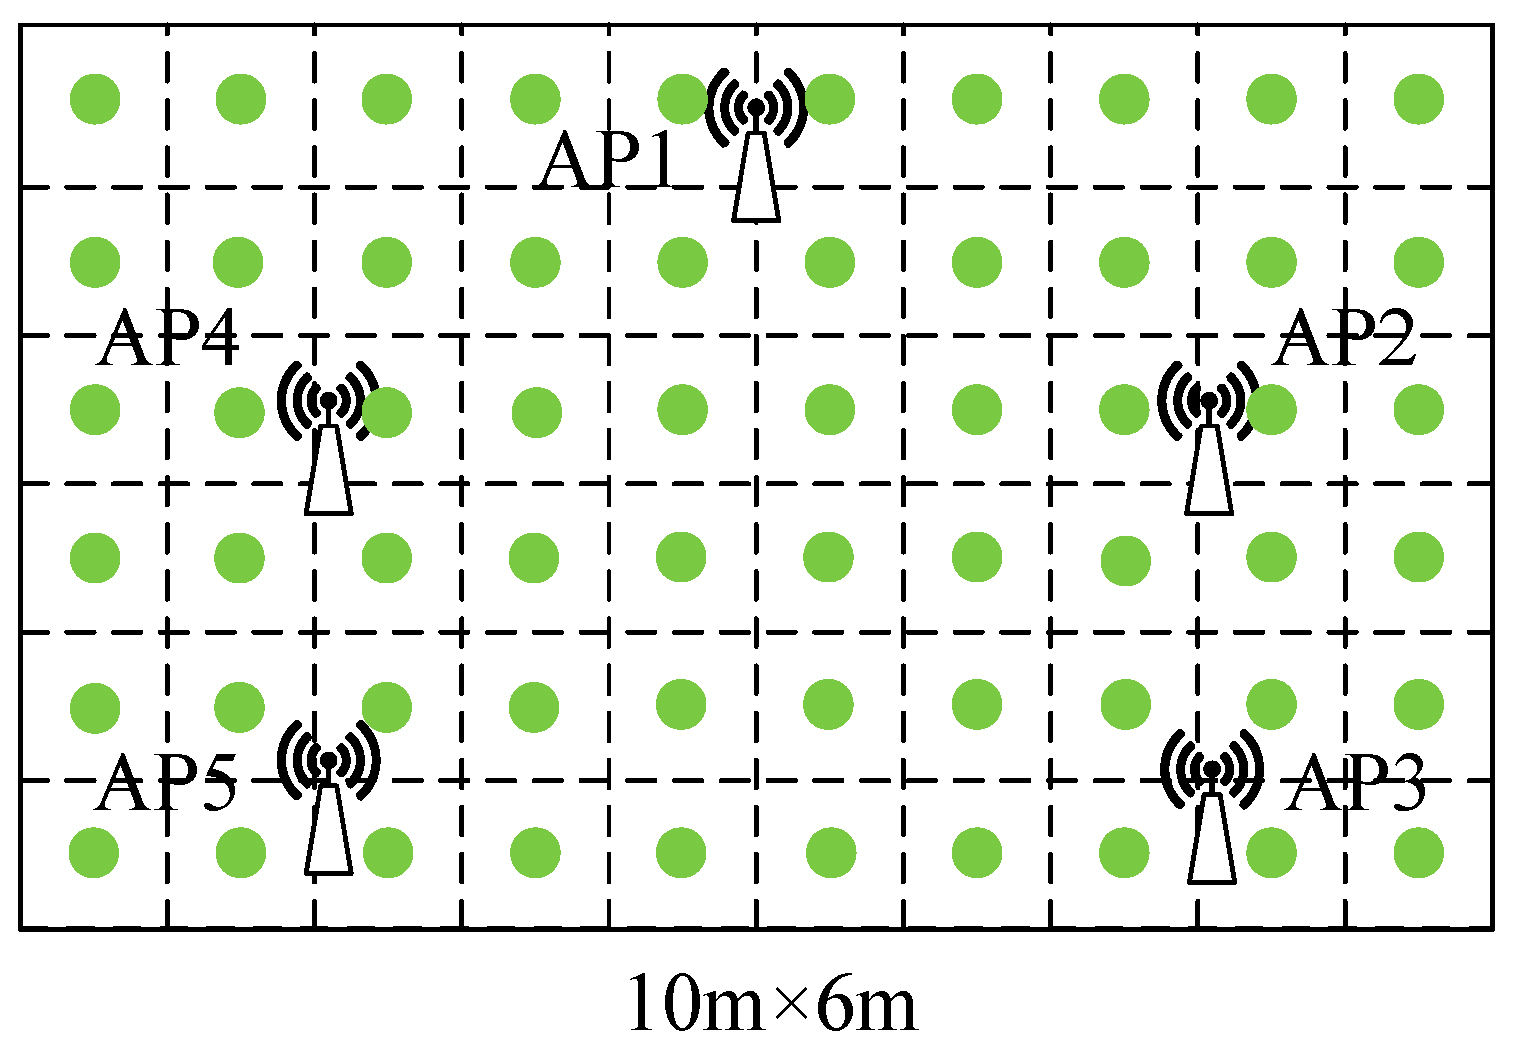
This study established a WiFi fingerprint positioning experimental platform in a rectangular indoor space (approximately 10 m × 6 m) within Room 303 of Building 4 at our university, as illustrated in Figure 4. Five commercial WiFi access points (Xiaomi Router 4C) were deployed at a height of approximately 0.8 m. Each AP was configured with a fixed channel and identical transmission power to minimize signal uncertainty induced by network dynamics. For the offline fingerprint database construction, the experimental area was discretized into a uniform grid with 1-m spacing, resulting in 100 reference points (RPs) at the grid intersections. At each RP, a mobile terminal collected 20 consecutive RSSI samples from all five APs. During data processing, the RSSI readings for each AP at a given location were averaged to enhance fingerprint stability. Consequently, the fingerprint feature vector for each RP is represented as {RSSIi1, RSSIi2, …, RSSIi5}, accompanied by its corresponding coordinate label (xi, yi) [30]. These collectively constitute the offline fingerprint database. In the online phase, real-time RSSI fingerprints collected at unknown locations were input into the trained positioning model for location estimation. All algorithmic experiments were implemented and validated in the MATLAB R2023a environment.
Figure 4.
Experimental deployment layout.
3.2. Fingerprint Data Preprocessing and Quality Assessment
To objectively evaluate fingerprint data quality and quantify the improvement achieved by the KADSFR algorithm, a comprehensive quality score Q is formulated as follows:
Here, denotes the completeness score, calculated as , where is the number of missing RSSI records and is the theoretical total. represents the consistency score, computed by first determining the MAD for each RP and then mapping the global median m of these MAD values to a score via . signifies the distribution characteristic score, derived from assessing the kurtosis and skewness of the aggregated RSSI values against typical distribution benchmarks. indicates the signal quality score, which correlates with the proportion of detected outliers and the average signal-to-noise ratio.
The comprehensive quality score Q is evaluated after the fingerprint reconstruction stage and serves as an offline assessment metric for the reconstructed fingerprint database. It is not updated iteratively over time, but instead reflects the overall improvement in data reliability achieved by KADSFR. The value of Q is influenced by multiple factors, including the reduction in missing RSSI values, enhanced signal consistency, improved distribution regularity, and effective suppression of anomalous measurements.
This scoring framework, inspired by multidimensional evaluation concepts in data quality management [31], provides a holistic assessment across four critical dimensions: completeness, consistency, distribution characteristics, and signal quality. The weight assigned to each dimension (, , , ) reflects its relative importance for positioning performance. The final composite score Q ranges from 0 to 100, with higher values denoting superior data quality.
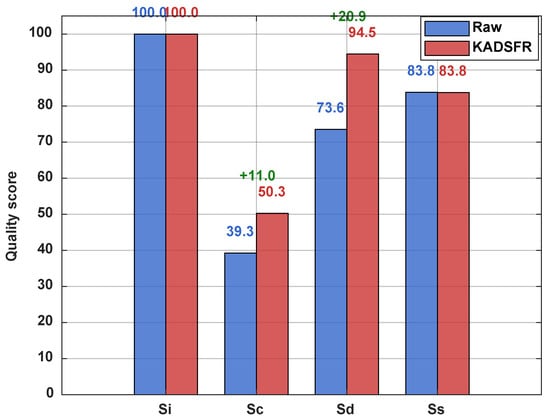
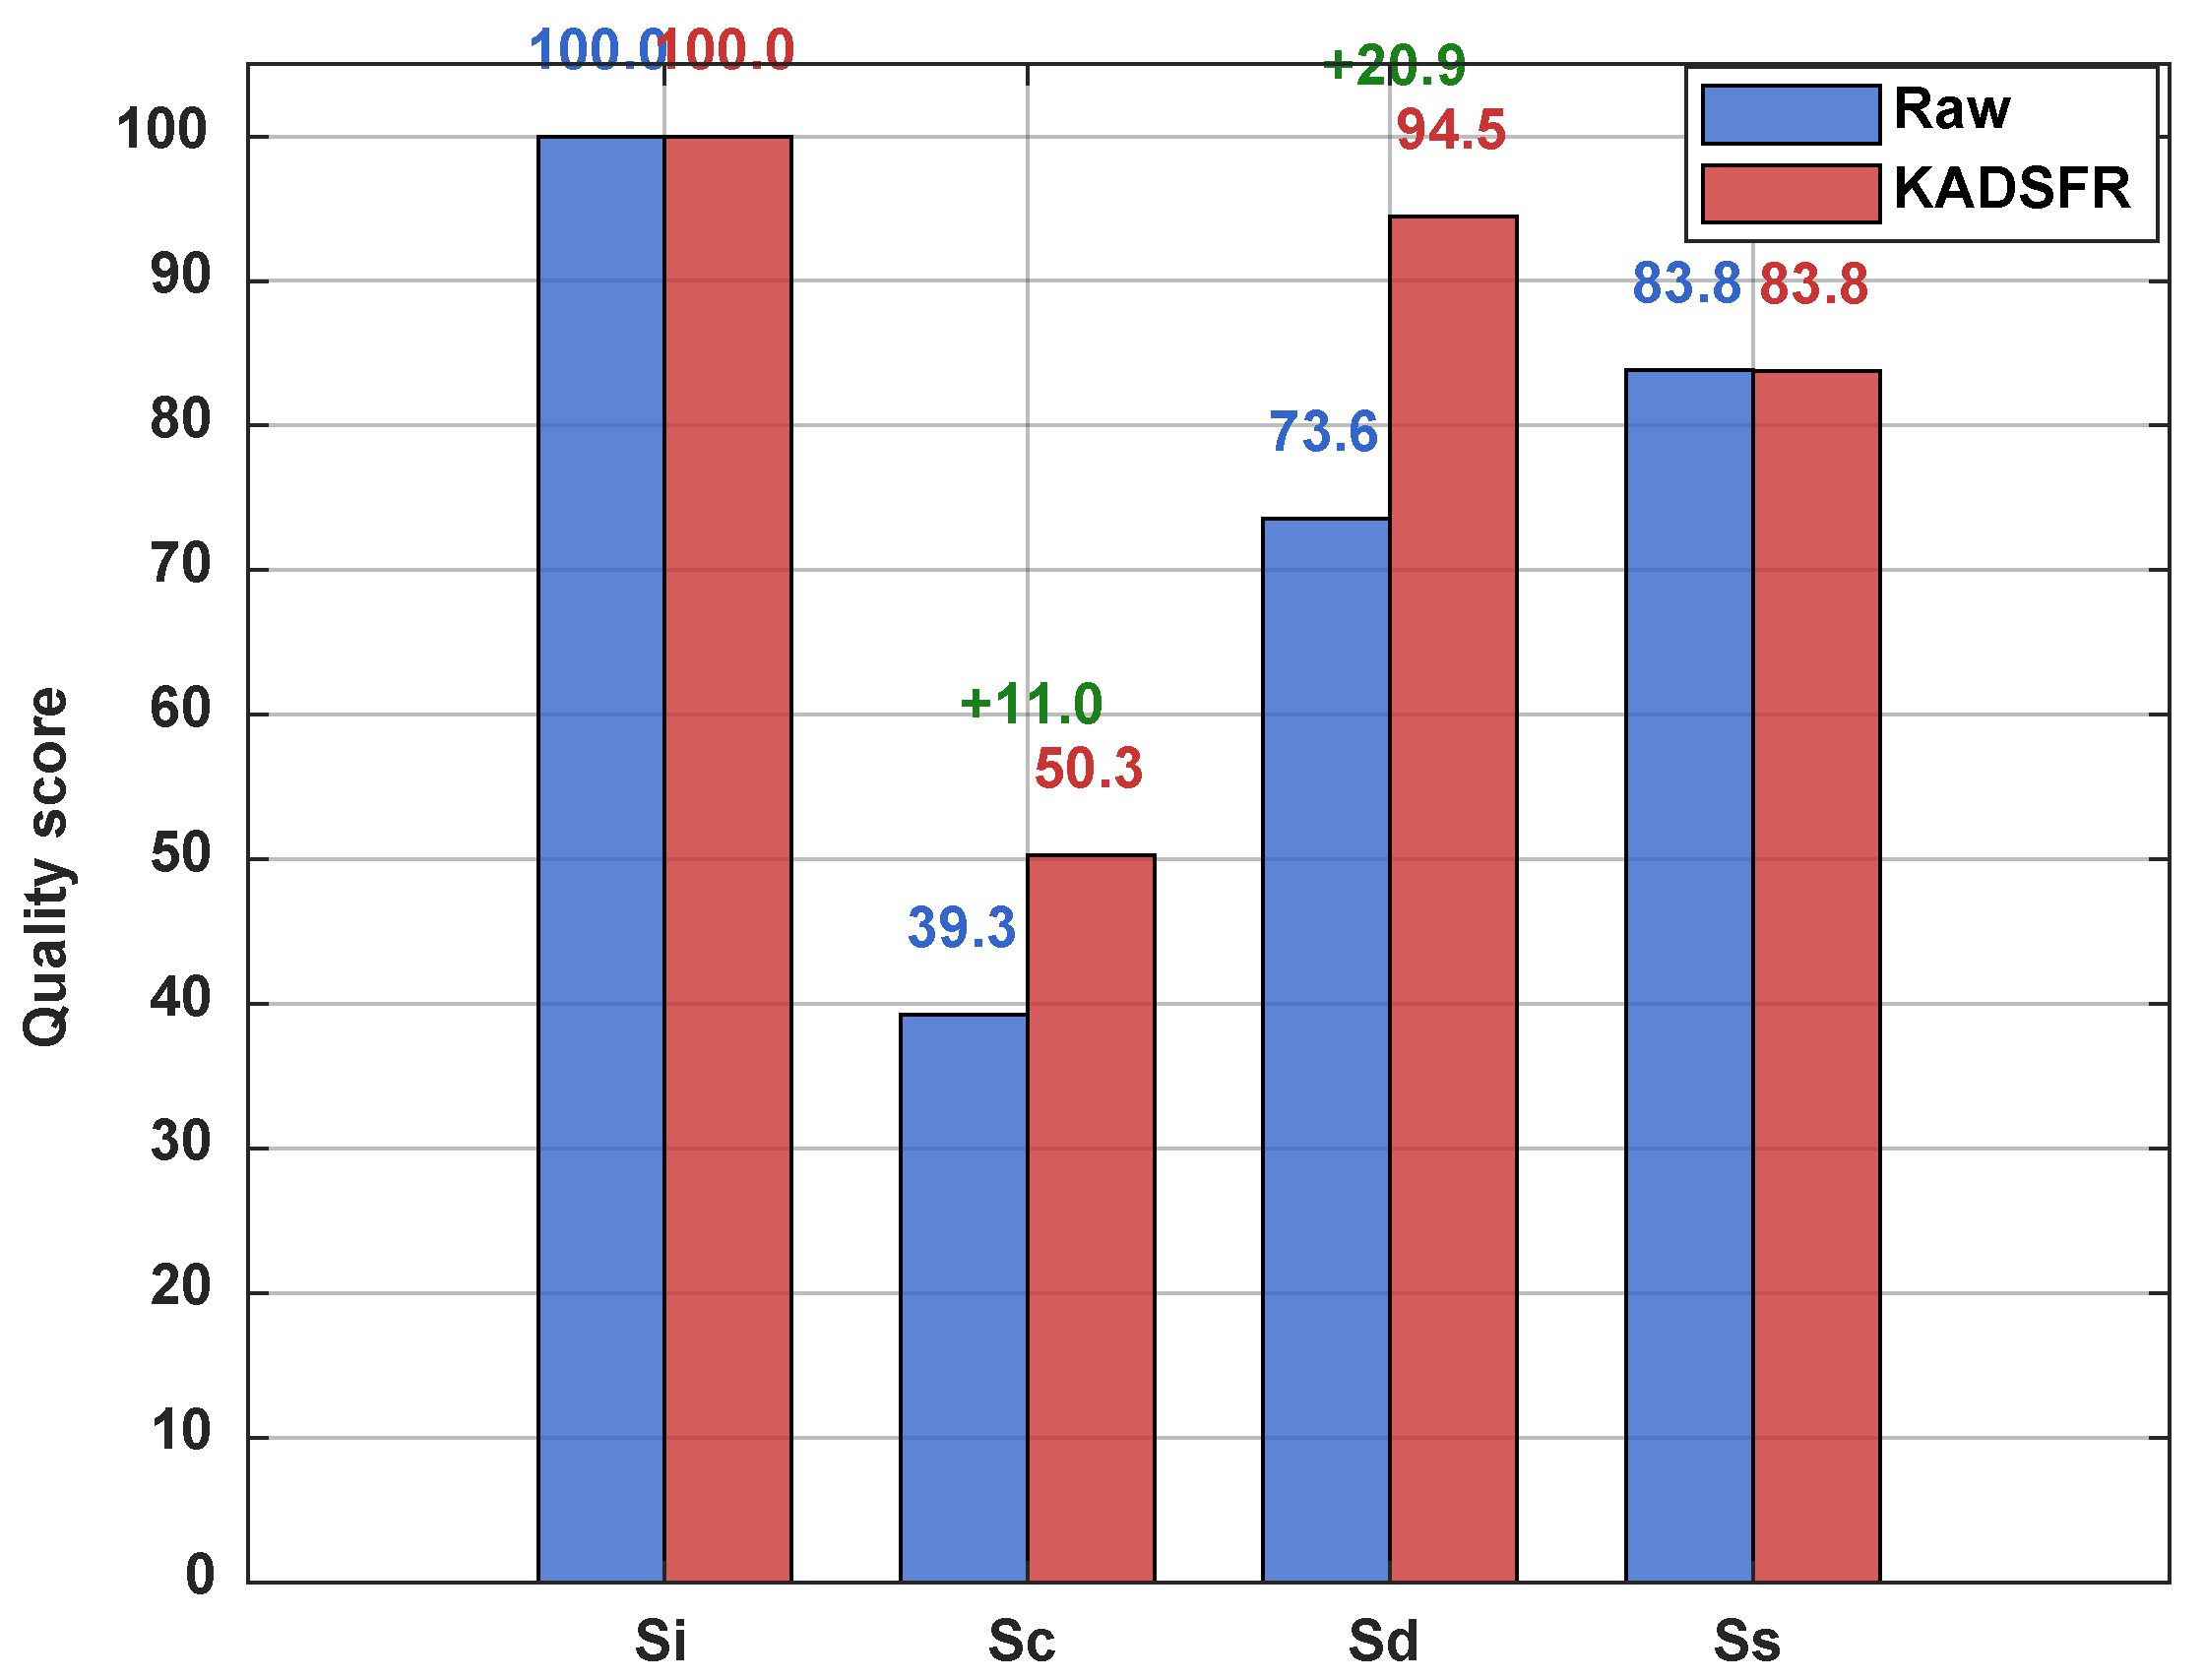
The efficacy of the KADSFR algorithm is visually confirmed through a detailed dimensional comparison of data quality, presented in Figure 5. The processed fingerprint database exhibits substantial gains across all evaluated dimensions. The most significant improvement is observed in consistency (a gain of 50.3 points), directly attributable to the algorithm’s effectiveness in identifying and rectifying outliers. The enhancement in distribution characteristics (reaching 94.5 points) indicates that the statistical distribution of the RSSI values has become more regular and plausible. Overall, the total quality score Q increases from 73.4 to 81.3, marking a relative improvement of 10.9%. This establishes a robust data foundation crucial for subsequent high-precision positioning tasks.
Figure 5.
Detailed comparison of data-quality dimensions.
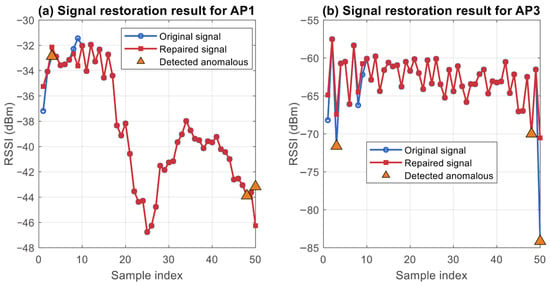
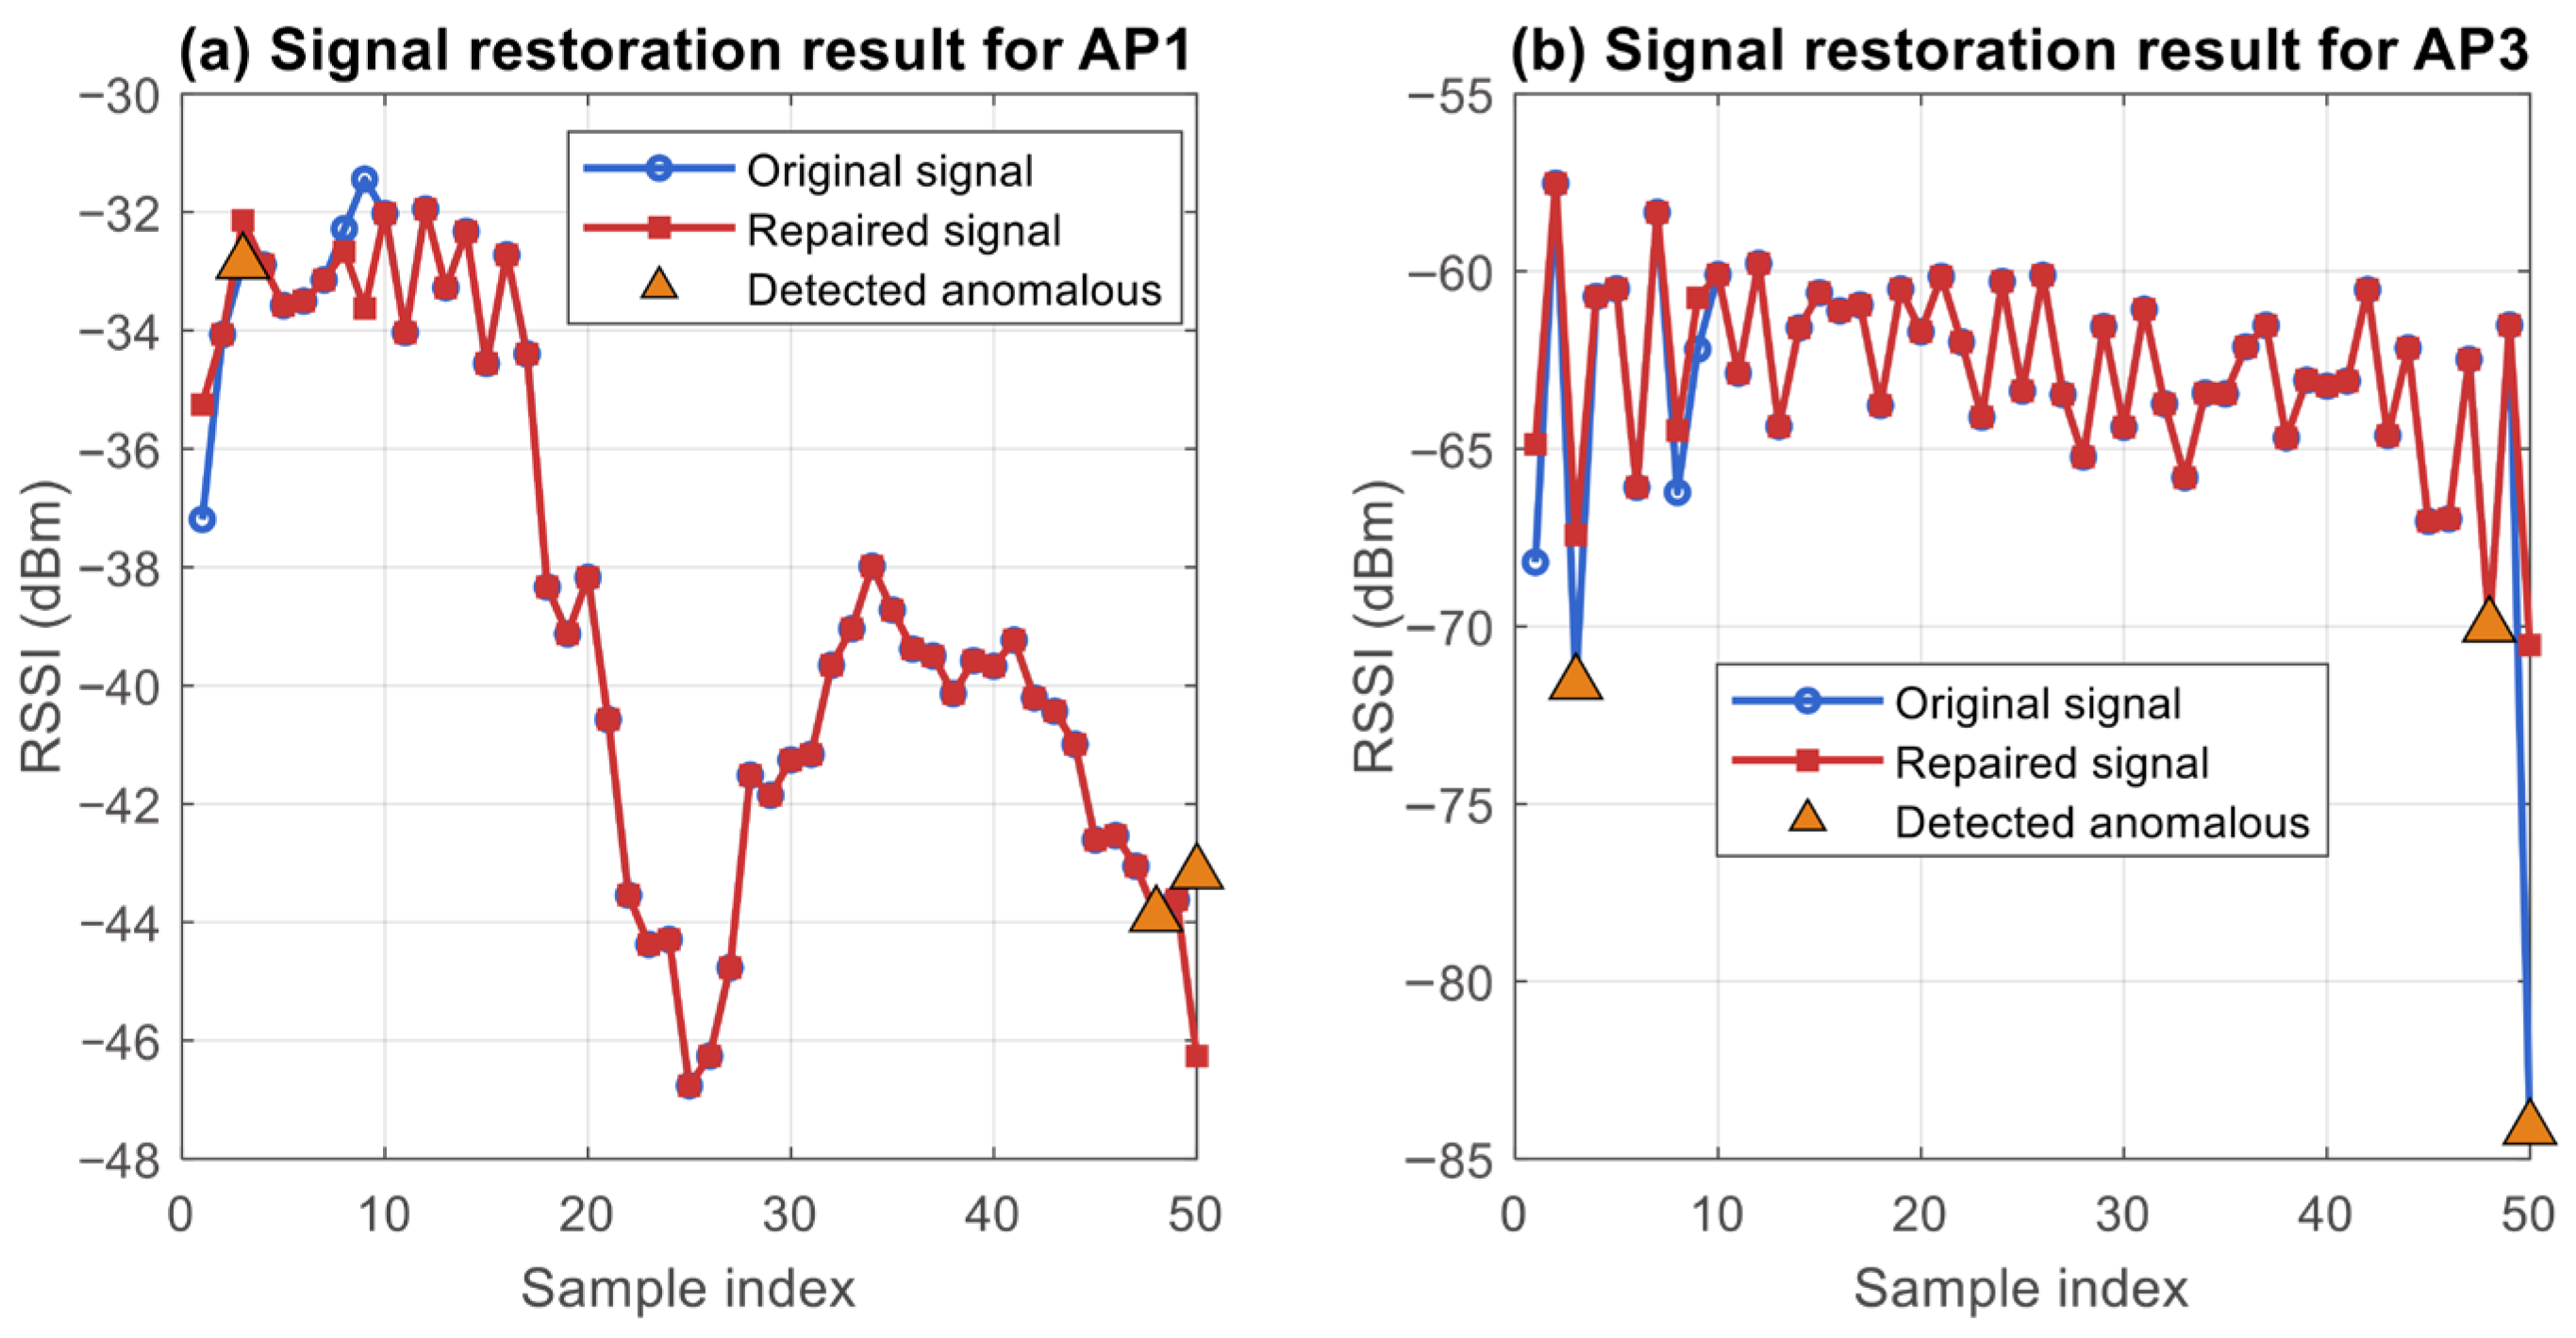
Figure 6 provides a visual demonstration of the KADSFR algorithm’s performance in anomaly detection and repair for two representative access points (APs). Triangular markers highlight RSSI samples identified as anomalies, which typically manifest as abrupt signal deviations. Following KADSFR processing, these anomalies are intelligently corrected to values consistent with the local signal trend, while valid data points remain unaltered. Notably, the algorithm demonstrates consistent adaptability across different APs, effectively handling diverse anomaly types and thereby validating its robustness. These observations align with the improved quality scores reported in Figure 5, collectively confirming KADSFR’s effectiveness in enhancing fingerprint data quality.
Figure 6.
Validation of KADSFR anomaly detection and repair.
3.3. Ablation Studies and Analysis
To systematically assess the contribution of each component in the proposed framework, ablation experiments were conducted to quantify the individual and combined effects of KADSFR-based data preprocessing and the multi-mechanism adaptive PSO-LSSVM model. Table 1 summarizes the positioning performance across four algorithmic configurations.
Table 1.
Ablation study results.
First, KADSFR consistently improves localization accuracy regardless of the underlying model. Using LSSVM as an example, the mean error decreased from 1.32 m to 1.13 m, the RMSE was reduced from 1.64 m to 1.42 m, the 90th percentile error dropped from 2.80 m to 2.33 m, and the proportion of estimates within 1 m increased from 49.3% to 56.0%. These results indicate that KADSFR effectively corrects anomalous fingerprints and enhances the overall reliability of the fingerprint database.
In addition, the SDM-SES-APSO optimizer further strengthens model performance. When applied to the original fingerprint database, the optimized model reduced the mean error from 1.32 m to 0.84 m and improved the proportion of estimates within 1 m from 49.3% to 73.2%. This demonstrates that the proposed adaptive PSO variant provides more stable convergence and avoids premature stagnation during hyperparameter optimization.
More notably, KADSFR and the improved APSO yield a clear synergistic effect when used together with a high-quality fingerprint database. When SDM-SES-APSO was applied on top of KADSFR-repaired data, the mean error was reduced to 0.74 m, the RMSE decreased to 0.94 m, and the rate of estimates within 1 m increased to 76.7%. Compared with using KADSFR or APSO alone, the combined configuration produced more substantial performance gains.
Overall, the ablation results verify the effectiveness of the dual-layer design strategy adopted in this work: Fingerprint Quality Enhancement + Parameter Robust Optimization. KADSFR improves the integrity and consistency of the fingerprint database, while the APSO-LSSVM module strengthens the robustness of model learning. Their interaction leads to the best overall localization performance.
3.4. Analysis of Hyperparameter Optimization for Localization Models
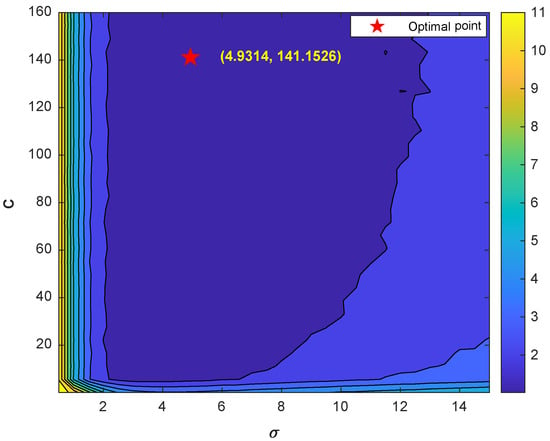
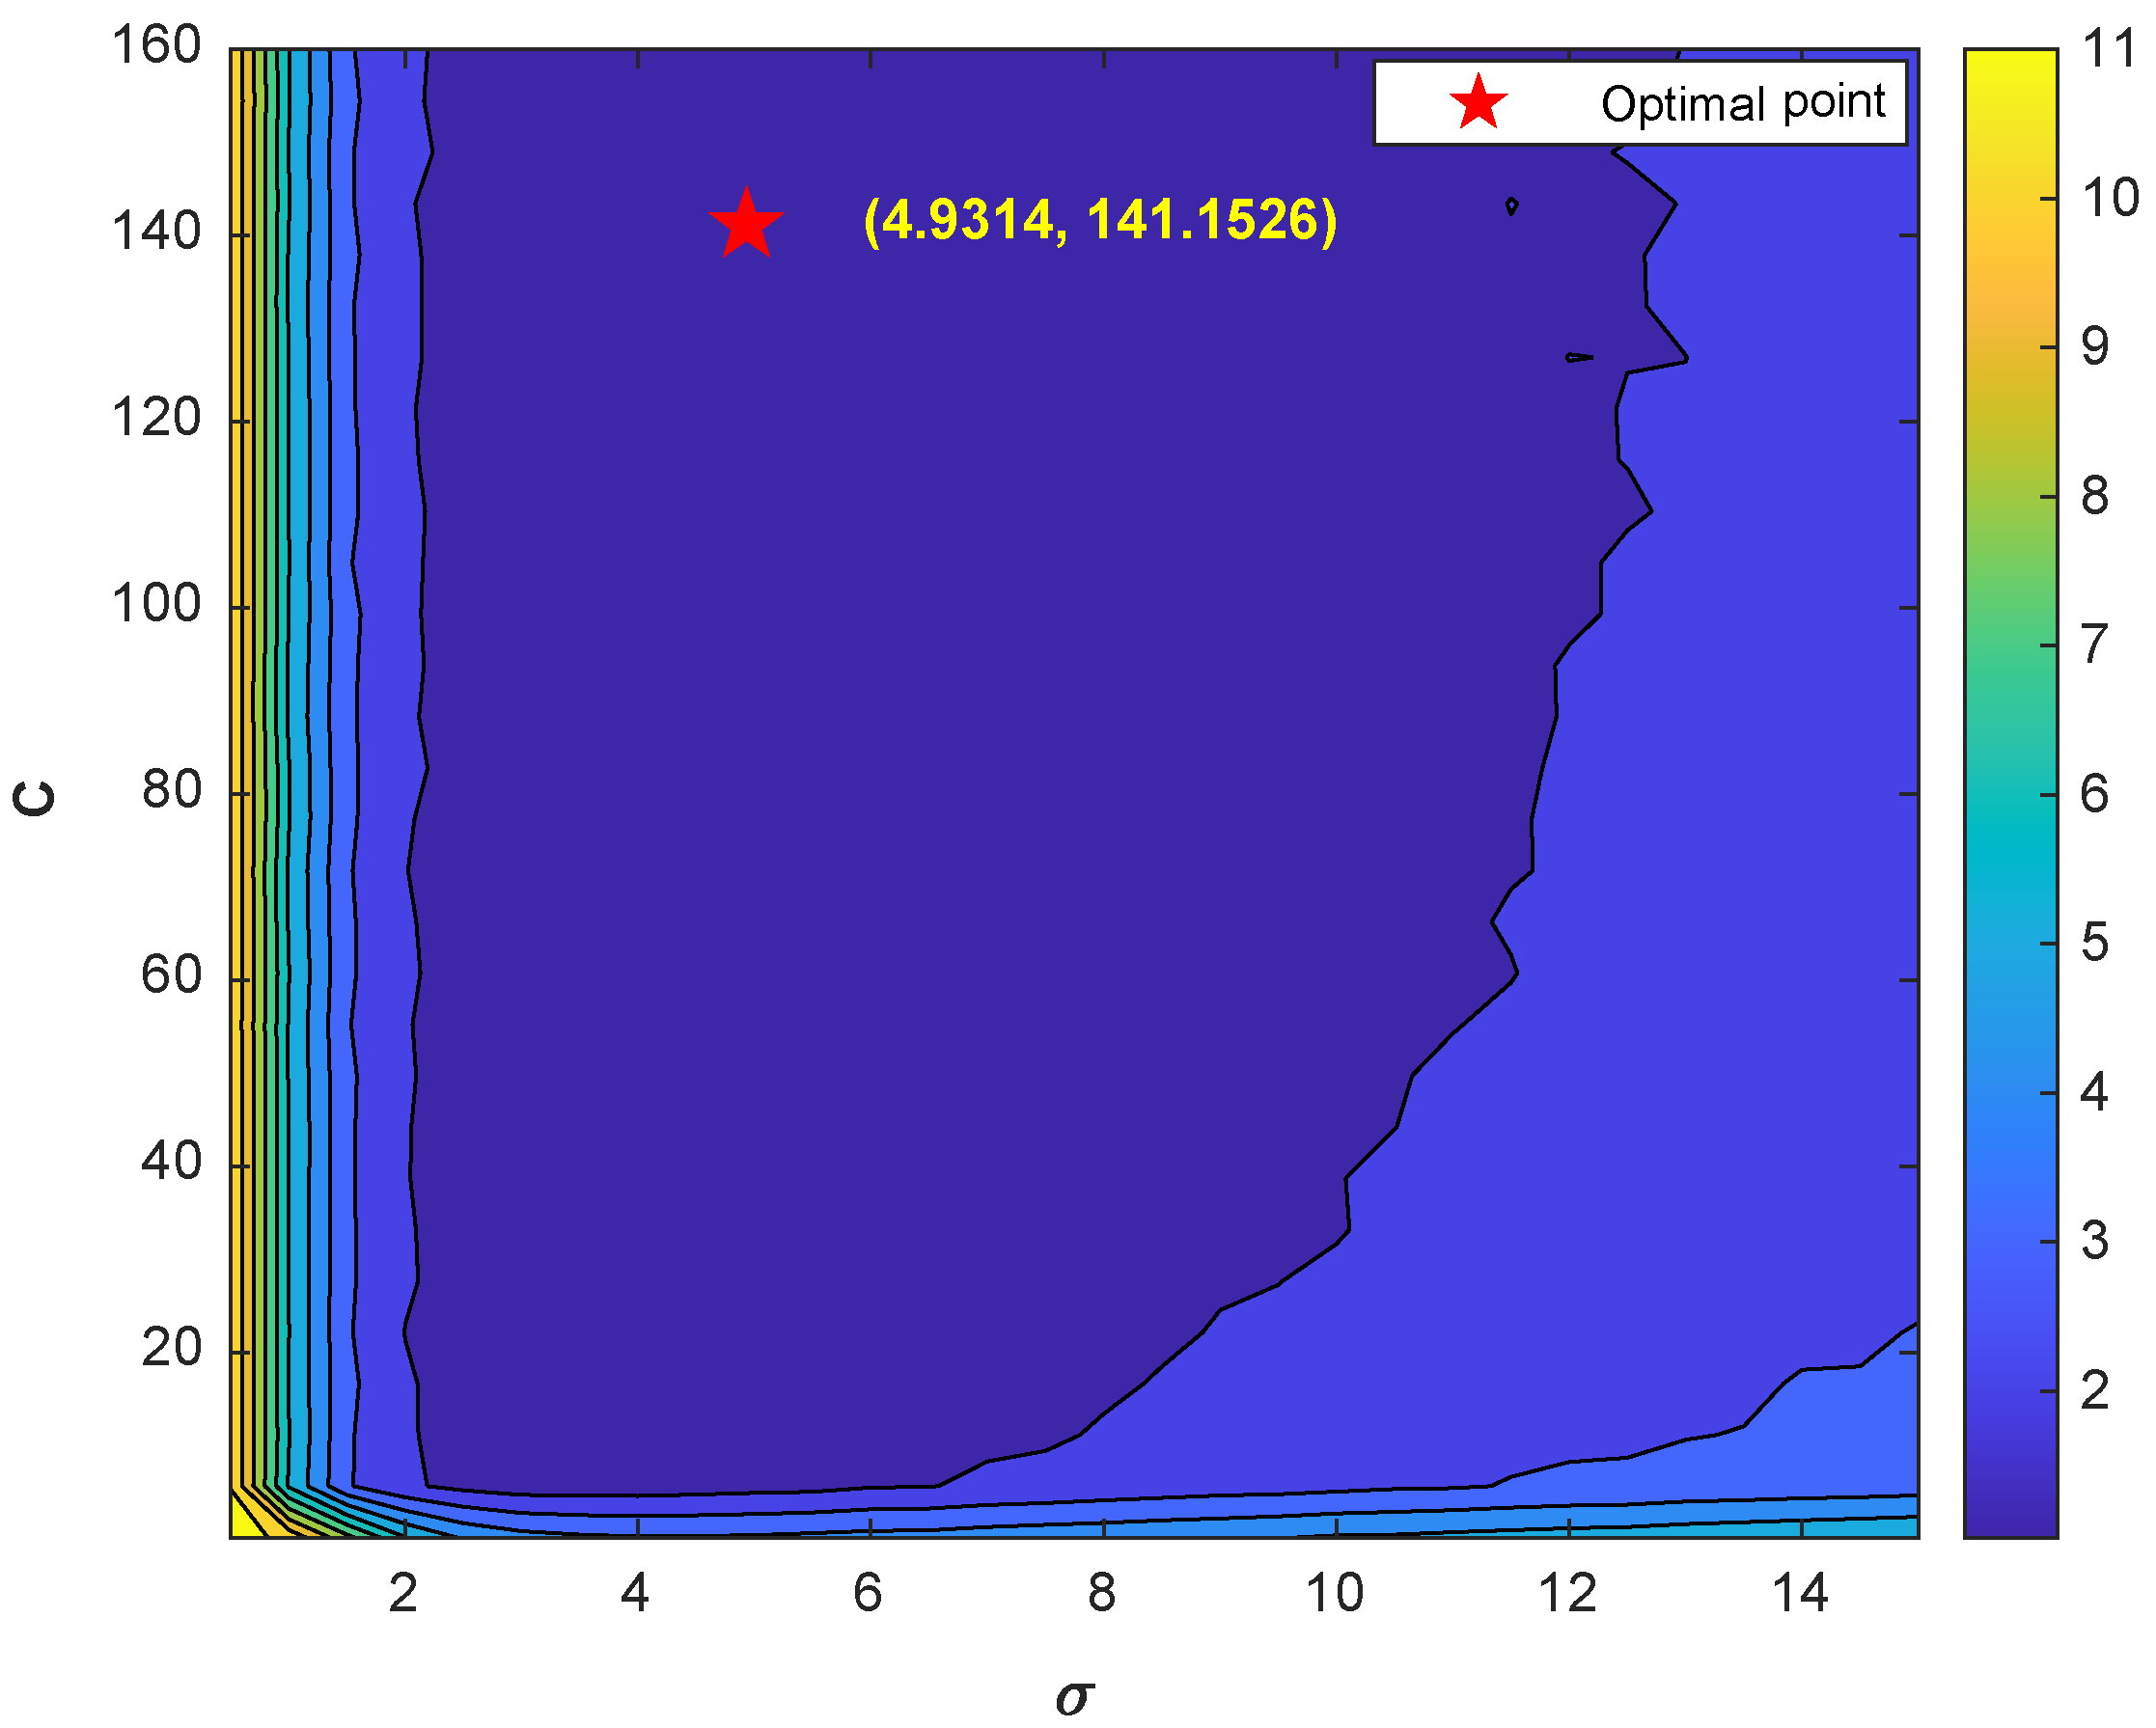
The hyperparameters (regularization coefficient) and (kernel width) critically influence the generalization capability and ultimate accuracy of the LSSVM localization model. To identify the optimal parameter combination, a grid search was performed over a defined range for both parameters. For each pair, an LSSVM model was trained and evaluated using the RMSE of the localization error. This process yielded a parameter sensitivity heatmap, shown in Figure 7, which visualizes how the RMSE varies with changes in and . The global minimum error is marked with a red star.
Figure 7.
Parameter sensitivity heatmap.
The sensitivity heatmap reveals a significant interaction between and . Model performance follows a distinct pattern: For , the RMSE remains notably high (yellow to light-blue regions) regardless of the value, indicating that an excessively narrow kernel leads to underfitting, preventing the model from effectively learning fingerprint features. For , performance recovers slightly but remains sub-optimal, suggesting that an overly wide kernel causes over-smoothing and diminishes the model’s ability to discriminate between fingerprints, potentially leading to overfitting. When , the heatmap is generally lighter with higher RMSE, reflecting that overly weak regularization (i.e., a small ) pushes the model towards underfitting. A robust plateau region (deep blue, with RMSE fluctuations < 0.3 m) is identified for ∈ [2.5, 6] and ∈ [20, 160]. Within this region, minor parameter variations induce negligible changes in RMSE, demonstrating strong model robustness. This plateau serves as the effective parameter search space. Through this sensitivity analysis, the hyperparameters were fine-tuned, selecting the combination yielding the minimum overall positioning error: = 141.15 and = 4.93, which achieved an RMSE of 0.94 m on the test set. The identification of this robust parameter interval provides a safety margin for practical deployment, indicating that positioning accuracy remains stable despite moderate parameter fluctuations.
3.5. Analysis of Localization Performance Across Different Algorithms
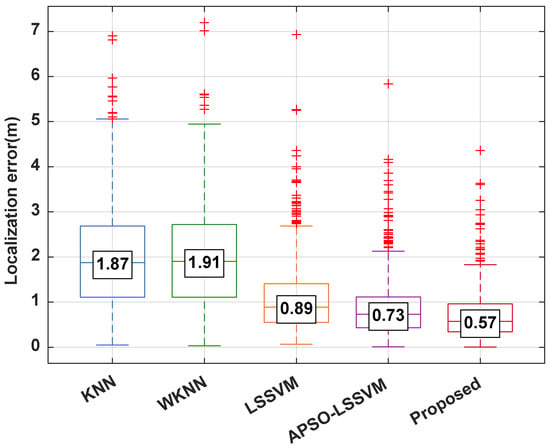
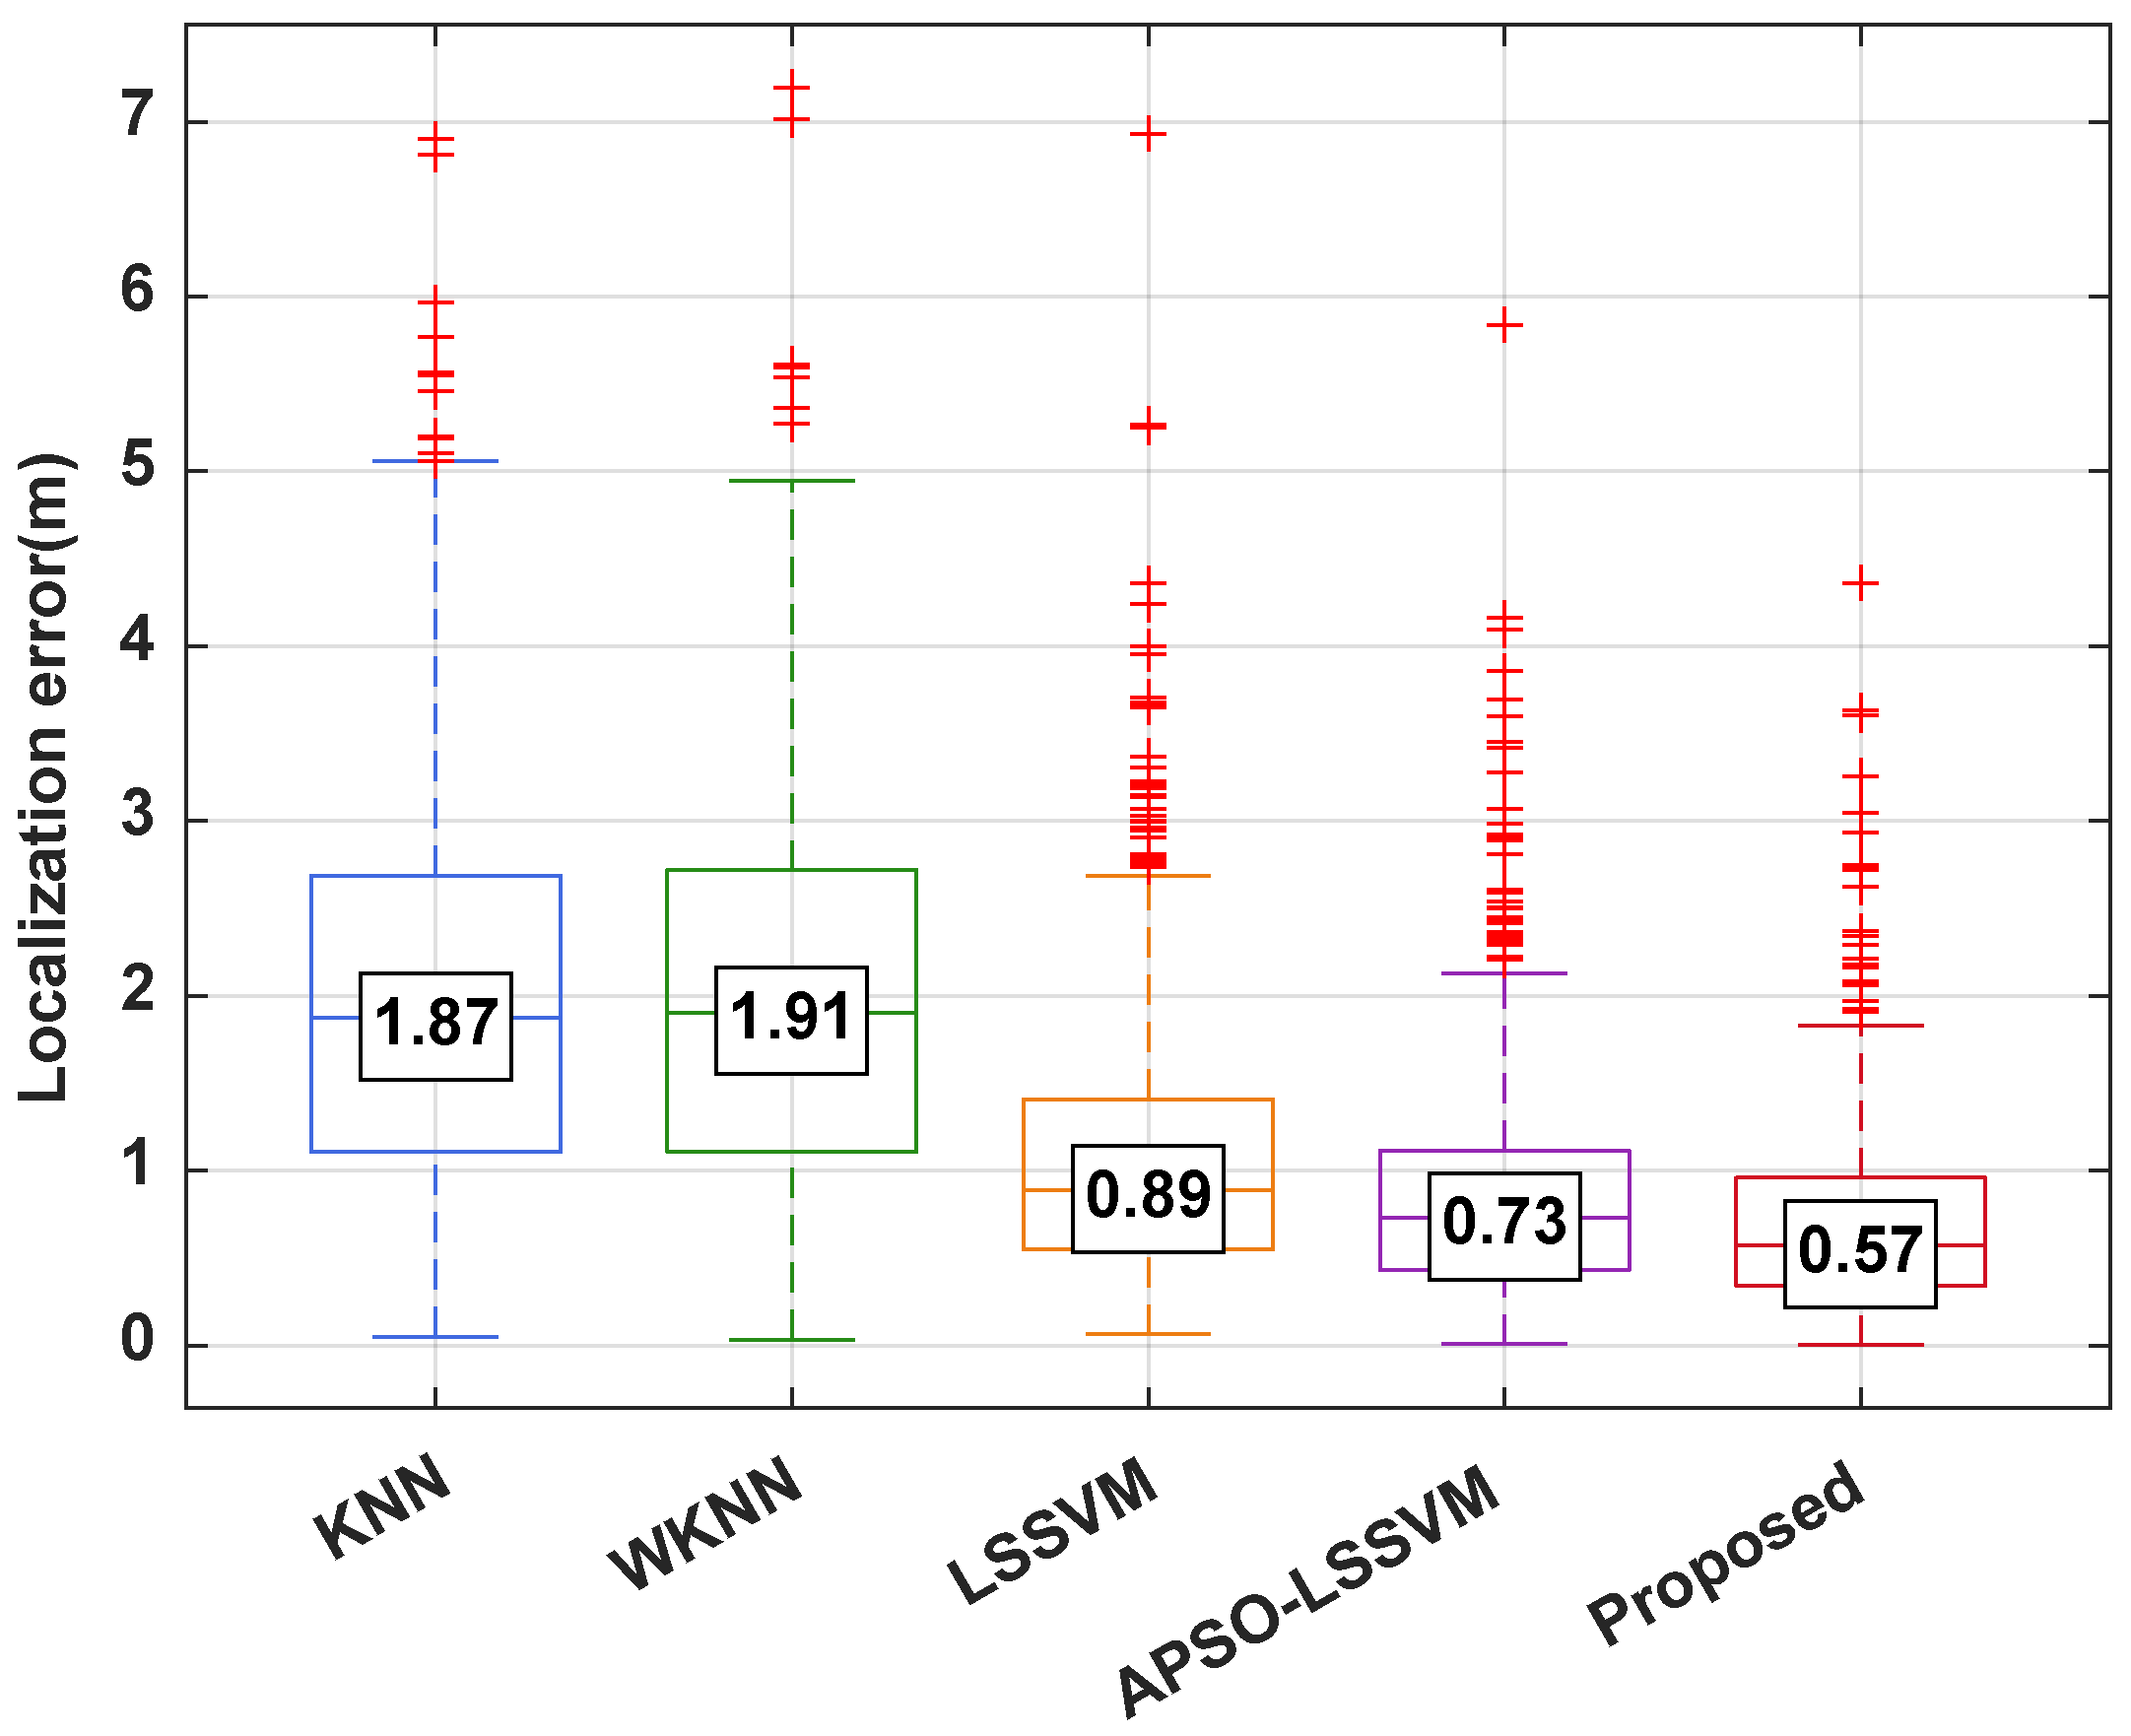
To comprehensively assess the performance of the proposed algorithm, comparative experiments were conducted using four representative baseline methods on the same test set (N = 600), including KNN, WKNN, LSSVM, and APSO-LSSVM. Figure 8 presents the boxplots of the localization error distributions for all methods.
Figure 8.
Boxplots of localization error distributions for different algorithms.
The results indicate that traditional distance-based methods, namely KNN and WKNN, exhibit broader error ranges and a larger number of outliers. This behavior reflects their susceptibility to RSSI fluctuations and multipath effects in complex indoor environments, which weakens the reliability of similarity-based fingerprint matching. In contrast, the machine learning approaches LSSVM and APSO-LSSVM achieve noticeably more compact error distributions with far fewer outliers, demonstrating the advantages of supervised nonlinear modeling.
Among all evaluated methods, the proposed algorithm achieves the most favorable error distribution characteristics. It yields the lowest median error, the smallest interquartile range, and the most concentrated distribution, indicating improved accuracy as well as enhanced robustness against environmental variability. These observations collectively confirm the effectiveness of the proposed approach in achieving stable and high-precision indoor localization.
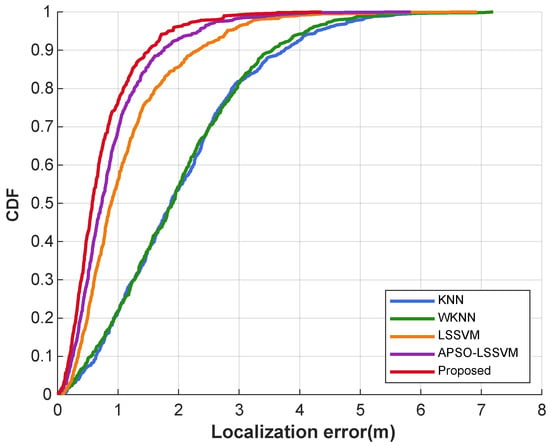
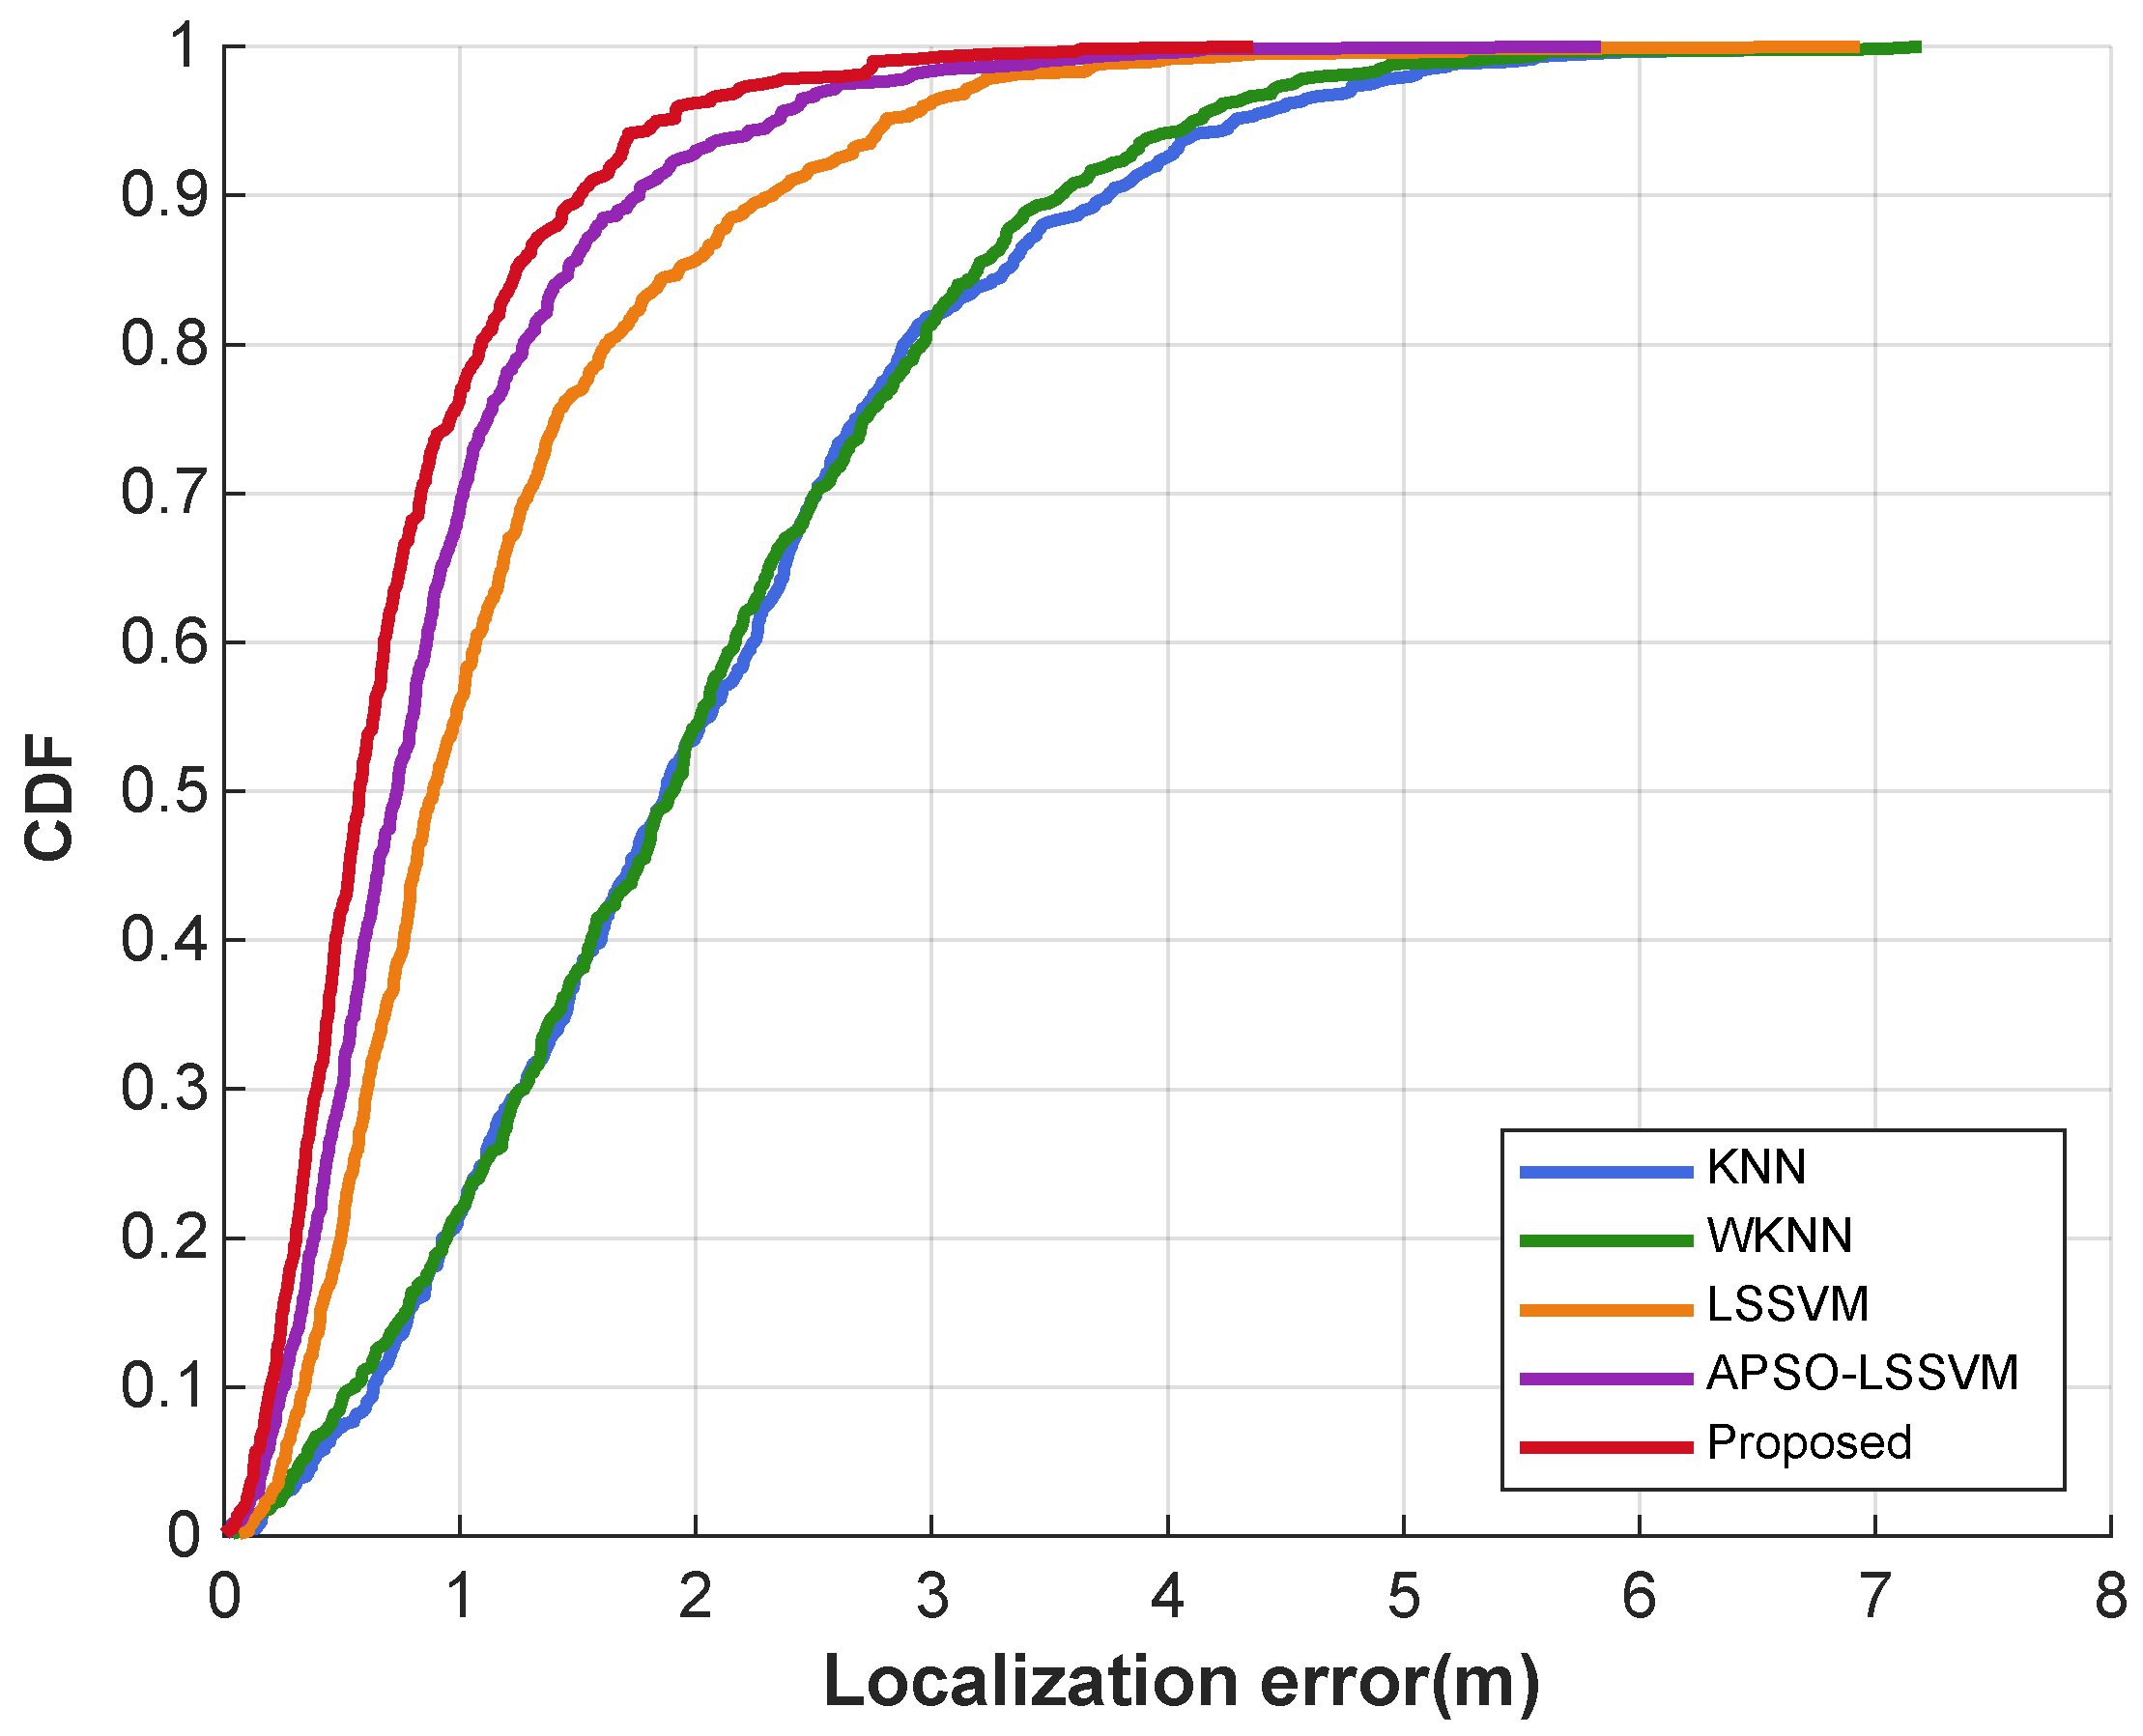
Figure 9 presents the cumulative distribution function (CDF) curves of the localization errors for all evaluated algorithms. The proposed method consistently maintains the most favorable curve shape, located toward the upper-left region of the plot, indicating that it achieves the highest cumulative probability at any given error threshold. At the 1-m threshold, the proposed method attains a cumulative probability of 76.7 percent, which is markedly higher than those of the comparison algorithms. When the threshold increases to 2 m, the cumulative probability reaches 96.2 percent, whereas traditional methods achieve only about 54 percent. These results demonstrate the superiority of the proposed approach in achieving high-precision positioning.
Figure 9.
CDF comparison of localization errors for different algorithms.
Table 2 provides a detailed comparison of the performance metrics for all algorithms. The proposed method achieves the best results across all evaluation indices, yielding an average positioning error of 0.74 m, which represents a 16.9 percent improvement over the APSO-LSSVM benchmark. Statistical analysis of the error distribution further shows that the proposed method attains a median error of 0.57 m and a 90th-percentile error of 1.51 m. Its RMSE of 0.94 m confirms its strong capability in controlling overall localization error.
Table 2.
Comparison of localization performance across different algorithms.
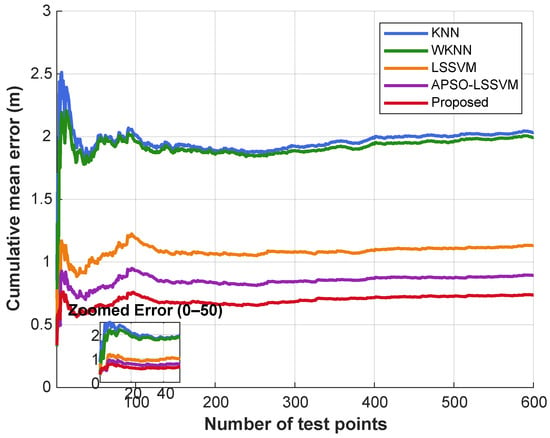
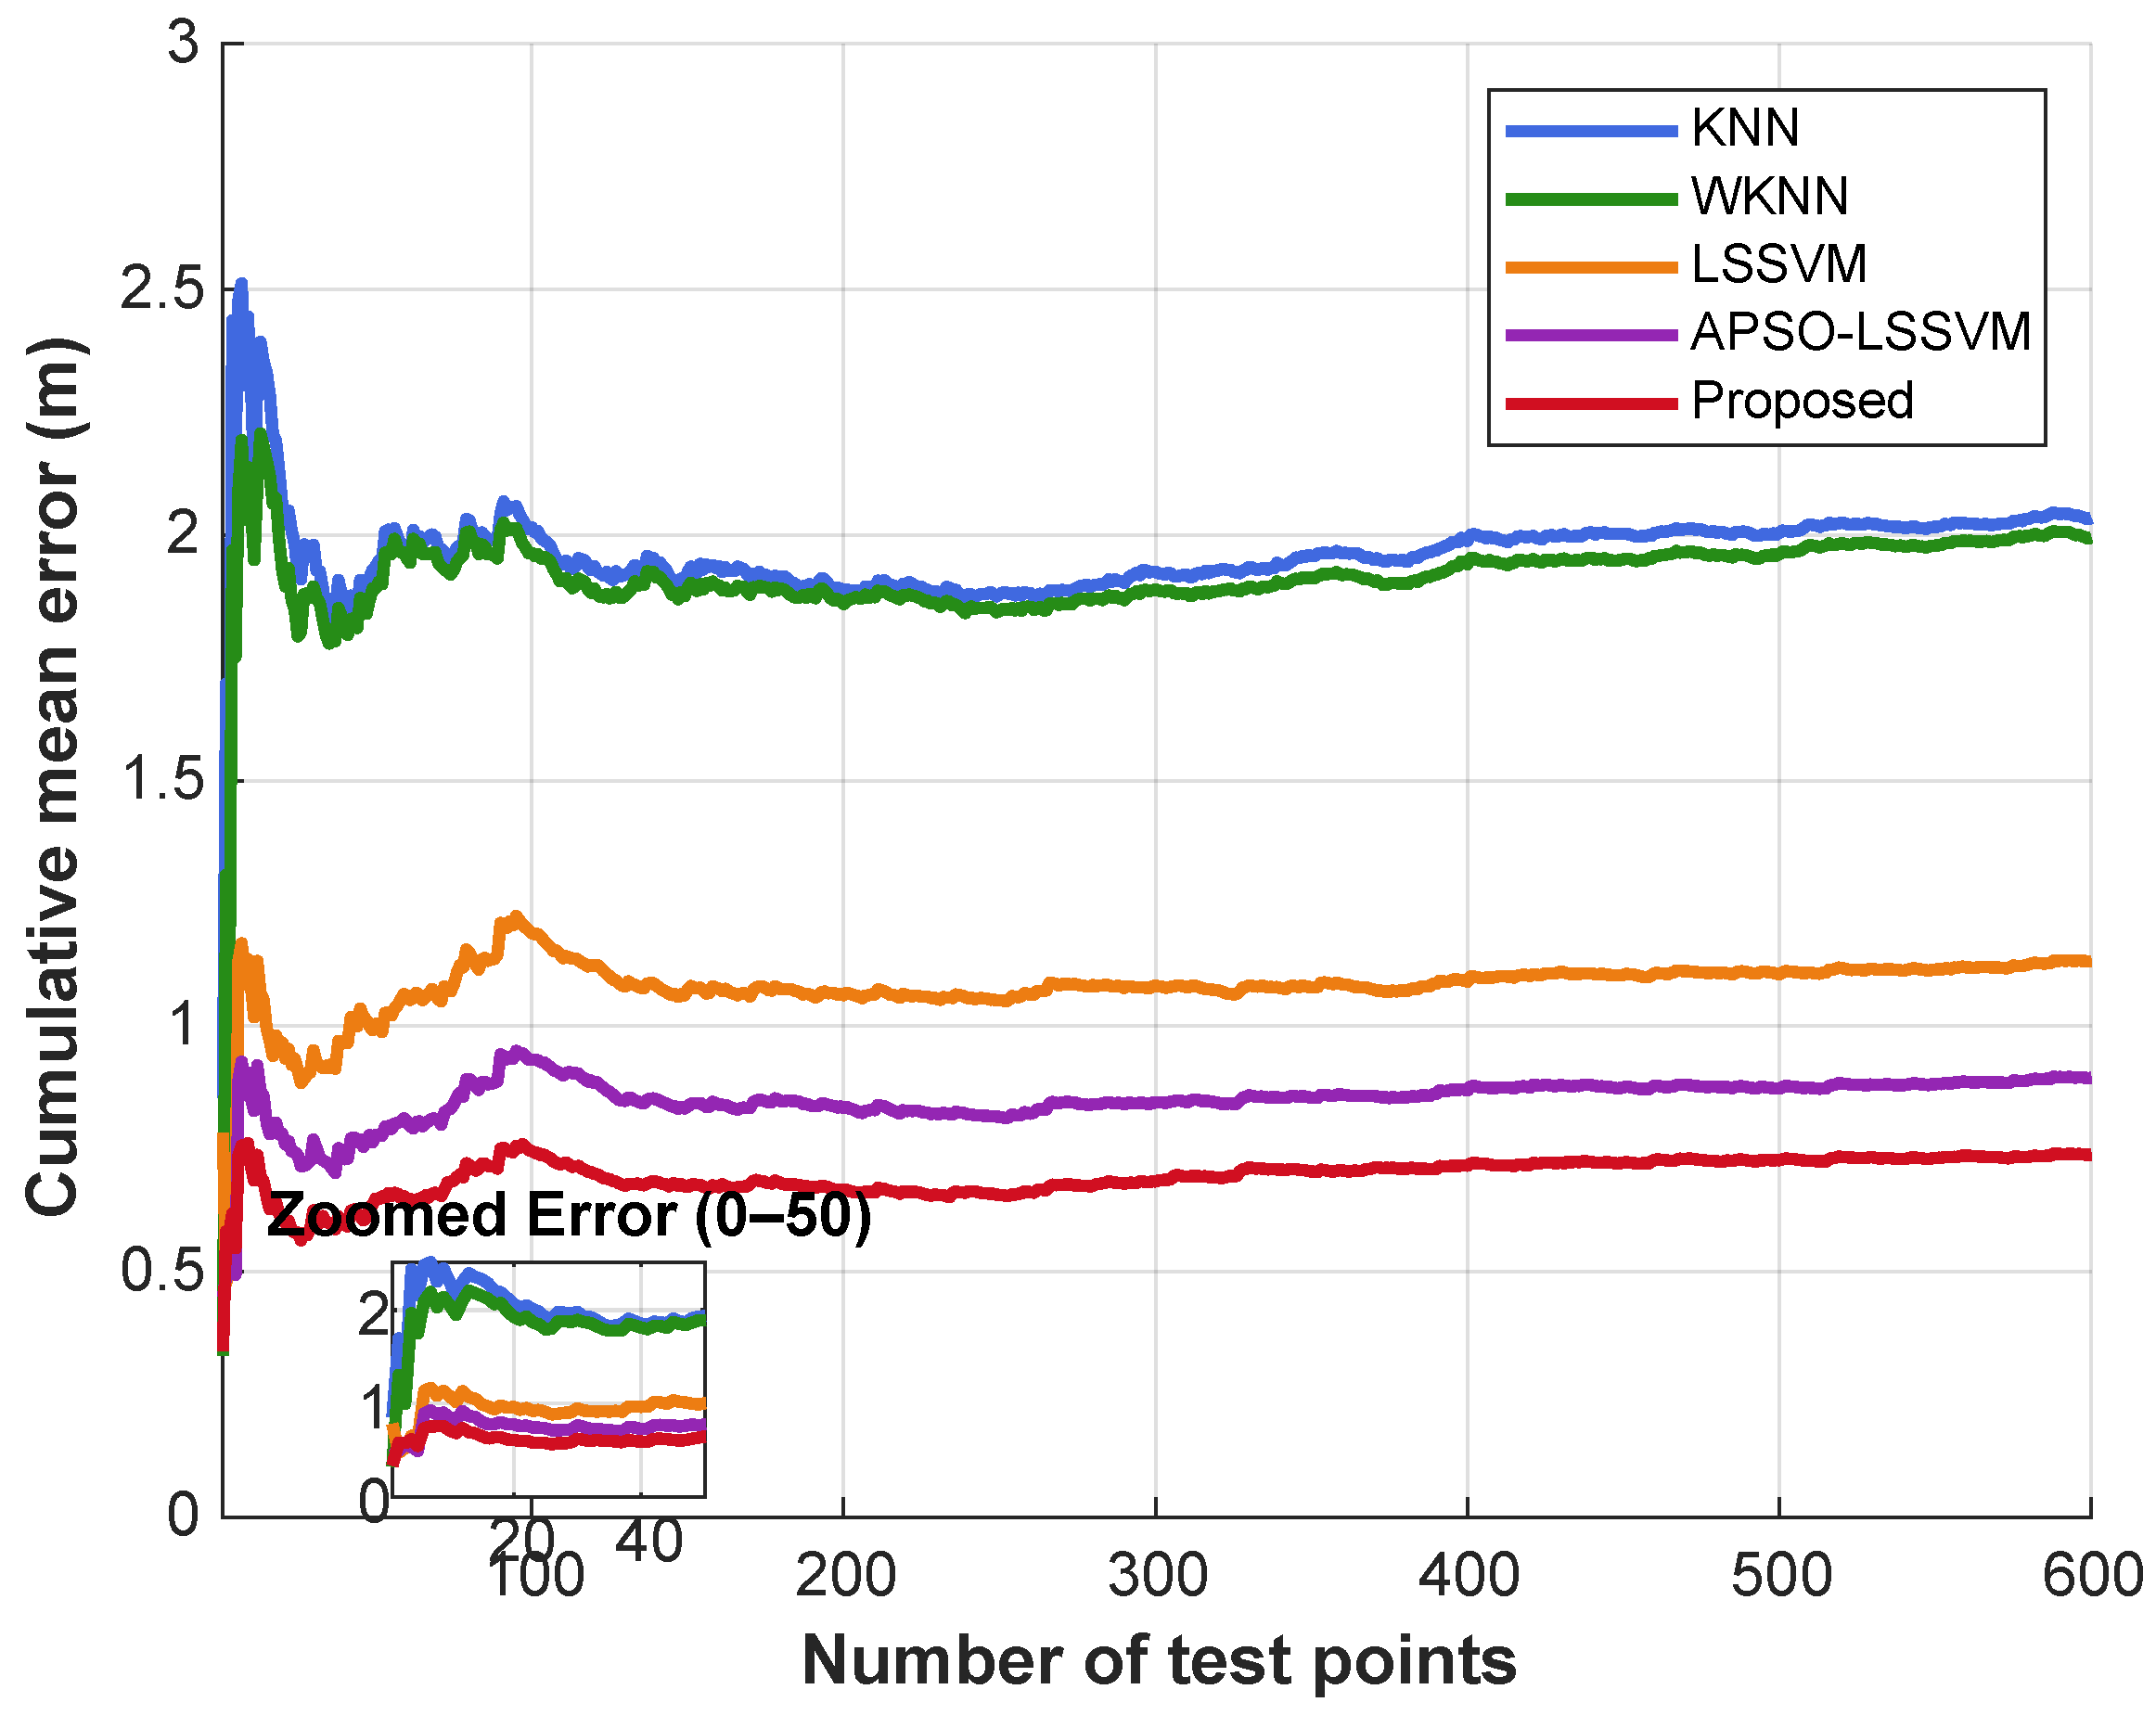
Figure 10 illustrates the cumulative mean positioning error curves of the evaluated methods as the number of test samples increases. At the beginning, when the sample size is small, the mean errors of all algorithms exhibit noticeable fluctuations due to limited statistical stability. As the number of samples increases, the curves gradually converge. Throughout the entire process, the curve of the proposed method remains consistently below those of the comparison algorithms and converges rapidly to a low and stable value. When the sample count reaches 20, its average error is 0.743 m, and this value remains nearly unchanged as more samples are incorporated. These observations verify the robustness and stable convergence behavior of the proposed method across varying test samples.
Figure 10.
Comparison of cumulative mean localization error curves for different algorithms.
The comprehensive results indicate that traditional KNN-based algorithms, constrained by simple distance-metric matching, perform poorly in multipath-rich indoor environments and struggle to maintain consistent accuracy. LSSVM improves feature mapping through kernel transformations, yet its performance is highly dependent on properly tuned hyperparameters. Although APSO-LSSVM enhances parameter selection, it does not fully exploit the structural characteristics of fingerprint signal distributions. In contrast, the proposed method leverages robust fingerprint reconstruction together with multi-mechanism adaptive optimization, achieving substantial gains in positioning accuracy, stability, and convergence. These advantages suggest that the proposed approach offers a promising and effective solution for high-precision indoor localization.
From a computational perspective, the KADSFR module is executed in the offline phase during fingerprint database construction, and therefore, its computational cost does not affect real-time localization. The SDM-SES-APSO-based hyperparameter optimization is also conducted offline using cross-validation. In the online phase, the optimized LSSVM model only requires kernel-based inference, whose computational burden is modest compared with data preprocessing and model training. As a result, the proposed framework is well suited for real-time localization and can be scaled to large indoor environments.
4. Conclusions
This paper presented and evaluated an improved end-to-end WiFi fingerprint localization framework designed for complex indoor environments. The proposed method enhances fingerprint data quality through the KADSFR reconstruction model and improves hyperparameter robustness by adopting the SDM-SES-APSO optimization scheme for LSSVM. Experimental results demonstrate that the integration of fingerprint repair with multi-mechanism adaptive optimization yields substantial gains over traditional distance-based methods and optimization-enhanced baseline models. Parameter sensitivity analysis further verifies the framework’s stability, showing consistent performance even under minor environmental variations.
Regarding the choice of the optimization strategy, this study adopts an adaptive PSO framework as the optimization core. While alternative global optimizers such as genetic algorithms (GA), differential evolution (DE), and simulated annealing (SA) are also effective in many contexts, APSO offers several characteristics well aligned with the LSSVM hyperparameter tuning task considered in this work. Specifically, the search space is continuous and of relatively low dimensionality, for which PSO-based methods often demonstrate efficient convergence behavior. Moreover, the proposed stagnation detection and spatial exclusion mechanisms can be naturally embedded into the swarm paradigm to enhance diversity preservation without introducing additional genetic operators or increasing algorithmic complexity. This design choice enables a balance between optimization robustness and computational efficiency within the fingerprint localization pipeline. Future work will explore the integration of the proposed KADSFR preprocessing module with other advanced optimization paradigms to further investigate performance–complexity tradeoffs.
Although the proposed method achieves high positioning accuracy and strong robustness, computational efficiency may become a limiting factor in large-scale access point deployments or high-dimensional feature spaces. Future research may explore two directions.
- Scenario extension and generalization: applying the framework to multi-floor and cross-building environments and investigating transfer learning techniques to reduce deployment overhead in new sites;
- Performance–efficiency tradeoff: developing lightweight localization models through pruning or quantization, or incorporating efficient search strategies such as approximate nearest neighbor matching, to maintain accuracy while meeting real-time or resource-constrained requirements.
Author Contributions
S.W., Methodology, Writing—Original Draft, Software, and Analysis and interpretation of results. L.Z., Conceptualization, Writing—Reviewing & Editing, and Analysis and interpretation of results. X.H., Software and Writing—Review & Editing. All authors have read and agreed to the published version of the manuscript.
Funding
This research was funded by the National Natural Science Foundation of China (No. 61741303), the Guangxi Natural Science Foundation Project (No. 2025GXNSFAA069942), and the Guangxi Young and Middle-aged College Teachers’ Scientific Research Basic Ability Improvement Project (No. 2023KY0263).
Institutional Review Board Statement
Not applicable.
Informed Consent Statement
Not applicable.
Data Availability Statement
The data that support the findings of this study are available from the corresponding author [L.Z.], upon reasonable request.
Acknowledgments
The authors would like to express their gratitude for the valuable feedback and suggestions provided by all the anonymous reviewers and the editorial team.
Conflicts of Interest
The authors declare no conflicts of interest to report regarding the present study.
References
- Bellavista-Parent, V.; Torres-Sospedra, J.; Pérez-Navarro, A. Comprehensive Analysis of Applied Machine Learning in Indoor Positioning Based on Wi-Fi: An Extended Systematic Review. Sensors 2022, 22, 4622. [Google Scholar] [CrossRef] [Scilit]
- He, S.; Chan, S.-H.G. Wi-Fi Fingerprint-Based Indoor Positioning: Recent Advances and Comparisons. IEEE Commun. Surv. Tutor. 2016, 18, 466–490. [Google Scholar] [CrossRef] [Scilit]
- Torres-Sospedra, J.; Richter, P.; Moreira, A.; Mendoza-Silva, G.M.; Lohan, E.S.; Trilles, S.; Matey-Sanz, M.; Huerta, J. A Comprehensive and Reproducible Comparison of Clustering and Optimization Rules in Wi-Fi Fingerprinting. IEEE Trans. Mob. Comput. 2020, 21, 769–782. [Google Scholar] [CrossRef] [Scilit]
- Chen, Z.; Zou, H.; Yang, J.; Jiang, H.; Xie, L. WiFi Fingerprinting Indoor Localization Using Local Feature-Based Deep LSTM. IEEE Syst. J. 2019, 14, 3001–3010. [Google Scholar] [CrossRef] [Scilit]
- Yin, Y.; Song, C.; Li, M.; Niu, Q. A CSI-Based Indoor Fingerprinting Localization with Model Integration Approach. Sensors 2019, 19, 2998. [Google Scholar] [CrossRef] [Scilit]
- Quezada-Gaibor, D.; Klus, L.; Torres-Sospedra, J.; Lohan, E.S.; Nurmi, J.; Granell, C.; Huerta, J. Data Cleansing for Indoor Positioning Wi-Fi Fingerprinting Datasets. In Proceedings of the 2022 23rd IEEE International Conference on Mobile Data Management (MDM 2022), Paphos, Cyprus, 6–9 June 2022; IEEE: Piscataway, NJ, USA, 2022; pp. 349–354. [Google Scholar] [CrossRef] [Scilit]
- Lin, Y.; Jiang, D.; Yus, R.; Bouloukakis, G.; Chio, A.; Mehrotra, S.; Venkatasubramanian, N. LOCATER: Cleaning WiFi Connectivity Datasets for Semantic Localization. Proc. VLDB Endow. 2020, 14, 329–341. [Google Scholar] [CrossRef] [Scilit]
- Tang, Z.; Li, S.; Kim, K.S.; Smith, J.S. Multi-Dimensional Wi-Fi Received Signal Strength Indicator Data Augmentation Based on Multi-Output Gaussian Process for Large-Scale Indoor Localization. Sensors 2024, 24, 1026. [Google Scholar] [CrossRef] [Scilit] [PubMed]
- Li, Q.; Qu, H.; Liu, Z.; Zhou, N.; Sun, W.; Sigg, S. AF-DCGAN: Amplitude Feature Deep Convolutional GAN for Fingerprint Construction in Indoor Localization Systems. IEEE Trans. Emerg. Top. Comput. Intell. 2019, 5, 468–480. [Google Scholar] [CrossRef] [Scilit]
- Ferreira, D.; Souza, R.; Carvalho, C. QA-kNN: Indoor Localization Based on Quartile Analysis and the kNN Classifier for Wireless Networks. Sensors 2020, 20, 4714. [Google Scholar] [CrossRef] [Scilit]
- Peng, X.; Chen, R.; Yu, K.; Ye, F.; Xue, W. An Improved Weighted K-Nearest Neighbor Algorithm for Indoor Localization. Electronics 2020, 9, 2117. [Google Scholar] [CrossRef] [Scilit]
- Mei, Y.; Deng, Y. Indoor Visible Light Fingerprint Location Method Based on Marine Predator Algorithm-Optimized Least Squares Support Vector Machine. Appl. Sci. 2024, 14, 7416. [Google Scholar] [CrossRef] [Scilit]
- Suykens, J.A.K.; Vandewalle, J. Least Squares Support Vector Machine Classifiers. Neural Process. Lett. 1999, 9, 293–300. [Google Scholar] [CrossRef] [Scilit]
- Zeng, J.; Tan, Z.H.; Matsunaga, T.; Shirai, T. Generalization of Parameter Selection of SVM and LS-SVM for Regression. Mach. Learn. Knowl. Extr. 2019, 1, 745–755. [Google Scholar] [CrossRef] [Scilit]
- Bi, J.; Zhao, M.; Yao, G.; Cao, H.; Feng, Y.; Jiang, H.; Chai, D. PSOSVRPos: WiFi indoor positioning using SVR optimized by PSO. Expert Syst. Appl. 2023, 222, 119778. [Google Scholar] [CrossRef] [Scilit]
- Wang, D.; Tan, D.; Liu, L. Particle swarm optimization algorithm: An overview. Soft Comput. 2018, 22, 387–408. [Google Scholar] [CrossRef] [Scilit]
- Liu, X.; Sun, B.; Xu, Z.D.; Liu, X. An adaptive Particle Swarm Optimization algorithm for fire source identification of the utility tunnel fire. Fire Saf. J. 2021, 126, 103486. [Google Scholar] [CrossRef] [Scilit]
- Yang, X.; Li, H.; Huang, Y. An adaptive dynamic multi-swarm particle swarm optimization with stagnation detection and spatial exclusion for solving continuous optimization problems. Eng. Appl. Artif. Intell. 2023, 123, 106215. [Google Scholar] [CrossRef] [Scilit]
- Gao, M.; Yang, X. APSO-SL: An Adaptive Particle Swarm Optimization with State-Based Learning Strategy. Processes 2024, 12, 400. [Google Scholar] [CrossRef] [Scilit]
- Poli, R.; Kennedy, J.; Blackwell, T. Particle Swarm Optimization: An overview. Swarm Intell. 2007, 1, 33–57. [Google Scholar] [CrossRef] [Scilit]
- Akopov, A.S. A Hybrid Multi-Swarm Particle Swarm Optimization Algorithm for Solving Agent-Based Epidemiological Model. Cybern. Inf. Technol. 2025, 25, 59–77. [Google Scholar] [CrossRef] [Scilit]
- Engelbrecht, A.P. Particle swarm optimization with crossover: A review and empirical analysis. Artif. Intell. Rev. 2016, 45, 131–165. [Google Scholar] [CrossRef] [Scilit]
- Cheng, Y.; Zhang, K.; Zheng, B.; Long, K.; Zhou, Y.; Jin, M.; He, J. Indoor WiFi fingerprint localization based on dual population PSO of stacked autoencoder and multi label classification. Sci. Rep. 2025, 15, 32941. [Google Scholar] [CrossRef] [Scilit] [PubMed]
- Freitas, D.; Lopes, L.G.; Morgado-Dias, F. Particle Swarm Optimisation: A Historical Review Up to the Current Developments. Entropy 2020, 22, 362. [Google Scholar] [CrossRef] [Scilit]
- Nobile, M.S.; Cazzaniga, P.; Besozzi, D.; Colombo, R.; Mauri, G.; Pasi, G. Fuzzy Self-Tuning PSO: A settings-free algorithm for global optimization. Swarm Evol. Comput. 2018, 39, 70–85. [Google Scholar] [CrossRef] [Scilit]
- Lin, A.; Sun, W.; Yu, H.; Wu, G.; Tang, H. Adaptive comprehensive learning particle swarm optimization with cooperative archive. Appl. Soft Comput. 2019, 77, 533–546. [Google Scholar] [CrossRef] [Scilit]
- Meng, X.; Li, H.; Chen, A. Multi-strategy self-learning particle swarm optimization algorithm based on reinforcement learning. Math. Biosci. Eng. 2023, 20, 8498–8530. [Google Scholar] [CrossRef] [Scilit]
- Jiang, H.; Cai, C.; Wang, H.J.; Wang, X. UWSN location based on improved weighted least squares support vector machine. Comput. Meas. Control 2021, 29, 250–254. [Google Scholar] [CrossRef]
- Zhang, L.; Chen, Y.; Gao, X.; Yang, J.; Zhang, C. Indoor visible light fingerprint positioning based on dynamic weighted RSSI and LGSHHO-LSSVM. Opt. Commun. 2025, 583, 131778. [Google Scholar] [CrossRef] [Scilit]
- Lu, H.; Zhang, L.; Chen, H.; Zhang, S.; Wang, S.; Peng, H.; Zou, J. An Indoor Fingerprint Positioning Algorithm Based on WKNN and Improved XGBoost. Sensors 2023, 23, 3952. [Google Scholar] [CrossRef] [Scilit] [PubMed]
- Cai, L.; Zhu, L.; Jiang, F.; Zhang, Y.; He, J. Research on multi-source POI data fusion based on ontology and clustering algorithms. Appl. Intell. 2022, 52, 4758–4774. [Google Scholar] [CrossRef] [Scilit]

Disclaimer/Publisher’s Note: The statements, opinions and data contained in all publications are solely those of the individual author(s) and contributor(s) and not of MDPI and/or the editor(s). MDPI and/or the editor(s) disclaim responsibility for any injury to people or property resulting from any ideas, methods, instructions or products referred to in the content. |
© 2026 by the authors. Licensee MDPI, Basel, Switzerland. This article is an open access article distributed under the terms and conditions of the Creative Commons Attribution (CC BY) license.