


Abstract
To evaluate the fire safety performance of the joint region in prefabricated buildings, specifically when the grout in the slurry layer is under an unconstrained state. Total 54 pull-out specimens were designed to investigate the effects of elevated temperatures (20 °C, 200 °C, 300 °C, 400 °C, 500 °C, and 600 °C) and steel bar positions (center, mid-side, and corner) on the bond behavior between the grout and steel rebars. The failure modes, bond strength, ultimate displacement, and load–slip curves of the specimens were recorded. The peak load of the specimens with the temperature increasing first rose and then declined, exhibiting a trend consistent with the variation in compressive strength of the grout with temperature. At 600 °C, the ultimate loads of the center, mid-side, and corner specimens decreased by 53.46%, 52.53%, and 51.28%, respectively, compared with those at ambient temperature. At ambient temperature, the bond strength of the mid-side specimen was 11.24% lower than that of the central specimen, but 19.98% higher than that of the corner specimen. At 500 °C, the bond strength of the mid-side and corner specimens decreased by 15.76% and 39.26%, respectively, compared with that of the center specimen. The failure mode changed from steel-rebar fracture to pull-out failure due to the high temperature exposure and the steel rebar position. Finally, based on the post-heating strength test results of grout specimens, a bond strength calculation formula and a bond–slip constitutive model, considering both steel rebar position and temperature, were developed, achieving a correlation coefficient (R2) close to 1.0.
1. Introduction
Prefabricated construction is primarily used to create green, ultra-low energy, high-quality, and digitally integrated structures [1]. Grout has good fluidity, early strength, high ultimate strength, and non-shrinkage properties. It is a cement-based dry mixture made of fine aggregates, chemical admixtures, and other additives [2]. It is frequently utilized to strengthen bar connections at prefabricated buildings’ joints [3]. The bond performance between the grout and the steel rebar is fundamental to the normal structural behavior, as it ensures effective force transfer and reliable connection in precast members [4]. Therefore, studying bond behavior between the grout and the steel rebar is essential for evaluating structural safety and load capacity after fire exposure.
Fire has become a major concern to engineering structures, occurring more frequently and posing major risks to public property safety and social development [5]. Elevated temperatures deteriorate the material properties of concrete structures. At present, research on the bond performance between steel bars and ordinary concrete is well established. The main factors influencing this bond behavior include high temperature, concrete strength, thickness of the concrete cover, and the position of the steel bar [6,7,8,9,10]. Splitting failure was more likely to occur in the corner bars, whereas most middle bars failed by pull-out [6]. As the compressive strength of concrete decreased, the bond stress also decreased, and the bonding failure slip also decreased [8]. Xiao’s study found that beyond 400 °C, the bond strength decreased significantly, whereas the peak slip increased markedly [9]. Higher temperatures also decreased friction and mechanical interlock, making steel rebar extraction easier. Similarly to results at ambient temperature, Sharma et al.’s studies [11] showed that the concrete cover can have a major impact on the bond strength and failure mechanism following high temperatures. Radial restraint was improved by thickening the concrete cover, which aided in the propagation of preventing cracks [12]. The bond strength between concrete and steel bars after high temperature exposure exhibited a trend similar to that of the compressive strength of concrete under the same thermal conditions [9,13]. Wu et al. [14] modified the bond–slip model by incorporating the influence of concrete confinement pressure and established a new predictive model. Previous studies on bond performance have primarily focused on conventional concrete specimens, whereas systematic investigations on the bond behavior between grout and steel rebars remain limited.
The primary difference between grout and concrete lies in the presence or absence of coarse aggregate. Compared with conventional concrete, grout exhibited a larger peak strain, a lower elastic modulus, and superior crack resistance [15]. In contrast, concrete generally exhibited lower fluidity and noticeable shrinkage, with relatively slow strength development. Therefore, vibration was typically required during casting, which imposed higher demands on construction space and operating conditions. Grout was mainly used for grouted sleeve connections, grout layers surrounding reinforcement, and the repair and strengthening of existing structures. Concrete was primarily used in the construction of main load-bearing structural components, such as beams, slabs, and columns. Grouted sleeve connections are the most widely used connection method in high-rise precast concrete structures [16]. Zhao et al. [17] examined the impact of microstructural alterations in the grout on the bond performance between the steel rebars and the grout by performing tensile tests on 28 grouted sleeve connection specimens following exposure to high temperatures. The findings showed that the main reason for the deterioration of bond strength was the breakdown of calcium hydroxide and calcium silicate hydrate. The main elements affecting the bond strength between the grout and the steel rebars are typically thought to be the impacts of sleeve constriction and the compressive strength of the grouting substance. Kim [18] measured the increase in bond strength brought about by sleeve confinement and suggested a way to calculate the confinement stress that the sleeve provided. According to the experimental data, the measured value was 1.007 times the calculated value. Zheng et al. [19] developed a bond strength prediction model for the steel bar–grout interface that takes the confinement effect into account after examining the impact of the confinement mechanism on the tensile performance of grouted sleeve connections. The calculated results were in good agreement with the experimental data. Ling et al. [20] proposed a bond strength prediction method based on sleeve dimensions and confinement stress, with a prediction error within 10%. However, the grout at the joint position of precast columns is frequently in a state of partial or even insignificant lateral confinement in real-world engineering applications. According to Liu et al. [4], the failure mechanism of steel bar–grout pull-out specimens was greatly influenced by both the steel rebar diameter and the bond length. However, little is known about how well grout and steel rebar connect after elevated temperatures or how bar position affects this relationship. Therefore, in the absence of sleeve confinement, more research is required to determine the elements influencing the bond performance between grout and steel rebar.
In this study, 54 steel bar–grout pull-out specimens were tested to investigate the effects of steel rebar position and elevated temperature on bond performance. Based on the experimental results, a bond strength calculation method and a bond–slip model under unconstrained conditions were developed. These findings provide a theoretical basis for the finite element analysis of prefabricated member joints and contribute to ensuring their fire safety performance.
2. Materials and Methods
2.1. Materials
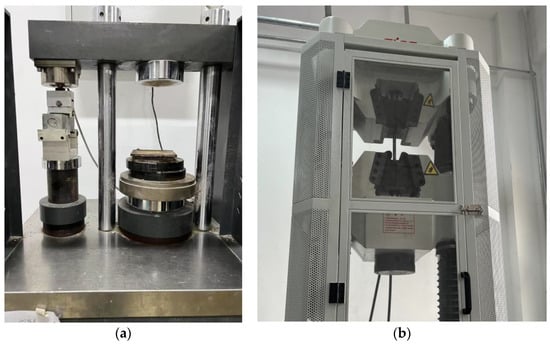
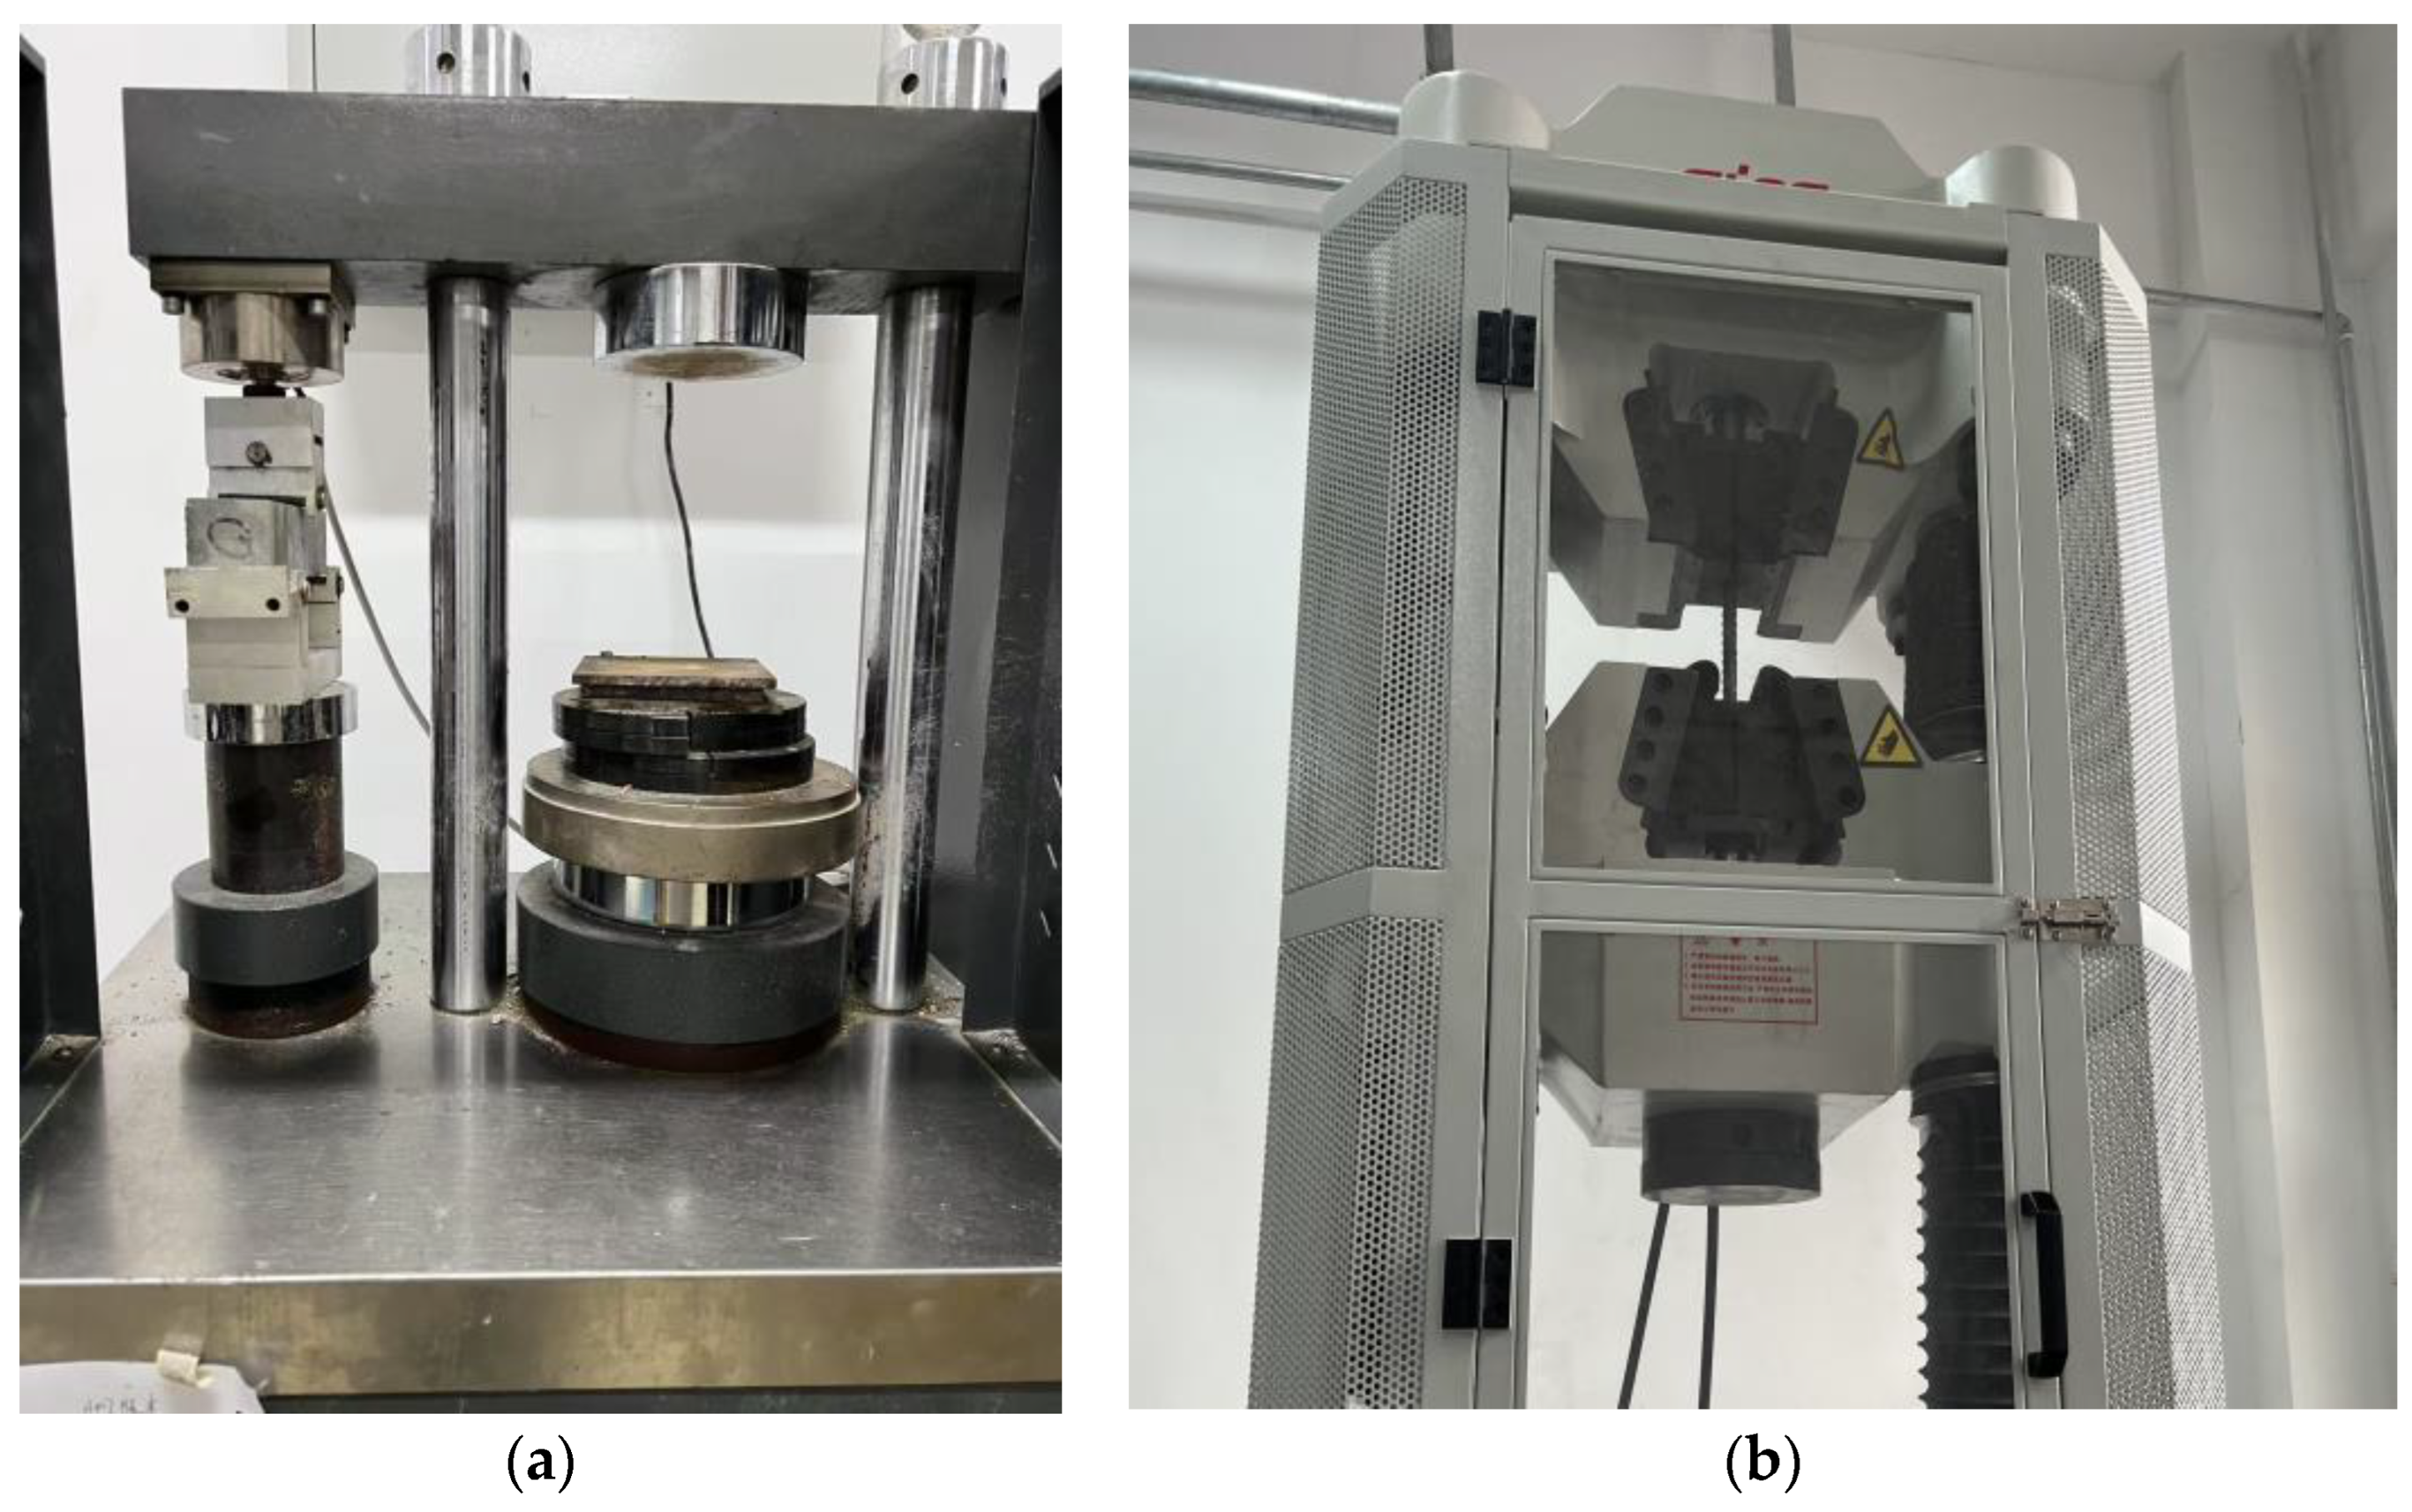
A85 high-strength non-shrinkage cement-based grout was used in this study. For details on the relevant performance of the A85 mortar, see Liu’s study [21]. The compressive and flexural strength tests followed Chinese standard GB/T 17671-2021 and JG/T 408-2019 were conducted on grout prism specimens with dimensions of 40 mm × 40 mm × 160 mm [22,23]. The maximum test force is 10 kN for the flexural system and 300 kN for the compressive system, as shown in Figure 1a. At ambient temperature, the compressive strength and flexural strength were 95.3 MPa and 13.8 MPa, respectively. The steel rebar of the specimen was HRB400 with a nominal diameter of 16 mm. According to the ISO6892-1 [24], the mechanical properties of the steel rebars were determined through tensile tests. The maximum applied load was limited to 1000 kN, as shown in Figure 1b. The measured yield strength and ultimate tensile strength at ambient temperature were 400.4 MPa and 551.9 MPa, respectively.
Figure 1.
Mechanical property test of materials. (a) Grout; (b) Steel rebar.
2.2. Specimen Design
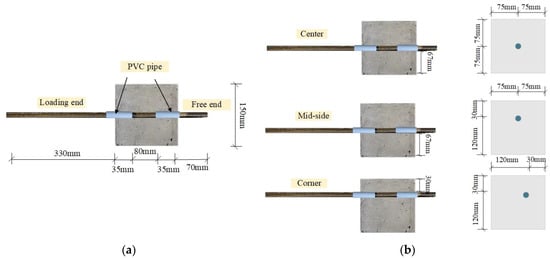
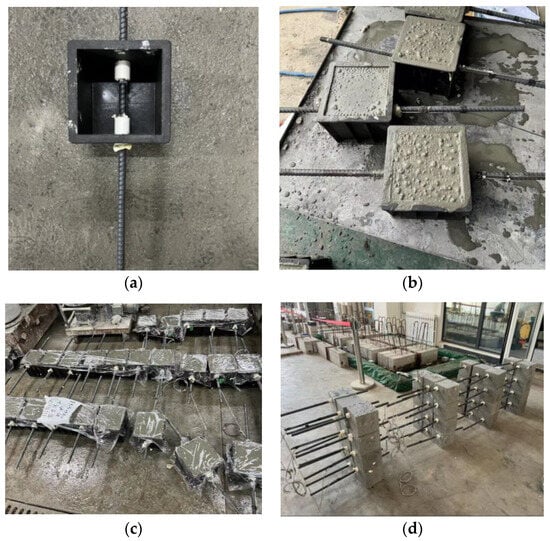
Based on the stress state of steel rebar in engineering practice, 54 cubic specimens (150 × 150 × 150 mm) were prepared in accordance with GB/T 50081-2019 [25]. The design parameters of this study included temperature (20, 200, 300, 400, 500, and 600 °C) and steel rebar position (center, mid-side, and corner). The design parameters of the test specimens are detailed in Table 1. The bond length of the steel rebar was taken as 5d (i.e., bond length la = 5 × 16 mm = 80 mm) [12]. This bonded length ensures an approximately uniform bond stress distribution along the bonded zone, effectively avoids anchorage failure or steel yielding, and facilitates accurate characterization of the local bond–slip relationship between the reinforcement and grout [4]. Under these conditions, the bond stress distribution can be reasonably approximated as uniform, enabling the peak bond stress to be calculated from the measured peak load. Nevertheless, bond stress is inherently non-uniform along the bonded length in practice. Therefore, the uniform bond stress assumption may introduce deviations. The longitudinal reinforcement was placed at three different positions, having a total of 650 mm, with a loading-end length of 330 mm and a free-end length of 70 mm, as shown in Figure 2. The fabrication process is illustrated in Figure 3: (1) Holes with dimensions of 150 mm × 150 mm × 150 mm were punched on the opposite side of the mold. (2) The deformed steel bar was inserted through the preformed side hole and positioned inside the mold. (3) The grout was poured into the mold, vibrated uniformly, and the surface was leveled to form the specimen. PVC pipes were installed on both sides of the bonded section to control the bond length. PVC pipes, filled with fireproof cotton on the outside of the bonded segment to control the bond length and to avoid stress concentration caused by high-temperature damage, were installed. The PVC pipe has an inner diameter of 22 mm and a length of 50 mm. The mean value was calculated from test results of three samples under identical conditions.
Table 1.
Main parameters of specimens.
Figure 2.
Sketch of pull-out specimens. (a) Specimen dimensions; (b) Three types of the specimens.
Figure 3.
Production process. (a) Making template; (b) Vibrating; (c) Forming; (d) Specimen completion.
2.3. Heating and Cooling Program
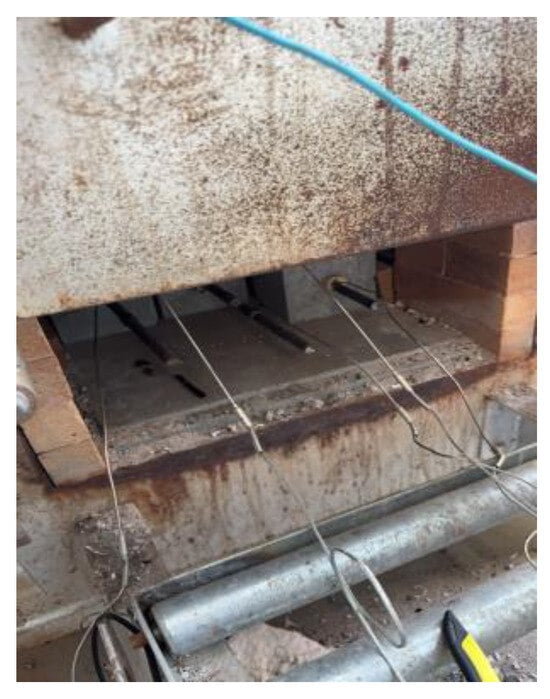
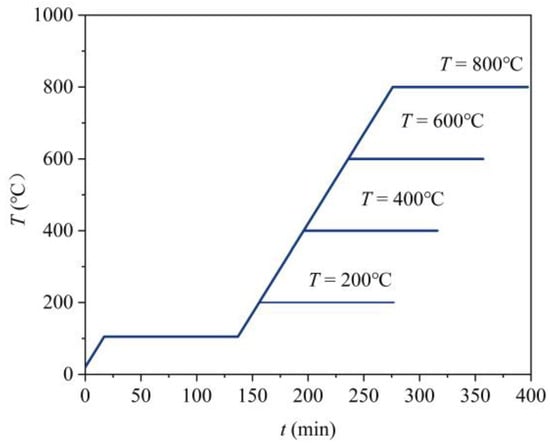
The SX2–12–12 heating system for the heating tests comprised a heating furnace and a heating controller, as shown in Figure 4. The furnace used was an RX3–45–9 box-type furnace with a power rating of 45 kW and working dimensions of 1200 × 600 × 400 mm [26]. The heating rate of specimens was set to 5 °C/min. First, the specimens were heated to 105 °C and maintained for 120 min. Subsequently, the temperature was increased to the target level and held constant for 120 min. The heating curve is illustrated in Figure 5. Finally, the specimen was promptly removed from the high-temperature furnace and allowed to cool naturally until it reached room temperature. A K-type thermocouple was inserted into the PVC pipe to monitor the temperature of the steel rebar in the bonded section.
Figure 4.
High temperature experimental device.
Figure 5.
Heating curve.
2.4. Test Setup
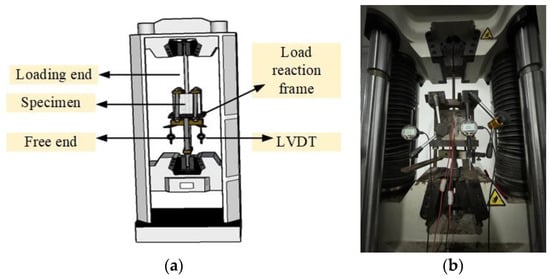
The pull-out test is a widely used method for investigating bond behavior, in which specimens are composed of a steel reinforcing bar embedded in a cementitious material cube. The test setup consisted of a microcomputer-controlled electro-hydraulic servo testing machine from Shenzhen, China (WAW-1000) with a maximum load capacity of 1000 kN, as illustrated in Figure 6. The loading device was a custom-designed frame for eccentric pull-out tests. It consisted of high-strength steel plates, restraining plates, and high-strength bolts to ensure specimen stability. This configuration enabled the specimen to undergo an eccentric pull-out test, thereby simulating the actual stress conditions encountered in engineering practice [26]. The specimen load was measured using the testing machine sensor, while the free-end slip was recorded by two LVDTs (linear variable differential transformers). The actual slip was obtained by averaging the measured displacement values. Displacement data were recorded and averaged to obtain the actual slip of the specimen. Displacement-controlled loading was adopted, with a loading rate of 0.356 mm/min. The test was terminated when one of the following conditions is met: (1) the displacement of the free end of the steel bar reaches or exceeds 20 mm; (2) the residual load is less than or equal to 0.3 times the peak load.
Figure 6.
Pull-out test device. (a) Schematic diagram; (b) Experimental diagram.
3. Results
3.1. Experimental Phenomena After Elevated Temperatures
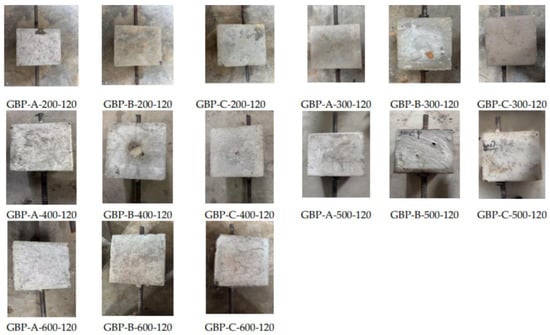
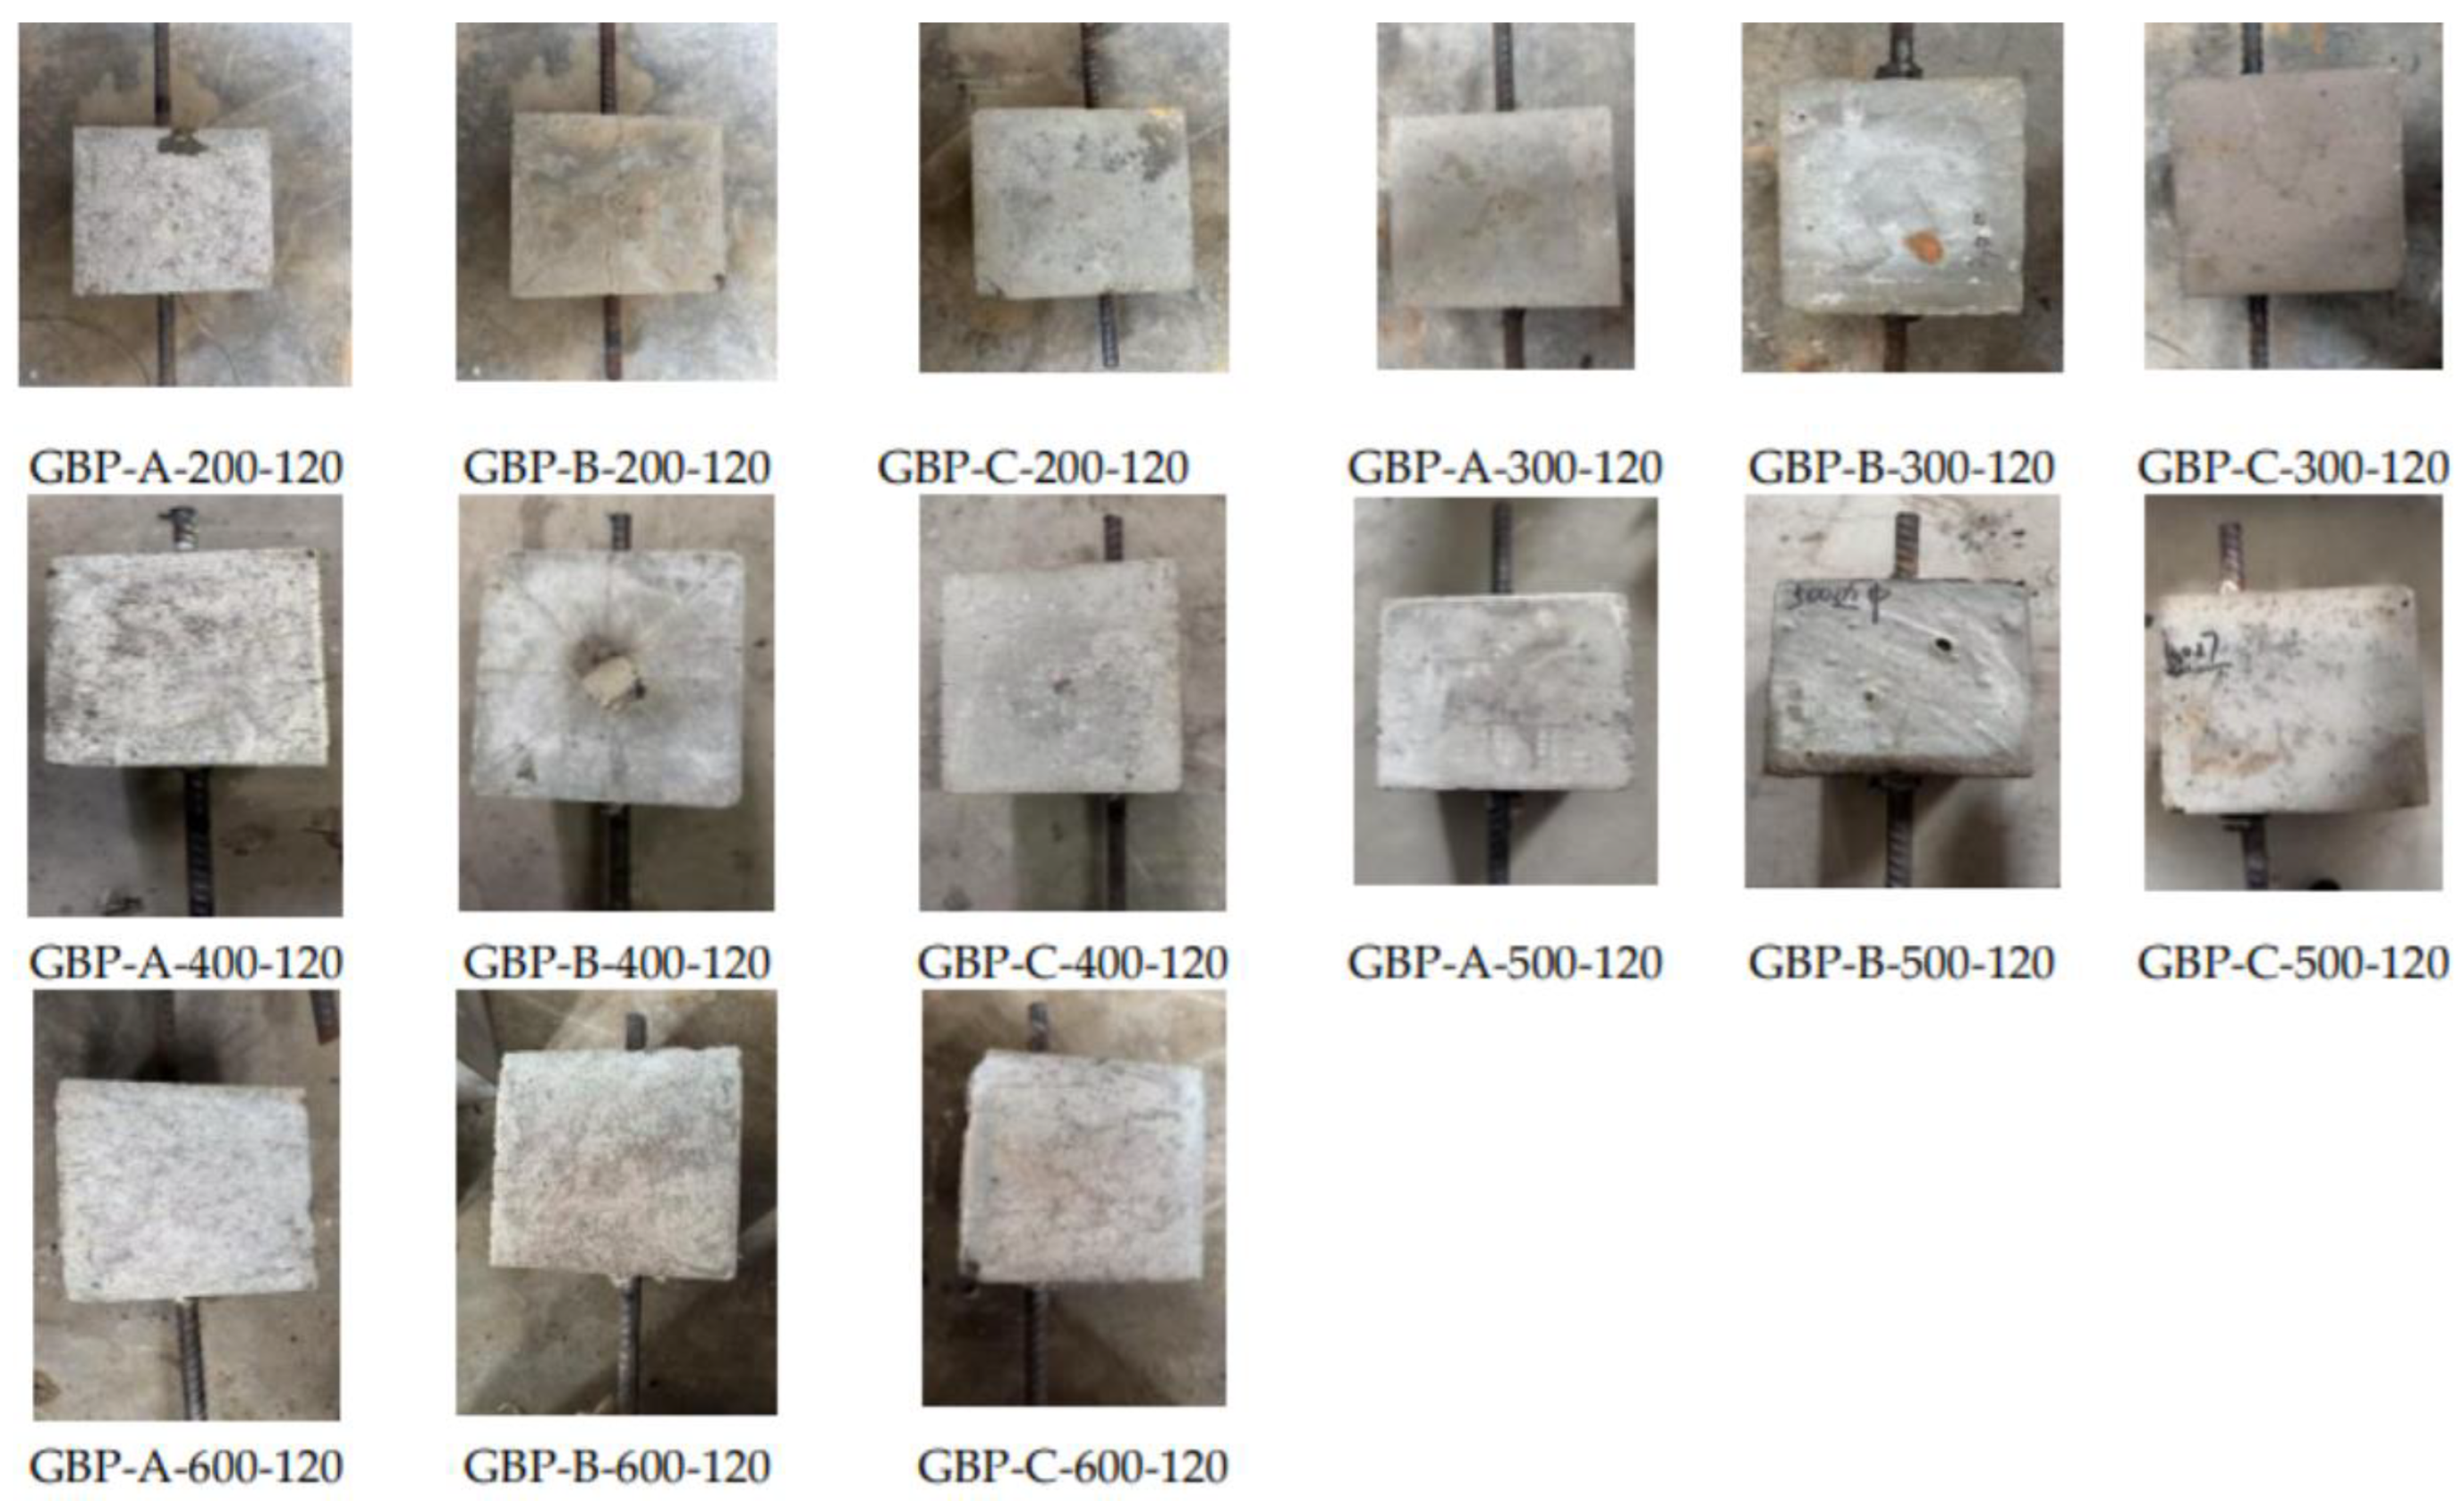
As the temperature increased, the surface color of the specimens changed from cyan gray to grayish white. In addition, numerous cracks with small widths, random distribution, and shallow depth were observed on the specimen surfaces, as shown in Figure 7. Taking the center specimen as an example, the maximum crack width measured using a crack observation instrument is 0.14 mm at 200 °C. The crack width increased to 0.19 mm at 300 °C, 0.22 mm at 400 °C, and 0.25 mm at 500 °C, reaching 0.33 mm at 600 °C. Surface thermal cracks on the specimen became denser and wider due to increasingly pronounced high-temperature damage. This occurred because rising temperatures led to decreased grout strength, stress concentration, and thermal cracking caused by temperature gradients. High-temperature exposure caused thermal expansion differences, which led to interfacial cracking between materials. The mismatch in expansion accelerated crack propagation and further reduced bond strength. The location of the steel bar also influenced the distribution of thermal cracks. At 500 °C, compared with the maximum crack width of the central specimen, the crack widths of the mid-side specimen and the corner specimen increased by 16.0% and 24.0%, respectively. Compared with specimens containing different locations of steel rebars but subjected to the same temperature, those with bars positioned at the corners exhibited deeper thermal cracks and a greater number of cracks. This behavior can be attributed to the reduced cover thickness and shortened heat transfer path, which result in a higher heating rate and peak temperature in the bonded section of the reinforcement, thereby aggravating high-temperature damage to the specimens. These results indicated that high temperature-induced initial damage in the specimens, and that the position of the reinforcing bar significantly affected the extent of thermal stress-related damage.
Figure 7.
Influence of high temperature on the apparent phenomenon of specimens.
3.2. Failure Mode
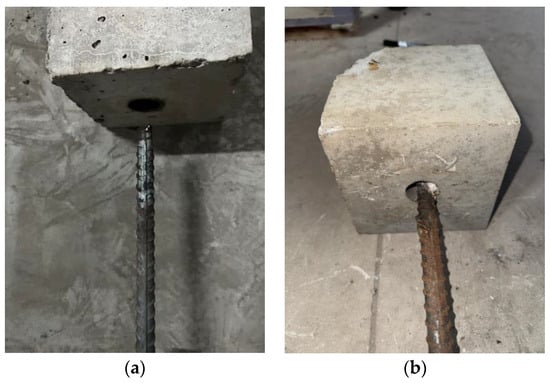
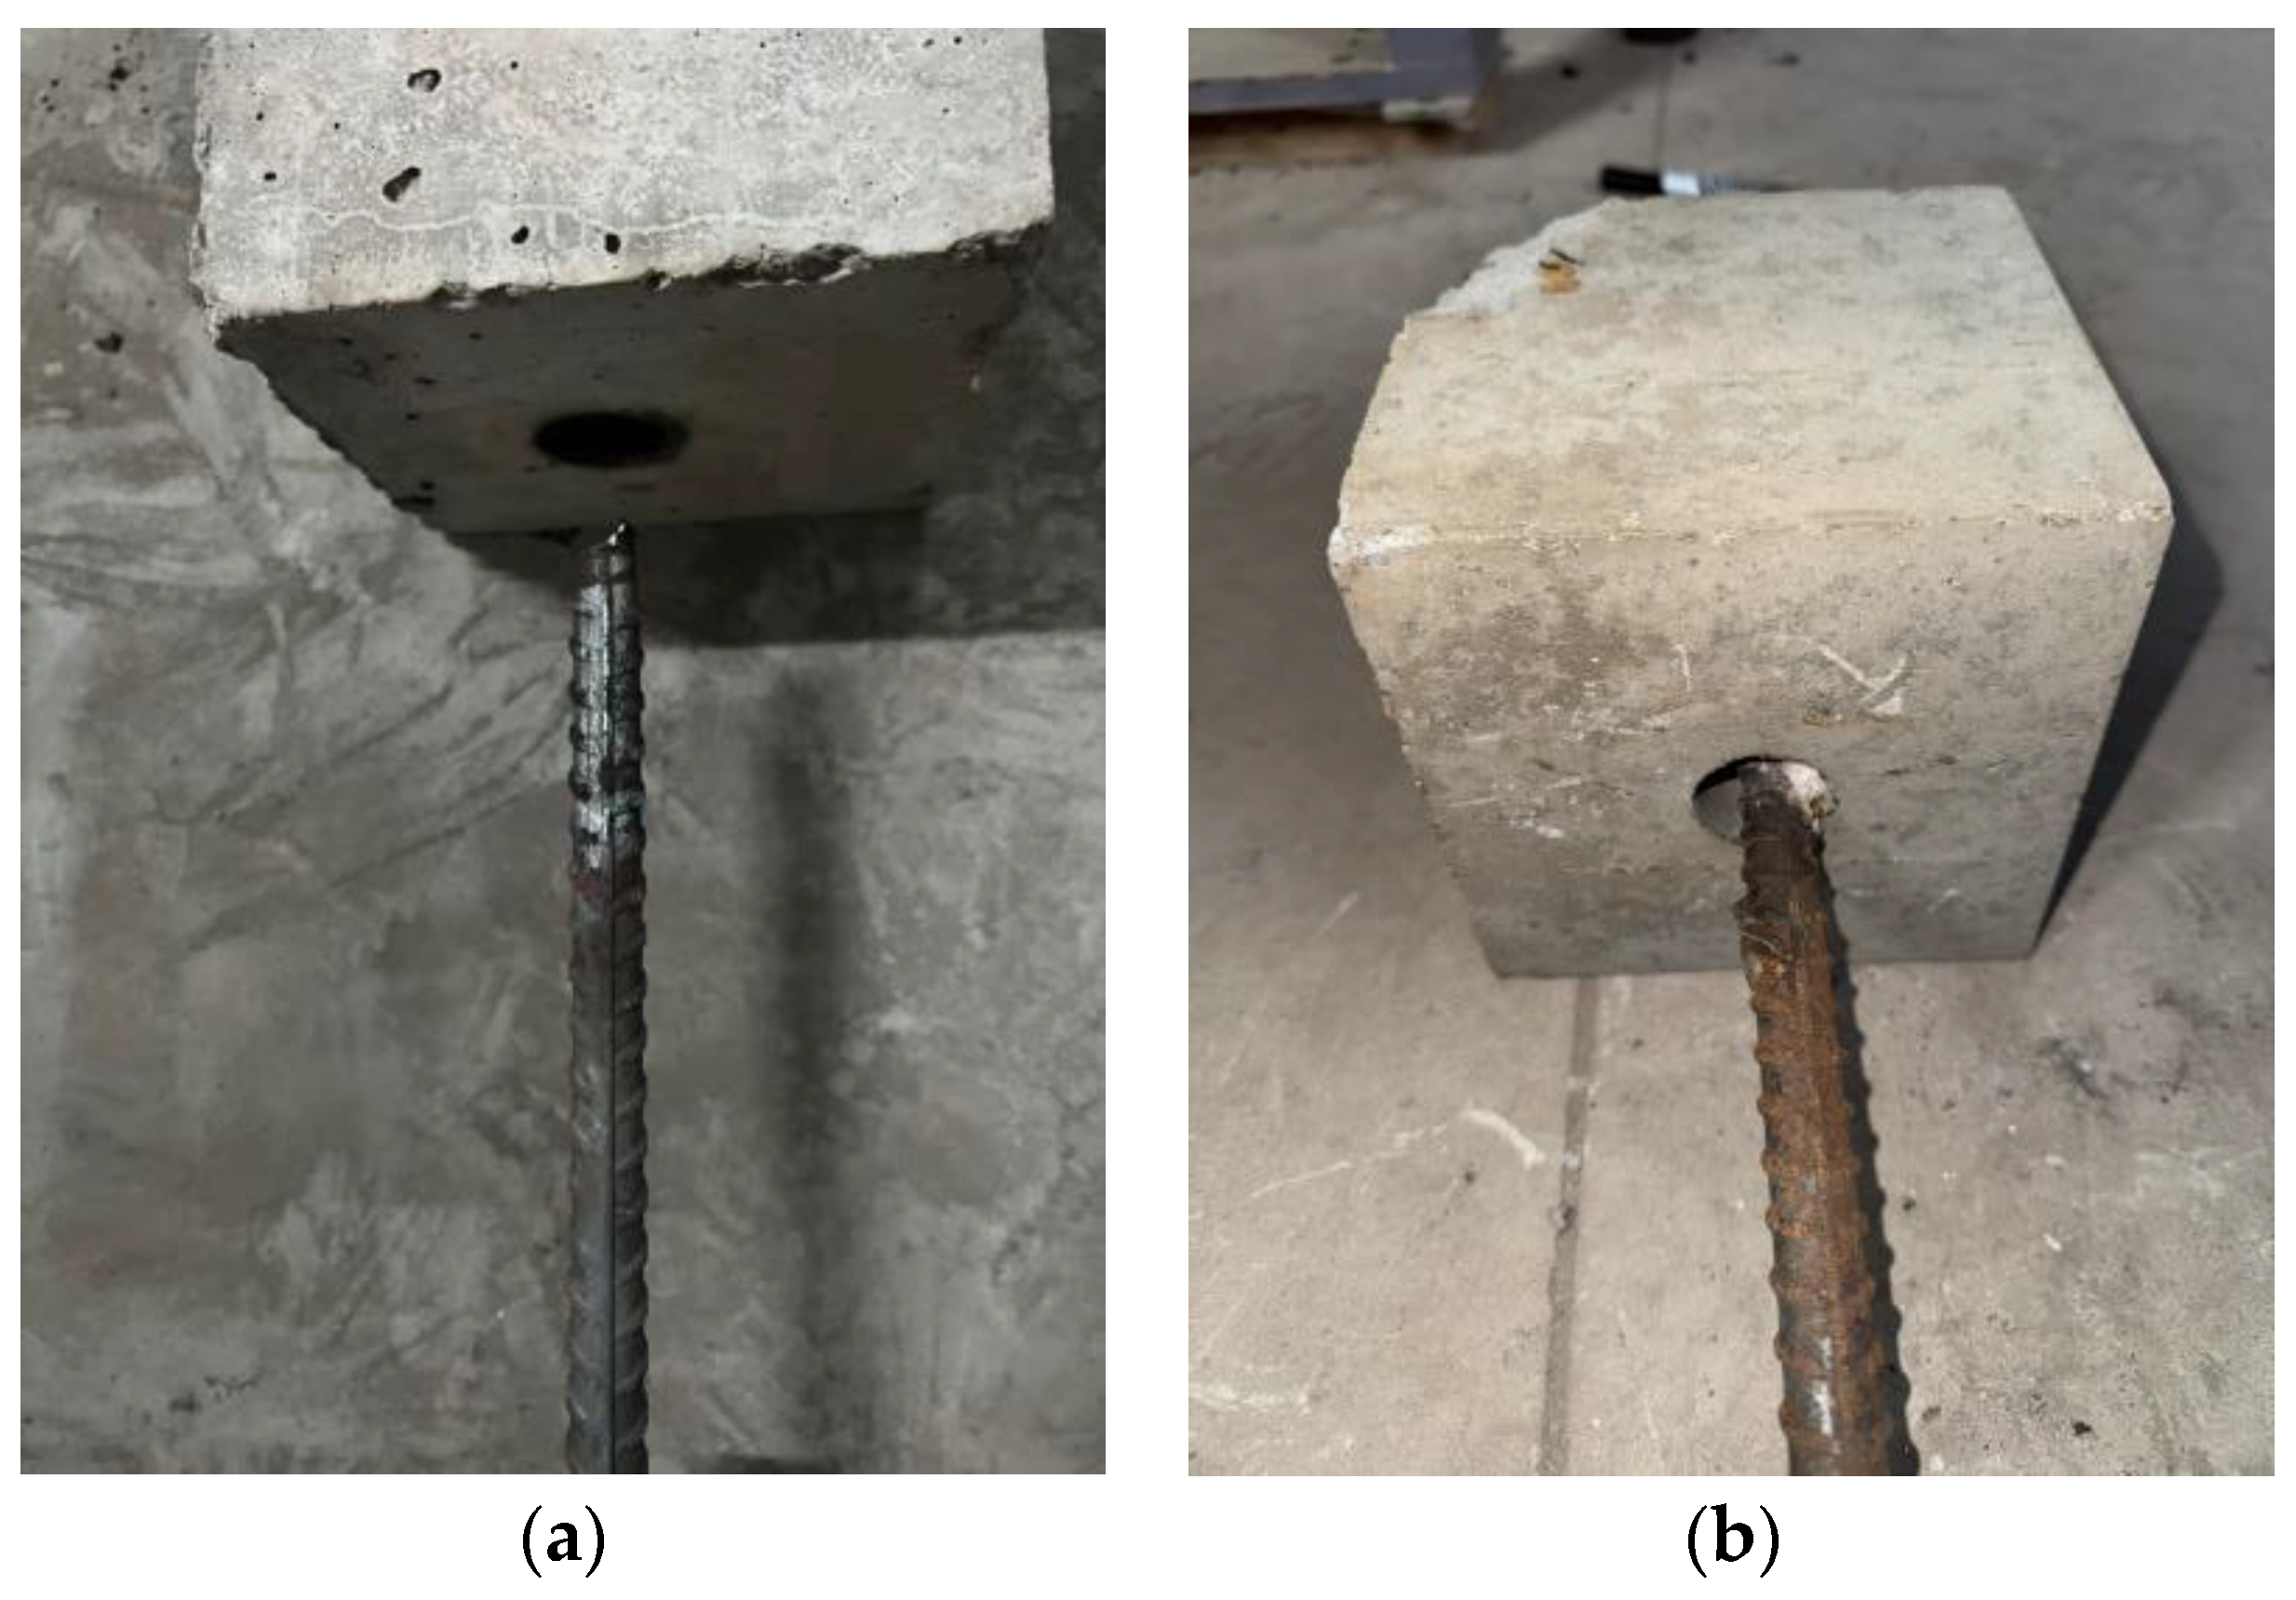
Two failure modes are observed in all specimens: steel-rebar fracture and pull-out failure. When the steel-rebar fractured, the specimen was accompanied by a loud noise, and pronounced tightening was observed at the fracture location, as shown in Figure 8a. In contrast, when pull-out failure occurred, the steel rebar gradually slid out of the specimen, as shown in Figure 8b. Fracture failure of the steel rebar indicated that the bond strength between the steel rebar and the grout exceeded the tensile strength of the steel rebar itself. Prior to failure, the steel rebar experienced elasticity, yielding, strengthening, and tightening, which was characteristic of ductile failure. Pull-out failure of the steel rebar indicated that the bond strength between the steel rebar and the grout was lower than the tensile strength of the steel rebar. The specimen remained structurally intact, and the crack width was relatively small at failure.
Figure 8.
Failure mode. (a) Steel-rebar fracture; (b) Pull-out failure.
The influence of steel rebar position on the bond performance between the steel rebar and the grout was mainly attributed to the different confinement states of the grout surrounding the steel rebar. In this study, the variations in protective layer thickness corresponding to the three steel rebar positions were defined as follows: for the center position, cmin = cmax = 67 mm; for the mid-side position, cmin = 30 mm and cmax = 67 mm, and for the corner position, cmin = cmax = 30 mm. The thickness of the protective layer was directly proportional to the radial confining force. An increase in protective layer thickness enhanced strength. Specimens with strong confinement tended to fail by steel bar fracture, whereas specimens with insufficient confinement and reduced bond strength predominantly exhibited steel rebar pull-out failure. When the specimen temperature reached 500 °C, steel rebar located at the center and mid-side positions failed by steel rebar fracture, whereas those at the corner position failed by pull-out failure. At ambient temperature, specimens with different steel rebar positions all failed by steel rebar fracture. After exposure to high temperature (600 °C), the bond strength significantly decreased, and the failure mode of all specimens shifted to steel bar pull-out failure. High-temperature exposure caused thermal expansion differences, which led to interfacial cracking between materials. The mismatch in expansion accelerated crack propagation and further reduced bond strength. Higher temperatures also decreased friction and mechanical interlock, making steel rebar extraction easier. These results indicated that high temperature exposure and the steel rebar position at side corners significantly deteriorated the bond performance, thereby exerting a pronounced influence on the failure mode of the specimens.
3.3. Load-Slip Curves
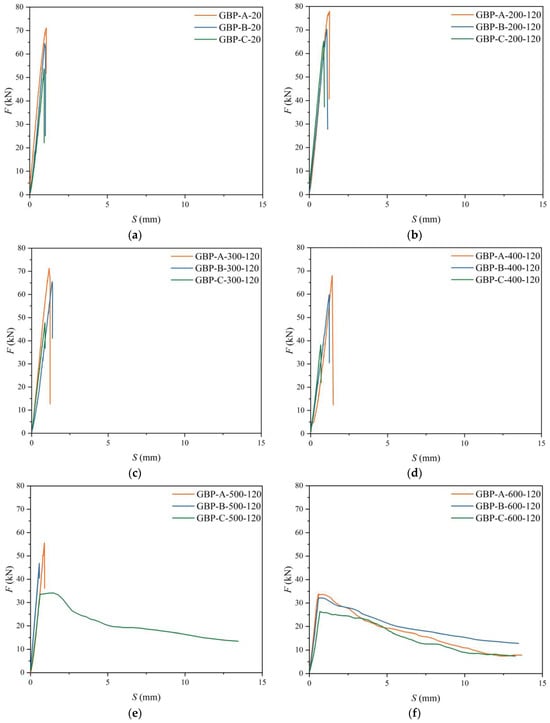
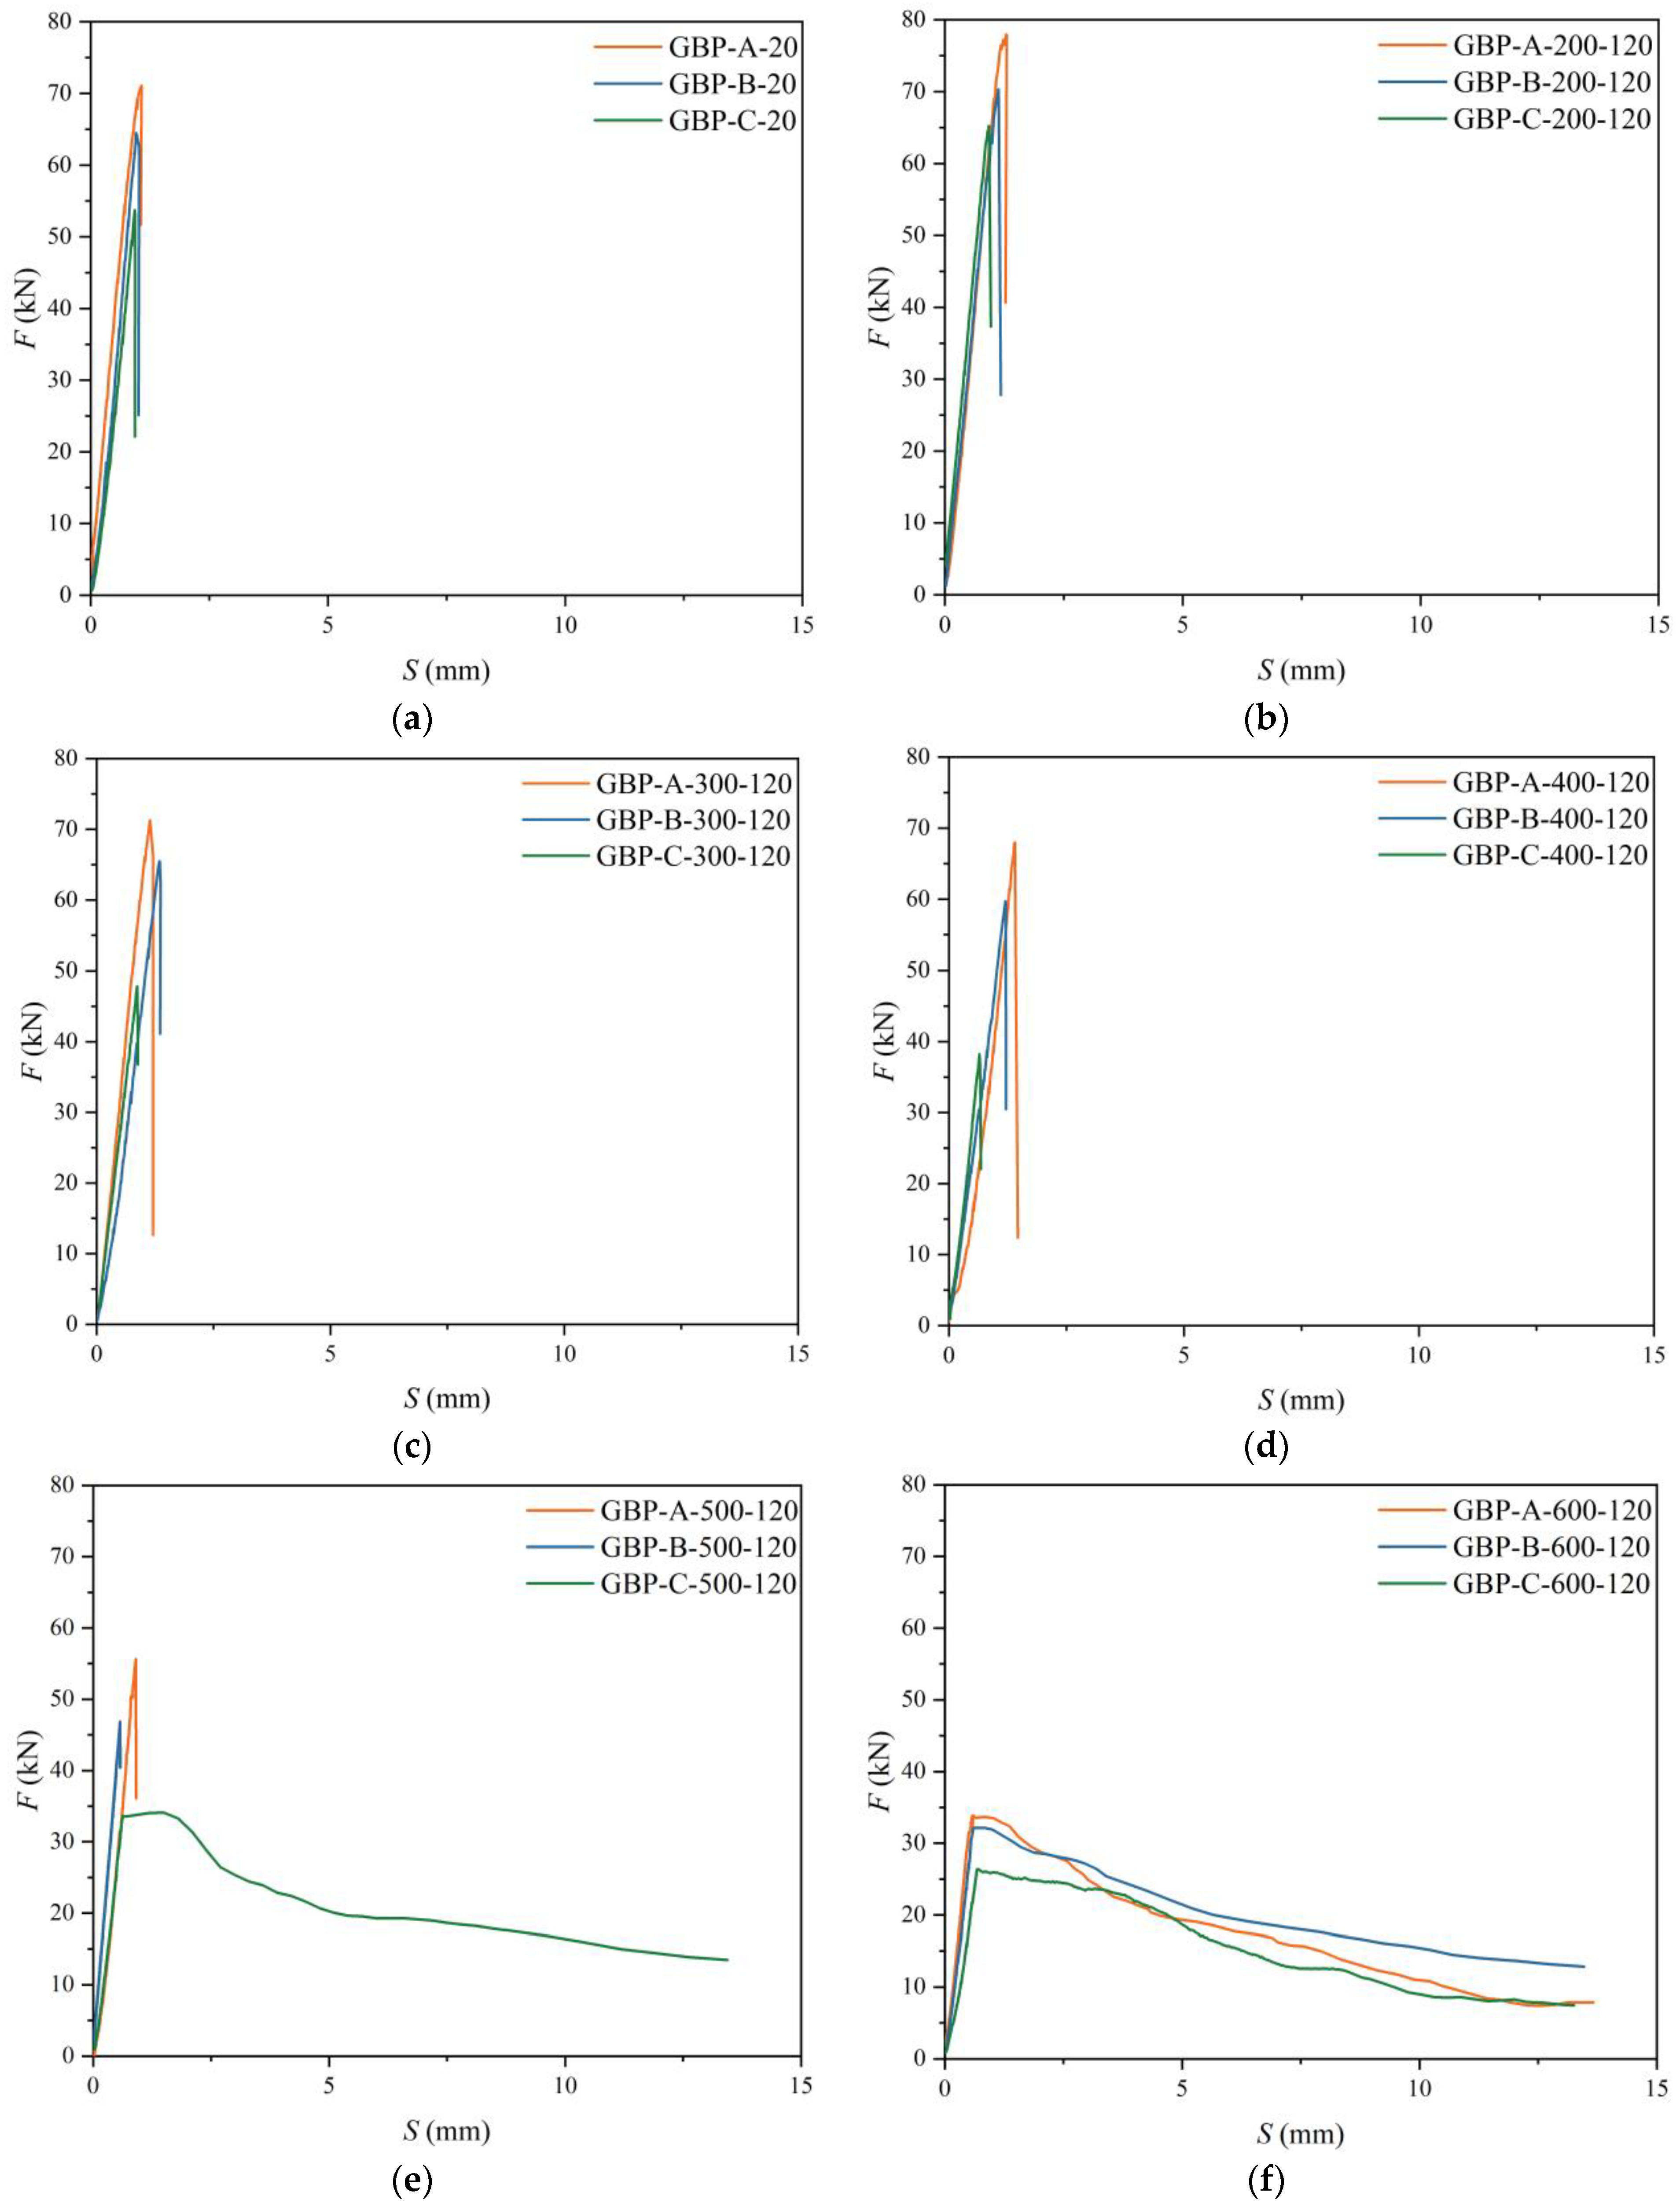
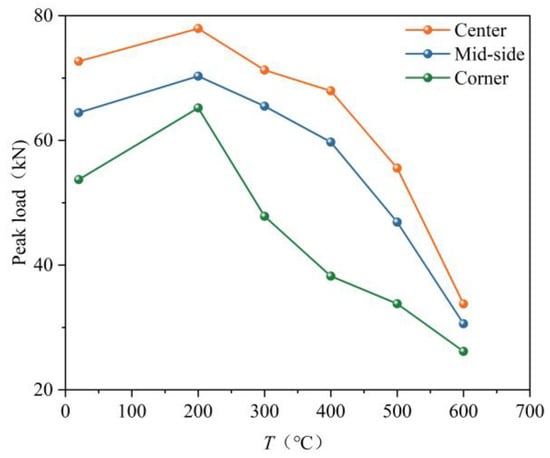
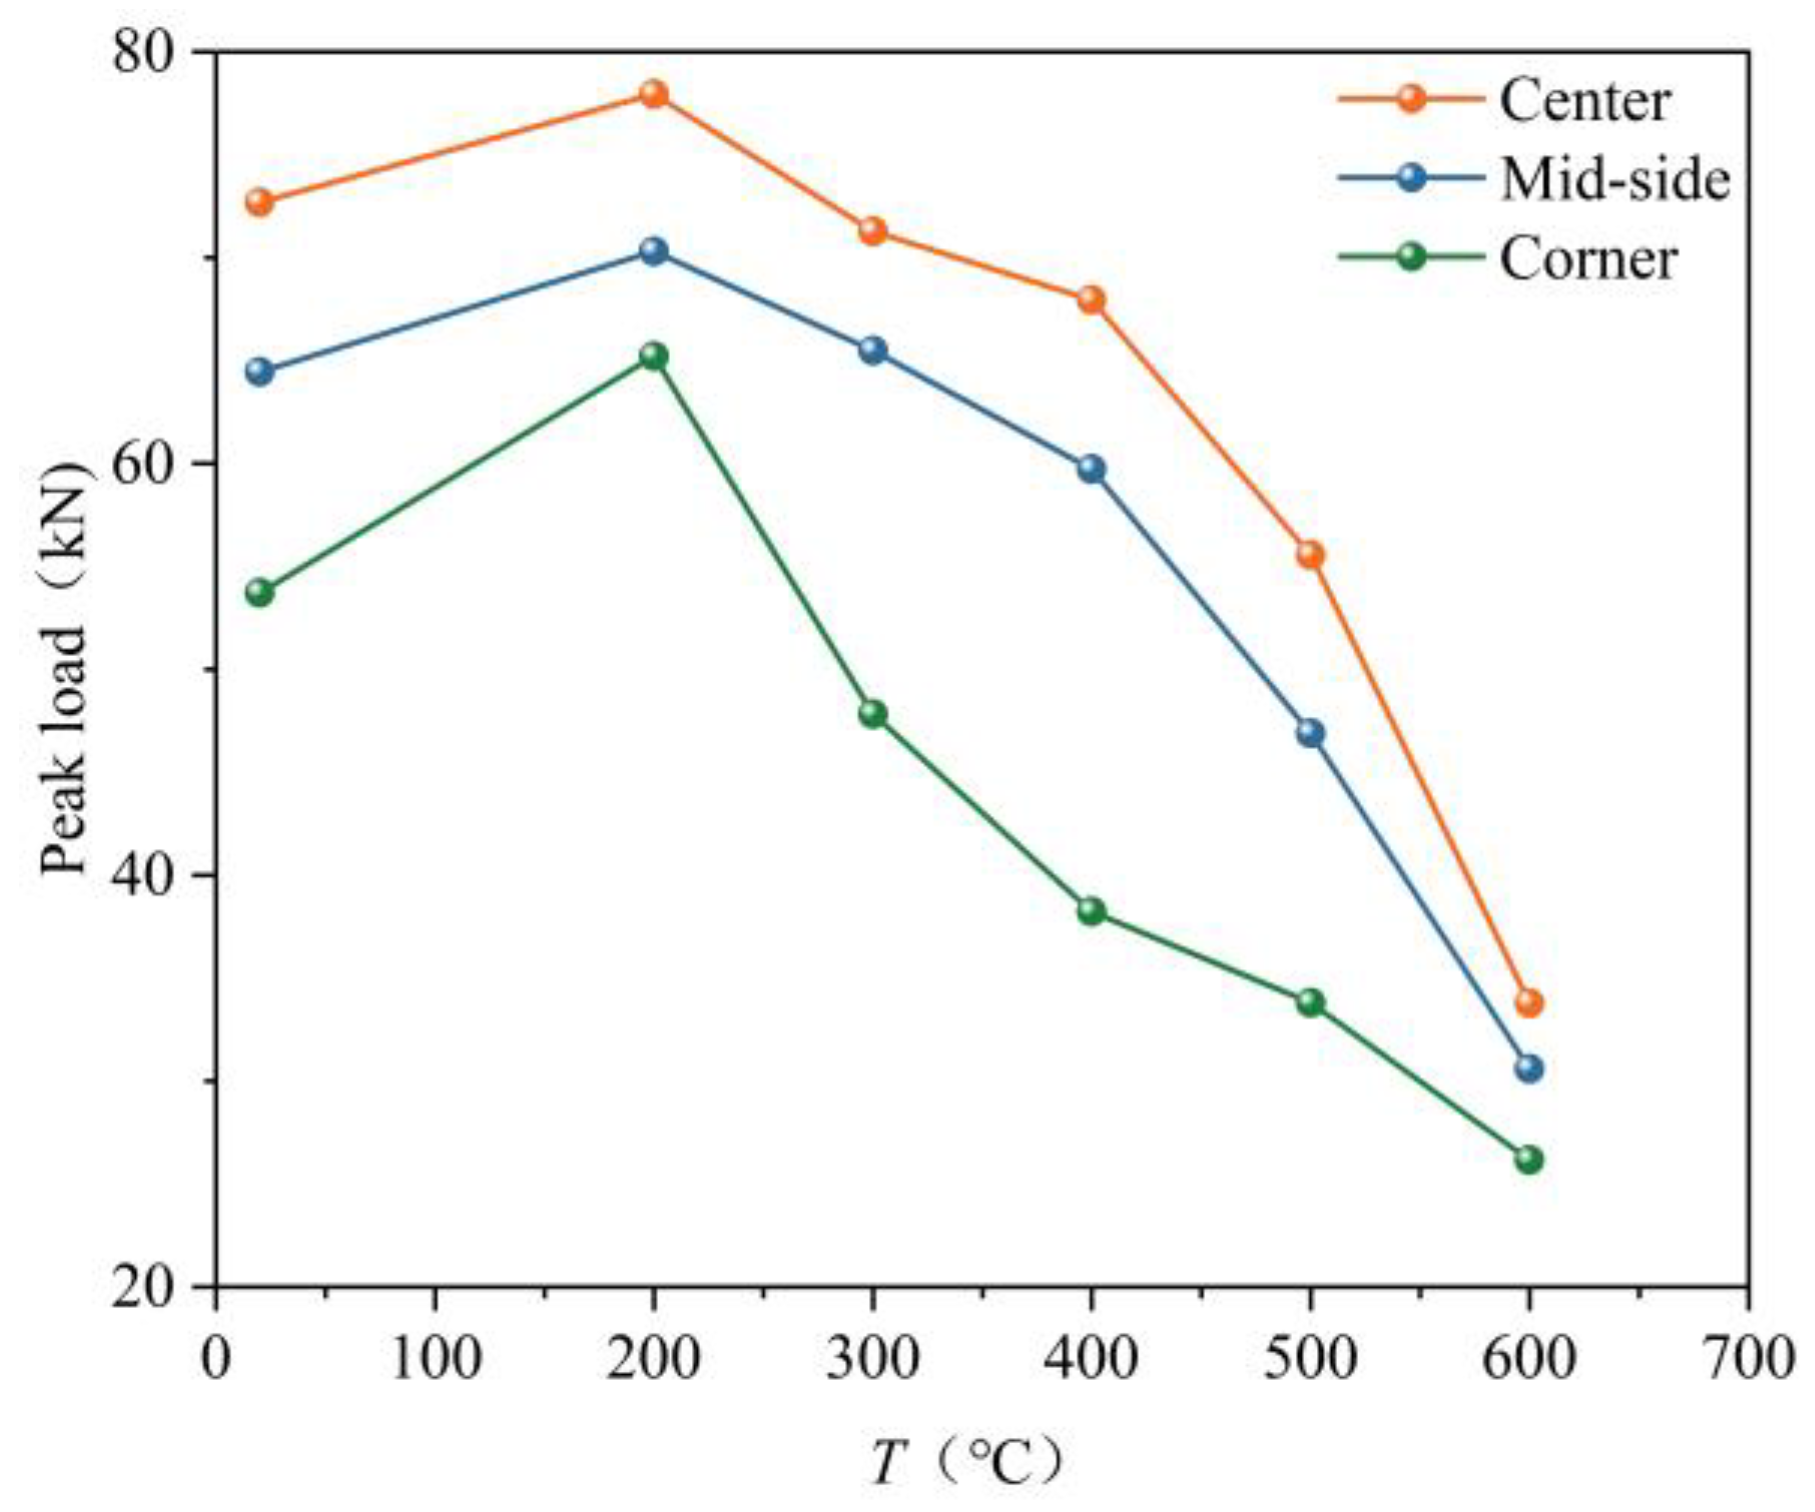
Two distinct types of load–slip curves are observed in Figure 9. The ascending branches were generally similar, whereas the primary differences appeared in the descending branches after the peak load was reached. When steel rebar fracture occurred, the descending branch exhibited an approximately linear drop in load. In contrast, for pull-out failure of the steel bar, a plateau segment appeared once the peak load was attained. As the slip increased, the load decreased in a nearly linear manner. When the slip reached approximately 5 mm, the rate of load reduction decreased, and the load remained nearly constant. As shown in Figure 10, steel bar pull-out failure occurred in specimens GBP-C-500-120, GBP-A-600-120, GBP-B-600-120, and GBP-C-600-120, whereas steel bar fracture was observed in the remaining specimens. Compared with specimen GBP-A-500-120, the ultimate load of GBP-B-500-120 decreased by 15.76%, whereas that of GBP-C-500-120 decreased by 39.26%. When pull-out failure was induced by high temperature and the steel bar position, the ultimate load of the specimen was significantly reduced, exhibiting a pronounced decrease. At ambient temperature, the ultimate displacements of the corner and side-middle specimens were 56.71% and 58.54%, respectively, of that of the central specimen (1.64 mm). Under identical loading conditions and for the same failure mode, the center specimen exhibited the largest ultimate displacement, followed by the side-middle specimen, while the corner specimen showed the smallest value. High temperature and reinforcement position showed a strong correlation with the ultimate load and displacement of the specimens.
Figure 9.
Load-slip curves. (a) GBP-X-20; (b) GBP-X-200-120; (c) GBP-X-300-120; (d) GBP-X-400-120; (e) GBP-X-500-120; (f) GBP-X-600-120.
Figure 10.
Comparison of peak load of each specimen.
3.4. Peak Load
As the temperature increased, the peak load of the specimen initially increased and then decreased. The peak load reached its maximum at 200 °C. When the temperature exceeded 400 °C, the bond strength decreased rapidly; at 600 °C, it was reduced by 56.63% compared with that at 200 °C. The deterioration effect induced by temperature was more pronounced. The specimen with center positioned steel rebar exhibited the highest peak load, whereas the specimens with mid-side and corner steel rebar showed lower peak loads. As shown by the data in Figure 10, when the peak load of the center specimen at each temperature was taken as the reference, the peak load ratios of the mid-side and corner specimens at 200 °C were 90.21% and 83.68%, respectively. At 400 °C, the corresponding peak load ratios decreased to 87.89% and 56.28%, respectively. At 500 °C, the peak load ratios further declined to 84.24% and 60.74%, respectively. At 600 °C, the peak load ratios increased slightly to 90.53% and 77.45%, respectively. The results indicated that, in cases where steel rebar fracture occurred, the peak load of the specimen gradually decreased as the temperature increased. Moreover, the ratios of the peak loads of the mid-side and corner specimens to that of the center specimen also decreased with increasing target temperature. After exposure to different high temperatures, the peak load of the center specimen remained higher than that of the mid-side and corner specimens. When the temperature exceeded 200 °C, the difference in peak load between the center specimen and the corner specimen increased rapidly with temperature, but gradually decreased beyond 400 °C. This was because when the temperature exceeded 400 °C, the peak load of the specimen was governed primarily by high-temperature effects, and the influence of steel rebar position on the peak load diminished. When pull-out failure occurred in all specimens at 600 °C, the peak load of specimens with different steel rebar positions was significantly reduced, primarily due to the change in failure mode. Consequently, the differences in peak load among specimens at different steel rebar positions decreased, and the peak load ratios of the mid-side and corner specimens to the center specimen increased with increasing temperature. The test results indicated that both high temperature and steel rebar position significantly influenced the peak load of the specimen. A reduction in the cover thickness provided limited restraint, leading to an increase in the peak temperature of the bonding section and a pronounced decrease in peak load under high-temperature exposure. Increasing the cover thickness delayed the heating rate of the bonding section and reduced its peak temperature. As the target temperature increased, the deterioration of the specimen peak load became more severe, while the peak load differences caused by steel rebar position exhibited a trend of rapid increase followed by gradual stabilization.
3.5. Comprehensive Bonding Performance
The above analysis of bonding performance indices is shown in Table 2. These results indicated that high-temperature exposure and steel bar location significantly influenced bond performance and the specimen failure mode.
Table 2.
Experimental results of specimens.
4. Bond–Slip Model
4.1. Mechanical Properties of Grout After Elevated Temperature
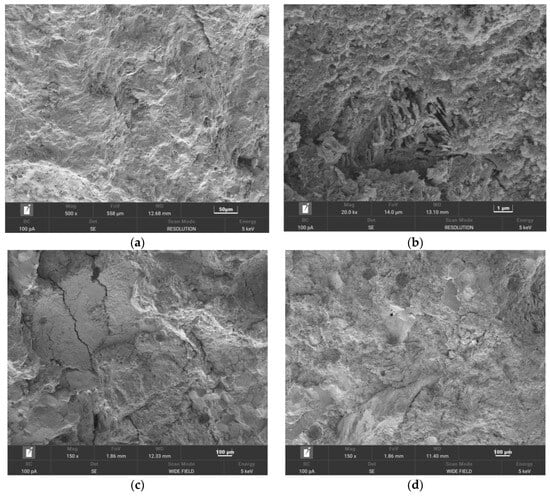
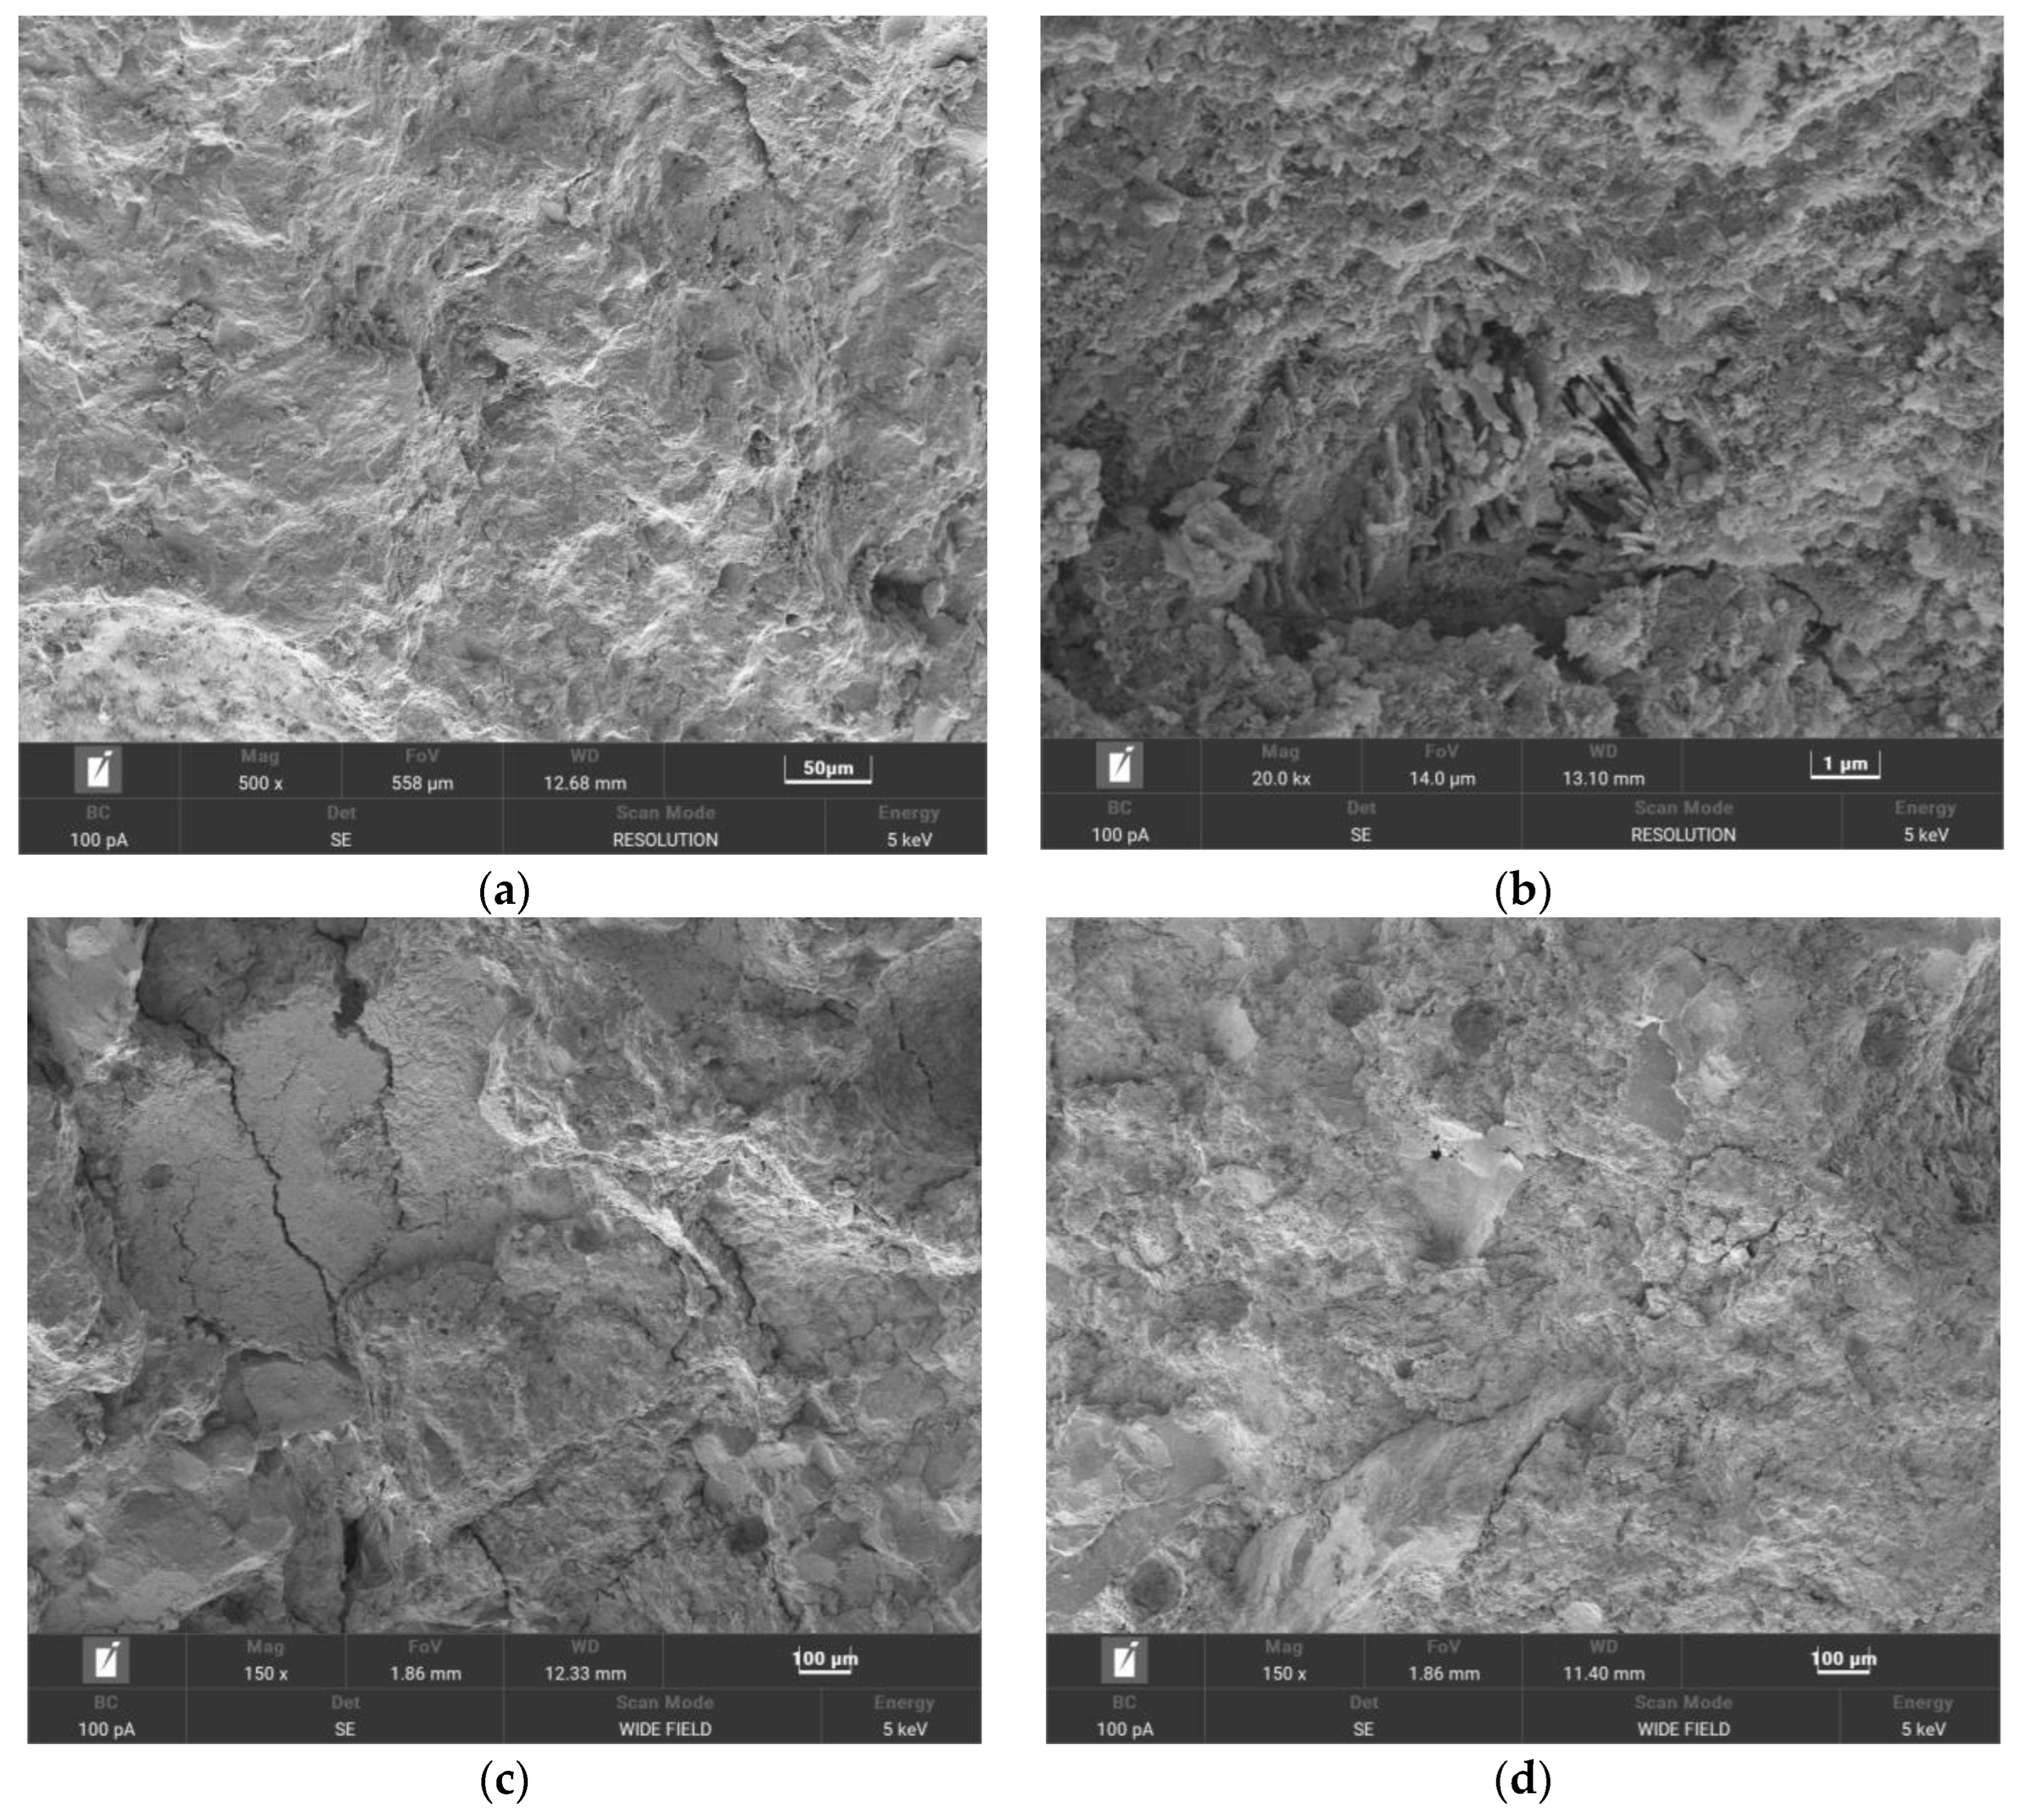
The grouting prisms (40 mm × 40 mm × 160 mm) were heated in a closed electric furnace at a rate of 5 °C/min. The specimens were first heated to 105 °C for 120 min, and subsequently heated to the target temperature and maintained at that temperature for 120 min. After natural cooling to ambient temperature, flexural and compressive strength tests were conducted at loading rates of 50 N/s and 2600 N/s, respectively. Table 3 presents the flexural and compressive strengths of the grout prisms after exposure to high temperatures. As the temperature increased, the compressive strength of the grout initially increased and then decreased. The relationship between bond strength and temperature was consistent with the trend observed in the grout specimen, as discussed in Section 3.4. These test results provided a basis for calculating the bond strength of subsequent specimens. The microscope parameters are provided in Figure 11 [12]. At ambient temperature, the cement paste exhibited a dense and intact microstructure without visible cracks. The aggregates exhibited strong interparticle bonding. At 200 °C, pores began to form due to dehydration of the cement gel. The removal of chemically bound water from the cement gel enhanced interparticle bonding and resulted in a denser microstructure, leading to a strength recovery and a 16.9% increase in compressive strength. At 400 °C, during the evaporation of free water, moisture loss caused the aggregate surface to become loose, while aggregate particles shrank and fragmented. Consequently, pore volume and porosity increased, flocculent hydration products formed, and the compressive strength decreased more rapidly than that of the grouting material. At 600 °C, the flocculent products became denser, and internal cracks expanded significantly. Meanwhile, the C–S–H gel in the grout decomposed, and calcium hydroxide in the cement matrix was transformed into calcium oxide. The results indicated that the microstructure of the grout transitioned from a dense to a loose state as temperature increased, thereby confirming the temperature-dependent evolution of its compressive strength. Based on the experimental results, a predictive formula describing the variation in compressive strength of the grout with temperature after high-temperature exposure was proposed, as shown in Equation (1), with an R2 value of 0.99.
where fc,gT is the compressive strength of the grout after elevated temperatures, MPa; fc,g20 is the compressive strength of the grout at ambient temperature, MPa; T is temperature, °C.
Table 3.
Mechanical properties of grouting material after high temperatures.
Figure 11.
Sem tests of grout. (a) 20 °C; (b) 200 °C; (c) 400 °C; (d) 600 °C.
4.2. Bond Strength and Peak Slip
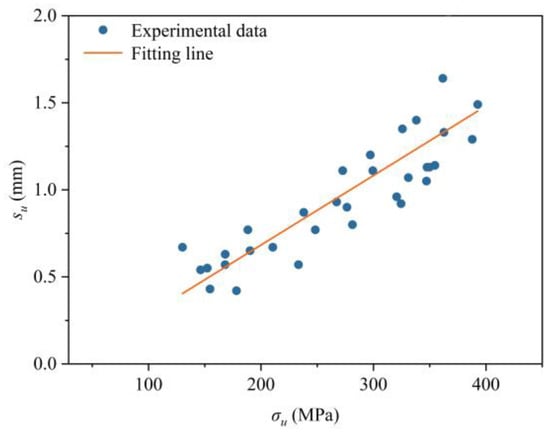
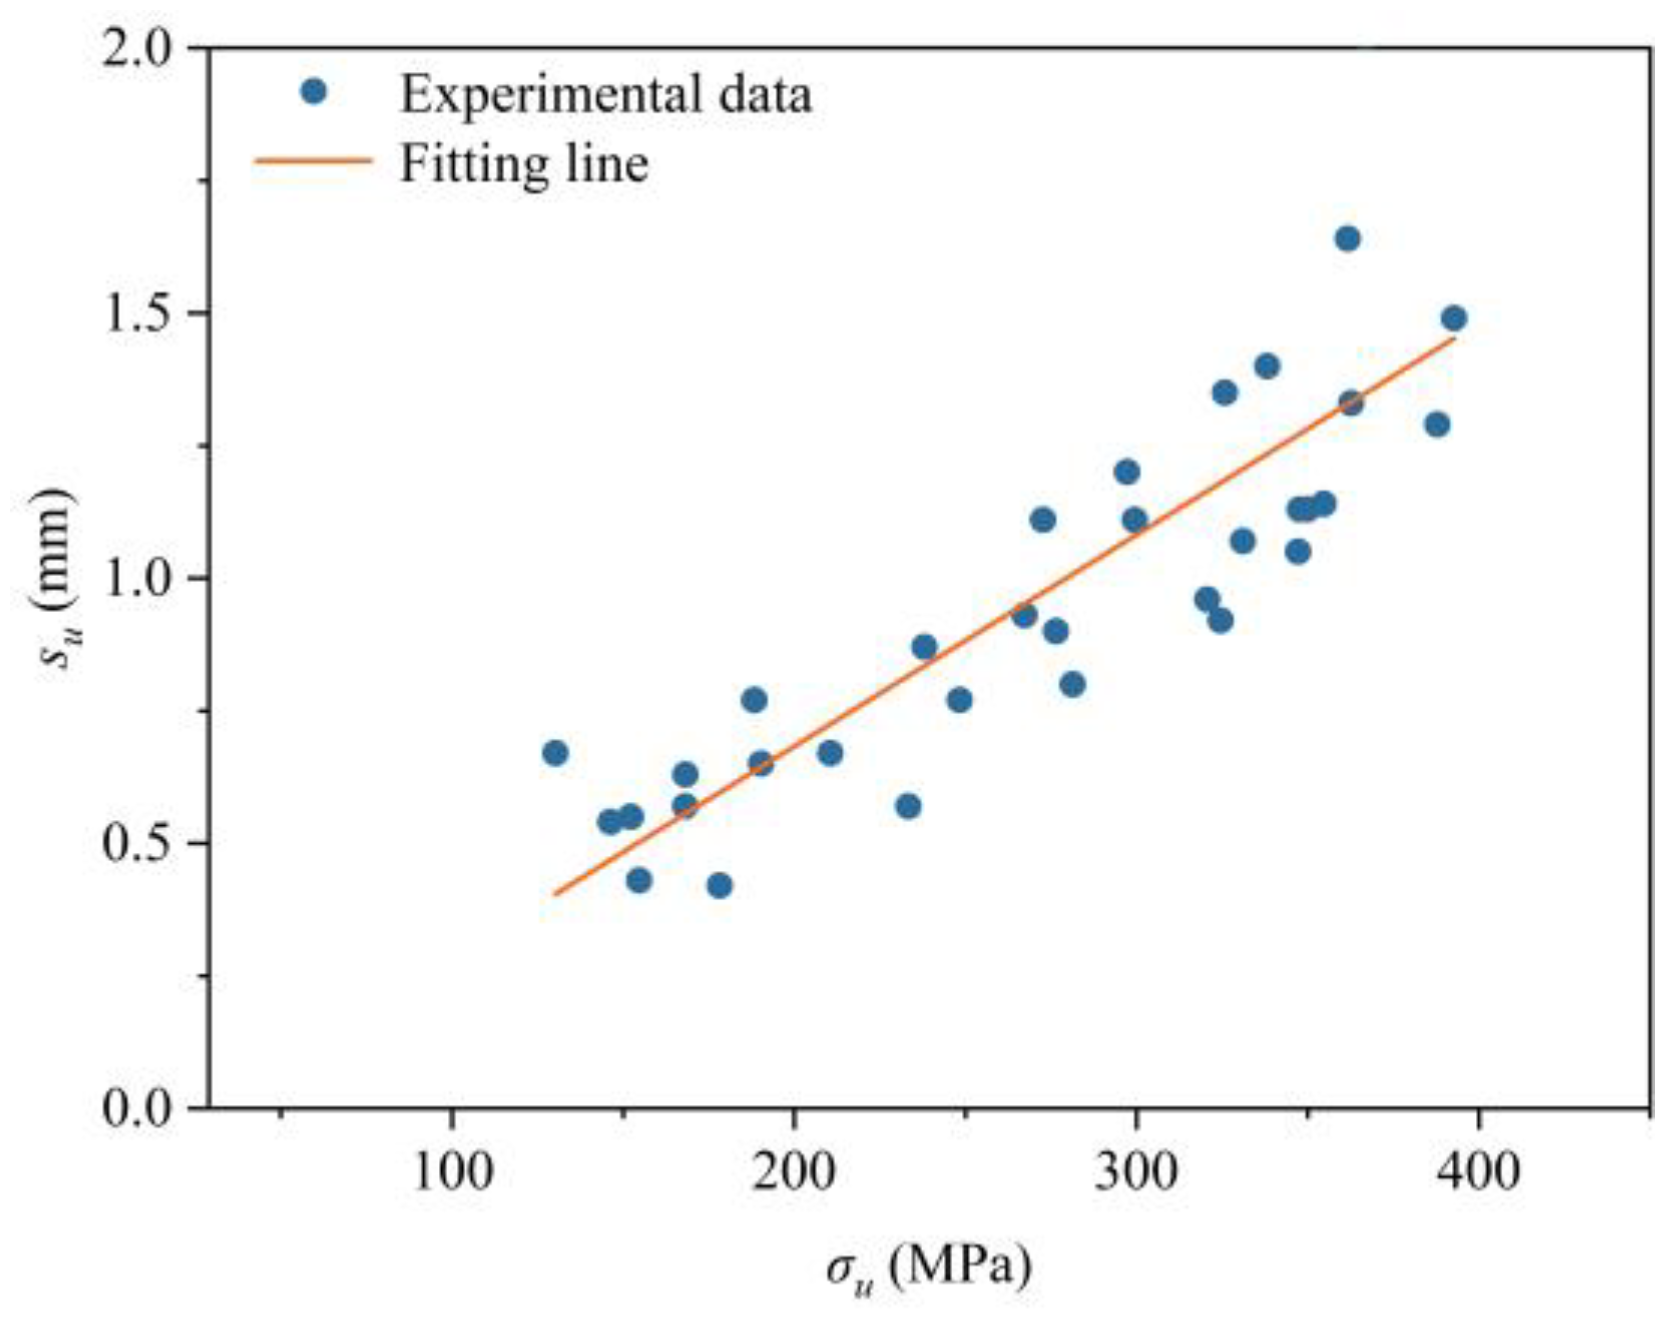
Using Equation (2), the peak stress of each specimen was calculated from the peak load derived from the load–slip curve. The slip corresponding to the peak load (Fu) was defined as the peak slip (su), and the relationship between peak stress and peak slip was illustrated in Figure 12. The results indicated that specimen slip increased with increasing peak stress, and a strong linear relationship was observed between the two variables, as described by Equation (3).
where σu is the peak stress, MPa; Fu is the peak load, N; A is the cross-sectional area of steel rebar, mm2; su is the peak slip corresponding to the peak load, mm.
Figure 12.
Relationship between peak stress and peak slip.
Assuming that the bond stress is uniformly distributed along the bonded length of the steel rebar, the calculation method is given in Equation (4). The calculated maximum bond stress (bond strength) corresponding to steel bar fracture and pull-out failure was presented in Table 4 and Table 5, respectively. As shown in Table 4, the bond strength initially increased and then decreased with increasing temperature, exhibiting a trend similar to that of the compressive strength of the grout. The thickness of the protective layer was negatively correlated with bond strength. Based on these observations, a regression analysis was conducted to characterize the relationship between bond strength and temperature, compressive strength of the grout, steel bar diameter, and protective layer thickness, as expressed in Equation (5). A strong correlation was observed between the calculated and experimental values, with an R2 value of 0.92.
where τ is the bond stress between grout and steel rebar, MPa; F is the load of the specimen, N; τu is the maximum bond stress (bond strength), Mpa; d is the steel rebar diameter, mm; c is the thickness of protective layer, take (cmin + cmax)/2, mm. fc,gT represents the compressive strength of grout after elevated temperatures, MPa; represents the square root of the compressive strength of the grout at different target temperatures.
Table 4.
Bond performance parameters of steel-rebar fracture specimens.
Table 5.
Bond performance parameters of pull-out failure specimens.
4.3. Residual Strength
When pull-out failure occurred, the bond strength tended to stabilize once the specimen slip reached a certain value. At this stage, the bond strength can be regarded as the residual strength. The load-slip curves of specimens exhibiting pull-out failure typically enter a stable stage when the slip reaches about 5 mm. This stage is equivalent to the frictional resistance stage against external loading. Therefore, the load corresponding to a slip of 5 mm on the load–slip curves is defined as the residual load (Fr). In addition, a strong linear relationship was observed between the residual strength and the bond strength (τu), as shown in Table 5. Accordingly, a residual strength prediction formula was proposed in Equation (6), with an R2 value of 0.96.
where τr is the residual strength of the interface between steel rebar and grout, MPa; τu is the bond strength of the interface between steel rebar and grout, MPa.
4.4. Bond–Slip Constitutive Relation
The bond mechanism between reinforcement and grout is a progressive process involving chemical adhesion, mechanical interlocking, and frictional resistance. As slip develops, the bond stress does not remain constant but evolves from an initial elastic stage to peak resistance, followed by degradation stages. Many studies often characterize bond performance using a single bond strength value, which fails to capture the complete load–slip response and cannot accurately describe post-peak degradation or residual capacity. For numerical simulation and structural analysis, the interfacial behavior must be defined by a constitutive bond–slip relationship. Without such a model, the interaction between reinforcement and grout cannot be realistically represented. The bond–slip model proposed in this study has not been cross-validated using data from other studies, mainly due to the diversity of grouting materials, the involvement of high-temperature effects, and the limited availability of research addressing reinforcement location. In future work, grouting materials with different strength grades and additional influencing factors will be systematically investigated, and the sample size will be expanded to further improve the accuracy and reliability of the proposed model.
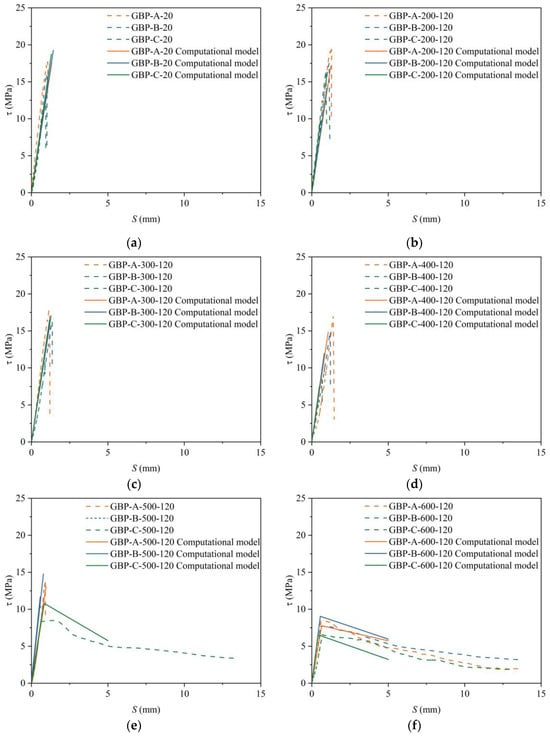
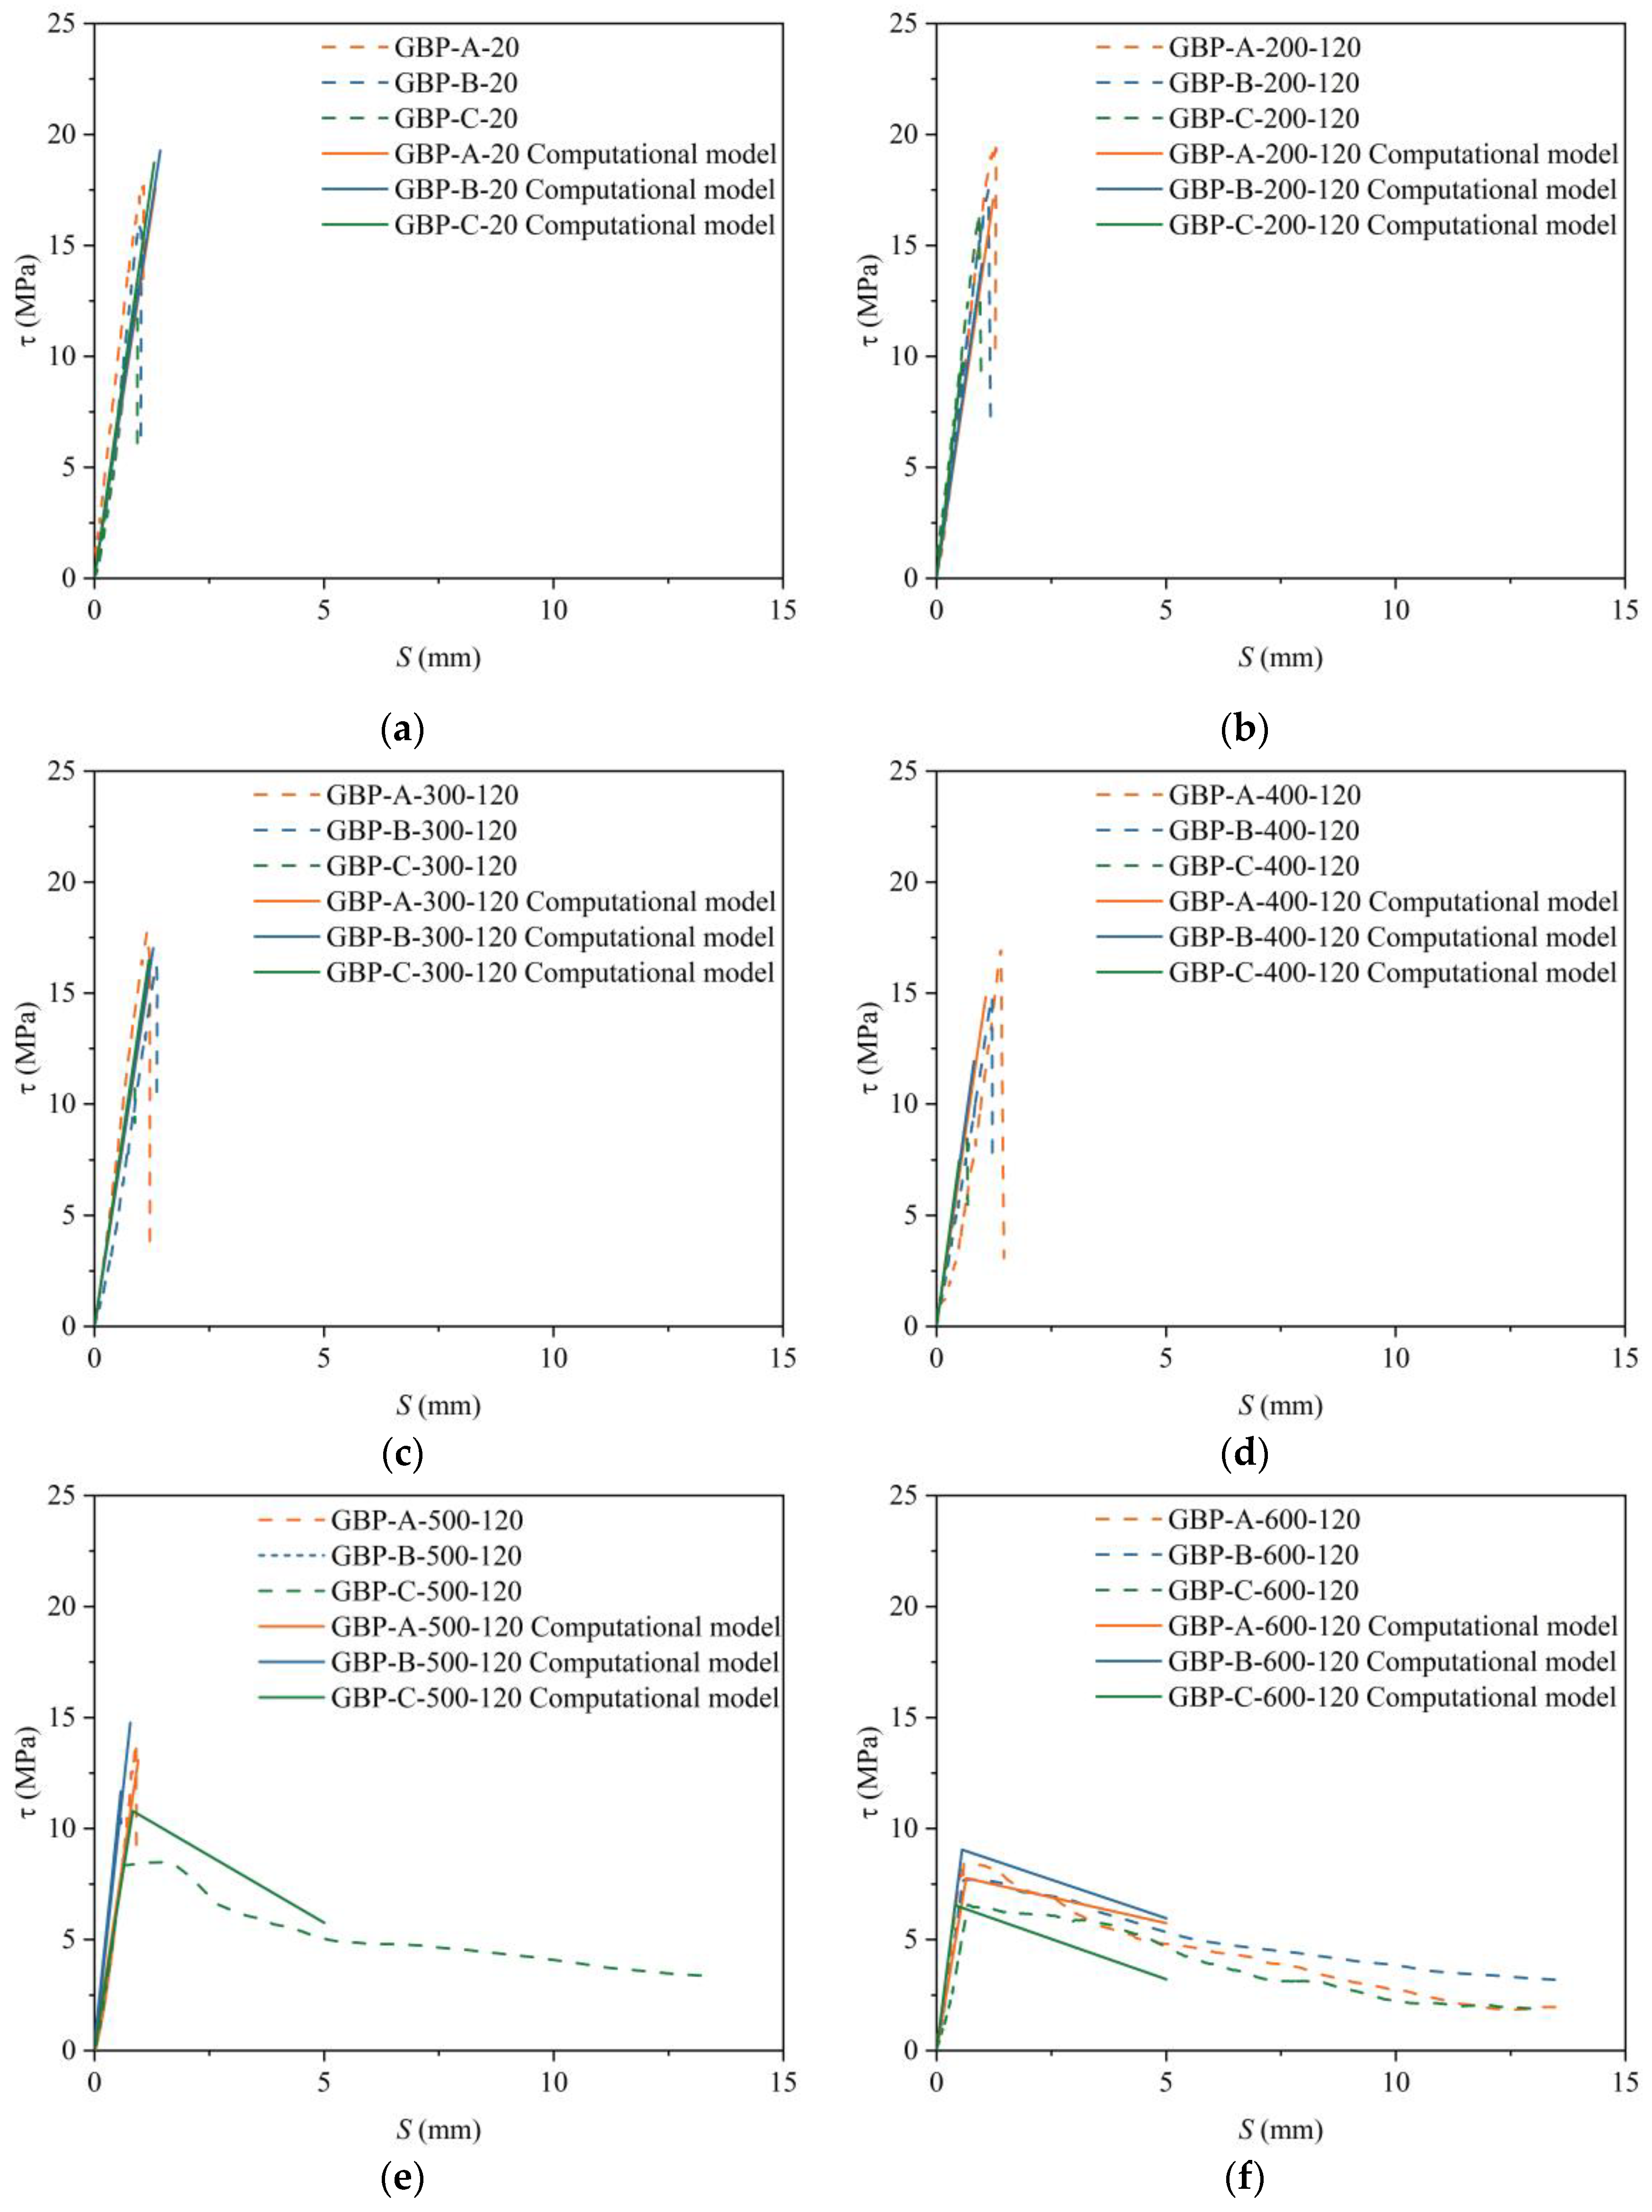
Steel-rebar fracture demonstrates that, at the joint location of precast members without lateral confinement, the bond performance between the steel rebar and the grout is sufficient. In this case, the interfacial bond capacity exceeded the tensile capacity of the steel rebar, and the measured bond strength can be regarded as a lower bound of the true bond strength. The bond strength obtained from pull-out failure specimens is generally lower than that from steel-rebar fracture specimens. Moreover, the calculated maximum bond strength for pull-out failures exhibited relatively large errors; therefore, a correction coefficient k was introduced into Equation (5). The ascending portions of the load–slip curves for steel-rebar fracture failure and pull-out failure were essentially identical, whereas their primary difference lay in the descending branch after the peak load was reached. Based on the analysis and calculation of characteristic parameters such as bond strength, peak slip, residual strength, and residual slip, together with the experimentally obtained load–slip curves and model characteristics, bond–slip constitutive relationships for the two failure modes were proposed, as shown in Equations (7) and (8). As shown in Figure 13, the curves predicted by the proposed bond–slip model agreed well with the experimental results, except for slight deviations observed in GBP-X-500-120 and GBP-X-600-120 specimens. These deviations were mainly attributed to severe material degradation after high temperatures, which leads to slightly overestimated calculated values. However, the overall trend and residual strength remained consistent with the experimental results. Overall, the proposed constitutive model demonstrated good applicability.
where τ is the bond stress, MPa; τu is the bond strength, MPa, calculated according to Expression (5); τr is the residual strength, MPa, which can be calculated according to the Expression (6); s is the slip, mm; su is the peak slip, mm, which can be calculated according to Expression (3); sr is the residual slip, mm, and it is recommended to take 5 mm; k is the correction coefficient, and the meanings of other parameters are the same as before.
Figure 13.
Calculation and verification of bond–slip constitutive model. (a) GBP-X-20; (b) GBP-X-200-120; (c) GBP-X-300-120; (d) GBP-X-400-120; (e) GBP-X-500-120; (f) GBP-X-600-120.
5. Conclusions
To evaluate the fire safety performance of joint regions in prefabricated buildings, particularly when the grout layer is in an unconstrained state, eccentric pull-out tests after exposure to elevated temperatures were conducted to simulate the actual stress conditions encountered in engineering practice. Based on experimental investigations of bond–slip behavior in 54 pull-out specimens, the effects of steel bar position and high temperature on the bond performance between grout and steel rebars were analyzed, and the following conclusions were drawn:
- (1)
- The surface color of the grout specimen changed from cyan gray to grayish white after elevated temperatures. High-temperature exposure caused thermal expansion differences, which led to interfacial cracking between materials. Corner specimens exhibited deeper temperature-induced cracks than those of center and mid-side specimens.
- (2)
- The effect of steel rebar position was manifested by differences in the thickness of the protective layer and the degree of constraint. Center specimens exhibited the largest peak load after the same elevated temperatures. At 500 °C, pull-out failure occurred only in corner specimens due to insufficient restraint and reduced bond strength.
- (3)
- Elevated temperature caused significant degradation of the mechanical properties of the materials and interface performance (friction and mechanical interlock). Elevated temperature damage leads to a transformation in the failure mode of the specimens, shifting from steel-rebar fracture to pull–out failure.
- (4)
- The peak load of the specimen first increased and then decreased as the temperature increased, exhibiting a trend similar to that of the compressive strength of the grout with temperature. The peak load reached its maximum at 200 °C, whereas at 600 °C the bond strength decreased by 56.63% compared with that at 200 °C.
- (5)
- Based on the experimental results, a bond strength calculation formula and a bond–slip model were proposed, considering the effects of steel bar location, elevated temperature, and the post-fire compressive strength of the grout. The proposed models showed good fitting accuracy and can provide a reference for evaluating the fire safety performance of joints in prefabricated buildings.
- (6)
- In future work, additional influencing factors—such as grouting material type, constant-temperature duration, cooling regime, steel bar diameter, and constraint conditions—will be systematically investigated, and the sample size will be expanded to further enhance the accuracy and reliability of the proposed model.
Author Contributions
Conceptualization, T.P. and B.S.; methodology, J.M.; software, T.P.; validation, T.P.; formal analysis, T.P. and Y.L.; investigation, S.S. and J.Z.; resources, J.M.; data curation, J.Z.; writing—original draft preparation, T.P.; writing—review and editing, B.S. and D.S.; supervision, J.M. and Y.L.; project administration, T.P. All authors have read and agreed to the published version of the manuscript.
Funding
This research received no external funding.
Institutional Review Board Statement
Not applicable.
Informed Consent Statement
Not applicable.
Data Availability Statement
The data presented in this study are available in the article.
Acknowledgments
Thanks to the teachers and classmates of the research group for their help in the experiment and discussion.
Conflicts of Interest
Author Bochen Song are employed by the Shandong Luqiao Group Co., Ltd.; Jiaqi Zhang are employed by the Qingdao Haixin Real Estate Co., Ltd. The remaining authors declare that the research was conducted in the absence of any commercial or financial relationships that could be construed as a potential conflict of interest.
References
- Zhao, S.Y.; Qu, X.R.; Zhao, X.J. The carbon emissions of prefabricated building in urban renewal: Assessment and emission reduction path. Energy Build. 2025, 341, 115830. [Google Scholar] [CrossRef] [Scilit]
- Xia, R.; Garbatov, Y.; Hu, Q.; Liu, C. Experimental analysis of axially compressively loaded GFRP-confined grout short columns. Thin-Walled Struct. 2026, 219, 114191. [Google Scholar] [CrossRef] [Scilit]
- Guaygua, B.; Sánchez-Garrido, A.J.; Yepes, V. A systematic review of seismic-resistant prefabricated concrete buildings. Structures 2023, 58, 105598. [Google Scholar] [CrossRef] [Scilit]
- Liu, L.; Ouyang, X.; Wang, X.; Zhang, Q. Multi-factors effects on developments of bond behaviors between the high-strength grout and steel rebar and its optimization. Structures 2025, 77, 109067. [Google Scholar] [CrossRef] [Scilit]
- Abd Elsalam, M.M.; Agamy, M.H.; Genidi, M.M.M.; Salem, M. Fire Resistance of Square Concrete Columns Reinforced with GFRP Bars, Experimental and Numerical Investigation. Eng. Struct. 2024, 305, 117732. [Google Scholar] [CrossRef] [Scilit]
- Feng, Q.; Wei, P.; Zhao, K.; Xu, R. Experimental investigation of stirrup confinement effects on bond-slip responses for corner and middle bars. Constr. Build. Mater. 2022, 314, 125629. [Google Scholar] [CrossRef] [Scilit]
- Li, Q.; Tian, Y.; Fang, D.; Zhao, K.; Chen, H.; Jin, X.; Fu, C.; He, R. The Influence of Longitudinal Rebar Type and Stirrup Ratio on the Bond Performance of Reinforced Concrete with Corrosion. Constr. Build. Mater. 2023, 409, 133943. [Google Scholar] [CrossRef] [Scilit]
- Zheng, C.; Yan, L.; Liu, L.; Liu, C.; Zhang, M.; Song, W. Bond performance deterioration of rebar in concrete under the temperature synergistic effect: Experimental study. Eng. Struct. 2025, 337, 120532. [Google Scholar] [CrossRef] [Scilit]
- Xiao, J.; Hou, Y.; Huang, Z. Beam test on bond behavior between high-grade rebar and high-strength concrete after elevated temperatures. Fire Saf. J. 2014, 69, 23–35. [Google Scholar] [CrossRef] [Scilit]
- Bošnjak, J.; Das, A.; Sharma, A. Influence of concrete cover and transverse reinforcement on residual post-fire bond performance of reinforcement in concrete. Eng. Struct. 2024, 314, 118191. [Google Scholar] [CrossRef] [Scilit]
- Sharma, A.; Bosnjak, J.; Bessert, S. Experimental investigations on residual bond performance in concrete subjected to elevated temperature. Eng. Struct. 2019, 187, 384–395. [Google Scholar] [CrossRef] [Scilit]
- Liu, C.W.; Zhao, K.X.; Liu, L.Z.; Yan, L.T.; Miao, J.J. Bond strength of steel rebar and concrete after different cooling methods: Experimental study and theoretical modeling. Constr. Build. Mater. 2025, 497, 143851. [Google Scholar] [CrossRef] [Scilit]
- Li, Z.; Shen, J.; Zhu, H.; Niu, G.; Yang, L.; Gu, Z. Experimental study on the bond behavior of coarse aggregate ultra-high-performance concrete and HRB500 steel bars. Constr. Build. Mater. 2025, 490, 142446. [Google Scholar] [CrossRef] [Scilit]
- Wu, H.Q.; Gilbert, R.I. Modeling short-term tension stiffening in reinforced concrete prisms using a continuum-based finite element model. Eng. Struct. 2009, 31, 2380–2391. [Google Scholar] [CrossRef] [Scilit]
- Peng, G.; Wu, J.W.; Huang, K.X.; Shi, C.; Hu, X.P.; Niu, D.T. Research on workability, mechanics, and durability of cementitious grout: A critical review. Constr. Build. Mater. 2024, 449, 138374. [Google Scholar] [CrossRef] [Scilit]
- Li, X.; Zhang, G.; Han, Q.; Zhou, J.; Liu, X.; Du, X. Mechanical behavior of splice joints for bridge columns connected by grouted sleeves. Soil Dyn. Earthq. Eng. 2023, 173, 108078. [Google Scholar] [CrossRef] [Scilit]
- Zhao, J.; Wei, C.J.; Chen, J.; Ma, B.; Xiao, W.W. Bond performance of seamless steel pipe grouting sleeves under large-deformation repeated tension and compression after high temperature. Buildings 2024, 14, 1136. [Google Scholar] [CrossRef] [Scilit]
- Kim, H.K. Bond strength of mortar-filled steel pipe splices reflecting confining effect. J. Asian Archit. Build. Eng. 2012, 11, 125–132. [Google Scholar] [CrossRef] [Scilit]
- Zheng, Y.F.; Guo, Z.X.; Liu, J.B.; Chen, X.N.; Xiao, Q.D. Performance and confining mechanism of grouted deformed pipe splice under tensile load. Adv. Struct. Eng. 2016, 19, 86–103. [Google Scholar] [CrossRef] [Scilit]
- Ling, J.H.; Abd Rahman, A.B.; Ibrahim, I.S.; Hamid, Z.A. Tensile capacity of grouted splice sleeves. Eng. Struct. 2016, 111, 285–296. [Google Scholar] [CrossRef] [Scilit]
- Liu, Y.; Peng, T.; Miao, J.; Liu, C.; Ba, G.; Zhao, Y.; Xiao, J.; Hou, D.; Liu, Y. Uniaxial Tensile Behavior of Half-Grouted Sleeve Connections with Concrete Cover after Exposure to Elevated Temperatures. J. Build. Eng. 2024, 87, 109066. [Google Scholar] [CrossRef] [Scilit]
- GB/T 17671-2021; Method of Testing Cements—Determination of Strength (ISO 679:2009). Ministry of Housing and Urban-Rural Development of China: Beijing, China, 2021. (In Chinese)
- JG/T 408-2019; Cementitious Grout for Coupler of Rebar Splicing. Ministry of Housing and Urban-Rural Development of China: Beijing, China, 2019. (In Chinese)
- ISO6892-1; Metallic Materials-Tensile Testing-Part 1: Method of Test at Room Temperature. International Organization for Standardization: Geneva, Switzerland, 2019.
- GB/T 50081-2019; Standard for Test Methods of Concrete Physical and Mechanical Properties. Ministry of Housing and Urban-Rural Development of China: Beijing, China, 2019. (In Chinese)
- Liu, Y.; Chen, B.; Liu, X.; Liu, C.; Miao, J.; Weng, C.; Luo, Y. Experimental Study on Bond Performance between Corroded Reinforcement and Basalt-Polypropylene Fiber Reinforced Concrete after High Temperature. Constr. Build. Mater. 2025, 474, 140944. [Google Scholar] [CrossRef] [Scilit]

Disclaimer/Publisher’s Note: The statements, opinions and data contained in all publications are solely those of the individual author(s) and contributor(s) and not of MDPI and/or the editor(s). MDPI and/or the editor(s) disclaim responsibility for any injury to people or property resulting from any ideas, methods, instructions or products referred to in the content. |
© 2026 by the authors. Licensee MDPI, Basel, Switzerland. This article is an open access article distributed under the terms and conditions of the Creative Commons Attribution (CC BY) license.