


Abstract
In response to the demand for real-time monitoring of the nitrogen nutritional status of peanut populations, this paper proposes a real-time monitoring system for the nitrogen nutritional status of peanut populations based on the YOLOv11 framework and spectral attention module. Traditional nitrogen detection methods have problems such as low efficiency and difficulty in achieving population-scale monitoring, while crop phenotyping technology based on computer vision faces challenges such as small leaf targets, severe occlusion, easy confusion of nitrogen deficiency symptoms, and difficulty in deploying deep learning models on mobile terminals. This study improves the YOLOv11 model, introduces the ASF (Attentional Scale Fusion) module and the DySample dynamic upsampling mechanism, enhances the model’s perception and feature expression capabilities for multi-scale targets, and effectively improves the monitoring accuracy and robustness of the nitrogen nutritional status of peanut populations. Experimental results show that the ADS-YOLO model performs well in evaluation indicators such as accuracy, recall, and mean average precision (mAP), providing technical support for precision fertilization of peanuts.
1. Introduction
Global agriculture is facing multiple challenges such as population growth and climate change. It is necessary to innovate a sustainable development path to improve crop yield [1]. Peanut occupies a pivotal position in the global agricultural field. As an important plant-based protein and cash crop, its planting area and output are considerable worldwide, accounting for about 20% and 40% of the world, respectively [2]. China’s peanut planting area is extensive, covering almost all provinces except Tibet, forming 7 peanut production areas with their own characteristics [3]. These production areas have a large north–south span and a wide east–west longitude span, and the land types are complex and diverse, resulting in a wide range of soil background nitrogen supply conditions [4]. As a leguminous crop, peanut has a unique nitrogen fixation ability. Its nitrogen nutrition mainly comes from rhizobium nitrogen fixation and soil nitrogen, while fertilizer nitrogen is only a supplement [5]. However, excessive application of nitrogen fertilizer not only increases production costs and reduces fertilizer utilization but also pollutes the ecological environment and affects the sustainable productivity of the soil [6]. Faced with the large differences in soil fertility in different peanut production areas and the different farming and fertilization management measures of farmers, how to accurately monitor the nitrogen nutrition status of the peanut population has become an urgent problem to be solved.
In recent years, the rapid development of hyperspectral imaging and deep learning technologies has provided new solutions for non-destructive and real-time monitoring of crop nitrogen nutrition [7]. In the process of peanut cultivation, the adequacy of nitrogen nutrition is directly related to the growth, development and yield quality of peanuts [8]. However, due to differences in soil background nitrogen supply and different management measures of farmers, it is often difficult to accurately grasp the nitrogen nutrition status of peanut populations. Traditional nitrogen nutrition monitoring methods are often time-consuming and labor-intensive, and it is difficult to achieve real-time monitoring. Hyperspectral imaging technology [9] can obtain hyperspectral information of crop canopies, which contains rich nitrogen nutrition information. Combined with deep learning technology, these hyperspectral data can be deeply mined and analyzed, thereby realizing real-time and accurate monitoring of the nitrogen nutrition status of peanut populations.
2. Overview of Related Research Content
In recent years, as an important economic crop, real-time monitoring of the nitrogen nutrition status of peanut populations is of great significance for achieving precise fertilization and improving yield and quality [10]. Traditional nitrogen diagnosis methods rely on destructive sampling and laboratory chemical analysis, which is not only time-consuming and labor-intensive but also difficult to promote in actual farmland production, especially in hilly and mountainous areas and areas where farmers are scattered [11]. Therefore, building an efficient, low-cost, non-destructive, and real-time nitrogen monitoring model has become the core goal of research. To this end, relevant scholars have conducted a lot of exploration around spectral remote sensing, digital image technology, and deep learning algorithms [12]. But the current mainstream methods still face many challenges when applied to population nitrogen monitoring of peanut crops.
In the field of spectral remote sensing, researchers mostly use the correlation between vegetation spectral reflectance characteristics and nitrogen content for modeling, such as NDVI and red edge position, which are commonly used in nitrogen inversion modeling for field crops such as rice and wheat [13,14,15,16]. However, peanuts have small leaves, many branches, and complex canopy structures, which are easily interfered by soil background, limiting the accurate acquisition of spectral information. In addition, hyperspectral equipment is expensive and data processing is complicated, and it has poor adaptability to crops with irregular spatial distribution such as peanuts [17]. Therefore, although some studies have introduced principal component analysis or multi-band feature compression algorithms, the scalability and robustness of the model in actual production are still not ideal.
Digital image technology has attracted widespread attention due to its convenient acquisition and high popularity of equipment. Scholars use color space parameters such as RGB and HSV to construct correlation models between image features and nitrogen indicators [18]. For example, indexes such as ExG and RI perform well in rice and wheat. However, in the peanut planting environment, the light changes drastically and the leaf color changes slightly, and the model based on color features is not stable enough [19]. In response to this, some studies have introduced multi-source features such as canopy coverage (CC), leaf morphology, and texture for fusion modeling, and combined with algorithms such as SVM and BP neural network to optimize the monitoring effect [19]. In the field of unmanned aerial vehicles, research on digital imaging technology has also made certain progress. Researchers have provided new technological paths in the construction, group decision-making, topology optimization, and signal processing of multispectral images of unmanned aerial vehicles using machine learning algorithms [20,21,22,23,24]. These ideas provide theoretical support for image-based peanut nitrogen monitoring, but problems such as small targets, local occlusion, and multi-scale features in the image have not been effectively solved.
In recent years, the application of YOLO series algorithms in agricultural image processing has gradually increased [25,26,27,28,29]. As a new generation of single-stage target detection model, YOLOv11 achieves a balance between speed and accuracy and has the potential to monitor nitrogen in peanuts. Its ability to quickly identify target areas provides a basis for real-time field monitoring. However, the original design of YOLOv11 focuses on target detection, and its recognition ability for “unstructured visual information” such as plant nitrogen status is limited. It is difficult to capture subtle changes in leaf color and texture, especially in complex backgrounds, small targets or overlapping leaf scenes. The detection performance is reduced. At the same time, its shallow features and deep semantic fusion effects are generally limited, which limits its ability to express fine-grained features of peanut leaves.
Therefore, current research is trying to deeply integrate YOLO with agricultural scenes, enhance the model’s perception ability by introducing attention mechanisms and multi-scale modules, and improve its application value in peanut nitrogen monitoring. In summary, combining the advantages of digital image technology, deep learning algorithms and target detection models to build an intelligent nitrogen status monitoring system suitable for peanut populations is an effective way to achieve intelligent fertilization management and an important direction for future precision agriculture research.
However, current mainstream methods still face significant challenges when applied to peanut population monitoring. As summarized in Table 1, spectral remote sensing methods generally require expensive equipment and complex data processing, making them difficult to scale for ordinary farmers. Traditional machine learning approaches rely on handcrafted features, which are sensitive to illumination changes and lack robustness in complex field environments. While early deep learning models have improved detection capabilities, they often struggle with the unstructured nature of nitrogen deficiency symptoms—specifically, the subtle texture differences between nitrogen levels, severe leaf occlusion in peanut canopies, and the interference from soil backgrounds.
Table 1.
Comparison of existing nitrogen monitoring methods and the proposed approach.
3. Methodology
3.1. Problem Formulation and Baseline Limitations
The real-time monitoring of peanut nitrogen status can be formally defined as a fine-grained object detection task. Given an input image , the goal is to predict a set of bounding boxes and corresponding nitrogen classes . The current state-of-the-art YOLOv11 architecture, while efficient for general object detection benchmarks, relies heavily on a CSP-Darknet backbone and a Path Aggregation Network (PANet) for feature extraction. However, when applied to the specific domain of peanut population monitoring, we identify two critical theoretical limitations in its architectural design.
First, the standard feature fusion mechanism in YOLOv11 relies on static upsampling operators, such as nearest-neighbor interpolation, which can be modeled as a fixed-kernel convolution:
Since the kernel is data-agnostic and spatially invariant, it inherently fails to recover the high-frequency edge details lost during downsampling. This limitation results in severe feature blurring at the boundaries between nitrogen-deficient leaves and the complex soil background, leading to imprecise localization of small targets. Second, the baseline model fuses multi-scale features via simple element-wise concatenation without prior semantic alignment. In peanut canopy images, the semantic gap between shallow geometric features and deep semantic features is significant. Direct concatenation often leads to semantic aliasing, where the model struggles to differentiate between the visual signatures of nitrogen deficiency and the natural texture variations in the canopy. To address these ill-posed problems, we propose the ADS-YOLO framework.
3.2. The ADS-YOLO Architecture
To address the critical challenges inherent in peanut nitrogen monitoring, particularly the detection of small leaf targets amidst strong background interference and significant semantic disparities, we construct the ADS-YOLO architecture. While the baseline YOLOv11 excels in general object detection, its architectural design exhibits theoretical limitations when applied to unstructured agricultural scenes. The standard feature fusion network relies on static nearest-neighbor interpolation for upsampling and simple element-wise concatenation to merge deep and shallow features. This conventional design fails to effectively recover high-frequency edge details lost during downsampling, leading to feature blurring at the boundaries between nitrogen-deficient leaves and the complex soil background. Furthermore, the direct concatenation of multi-scale features without semantic alignment often results in semantic aliasing, limiting the model’s ability to distinguish fine-grained nitrogen nutrition characteristics from natural canopy texture variations.
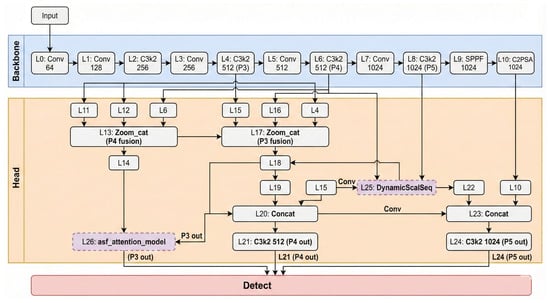
To resolve these ill-posed problems, the ADS-YOLO architecture reconstructs the feature fusion pathway while retaining the lightweight backbone of YOLOv11 (Figure 1). We introduce the DySample dynamic upsampling mechanism to replace the original static upsampling operators. By utilizing a point-sampling strategy, DySample dynamically reconstructs the spatial structure of feature maps, thereby effectively preserving essential leaf texture and boundary information. Additionally, the Attentional Scale Fusion (ASF) module is embedded into the detection head to replace the standard concatenation operation at the P3 scale. This module employs dynamic scale sequences and attention mechanisms to achieve semantic alignment and weighted fusion across different feature levels, effectively bridging the semantic gap and significantly enhancing the model’s perceptual robustness toward subtle differences in peanut nitrogen status.
Figure 1.
Structure of the ADS-YOLO Model.
3.3. ASF Model
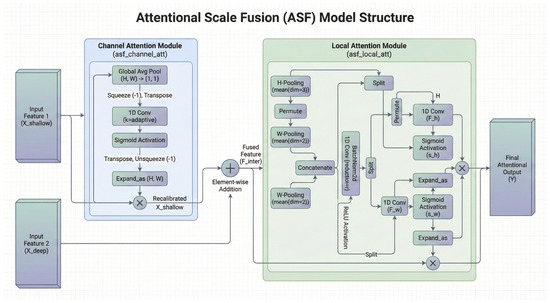
The ASF model constitutes a critical component of the ADS-YOLO architecture, designed to resolve the semantic misalignment inherent in fusing multi-scale feature maps. As illustrated in Figure 2, the ASF module processes a dual-input stream comprising high-resolution shallow features and semantically rich deep features . To mitigate the interference of background noise in shallow features, the module first employs a channel attention mechanism solely on the branch. This sub-module avoids dimensionality reduction, which often destroys channel-wise dependencies, by utilizing a global average pooling operation followed by a fast 1D convolution. The kernel size of this convolution is adaptively determined by the channel dimension , calculated as:
where and are mapping parameters. The channel-wise attention weights and the recalibrated feature map are formulated as:
Figure 2.
Structure of the ASF model.
Following the channel-wise recalibration, the module performs an initial feature fusion via element-wise addition, yielding the intermediate feature map:
To further refine this fused representation and enhance the localization of small peanut leaf targets, the intermediate map is processed by a local attention mechanism based on coordinate attention theory. This sub-module decomposes the standard global pooling into two parallel 1D feature encoding operations to capture long-range dependencies along one spatial direction while preserving precise positional information along the other. Specifically, for an input channel with height and width , the module aggregates features using pooling kernels and , generating direction-aware feature maps and along the horizontal and vertical coordinates, respectively:
These aggregated feature maps are concatenated and passed through a shared convolutional transformation layer to reduce the channel dimensionality by a ratio , followed by batch normalization and a non-linear ReLU activation . This produces an encoded intermediate tensor:
The tensor is subsequently split along the spatial dimension into two separate tensors and . These are then transformed by two auxiliary convolutions, and , into spatial attention maps with the same channel depth as the input. The final output of the ASF module is obtained by reweighting the intermediate fusion map with these spatial weights, ensuring the model focuses on the precise semantic regions of the nitrogen-stressed targets:
3.4. DySample Dynamic Upsampling
To overcome the inherent limitations of static interpolation methods, such as nearest-neighbor and bilinear upsampling, which often result in blurred boundaries and the loss of fine-grained structural details in peanut canopy images, we introduce the DySample dynamic upsampling module. Unlike standard upsampling operators that apply a fixed, data-agnostic kernel, DySample formulates upsampling as a learnable point-sampling task. It leverages the intrinsic geometric information of the input features to dynamically generate sampling coordinates, thereby effectively recovering sharp edges and preserving the texture fidelity of small targets.
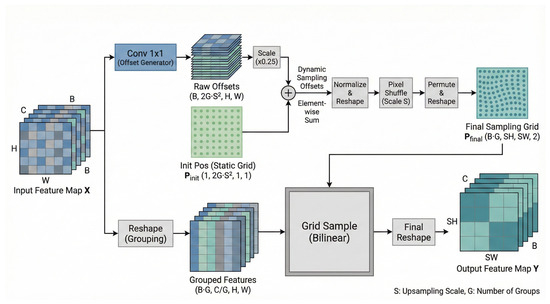
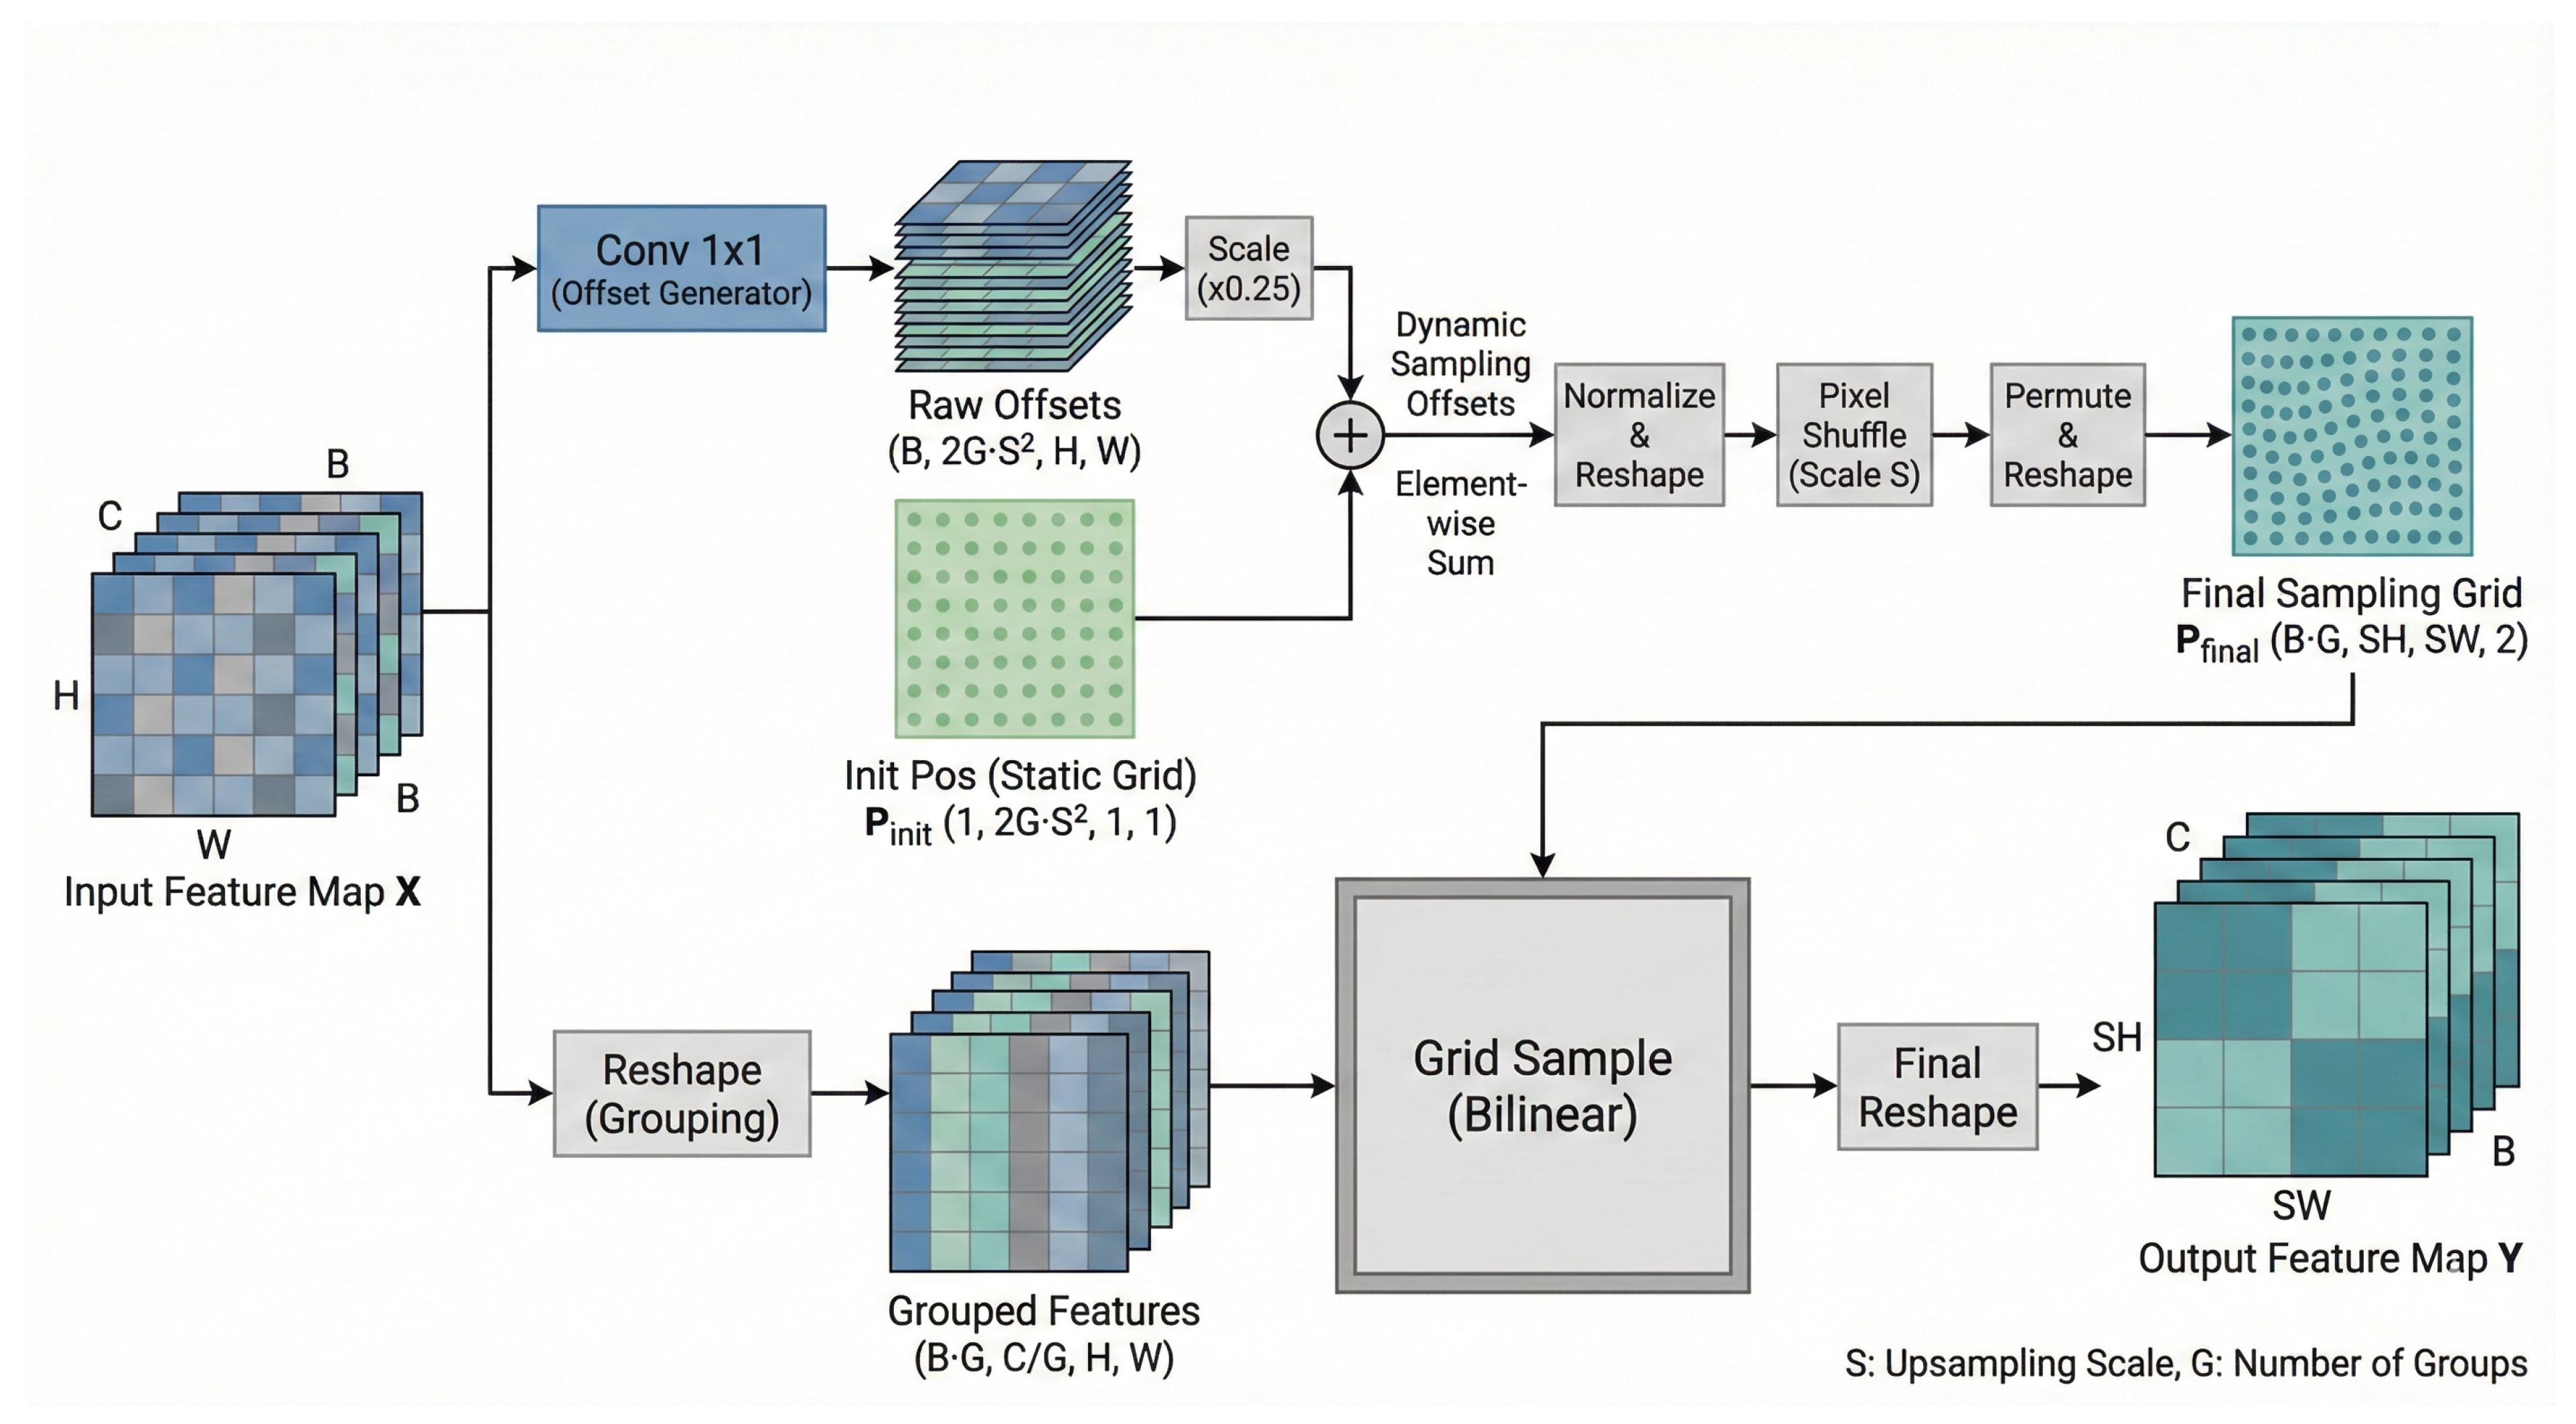
As shown in Figure 3, the module takes an input feature map and an upsampling scale factor . The core mechanism revolves around two key steps: offset generation and grid resampling.
Figure 3.
Structure of the DySample.
The module first utilizes a lightweight convolutional layer, parameterized by weights , to predict a dense offset map directly from the input features. This offset map captures the local structural variations needed to adjust the sampling positions. Then, the input features are projected to generate offsets for each sampling group , resulting in an offset tensor of dimensions . These offsets are then scaled by a factor and added to a pre-computed static initialization grid to form the final sampling grid . The generation process can be formulated as:
The generated sampling grid is then reshaped and reorganized via a Pixel Shuffle operation to align with the target high-resolution spatial dimensions. The final upsampled feature map is obtained by applying a bilinear resampling function on the input using the computed dynamic coordinates . This allows the model to adaptively sample information from relevant sub-pixel locations, ensuring semantic consistency across scales. The resampling operation is defined as:
In the ADS-YOLO architecture, the Dynamic Scale Sequence (DynamicScalSeq) module employs DySample to align the low-resolution deep semantic features to the high-resolution P3 scale. By replacing static interpolation with DySample, the model significantly reduces feature aliasing and blurring during the fusion process, providing the subsequent detection head with high-fidelity feature representations crucial for identifying the subtle visual indicators of nitrogen deficiency.
4. Experiment and Analysis
4.1. Dataset
4.1.1. Dataset Introduction
The dataset utilized in this study was self-collected and constructed. Data acquisition was conducted between July and August in the main peanut production area of central and western Jilin Province, during the peanut flowering and pegging stage. The experiment focused on the ‘Baisha 308’ variety, grown in a temperate farmland ecological zone. Canopy images were captured under natural lighting conditions—characterized by 7–9 h of daily sunlight with strong solar radiation and occasional rainfall—using an Apple iPhone 11 to simulate real-world application scenarios.
The dataset comprises a total of 117 images, encompassing three distinct nitrogen nutritional levels designated as “high,” “medium,” and “low.” These nitrogen levels were established through rigorously controlled fertilization treatments in the experimental plots. The sample distribution for each category is as follows: High Nitrogen: 32 images; Medium Nitrogen: 59 images; Low Nitrogen: 26 images.
To ensure the reliability of the model evaluation, the entire dataset was randomly partitioned into training, validation, and test sets at an 8:1:1 ratio. During the model training phase, data augmentation strategies, including random flipping, rotation, and scaling, were employed to enhance the model’s generalization capabilities and mitigate the risk of overfitting.
The dataset is collected in the main peanut production area of Jilin Province. Although the raw dataset comprises 117 high-quality images, strictly controlled experimental conditions are applied to ensure data diversity. Three nitrogen levels are established based on specific fertilization rates: “High Nitrogen”, “Medium Nitrogen”, and “Low Nitrogen”. Images are captured using an Apple iPhone 11 at a height of approximately 1.0–1.2 m to simulate a low-cost, accessible monitoring scenario for farmers. To ensure statistical reliability and overcome the limitation of dataset size.
4.1.2. Experimental Environment and Hyperparameter Settings
The experiments in this paper were conducted under the Ubuntu 20.04 operating system, utilizing a high-performance hardware configuration. The central processing unit (CPU) is an Intel(R) Xeon(R) CPU E5-2680 V4 processor, sourced from Intel Corporation (Santa Clara, CA, USA). The graphics processing unit (GPU) is an NVIDIA GeForce RTX 3090 Ti (24 GB video memory), sourced from NVIDIA Corporation (Santa Clara, CA, USA). In terms of development framework, the Pytorch 2.0.0 deep learning framework was selected, combined with CUDA 11.8, Python version 3.8, and the SGD optimizer was used. In terms of experimental parameters: the input image resolution is unified to 640 × 640, the model training iteration (epoch) is 300, the Batch Size is set to 16, the initial learning rate (lr0) is set to 0.01, the weight decay coefficient (weight decay) is 0.0005, and the momentum is set to 0.937 to ensure training stability and convergence efficiency.
4.2. Evaluation Indicators
This study uses accuracy, recall, and mean average precision (mAP) as evaluation indicators of the model.
Precision, also known as precision, quantifies the accuracy of the model prediction and reflects the proportion of correctly detected targets in all detection results; recall measures the detection coverage of the model and represents the ratio of the number of successfully identified targets to the total number of actual targets. F1-sore is the weighted average of precision and recall, which measures the overall performance and stability of the model. Mean average precision mAP@0.5 refers to the average detection accuracy when the intersection-over-union (IOU) threshold is set to 0.5. The higher the value, the better the overall performance of the model.
Among them, TP (True Positive) represents the number of correctly identified positive samples; FP (False Positive) represents the number of negative samples that are mistakenly classified as positive samples; FN (False Negative) refers to the number of positive samples that are mistakenly classified as negative samples. represents the AP value of the i-th category, and N represents the total number of categories that the model needs to identify.
4.3. Results Analysis
4.3.1. Three-Fold Cross-Validation Experiment
To rigorously evaluate the generalization capability and stability of the proposed ADS-YOLO model, a 3-fold cross-validation strategy is employed on the collected peanut canopy image dataset. The entire dataset of 117 images is randomly partitioned into three non-overlapping subsets of approximately equal size. In each iteration, two folds were used for training and validation, while the remaining fold served as the test set. This process was repeated three times, ensuring that every image was used for testing exactly once. The results of the 3-fold cross-validation are summarized in Table 2.
Table 2.
Performance of ADS-YOLO across three folds of cross-validation.
The cross-validation results demonstrate exceptional consistency across all folds. The model achieved near-perfect recall (100%) in every fold, indicating that it successfully detected all annotated nitrogen-status targets without omission. Precision remained consistently above 98.15%, confirming a very low false-positive rate. The F1-score and mAP@0.5 also exhibited minimal variance (standard deviation < 0.03%), reflecting the model’s high robustness and stability despite the relatively small dataset size and natural variations in lighting, occlusion, and canopy structure across field images.
This stability is particularly significant given the challenges inherent in agricultural imaging—such as subtle color differences between nitrogen levels, leaf overlap, and background interference. The consistent performance across folds validates that the integration of the ASF module and DySample mechanism not only boosts peak performance but also enhances the model’s ability to generalize across different subsets of real-world field data.
In summary, the 3-fold cross-validation confirms that ADS-YOLO delivers reliable, high-accuracy nitrogen status monitoring for peanut populations under practical farming conditions, with minimal performance fluctuation—making it a strong candidate for real-time deployment in precision agriculture systems.
4.3.2. Confusion Matrix Analysis
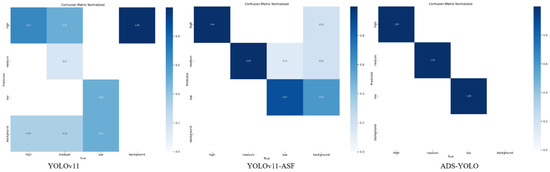
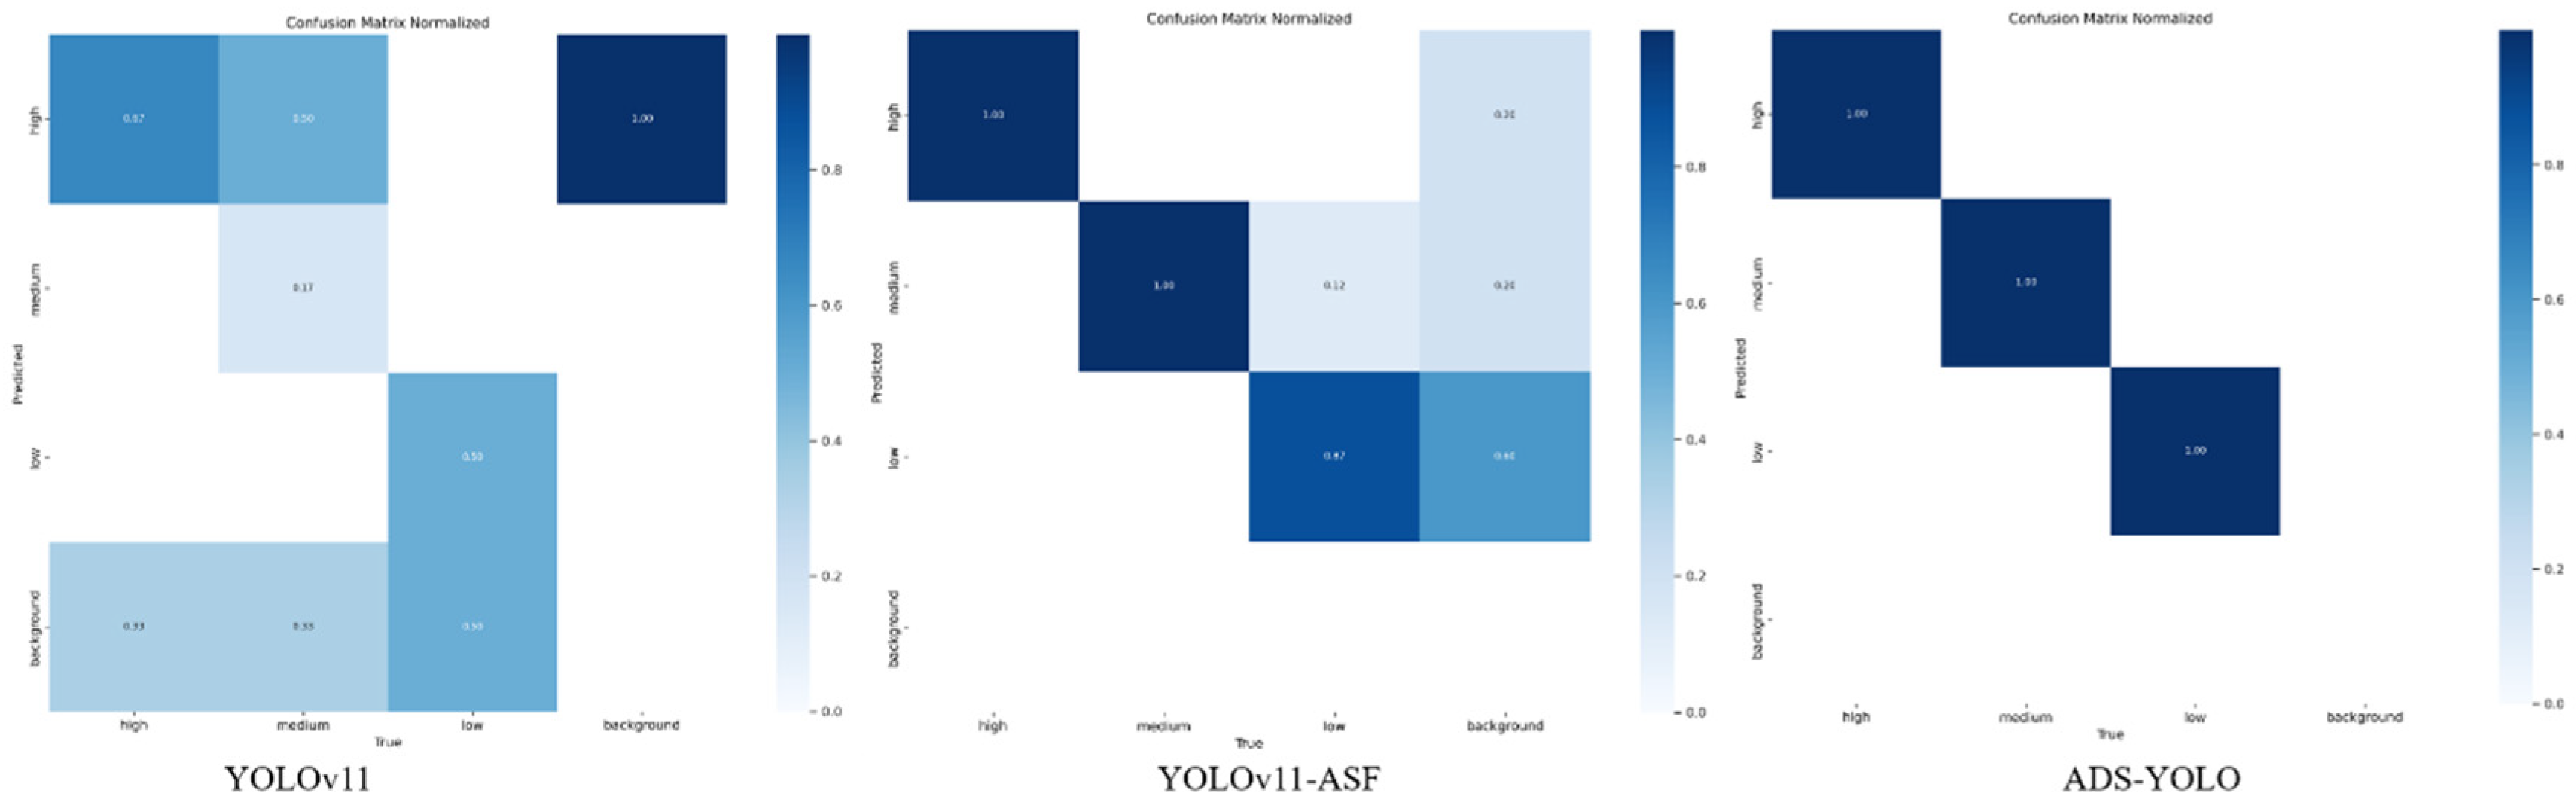
In the multi-category target detection task, the model’s ability to identify targets at different semantic levels will have a direct impact on the overall detection performance. In order to evaluate the classification accuracy and error sources of the model, this paper uses the confusion matrix to conduct a comparative analysis of the prediction performance of the YOLOv11 series models in various categories, including the baseline model YOLOv11, the YOLOv11-ASF with the attention module, and the ADS-YOLO model with the dynamic sampling mechanism. By comparing the prediction distribution of the three models on the four categories of “high”, “medium”, “low” and “background”, the changing trend and advantages of the model’s recognition ability in the gradual improvement process can be systematically revealed. Figure 4 shows the confusion matrix diagram of the three models.
Figure 4.
Confusion matrix results.
From the confusion matrix in Figure 4, YOLOv11 has a very prominent classification confusion in multi-category recognition tasks. The error rate is relatively high between the “medium” and “low” categories. For example, only 17% of the samples in the “medium” category can be correctly classified, and a large number of samples are mistakenly judged as “high” or “background”, which reflects that the model’s representation ability at the intermediate semantic level has certain limitations. After the introduction of the ASF module, the YOLOv11-ASF model has improved the recognition accuracy of the “high” and “medium” categories. The values on the diagonal are all 1.00. The model can accurately distinguish these target categories with higher semantic levels. However, there is still a deviation in the recognition of the “low” category. Among them, 87% of the “low” category is correctly identified, but some are still misjudged as “background”, which shows that there is room for improvement in the discrimination of low semantic areas. After integrating the DySample module, the ADS-YOLO model achieved 100% classification accuracy in all categories, and the confusion matrix showed an ideal diagonal distribution. The model had good feature extraction and scale adaptation capabilities, which could effectively identify various types of targets and overcome the challenges brought by semantic overlap between categories. It can be seen that the introduction of the ASF and DySample modules improved the model’s discrimination ability, especially in fine category distinction and background suppression.
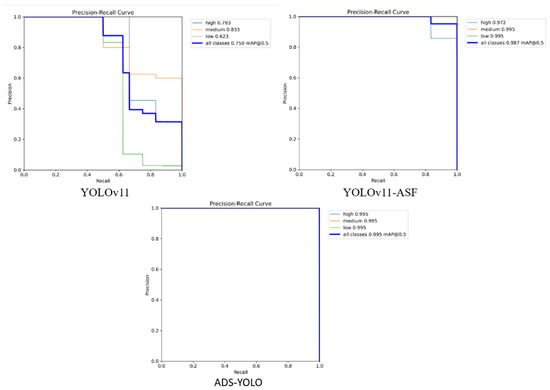
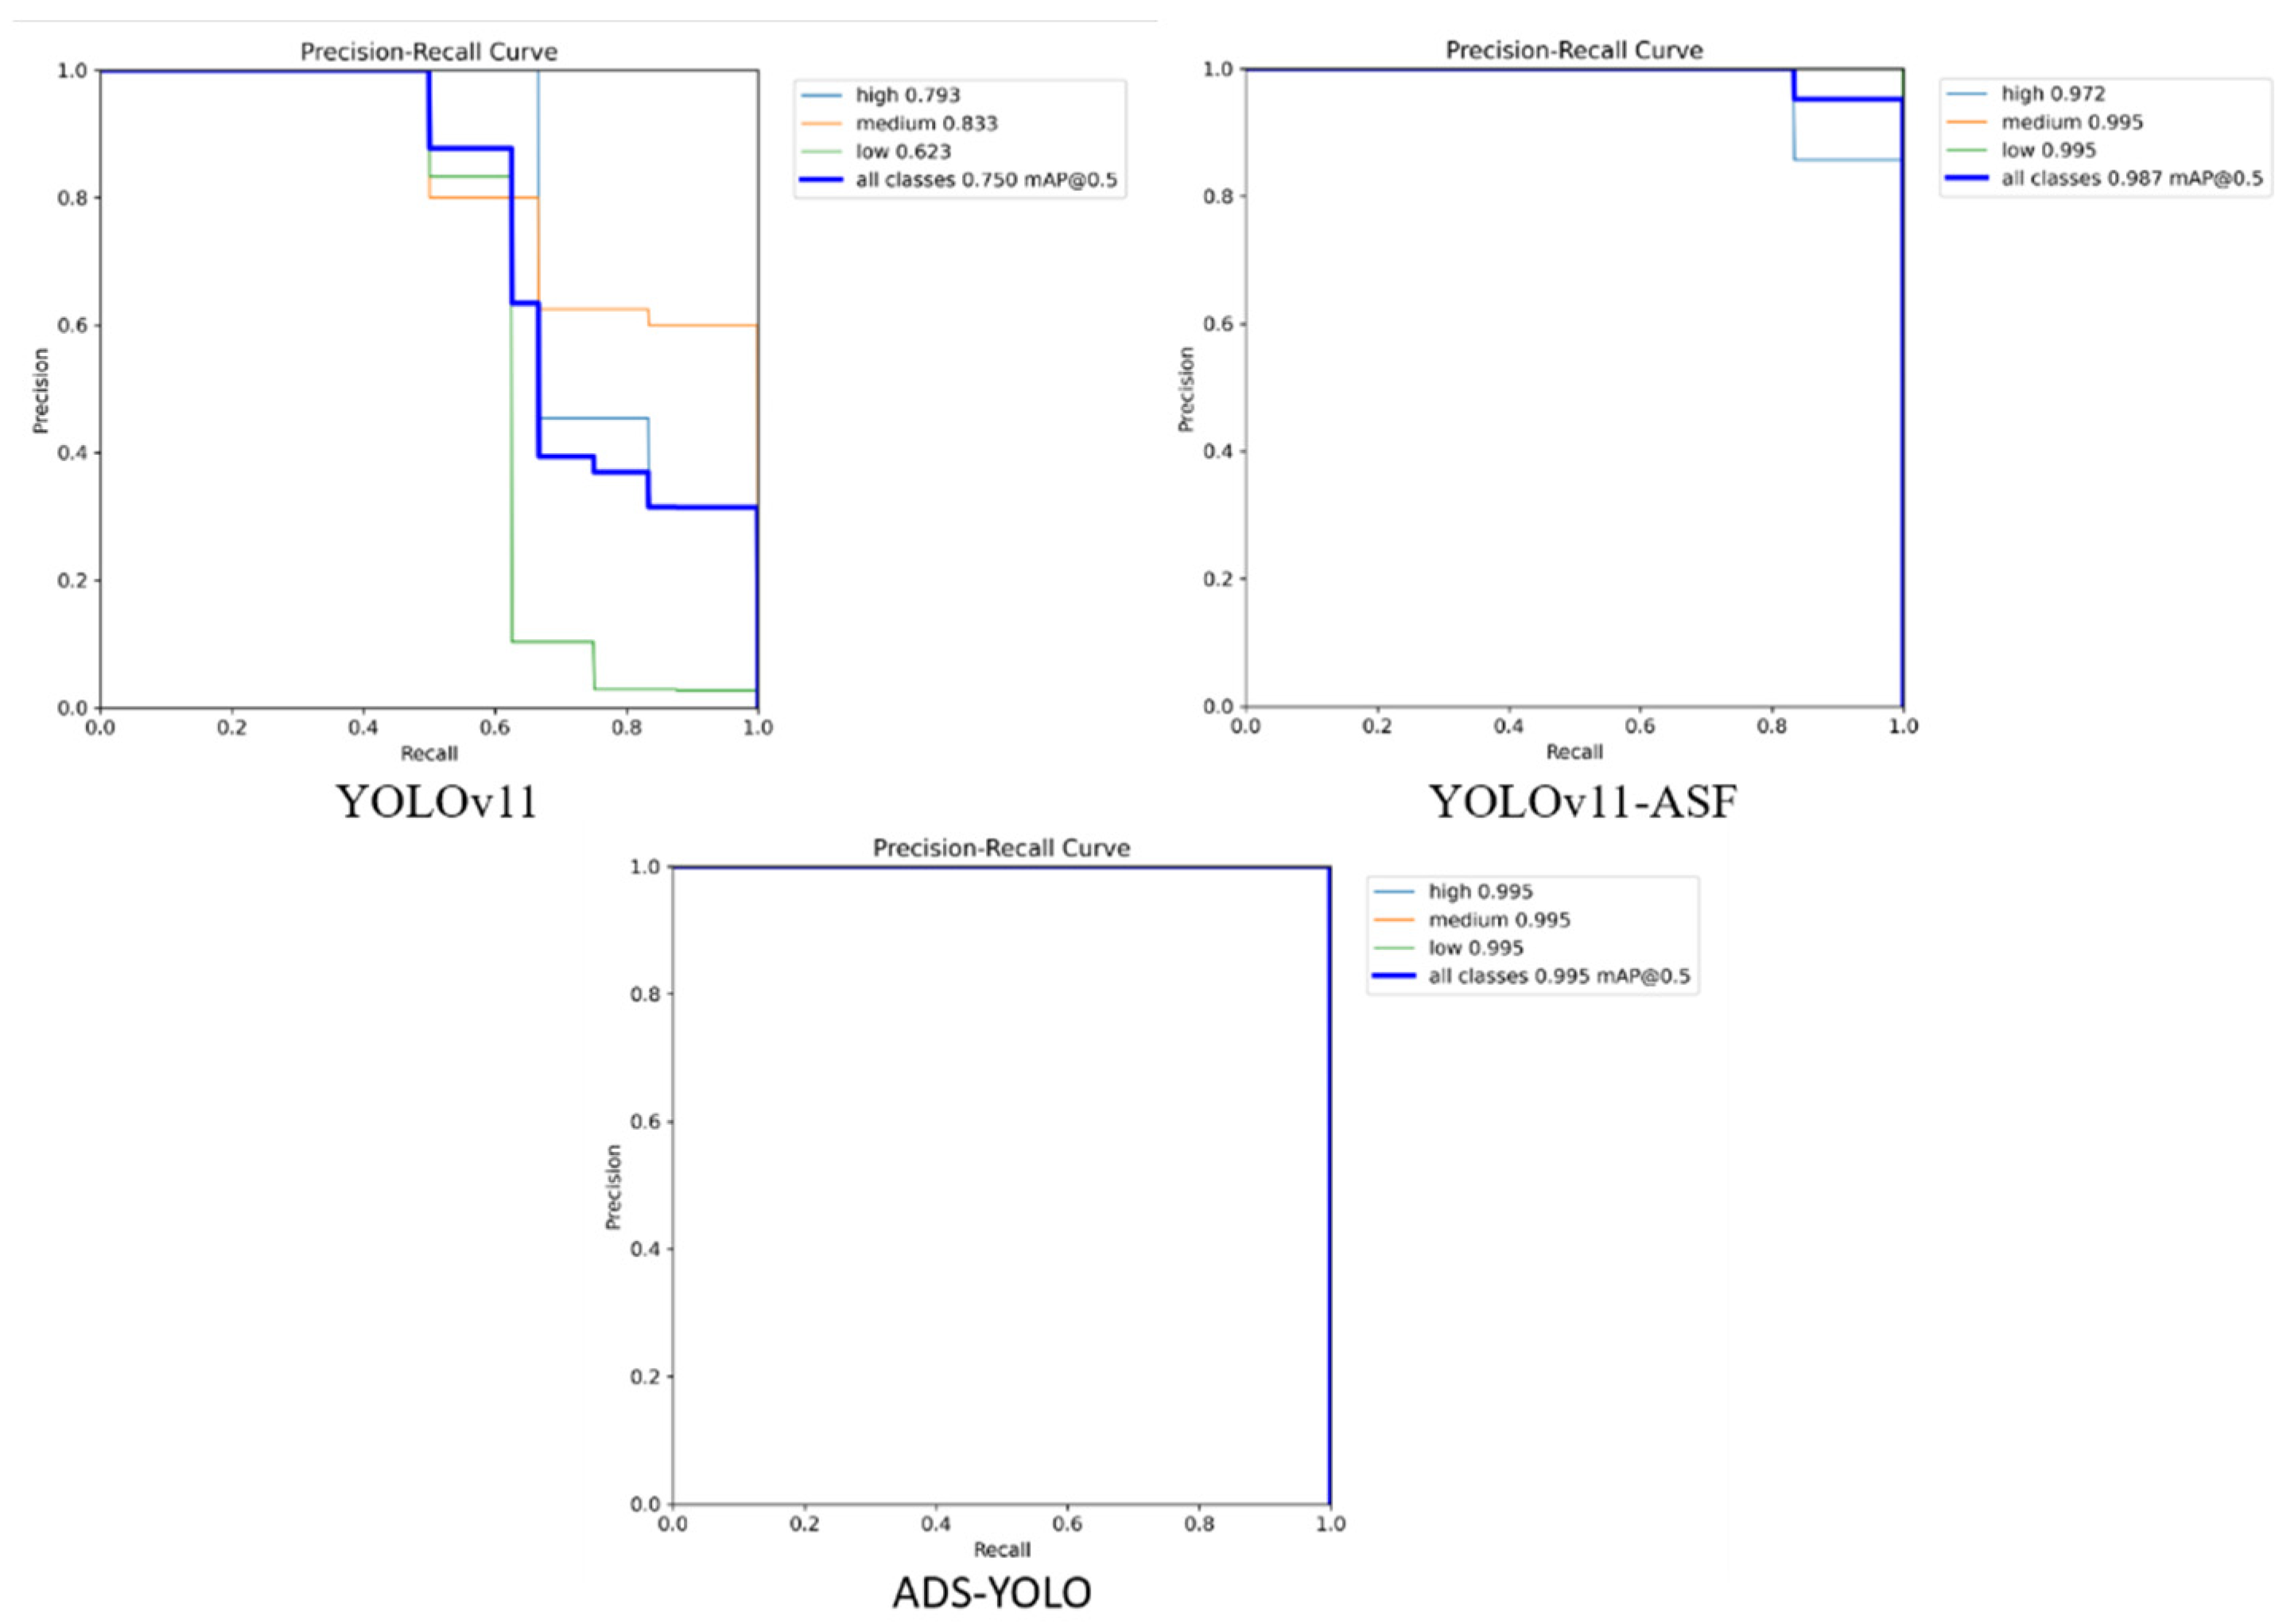
4.3.3. PR Curve Results Analysis
To evaluate the overall performance of the model in detecting different categories of objects, this paper analyzes the Precision-Recall curve of the YOLOv11 series of models, and uses mAP@0.5 as a measurement indicator to fully reflect the trade-off between the model’s precision and recall. Figure 5 shows the PR curves of the three models.
Figure 5.
PR curve.
As can be seen from Figure 5, YOLOv11 shows a large volatility as a whole, the curve is step-shaped and the decline is obvious. In the “low” category, the precision declines rapidly with the increase in recall rate, resulting in the mAP value of this category being only 0.623, and the overall mAP@0.5 is 0.750, which shows that the model is insufficient in the detection of low-confidence targets and boundary targets. After the introduction of the ASF module, the YOLOv11-ASF model shows a smoother and nearly full PR curve in all three categories, and the relationship between precision and recall is more coordinated. The mAP values of the three categories of targets all reach 0.972 and above, and the comprehensive mAP@0.5 is increased to 0.987, which verifies that the attention mechanism has an effect on improving the feature expression ability. After adding the DySample module, the PR curve of ADS-YOLO almost reaches the ideal state, and the mAP values of the three categories of targets are all 0.995. The curve presents a nearly rectangular outline, indicating that the model can maintain a high prediction accuracy within the full recall range. In short, the ASF and DySample modules work together to improve the model’s ability to perceive category discrimination boundaries and target consistency, allowing the model to achieve the optimal balance between precision and recall, and improving detection performance and stability.
4.4. Comparative Experiments
In the field of object detection, different models have different performances on key evaluation indicators such as precision, recall, and mAP. By comparing the experimental results of Faster-RCNN, SSD, DETR, RT-DETR, and YOLOv11 series models, we can deeply analyze the advantages and disadvantages and applicability of each method in actual detection tasks. Table 3 shows the performance comparison of different models on the dataset in this article.
Table 3.
Comparison experimental results of different models.
As shown in Table 1, different object detection models exhibit clear disparities across four key metrics: precision (P), recall (R), F1 score, and mAP@0.5. Faster R-CNN, a representative two-stage detector, achieves a precision of 93.00%, recall of 53.00%, F1 score of 41.00%, and mAP@0.5 of 39.10%. Its performance remains relatively well-balanced across metrics. As a one-stage detector, SSD yields a precision of 80.00%, recall of 53.00%, F1 score of 39.00%, and mAP@0.5 of 30.20%. Its overall performance is inferior to that of Faster R-CNN. DETR achieves a precision of 7.20%, recall of 19.35%, F1 score of 1.79%, and mAP@0.5 of 7.20%. Under the current experimental conditions, the model fails to achieve satisfactory detection performance.
The RT-DETR model achieves slightly better performance than DETR, with a precision of 9.10%, recall of 66.67%, F1 score of 14.89%, and mAP@0.5 of 12.17%, though these results remain relatively low overall. The suboptimal performance of the transformer-based DETR and RT-DETR models can likely be attributed to the limited size of the training dataset. These architectures typically require extensive pre-training on large-scale datasets to achieve convergence and competitive performance, and their effectiveness may be constrained when trained on smaller, specialized datasets such as the one used in this study. In addition to detection accuracy, model complexity and computational efficiency are critical for real-time monitoring applications. As shown in Table 1, the Params and GFLOPs metrics reveal significant differences between the models. The proposed ADS-YOLO and the baseline YOLOv11 are exceptionally lightweight, with only 2.6 M parameters and 7.2 and 6.5 GFLOPs, respectively. In contrast, other models like Faster-RCNN, SSD, DETR, and RT-DETR are substantially larger, with parameter counts ranging from 35.6 M to 42.0 M and significantly higher computational loads. Crucially, the significant performance improvements of ADS-YOLO—achieving a mAP@0.5 of 99.50%—come at a negligible cost, with no increase in parameters and only a minor increase in GFLOPs compared to the baseline YOLOv11. This demonstrates that the integrated ASF and DySample modules enhance accuracy efficiently without imposing a heavy computational burden. The combination of high accuracy and low complexity makes the ADS-YOLO model highly suitable for deployment on mobile or edge devices for real-time field monitoring tasks. The YOLOv11 series exhibits outstanding performance. The baseline YOLOv11 model achieves a precision of 68.13%, recall of 60.32%, F1 score of 55.72%, and mAP@0.5 of 65.94%, substantially outperforming the aforementioned methods. Incorporating the ASF-DySample module led to significant improvements across all evaluation metrics. ADS-YOLO achieves 98.22% precision, 100.00% recall, 99.10% F1 score, and 99.50% mAP@0.5, demonstrating markedly enhanced robustness and accuracy in object detection tasks.
Overall, YOLOv11 and its enhanced variants achieved the best performance in this study. ADS-YOLO approaches or achieves near-perfect scores across multiple metrics, reflecting its strong adaptability to detection tasks and superior overall performance. These findings indicate that integrating adaptive sampling and feature enhancement mechanisms can effectively boost the detection performance of object detection models.
4.5. Ablation Experiment
To verify the effectiveness of the DySample module in the YOLOv11-ASF model, this paper designed an ablation experiment to compare the performance differences in the YOLOv11-ASF model and the ADS-YOLO model after adding the DySample module in terms of precision (P), recall (R), and mAP@0.5. The experimental results are shown in Table 4.
Table 4.
Ablation experiments of different models.
As shown in the ablation results in Table 2, even without the DySample module, the YOLOv11-ASF model exhibits strong performance, achieving a precision of 86.47%, recall of 89.55%, F1 score of 87.97%, and mAP@0.5 of 96.75%. The integration of the DySample module led to substantial improvements across all evaluation metrics. Specifically, precision increased to 98.22%, recall reached a perfect 100.00%, the F1 score rose to 99.10%, and mAP@0.5 improved further to 99.50%. These findings demonstrate that the DySample module substantially enhances the model’s capacity to represent target features, markedly improves detection accuracy and completeness, and further optimizes overall object detection performance with minimal computational overhead.
4.6. Visualization Analysis
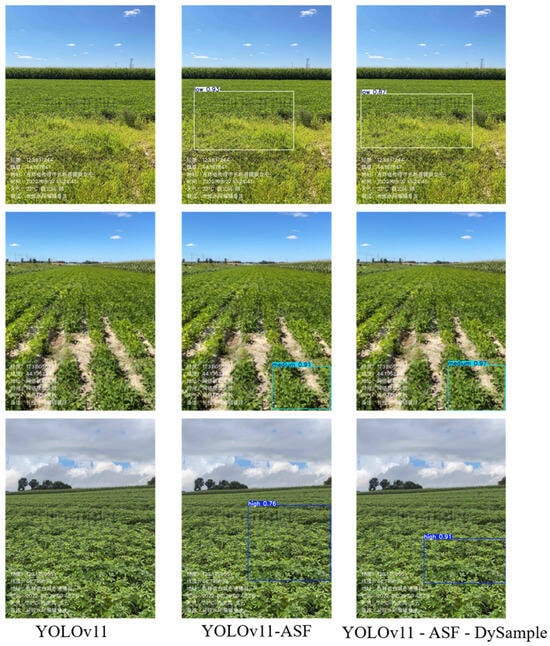
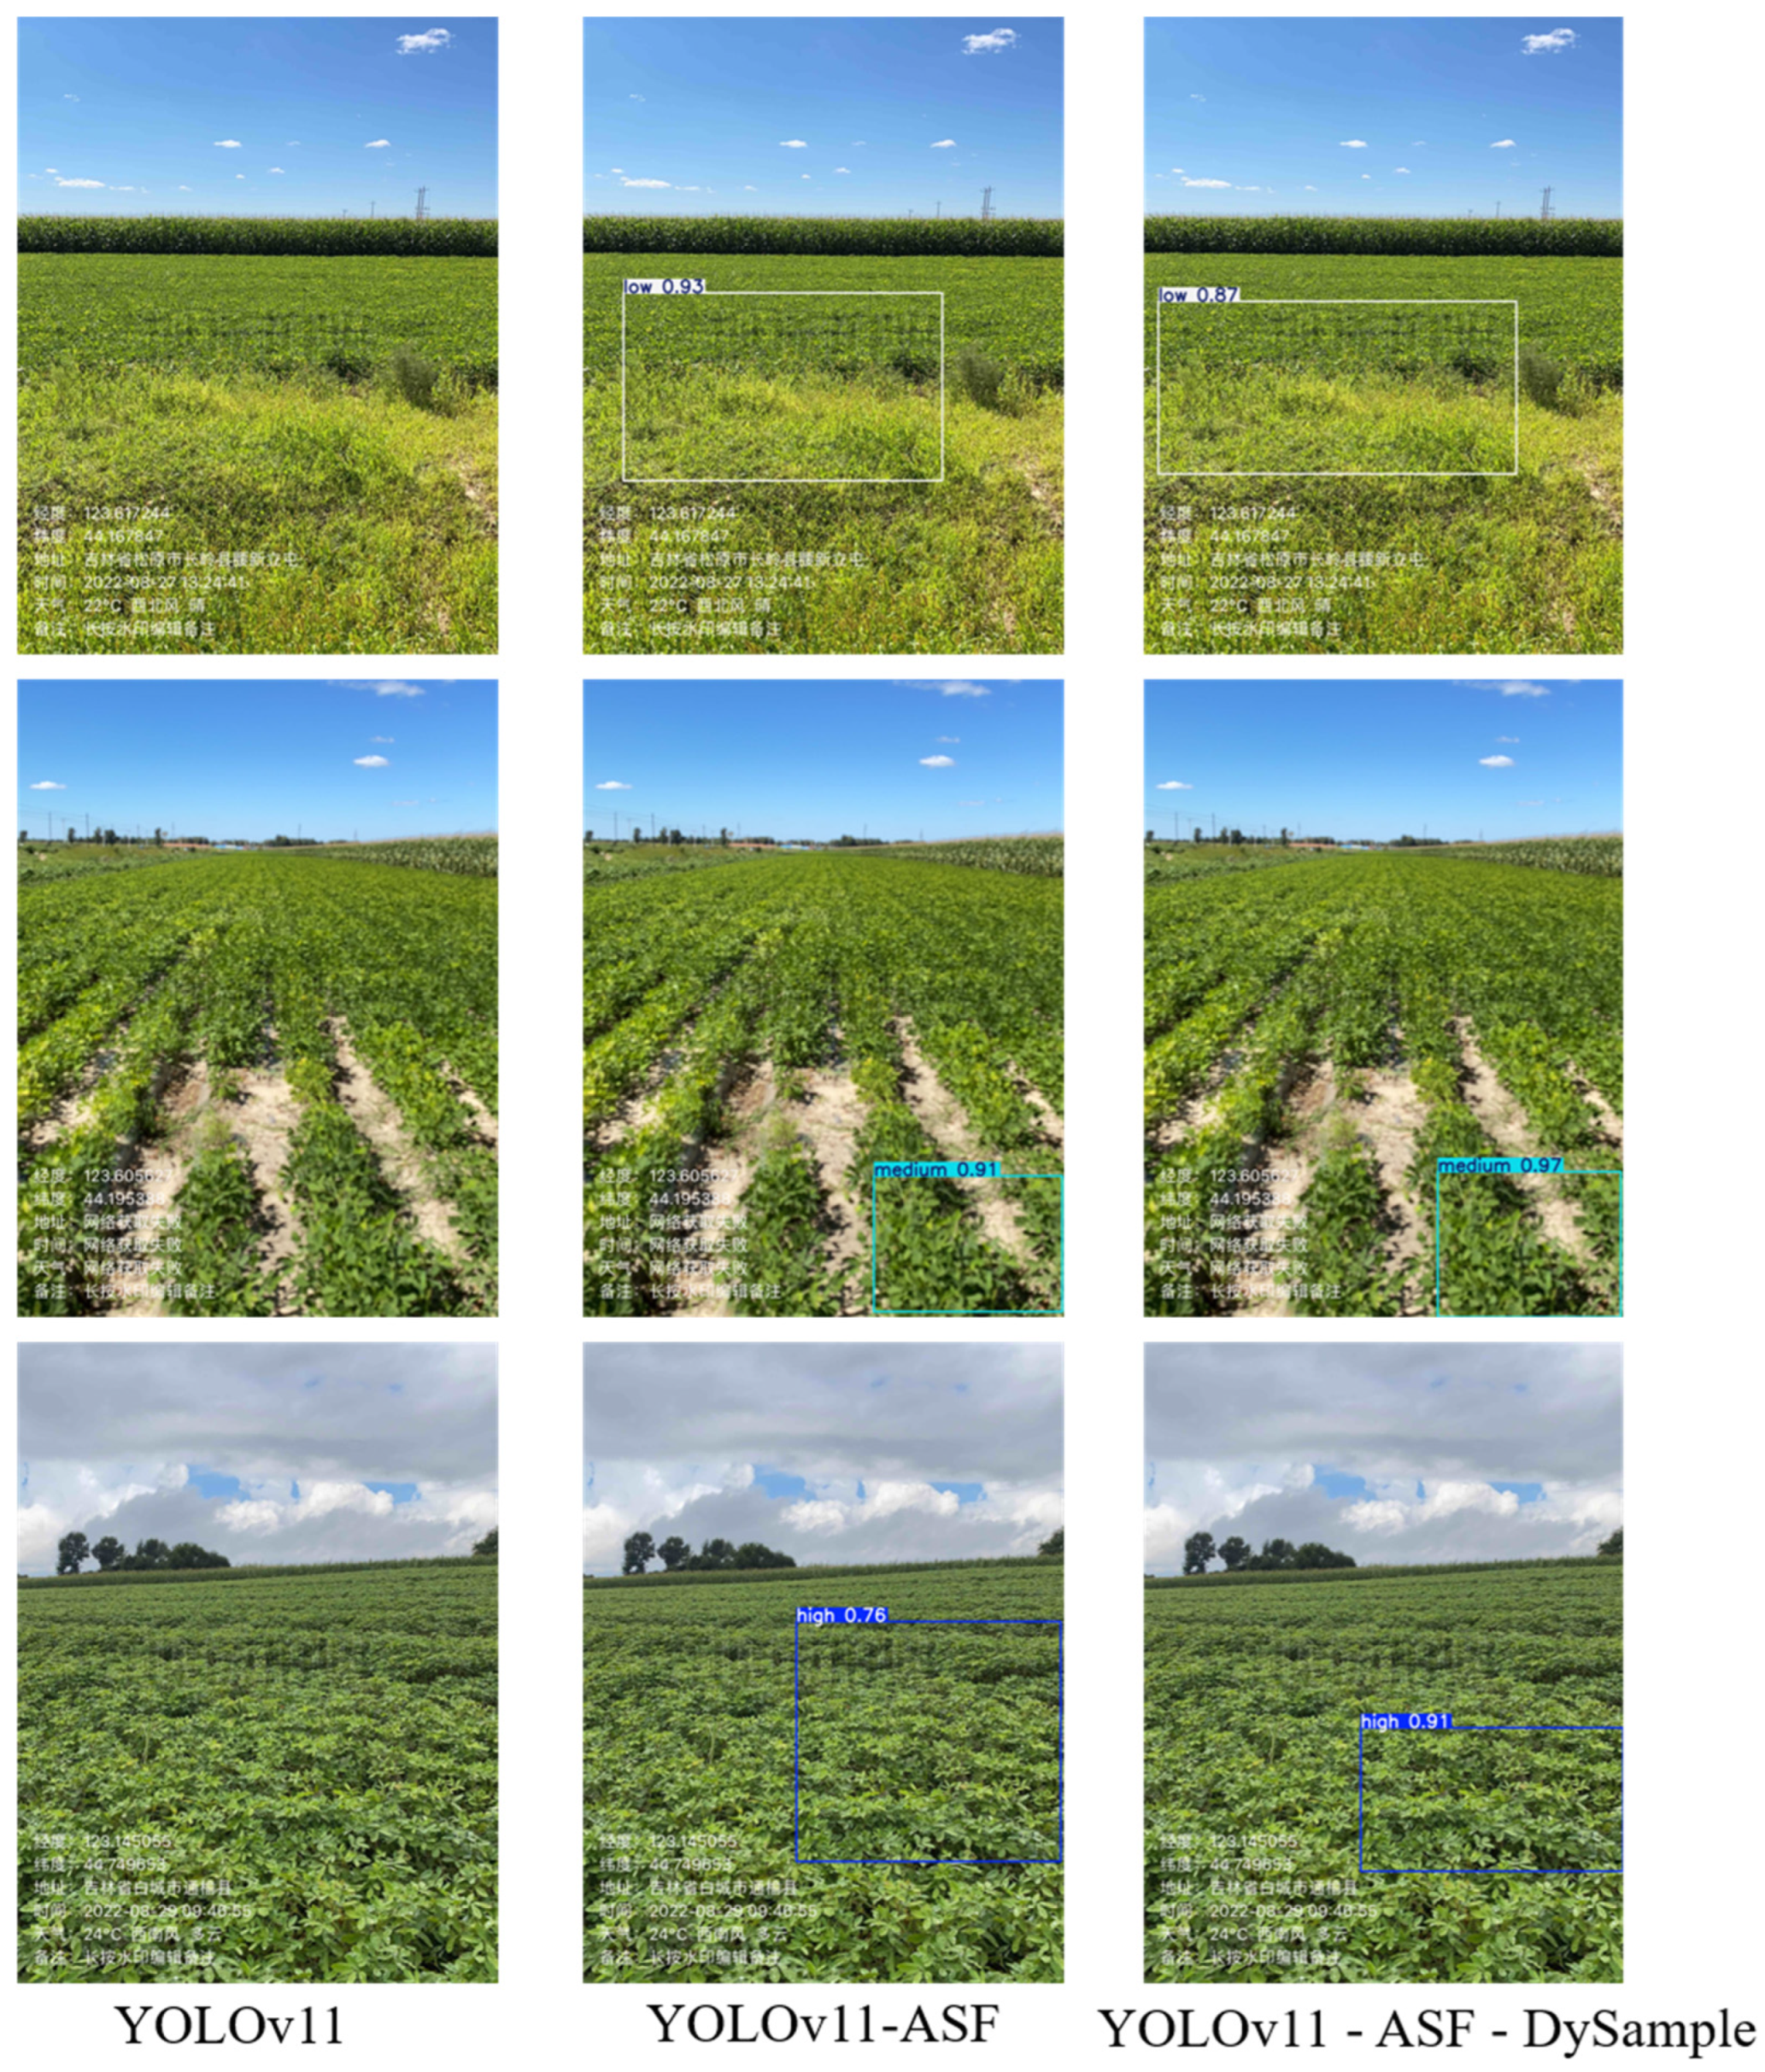
This paper conducts visualization analysis on the detection results of YOLOv11 and its improved models. By comparing the detection effects of different models in real field environments, the differences in target positioning and classification accuracy of each method can be intuitively presented. Figure 6 shows the detection situation of each model in actual conditions.
Figure 6.
Visual analysis of different models.
From the results of the experimental visualization presented in Figure 6, it can be seen that the YOLOv11 model failed to detect any growth grade targets in the three groups of field crop images, showing that the detection ability is insufficient. In comparison, although the YOLOv11-ASF model can detect some targets, there is still room for improvement in terms of confidence and positioning accuracy. The most outstanding performance is the ADS-YOLO model, which can detect all three growth grade targets of “low”, “medium” and “high”, and the position of the detection frame is more accurate, and the confidence has reached a relatively high level, showing excellent robustness and generalization ability. In complex backgrounds and areas with dense crops, ADS-YOLO can still stably and accurately complete target detection. The experimental results strongly prove that after the introduction of the ASF feature enhancement module and the DySample adaptive sampling mechanism, the overall performance of the model has been improved, and it has great practical value and application potential for intelligent identification of field crop growth levels. ADS-YOLO has shown advantages in actual agricultural remote sensing and smart farmland monitoring, and can provide more accurate and reliable technical support for farmland management and crop growth assessment.
5. Discussion
This study systematically improved the YOLOv11 network structure and proposed a ADS-YOLO model that integrates the ASF attention module and the DySample dynamic upsampling mechanism, which effectively improved the real-time and non-destructive monitoring capability of the nitrogen nutrition status of the peanut population. Experimental data show that the model significantly surpasses the original YOLOv11 model and other common detection models in key indicators such as precision, recall, and average precision, showing extremely high detection accuracy and model robustness. This achievement not only theoretically enriches the application system of deep learning methods in the field of agricultural remote sensing and crop phenotypic monitoring, but also provides a practical technical foundation for large-scale intelligent monitoring and scientific fertilization in actual farmland environments.
Specifically, the ASF module plays an important role in multi-scale feature fusion and semantic information extraction. By introducing space-scale feature fusion and quasi-time series feature mining mechanisms, the model can achieve efficient information interaction between feature expressions of different scales and levels, significantly improving the detection capability of small and medium-sized targets, low-contrast areas, and leaf occlusion scenes in farmland. The DySample dynamic upsampling mechanism dynamically adjusts the sampling point position to address the feature loss problem caused by fixed sampling during the upsampling stage, realizes adaptive reconstruction of the feature map at the spatial structure and detail information level, and greatly optimizes the model’s adaptability to target edges and complex backgrounds. These structural innovations not only improve the detection accuracy of the model, but also ensure the detection stability and generalization ability under actual conditions such as high density, complex lighting, and frequent occlusion in the field.
By comparing with typical target detection algorithms such as Faster-RCNN, SSD, DETR, and RT-DETR, the ADS-YOLO model shows absolute advantages in both precision and recall, especially in recall rate and mAP@0.5 indicators, which basically reach or approach 100%. The experimental visualization results further prove that the improved model can not only accurately distinguish targets of different nitrogen nutrition levels, but also has accurate positioning frames and high confidence, and has stable detection performance regardless of simple or complex backgrounds. This fully demonstrates that the multi-scale feature fusion and dynamic sampling strategy proposed in this study can effectively alleviate the problem of insufficient adaptability of traditional models in scenarios such as multi-category, small targets, high occlusion, and low contrast and greatly expand the application boundaries of target detection algorithms in agricultural remote sensing scenarios.
It is worth emphasizing that the deployment of the ADS-YOLO model provides solid technical support for new digital agricultural application scenarios such as farmland drone remote sensing, intelligent agricultural machinery, and remote agricultural monitoring, which helps to accelerate the transformation of traditional agriculture towards digitalization, intelligence, and precision. In the process of field production management, intelligent monitoring based on this model can realize rapid diagnosis and zoning management of crop nutrition status, and then provide accurate decision-making basis for scientific fertilization, resource optimization allocation, and environmental protection, which is conducive to promoting high-quality development of agricultural production and ecological sustainability.
Of course, this study also has certain limitations. First of all, the data used in the current experiment mainly come from specific regions and stages, and have not yet covered different ecological zones, soil types, and peanut varieties in different ranges. Furthermore, the near-perfect results reported, such as the 100% recall and >99% mAP for the ADS-YOLO model, should be interpreted with caution. While demonstrating the model’s high efficacy on the test set, these results may also reflect the limited diversity of the dataset rather than universal superiority. The generalization ability and adaptability of the model still need to be further verified in a wider range of application scenarios. Secondly, although this study has optimized the model detection accuracy and computational efficiency, the deployment on edge devices or low-power hardware platforms still faces practical challenges such as resource constraints and response delays. It is necessary to further improve the deployment efficiency through methods such as model pruning, quantization, and operator optimization. In addition, the current model mainly focuses on the monitoring of nitrogen nutrition single factor. In actual production, crop growth is synergistically affected by multiple nutrients and environmental factors. In the future, the model perception capability should be further expanded to achieve joint identification and comprehensive diagnosis of multiple targets such as multiple nutrients, pests and diseases, and stress, so as to adapt to the more complex and dynamic needs of smart farmland management.
In summary, this study has made breakthrough progress in the intelligent, real-time and high-throughput directions of crop nutrition monitoring, and promoted the integration and innovation of deep learning and agricultural engineering intersections. In the future, further in-depth research can be conducted based on multimodal data fusion, cross-crop transfer learning, lightweight deployment, and intelligent decision-making on agricultural conditions to enhance the application breadth and practical value of the model, and help the sustainable development of my country’s agricultural intelligence and green and efficient production system.
To further validate the scientific value of our method, it is necessary to compare it with existing studies. Previous research using traditional machine learning demonstrated that color indices are effective under controlled lighting but struggle with the severe occlusion and variable illumination typical of field conditions. Our ADS-YOLO overcomes these bottlenecks by learning deep semantic features rather than relying on handcrafted thresholds. Similarly, while hyperspectral imaging studies have achieved high chemical inversion accuracy for nitrogen content, they often suffer from low spatial resolution and high hardware costs, making them unsuitable for real-time detection of small individual leaves. In contrast, our approach strikes a balance between precision and deployment cost, offering a viable solution for ordinary farmers.
From an agronomic perspective, it is important to acknowledge the physiological uniqueness of peanuts as a leguminous crop. Unlike cereals whose nitrogen status is linearly dependent on soil fertilizer application, peanuts obtain a significant portion of nitrogen through symbiotic fixation by rhizobia. This biological characteristic means that the actual nitrogen nutritional status of the plant may not strictly correlate with the amount of fertilizer applied. Therefore, non-destructive visual monitoring of the canopy phenotype—as proposed in this study—becomes even more critical than simple fertilization records for accurate nutrient management. Future work will extend this validation to non-leguminous crops to assess the model’s generalization capability across different physiological mechanisms.
Despite the promising results, this study has limitations. First, the dataset is relatively small and collected from a specific geographical region and a single peanut variety. While cross-validation validates the method’s internal stability, its generalization to other varieties or varying soil backgrounds requires further verification. Second, the current model relies on RGB images, which may be less sensitive to early-stage nitrogen stress compared to hyperspectral data.
6. Conclusions
This study effectively improved the YOLOv11 model by introducing the ASF module and the DySample dynamic upsampling mechanism, significantly improving its performance in real-time monitoring of nitrogen nutrition status in peanut populations. Experimental results show that the ADS-YOLO model outperforms the baseline model YOLOv11 and other comparison models in terms of multi-scale target detection, feature expression, and model robustness. The model can accurately identify the nitrogen nutrition status of peanut populations, effectively overcome the limitations of traditional nitrogen detection methods, and provide a reliable technical means for achieving precision fertilization in field environments. In the future, the application potential of this model in nitrogen nutrition monitoring of other crops can be further explored, and the model can be optimized to adapt to more complex farmland environments. Future work will focus on two directions: (1) Data Expansion: We will expand the dataset to include multi-regional samples and integrate UAV-based multispectral imagery to enhance detection sensitivity. (2) Edge Deployment: We aim to further optimize the model using quantization techniques to deploy the ADS-YOLO algorithm on mobile devices and agricultural drones for real-time, offline field monitoring.
Author Contributions
T.Z.: Conceptualization, Methodology, Writing—original draft. H.F.: Data curation, Formal analysis, Validation. Y.F.: Investigation, Resources, Visualization. X.P.: Software, Methodology, Writing—review & editing. L.Z.: Supervision, Project administration, Funding acquisition. All authors have read and agreed to the published version of the manuscript.
Funding
This study was funded by Dr. Li Zhu with the number [20240302092gx], and APC was funded by the [science and technology development program] of Jilin Province.
Institutional Review Board Statement
Not applicable.
Informed Consent Statement
Not applicable.
Data Availability Statement
The original contributions presented in this study are included in the article. Further inquiries can be directed to the corresponding author.
Conflicts of Interest
The authors declare no conflict of interest.
References
- Hu, Y.; Zhao, T.; Guo, Y.; Wang, M.; Brachhold, K.; Chu, C.; Hanson, A.; Kumar, S.; Lin, R.; Long, W.; et al. 100 essential questions for the future of agriculture. Mod. Agric. 2023, 1, 4–12. [Google Scholar] [CrossRef] [Scilit]
- Li, G.; Guo, X.; Sun, W.; Hou, L.; Wang, G.; Tian, R.; Wang, X.; Qu, C.; Zhao, C. Nitrogen application in pod zone improves yield and quality of two peanut cultivars by modulating nitrogen accumulation and metabolism. BMC Plant Biol. 2024, 24, 48. [Google Scholar] [CrossRef] [Scilit] [PubMed]
- Zhang, L.; Wang, L. Development status, existing problems and policy recommendations of peanut industry in China. China Oils Fats 2020, 45, 116–122. [Google Scholar]
- Huang, Z.; Zhang, J.; Ren, D.; Hu, J.; Xia, G.; Pan, B. Modeling and assessing water and nitrogen use and crop growth of peanut in semi-arid areas of Northeast China. Agric. Water Manag. 2022, 267, 107621. [Google Scholar] [CrossRef] [Scilit]
- Kebede, E. Contribution, utilization, and improvement of legumes-driven biological nitrogen fixation in agricultural systems. Front. Sustain. Food Syst. 2021, 5, 767998. [Google Scholar] [CrossRef] [Scilit]
- Luo, L.; Zhang, Y.; Xu, G. How does nitrogen shape plant architecture. J. Exp. Bot. 2020, 71, 4415–4427. [Google Scholar] [CrossRef] [Scilit]
- Asif, M.; Rayamajhi, A.; Mahmud, M.S. Technological Progress Toward Peanut Disease Management: A Review. Sensors 2025, 25, 1255. [Google Scholar] [CrossRef] [Scilit]
- Yang, Q.; Li, L.; Zhang, X.; Miao, Y.; Sheng, K.; Zhang, D.; Wang, Y. Effect of nitrogen application on yield, quality and light temperature physiological characteristics of summer peanut. Chin. J. Eco-Agric. 2024, 32, 627–639. [Google Scholar]
- Wu, Q.; Xu, L.; Zou, Z.; Wang, J.; Zeng, Q.; Wang, Q.; Zhen, J.; Wang, Y.; Zhao, Y.; Zhou, M. Rapid nondestructive detection of peanut varieties and peanut mildew based on hyperspectral imaging and stacked machine learning models. Front. Plant Sci. 2022, 13, 1047479. [Google Scholar] [CrossRef] [Scilit]
- Zhao, S.; Lü, J.L.; Xu, X.P.; Luiz, M.R.; Ciampitti, I.; He, P. Peanut yield, nutrient uptake and nutrient requirements in different regions of China. J. Integr. Agric. 2021, 20, 2502–2511. [Google Scholar] [CrossRef] [Scilit]
- Xia, G.; Wang, Y.; Hu, J.; Wang, S.; Zhang, Y.; Wu, Q.; Chi, D. Effects of supplemental irrigation on water and nitrogen use, yield, and kernel quality of peanut under nitrogen-supplied conditions. Agric. Water Manag. 2021, 243, 106518. [Google Scholar] [CrossRef] [Scilit]
- Sui, X.; Zou, J.; Geng, Z.; Yang, H.; Hou, J.; Feng, L. Electrochemical impedance spectroscopy for pear ripeness detection and integration with robotic manipulators. Food Control 2025, 177, 111425. [Google Scholar] [CrossRef] [Scilit]
- Shi, P.; Wang, Y.; Xu, J.; Zhao, Y.; Yang, B.; Yuan, Z.; Sun, Q. Rice nitrogen nutrition estimation with RGB images and machine learning methods. Comput. Electron. Agric. 2021, 180, 105860. [Google Scholar] [CrossRef] [Scilit]
- Qiao, D.; Yang, J.; Bai, B.; Li, G.; Wang, J.; Li, Z.; Liu, J.; Liu, J. Non-destructive monitoring of peanut leaf area index by combing UAV spectral and textural characteristics. Remote Sens. 2024, 16, 2182. [Google Scholar] [CrossRef] [Scilit]
- Qi, H.; Wu, Z.; Zhang, L.; Li, J.; Zhou, J.; Jun, Z.; Zhu, B. Monitoring of peanut leaves chlorophyll content based on drone-based multispectral image feature extraction. Comput. Electron. Agric. 2021, 187, 106292. [Google Scholar] [CrossRef] [Scilit]
- Bagherian, K.; Bidese-Puhl, R.; Bao, Y.; Zhang, Q.; Sanz-Saez, A.; Dang, P.M.; Lamb, M.C.; Chen, C. Phenotyping agronomic and physiological traits in peanut under mid-season drought stress using UAV-based hyperspectral imaging and machine learning. Plant Phenome J. 2023, 6, E20081. [Google Scholar] [CrossRef] [Scilit]
- Hasituya, L.; Salah, E.; Hu, Y.; Schmidhalter, U. Passive reflectance sensing using optimized two- and three band spectral indices for quantifying the total nitrogen yield of maize. Comput. Electron. Agric. 2020, 173, 105403. [Google Scholar] [CrossRef] [Scilit]
- Kawamura, K.; Asai, H.; Yasuda, T.; Soisouvanh, P.; Phongchanmixay, S. Discriminating crops/weeds in an upland rice field from UAV images with the SLIC-RF algorithm. Agron. Crop Ecol. 2021, 24, 198–215. [Google Scholar] [CrossRef] [Scilit]
- Chianucci, F.; Andrea, L.; Dell’Abate, M. Estimation of ground canopy cover in agricultural crops using downward-looking photography. Biosyst. Eng. 2018, 169, 209–216. [Google Scholar] [CrossRef] [Scilit]
- Niu, Y.; Han, W.; Zhang, H.; Zhang, L.; Chen, H. Estimating fractional vegetation cover of maize under water stress from UAV multispectral imagery using machine learning algorithms. Comput. Electron. Agric. 2021, 189, 106414. [Google Scholar] [CrossRef] [Scilit]
- Liu, Y.; Song, Y.; Liang, C.; Cao, M.; Wu, J. A data-driven minimum cost consensus model for group decision making with personality traits prediction. Inf. Sci. 2025, 690, 121556. [Google Scholar] [CrossRef] [Scilit]
- Wang, Y.; Li, X.; Long, K.; Wei, P. Open-Source Codes of Topology Optimization: A Summary for Beginners to Start Their Research. Comput. Model. Eng. Sci. 2023, 137, 34. [Google Scholar] [CrossRef] [Scilit]
- Li, W.; Yu, Y.; Meng, F.; Duan, J.; Zhang, X. A image fusion and U-Net approach to improving crop planting structure multi-category classification in irrigated area. J. Intell. Fuzzy Syst. Appl. Eng. Technol. 2023, 45, 185–198. [Google Scholar] [CrossRef] [Scilit]
- Büchi, L.; Wendling, M.; Muoly, P.; Charles, R. Comparison of visual assessment and digital Image analysis for canopy cover estimation. Agron. J. 2018, 110, 1289–1295. [Google Scholar] [CrossRef] [Scilit]
- Wang, N.; Liu, H.; Li, Y.; Zhou, W.; Ding, M. Segmentation and phenotype calculation of rapeseed pods based on YOLO v8 and mask R-convolution neural networks. Plants 2023, 12, 3328. [Google Scholar] [CrossRef] [Scilit]
- Tripathi, A.; Gohokar, V.; Kute, R. Comparative Analysis of YOLOv8 and YOLOv9 Models for Real-Time Plant Disease Detection in Hydroponics. Eng. Technol. Appl. Sci. Res. 2024, 14, 17269–17275. [Google Scholar] [CrossRef] [Scilit]
- Liu, Y.; Li, X.; Fan, Y.; Liu, L.; Shao, L.; Yan, G.; Geng, Y.; Zhang, Y. Classification of peanut pod rot based on improved YOLOv5s. Front. Plant Sci. 2024, 15, 1364185. [Google Scholar] [CrossRef] [Scilit]
- Lee, D.Y.; Kim, T.H.; Kim, A.N.; Kwon, K.H.; Lee, D.H. Deep learning-based peanut seeds appearance quality classification model. J. Korea Inst. Inf. Electron. Commun. Technol. 2025, 18, 95–103. [Google Scholar]
- de Brito Filho, A.L.; Carneiro, F.M.; dos Santos Carreira, V.; Tedesco, D.; Souza, J.B.C.; Júnior, M.R.B.; da Silva, R.P. Deep convolutional networks based on lightweight YOLOv8 to detect and estimate peanut losses from images in post-harvesting environments. Comput. Electron. Agric. 2025, 234, 110282. [Google Scholar] [CrossRef] [Scilit]

Disclaimer/Publisher’s Note: The statements, opinions and data contained in all publications are solely those of the individual author(s) and contributor(s) and not of MDPI and/or the editor(s). MDPI and/or the editor(s) disclaim responsibility for any injury to people or property resulting from any ideas, methods, instructions or products referred to in the content. |
© 2026 by the authors. Licensee MDPI, Basel, Switzerland. This article is an open access article distributed under the terms and conditions of the Creative Commons Attribution (CC BY) license.