


Abstract
The decarbonization of port operations is becoming increasingly important due to tightening environmental regulations and the growing adoption of shore power solutions. However, the large-scale deployment of conventional onshore power supply (OPS) systems often is constrained by limited grid capacity, high infrastructure costs, and variability in the environmental performance of grid electricity. Against this backdrop, this study investigates whether an integrated port microgrid can provide a viable alternative for enabling cold ironing in grid-constrained ports. A case study is developed for a commercial port characterized by a maximum grid import capacity of 3 MW and a peak shore power demand of approximately 20 MW. Two alternative configurations are evaluated: conventional onboard auxiliary engine generation and an integrated microgrid incorporating combined heat and power (CHP) units, photovoltaic generation, battery energy storage, and thermal integration through heat recovery. Results indicate that the integrated microgrid can satisfy the required shore power demand while significantly reducing both costs and emissions compared with onboard generation under the assumptions of the case study. The proposed configuration achieves a levelized cost of energy (LCOE) of 0.157 €/kWh, corresponding to a reduction of approximately 22% compared to the conventional onboard auxiliary engine generation, and a reduction in annual CO2 emissions of about 36%. The system also maintains operational continuity during a simulated 24 h grid outage at the hourly simulation resolution, while an N + 1 criterion is adopted separately for sizing the on-site generation architecture. Beyond the quantitative benefits, the findings highlight the role of cogeneration as an enabling technology for integrating multiple energy vectors within port infrastructures. By coupling electricity generation, thermal recovery, renewable energy, and storage within a coordinated microgrid architecture, the proposed solution transforms grid-capacity limitations into opportunities for energy system optimization. The study contributes to the growing literature on ports as multi-energy hubs and provides evidence that integrated CHP-based microgrids can represent a technically feasible and economically competitive pathway for supporting cold ironing in ports where grid reinforcement is constrained, delayed, or costly under the conditions examined in this study.
1. Introduction
1.1. Port Decarbonization and the Role of Shore Power
Maritime transport is responsible for approximately 1 Gt of greenhouse gas (GHG) emissions, corresponding to roughly 3% of total global emissions [1], with shipping-related emissions further estimated to cause approximately 60,000 deaths per year worldwide from cardiopulmonary disease and lung cancer [2]. These emissions occur both when ships are at sea and when ships are docked in port [3,4]. During berthing operations, vessels typically rely on onboard auxiliary engines to supply electricity for hoteling and auxiliary services [5,6], resulting in continuous emissions of CO2 and local air pollutants such as NOx, SOx, and particulate matter [7,8]. These emissions, in some contexts exceeding those associated with vessel navigation [9], directly affect port workers, nearby urban populations, and coastal ecosystems [10].
Ports have, therefore, emerged as strategic leverage points for accelerating maritime decarbonization [11], a view reinforced by the European Commission through a strategic document specifically dedicated to ports and their decarbonization process [12]. In particular, shore power, also referred to as cold ironing or onshore power supply (OPS), enables berthed vessels to switch off auxiliary engines and connect to shore-based electricity. Compared to propulsion-related measures, which often require long asset lifetimes and vessel retrofitting, such interventions can deliver immediate emission reductions during port stays. Previous studies have demonstrated that OPS can significantly reduce local air pollution and noise, while also contributing to GHG mitigation when electricity is supplied from low-carbon sources [13].
In addition to the support deriving from the strategic plan published by the European Commission [12], the importance of shore power has been reinforced by an increasingly stringent regulatory framework at the international level. The International Maritime Organization (IMO) has introduced progressively tighter carbon intensity targets for shipping [14], while at the regional level the European Union has adopted regulatory instruments such as the FuelEU Maritime Regulation [15] and the Alternative Fuels Infrastructure Regulation (AFIR) [16], which mandate the availability and use of shore power for specific vessel categories within defined timelines. Interest in these solutions is also observable in North America and parts of Asia, where port electrification and shore power requirements are increasingly embedded within broader decarbonization and air quality strategies, even though the regulations there are comparatively less stringent [17,18].
This global convergence of regulatory drivers underscores that shore power deployment constitutes a shared priority across ports worldwide.
1.2. Limitations of Conventional Cold Ironing Implementations
Despite its environmental benefits and strong regulatory support, the large-scale deployment of conventional grid-connected shore power systems remains limited worldwide [19], reflecting several barriers that hinder the adoption of these solutions. Although the presence and relevance of these barriers vary considerably by region [20], several recurring challenges can be identified in OPS implementation.
The first category concerns economic barriers. Several studies show that the economic viability of OPS often depends more on regulatory mandates and financial incentives than on intrinsic cost competitiveness, since electricity supplied through shore power from the local grid can be more expensive than onboard power generation [11,21,22,23]. This situation becomes even more pronounced where tax regimes exempt electricity produced onboard vessels [24], calling for corresponding changes in the regulatory framework. Another economic barrier concerns the lack of initial capital, which prevents investors from securing sufficient resources to sustain costs throughout the investment lifetime [25]. In general, investors often find it challenging to identify an attractive business model for such investments [24,26].
A second category of barriers concerns the actual environmental benefits achievable through conventional OPS implementation. The environmental effectiveness of OPS is highly context-dependent [27]: in regions where electricity generation remains carbon-intensive, shore power may primarily shift emissions from the transportation sector to the power sector, resulting in limited net climate benefits despite improvements in local air quality [8,26]. China illustrates this pattern: research shows that shore power delivers a net emissions benefit only in provinces with a cleaner power mix, while most coastal regions with carbon-intensive grids show limited or negative results [28].
Additional barriers also affect the deployment of conventional OPS solutions. The lack of standardization, for instance, prevents operators from implementing consistent technical solutions, as different ports must satisfy different technical constraints, as discussed in several studies [24,29,30,31]. Another barrier relates to the “chicken-and-egg” nature of OPS adoption [26]: addressing this dynamic makes collaboration and collective action among all actors within the port ecosystem boundaries of paramount importance [19]. A further relevant barrier concerns gaps in the technical competence operators need to implement these solutions at ports [32,33].
While these aspects certainly deserve further analysis in future studies, the present research focuses on a port facing another major barrier to the deployment of conventional OPS solutions: the limited capacity of local electrical grids in many port areas. Supplying OPS to large vessels may require several megawatts per berth, often exceeding available grid capacity and necessitating costly and time-consuming infrastructure reinforcements [34,35,36]. As an example, UK port companies estimated that their electricity capacity requirements could reach an average of around 91 MW, against a current median and average capacity of 5.5 MW and 11.7 MW, respectively, and most of them indicated that the upgrades already planned would only partially cover their expected future demand [37]. Other studies have similarly highlighted the limited preparedness of many ports to host these solutions [38]. As noted in [39], while most of the literature has focused on techno-economic assessments of port electrification, comparatively few studies have been devoted to feasibility analyses.
1.3. Ports as Multi-Energy Systems and Microgrids
Moving beyond the narrow view of a single-vector electrification approach, a stream of the literature positions cold ironing as one component of a wider port decarbonization strategy, achieved through synergy with multi-energy systems and microgrids [8,40]. By combining distributed generation, energy storage, and controllable loads under advanced control schemes [41], these systems represent an operational architecture enabling the deployment of integrated energy systems, with the objective of improving overall efficiency, flexibility, and resilience [40,42,43]. Although the deployment of this innovative technology in seaports is still limited, it appears to be a vital strategy [44], particularly in the presence of intermittent energy generation plants, which call for an integrated approach to manage this complex energy dispatching [40]. Previous studies have demonstrated that this systematic approach can meet the day-to-day energy needs of port operations and provide emergency backup under extreme weather conditions or equipment failures [45], while also helping to reduce operating costs and improve environmental sustainability [46].
The role of port microgrids is even more interesting in environments where electrical loads (e.g., shore power, terminal operations) and thermal demands (e.g., building heating and cooling) coexist, thanks to their ability to combine power, heat, and cooling. In this case, the alignment between recovered waste heat and thermal loads is a highly relevant factor: when well matched, combined heat and power systems can reach efficiencies of up to 80–90% [47].
Beyond technical considerations, the capability of ports to become multi-energy systems is also a strategic concern, encompassing policy and governance perspectives [48]. The role of port authorities in governing this transition, for instance, is fundamental, encompassing regulation, infrastructure provision, and broader sustainability aspects [49]. More broadly, energy transition in ports and harbors should be addressed from a whole-systems perspective, given its strong dependence on policy mixes and decisions [50].
Taken together, this evidence calls for a systemic approach that considers the port as a complex multi-energy system, extending beyond its traditional role as a simple energy load.
1.4. Research Objective and Structure of the Paper
Building on the limitations of conventional OPS implementation discussed in Section 1.2, this study assesses the convenience of installing a microgrid in a port facing grid-capacity constraints. Moreover, the study frames the port as a multi-energy hub, considering both electrical and thermal loads. Consistently, the microgrid modeled in this study also comprises cogeneration engines, in addition to renewable energy assets and an energy storage system.
The remainder of the paper is organized as follows. Chapter 2 describes the methodology adopted for conducting the analysis, illustrating the research design underlying the study, along with the main technical and simulation-related aspects that have been considered. Chapter 3 presents the results of the base-case assessment, along with results obtained by changing some inputs, in order to enrich the analysis with additional results and considerations. Chapter 4 discusses the findings in relation to the existing literature and explores policy and planning implications. Chapter 5 concludes the paper and outlines directions for future research. Appendix A.1 and Appendix A.2 describe the modeling of the electrical and thermal loads.
2. Materials and Methods
2.1. Research Design and Analytical Framework
This study adopts a case-study-based techno-economic framework to evaluate alternative energy supply strategies for cold ironing in a grid-constrained port environment. In this context, the analysis investigates whether an integrated on-site microgrid can provide a viable and scalable solution. The microgrid configuration is designed to compensate for the limited grid availability (3 MW) while meeting peak shore power demand of up to 20 MW through a combination of cogeneration units (CHPs), photovoltaic generation (PV), battery energy storage (BESS), and coordinated control systems.
Given that a grid-only OPS configuration cannot satisfy the full demand under the imposed infrastructure constraint, the comparison focuses on two feasible paradigms: (i) onboard auxiliary engine generation and (ii) integrated port-based generation through a multi-vector microgrid.
The feasible system design space is defined ex ante based on engineering feasibility and operational requirements, while selected component capacities (PV, CHP and BESS) are determined through the optimization process within predefined bounds. Its performance then is evaluated through time-resolved simulation over a full annual cycle. The methodological structure clearly separates input data, dispatch modeling, and performance evaluation metrics, helping to ensure transparency and internal consistency in the comparison between configurations.
The methodological approach, depicted in Figure 1, consists of:
Figure 1.
Methodological approach adopted in the study.
- Modeling annual electrical and thermal load profiles for the port;
- Defining two alternative energy supply architectures (onboard auxiliary engine generation and integrated multi-vector microgrid) under identical demand conditions;
- Performing time-resolved dispatch simulation over 8760 h with a time resolution of 1 h;
- Evaluating economic, environmental, and operational performance;
- Testing robustness through sensitivity analysis and the “carbon-priority scenario” analysis.
2.2. Case Study Context and Energy Demand Modeling
The reference case represents a commercial port operating under a maximum external grid capacity of 3 MW. Peak vessel demand during cold ironing operations reaches approximately 20 MW, creating a structural mismatch between required and available power. This mismatch defines the core problem addressed in this study: how to supply large berth loads under existing grid-capacity constraints.
To answer this research question, as a first step it is necessary to construct energy load profiles. In particular, both electrical and thermal load profiles are constructed over a full annual horizon (8760 h).
2.2.1. Electrical Load Modeling
The electrical load profile is constructed using the methodology described in Appendix A.1. The methodology, along with the underlying data and assumptions, is consistent with a previously published work [51].
The model incorporates:
- Four vessel categories (container, cruise, RoRo/ferry, tanker);
- Vessel-specific power ranges and connection durations;
- Port baseline consumption (150–300 kW);
- Seasonal, weekly, and daily variation factors;
- Capacity constraints preventing unrealistic berth overlap.
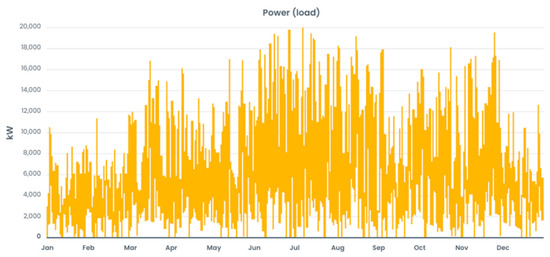
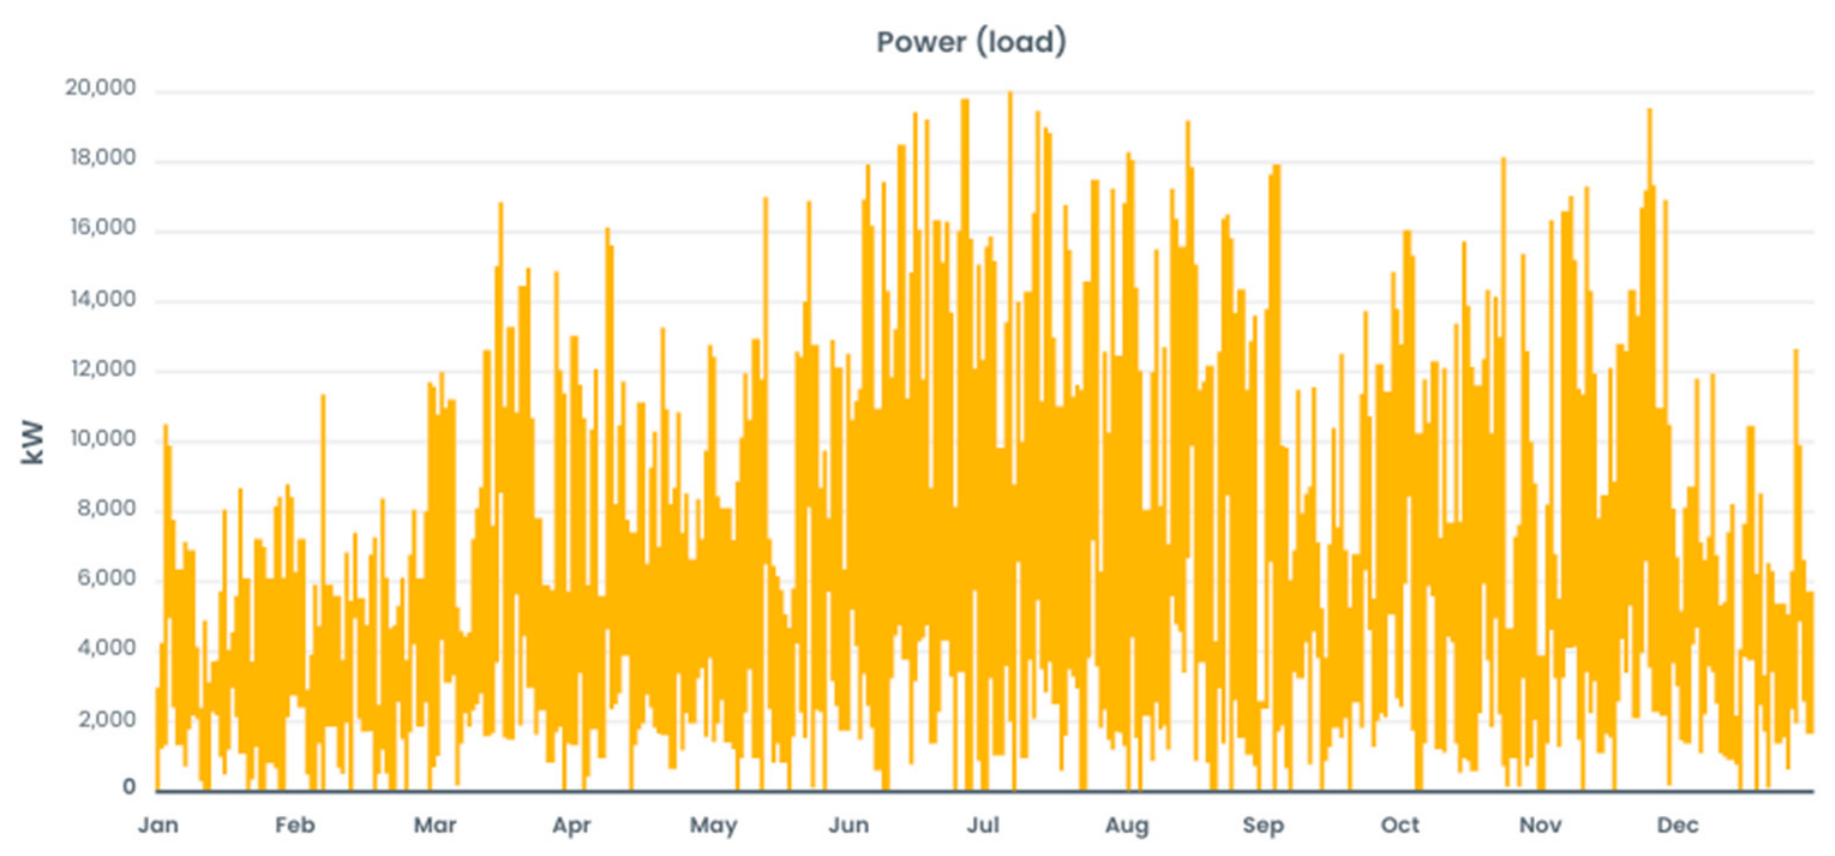
The electrical load profile, depicted in Figure 2, exhibits high intermittency due to vessel arrival patterns, reinforcing the need for flexible dispatch and storage integration.
Figure 2.
Yearly electrical load profile of the port analyzed in the study.
2.2.2. Thermal Load Modeling
The thermal load profile is modeled using the methodology detailed in Appendix A.2. The methodology, along with the underlying data and assumptions, is consistent with a previously published work [51]. The modeled terminal area is 10,000 m2, with annual energy intensities assigned to:
- Space heating;
- Domestic hot water;
- Space cooling;
- Process heat.
Thermal demand follows seasonal and hourly distribution patterns and traditionally is supplied by gas boilers (55 MW_th installed capacity).
The inclusion of thermal demand is critical because it enables evaluation of the port as a multi-vector energy system. The possibility of recovering waste heat from cogeneration fundamentally alters system efficiency and economic performance.
2.3. Energy System Configurations
As previously introduced, two alternative configurations to fulfill electrical and thermal demands are evaluated:
- Configuration A—onboard auxiliary engine generation: In the baseline configuration, vessels continue to rely on onboard auxiliary engines. This configuration serves as the reference baseline for both economic and environmental comparison. Key parameters of configuration A are summarized in Table 1.
Table 1.
Key parameters related to configuration A.
- Configuration B—integrated port microgrid: The alternative configuration consists of an integrated on-site microgrid designed to overcome grid-capacity limitations while maintaining redundancy and operational robustness. The selection of six 4.5 MW CHP units enables compliance with the N + 1 (referred to the number of on-site power generation units, CHPs) redundancy criterion to improve the microgrid availability in case of utility grid failure and allows operation within a 50–100% loading window. The battery system is dimensioned to:
- Manage transient vessel connection surges in lower load conditions (<2 MW);
- Provide about 2 h of critical load support;
- Enable load shifting to maintain generator efficiency.
In this study, the BESS was designed primarily as a flexibility and resilience asset, not as a bulk energy supply resource. Its power rating is accordingly set at an upper bound of 2 MW, sized to accommodate short-duration power variations associated with vessel connections, while its energy capacity of 4 MWh provides approximately two hours of support for critical loads. Its comparatively limited annual energy contribution is therefore consistent with this intended operational role.
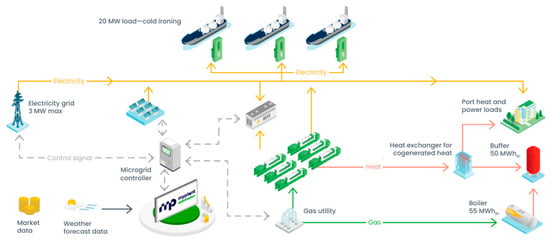
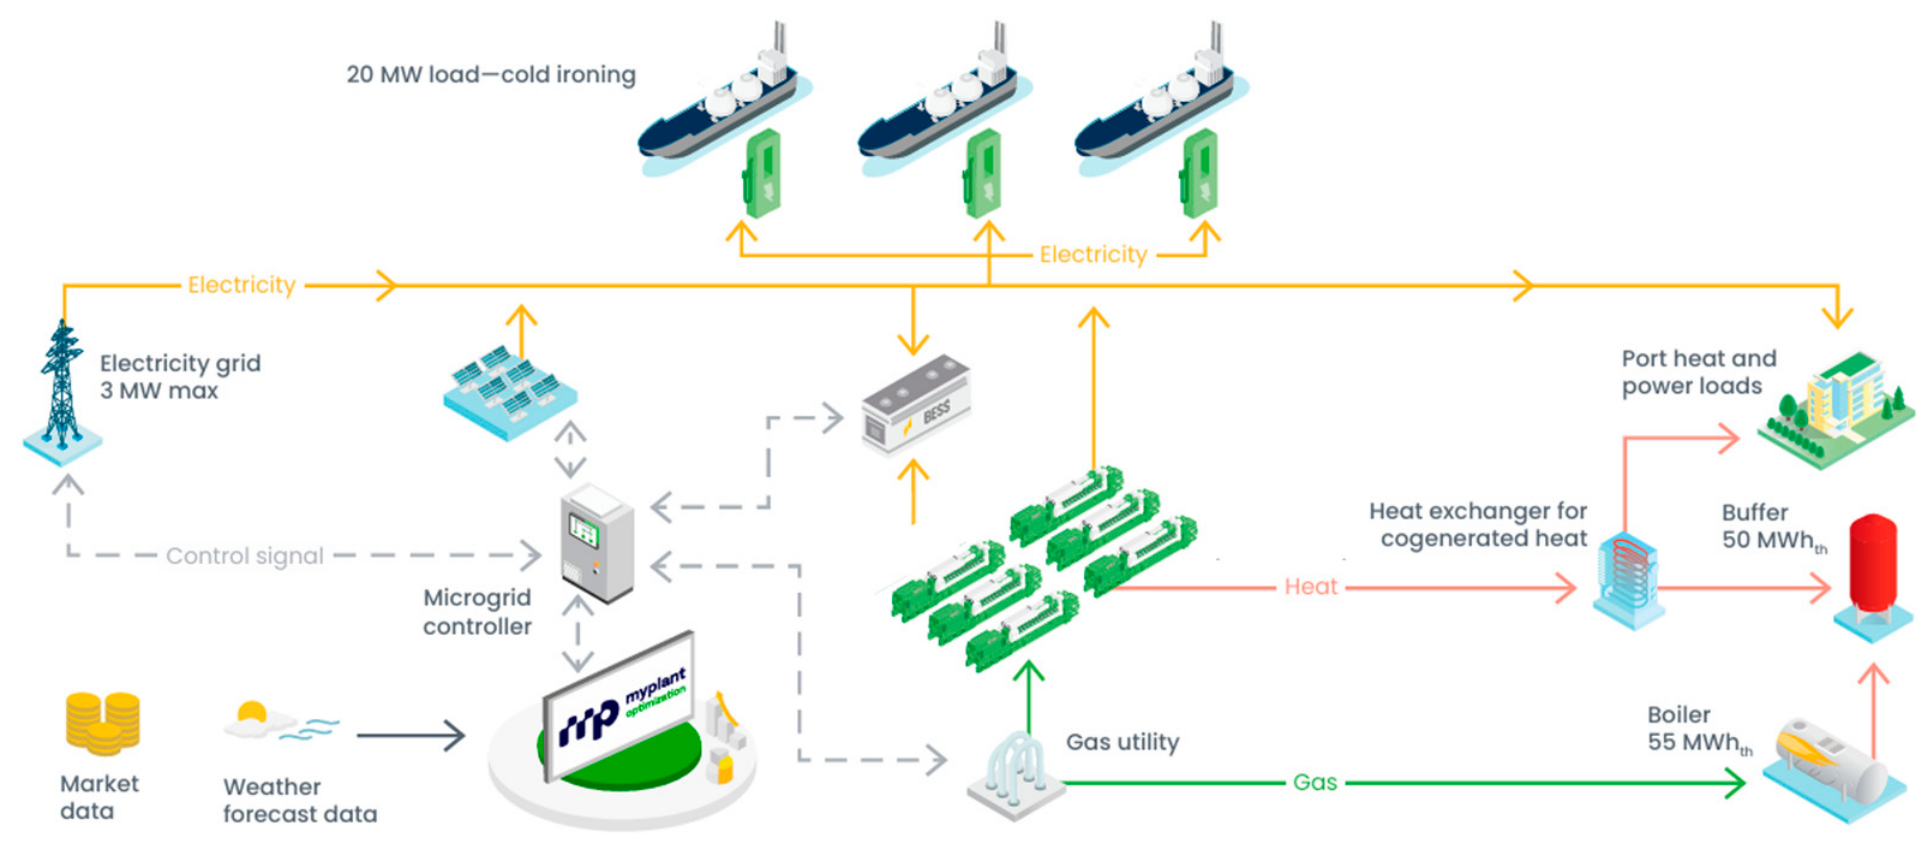
Thermal integration includes heat recovery from all CHP units and buffering through thermal storage, reducing boiler gas consumption by approximately 10%. This configuration is not merely an electrical solution; it redefines the port as an integrated energy hub capable of managing electricity and heat simultaneously. Key information describing configuration B is summarized in Table 2. For a better comprehension of the integrated port microgrid alternative, a graphical representation of configuration B is reported in Figure 3. The solar capacity is limited to 2 MW due to assumed local space constraints on the terminal roofs.
Table 2.
Key parameters related to configuration B.
Figure 3.
Graphical representation of configuration B (integrated port microgrid).
2.4. Simulation Model and and Input Parameters
The techno-economic assessment was conducted using a commercial microgrid simulation and optimization software environment. The simulation horizon covers a full calendar year (8760 h) with hourly resolution. The modeling approach is deterministic and time-series based. The optimization framework is based on a cost-minimization objective subject to component-level technical and operational constraints. The algorithm simultaneously determines the optimal system configuration and its operational strategy by minimizing the total life-cycle cost of the microgrid. In particular, the number of CHP units, BESS size (power and capacity) and PV capacity are treated as design variables, subject to predefined upper bounds established on the basis of engineering feasibility and previous microgrid-sizing experience (see Table 2). Electrical and thermal demand profiles and the 3 MW grid import limit are instead imposed as model inputs or constraints. The objective function incorporates both capital expenditures (CAPEX), associated with the sizing of generation, storage, and supporting infrastructure, and operating expenditures (OPEX), including fuel consumption and electricity purchases. Environmental criteria are not explicitly included in the optimization process. Consequently, environmental performance indicators are evaluated ex post based on the simulated energy flows and the corresponding emission factors associated with each energy source.
Electrical and thermal demands are defined exogenously, computed according to the methodology discussed in Section 2.2, and held constant within each run. The same applies to the technical parameters relating to CHP, PV, and BESS, which are summarized, respectively, in Table 3, Table 4 and Table 5.
Table 3.
Technical parameters related to CHP (representative model assumptions) (source: manufacturer technical data and authors’ engineering assumptions implemented in the optimization model).
Table 4.
Technical parameters related to PV (source: authors’ model inputs based on representative PV system specifications and site conditions).
Table 5.
Technical parameters related to BESS (source: authors’ model inputs based on representative commercial BESS specifications).
Additional aspects defined in the simulation are:
- For what concerns CHP, operating range is constrained to 50–100% of rated load (minimum stable loading assumption);
- CHP ramp-rate constraints were implemented using representative manufacturer-based engineering limits of approximately 33% of rated power per minute for ramp-up and 100% per minute for ramp-down. The detailed underlying manufacturer performance data are proprietary;
- The recoverable thermal energy from CHP units was modeled based on manufacturer performance specifications. The maximum available thermal output corresponds to the recoverable heat from exhaust gases and cooling circuits under operating conditions;
- PV is modeled as non-dispatchable with priority of dispatch within the microgrid;
- Grid import is capped at 3 MW;
- Thermal demand not covered by heat recovery is supplied via conventional boilers, with thermal storage used to buffer heat recovery and improve utilization;
- No grid export is allowed. Consequently, in cases where generation exceeds instantaneous electrical demand and storage capacity, surplus electricity is assumed to be curtailed;
- Heat recovery is limited by instantaneous demand and storage capacity. Consequently, excess thermal energy beyond storage limits is assumed to be dissipated and not credited in performance calculations;
- The BESS operates within a 20–80% SOC range, with the final SOC constrained to equal the initial SOC to avoid artificial end-of-horizon charging or depletion effects.
A deterministic 24 h grid outage scenario is simulated to evaluate resilience. No probabilistic reliability modeling is performed.
Thermal integration is assessed at the screening level through the contribution of recovered CHP heat to the port thermal demand and the resulting reduction in conventional boiler use. The purpose is to quantify the additional potential of cogeneration rather than to provide a detailed thermodynamic design of the thermal subsystem.
The simulation framework is parameterized using a consistent set of technical, economic, and environmental assumptions reflecting representative operating conditions for a grid-constrained commercial port. All input parameters are applied uniformly across the configurations analyzed to help ensure that performance differences arise exclusively from the energy supply architecture.
Key economic input parameters are summarized in Table 6. Capital costs are amortized over 20 years, and no residual value is considered.
Table 6.
Key economic input parameters considered in the study (source: market data at the time of writing and project-specific techno-economic assumptions adopted by the authors).
For the model to provide environmental performance, key parameters related to emission factor are necessary. Key emissions-related input parameters are summarized in Table 7.
Table 7.
Key emissions-related input parameters considered in the study (source: the literature/reference emission factors and authors’ assumptions adopted for the case study).
2.5. Performance Indicators
System performance is evaluated through a multidimensional framework encompassing economic, environmental, thermal, and operational criteria. This integrated evaluation approach reflects the multi-vector nature of the investigated system and enables a consistent comparison between onboard auxiliary engine generation and the integrated microgrid configuration.
From an economic perspective, the primary metric adopted is the levelized cost of energy (LCOE), which provides a comprehensive measure of lifetime electricity supply cost by integrating capital expenditures and operating costs over the project horizon. LCOE is defined by the following equation (Equation (1)):
where: represents total capital investment; , annual operational expenditures; fuel costs; purchased electricity costs; total electricity supplied to vessel and port-side electrical loads within the considered system boundary; r, the financial rate, set equal to 5%; and n, the 20-year project lifetime. In addition to LCOE, total annual operating cost and fuel expenditure are quantified to provide further insight into cost structure, and the relative cost reduction compared to the onboard baseline configuration is also computed to express economic competitiveness in percentage terms. Initial capital expenditure is accounted for at the beginning of the project, while future operating, fuel, grid electricity costs, and electricity flows are discounted over the project lifetime.
Because the LCOE indicator is defined on an electrical-energy basis, useful CHP heat is not included in the LCOE denominator, and no heat-recovery credit is applied in the electrical LCOE calculation. Accordingly, the additional €4 million CAPEX associated with the heat-recovery subsystem reported in Table 6 is excluded from the reported electrical LCOE. Thermal benefits are evaluated separately through boiler fuel reduction and related thermal-system indicators.
Environmental performance is assessed within a Scope 1 and Scope 2 boundary. Scope 1 includes direct fuel combustion emissions from auxiliary engines (configuration A) and CHP units (configuration B), while Scope 2 accounts for indirect emissions associated with purchased grid electricity. The evaluation includes total annual CO2 emissions (tCO2/year), emission intensity expressed in kgCO2 per kWh supplied, and percentage emission reduction relative to the onboard baseline. Upstream emissions related to fuel extraction, processing, transportation, and infrastructure manufacturing (Scope 3) are not included in this assessment.
Given the integrated nature of the proposed microgrid (Configuration B), thermal integration is assessed at the screening level through the reduction in conventional boiler fuel consumption enabled by CHP heat recovery. This indicator is used to provide a preliminary assessment of the additional thermal benefit of cogeneration, while a detailed thermal-energy performance assessment is beyond the scope of the present study.
Finally, operational performance is evaluated through an assessment of system resilience. Specifically, a grid outage scenario was simulated assuming a 24 h interruption of the external electricity supply. During this period, the microgrid operates in island mode, with load supplied by CHP units and battery storage within their technical operating constraints. The system configuration follows an N + 1 redundancy criterion (related to the amount of on-site power generation equipment), where installed generation capacity exceeds peak demand even in the event of a single unit failure. This helps ensure continuity of supply for critical shore power loads under grid-disconnected operation. No probabilistic reliability assessment (e.g., SAIDI-/SAIFI-based modeling) was conducted; resilience assessment is based on deterministic outage simulation. Thus, although resilience is not quantified through probabilistic reliability metrics, these indicators provide a structured basis for assessing operational continuity under constrained infrastructure conditions. The selected outage represents a deterministic stress test aimed at assessing system adequacy during a prolonged loss of grid supply. In the adopted algorithm outage setting, the event is placed in the month characterized by the highest average electrical demand. It should be noted that the resilience assessment adopted in this study reflects the specific design requirements of the analyzed case study. Depending on the characteristics of the port infrastructure and the objectives of the analysis, alternative availability and reliability assessments may be considered (e.g., different outage durations, multiple equipment failure scenarios or stress tests involving simultaneous disruptions affecting generation). Therefore, the methodology presented herein should be interpreted as one possible resilience assessment framework, which can be adapted and extended according to the operational requirements and risk profile of the specific port under investigation.
2.6. Sensitivity and “Carbon-Priority Scenario” Analysis
Sensitivity analysis was performed using a one-factor-at-a-time (OFAT) approach, whereby a single parameter was varied while all others were held at their base-case values. For the grid carbon intensity parameter, a different approach was adopted instead: to compute the annual dispatch profile, the optimization objective in these runs was reformulated to prioritize CO2 reduction (the asset sizes were instead fixed as model inputs, set equal to the values obtained in the base-case assessment) and, therefore, does not follow the strict OFAT structure used for the other sensitivity cases. This alternative approach was necessary because, in the original model, the objective function does not depend on grid carbon intensity; consequently, varying this parameter alone would have had no effect on the optimization results. Although the “carbon-priority scenario” analysis is not methodologically consistent with the rest of the sensitivity analysis, the authors considered it a valuable addition, as it provides more transparent and comprehensive results.
The selected parameters reflect key uncertainties that directly affect the feasibility of shore power deployment in grid-constrained ports. Specifically, to conduct the sensitivity and “carbon-priority scenario” analysis, the following parameters were varied:
- Grid electricity price;
- CHP CAPEX;
- Battery energy storage system (BESS) CAPEX;
- Natural gas price;
- Grid carbon intensity.
Each parameter was varied using a low–base–high structure to capture realistic uncertainty bands, consistent with common energy infrastructure planning practice. Percentage-based ranges are used where cost uncertainty dominates (prices and CAPEX). Absolute values are used for grid carbon intensity to reflect real-world differences between electricity systems.
Table 8 provides a general overview of the scenarios that have been considered in the sensitivity and “carbon-priority scenario” analysis.
Table 8.
Scenarios considered in the sensitivity and “carbon-priority scenario” analysis.
The following outputs were evaluated for each sensitivity scenario and for the “carbon-priority scenario”, both in absolute terms and in percentage reduction from the base-case scenario:
- Levelized cost of energy (LCOE);
- Total annual system cost (fuel + grid electricity + fixed OPEX);
- Annual CO2 emissions (Scope 1 + Scope 2 boundary).
- Percentage CO2 reduction relative to the onboard auxiliary engine baseline configuration.
3. Results
3.1. Base-Case Scenario
This section presents the base-case scenario results for the two configurations analyzed under identical demand conditions. All results are computed over a full annual horizon (8760 h). Moreover, to provide insights regarding the microgrid functioning, Paragraph 3.1.2 complements the annual outputs with a representative weekly operational extract, also illustrating the system behavior in terms of energy flows and dispatching.
3.1.1. Configuration A: Onboard Auxiliary Engine Generation
In Configuration A, vessels meet their annual electricity demand of 46.21 GWh through onboard auxiliary engines, while an additional 8.31 GWh/year of port-side and infrastructure baseline loads are supplied by the grid. Using the adopted specific fuel consumption and conversion assumptions, annual marine diesel oil (MDO) consumption is approximately 10,166 metric tons. Applying the selected emission factor, total annual CO2 emissions are approximately 32,592 tCO2/year. The annual cost of onboard vessel electricity supply is approximately €9.326 million. Including approximately 1.662 million € per year for grid-supplied port-side baseline loads, the total annual electricity cost becomes approximately 10.99 million €, corresponding to an average cost of about €0.202/kWh over the total 54.52 GWh electrical demand. These values, summarized in Table 9, provide the reference baseline for the comparative assessment.
Table 9.
Outputs related to configuration A.
3.1.2. Configuration B: Integrated Port Microgrid
In the integrated microgrid configuration, port-side generation and flexibility assets supply shore power demand under a hard grid import constraint. The resulting asset sizes from the optimization are reported in Table 10.
Table 10.
Asset sizes resulting from optimization.
Annual electricity supply is primarily provided by the CHP units, complemented by solar PV generation and limited grid imports within the maximum import cap. In the base case, the annual electricity balance indicates that most energy is produced on-site by cogeneration, while PV and grid imports contribute smaller shares of total energy served.
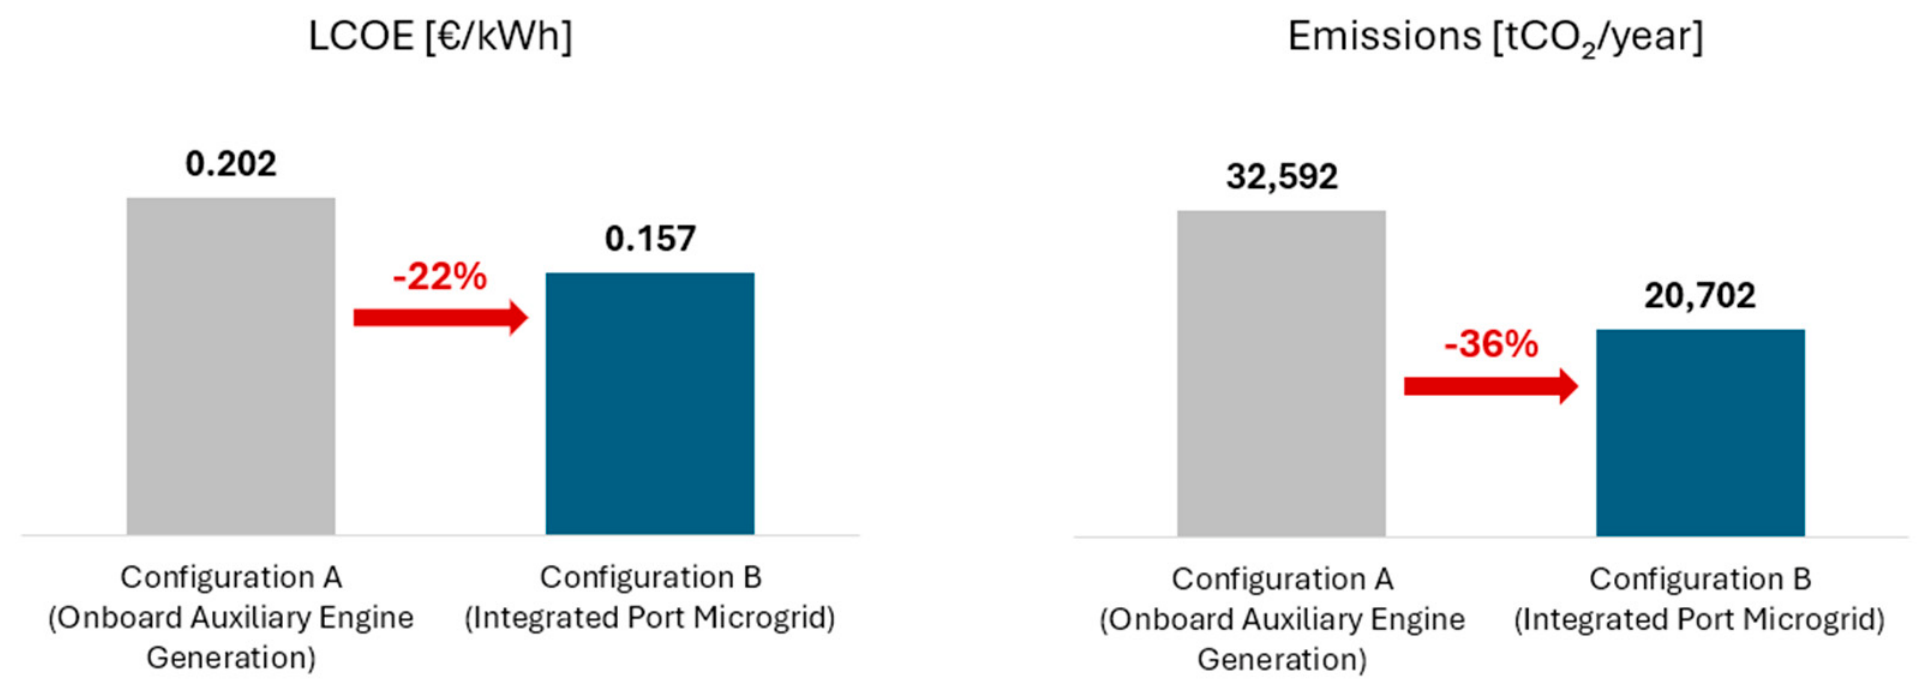
Within the assumptions adopted in this case study, the microgrid configuration achieves a reduction in levelized electricity supply cost compared to onboard generation, with an LCOE equal to 0.157 €/kWh. Specifically, the LCOE reduction is approximately 22% relative to the onboard baseline, leading to an absolute reduction equal to 0.045 €/kWh. In this case, total annual cost for energy procurement (fuel + electricity) is equal to 6.3 million €.
Under the modeled conditions, total annual CO2 emissions are lower compared to onboard generation. Specifically, microgrid annual emissions are approximately 20,702 tCO2/year, corresponding to a reduction of approximately 36% relative to the onboard baseline.
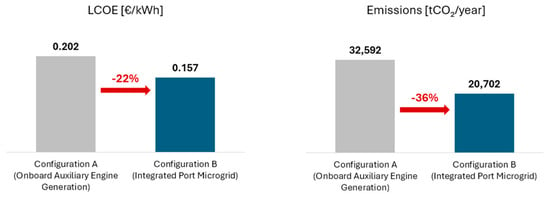
Outputs related to configuration B are summarized in Table 11, while Figure 4 graphically shows the comparison between the two configurations, respectively, regarding economic and environmental performance.
Table 11.
Outputs related to configuration B.
Figure 4.
Economic and environmental outputs associated with two configurations.
To illustrate the operational behavior of the integrated microgrid under realistic load variability, results are examined both at the annual level and through a representative weekly dispatch extract.
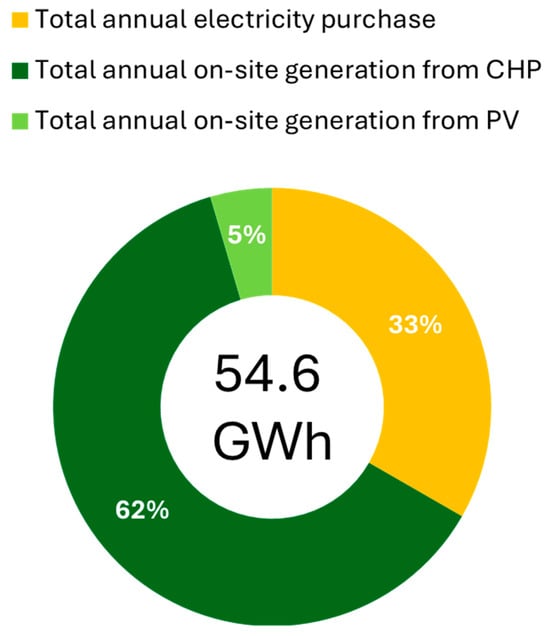
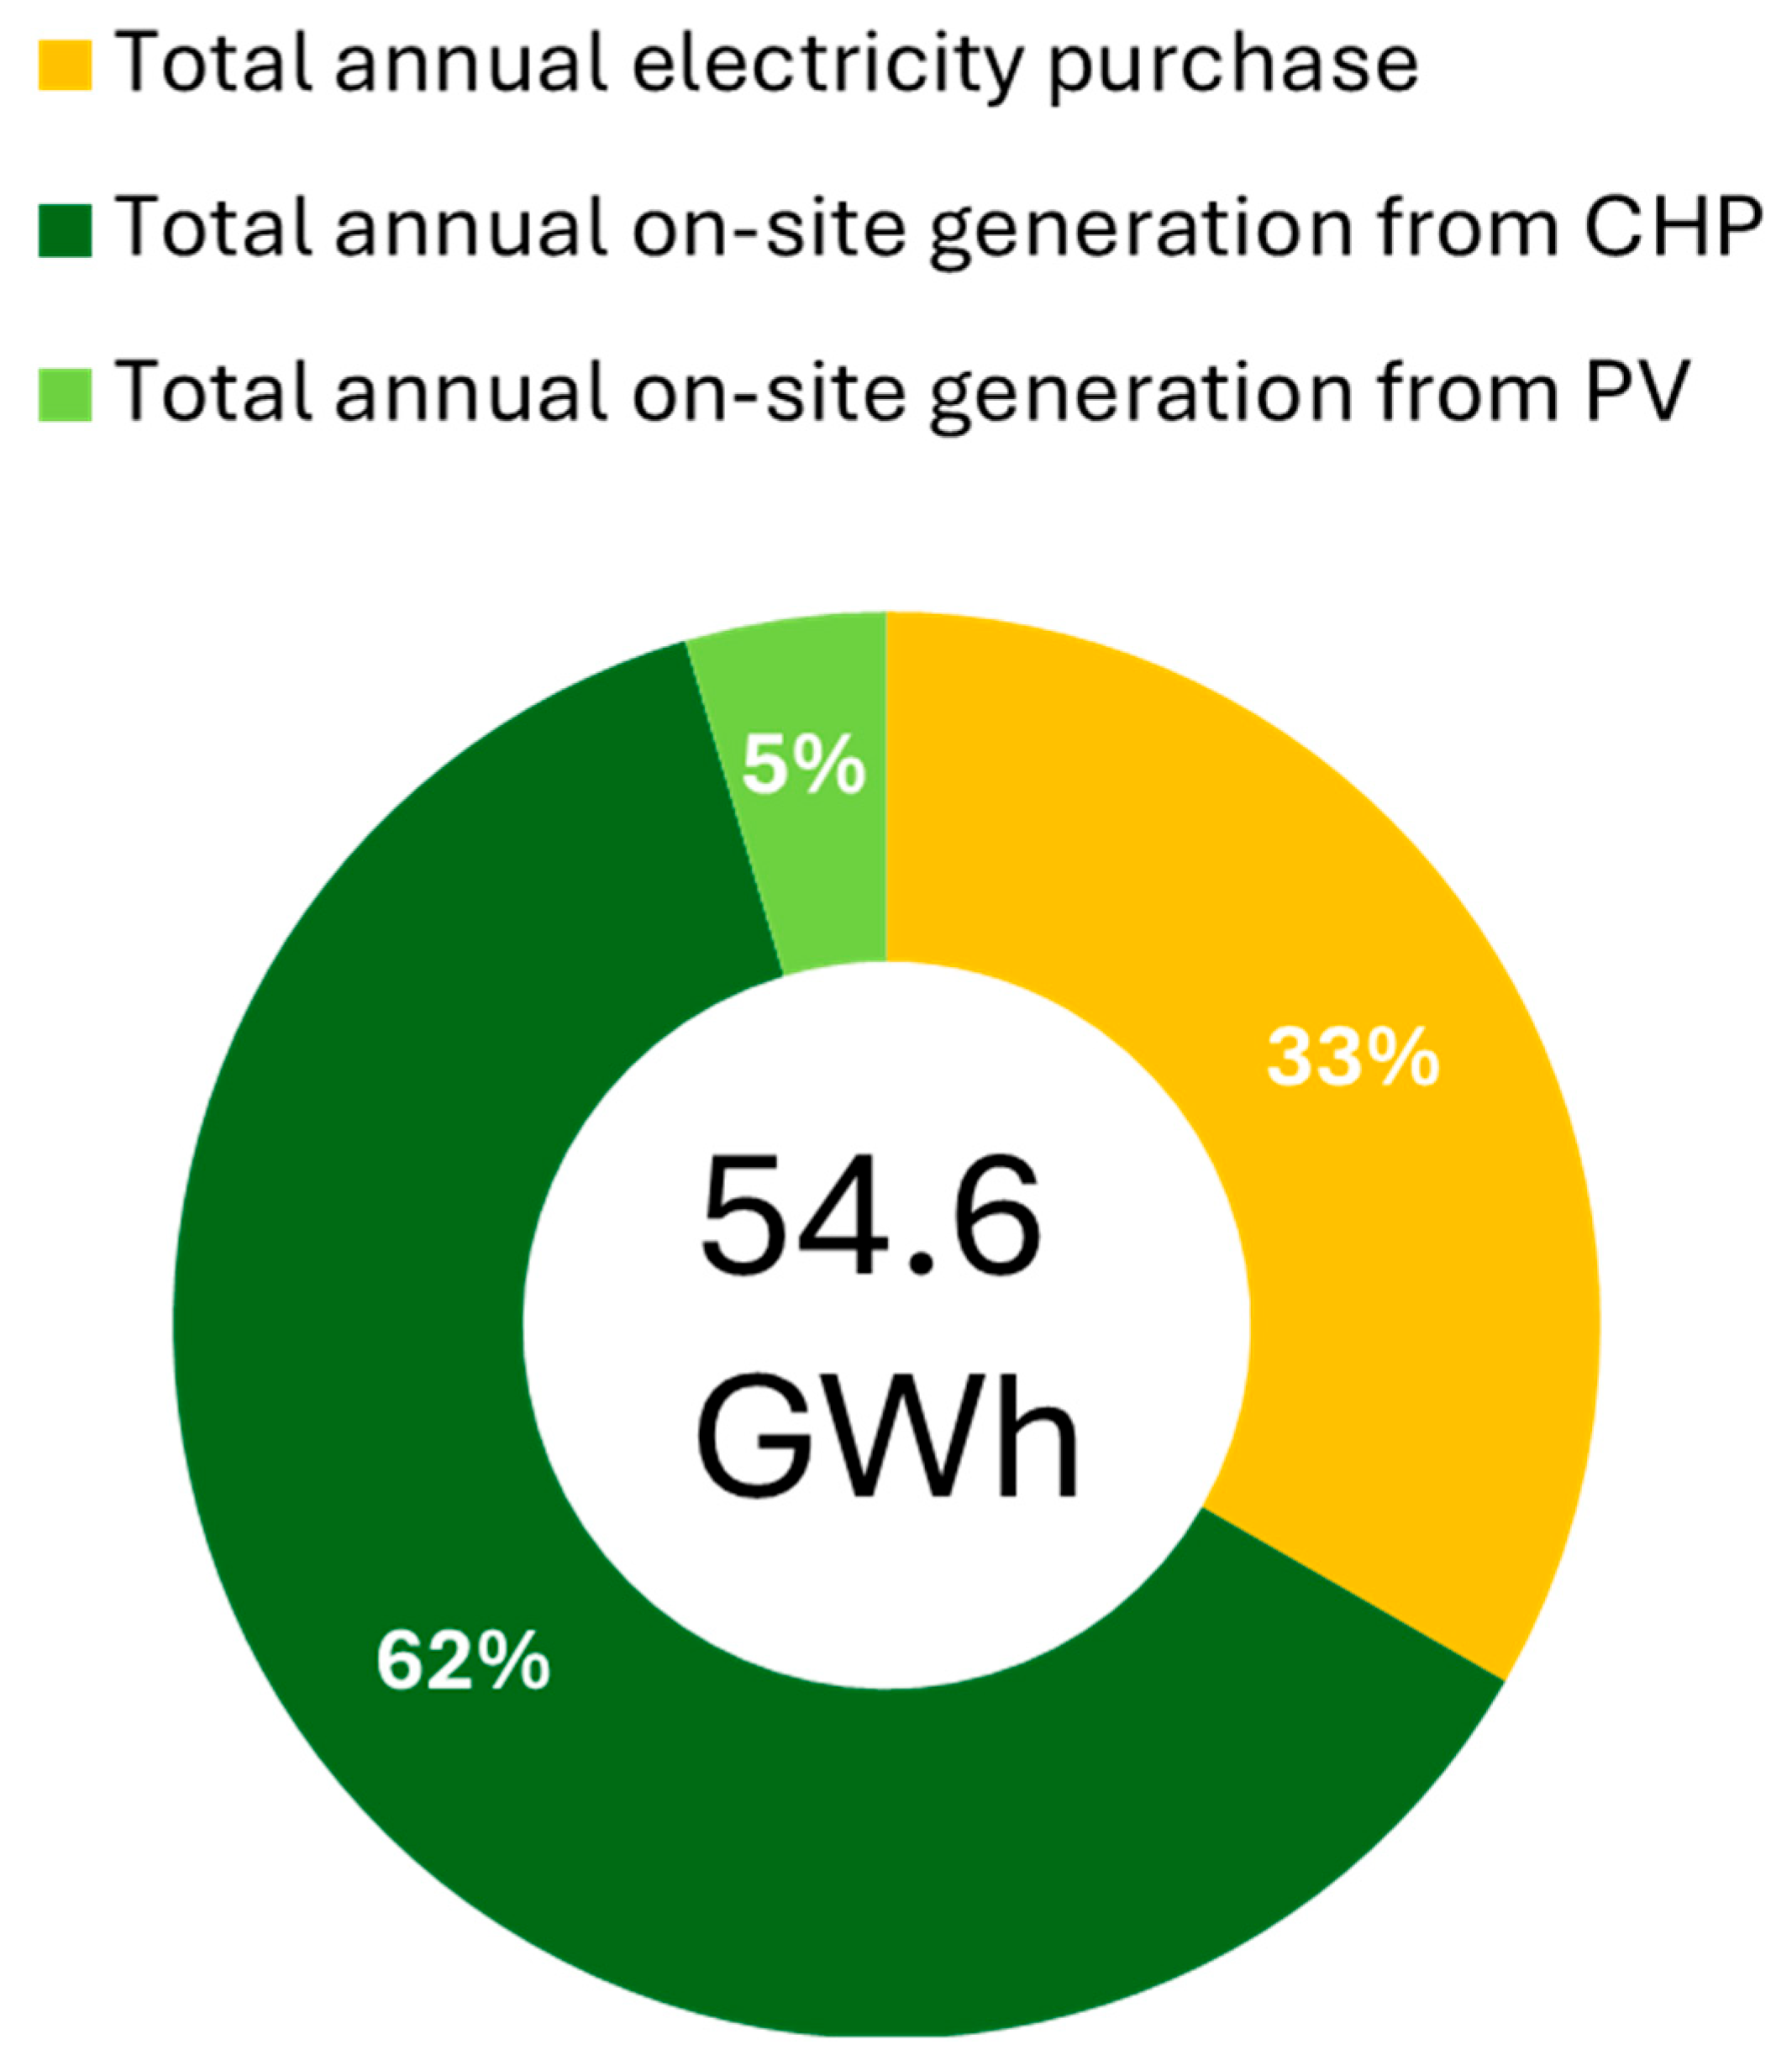
Over the full annual horizon (8760 h), the microgrid supplies vessel demand primarily through on-site cogeneration, with PV generation and limited grid imports complementing the supply mix. The annual electricity balance, illustrated in Figure 5, shows that most energy (62%) is produced by the CHP units, with grid imports consisting of the second supply source (33%) despite being constrained by the 3 MW infrastructure cap. PV contributes a smaller share, equal to 5%. Total annual energy supplied amounts to approximately 54.6 GWh, including vessel demand and baseline port loads.
Figure 5.
Contribution of each component to the electrical demand fulfillment.
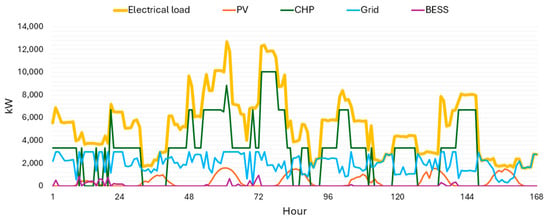
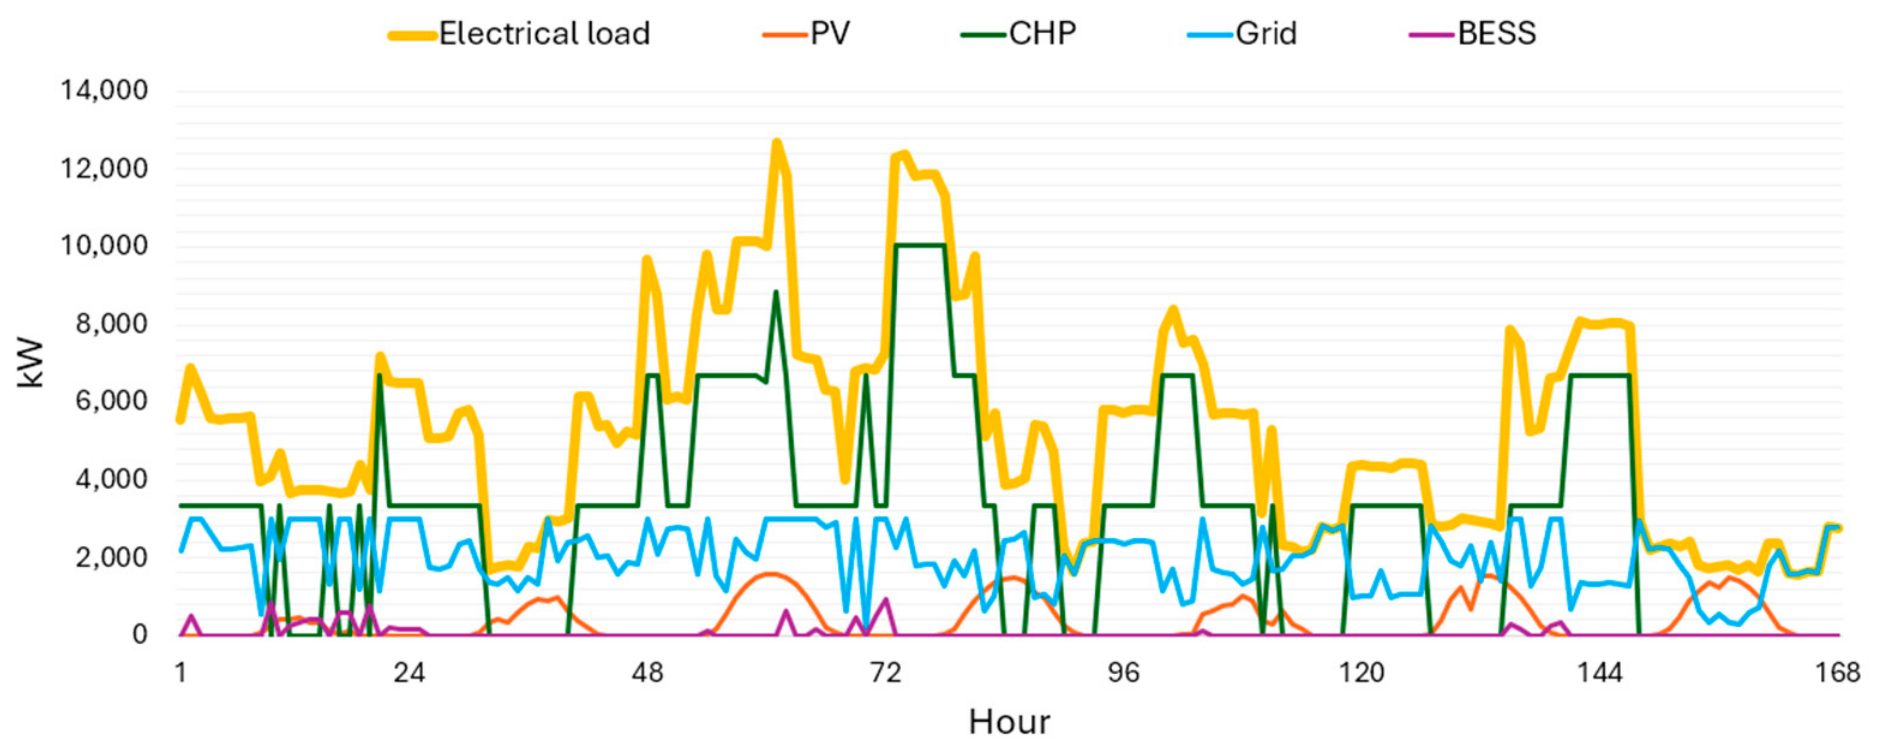
To provide greater insight into dynamic system behavior, a representative week (168 h) was extracted from the simulation results. During this week, electrical load varies significantly, with a maximum observed peak of 12.692 MW and an average load of approximately 5.293 MW. The dispatch logic follows the cost-minimizing objective defined in Chapter 2. Figure 6 illustrates how the electricity demand during the analyzed week is met, highlighting the specific technologies used to satisfy the load. According to model outputs, in the selected week most electrical demand is fulfilled by CHP engines (55%) and the grid (37%), with a smaller contribution provided by the PV plant (7%). The BESS contribution is negligible.
Figure 6.
Contribution of different technologies to fulfilling electricity demand for a selected specific week taken as example.
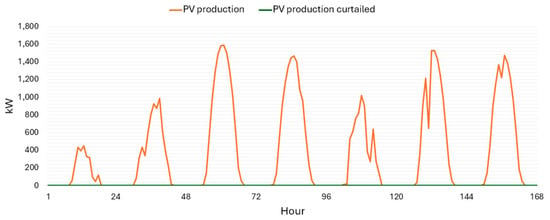
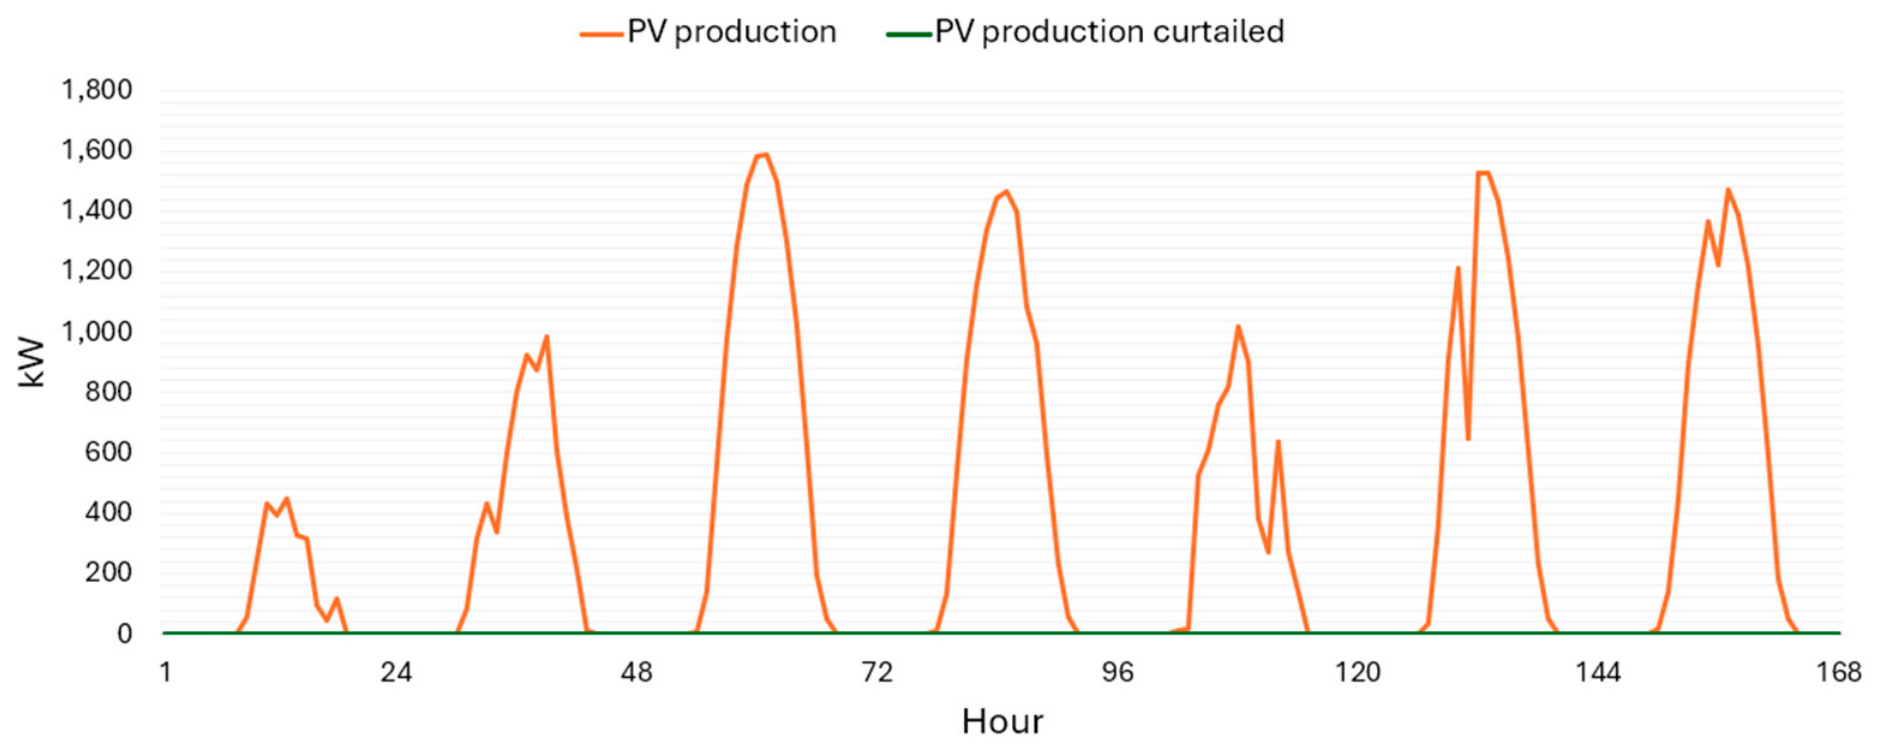
With reference to the PV plant, during the selected week it reaches a maximum hourly output of approximately 1.59 MW. An analysis of the energy flows (Figure 7) shows that all PV generation is allocated to meeting on-site demand, either directly or indirectly through BESS, with no share being curtailed.
Figure 7.
Total PV production and curtailed PV production share in the selected week.
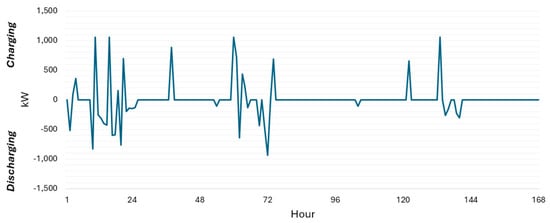
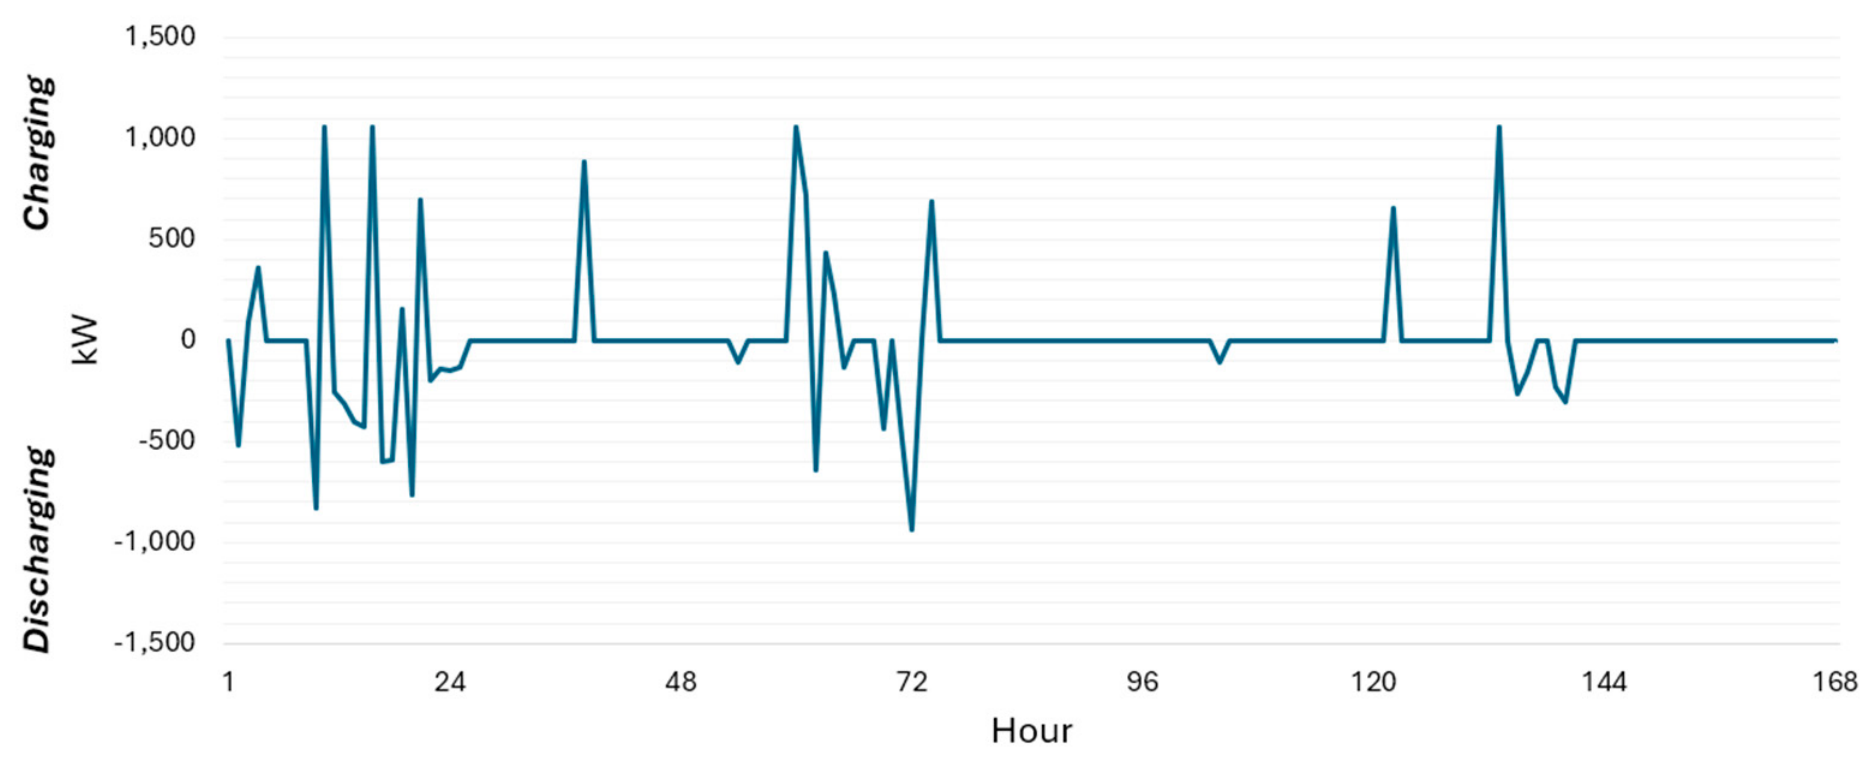
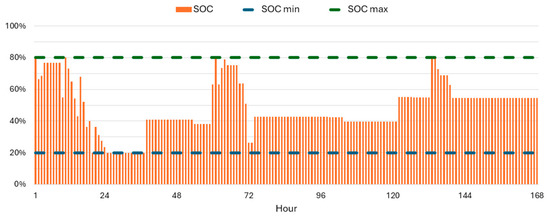
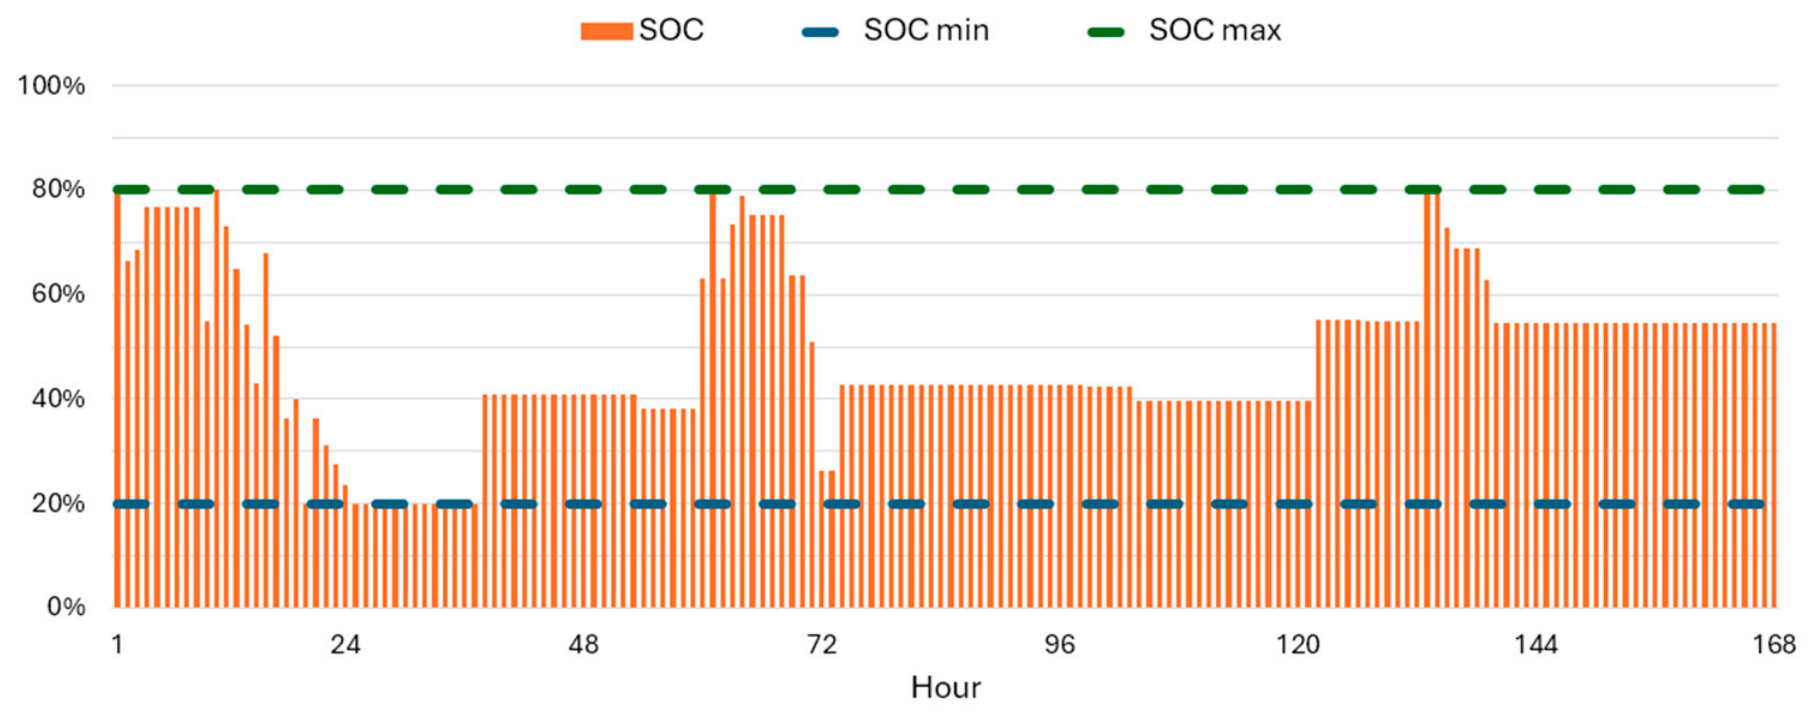
The battery energy storage system plays a secondary role in operational flexibility. Over the representative week, the battery discharges for 24 h and charges for 20 h. The maximum hourly discharge power reaches approximately 0.94 MW, while maximum charging power is approximately 1.053 MW. Figure 8 shows the BESS profile, assuming positive power values for the charging phase and negative ones for the discharging phase. The BESS state of charge, constrained within the predefined operational window (20–80%), is represented in Figure 9.
Figure 8.
BESS profile during the selected week.
Figure 9.
BESS state of charge (SOC) during the selected week.
A deterministic 24 h grid outage was simulated from 3 June at 00:00 to 23:59, corresponding to the outage period selected by the algorithm resilience setting within the month characterized by the highest average electrical demand. During the outage, the microgrid operates in island mode and no load shedding occurs at the hourly simulation resolution. The result should therefore be interpreted as an assessment of hourly energy adequacy rather than of sub-hourly transient performance. The N + 1 requirement is adopted as a design criterion for the on-site generation architecture; detailed forced-outage and probabilistic reliability analyses are beyond the scope of the present study.
3.2. Sensitivity and “Carbon-Priority Scenario” Analysis Results
The baseline corresponds to an LCOE of approximately 0.157 €/kWh and annual CO2 emissions of 20,702 tCO2/year. Table 12 provides a general overview of how the input parameters were varied to conduct the sensitivity and “carbon-priority scenario” analysis, while Table 13 and Figure 10 show results, commented on in the following lines.
Table 12.
The parameters varied in the sensitivity and “carbon-priority scenario” analysis 1.
Table 13.
Results of the sensitivity and “carbon-priority scenario” analysis.
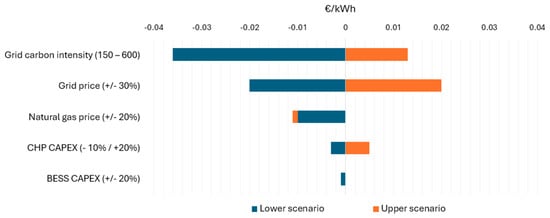
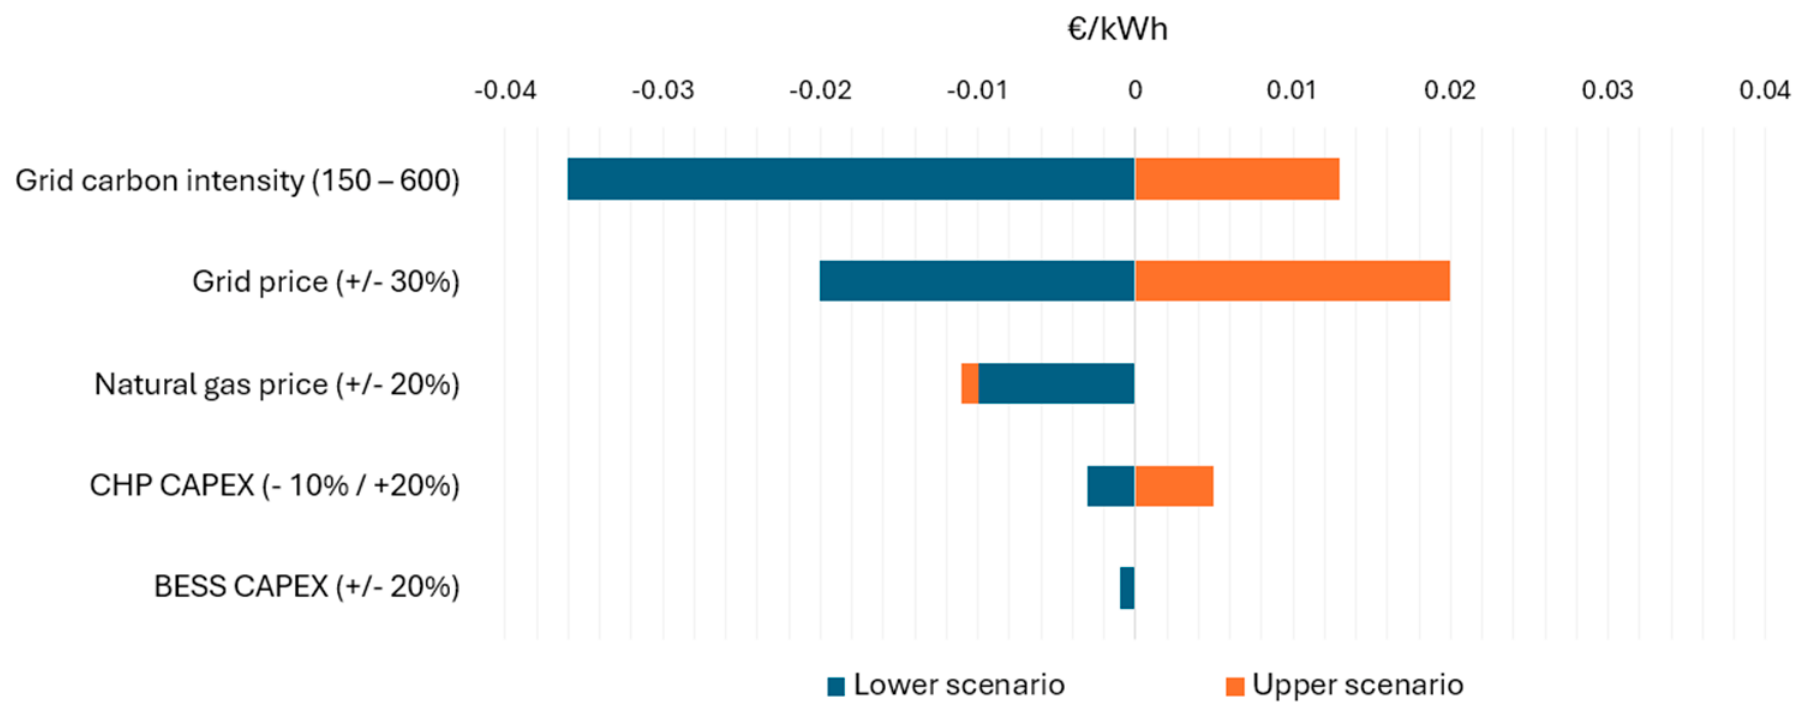
Figure 10.
Variations in LCOE (€/kWh) according to different parameter variations, where carbon intensity case scenario analysis with carbon-priority dispatch.
3.2.1. Grid Electricity Price
A ±30% variation in grid electricity tariff produces the largest observed variation in LCOE. Under the −30% scenario, LCOE decreases to 0.137 €/kWh (−13%), whereas under the +30% scenario it increases to 0.177 €/kWh (+13%). Annual CO2 emissions remain unchanged at 20,702 tCO2/year in both cases. This indicates that tariff variability directly affects economic performance but does not modify the simulated energy mix under cost-minimizing dispatch.
3.2.2. CHP CAPEX/OPEX
Variations in CHP capital and operational expenditures (−10%/+20%) produce moderate changes in LCOE, ranging from 0.154 €/kWh (−2%) in the low-cost scenario to 0.162 €/kWh (+3%) in the high-cost scenario. Annual CO2 emissions remain constant at 20,702 tCO2/year across these cases, confirming that investment cost variability affects levelized cost but not environmental performance within the modeled boundary.
3.2.3. BESS CAPEX
A ±20% variation in battery capital costs results in minimal changes in LCOE, from 0.156 €/kWh to 0.157 €/kWh. Annual CO2 emissions remain unchanged at 20,702 tCO2/year. These results suggest that within the analyzed configuration, battery cost uncertainty has a limited impact on overall economic outcomes.
3.2.4. Natural Gas Price
A ±20% variation in natural gas price produces intermediate LCOE sensitivity, with values ranging from 0.147 €/kWh to 0.156 €/kWh. Annual CO2 emissions remain largely stable, with minor variation between 20,702 and 20,793 tCO2/year. This reflects the significant role of CHP in the supply mix while indicating that fuel price fluctuations do not materially alter emission outcomes under fixed operational constraints.
3.2.5. Grid Carbon Intensity
Grid carbon intensity is the primary environmental driver. When the emission factor is reduced to 150 gCO2/kWh, annual emissions decrease to approximately 15,350 tCO2/year (−26%). Conversely, when the grid carbon intensity increases to 600 gCO2/kWh, annual emissions rise to approximately 21,295 tCO2/year (+3%). LCOE values associated with these scenarios are 0.170 €/kWh (150 gCO2/kWh) and 0.121 €/kWh (600 gCO2/kWh). Unlike the other sensitivity cases, the grid carbon intensity analysis represents a carbon-priority operating scenario rather than a strict OFAT test. In these runs, the optimization gives priority to CO2 reduction, causing the optimal dispatch and energy mix to change as grid carbon intensity varies. The resulting changes in fuel consumption and grid electricity purchases therefore also affect LCOE indirectly, although grid carbon intensity does not enter the LCOE equation directly.
Overall, the sensitivity and “carbon-priority scenario” analysis indicates that, within the explored parameter ranges, economic performance primarily is influenced by the conditions of the national grid, both in terms of electricity tariff and carbon intensity. Figure 10 shows the absolute variation in LCOE according to different parameters’ scenarios. As for environmental performance, it is strongly dependent on this latter factor. Technology cost uncertainty within the tested ranges produces comparatively limited variation in key performance indicators.
4. Discussion
4.1. Interpretation of Results
The results indicate that the integrated microgrid configuration achieves better performance within the scenario analyzed across economic, environmental, and operational dimensions under grid-constrained conditions. The most significant finding is that the proposed system achieves a marked reduction in LCOE while simultaneously lowering CO2 emissions and maintaining full operational compliance with peak demand and redundancy requirements.
From an economic perspective, the approximately 22% reduction in electrical LCOE relative to onboard generation reflects the higher electrical conversion efficiency of the CHP units and the modeled fuel and electricity cost structure. While onboard auxiliary engines are characterized by an average electrical efficiency of approximately 32.5%, the CHP units operate at electrical efficiencies of approximately 42–45%. The thermal contribution of cogeneration is not included in the electrical LCOE and is discussed separately below.
Thermal integration further enhances system performance. Under the modeled conditions, partial recovery of CHP heat reduces conventional boiler gas consumption by approximately 10%. Although this reduction in installed boiler capacity (55 MW_th to 50 MW_th) may appear modest, it produces measurable operational cost savings and emission reductions. This suggests that the value of cogeneration in port environments lies not only in electrical supply substitution but in its ability to couple electrical and thermal-energy flows within a unified system architecture. A detailed annual thermal–flow balance and component-level thermal-system design are beyond the scope of the present analysis.
Operationally, the microgrid was able to meet a 20 MW peak demand under a 3 MW grid cap, supporting the study hypothesis that integrated on-site generation can help address grid bottlenecks. The representative weekly dispatch results illustrate stable coordination between CHP, grid imports, and PV, while battery systems play a secondary role. Furthermore, the deterministic 24 h outage simulation demonstrates hourly energy adequacy during islanded operation. The N + 1 criterion is used separately as a design requirement for the on-site generation architecture.
The sensitivity and “carbon-priority scenario” analysis reveal a structural separation between economic and environmental drivers. Economic performance primarily is influenced by grid electricity tariffs and carbon intensity, with this latter strongly affecting environmental performance. Technology cost uncertainty (CHP and BESS CAPEX) exerts comparatively limited influence within realistic ranges, indicating robustness of the proposed configuration under moderate investment cost fluctuations.
Taken together, these findings suggest that, within the assumptions of the analyzed case study, the integration of cogeneration within a port microgrid does not merely provide incremental improvement over conventional OPS but represents an alternative energy system approach capable of addressing both infrastructure constraints and multi-vector energy demands.
4.2. Comparison with the Literature
The study focuses on a context in which cold ironing cannot rely on conventional OPS solutions. Here, the barrier is a physical one: the electrical grid capacity is limited to 3 MW, a situation common to many ports worldwide, which are often unable to reinforce their infrastructure or can do so only with considerable difficulty [34,35,36]. The results demonstrate that, in such situations, a microgrid comprising PV, BESS, and CHP achieves better economic and environmental performance than auxiliary onboard engines. These benefits are particularly noteworthy, since, even where technically feasible, conventional OPS solutions can sometimes underperform relative to auxiliary onboard engines [8,21,22,23,26,27,34].
Beyond this comparison, the study is particularly relevant to the wider academic literature on microgrids and integrated energy systems. The aforementioned body of literature has emphasized the benefits of multi-vector coordination and distributed generation for improving flexibility and resilience [42,47]. Many prior contributions, however, focus either on electrical microgrids in isolation or on abstract system optimization, without an explicit techno-economic comparison against onboard baselines [13,43].
The sensitivity analysis and the “carbon-priority scenario” results further contribute to the literature by clarifying that external electricity market conditions represent the dominant economic risk factor, whereas technology cost uncertainty plays a secondary role. This finding complements previous techno-economic analyses of shore power [35] and supports the argument that tariff structure and energy market exposure are critical determinants of project viability.
Overall, the study expands the existing body of knowledge by providing quantitative evidence that cogeneration-based microgrids can help address grid limitations while supporting efficiency gains and integrated energy optimization.
4.3. Policy and Planning Implications
The results have several implications for port authorities, regulators, and infrastructure planners.
First, the results indicate that integrated on-site generation can provide a technically feasible pathway for shore power supply where the existing grid connection is insufficient to meet the required load. Since a grid-reinforcement scenario was not explicitly modeled, the present analysis does not establish the relative economic or environmental performance of the proposed microgrid compared with reinforced-grid OPSs.
Second, tariff design and long-term electricity procurement mechanisms are critical to economic viability. The sensitivity and “carbon-priority scenario” analysis shows that electricity price variability has a stronger effect on LCOE than moderate changes in technology CAPEX. This suggests that regulatory stability and predictable tariff frameworks may be more important than short-term equipment cost fluctuations.
Third, grid decarbonization policy directly influences port-level emission outcomes. Even under a cost-minimizing dispatch strategy, residual grid imports expose the port system to upstream carbon intensity. Therefore, coordinated national energy and maritime policy frameworks may play an important role in supporting emission reductions.
Fourth, the results support the “port as energy hub” perspective introduced in Chapter 1. By integrating electricity and heat production, ports can move beyond compliance-driven electrification toward strategic energy system optimization. This integrated approach may improve resilience, reduce cost volatility exposure, and create pathways for progressive decarbonization, including future hydrogen blending.
4.4. Limitations of the Study
Several limitations should be acknowledged.
First, dispatch optimization is cost-minimizing and deterministic. While this reflects realistic operational priorities, it does not explore alternative objective functions or probabilistic uncertainty modeling.
Second, the sensitivity analysis adopts a univariate structure. Interaction effects between variables, such as simultaneous electricity price and gas price fluctuations, are not modeled.
Third, the resilience analysis is limited to deterministic hourly energy-adequacy assessment; detailed transient dynamics, forced single-unit contingencies, and probabilistic reliability metrics are not evaluated.
Fourth, the case study reflects a specific port scale and geographic context. While structural relationships are likely transferable to other grid-constrained ports, absolute performance values may vary depending on local energy prices, carbon intensity, and demand characteristics. Moreover, a reinforced-grid OPS configuration was not explicitly modeled; therefore, no direct techno-economic comparison between the proposed microgrid and grid reinforcement is made. Fifth, the thermal-energy assessment is limited to a screening-level representation of heat recovery, storage, and boiler displacement. Space-cooling demand is included in the broader characterization of terminal energy requirements but is not explicitly modeled through an absorption chiller subsystem in the present optimization. Detailed cooling system integration is therefore outside the scope of this study. Detailed heat-exchanger design, cooling system integration, thermal-network losses, and component-level optimization are not considered and should be addressed in future work.
Despite these limitations, the study provides a structured and transparent evaluation of integrated cogeneration microgrids under realistic infrastructure constraints and contributes quantitative evidence to ongoing discussions on port decarbonization strategies.
5. Conclusions
This study assessed the techno-economic and environmental performance of an integrated port microgrid for cold ironing in a grid-constrained port environment. The analysis considered a case in which the available grid connection is limited to 3 MW, while peak shore power demand can reach approximately 20 MW. Under these conditions, the study compared continued onboard auxiliary engine generation with a port-side microgrid integrating cogeneration units, photovoltaic generation, battery storage, limited grid imports, and heat recovery.
The results show that, within the assumptions of the case study, the integrated microgrid can satisfy the modeled electrical demand under the imposed grid constraint while reducing both energy supply costs and CO2 emissions compared with onboard generation. In the base case, the microgrid achieves an LCOE of 0.157 €/kWh, compared with 0.202 €/kWh for onboard auxiliary engines, corresponding to a reduction of approximately 22%. Annual CO2 emissions decrease from 32,592 tCO2/year to approximately 20,702 tCO2/year, equal to a reduction of about 36% within the adopted Scope 1 and Scope 2 boundary.
The simulated 24 h grid outage indicates that the system can maintain supply continuity in island mode at the hourly simulation resolution. The N + 1 criterion is adopted separately as a generation-sizing requirement and was not tested through a simultaneous forced outage of one CHP unit.
Beyond these quantitative benefits, the results highlight a broader system-level implication. The proposed configuration suggests that cogeneration should not be interpreted merely as an alternative electricity generation technology but, rather, as an enabling mechanism for integrating multiple energy vectors within a constrained infrastructure environment. By coupling electricity production, thermal recovery, renewable generation, and storage within a coordinated microgrid architecture, the system may help address grid limitations while supporting overall energy system optimization. In this sense, the value of CHP extends beyond efficiency gains alone and lies in its ability to support cold ironing deployment where conventional grid-connected solutions would face significant technical or economic barriers.
The proposed microgrid, then, should not be interpreted solely as a natural-gas-based alternative to onboard generation. Rather, it should be viewed as an energy infrastructure platform capable of evolving alongside the decarbonization of fuel supply chains. Subject to technical compatibility, safety requirements, future regulatory developments, economic viability, and fuel availability, the same architecture could progressively integrate renewable and low-carbon fuels such as biomethane, synthetic methane, or hydrogen blends, while preserving the underlying generation, storage, and control infrastructure.
This aspect is particularly relevant in the context of ports increasingly being considered as energy hubs. Ports are increasingly being considered not only as energy consumers for terminal operations and vessel services but also to manage, distribute, store, and potentially produce alternative energy carriers for both maritime and land-side applications. The integrated microgrid analyzed in this study is consistent with this perspective, since it combines electricity generation, grid imports, storage, and heat recovery within a coordinated local energy system. Its contribution, therefore, is not limited to reducing emissions during berthing operations but also drives increasing operational autonomy and preparing port energy infrastructure for future energy transitions.
Future research should extend the proposed framework to alternative fuel scenarios, including renewable gases and hydrogen-compatible technologies, as well as broader life-cycle emission boundaries, multivariate uncertainty analysis, and different port typologies. Additional research also may investigate the interaction between port microgrids and wider energy systems, including participation in flexibility markets, sector coupling opportunities, and integration with emerging regional energy infrastructures.
Overall, the study demonstrates that integrated port microgrids can provide a technically feasible and economically competitive pathway relative to continued onboard generation under the grid-capacity constraint considered in this case study. Their value should not be assessed solely in terms of current cost and emission reductions but also in terms of infrastructure flexibility and long-term adaptability. If properly designed, port-side energy assets deployed today for cold ironing can become foundational elements of future port energy systems, supporting the transition from conventional electrification strategies toward integrated multi-energy hubs capable of coordinating renewable electricity, thermal recovery, storage, and progressively decarbonized fuels.
Author Contributions
Conceptualization, D.G. and A.P.; methodology, D.G., A.P. and V.C.; validation, D.G. and V.C.; investigation, D.G. and A.P.; resources, A.P. All authors have read and agreed to the published version of the manuscript.
Funding
This research received no external funding, and the APC was funded by INNIO Group.
Institutional Review Board Statement
Not applicable.
Informed Consent Statement
Not applicable.
Data Availability Statement
The main data, model assumptions, and input parameters supporting this study are provided in the article. Additional information may be made available by the corresponding author upon reasonable request, subject to proprietary restriction.
Conflicts of Interest
Author Andrea Pivatello was employed by the company INNIO Group. The remaining authors declare that the research was conducted in the absence of any commercial or financial relationships that could be construed as a potential conflict of interest. The authors declare that this study received funding from INNIO Group. The funder had the following involvement with the study: The funder had a role in providing general insights into system modelling and input parameter selection, drawing on its industry expertise.
Appendix A
Appendix A.1
To model shore power electric load profile, the following elements were considered:
- Vessel classification parameters: The load profile accounts for four main vessel categories, each with its own distinct operational characteristics. Full details are provided in Table A1.
- Port baseline load: A realistic baseline load is built into the model to capture power consumption occurring even when no vessels are connected to shore power. This ensures the model reflects the fact that shore power infrastructure draws some power continuously, regardless of vessel presence. Full details are provided in Table A2.
- Port capacity constraints: Operational constraints are embedded in the model to cap simultaneous vessel connections and overall power capacity. These constraints prevent unrealistic scenarios in which an excessive number of arriving vessels would generate power demand exceeding what the port can practically supply. Full details are provided in Table A3.
- Core modeling approach:
- Vessel arrivals are modeled probabilistically, following seasonal and weekly patterns;
- Capacity is limited by the number of available berths and total power constraints;
- A continuous baseline load accounts for always-on infrastructure consumption;
- The simulation spans a full year, generating 8760 hourly load values (365 days × 24 h);
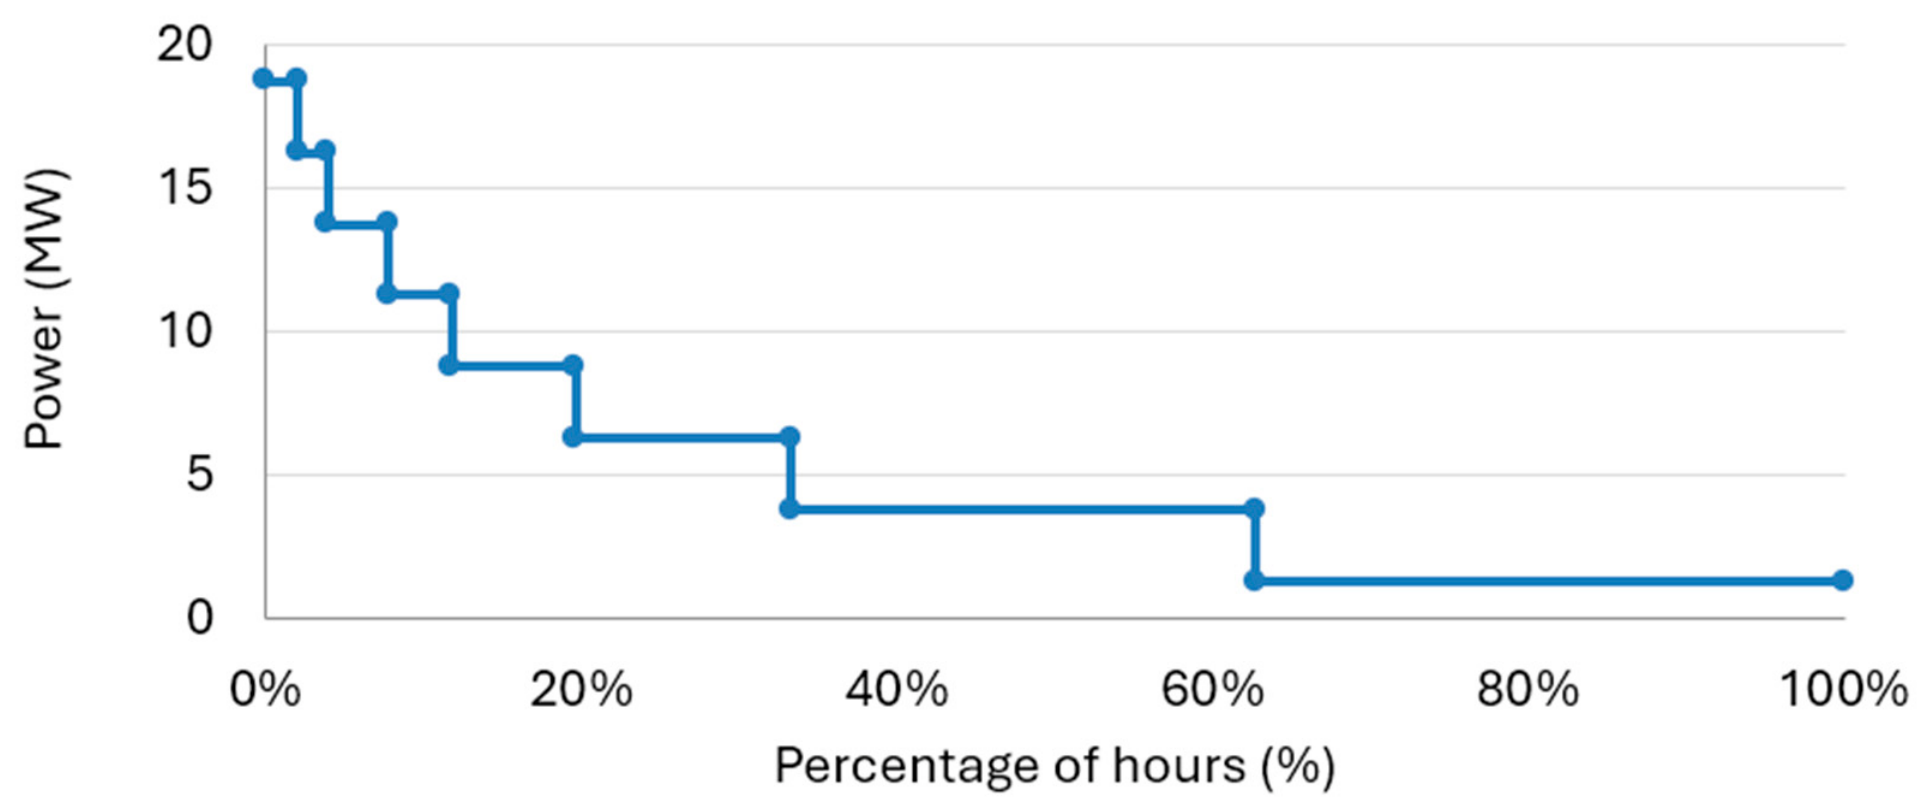
- The model is calibrated so that the system operates below 50% capacity for 70–80% of the hours.
- Temporal patterns:
- Seasonal effects: Cruise activity peaks in summer, while container traffic peaks in fall;
- Weekly patterns: Cruise/ferry activity concentrates on weekends, while container traffic is concentrated on weekdays;
- Daily baseline: Consumption is higher during business hours (8 am–4 pm) and lower overnight.
- Validation and representativeness: The resulting synthetic electrical load profile was assessed in terms of representativeness through benchmarking against reference-port operating characteristics, expert review, statistical checks, sensitivity testing, and minimum-load verification. The profile was calibrated so that the system operates below 50% of the assumed maximum capacity for approximately 70–80% of annual hours. The resulting peak demand, average load, annual load factor, and load–duration characteristics were used as consistency checks. The profile should therefore be interpreted as representative of the modeled port typology rather than as a reconstruction of the measured operation of a specific port. Once generated, the same calibrated 8760 h profile is used as a fixed input in all subsequent optimization runs.
Key characteristics of the modeled electrical load include:
- The shore power infrastructure itself (transformers, control systems, standby equipment) is responsible for roughly 4% of total annual energy consumption;
- Vessels account for the remaining share, representing about 96% of total annual energy consumption;
- During periods of reduced port activity (particularly in winter), the baseline infrastructure load can make up a larger share of the instantaneous power consumption.
Figure A1 presents the load duration curve graphically. Although outside the scope of the present work, several enhancements could be explored in future research:
- Dynamic vessel load profiles: Introducing time-varying load profiles that reflect different operational phases;
- Weather integration: Incorporating disruption patterns linked to weather conditions;
- Berth scheduling logic: Applying more realistic scheduling constraints;
- Grid interaction modeling: Accounting for demand response mechanisms and grid-side constraints;
- Economic decision modeling: Including price-responsive connection decisions;
- Machine learning integration: Introducing adaptive parameters informed by operational data;
- In practical implementations, The applicable technical and power-quality standards, such as IEC/IEEE 80005-1 [52], would also need to be considered depending on the specific shore-connection architecture.
These enhancements would require additional data collection, stakeholder engagement, and computational resources for effective implementation.
Table A1.
Operational characteristics of four vessel categories (in accordance with [51]).
Table A2.
Relevant information related to port baseline load (in accordance with [51]).
Table A3.
Relevant information related to port capacity constraints (in accordance with [51]).
Figure A1.
Load–duration curve.
Appendix A.2
To model the thermal load profile of the port terminal, the following elements were taken into account:
- Annual energy intensity parameters: The annual energy intensity benchmarks shown in Table A4 were adopted as baseline values, corresponding to the midpoint of the documented ranges for a typical Mediterranean port terminal. For process heat, which varies considerably depending on port type and industrial integration, a reasonable estimate was derived from typical auxiliary thermal demands associated with port operations (limited to terminal buildings only).
- Terminal size assumption: A reference terminal size of 10,000 m2 was adopted for the model, representing a medium-scale facility and enabling straightforward scaling of the results to terminals of different sizes. Based on this size, a corresponding set of thermal needs was defined. Full details are provided in Table A5.
- Seasonal distribution:
- Heating: Concentrated in winter (January–March, October–December), with a peak in January;
- Cooling: Concentrated in summer (May–September), with a peak in July–August;
- Domestic hot water (DHW): Fairly stable throughout the year, with a slight increase in winter;
- Process heat: Stable across the year, with only minor variations.
- Daily variation:
- Weekdays: 110% of average daily load;
- Weekends: 80% of average daily load.
- Hourly patterns:
- Heating: Bimodal, with peaks in the morning and evening;
- Cooling: Peaks at mid-day (10 am–3 pm);
- DHW: Peaks at 8 am and between 12 pm and 1 pm;
- Process heat: Concentrated during business hours (8 am–5 pm).
- Calculation process:
- Annual demand allocated to months using seasonal factors;
- Monthly demand is distributed across days, adjusted for weekdays and weekends;
- Daily demand is distributed across hours using normalized patterns.
- Validation and representativeness: The thermal profile was checked for consistency through energy-conservation tests across annual, monthly, daily, and hourly aggregation levels. The resulting seasonal, weekday/weekend, and intraday profiles were also compared with typical patterns for Mediterranean port-terminal facilities. The profile is therefore intended to provide a representative synthetic thermal demand rather than to reproduce measurements from a specific port.
The methodology used to model the thermal load profile has some limitations, the most relevant of which are:
- Represents typical Mediterranean port terminal (specific ports may vary);
- Does not account for extreme weather events or operational anomalies;
- Process heat demand requires adjustment for specific port industrial processes.
Table A4.
Energy intensity benchmarks used as baseline values (in accordance with [51]).
Table A5.
Information related to the terminal area (in accordance with [51]).
References
- OECD. Maritime Transport CO2 Emissions. OECD, 2026. Available online: https://www.oecd.org/en/data/datasets/maritime-transport-co2-emissions.html (accessed on 18 September 2026).
- Corbett, J.J.; Winebrake, J.J.; Green, E.H.; Kasibhatla, P.; Eyring, V.; Lauer, A. Mortality from Ship Emissions: A Global Assessment. Environ. Sci. Technol. 2007, 41, 8512–8518. [Google Scholar] [CrossRef] [Scilit] [PubMed]
- Yánez-Rosales, P.; Ferreira, P.; Schallenberg-Rodriguez, J.; Lozano-Medina, A.; del Rio-Gamero, B. Decarbonizing the Maritime Sector: Cold Ironing and E-Fuels. Case Study: Gran Canaria. Transp. Res. Part D Transp. Environ. 2026, 160, 105566. [Google Scholar] [CrossRef] [Scilit]
- Styhre, L.; Winnes, H.; Black, J.; Lee, J.; Le-Griffin, H. Greenhouse Gas Emissions from Ships in Ports—Case Studies in Four Continents. Transp. Res. Part D Transp. Environ. 2017, 54, 212–224. [Google Scholar] [CrossRef] [Scilit]
- Uzun, D.; Okumus, D.; Canbulat, O.; Gunbeyaz, S.A.; Karamperidis, S.; Hudson, D.; Turan, O.; Allan, R. Port Energy Demand Model for Implementing Onshore Power Supply and Alternative Fuels. Transp. Res. Part D Transp. Environ. 2024, 136, 104432. [Google Scholar] [CrossRef] [Scilit]
- Sifakis, N.; Cholidis, D.; Savvakis, N.; Arampatzis, G. Temporal and Grid-Constrained Performance of Cold-Ironing and Photovoltaic Generation towards Nearly Zero Energy Ports. Next Res. 2026, 9, 101715. [Google Scholar] [CrossRef] [Scilit]
- Wang, J.; Li, H.; Yang, Z.; Ge, Y.-E. Shore Power for Reduction of Shipping Emission in Port: A Bibliometric Analysis. Transp. Res. Part E Logist. Transp. Rev. 2024, 188, 103639. [Google Scholar] [CrossRef] [Scilit]
- Abu Bakar, N.N.; Bazmohammadi, N.; Vasquez, J.C.; Guerrero, J.M. Electrification of Onshore Power Systems in Maritime Transportation towards Decarbonization of Ports: A Review of the Cold Ironing Technology. Renew. Sustain. Energy Rev. 2023, 178, 113243. [Google Scholar] [CrossRef] [Scilit]
- Fameli, K.M.; Kotrikla, A.M.; Psanis, C.; Biskos, G.; Polydoropoulou, A. Estimation of the Emissions by Transport in Two Port Cities of the Northeastern Mediterranean, Greece. Environ. Pollut. 2020, 257, 113598. [Google Scholar] [CrossRef] [Scilit] [PubMed]
- Mueller, N.; Westerby, M.; Nieuwenhuijsen, M. Health Impact Assessments of Shipping and Port-Sourced Air Pollution on a Global Scale: A Scoping Literature Review. Environ. Res. 2023, 216, 114460. [Google Scholar] [CrossRef] [Scilit] [PubMed]
- Wan, Z.; Nie, A.; Chen, J.; Pang, C.; Zhou, Y. Transforming Ports for a Low-Carbon Future: Innovations, Challenges, and Opportunities. Ocean Coast. Manag. 2025, 264, 107636. [Google Scholar] [CrossRef] [Scilit]
- European Commission; Directorate-General for Mobility and Transport. Commission Unveils EU Ports Strategy to Strengthen Competitiveness, Security and Sustainability of European Ports. European Commission, 4 March 2026. Available online: https://transport.ec.europa.eu/news-events/news/commission-unveils-eu-ports-strategy-strengthen-competitiveness-security-and-sustainability-european-2026-03-04_en (accessed on 18 September 2026).
- Zhang, Z.; Zhu, Y.; Zhu, J.; Huang, D.; Yin, C.; Li, J. Collaborative Optimization of Shore Power and Berth Allocation Based on Economic, Environmental, and Operational Efficiency. J. Mar. Sci. Eng. 2025, 13, 776. [Google Scholar] [CrossRef] [Scilit]
- International Maritime Organization (IMO). Resolution MEPC.304(72): Initial IMO Strategy on Reduction of GHG Emissions from Ships. Available online: https://wwwcdn.imo.org/localresources/en/KnowledgeCentre/IndexofIMOResolutions/MEPCDocuments/MEPC.304(72).pdf (accessed on 20 August 2026).
- European Parliament and Council of the European Union. Regulation (EU) 2023/1805 on the Use of Renewable and Low-Carbon Fuels in Maritime Transport (FuelEU Maritime). Available online: https://eur-lex.europa.eu/legal-content/EN/TXT/?uri=CELEX%3A32023R1805 (accessed on 20 August 2026).
- European Parliament and Council of the European Union. Regulation (EU) 2023/1804 on the Deployment of Alternative Fuels Infrastructure (AFIR). Available online: https://eur-lex.europa.eu/legal-content/EN/TXT/?uri=CELEX%3A32023R1804 (accessed on 20 August 2026).
- California’s “At Berth” Regulation for Ports. Available online: https://lpdd.org/resources/californias-at-berth-regulation-for-ports/ (accessed on 20 August 2026).
- Bahtić, F. CMA CGM, Shanghai Port Join Hands to Scale Up Use of Cold Ironing. Offshore Energy, 16 December 2022. Available online: https://www.offshore-energy.biz/cma-cgm-shanghai-port-join-hands-to-scale-up-use-of-cold-ironing/ (accessed on 20 August 2026).
- International Chamber of Shipping (ICS). The Race for Shore Power. ICS, 29 October 2024. Available online: https://www.ics-shipping.org/news-item/the-race-for-shore-power/ (accessed on 18 September 2026).
- Williamsson, J.; Costa, N.; Santén, V.; Rogerson, S. Barriers and Drivers to the Implementation of Onshore Power Supply—A Literature Review. Sustainability 2022, 14, 6072. [Google Scholar] [CrossRef] [Scilit]
- Osipova, L.; Carraro, C. Shore Power Needs and CO2 Emission Reductions of Ships in European Ports: Meeting the Ambitions of the FuelEU Maritime and AFIR; ICCT Working Paper 2023-24; International Council on Clean Transportation: Washington, DC, USA, 2023; Available online: https://theicct.org/publication/shore-power-eu-oct23/ (accessed on 20 August 2026).
- Daniel, H.; Trovão, J.P.F.; Williams, D. Shore Power as a First Step toward Shipping Decarbonization and Related Policy Impact on a Dry Bulk Cargo Carrier. eTransportation 2022, 11, 100150. [Google Scholar] [CrossRef] [Scilit]
- Innes, A.; Monios, J. Identifying the Unique Challenges of Installing Cold Ironing at Small and Medium Ports—The Case of Aberdeen. Transp. Res. Part D Transp. Environ. 2018, 62, 298–313. [Google Scholar] [CrossRef] [Scilit]
- Kumar, J.; Kumpulainen, L.; Kauhaniemi, K. Technical Design Aspects of Harbour Area Grid for Shore to Ship Power: State of the Art and Future Solutions. Int. J. Electr. Power Energy Syst. 2019, 104, 840–852. [Google Scholar] [CrossRef] [Scilit]
- Ballini, F.; Bozzo, R. Air Pollution from Ships in Ports: The Socio-Economic Benefit of Cold-Ironing Technology. Res. Transp. Bus. Manag. 2015, 17, 92–98. [Google Scholar] [CrossRef] [Scilit]
- Winkel, R.; Weddige, U.; Johnsen, D.; Hoen, V.; Papaefthimiou, S. Shore Side Electricity in Europe: Potential and Environmental Benefits. Energy Policy 2016, 88, 584–593. [Google Scholar] [CrossRef] [Scilit]
- Dai, L.; Hu, H.; Wang, Z. Is Shore Side Electricity Greener? An Environmental Analysis and Policy Implications. Energy Policy 2020, 137, 111144. [Google Scholar] [CrossRef] [Scilit]
- Sun, L.; Ding, P.; Xiong, Y.; Liu, W.; Hu, Z. Carbon Emission Reduction of Shore Power from Power Energy Structure in China. Front. Mar. Sci. 2022, 9, 1077289. [Google Scholar] [CrossRef] [Scilit]
- Radwan, M.E.; Chen, J.; Wan, Z.; Zheng, T.; Hua, C.; Huang, X. Critical Barriers to the Introduction of Shore Power Supply for Green Port Development: Case of Djibouti Container Terminals. Clean Technol. Environ. Policy 2019, 21, 1293–1306. [Google Scholar] [CrossRef] [Scilit]
- Krämer, I.; Czermański, E. Onshore Power—One Option to Reduce Air Emissions in Ports. Sustain. Manag. Forum 2020, 28, 13–20. [Google Scholar] [CrossRef] [Scilit]
- Arduino, G.; Carrillo Murillo, D.G.; Ferrari, C. Key Factors and Barriers to the Adoption of Cold Ironing in Europe; SIET Working Paper No. 11/15; Società Italiana di Economia dei Trasporti e della Logistica: Messina, Italy, 2011; Available online: https://ideas.repec.org/p/sit/wpaper/11_15.html (accessed on 18 September 2026).
- Bjerkan, K.Y.; Seter, H. Reviewing Tools and Technologies for Sustainable Ports: Does Research Enable Decision Making in Ports? Transp. Res. Part D Transp. Environ. 2019, 72, 243–260. [Google Scholar] [CrossRef] [Scilit]
- Lawer, E.T.; Herbeck, J.; Flitner, M. Selective Adoption: How Port Authorities in Europe and West Africa Engage with the Globalizing ‘Green Port’ Idea. Sustainability 2019, 11, 5119. [Google Scholar] [CrossRef] [Scilit]
- Dai, L.; Hu, H.; Wang, Z.; Shi, Y.; Ding, W. An Environmental and Techno-Economic Analysis of Shore-Side Electricity. Transp. Res. Part D Transp. Environ. 2019, 75, 223–235. [Google Scholar] [CrossRef] [Scilit]
- Bignucolo, F.; Visentin, M.; De Pieri, D.; Augello, C.; Faggioni, N. Technical and Economic Feasibility of Cold Ironing in Italy: A Detailed Case Study. Energies 2025, 18, 5950. [Google Scholar] [CrossRef] [Scilit]
- Merkel, A.; Nyberg, E.; Ek, K.; Sjöstrand, H. Economics of Shore Power under Different Access Pricing. Res. Transp. Econ. 2023, 101, 101330. [Google Scholar] [CrossRef] [Scilit]
- Schuler, M. UK Ports Warn Grid Delays, Energy Costs Threaten Maritime Decarbonization. gCaptain, 28 August 2026. Available online: https://gcaptain.com/uk-ports-warn-grid-delays-energy-costs-threaten-maritime-decarbonization/ (accessed on 18 September 2026).
- Glavinović, R.; Krčum, M.; Vukić, L.; Karin, I. Cold Ironing Implementation Overview in European Ports—Case Study—Croatian Ports. Sustainability 2023, 15, 8472. [Google Scholar] [CrossRef] [Scilit]
- Ramasan, S.M.; Thakur, J.; Bhagavathy, S.M.; Laumert, B. Grid Aware Electrification for Decarbonising Port Logistics Based on a Case Study from Sweden. Sci. Rep. 2025, 15, 38472. [Google Scholar] [CrossRef] [Scilit] [PubMed]
- Franco, A. Future Ports as Energy Hubs: Integrated Framework for Renewable Energy Planning, Storage, and Sector Coupling. Energies 2026, 19, 4203. [Google Scholar] [CrossRef] [Scilit]
- Lund, H.; Østergaard, P.A.; Connolly, D.; Mathiesen, B.V. Smart Energy and Smart Energy Systems. Energy 2017, 137, 556–565. [Google Scholar] [CrossRef] [Scilit]
- Mathiesen, B.V.; Lund, H.; Connolly, D.; Wenzel, H.; Østergaard, P.A.; Møller, B.; Nielsen, S.; Ridjan, I.; Karnøe, P.; Sperling, K.; et al. Smart Energy Systems for Coherent 100% Renewable Energy and Transport Solutions. Appl. Energy 2015, 145, 139–154. [Google Scholar] [CrossRef] [Scilit]
- Molavi, A.; Shi, J.; Wu, Y.; Lim, G.J. Enabling Smart Ports through the Integration of Microgrids: A Two-Stage Stochastic Programming Approach. Appl. Energy 2020, 258, 114022. [Google Scholar] [CrossRef] [Scilit]
- Abu Bakar, N.N.; Guerrero, J.M.; Vasquez, J.C.; Bazmohammadi, N.; Yu, Y.; Abusorrah, A.; Al-Turki, Y.A. A Review of the Conceptualization and Operational Management of Seaport Microgrids on the Shore and Seaside. Energies 2021, 14, 7941. [Google Scholar] [CrossRef] [Scilit]
- Zhang, Q.; Qi, J.; Zhen, L. Optimization of Integrated Energy System Considering Multi-Energy Collaboration in Carbon-Free Hydrogen Port. Transp. Res. Part E Logist. Transp. Rev. 2023, 180, 103351. [Google Scholar] [CrossRef] [Scilit]
- Yu, S.; Huang, Z.; Tang, D.; Ma, W.; Guerrero, J.M. The Role of Integrated Multi-Energy Systems Toward Carbon-Neutral Ports: A Data-Driven Approach Using Empirical Data. J. Mar. Sci. Eng. 2025, 13, 477. [Google Scholar] [CrossRef] [Scilit]
- Hirsch, A.; Parag, Y.; Guerrero, J. Microgrids: A Review of Technologies, Key Drivers, and Outstanding Issues. Renew. Sustain. Energy Rev. 2018, 90, 402–411. [Google Scholar] [CrossRef] [Scilit]
- Che, Z.; Zhang, Q.; Cao, Z.; Peng, Y.; Chu, Z.; Wang, W. Port Integrated Energy System Planning with Multi-Energy Collaboration under Uncertainty. Ocean Eng. 2026, 362, 126373. [Google Scholar] [CrossRef] [Scilit]
- Acciaro, M.; Ghiara, H.; Cusano, M.I. Energy Management in Seaports: A New Role for Port Authorities. Energy Policy 2014, 71, 4–12. [Google Scholar] [CrossRef] [Scilit]
- Damman, S.; Wardeberg, M.; Gabrielii, C. Policies Shaping Energy Transitions in Ports and Harbours: A ‘Whole Systems’ Perspective from Norway. Energy Res. Soc. Sci. 2025, 125, 104101. [Google Scholar] [CrossRef] [Scilit]
- INNIO Group (Jenbacher). Enhancing Port Decarbonization: An Integrated Analysis of Cogeneration Systems and Microgrids for Cold Ironing Applications; White Paper, June 2025. Available online: https://www.jenbacher.com/wp-content/uploads/2025/09/ijb_wp_en_a4_nu_cold_ironing_eu_rz_screen_ijb-325032-en.pdf (accessed on 17 September 2026).
- IEC/IEEE 80005-1:2019; Utility Connections in Port—Part 1: High Voltage Shore Connection (HVSC) Systems—General Requirements. International Electrotechnical Commission (IEC): Geneva, Switzerland, 2019.



Disclaimer/Publisher’s Note: The statements, opinions and data contained in all publications are solely those of the individual author(s) and contributor(s) and not of MDPI and/or the editor(s). MDPI and/or the editor(s) disclaim responsibility for any injury to people or property resulting from any ideas, methods, instructions or products referred to in the content. |
© 2026 by the authors. Licensee MDPI, Basel, Switzerland. This article is an open access article distributed under the terms and conditions of the Creative Commons Attribution (CC BY) license.