


Abstract
Short-horizon prediction of three-dimensional slope displacement is important for proactive risk control in open-pit mines, where deformation commonly exhibits multiscale, non-stationary, and environmentally responsive characteristics. This study aims to develop a causality-preserving framework for direct 24 h prediction of northward, eastward, and upward slope displacement while jointly representing multiscale deformation patterns, meteorological influences, and temporal dependencies. A Variational Mode Decomposition-Gated Recurrent Unit-Cross-Attention-Transformer Network (VGCAT-Net) is therefore proposed. Window-wise variational mode decomposition constructs multiscale displacement features from each 168 h historical window, gated recurrent units encode local temporal evolution, meteorological cross-attention dynamically integrates environmental information, and a Transformer captures long-range temporal dependencies. The framework was evaluated using GNSS displacement observations from four monitoring stations and synchronized meteorological measurements at the Fushun West Open-Pit Mine. At the reference station FS-01, VGCAT-Net achieved an average mean absolute error of 4.538 mm, root mean square error of 5.642 mm, and coefficient of determination of 0.853, outperforming the RF, LSTM, GRU, and Transformer baselines. Cross-site evaluation yielded mean R2 values of 0.739–0.831. These results demonstrate that combining multiscale deformation representation with state-conditioned meteorological fusion can improve stable one-day-ahead three-dimensional displacement forecasting and provide useful predictive information for operational slope monitoring and early-warning support.
1. Introduction
Progressive deformation of open-pit mine slopes reflects the combined influence of excavation-induced stress redistribution, structural controls, long-term creep, and environmental forcing [1,2]. Changes in displacement rate and related kinematic indicators commonly precede accelerated movement and provide a quantitative basis for early-warning interpretation [3]. Short-horizon displacement prediction can therefore extend the time available for field inspection, operational adjustment, and risk-control actions, particularly in large open pits where deformation evolves heterogeneously across benches and directions.
The Global Navigation Satellite System (GNSS) provides automated, all-weather, high-temporal-resolution observations of surface movement in three dimensions [4]. The northward, eastward, and upward components preserve directional kinematic information that is not retained by a single resultant-displacement index. Recent studies have combined monitored displacement sequences with machine-learning and deep temporal models to predict slope or landslide deformation [5,6]. Multimodal mine-slope studies further show that integrating environmental observations with displacement records can improve short-horizon prediction [7,8], while explainable time-series analyses support the value of explicitly representing trend and seasonal structure in monitored ground deformation [9].
Empirical mode decomposition (EMD) and ensemble-based extensions provide adaptive representations for nonlinear and nonstationary time series [10,11]. Variational mode decomposition (VMD) offers a variational formulation that separates a signal into band-limited modes with distinct center frequencies [12,13]. VMD-based displacement-prediction models have shown that frequency-layered representations can improve the characterization of trend and disturbance components in slope deformation [14,15]. Related hybrid models combining VMD with support-vector or recurrent learners provide further evidence that decomposition and temporal learning are complementary [16,17], including multiscale three-dimensional displacement prediction [18,19].
For time-series prediction, multiscale feature construction must preserve temporal causality. Decomposing a complete record before chronological evaluation allows later observations to influence modal features used at earlier forecast origins. Constructing VMD features independently within each historical input window preserves the information set available at prediction time. Environmental forcing provides a second source of predictive structure. Rainfall infiltration changes water content, pore-water pressure, and the mechanical state of shallow slope materials [20,21]. Field and numerical studies further demonstrate rainfall-related changes in deformation and stability [22,23], including open-pit slope responses identified from monitoring and numerical simulation [24]. Monitored landslides commonly exhibit delayed displacement responses to rainfall and other hydrological factors [25,26].
Meteorological coupling with slope deformation can be direction- and stage-dependent because environmental forcing does not necessarily produce an instantaneous or uniform displacement response. Rainfall and variations in near-surface soil moisture can modify infiltration conditions, matric suction, and pore-water conditions, and the corresponding deformation response may occur with a temporal lag. Air and soil temperature characterize thermal forcing in the shallow ground and monitoring environment [27,28], whereas atmospheric pressure and related environmental loading may additionally affect geodetic observations [29,30]. These effects may be expressed differently in the northward, eastward, and upward displacement components because the monitored response reflects the combined influence of local slope geometry, deformation direction, near-surface conditions, and the GNSS observation environment. Moreover, the relative importance of individual environmental variables may vary as deformation evolves between relatively stable and more active stages. Consequently, a state-conditioned fusion mechanism is preferable to simple static concatenation when the relevance of meteorological information changes with deformation state, direction, and historical time lag.
Deep temporal models provide complementary capabilities for displacement prediction. Recent physics-informed and multi-source learning frameworks demonstrate the value of combining monitored deformation with structured temporal learning and environmental information [31,32]. Recurrent and convolutional-recurrent models are effective for local temporal feature extraction in mine and engineering deformation series [33,34], whereas Transformer-based architectures can represent longer-range dependencies and attention-weighted interactions [35,36]. Site-specific investigations at the Fushun West Open-Pit Mine provide complementary geological and stability context for deformation analysis [37,38]. Field-oriented warning studies further show that continuous geodetic or in situ displacement streams can be connected to operational warning logic [39,40].
The methodological requirements therefore converge on three aspects: causality-consistent multiscale representation of nonstationary displacement, adaptive fusion of meteorological information with direction-specific deformation states, and stable joint prediction of three-dimensional displacement over an operationally meaningful lead time. These aspects define a prediction problem in which data organization is as important as network architecture, because the temporal availability of every feature must remain consistent with real prediction conditions.
Despite these advances, several issues remain relevant to operational short-horizon slope-displacement forecasting. Existing approaches may not simultaneously represent non-stationary multiscale deformation, dynamically varying meteorological influences, and long-range temporal dependencies within a unified three-dimensional prediction framework. In particular, environmental variables are often incorporated as conventional auxiliary inputs, although their relevance may vary with deformation state, displacement direction, and historical time lag. Accordingly, the objective of this study is to develop a unified multiscale and meteorological-aware framework for direct 24 h prediction of the northward, eastward, and upward displacement components while preserving the chronological information structure required by short-horizon operational forecasting.
Accordingly, the Variational Mode Decomposition-Gated Recurrent Unit-Cross-Attention-Transformer Network (VGCAT-Net) advances multistep three-dimensional slope-displacement prediction in three respects. First, window-wise variational mode decomposition (VMD) preserves temporal causality while supplying frequency-layered displacement features. Second, meteorological cross-attention conditions environmental information on the evolving displacement state rather than treating meteorological variables as static auxiliary inputs. Third, local temporal encoding by a gated recurrent unit (GRU) is combined with Transformer-based long-range representation to produce a 24 h sequence of northward, eastward, and upward displacement components, with external-site evaluation used to examine spatial transfer across independent monitoring locations.
2. Materials and Methods
2.1. Study Area and Data Acquisition
2.1.1. Study Area and Monitoring Network
The Fushun West Open-Pit Mine in Liaoning Province, China, is a large deep open-pit coal mine with an elongated east–west geometry of approximately 6.6 km, a north–south width of approximately 2.2 km, and a mining depth of about 424 m. Long-term excavation has produced high and spatially heterogeneous slopes around the pit, and deformation is influenced by the combined effects of excavation unloading, geological structure, rainfall infiltration, and local engineering disturbance. Previous studies at this mine have documented pronounced spatial variability in slope deformation and stability, providing an engineering basis for continuous surface-displacement monitoring and short-horizon prediction [37,38].
A multi-source monitoring network has been established across the mine to characterize surface deformation, subsurface deformation, slope geometry, and environmental forcing. GNSS stations provide continuous point-wise three-dimensional surface-displacement observations and constitute the principal displacement data source used in this study. Interferometric synthetic aperture radar (InSAR) provides spatially distributed line-of-sight deformation information over broad slope areas and is mainly used for regional deformation screening. Light detection and ranging (LiDAR) provides high-resolution topographic and surface-geometry information that can support identification of morphological changes. Slope radar supplies high-frequency line-of-sight displacement observations for rapidly deforming local slope areas. Crack and inclination monitoring characterize localized opening, tilting, and near-surface deformation behavior, whereas distributed fiber-optic sensing provides spatially distributed information on subsurface deformation. The multiparameter meteorological system records atmospheric and near-surface environmental variables, including temperature, precipitation, soil moisture, relative humidity, and surface air pressure.
The surface-monitoring network includes seven GNSS stations together with complementary crack, inclination, rainfall, and other monitoring instruments, and the horizontal positioning precision of the GNSS is approximately 2 mm. For the forecasting experiments presented in this study, the model input is restricted to the GNSS displacement observations and synchronized meteorological measurements. The remaining monitoring techniques are described to provide the engineering context of the mine-wide monitoring system and are not used directly for model training or performance evaluation. The same monitoring system has supported operational warning activities in the northern slope. Five documented warning events between 2019 and 2021 involved deformation areas ranging from approximately 5 m × 7 m to 65 m × 150 m; representative events exhibited monitored deformation velocities of 6 mm/h and 10 mm/h, while documented acceleration stages extended from about 10 h to about 23 h. These field records provide an independent engineering reference for interpreting the 24 h prediction horizon used in this study.
2.1.2. Slope Displacement Monitoring Data
The displacement dataset was obtained from the public Fushun West Open-Pit Mine multidimensional monitoring resource archived by the National Basic Science Data Center (CSTR:16666.11.nbsdc.fJ5ZJedX). Four continuous monitoring stations equipped with GNSS receivers were selected and are denoted FS-01, FS-02, FS-03, and FS-04. Continuous coordinate observations were transformed into northward (N), eastward (E), and upward (U) displacement components after datum unification and coordinate differencing. The original observations were recorded in meters and converted to millimeters for model training and engineering-scale error evaluation. FS-01 serves as the reference site for chronological training, validation, and testing, while FS-02, FS-03, and FS-04 provide independent external-site evaluations.
FS-01 contained 9921 valid original observations from 1 September 2020 to 23 April 2022. Because GNSS observation epochs were not always exactly hourly while the meteorological variables were available on an hourly grid, the displacement records were aligned to a unified hourly time scale. After temporal alignment, 14,397 continuous hourly samples were obtained from 03:00 on 1 September 2020 to 23:00 on 23 April 2022. The three external monitoring sites were processed using the same data-cleaning, unit-conversion, and temporal-alignment procedures to maintain consistent evaluation conditions.
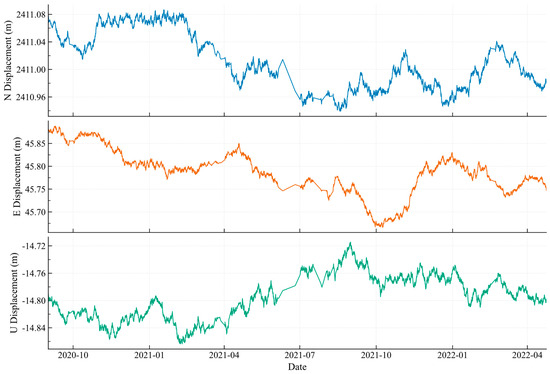
Figure 1 shows the N, E, and U displacement components at FS-01. The three directions differ in amplitude, local fluctuation, and stage-wise evolution, so direction-resolved analysis provides a fuller representation of the monitored deformation than a single component alone. The U component exhibits a comparatively narrower variation range and distinct short-period fluctuations, whereas the N and E components retain stronger long-term directional trends. Joint modeling of all three components therefore preserves the directional structure needed for three-dimensional trajectory prediction.
Figure 1.
Three-dimensional slope-displacement time series at the reference monitoring point FS-01. The original coordinate-derived observations are shown in metres; all model inputs, predictions, and error metrics use millimetres after unit conversion.
2.1.3. Meteorological Data
The meteorological record contains hourly air temperature, precipitation, volumetric soil moisture, soil temperature, relative humidity, and surface air pressure, together with daily statistics including mean air temperature, cumulative precipitation, and evapotranspiration. Daily variables were mapped to the unified hourly timeline without using information from later evaluation periods, and all meteorological records were synchronized with the monitoring timestamps. The resulting data matrix provides concurrent environmental forcing for each displacement observation. The candidate meteorological variables, their measurement units, and their possible physical mechanisms of influence are summarized in Table 1.
Table 1.
Candidate meteorological variables and their physical interpretation.
The meteorological series comprises 14,400 hourly records covering the principal displacement-monitoring interval. The candidate variables have direct relevance to near-surface deformation processes: temperature describes thermal forcing in the observation environment and shallow materials; precipitation and soil moisture represent hydrological forcing and infiltration-related water-content changes; and air pressure and relative humidity characterize additional atmospheric variability. These synchronized variables provide environmental context for state-dependent displacement prediction.
Soil moisture in this study refers to volumetric soil moisture content. For clarity, the physical quantity is defined as .
Where is the volumetric soil moisture content (m3 m−3), is the volume of water contained in the soil (m3), and is the total bulk volume of the soil (m3). Volumetric soil moisture is therefore dimensionless and is commonly expressed as m3 m−3. The present study uses the volumetric soil-moisture observations provided by the monitoring dataset rather than independently determining water content from laboratory samples.
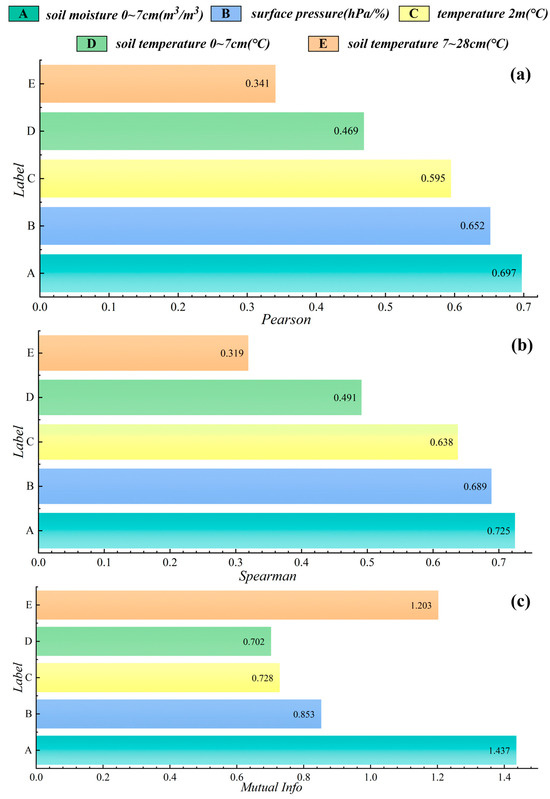
Feature relevance was assessed exclusively on the FS-01 training period using Pearson correlation, Spearman rank correlation, and mutual information, representing linear, monotonic, and nonlinear dependence, respectively. Selection was based on variables that remained consistently informative across these complementary criteria rather than on a single correlation measure. The retained variables were soil moisture at 0–7 cm, surface air pressure, 2 m air temperature, soil temperature at 0–7 cm, and soil temperature at 7–28 cm. The training-period relevance values are shown in Figure 2.
Figure 2.
Training-period meteorological relevance: (a) Pearson correlation coefficient; (b) Spearman rank correlation coefficient; (c) mutual information.
The selected variables span hydrological, thermal, and atmospheric forcing and were used as the meteorological branch of VGCAT-Net.
2.1.4. Data Preprocessing and Temporal Partitioning
All observations were organized on a strictly chronological hourly index before sample construction. Timestamps were standardized, displacement and meteorological records were aligned to the same hourly grid, and locally irregular observations were regularized in time order. Preprocessing operations were separated by chronological subset so that parameters estimated from later validation or test intervals could not influence earlier feature construction. This arrangement preserves the information structure of an operational prediction stream.
The slope displacement series and the meteorological series were subsequently aligned using hourly timestamps. Let the input feature vector at time step after temporal alignment be defined as:
where denotes the input feature vector at time step ; denotes the three-dimensional slope displacement vector at time step , measured in millimeters ; denotes the selected meteorological feature vector at the same time step, whose elements have measurement units determined by the corresponding meteorological variables; and denotes an auxiliary feature vector composed of temporal features, lag features, and the multiscale features constructed in the subsequent stage. By constructing using a unified temporal index, the model can simultaneously exploit the current displacement state, environmental disturbances, and historical temporal dynamics at each time step.
The FS-01 sequence was divided chronologically into training, validation, and test subsets using proportions of 70%, 15%, and 15%, respectively. Model parameters were learned from the training subset, hyperparameter selection and early stopping used only the validation subset, and the held-out test subset was reserved for final reference-site evaluation.
Let the complete sample sequence be defined as:
where denotes the complete sample set, denotes the prediction target at time step , and denotes the total number of samples.
Accordingly, the training, validation, and test sets are defined as follows:
where , , and denote the training, validation, and test sets, respectively, and denotes the floor operation.
For the reference-site experiments, robust-scaling parameters were estimated solely from the FS-01 training subset and then fixed for its validation and test subsets. For cross-site evaluation, a short historical calibration segment preceding each external evaluation interval was used only to align the local displacement baseline and estimate site-specific scaling parameters; model weights remained fixed, and observations from the external evaluation interval were not used for calibration. For any continuous variable, robust scaling follows Equation (6).
In Equation (6), the scaled value is dimensionless; the location and scale parameters correspond to the median and interquartile range (IQR) estimated from the applicable pre-evaluation calibration period. This procedure provides comparable numerical ranges while retaining chronological independence between calibration and evaluation data.
After synchronization, chronological partitioning, and causality-preserving scaling, each hourly sample combines three-dimensional displacement, selected meteorological variables, temporal and lag information, and the multiscale features generated inside the historical prediction window.
2.2. VGCAT-Net Prediction Framework
2.2.1. Overall Architecture
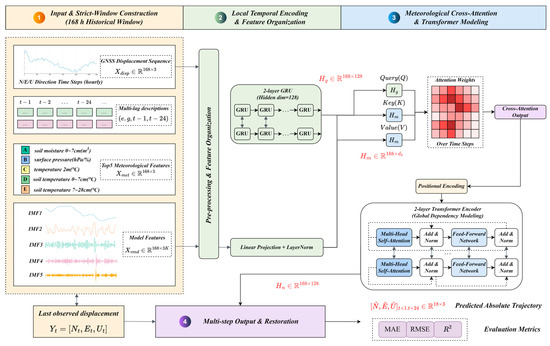
VGCAT-Net is configured for direct multistep prediction of three-dimensional displacement increments. Each sample uses the previous 168 h as the historical context and returns the N, E, and U displacement-increment trajectories for the subsequent 24 h. The input combines raw three-dimensional displacement, temporal and lag features, the five selected meteorological variables, and VMD modal features computed independently within the current 168 h window. This organization couples local temporal encoding, environmental interaction, long-range dependency modeling, and a multistep output head within a single causal prediction pipeline.
Given an input sequence with historical-window length L and prediction horizon H, the model input is defined in Equation (7).
Equation (7) represents one prediction sample over the historical window. Each time step contains the three-dimensional displacement state together with meteorological, temporal, lag, and window-wise VMD features. In the experiments, L = 168 h and H = 24 h.
The prediction target is the sequence of three-dimensional displacement increments over the next H time steps, as defined in Equation (8).
The target in Equation (8) contains one N, E, and U displacement increment for each forecast step. Predicting increments rather than absolute coordinates focuses learning on the evolving deformation process and reduces sensitivity to station-specific displacement baselines.
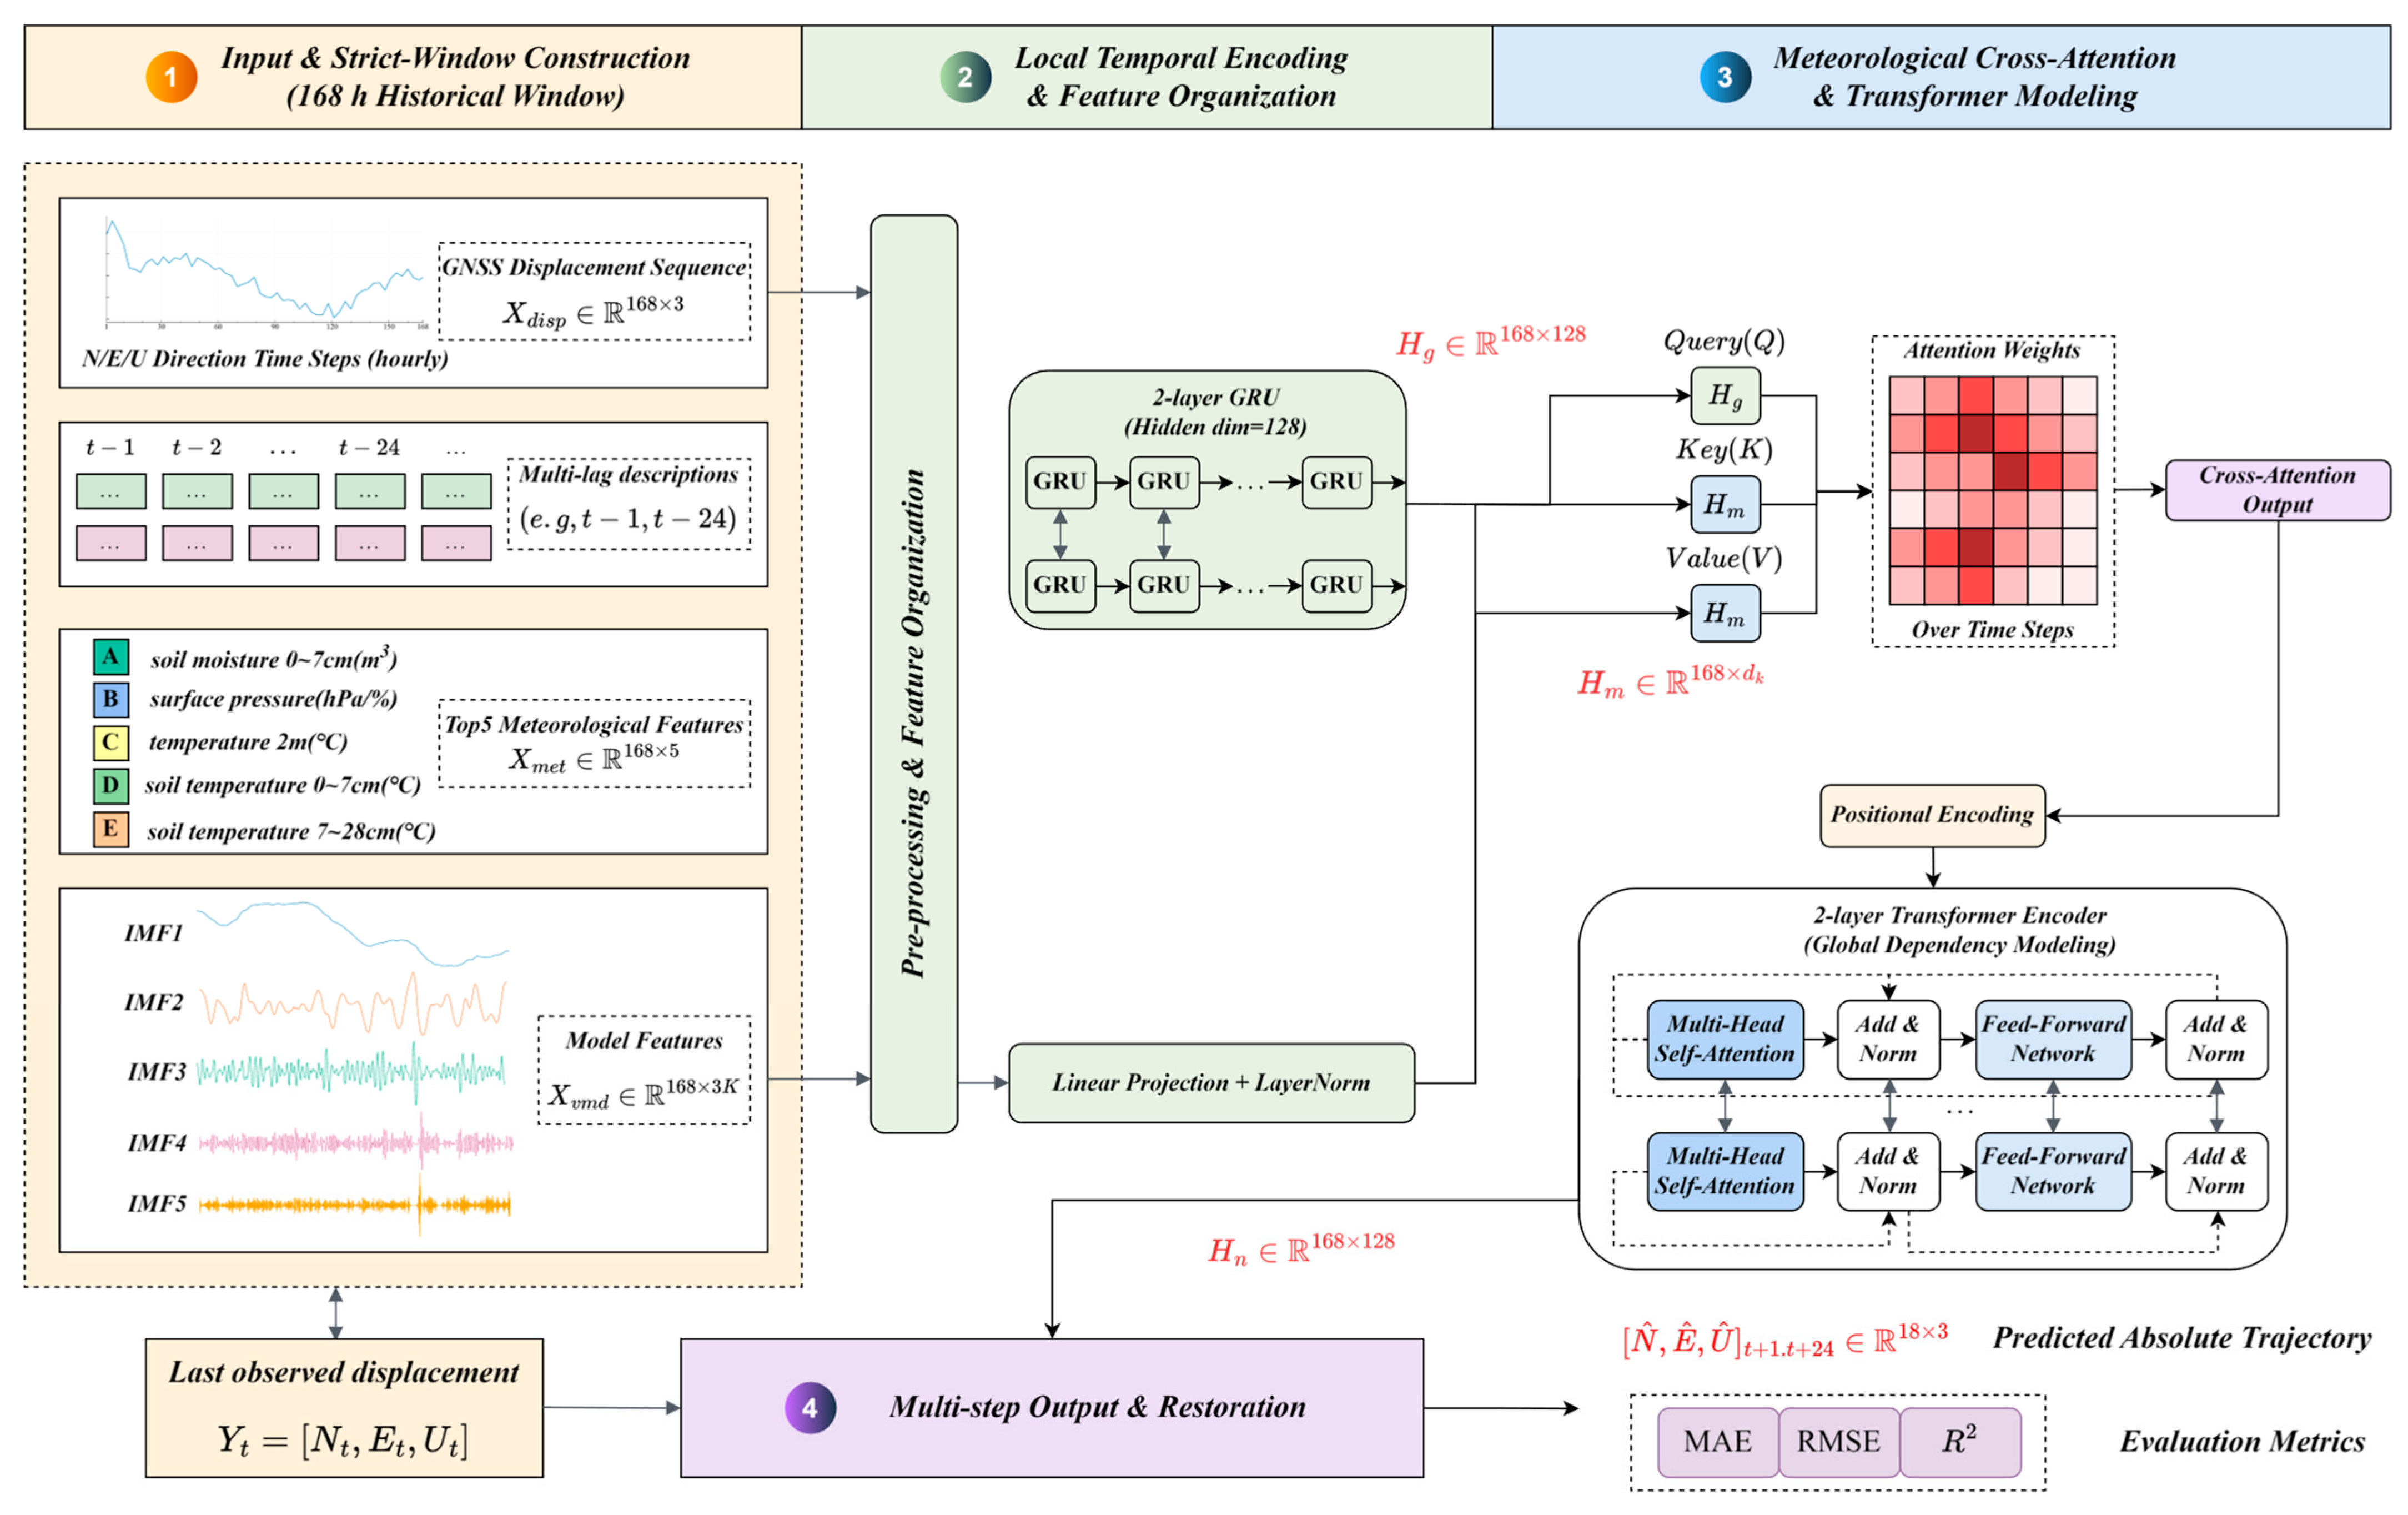
The information flow is illustrated in Figure 3. Multiscale displacement and temporal features first enter the GRU encoder; meteorological information is fused through cross-attention; the resulting representation is passed to the Transformer encoder; and the multistep head produces the 24 h increment sequence. Absolute displacement is reconstructed from the last observed displacement using Equation (9).
Figure 3.
Architecture of VGCAT-Net for 24 h prediction of three-dimensional slope displacement.
Equation (9) reconstructs the absolute three-dimensional trajectory by cumulatively adding the predicted increments to the last observed displacement vector in the input window.
2.2.2. Causality-Preserving VMD Multiscale Decomposition
VMD is used to represent the displacement signal as a set of band-limited modes with distinct center frequencies. For each direction, the method minimizes the summed bandwidth of the modes while constraining their reconstruction to the original signal, as expressed in Equation (10). The number of modes was fixed at K = 5 for all experiments so that the same frequency-layered representation was available to the temporal encoder.
Equation (10) describes the VMD optimization for a one-dimensional displacement sequence. The mode functions are measured in millimeters; their center angular frequencies control the frequency localization, and the reconstruction constraint preserves the original historical signal.
For each prediction sample, decomposition is executed separately using only the displacement observations contained in that sample’s historical input window. The resulting modal values are therefore available at the forecast origin and do not depend on later validation or test observations. The combined N-, E-, and U-direction modal feature vector is defined in Equation (11).
Equation (11) concatenates the K modal values from each of the three displacement components at a given historical time step. Low-frequency modes describe gradual evolution, whereas higher-frequency modes encode shorter disturbances and local variability.
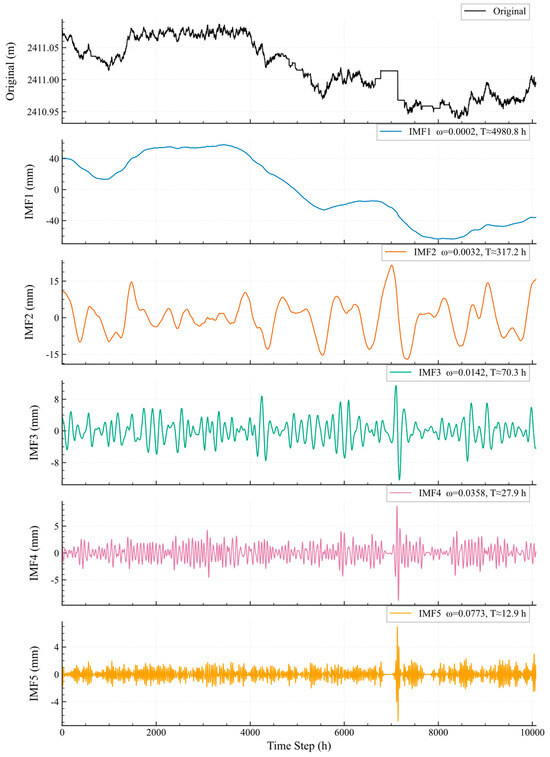
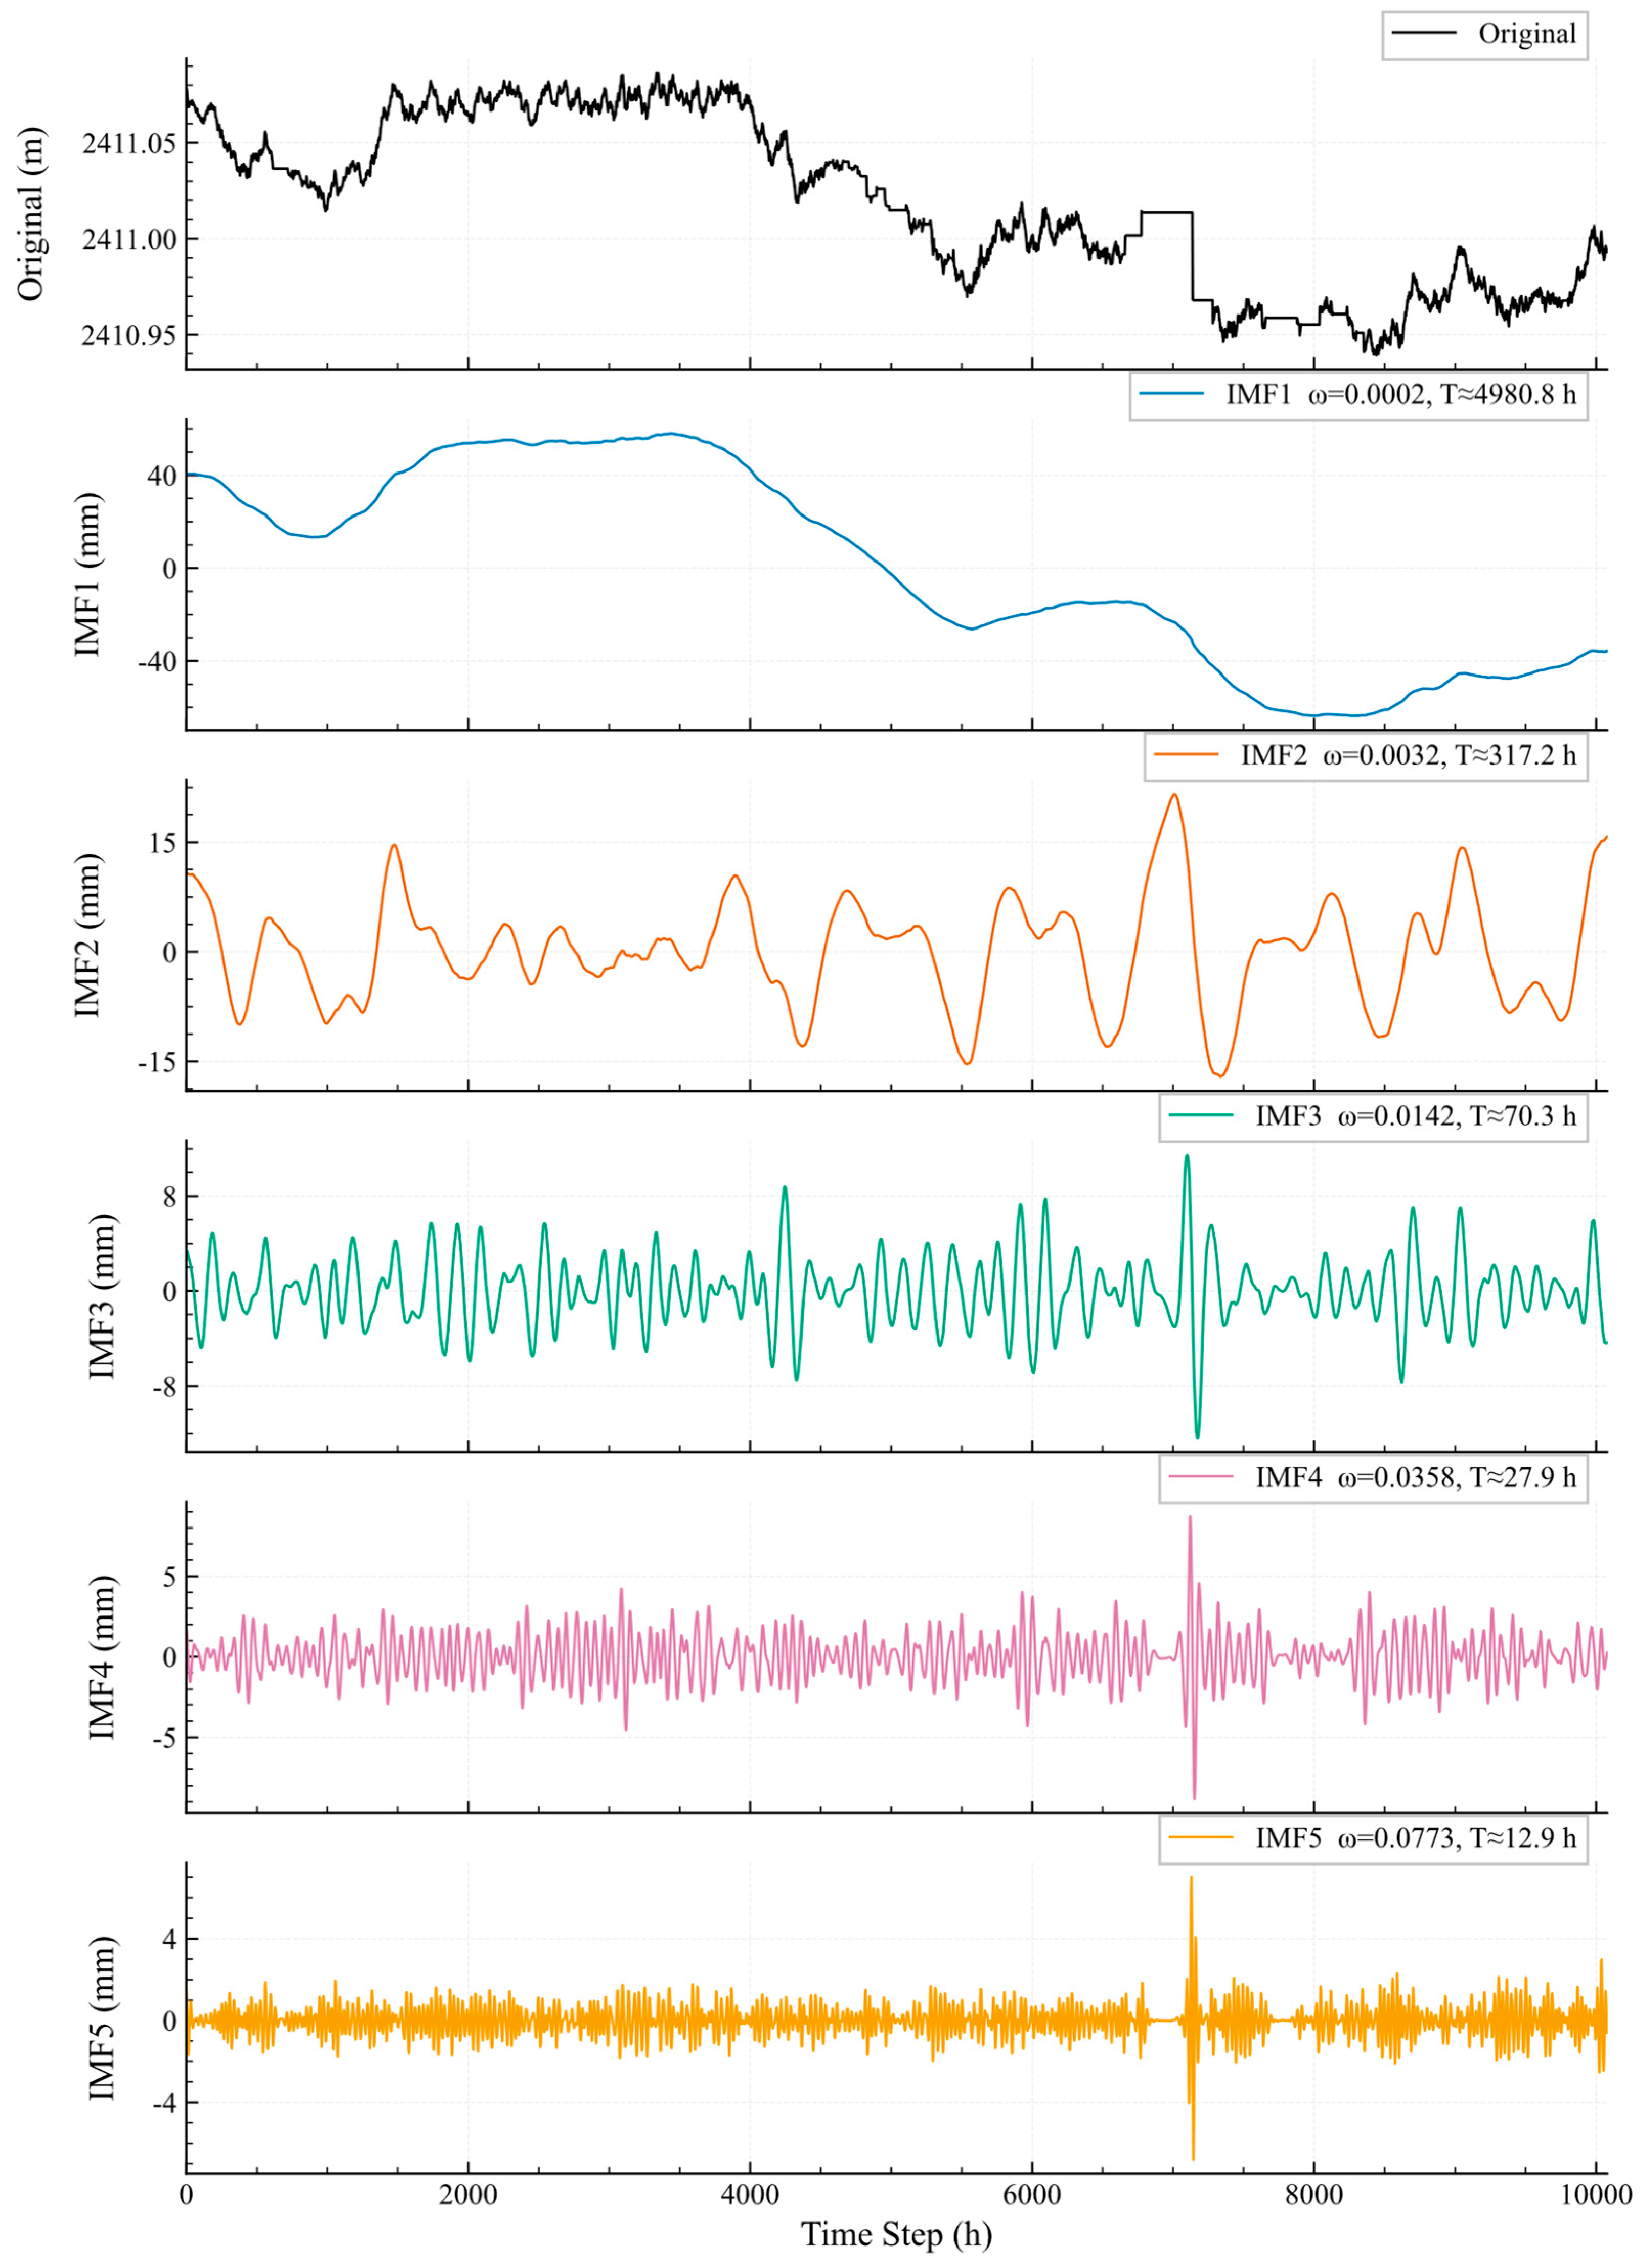
Figure 4 illustrates the five-mode decomposition of the N-direction displacement component at FS-01 as a representative example. The frequency-layered signals retain the long-term evolution visible in the original series while isolating shorter-term fluctuations for subsequent temporal encoding. The E- and U-direction displacement components are decomposed in the same manner.
Figure 4.
Window-wise VMD of the N-direction displacement series at FS-01.
2.2.3. GRU-Based Local Temporal Encoding
The GRU encoder is employed to capture short- and medium-term temporal dependencies within the 168 h historical window through its update and reset mechanisms. Owing to its compact recurrent architecture, it can effectively preserve the temporal evolution of displacement-related features while maintaining a relatively low model complexity. The resulting hidden representations are subsequently used as the query-side deformation features for interaction with meteorological information. The GRU state update for the historical feature sequence is formulated in Equation (12).
The sequence of GRU hidden states over the historical window is assembled according to Equation (13).
The GRU output preserves local deformation dynamics at every historical time step and supplies a displacement-conditioned representation to the meteorological cross-attention module.
2.2.4. Meteorological Cross-Attention
Meteorological forcing is fused conditionally on the current displacement representation. The GRU-encoded displacement sequence acts as the query, while the synchronized meteorological representation supplies keys and values. This arrangement allows the model to emphasize environmental variables and historical moments according to their relevance to the evolving deformation state.
Linear projections form the query, key, and value matrices in Equation (14).
The scaled dot-product cross-attention operation is defined in Equation (15).
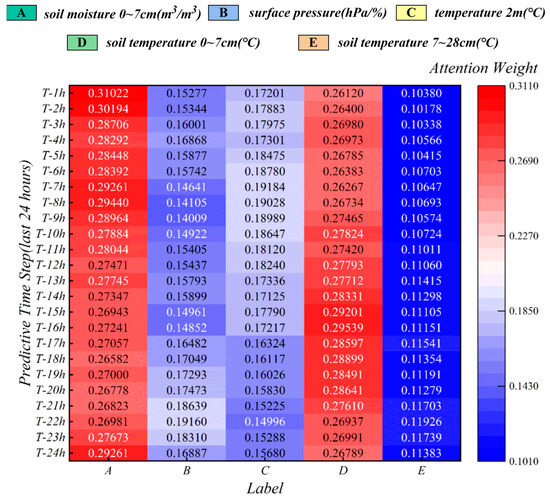
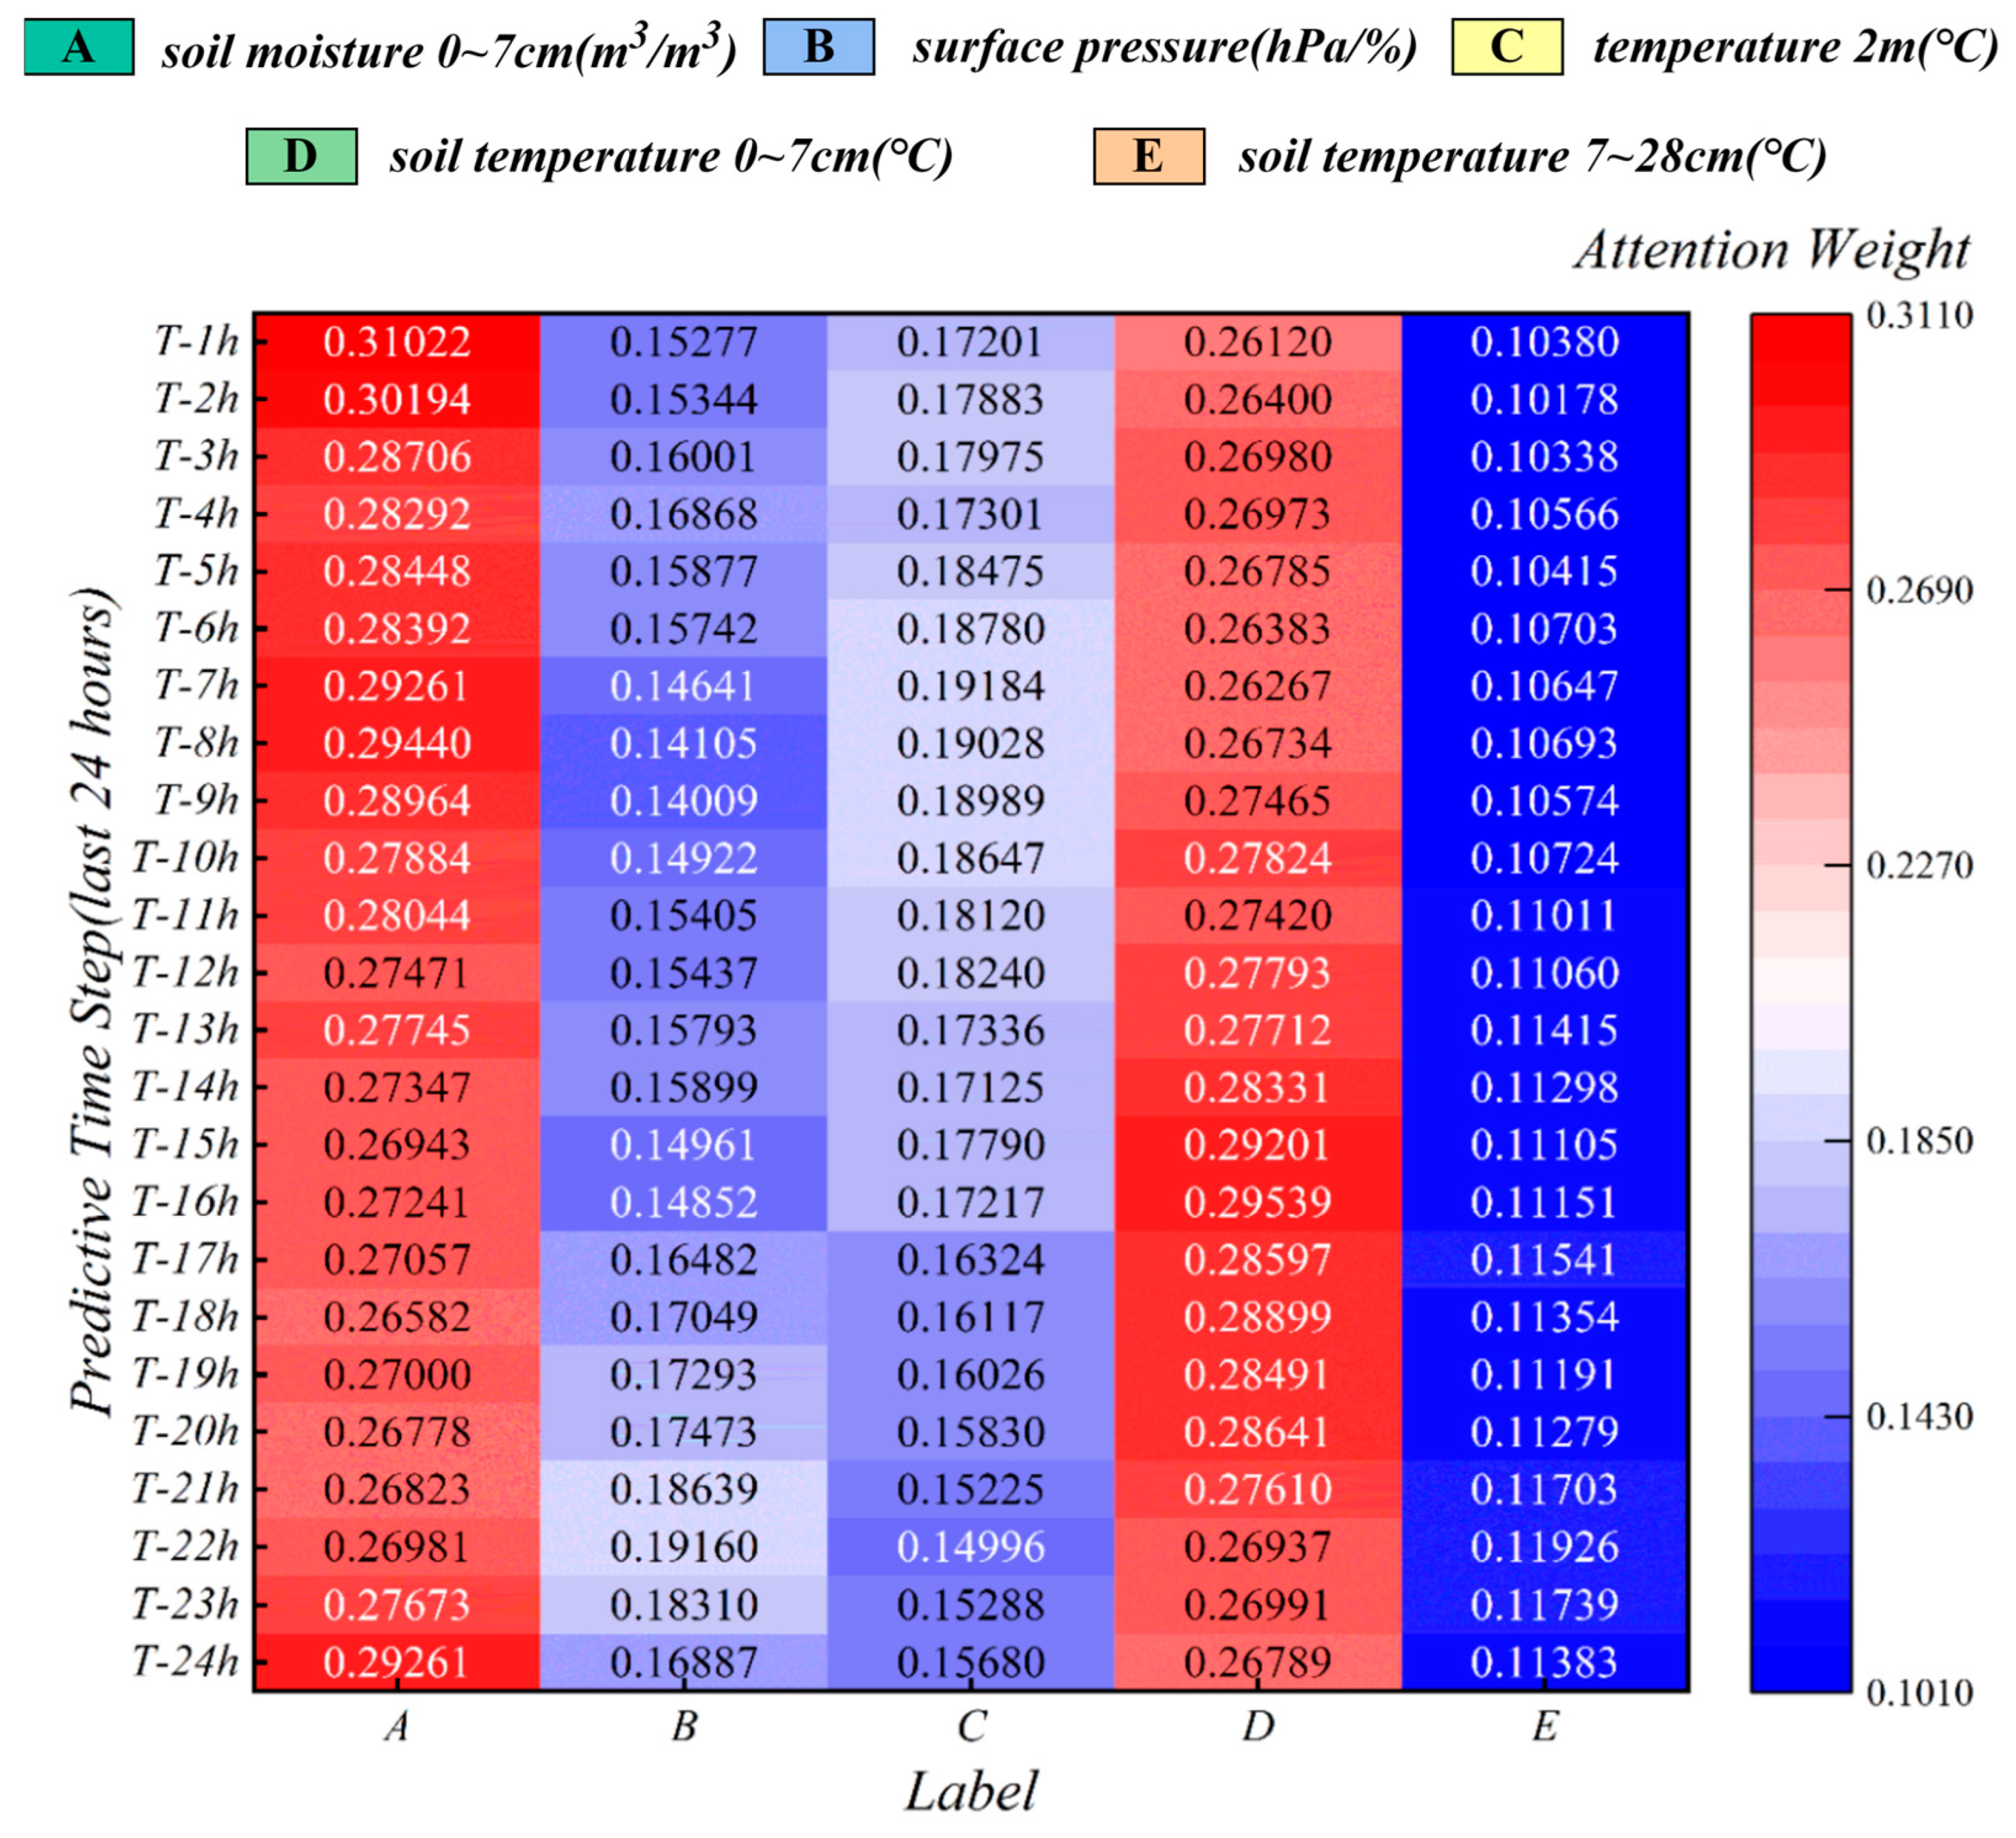
The attention matrix assigns a data-dependent relevance weight to meteorological information at each historical step. The five variables selected in Section 2.1.3 cover soil moisture, surface air pressure, air temperature, and soil temperature, enabling the interaction layer to represent hydrological, atmospheric, and thermal responses. The fused displacement–meteorological representation is defined in Equation (16).
The fusion function combines the original displacement encoding with the cross-attention output through concatenation, linear projection, and nonlinear activation. Meteorological variables therefore participate dynamically in the deformation representation instead of entering as a fixed appended vector.
2.2.5. Transformer-Based Long-Range Modeling and Multistep Output
After meteorological fusion, a Transformer encoder captures long-range dependencies across the 168 h historical context. Self-attention establishes interactions between nonadjacent time steps, complementing the local recurrent encoding of the GRU and stabilizing the representation used for the 24 h output sequence.
With positional encoding added to preserve temporal order, the Transformer representation is defined in Equation (17).
Positional encoding identifies the relative order of observations within the historical window. The Transformer output is passed to the multistep prediction head to generate the complete 24 h displacement-increment trajectory.
Equation (18) denotes the fully connected multistep prediction head and its learnable parameters. The output contains 24 successive three-dimensional displacement increments, reported in millimeters.
Figure 5 visualizes meteorological cross-attention weights over the final 24 h of the historical input window.
Figure 5.
Meteorological cross-attention weights for the five selected features over the final 24 h of the 168 h historical input window. The variables are volumetric soil moisture at 0–7 cm (m3 m−3), surface air pressure (hPa), 2 m air temperature (°C), soil temperature at 0–7 cm (°C), and soil temperature at 7–28 cm (°C).
Absolute trajectories are reconstructed from the predicted increments using Equation (9). Prediction accuracy is quantified using the mean absolute error (MAE), root mean square error (RMSE), and coefficient of determination (R2), allowing absolute error and temporal agreement to be evaluated together.
The complete framework therefore combines causality-preserving multiscale decomposition, recurrent local encoding, state-conditioned environmental fusion, long-range self-attention, and direct 24 h three-dimensional output.
2.3. Experimental Design and Evaluation Metrics
2.3.1. Prediction Task and Hyperparameters
FS-01 was used for chronological model development and held-out reference-site evaluation. Each sample uses the preceding 168 h of synchronized monitoring information to predict the subsequent 24 h sequence of N, E, and U displacement increments, which are subsequently reconstructed into absolute trajectories. The FS-01 record was divided chronologically into training, validation, and test subsets at a ratio of 70%, 15%, and 15%, respectively. The training subset was used for parameter learning, the validation subset for model selection and early stopping, and the test subset exclusively for final evaluation. After completion of reference-site model development, FS-02, FS-03, and FS-04 were used for cross-site evaluation following the protocol described in Section 2.3.4.
The principal hyperparameters used for model development are summarized in Table 2. The historical input length and prediction horizon were fixed at 168 h and 24 h, respectively. The VMD representation contained five modes for each displacement component, and five meteorological variables were retained following training-period feature screening. The GRU encoder consisted of two recurrent layers with a hidden-state dimension of 128. Model optimization used an initial learning rate of 3 × 10⁻⁴, a batch size of 32, and validation-based early stopping with a patience of 30 epochs. Hyperparameter selection was performed during model development, and the held-out test subset was not used for hyperparameter optimization. All evaluated models used the same 168 h historical input length, 24 h prediction horizon, chronological data partitions, and evaluation metrics to ensure consistent comparison.
Table 2.
Principal VGCAT-Net hyperparameters.
2.3.2. Baseline Models
Four representative baselines were used: random forest (RF), long short-term memory (LSTM), gated recurrent unit (GRU), and Transformer. Together they span feature-based ensemble learning, recurrent sequence modeling, and self-attention-based long-range modeling, providing complementary reference points for the complete architecture.
RF evaluates nonlinear mapping without an explicit recurrent state. LSTM and GRU quantify the contribution of recurrent temporal memory, and the Transformer tests long-range self-attention on the original feature sequence. VGCAT-Net adds causality-preserving VMD and displacement-conditioned meteorological interaction to the GRU–Transformer pathway.
All models used identical chronological training, validation, and test intervals, the same 168 h input window, the same 24 h prediction horizon, and the same evaluation metrics. Scaling parameters for FS-01 were estimated from the training subset only, and the test subset was not used for model fitting, feature screening, or hyperparameter selection.
2.3.3. Progressive Ablation Design
A progressive ablation sequence isolates the contribution of multiscale decomposition, meteorological interaction, and long-range temporal encoding. Starting from a GRU baseline, window-wise VMD, meteorological cross-attention, and the Transformer encoder are introduced successively while all data partitions, training settings, and evaluation protocols remain unchanged.
Table 3 summarizes the four configurations. Because each stage differs from the preceding stage by one functional module, performance changes can be interpreted as incremental gains associated with multiscale representation, environmental interaction, and long-range dependency modeling.
Table 3.
Progressive ablation configurations.
2.3.4. Cross-Site External Validation
Spatial transfer was evaluated by applying the FS-01-trained model to FS-02, FS-03, and FS-04. Each external station follows the same hourly alignment, feature organization, input length, and forecast horizon as the reference site. Model weights are not updated using external evaluation observations.
To account for station-specific displacement baselines and numerical scale, only a short historical segment preceding each external evaluation interval is used for baseline alignment and local robust-scaling calibration. This pre-evaluation calibration preserves the information chronology and allows transfer performance to reflect the deformation patterns learned at FS-01 rather than target-period fitting.
2.3.5. Evaluation Metrics
Prediction performance is evaluated using the mean absolute error (MAE), root mean square error (RMSE), and coefficient of determination (R2). MAE represents the average magnitude of displacement error, RMSE gives greater weight to larger local deviations, and R2 quantifies agreement between predicted and observed temporal variation. The three metrics are defined in Equations (19)–(21).
In Equations (19)–(21), the observed and predicted displacement values are compared over the evaluation samples, and the sample mean of the observations is used in R2. MAE and RMSE are reported in millimeters, whereas R2 is dimensionless.
MAE and RMSE jointly characterize engineering-scale error, while R2 complements them by describing how closely the predicted trajectory follows the observed temporal pattern. Directional metrics are calculated independently for N, E, and U.
Equation (22) defines the mean metric across the three displacement components. For MAE and RMSE, the resulting mean retains units of millimeters; the mean R2 is dimensionless.
3. Results and Discussion
3.1. Reference-Site Prediction Performance
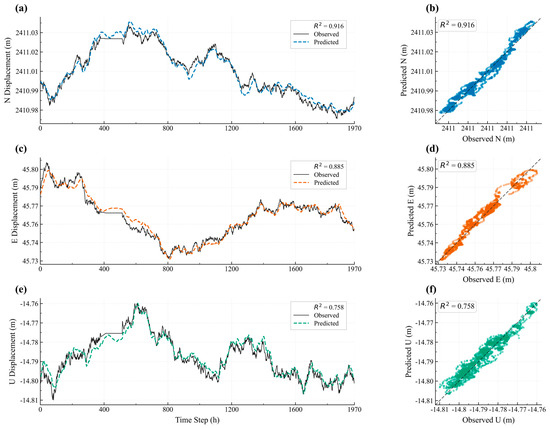
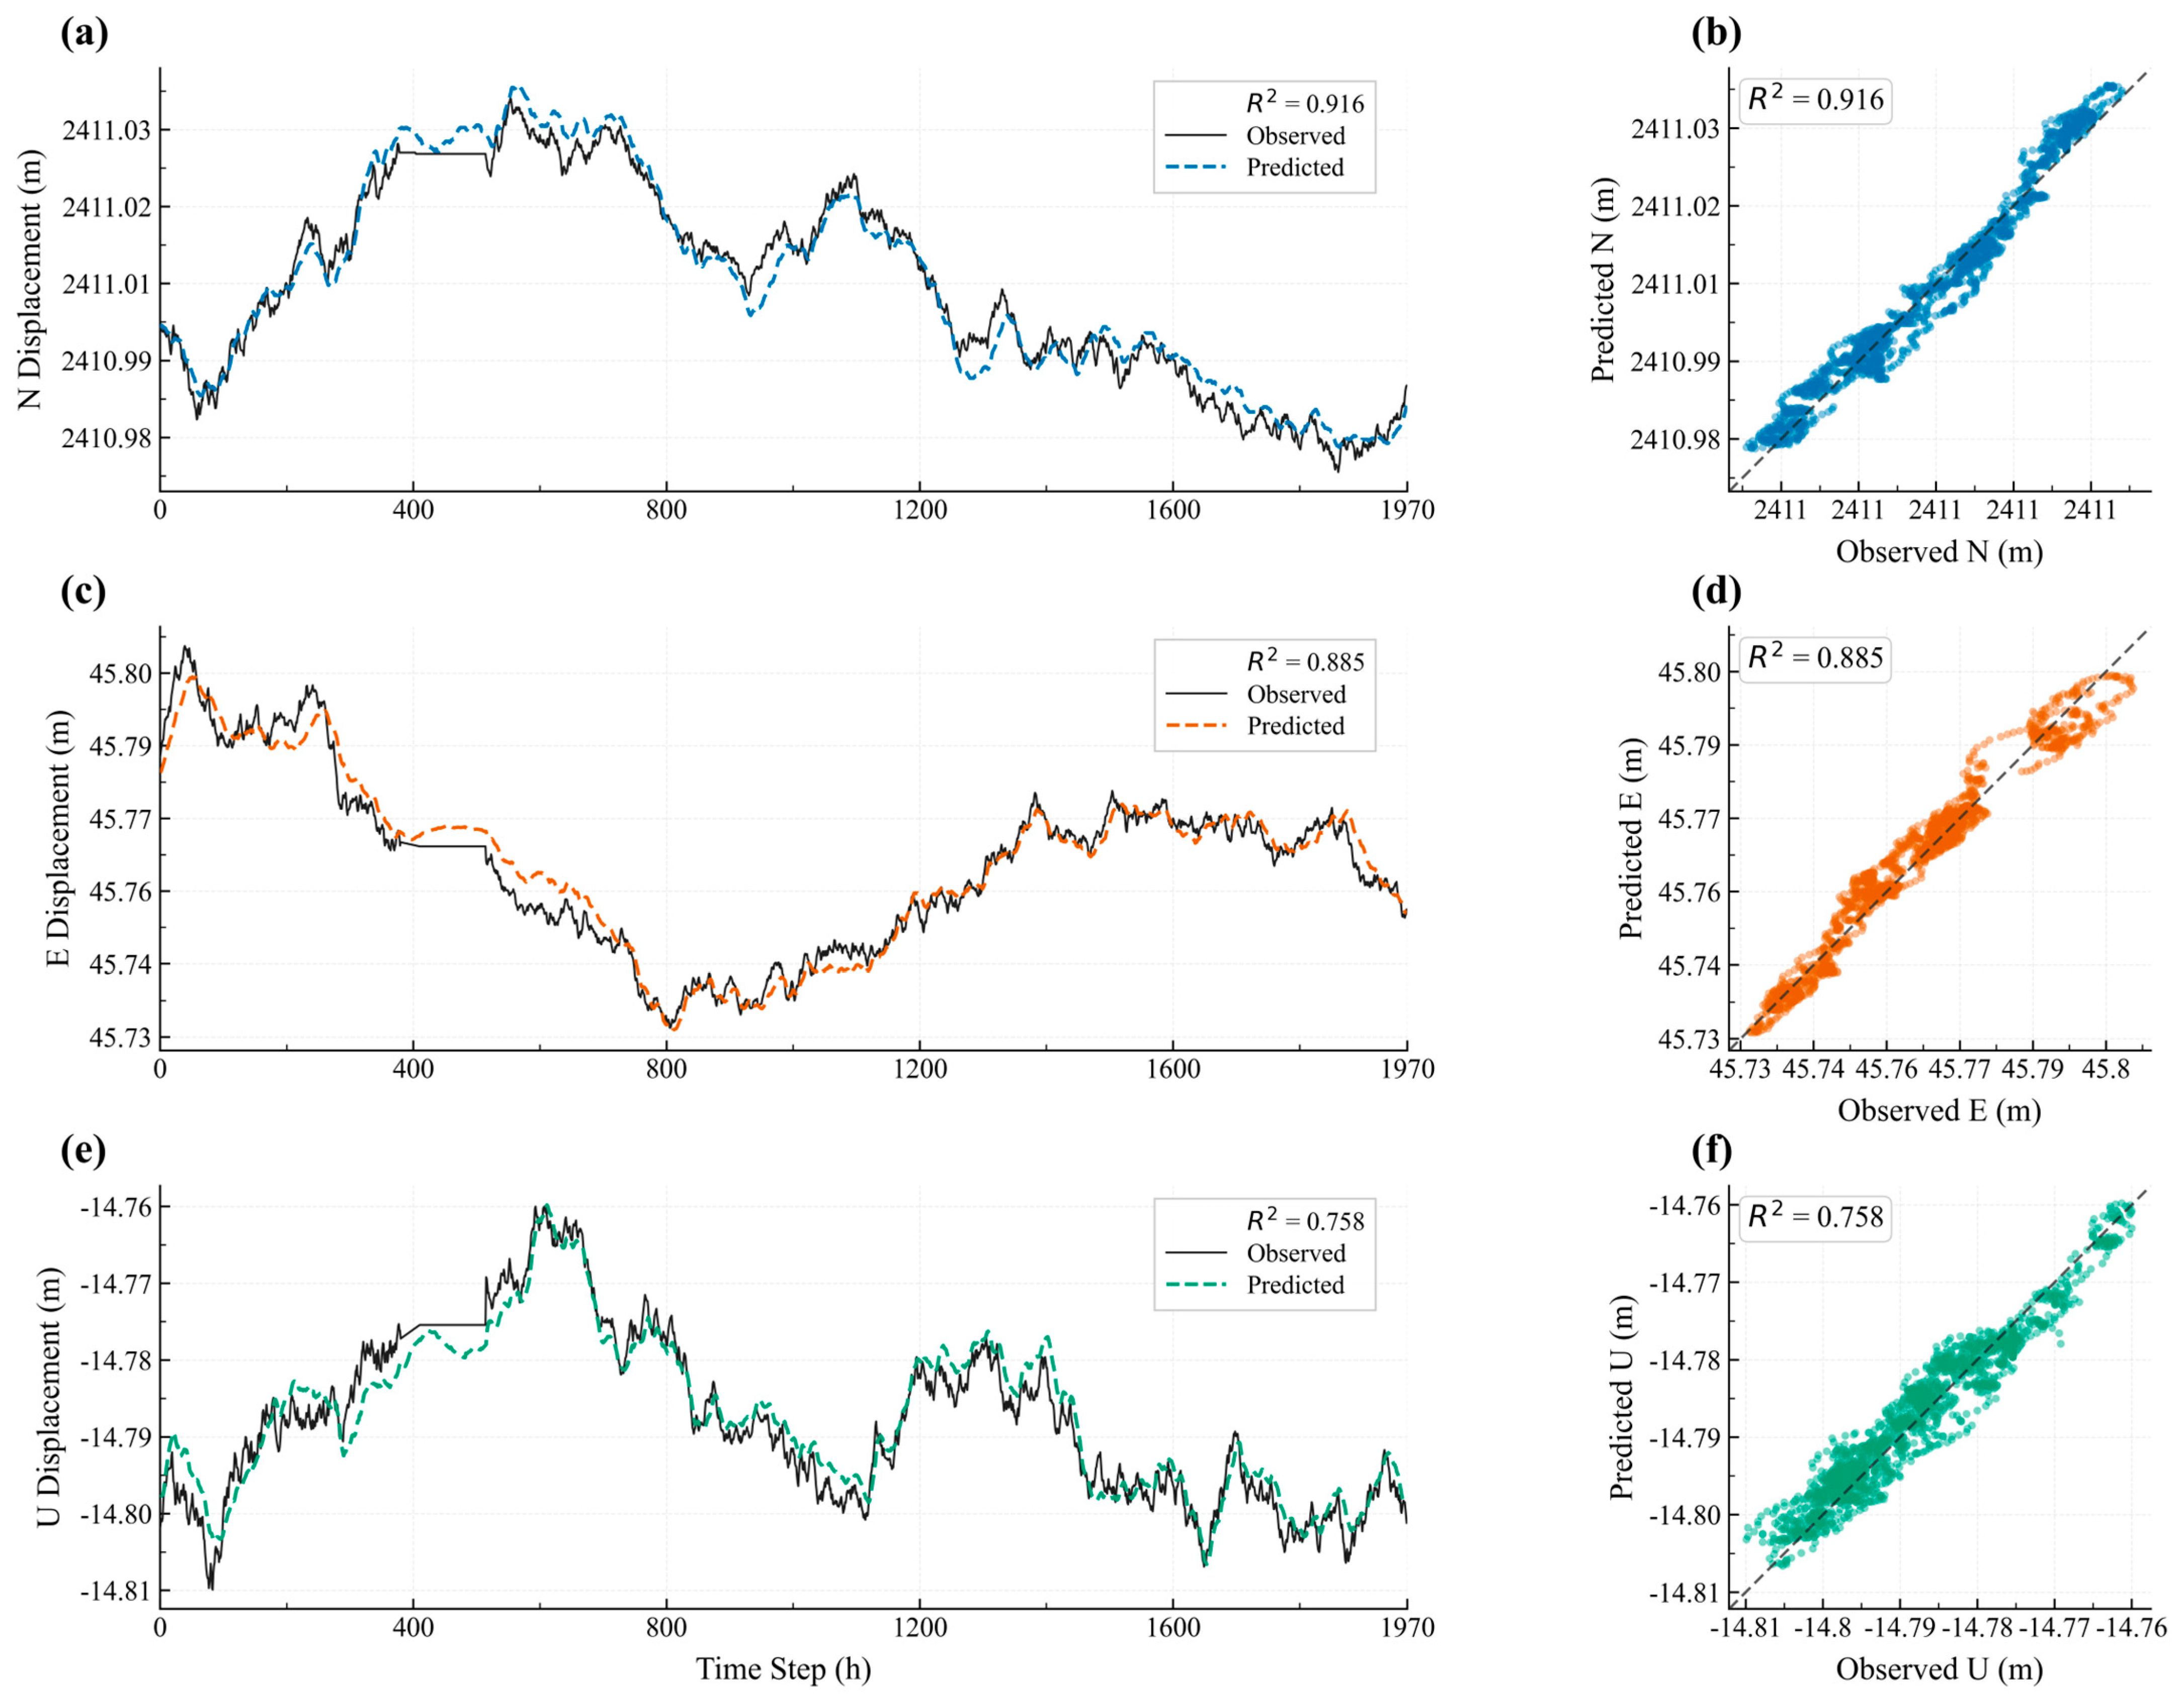
VGCAT-Net was first evaluated on the held-out FS-01 test interval. Table 4 summarizes direction-resolved and averaged metrics, and Figure 6 compares the observed and predicted trajectories. The predictions track the dominant trends and shorter fluctuations in all three displacement components over the 24 h prediction horizon.
Table 4.
Twenty-four-hour prediction performance of VGCAT-Net and baseline models at FS-01.
Figure 6.
Observed and predicted displacement components at FS-01: (a,b) N component; (c,d) E component; (e,f) U component. Solid lines indicate observed displacements and dashed lines in panels (b), (d), and (f) represent the reference line , indicating perfect agreement between observed and predicted values. Colors are used to distinguish the displacement components.
VGCAT-Net achieved an average MAE of 4.538 mm, RMSE of 5.642 mm, and R2 of 0.853. The corresponding average R2 values of RF, LSTM, GRU, and Transformer were 0.551, 0.641, 0.724, and 0.805, respectively. The complete framework also produced the lowest average MAE and RMSE among the evaluated models, demonstrating consistent gains across both absolute-error and trajectory-agreement measures.
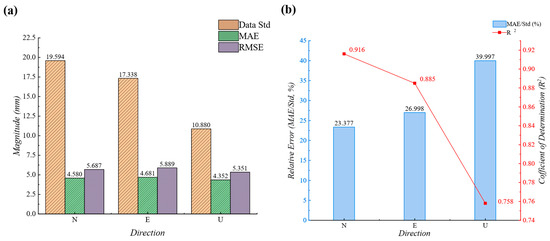
For the individual components, MAE values were 4.580, 4.681, and 4.352 mm for N, E, and U, with RMSE values of 5.687, 5.889, and 5.351 mm, respectively. R2 reached 0.916 for N, 0.885 for E, and 0.758 for U. The comparable absolute errors across directions indicate stable three-dimensional prediction, while the lower U-component R2 reflects the narrower variation range of the vertical series examined in Section 3.2.
3.2. Direction-Resolved Error Characteristics
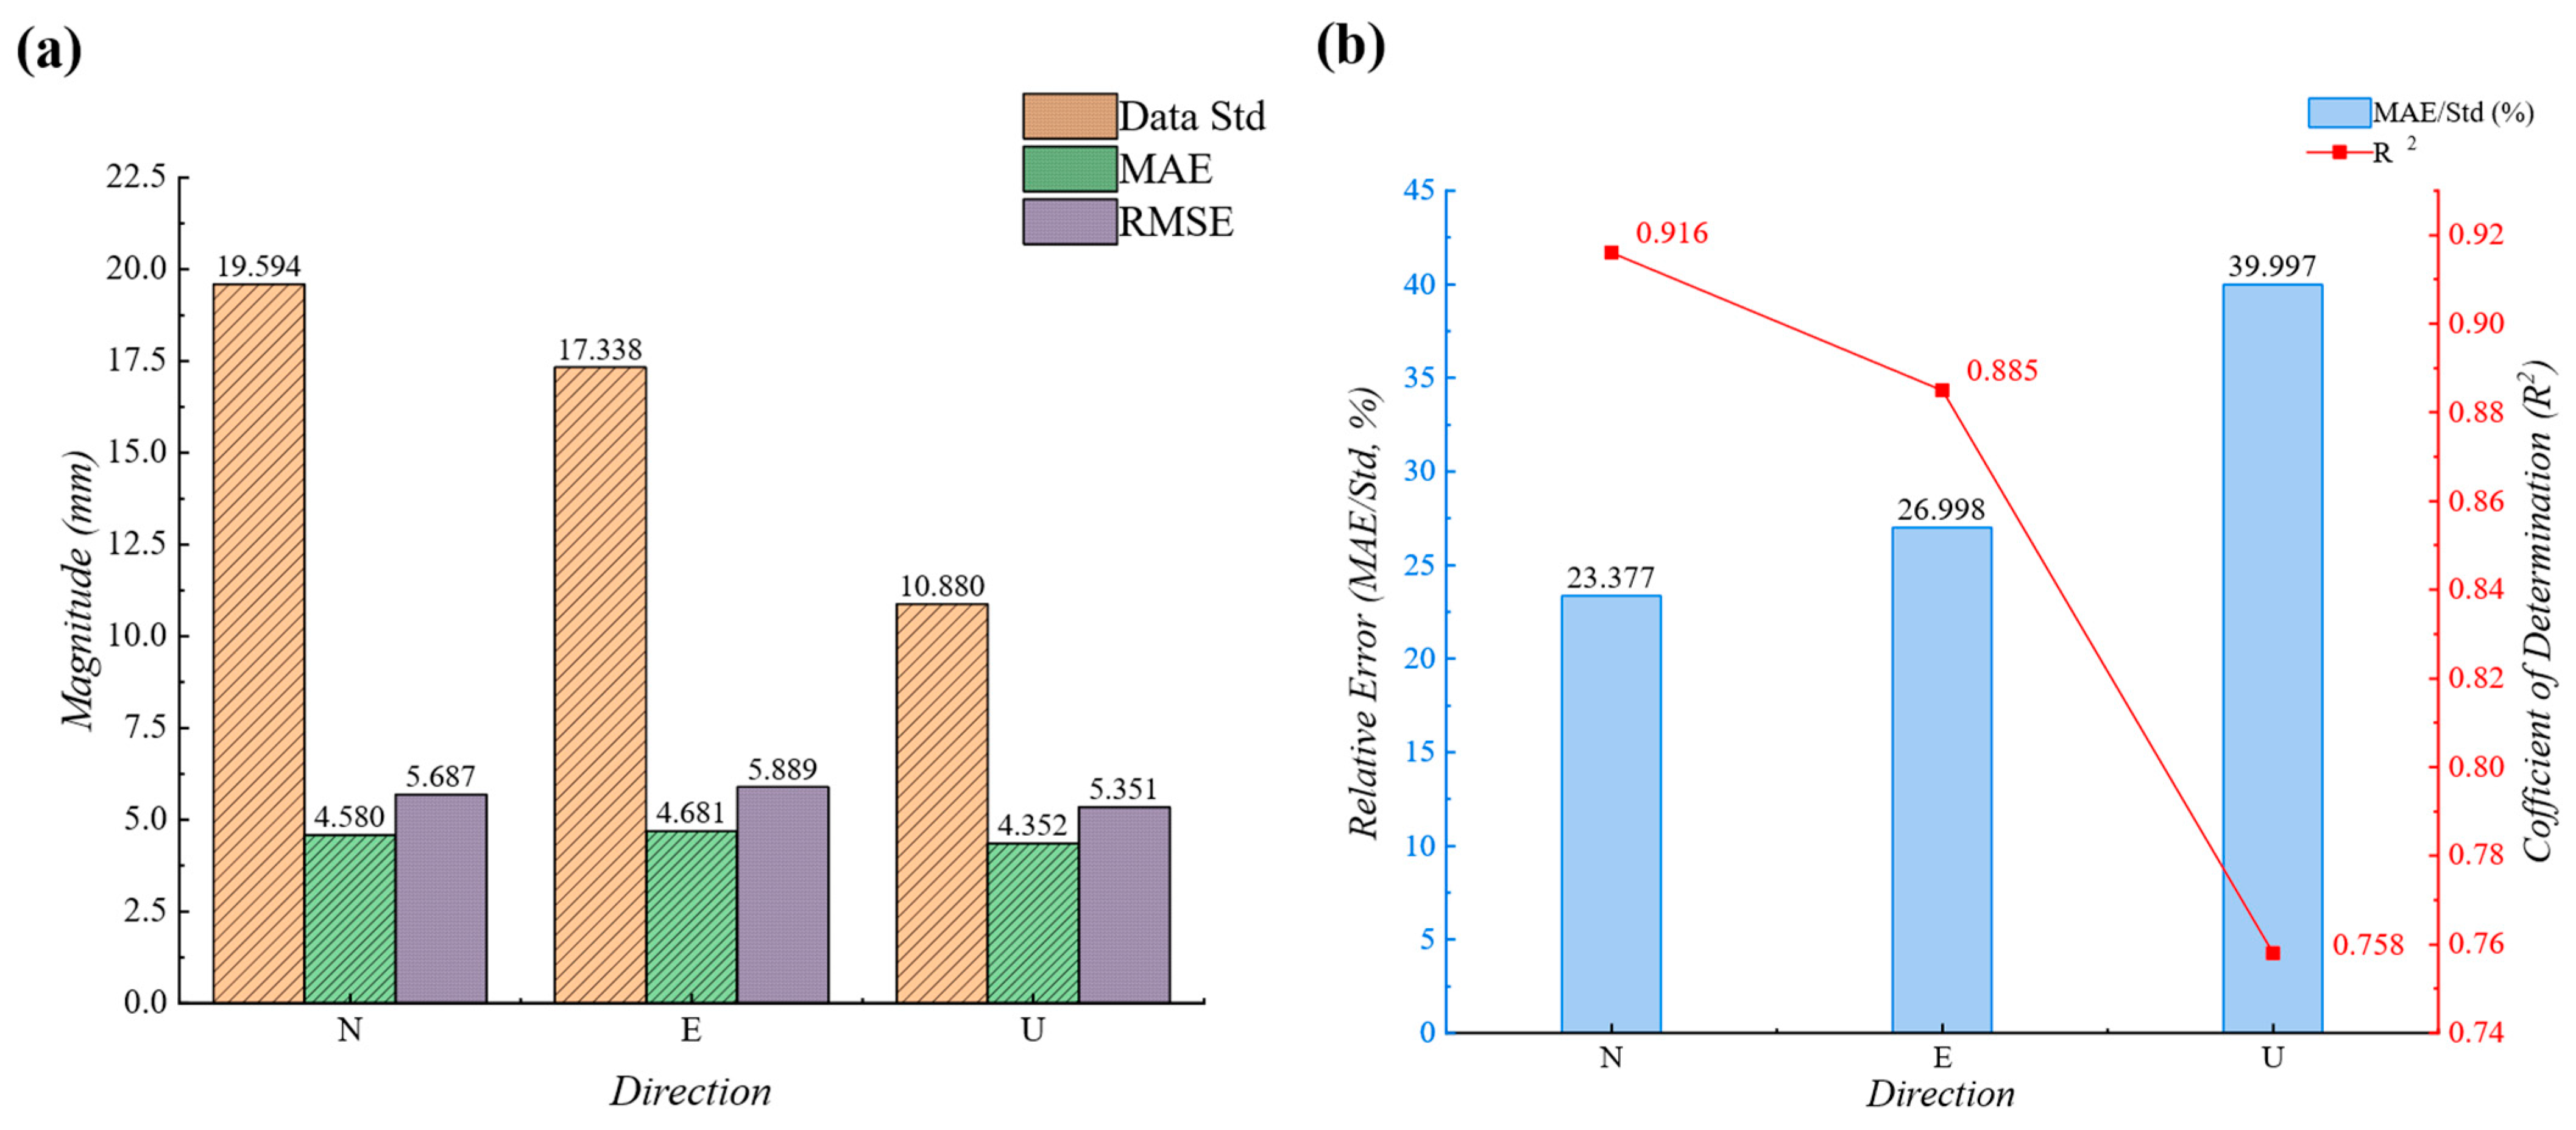
Direction-resolved statistics were examined to interpret the relationship between absolute error and signal variability. Figure 7 illustrates the relationship between displacement variability and prediction error at FS-01, showing the variations in MAE, RMSE, observed standard deviation, and the normalized error ratio. Although the U component had the lowest MAE and RMSE, its R2 was lower than those of N and E. Table 5 therefore reports the standard deviation and range of each observed component together with normalized error ratios.
Figure 7.
Relationship between displacement variability and prediction error at FS-01: (a) MAE, RMSE, and observed standard deviation; (b) R2 and MAE/standard-deviation ratio.
Table 5.
Displacement variability and normalized prediction errors for the FS-01 test interval.
The U component has a standard deviation of 10.880 mm, equal to 55.5% of the N-component standard deviation (19.594 mm), and a range of 49.900 mm. The N and E ranges are 72.750 and 78.703 mm, respectively. Because R2 is normalized by the variance of the observed series, a comparable absolute error occupies a larger fraction of the available variance for U. The normalized ratios in Table 5 therefore complement R2 and confirm that the lower vertical R2 is associated with a more compact observed displacement range.
From an engineering perspective, the vertical component is influenced by a distinct combination of satellite geometry, residual atmospheric effects, local settlement, and near-surface environmental response. Evaluating N, E, and U jointly therefore provides a more complete assessment than interpreting a single relative metric in isolation.
The U component combines the lowest absolute errors with the lowest reference-site R2 among the three directions. This result is consistent with its smaller observed standard deviation and range: when the target series occupies a compact variability envelope, millimeter-scale errors account for a larger fraction of the variance used in R2. The normalized MAE/standard deviation and MAE/range ratios therefore provide useful context for interpreting vertical performance.
Vertical GNSS observations also reflect a distinct measurement environment involving satellite geometry, residual atmospheric effects, local settlement, and near-surface conditions. Direction-resolved assessment is consequently more informative than a single averaged statistic. The combination of MAE, RMSE, R2, MAE/standard deviation, and MAE/range provides a balanced engineering interpretation of both absolute trajectory error and relative temporal agreement.
3.3. Prediction-Horizon Stability
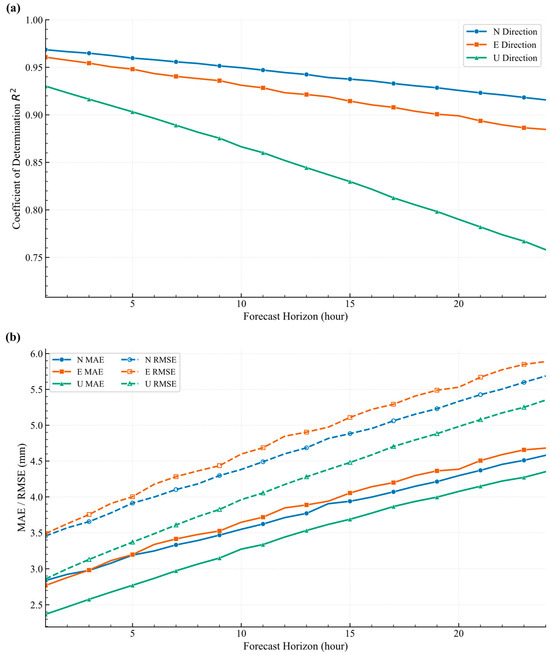
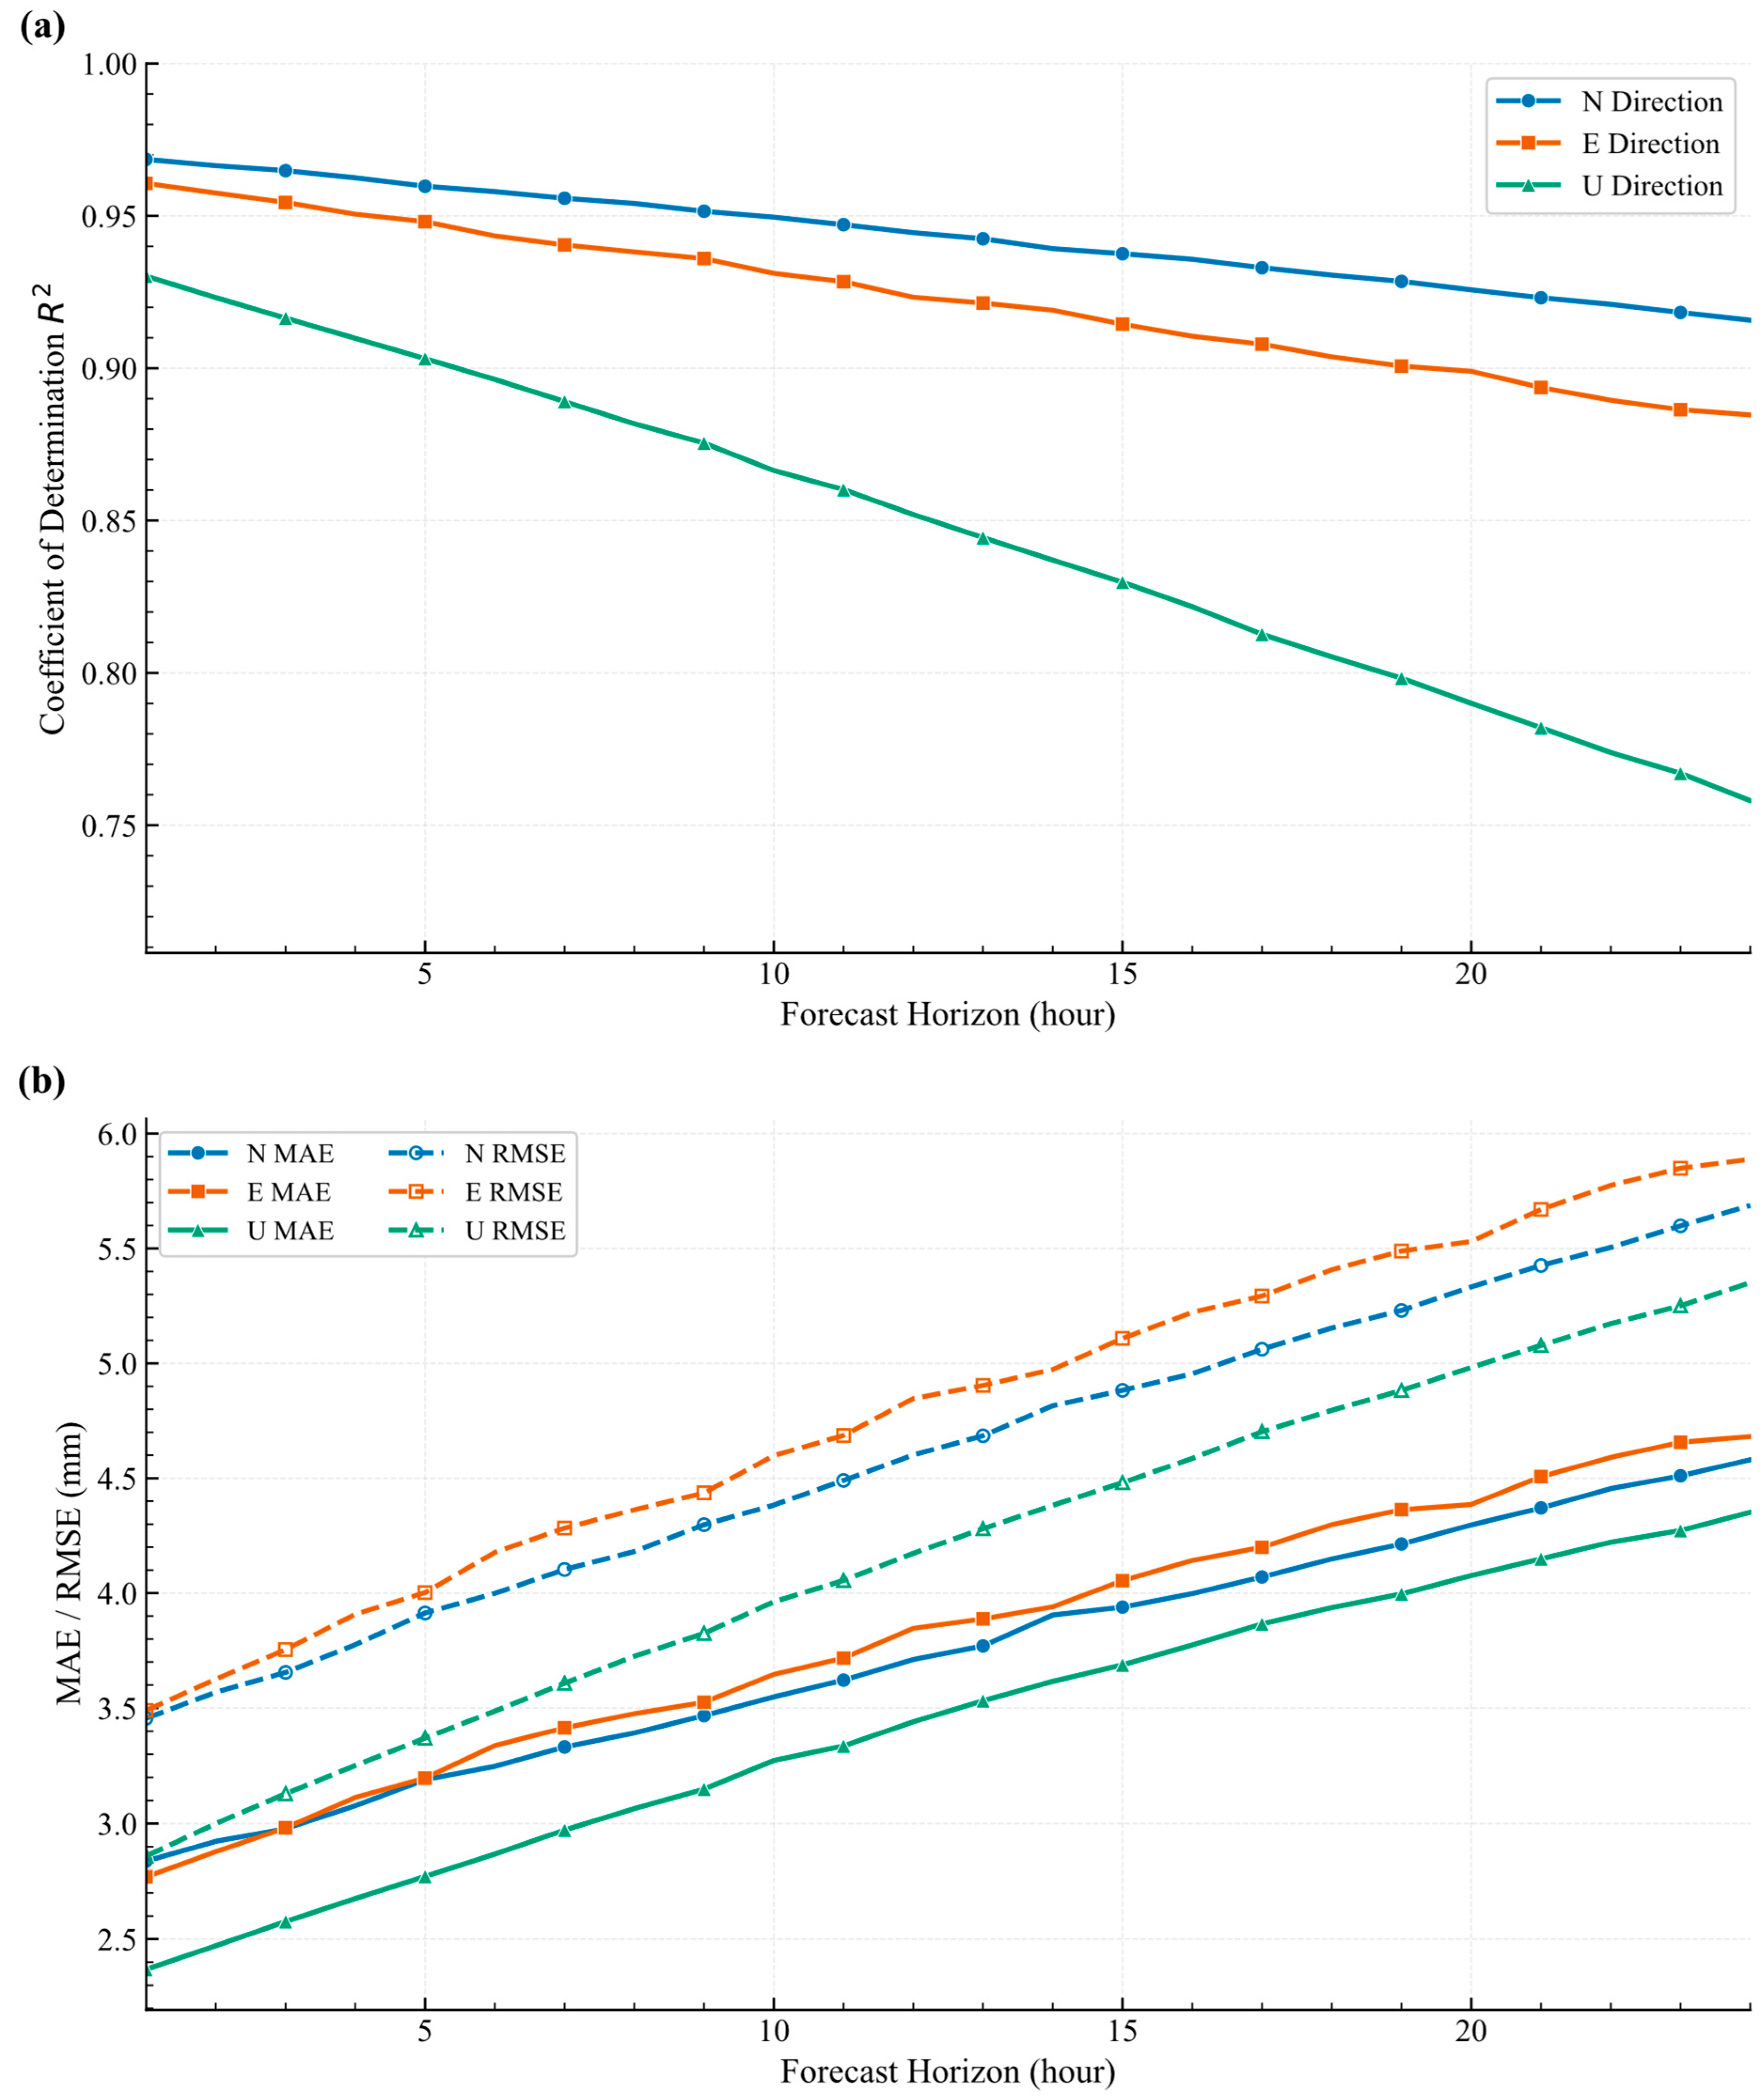
Lead-time analysis was used to examine how accuracy evolves from 1 to 24 h ahead (Figure 8). MAE and RMSE increase gradually with lead time while R2 decreases smoothly, showing that predictive skill is retained across the full one-day horizon rather than concentrated only at the first few steps. This smooth metric evolution across the complete 1–24 h horizon is consistent with the combined local and long-range temporal representation of VGCAT-Net.
Figure 8.
Prediction metrics as a function of lead time from 1 to 24 h: (a) R2; (b) MAE and RMSE.
3.4. Baseline Comparison
The baseline results reveal a clear progression in temporal modeling capability. RF produced an average R2 of 0.551, whereas recurrent architectures improved trajectory agreement by explicitly representing temporal state. LSTM reached 0.641 and GRU reached 0.724, while the Transformer increased the average R2 to 0.805 through long-range self-attention.
GRU provided lower average MAE and RMSE than LSTM, supporting its use as the local temporal encoder in the complete framework. The Transformer further reduced average MAE to 5.378 mm and RMSE to 6.736 mm, indicating that longer-range dependencies contribute directly to stable multistep prediction.
VGCAT-Net achieved the strongest overall performance because the sequence model receives both frequency-layered displacement features and dynamically weighted meteorological information before long-range encoding. Relative to the standalone Transformer, average MAE decreased from 5.378 to 4.538 mm and RMSE from 6.736 to 5.642 mm, while average R2 increased from 0.805 to 0.853.
The direction-resolved results follow the same pattern, indicating that the improvement is distributed across the three displacement components rather than being dominated by a single axis.
3.5. Ablation Analysis
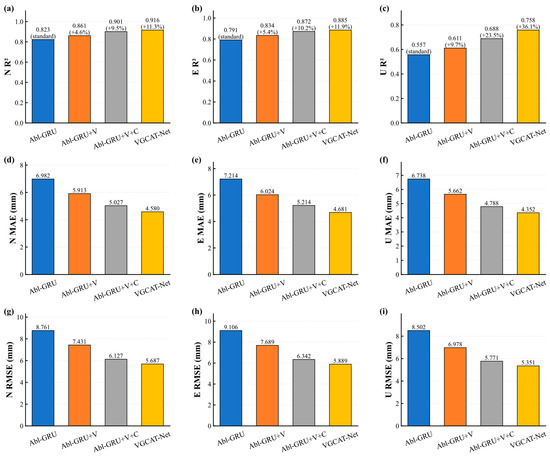
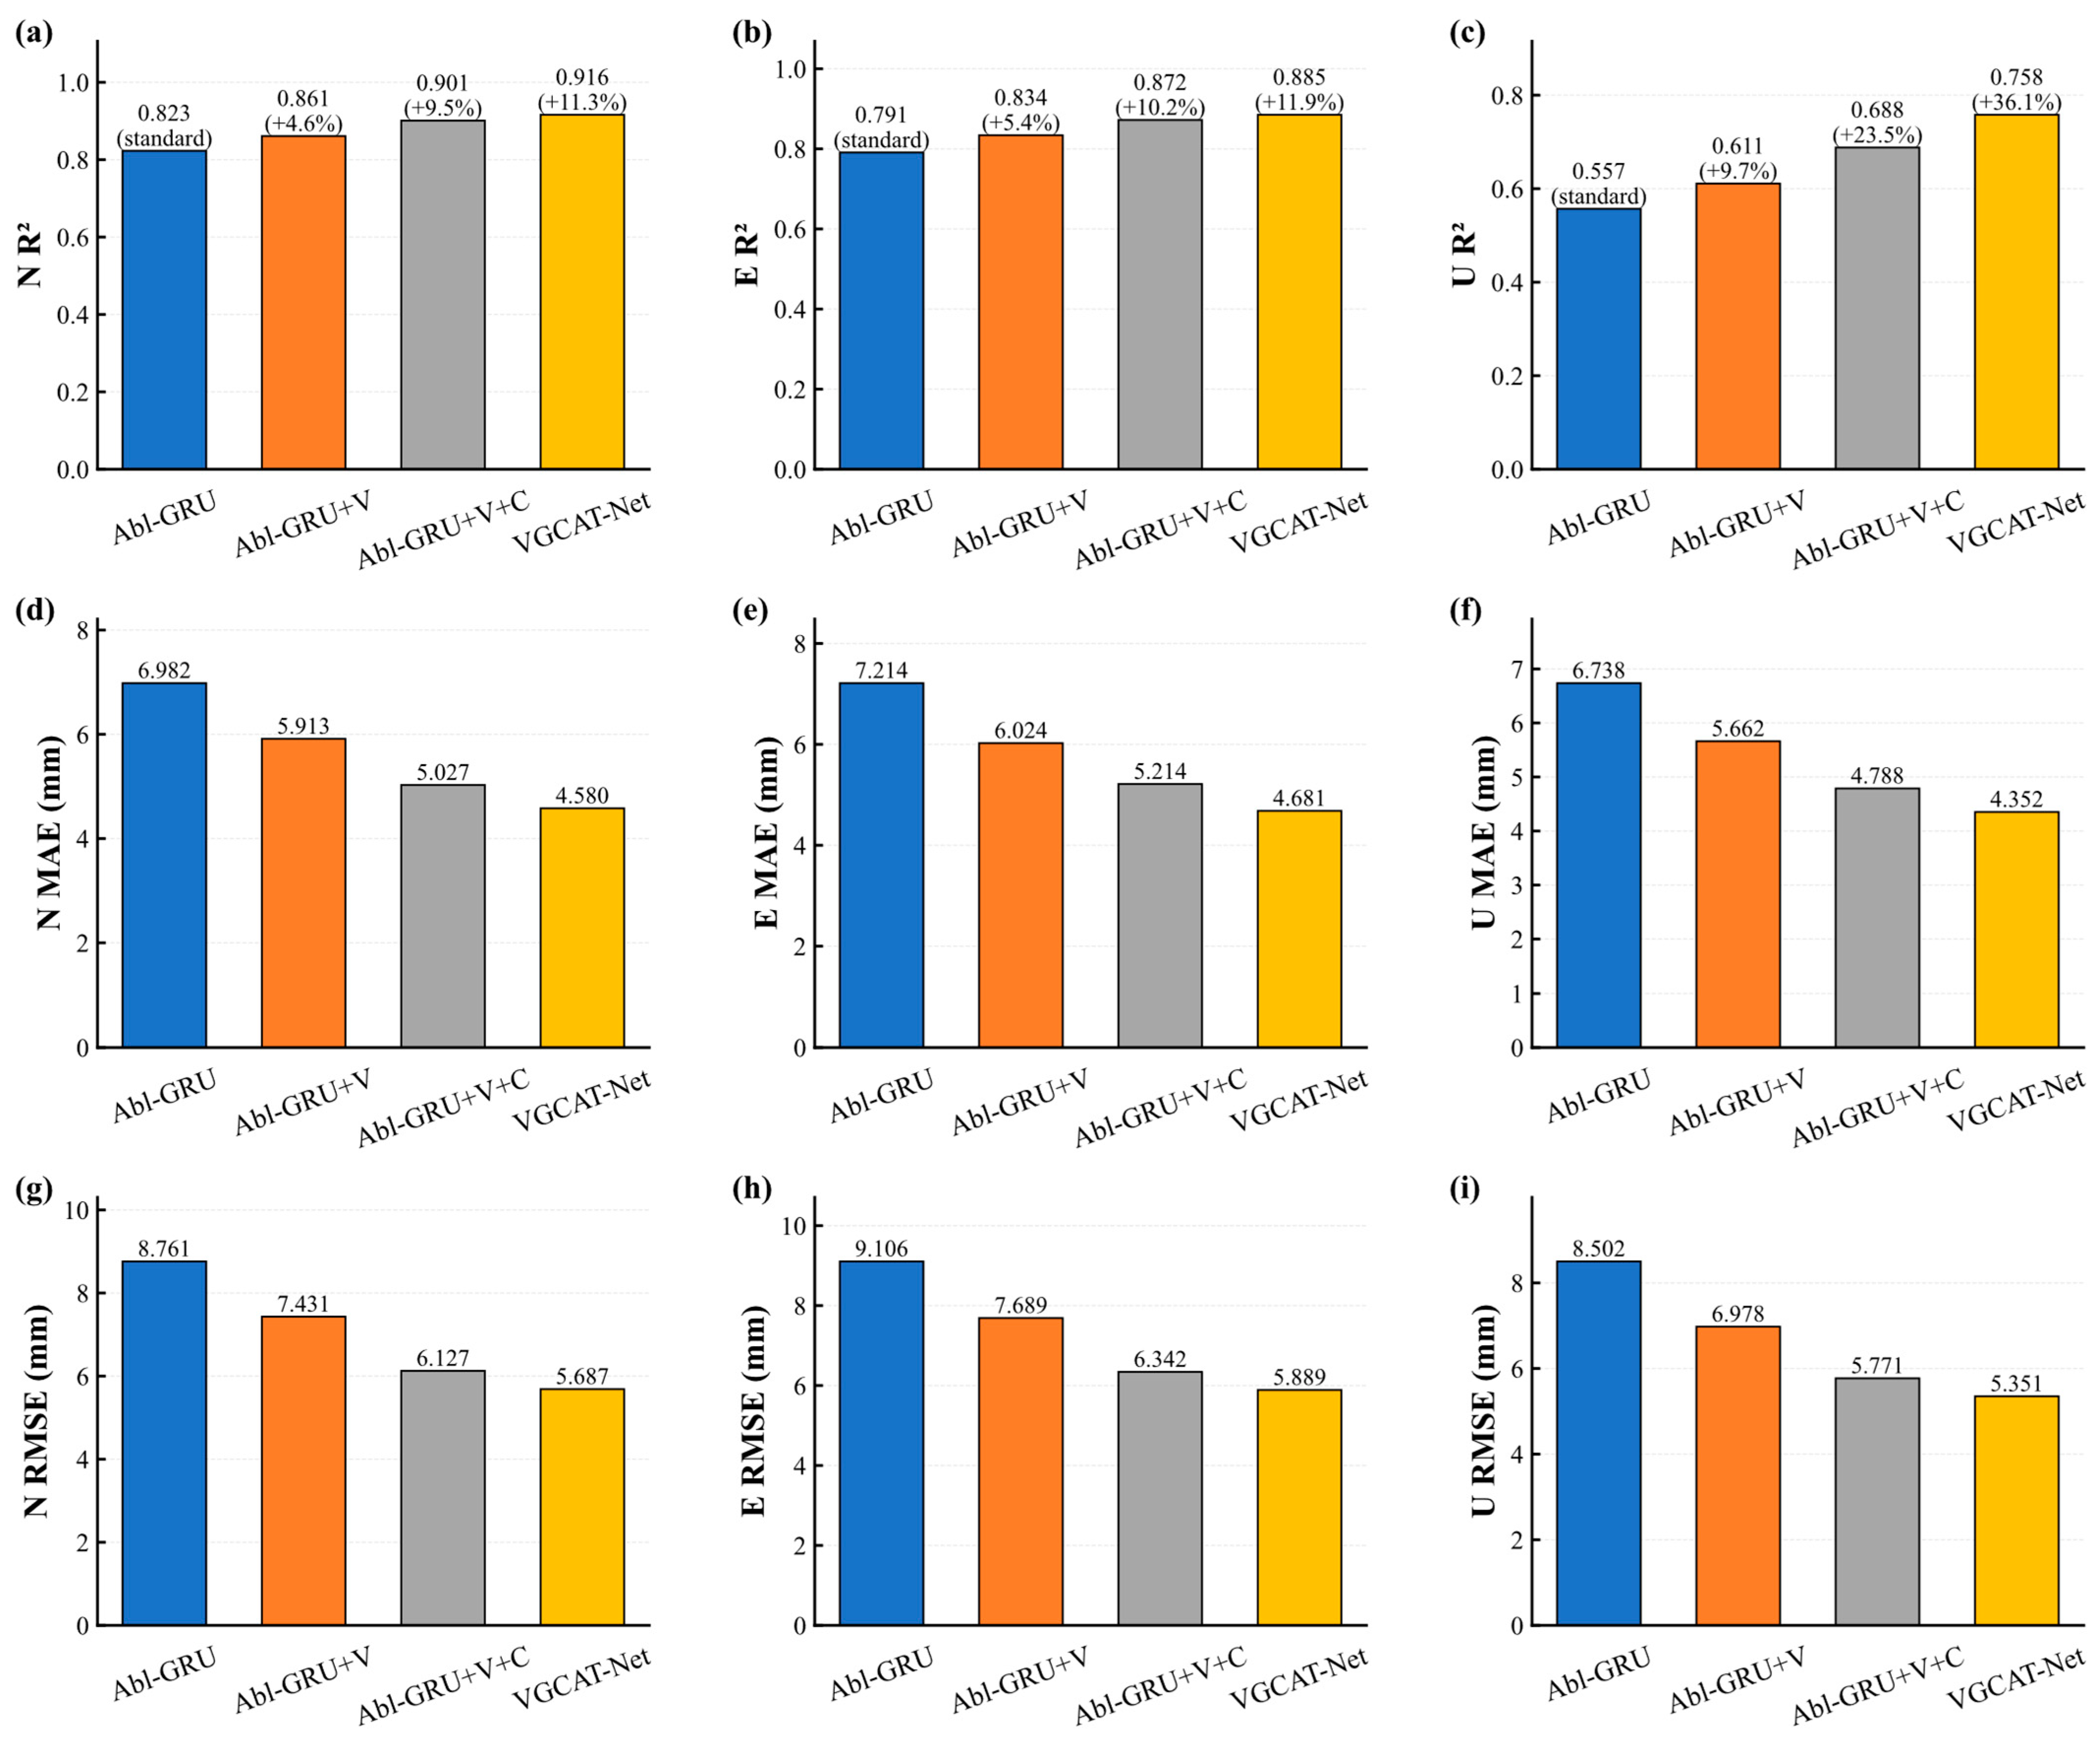
The progressive ablation sequence traces the contribution of each functional stage under identical data partitions and training settings. The GRU-only configuration establishes the local temporal baseline; adding window-wise VMD introduces explicit multiscale structure; meteorological cross-attention then adds state-conditioned environmental interaction; and the Transformer supplies long-range temporal integration.
Performance improves successively across the ablation sequence (Figure 9), confirming that the three added mechanisms provide complementary information. Window-wise VMD strengthens frequency-layered representation, cross-attention improves environmentally driven response encoding, and Transformer self-attention stabilizes the longer-horizon sequence representation.
Figure 9.
Progressive ablation performance for N, E, and U displacement: (a–c) R2; (d–f) MAE; (g–i) RMSE.
Three-dimensional slope displacement combines gradual evolution with shorter periodic and disturbance-driven components. Window-wise VMD exposes these frequency layers before recurrent temporal encoding, allowing the GRU to operate on a representation in which long-term structure and local variability are more explicitly separated. The stepwise gains in the ablation analysis support the value of this frequency-layered representation for 24 h prediction.
The prediction protocol also treats temporal causality as part of feature design. Every VMD is confined to the observations available in the current 168 h historical window, while reference-site feature screening and scaling use only the training period. This construction aligns offline evaluation with online use and makes the resulting performance estimates directly interpretable under real forecast-origin conditions. At an hourly update cadence, the same window-wise operation remains compatible with operational monitoring; incremental decomposition and learnable filtering provide natural routes to further reduce update latency.
3.6. Cross-Site Validation
The trained model was then evaluated at FS-02, FS-03, and FS-04 using the cross-site protocol defined in Section 2.3.4. Pre-evaluation baseline and scaling calibration used only historical observations preceding each external evaluation interval, and the VGCAT-Net weights learned at FS-01 remained unchanged.
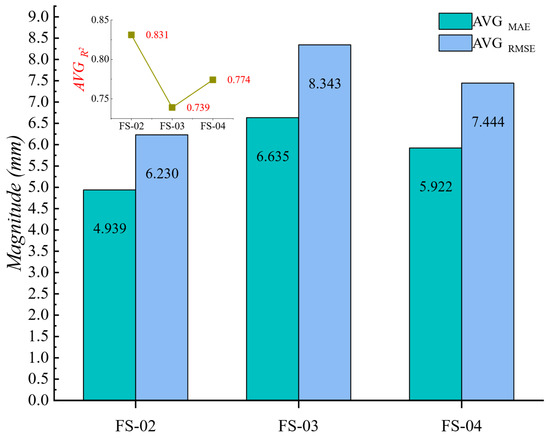
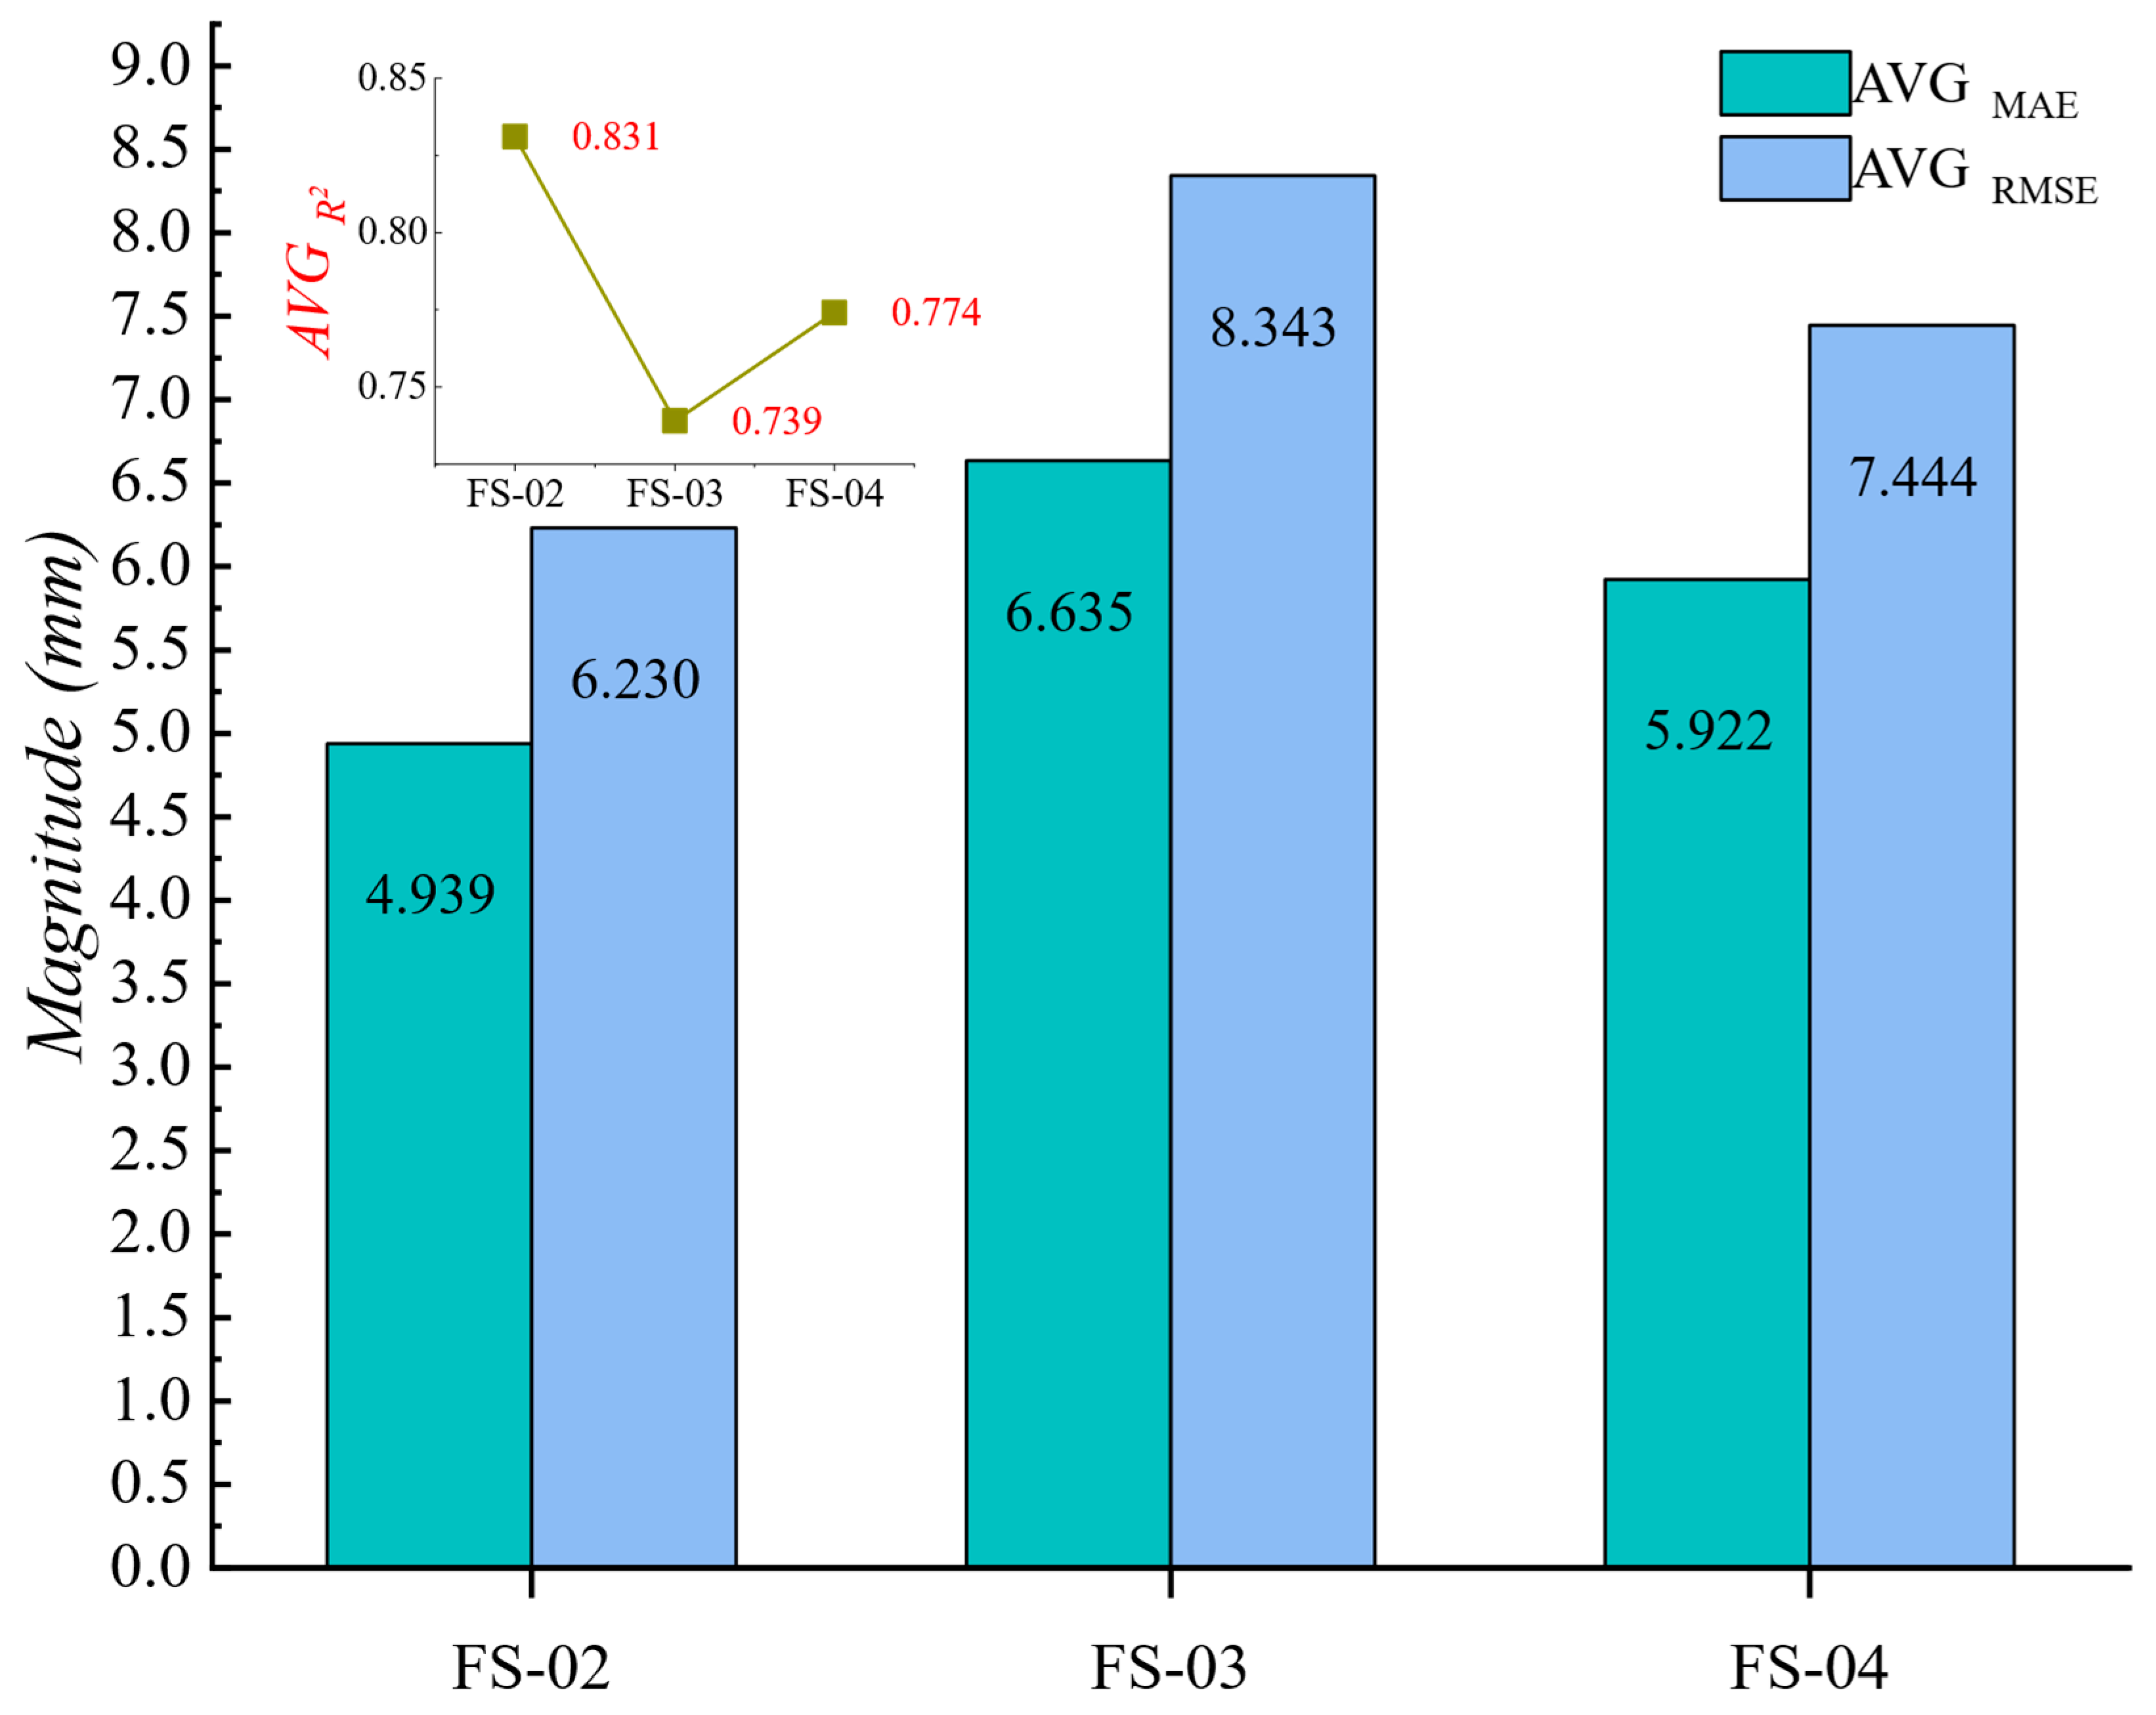
Table 6 and Figure 10 summarize the external results. Mean R2 values were 0.831 at FS-02, 0.739 at FS-03, and 0.774 at FS-04, with corresponding average MAE values of 4.939, 6.635, and 5.922 mm. The model therefore retained substantial trajectory agreement across spatially distinct monitoring points. FS-03 shows the largest vertical absolute error (MAE 8.145 mm; RMSE 10.128 mm), while its N and E components remain above R2 = 0.81, illustrating the value of direction-resolved transfer assessment.
Table 6.
Cross-site VGCAT-Net prediction performance at FS-02, FS-03, and FS-04.
Figure 10.
Mean VGCAT-Net prediction performance across the three external monitoring sites.
Taken together, reference-site testing, baseline comparison, ablation analysis, lead-time evaluation, and cross-site validation show that the framework maintains millimeter-scale absolute error while preserving three-dimensional trajectory structure over a 24 h horizon.
The selected meteorological variables span soil moisture, atmospheric pressure, and air and soil temperature, indicating that the deformation signal contains information associated with both hydrological and thermal–atmospheric forcing. Cross-attention makes this information conditional on the displacement state and historical time step, which is particularly appropriate when the strength and timing of environmental responses vary among N, E, and U components.
This conditional interaction also supports spatial transfer. A given meteorological change can correspond to different deformation responses under different local topographic, geological, surface-cover, and installation conditions, yet the attention layer can reweight the synchronized environmental sequence rather than assuming a fixed contribution. The same architecture can naturally incorporate additional engineering variables such as groundwater level, pore-water pressure, rainfall-infiltration indicators, mining intensity, and structural descriptors when these streams are available.
3.7. Field-Oriented Application and Early-Warning Relevance
The field-oriented evaluation uses continuous displacement records acquired by monitoring stations embedded in the mine’s operational observation network. At each forecast origin, the latest 168 h of synchronized three-dimensional displacement and meteorological measurements are converted into the same feature structure used during model development, and VGCAT-Net returns 24 hourly N, E, and U displacement trajectories. This workflow translates the monitoring stream into a forward deformation estimate that can be refreshed as new observations become available, providing a predictive layer that is compatible with the mine’s existing monitoring and warning architecture.
The documented warning records provide an independent engineering reference for the selected lead time. At E2350, an anomalous zone identified at 08:00 reached a deformation velocity of 10 mm h−1 by 11:00; at E1540, the monitored velocity reached 6 mm h−1 during the warning stage. The E2750 event developed from approximately 10 h of accelerated deformation, whereas the E3098 event exhibited an acceleration interval of approximately 23 h before the documented local slope event. These observations show that a 24 h three-dimensional displacement trajectory spans the principal acceleration timescale documented in representative field events. The historical alerts were generated by the existing mine-monitoring system and are used here as operational reference cases rather than model-training labels, preserving a clear distinction between field warning records and the predictive output evaluated in this study.
The 168 h to 24 h input-output structure is directly compatible with continuous hourly monitoring. Displacement-increment prediction reduces sensitivity to station-specific coordinate baselines, while reconstruction returns absolute three-dimensional trajectories that can be interpreted together with displacement rate, rainfall, and other warning indicators. Because every feature is generated from information available before the forecast origin, the same sequence construction can be repeated as new observations arrive without changing the causal structure used during evaluation.
The field warning records strengthen the engineering interpretation of the prediction horizon: documented acceleration stages extend from several hours to nearly one day, which is covered by the 24 h output sequence. The framework can therefore be configured as a predictive layer upstream of existing threshold-based warning logic, so that forward three-dimensional displacement trajectories complement real-time observations and velocity-based indicators. Additional monitored variables, such as groundwater response, deep deformation, or mining-operation descriptors, can be incorporated through the same state-conditioned fusion structure as they become available in operational data streams.
Overall, the reference-site comparison, lead-time analysis, progressive ablation, and cross-site evaluation consistently indicate that combining multiscale displacement representation, state-conditioned meteorological interaction, and long-range temporal modeling improves the robustness of 24 h three-dimensional displacement prediction. The resulting framework is therefore intended as a predictive complement to continuous monitoring rather than as a replacement for existing field-based warning criteria.
The relationship between soil moisture and the limiting condition for stable slope equilibrium also deserves further investigation. In the present study, near-surface volumetric soil moisture is treated as an environmental predictor rather than as a deterministic stability threshold. From a geotechnical perspective, a critical or limiting moisture condition is expected to depend on the combined effects of material properties, matric suction, hydraulic conductivity, groundwater conditions, geological structure, and the prevailing stress state. Future studies may therefore integrate soil-moisture observations with pore-water pressure, groundwater level, soil-water characteristic relationships, and relevant strength parameters to examine whether characteristic moisture ranges can be associated with the transition from relatively stable deformation to accelerated movement. The proposed multiscale forecasting framework provides a potential data-driven basis for investigating such hydro-mechanical relationships.
4. Conclusions
This study proposed a causality-preserving multiscale forecasting framework for short-term three-dimensional mine displacement prediction by integrating frequency decomposition, meteorological feature interaction, and long-range temporal dependency learning. The framework was designed to overcome two major limitations of conventional data-driven deformation prediction approaches: insufficient representation of non-stationary deformation characteristics and inadequate modeling of complex interactions between environmental factors and displacement responses. By restricting VMD within each 168 h historical window and performing feature screening and reference-site scaling only using information available before prediction, the proposed framework strictly preserves temporal causality and prevents information leakage in operational forecasting scenarios.
The proposed framework achieved accurate and stable 24 h ahead displacement forecasting at the FS-01 monitoring site, with an average MAE of 4.538 mm, RMSE of 5.642 mm, and R2 of 0.853. The directional prediction errors remained within 4.352–4.681 mm, while the lead-time evaluation demonstrated consistent predictive performance throughout the entire 1–24 h forecasting horizon. Ablation experiments and comparative analyses further verified that the improvement was attributed to the synergistic effects of frequency-layered VMD representations, meteorological cross-attention, and Transformer-based temporal encoding, which jointly enhanced the extraction of deformation patterns from multi-source monitoring information.
The primary scientific contribution of this study lies in establishing a causality-aware hybrid learning strategy that integrates multiscale deformation characterization with dynamic environmental information fusion. Unlike approaches relying solely on historical displacement sequences, the proposed framework enables the model to simultaneously capture intrinsic deformation evolution and external meteorological influences, thereby providing a more comprehensive representation of complex mine deformation processes. Furthermore, cross-site validation at FS-02, FS-03, and FS-04 achieved mean R2 values ranging from 0.739 to 0.831, demonstrating the spatial generalization capability of the learned deformation representations across different monitoring locations.
From an engineering perspective, the proposed framework provides a feasible approach for transforming continuous GNSS observations into forward-looking deformation assessment information. The adopted 24 h forecasting horizon is consistent with the temporal characteristics reported in representative mine deformation warning cases, where acceleration processes commonly develop over several hours to approximately one day. Future work should further integrate additional geological, hydrological, and remote sensing observations, establish adaptive warning thresholds based on predicted deformation trajectories, and evaluate the framework under a wider range of mining conditions and deformation mechanisms.
Author Contributions
Conceptualization, Z.W. and H.M.; methodology, Z.W. and H.M.; software, Z.W.; validation, Z.W., H.S. and J.M.; formal analysis, Z.W.; investigation, S.H., H.S. and C.Y.; resources, H.M., S.H. and C.Y.; data curation, S.H., H.S. and C.Y.; writing—original draft preparation, Z.W.; writing—review and editing, H.M., C.Y. and J.M.; visualization, Z.W.; supervision, H.M.; project administration, H.M. and C.Y.; funding acquisition, H.M. All authors have read and agreed to the published version of the manuscript.
Funding
This research was funded by the National Key Research and Development Program of China, grant number 2023YFF1306001, and the Science and Technology Innovation and Entrepreneurship Special Fund Project of China Coal Technology and Engineering Group Co., Ltd., grant number 2025-QZ006.
Institutional Review Board Statement
Not applicable.
Informed Consent Statement
Not applicable.
Data Availability Statement
The slope-monitoring dataset used in this study is publicly available from the National Basic Science Data Center under the scientific resource identifier CSTR:16666.11.nbsdc.fJ5ZJedX. The accompanying monitoring-platform records support the engineering context described in this article. Processing and modeling details required to reproduce the reported experiments are provided in the manuscript; additional implementation materials are available from the corresponding author upon reasonable request.
Conflicts of Interest
The authors declare no conflicts of interest.
Abbreviations
The following abbreviations are used in this manuscript: VGCAT-Net, Variational Mode Decomposition-Gated Recurrent Unit-Cross-Attention-Transformer Network; GNSS, Global Navigation Satellite System; VMD, Variational Mode Decomposition; GRU, Gated Recurrent Unit; LSTM, Long Short-Term Memory; RF, Random Forest; InSAR, Interferometric Synthetic Aperture Radar; LiDAR, Light Detection and Ranging; MAE, Mean Absolute Error; RMSE, Root Mean Square Error; R2, Coefficient of Determination; IQR, Interquartile Range; SD, Standard Deviation; N, Northward displacement component; E, Eastward displacement component; and U, Upward displacement component.
References
- Sun, S.; Liu, L.; Hu, J.; Ding, H. Failure Characteristics and Mechanism of a Rain-Triggered Landslide in the Northern Longwall of Fushun West Open Pit, China. Landslides 2022, 19, 2439–2458. [Google Scholar] [CrossRef] [Scilit]
- Ma, S.; Qiu, H.; Zhu, Y.; Yang, D.; Tang, B.; Wang, D.; Wang, L.; Cao, M. Topographic changes, surface deformation and movement process before, during and after a rotational landslide. Remote Sens. 2023, 15, 662. [Google Scholar] [CrossRef] [Scilit]
- Zhang, J.; Tang, H.; Li, C.; Gong, W.; Zhou, B.; Zhang, Y. Deformation stage division and early warning of landslides based on the statistical characteristics of landslide kinematic features. Landslides 2024, 21, 717–735. [Google Scholar] [CrossRef] [Scilit]
- Shu, B.; He, Y.; Wang, L.; Zhang, Q.; Li, X.; Qu, X.; Huang, G.; Qu, W. Real-time high-precision landslide displacement monitoring based on a GNSS CORS network. Measurement 2023, 217, 113056. [Google Scholar] [CrossRef] [Scilit]
- Bai, D.; Lu, G.; Zhu, Z.; Zhu, X.; Tao, C.; Fang, J.; Li, Y. Prediction interval estimation of landslide displacement using bootstrap, variational mode decomposition, and long and short-term time-series network. Remote Sens. 2022, 14, 5808. [Google Scholar] [CrossRef] [Scilit]
- Bai, D.; Lu, G.; Zhu, Z.; Tang, J.; Fang, J.; Wen, A. Using time series analysis and dual-stage attention-based recurrent neural network to predict landslide displacement. Environ. Earth Sci. 2022, 81, 509. [Google Scholar] [CrossRef] [Scilit]
- Zhao, X.; Wan, X.; Chen, J.; Liu, C.; Chen, C. Multi-Modal Data-Driven Bayesian-Optimized CNN-LSTM Model for Slope Displacement Prediction. Sensors 2026, 26, 1452. [Google Scholar] [CrossRef] [Scilit] [PubMed]
- Xie, Y.; Meng, X.; Wang, J.; Li, H.; Lu, X.; Ding, J.; Jia, Y.; Yang, Y. Enhancing GNSS deformation monitoring forecasting with a combined VMD-CNN-LSTM deep learning model. Remote Sens. 2024, 16, 1767. [Google Scholar] [CrossRef] [Scilit]
- Ma, Z.; Mei, G.; Xu, N. Characterizing seasonality and trend from in situ time-series observations using explainable deep learning for ground deformation forecasting. J. Geophys. Res. Mach. Learn. Comput. 2024, 1, e2024JH000122. [Google Scholar] [CrossRef] [Scilit]
- Huang, N.E.; Shen, Z.; Long, S.R.; Wu, M.C.; Shih, H.H.; Zheng, Q.; Yen, N.-C.; Tung, C.C.; Liu, H.H. The Empirical Mode Decomposition and the Hilbert Spectrum for Nonlinear and Non-Stationary Time Series Analysis. Proc. R. Soc. Lond. A 1998, 454, 903–995. [Google Scholar] [CrossRef] [Scilit]
- Liu, H.; Chen, W.; Li, Y.; Xu, Z.; Li, X. Application of integrated model based on EEMD-CNN-LSTM for landslide-displacement prediction. J. Geomech. 2024, 30, 633–646. [Google Scholar] [CrossRef]
- Dragomiretskiy, K.; Zosso, D. Variational Mode Decomposition. IEEE Trans. Signal Process. 2014, 62, 531–544. [Google Scholar] [CrossRef] [Scilit]
- Rong, M.; Feng, C.; Wang, H.; Luo, L.; Yuan, Y.; Geng, D.; Li, J. Dynamic prediction of slope displacement using VMD decomposition with collaborative LSSVM-LSTM optimization. Sci. Rep. 2025, 15, 35176. [Google Scholar] [CrossRef] [Scilit] [PubMed]
- Zhang, M.; Cai, S.; Jin, L.; Shen, S.; Xu, Y. Displacement prediction model for rainfall-induced landslides based on PDL-VMD-SVR: A case study of the southern slope landslide at Fushun West Open-pit Mine, China. Eng. Geol. 2026, 371, 108855. [Google Scholar] [CrossRef] [Scilit]
- Gao, Y.; Chen, X.; Tu, R.; Chen, G.; Luo, T.; Xue, D. Prediction of landslide displacement based on the combined VMD-stacked LSTM-TAR model. Remote Sens. 2022, 14, 1164. [Google Scholar] [CrossRef] [Scilit]
- Wang, C.; Guo, W. Prediction of landslide displacement based on the variational mode decomposition and GWO-SVR model. Sustainability 2023, 15, 5470. [Google Scholar] [CrossRef] [Scilit]
- Wang, H.; Ao, Y.; Wang, C.; Zhang, Y.; Zhang, X. A dynamic prediction model of landslide displacement based on VMD–SSO–LSTM approach. Sci. Rep. 2024, 14, 9203. [Google Scholar] [CrossRef] [Scilit] [PubMed]
- Wang, Y.; Li, Y.; Gu, T.; Wang, J. Landslide displacement prediction model based on variational mode decomposition and MCNN-SE-GRU. Acta Geotech. 2025, 20, 3677–3701. [Google Scholar] [CrossRef] [Scilit]
- Rong, Z.; Cong, S.; Tang, L.; Chen, P.; Wang, Y.; Ma, M.; Arbanas, Ž. Prediction of enhanced creep landslide displacement by analyzing multi-time-scale displacement impact factors using convolutional neural network (CNN). Landslides 2026, 23, 595–615. [Google Scholar] [CrossRef] [Scilit]
- Li, X.; Li, Q.; Wang, Y.; Liu, W.; Hou, D.; Zhu, C. Effect of slope angle on fractured rock masses under combined influence of variable rainfall infiltration and excavation unloading. J. Rock Mech. Geotech. Eng. 2024, 16, 4154–4176. [Google Scholar] [CrossRef] [Scilit]
- Zhang, Z.; Zeng, R.; Meng, X.; Zhao, S.; Wang, S.; Ma, J.; Wang, H. Effects of changes in soil properties caused by progressive infiltration of rainwater on rainfall-induced landslides. Catena 2023, 233, 107475. [Google Scholar] [CrossRef] [Scilit]
- Liu, X.; Dong, J.; Tang, C.; Pan, Y.; Zhao, J.; Wei, Z. Instability mechanism of loess-mudstone landslides under rainfall infiltration conditions. Sci. Rep. 2025, 15, 17591. [Google Scholar] [CrossRef] [Scilit] [PubMed]
- Yuan, T.; Yang, Y.; Nie, B.; Qi, Z.; Liu, D. Analysis of the influence mechanism of rainfall infiltration on slope stability based on InSAR and numerical simulation. Saf. Coal Mines 2026, 57, 147–158. (In Chinese) [Google Scholar] [CrossRef]
- Wang, Z.; Li, Y.; Wei, Y.; Huang, K.; Jiang, H.; Cheng, Y. The influence of base inclination on slope deformation of inner dump under rainfall infiltration. Saf. Coal Mines 2024, 55, 169–175. (In Chinese) [Google Scholar] [CrossRef]
- Wang, L.; Chen, Y.; Wang, S.; Guo, F. Response of landslide deformation to rainfall based on multi-index monitoring: A case of the Tanjiawan landslide in the Three Gorges Reservoir. Bull. Eng. Geol. Environ. 2022, 81, 231. [Google Scholar] [CrossRef] [Scilit]
- Wang, L.; Chen, Y.; Huang, X.; Zhang, L.; Li, X.; Wang, S. Displacement prediction method of rainfall-induced landslide considering multiple influencing factors. Nat. Hazards 2023, 115, 1051–1069. [Google Scholar] [CrossRef] [Scilit]
- Wang, Y.; Gao, L.; Li, J.; Peng, X. Responses of deep soil moisture to direct rainfall and groundwater in the red soil critical zone: A four-stage pattern. J. Hydrol. 2024, 632, 130864. [Google Scholar] [CrossRef] [Scilit]
- Guo, Y.; Golchin, A.; Hicks, M.A.; Liu, S.; Zhang, G.; Vardon, P.J. Experimental investigation of soil–structure interface behaviour under monotonic and cyclic thermal loading. Acta Geotech. 2023, 18, 3585–3608. [Google Scholar] [CrossRef] [Scilit]
- Li, C.; Huang, S.; Chen, Q.; van Dam, T.; Fok, H.S.; Zhao, Q.; Wu, W.; Wang, X. Quantitative evaluation of environmental loading induced displacement products for correcting GNSS time series in CMONOC. Remote Sens. 2020, 12, 594. [Google Scholar] [CrossRef] [Scilit]
- Jiang, Y.; Liao, L.; Luo, H.; Zhu, X.; Lu, Z. Multi-scale response analysis and displacement prediction of landslides using deep learning with JTFA: A case study in the Three Gorges Reservoir, China. Remote Sens. 2023, 15, 3995. [Google Scholar] [CrossRef] [Scilit]
- Zhou, J.; Ju, N.; He, C.; Xie, M. A Physics-Informed Online Learning Framework for Landslide Displacement Prediction. Appl. Sci. 2026, 16, 6003. [Google Scholar] [CrossRef] [Scilit]
- Ji, Y.; Cao, X.; Sun, X.; Yan, Q.; Lu, W.; Ren, S. Multi-Source Environmental Information Fusion and Adaptive Deep Learning for Karst Landslide Displacement Prediction. Appl. Sci. 2026, 16, 7353. [Google Scholar] [CrossRef] [Scilit]
- Zhang, L.; Wang, Z.; Zeng, X.; Xin, F.; Zhang, K.; Cao, J.; Zhou, Z. Landslide prediction in open-pit mines based on a CNN-KAN hybrid model with multi-source information fusion. Saf. Coal Mines 2025, 56, 61–70. (In Chinese) [Google Scholar] [CrossRef]
- Xie, Y.; Wang, J.; Li, H.; Dong, A.; Kang, Y.; Zhu, J.; Wang, Y.; Yang, Y. Deep learning CNN-GRU method for GNSS deformation monitoring prediction. Appl. Sci. 2024, 14, 4004. [Google Scholar] [CrossRef] [Scilit]
- Ge, Q.; Li, J.; Wang, X.; Deng, Y.; Zhang, K.; Sun, H. LiteTransNet: An interpretable approach for landslide displacement prediction using transformer model with attention mechanism. Eng. Geol. 2024, 331, 107446. [Google Scholar] [CrossRef] [Scilit]
- Huang, N.; Han, Y.; Xie, W.; Hu, R.; Peng, H.; Song, G.; Wu, M.; Zhu, M.; Wei, H.; Liang, M. An Innovative and Efficient Approach for Slope Reliability Analysis: Machine Learning Based Surrogate Modeling with Advanced Attention Mechanisms. Eng. Geol. 2025, 354, 108194. [Google Scholar] [CrossRef] [Scilit]
- Gao, Y.; Li, J.; Yang, T.; Deng, W.; Wang, D.; Cheng, H.; Ma, K. Stability analysis of a deep and large open pit based on fine geological modeling and large-scale parallel computing: A case study of Fushun West Open-pit Mine. Geomat. Nat. Hazards Risk 2023, 14, 2266663. [Google Scholar] [CrossRef] [Scilit]
- Gao, Y.; Li, J.; Yang, T.; Meng, L.; Deng, W.; Zhang, P. Formation of pit lake and slope stability following mine closure: A case study of Fushun West Open-pit Mine. Geomat. Nat. Hazards Risk 2024, 15, 2340612. [Google Scholar] [CrossRef] [Scilit]
- Wu, J.; Fei, L.; Dong, W.; Cao, C.; Zhang, B.; Han, X.; Chan, T.O.; Wang, Y.; Awange, J. GA-GBDT: A spatio-temporal graph-augmented gradient boosting framework for GNSS network-based landslide event warning in mining areas. Appl. Sci. 2026, 16, 5569. [Google Scholar] [CrossRef] [Scilit]
- Ji, B.; Park, J.; Lee, S.; Kim, Y. Kinematics-guided Transformer for early warning of slope failures using embedded IoT displacement sensors. Appl. Sci. 2026, 16, 1922. [Google Scholar] [CrossRef] [Scilit]

Disclaimer/Publisher’s Note: The statements, opinions and data contained in all publications are solely those of the individual author(s) and contributor(s) and not of MDPI and/or the editor(s). MDPI and/or the editor(s) disclaim responsibility for any injury to people or property resulting from any ideas, methods, instructions or products referred to in the content. |
© 2026 by the authors. Licensee MDPI, Basel, Switzerland. This article is an open access article distributed under the terms and conditions of the Creative Commons Attribution (CC BY) license.