


Abstract
Identifying favourable zones for geothermal exploration at the regional scale remains challenging, particularly in areas where conventional geophysical surveys are spatially limited or economically unfeasible. This study presents an integrated framework for delineating geothermal favourability across the Iberian Peninsula using global gravity and magnetic products combined with subsurface thermal information. EGM2008, WGM2012, EMAG2, and WDMAM2 were compared and harmonized through geostatistical modelling, anisotropic ordinary kriging, and common-grid processing. Potential-field transformations and spectral coherence analysis were used to derive a Geophysical Favourability Index (FI_geof). This index was integrated with temperature at 100 m depth using weighted fuzzy logic, applying FuzzyLinear and FuzzyLarge membership functions with a 60% FI_geof and 40% temperature weighting, to obtain the Geothermal Favourability Index (FI_geot). Quantitative comparison and cross-validation indicated that EGM2008 and EMAG2 were the most suitable primary reference products within their respective datasets, whereas WGM2012 and WDMAM2 provided complementary regional-scale information. The fuzzy integration identified the highest favourability mainly in Galicia and the Levante–Betic sector, where elevated FI_geot values coincide with heat-flow values of approximately 96–154 mW m−2 and comparatively high geothermal gradients. Around 20% of the study area was classified within the highest favourability category. The resulting FI_geot should be interpreted as a regional screening and prioritization tool rather than as direct evidence of an exploitable geothermal resource. Overall, the proposed methodology provides a reproducible approach for identifying priority areas for further geothermal investigation in large and incompletely characterized regions.
1. Introduction
Geothermal energy is a key renewable resource for the low-carbon energy transition due to its base-load capability, low greenhouse gas emissions, and long-term resource availability, making it suitable for decarbonizing heating, cooling, and electricity sectors. Unlike other renewables, it is not dependent on meteorological conditions, providing a stable and continuous energy supply [1]. It also offers high energy density and a reduced land-use footprint compared to other technologies, minimizing environmental impacts [2]. Beyond electricity generation, geothermal energy can be directly used in district heating, industrial processes, greenhouse heating, and aquaculture, highlighting its versatility. Furthermore, advances in Enhanced Geothermal Systems (EGS) and hybrid configurations are expanding its applicability to previously non-viable regions, strengthening its role as a reliable component of future energy systems [3].
Despite its advantages, in terms of installed capacity, geothermal energy remains a relatively small component of the global energy mix. By the end of 2024, installed geothermal power capacity reached ~16.9 GW across 32 countries, with 198 identified fields and an average capacity factor of 67.5% (2021–2022). For direct-use applications, global thermal capacity reached 107.4 GWth in 2020, with ~72% from geothermal heat pumps [4].
However, its deployment is still limited by the difficulty of accurately delineating subsurface resources, where detailed knowledge of highly variable geological conditions is required. Identifying favourable geothermal zones is therefore essential to reduce exploration risk and improve development strategies [5]. Traditionally, assessment has relied on geological, geochemical [6], and geophysical surveys [7,8], involving extensive fieldwork, drilling, and laboratory analyses. While reliable, these methods are costly, time-consuming, and typically restricted to well-known geothermal areas [9].
Given the limitations of traditional geophysical and geochemical methods (particularly their limited applicability over large or remote areas), the increasing availability and improved resolution of satellite-based geophysical data have created new opportunities for regional-scale geothermal exploration [10]. Satellite-derived datasets, including gravity, magnetic, and radiometric fields, have proven effective for characterizing subsurface conditions relevant to geothermal systems [11]. Gravity anomalies help identify density contrasts associated with intrusive bodies, sedimentary basins, and crustal discontinuities that influence regional heat flow patterns [12]. Magnetic data are useful for detecting hydrothermal alteration, demagnetized zones linked to elevated temperatures, and fault structures that facilitate fluid circulation [13]. In addition, radiometric and thermal observations provide complementary information on surface geochemical variations related to alteration processes and geothermal manifestations, integrating physical and chemical signals for a more comprehensive subsurface interpretation [14].
As representative examples, Pastorutti and Braitenberg (2019) [15] applied satellite gravity data to model crustal heat production and lithospheric temperature in Central Europe, demonstrating the potential of these datasets to constrain regional thermal structure and geothermal resources. Similarly, Larasati et al. (2023) [16] integrated gravity, magnetotelluric, and remote sensing data in the Kepahiang geothermal system (Indonesia) to identify low-resistivity zones and fault intersections associated with potential geothermal reservoirs. Zhao et al. (2023) [17] used 3D gravity inversion in the Central and Eastern Gonghe Basin (China) to detect low-density anomalies linked to partial-melt zones acting as possible deep heat sources. More recently, Soekarno et al. (2025) [18] employed GGMplus satellite gravity data and derivative filtering techniques to map faults and density contrasts at Mount Endut (Indonesia), highlighting the effectiveness of satellite gravity in delineating structural controls on geothermal fluid flow.
Previous studies clearly highlight the strong potential of satellite-based methods for geothermal exploration, as they provide valuable insights into subsurface structures, density contrasts, heat sources, and fluid pathways, enabling a more comprehensive characterization of geothermal systems at both regional and local scales. However, important challenges remain, particularly in the integration and processing of multi-source datasets with differing resolutions, acquisition times, and measurement techniques, which complicates their joint interpretation. In addition, the application of these approaches in poorly characterized regions lacking detailed geological and geophysical information is still limited.
Based on the state-of-the-art review presented above, this study proposes an integrated assessment of satellite-derived datasets to identify favourable geothermal zones in the Iberian Peninsula, a region with significant gaps in geothermal exploration. The novelty of this work lies in the comparative evaluation and spatial integration of multi-source gravity and magnetic products with subsurface thermal information within a common regional framework. The proposed workflow combines geostatistical harmonization, potential-field transformations, spectral coherence analysis, and weighted fuzzy logic to identify areas where structural and thermal indicators spatially coincide. Rather than replacing conventional exploration methods, this approach provides a regional screening tool for prioritizing areas where more detailed geological, hydrogeological, geochemical, and geophysical investigations may be warranted. The framework is particularly applicable to large or incompletely characterized regions where ground-based observations are unevenly distributed. The paper is organized as follows: Section 2 describes the study area, data sources, and methodology; Section 3 presents the results; Section 4 discusses the findings in a regional geophysical and geothermal context; and Section 5 summarizes the main conclusions and implications.
2. Materials and Methods
2.1. Geographical and Geological Setting of the Study Area
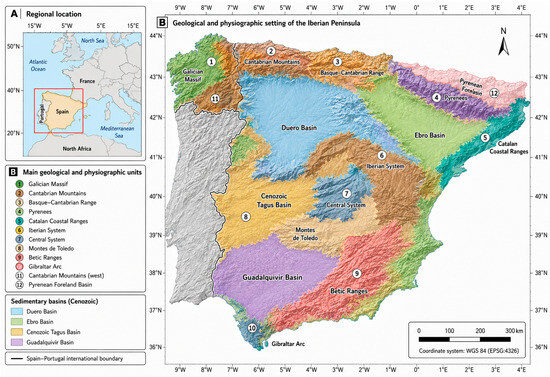
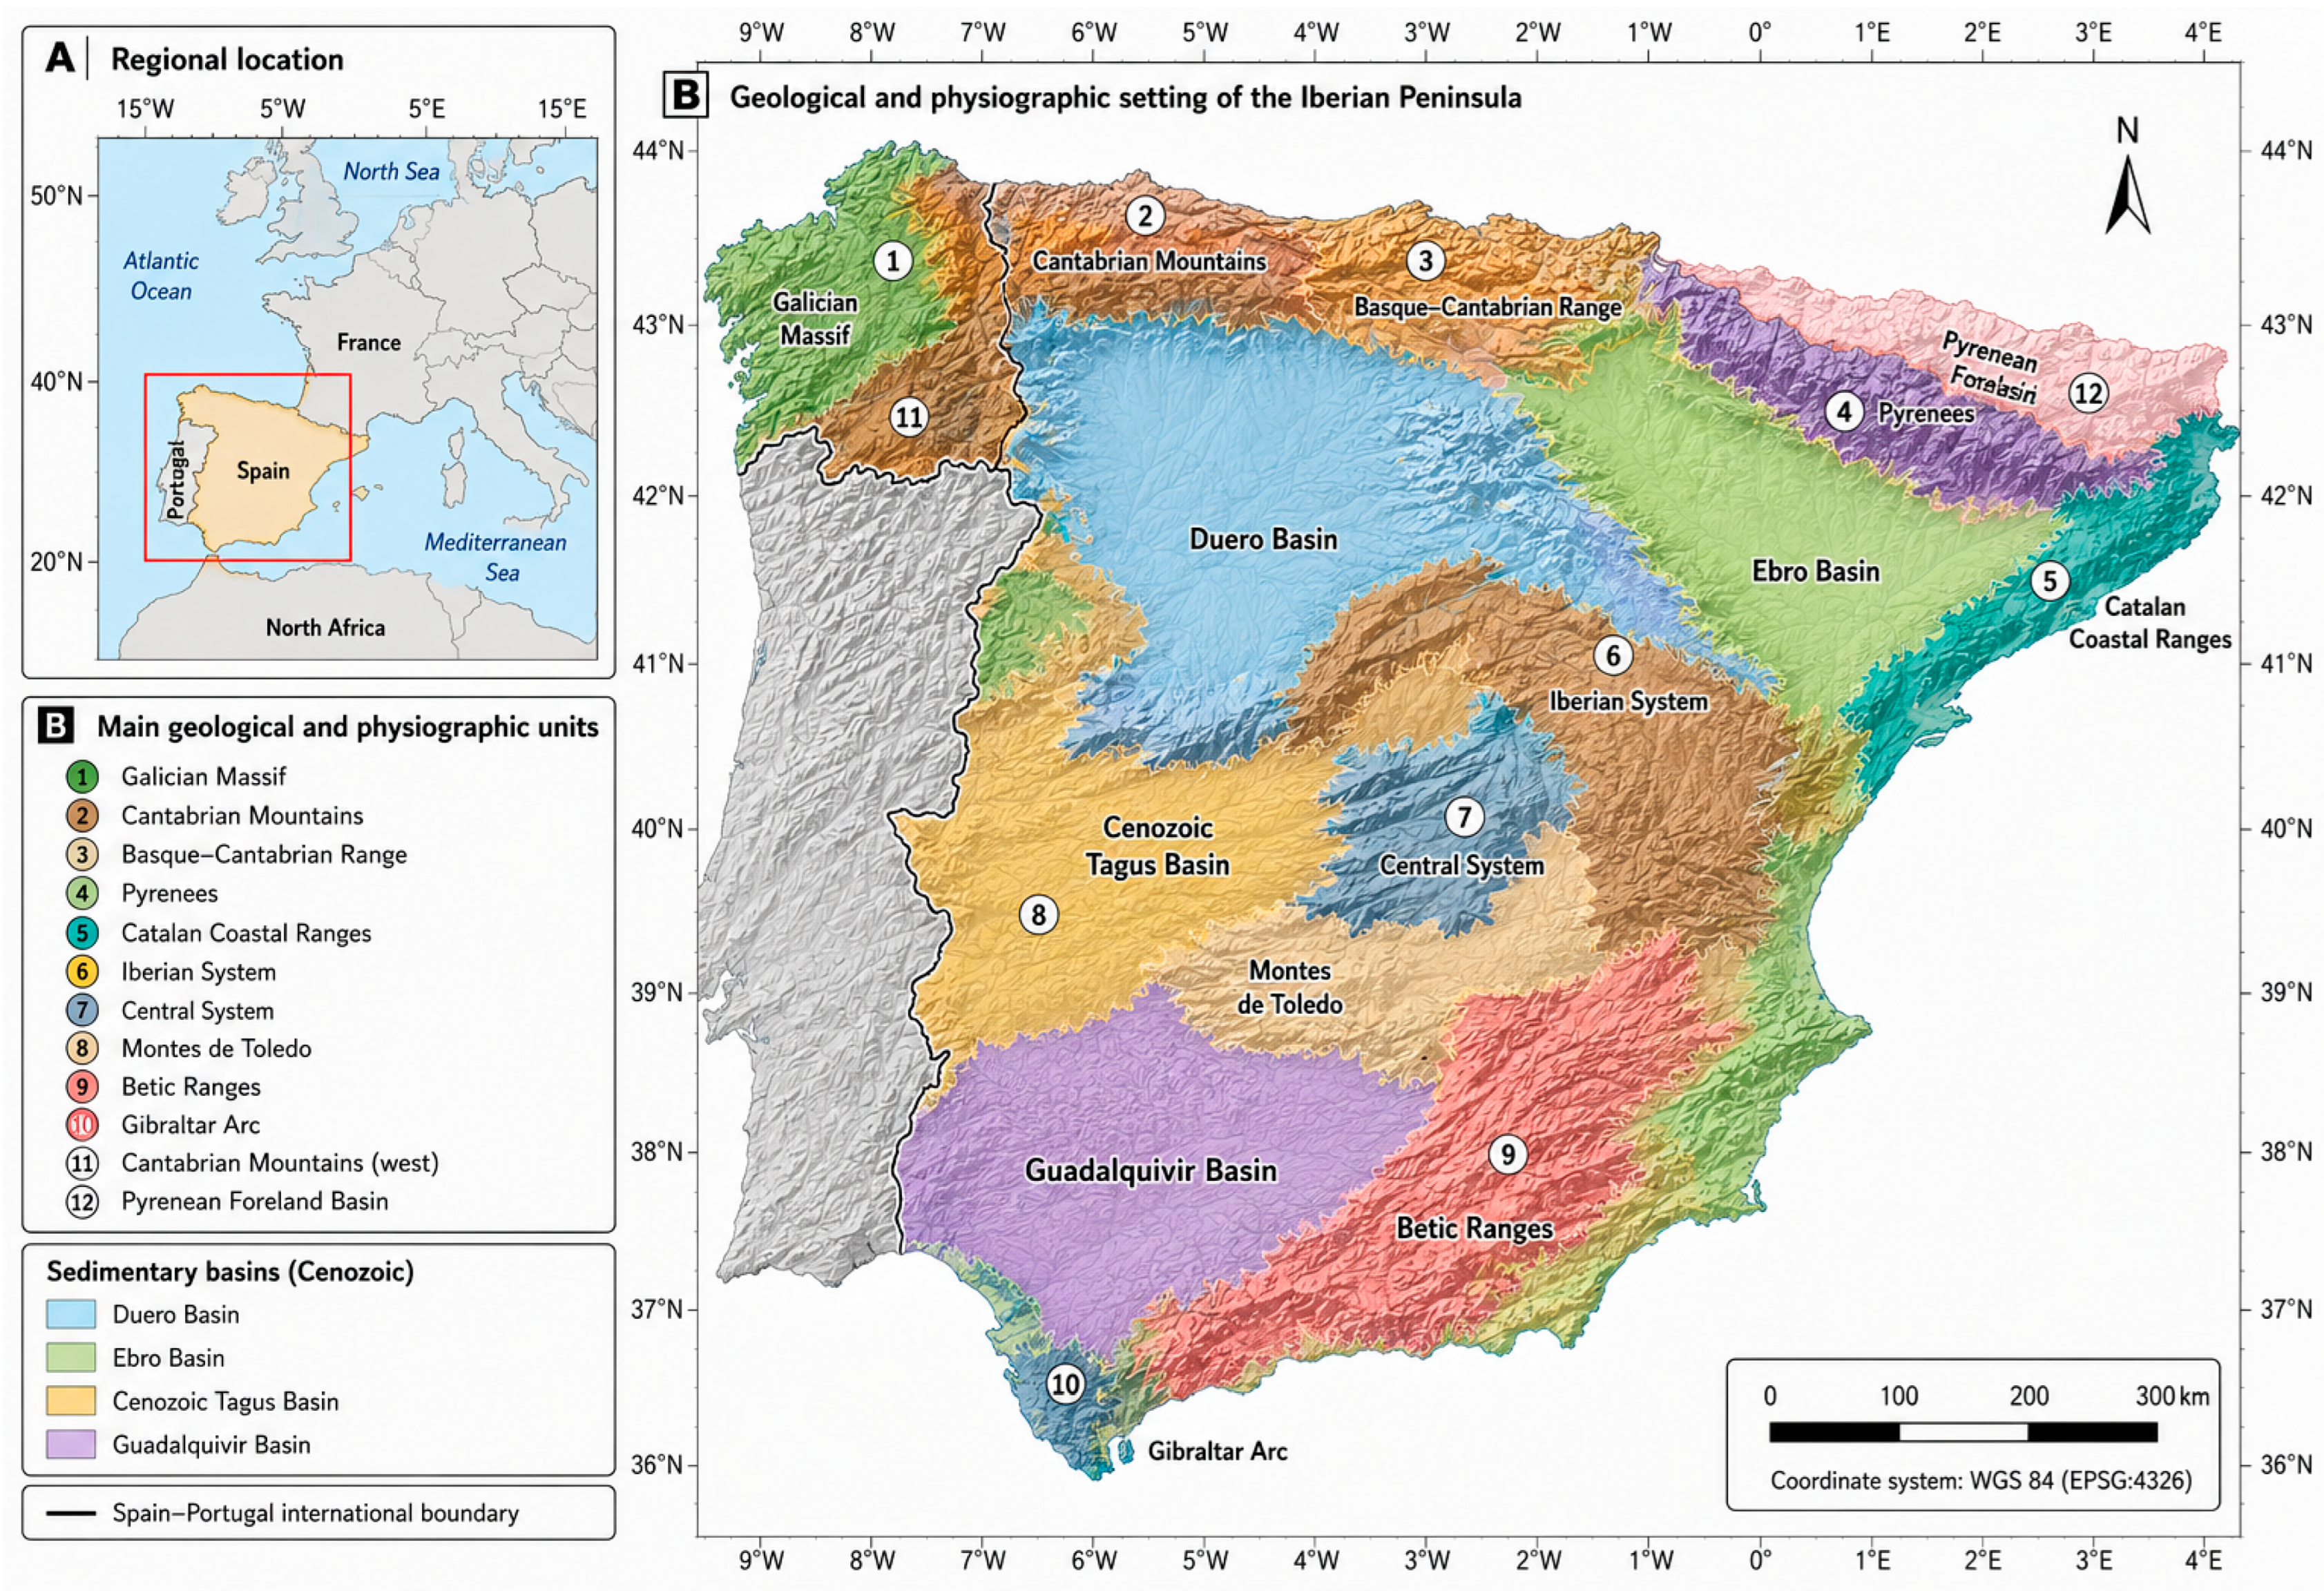
The study area encompasses the Iberian Peninsula, located in southwestern Europe and comprising mainland Spain and Portugal. Its geological configuration reflects the superposition of Variscan and Alpine tectonic events and includes several major domains, such as the Iberian Massif, the Pyrenees, the Betic Cordillera, the Iberian and Catalan Coastal ranges, and the main Mesozoic–Cenozoic sedimentary basins. The Iberian Massif is predominantly composed of Precambrian and Palaeozoic metamorphic rocks and granitoids, whereas the Alpine ranges comprise deformed sedimentary successions, basement units, and locally occurring igneous and metamorphic rocks. The Ebro, Duero, Tagus, and Guadalquivir basins are characterized by sedimentary infill of variable thickness and petrophysical properties [19]. Figure 1 shows the location of the Iberian Peninsula and its main geological domains.
Figure 1.
Geographical and geological setting of the study area: (A) Regional location of the Iberian Peninsula in southwestern Europe. (B) Main geological and physiographic units and major Cenozoic sedimentary basins of the Iberian Peninsula. The Spain–Portugal international boundary is also shown. Coordinates are referenced to WGS 84.
These geological contrasts influence the regional geothermal regime through variations in crustal composition, radiogenic heat production, lithospheric thickness, structural permeability, and groundwater circulation. Radiogenic granitoids in Galicia and the Central System may generate localized thermal anomalies, whereas fractured Alpine domains and Neogene extensional regions may facilitate geothermal fluid circulation. In addition, porous and permeable sedimentary formations within the main basins may be relevant for low- to medium-temperature direct-use applications. Regional lithospheric modelling has also revealed marked spatial variations in crustal temperature and thermal structure across the Iberian Peninsula [20].
The lithospheric structure of the Iberian Peninsula has been investigated using seismic, gravimetric, magnetic, magnetotelluric, heat-flow, and geodetic observations. Regional initiatives such as TopoIberia and the IberArray network, together with broader European projects such as AlpArray, have improved the characterization of crustal and lithospheric structures across Iberia [21]. The integration of observations from Spain, Portugal, southern France, and northern Morocco has further contributed to understanding the tectonic evolution and thermal regime of the region [22].
Despite the theoretical geothermal potential reported for the region, its practical development remains limited. In Spain, deep enhanced geothermal system resources have been estimated at up to approximately 700 GW, although no commercial high-enthalpy geothermal power plants are currently operating, and the deployment of shallow geothermal systems remains comparatively modest [23]. This limited development is partly related to the uneven spatial distribution of boreholes and field measurements and to the lack of spatially continuous, high-resolution subsurface information [24]. These data limitations support the use of integrated satellite-derived and ground-based datasets for regional geothermal favourability assessment.
2.2. Data Sources and Inputs
2.2.1. Global Potential Field Models
Gravity and magnetic information from global potential-field models was compiled for the regional analysis of the Iberian Peninsula. The selected products incorporate observations derived from satellite missions, terrestrial surveys, marine measurements, airborne data, and satellite altimetry. The main characteristics of the missions and models considered in the study are summarized in Table 1.
Table 1.
Summary of the Earth observation satellites and magnetic models used in this research [25,26,27].
Based on the data sources described above, two models have been applied to each dataset (gravimetry and magnetometry) which will be detailed in the following subsections.
Gravimetry. The gravity component comprised EGM2008 and WGM2012. EGM2008 combines satellite observations, particularly from GRACE, with terrestrial and marine gravity measurements and satellite-altimetry information. WGM2012 is a global gravity compilation derived from several existing products, including EGM2008 and DTU10, and incorporates both satellite-derived and ground-based information [28]. The two models differ in their data composition, spatial support, resolution, and treatment of regional gravity signals. Their compatibility was assessed before integration using descriptive statistics, spatial comparison, geostatistical analysis, and comparison with higher-resolution observations from Catalonia. The complete comparative analysis is provided in the Supplementary Material, while the quantitative results and model selection are presented in Section 3.1 and Section 3.2.
Magnetometry. The magnetic component comprised EMAG2 and WDMAM2. EMAG2 provides a global magnetic-anomaly grid with a nominal resolution of 2 arc-minutes, approximately 0.033°, integrating satellite, airborne, marine, and ground-based observations. WDMAM2 provides a global magnetic-anomaly model on a 0.05° grid and emphasizes longer-wavelength components of the crustal magnetic field [29]. Because the two products differ in spatial resolution, source data, and spectral content, they were initially evaluated independently before spatial harmonization and integration. The descriptive comparisons, difference maps, and validation against local magnetic observations are included in the Supplementary Materials, whereas the quantitative comparison and final model selection are reported in Section 3.1 and Section 3.2.
2.2.2. Geostatistical Processing
The gravity and magnetic datasets were processed independently before their subsequent integration. The gravity component comprised EGM2008 and WGM2012, whereas the magnetic component included EMAG2 and WDMAM2. Because these products differ in spatial resolution, sampling support, data sources, and statistical distribution, a common geostatistical workflow was applied to enable their comparison and harmonization. The workflow comprised spatial resolution homogenization, statistical standardization, variogram modelling, anisotropy assessment, ordinary kriging, and cross-validation.
Spatial Resolution Homogenization. EGM2008 and WGM2012 were resampled onto a regular gravity working grid with a cell size of 0.033°, whereas EMAG2 and WDMAM2 were processed using a magnetic working grid with a cell size of 0.05°. These resolutions were selected considering the spatial support of the original products and the need to preserve regional-scale variability. Where an input product had a finer spatial resolution than the selected working grid, weighted spatial aggregation was applied. Coarser datasets and areas with incomplete coverage were interpolated onto the corresponding grid. These procedures provided a common spatial framework but did not increase the intrinsic physical resolution of the original observations.
Before geostatistical modelling, EGM2008, WGM2012, EMAG2, and WDMAM2 were independently standardized to zero mean and unit variance. This transformation reduced differences in magnitude and measurement units and prevented datasets with larger numerical ranges from dominating the subsequent comparison and integration.
Geostatistical Modelling and Interpolation. Experimental omnidirectional and directional variograms were calculated independently for EGM2008, WGM2012, EMAG2, and WDMAM2 to characterize their spatial continuity and identify possible anisotropic behaviour. Spherical variogram models were fitted using the nugget, sill, range, and anisotropy parameters reported in the Supplementary Materials.
Anisotropic ordinary kriging was subsequently applied to generate continuous surfaces for each gravity and magnetic model. Leave-one-out cross-validation was used to compare observed and predicted values, and model performance was evaluated using mean error, mean absolute error, and root mean square error. The resulting surfaces were finally resampled onto a common 5 × 5 km grid for the potential-field transformations and spectral coherence analysis described in Section 2.3.
2.2.3. Thermal Database and Lithological Information
Lithological data were incorporated to complement and validate the satellite information using the 1:50,000 Continuous Geological Map of Spain (GEODE) developed by the Geological and Mining Institute of Spain [30]. The 142 lithostratigraphic units identified in the Iberian Peninsula were grouped according to the generalized lithological legend of IGME into 26 main classes with similar composition and petrophysical properties [24]. Representative values of thermal conductivity, density, and magnetic susceptibility were assigned based on laboratory measurements, regional compilations [24], local studies of igneous and metamorphic rocks [31], and standard geophysical references [32]. The lithological map was resampled to a 5 × 5 km grid consistent with the spatial resolution of the potential field datasets, assigning the dominant lithology to each cell, following the approach proposed in [24]. In addition, other thermal measurements available for the study area (Table 2) were incorporated and harmonized through quality control criteria and topographic corrections.
Table 2.
Main thermal data sources compiled for the present study. All gradients were converted to °C/10 m. The heat flux was recalculated q = k·dT/dz, with k = 2.25 W/m·K when not available.
The datasets listed in Table 2 represent the principal thermal data sources compiled for the study and contain overlapping records. Therefore, the numbers reported for each source should not be summed directly. The initial compilation comprised 881 entries; after removing duplicate and spatially coincident records and retaining observations with valid coordinates, elevation, and thermal attributes, 199 unique thermal measurement locations were obtained. These harmonized records were used to generate the regional temperature at 100 m surface through IDW interpolation.
2.3. Geophysical Processing for Geothermal Purposes
The potential-field datasets were processed in Oasis montaj 2026.1 (Seequent, Christchurch, New Zealand= to derive transformations intended to enhance geological structures according to their spatial wavelength and geometry. The gravity analysis used the complete Bouguer anomaly products derived from EGM2008 and WGM2012 as supplied by their respective data providers. Therefore, Bouguer and terrain corrections were not recalculated in this study; the corrections incorporated into the original products were retained during subsequent processing.
The first vertical derivative of the Bouguer anomaly was calculated in Oasis montaj to enhance short-wavelength variations and lateral gravity gradients associated with relatively shallow density contrasts. For the magnetic data, reduction to the pole was performed using a geomagnetic inclination of 48.5° and a declination of −3.1°. These parameters were applied to reposition magnetic anomalies closer to their causative sources and reduce the asymmetry produced by the direction of the inducing field.
The pseudogravity transformation was subsequently performed in Oasis montaj using the same geomagnetic inclination and declination values, a density contrast of 2670 kg m−3, consistent with the density parameter used in the gravity product, and the magnetic-anomaly values in nT from the processed magnetic dataset. The transformation generated a gravity-equivalent representation of the magnetic field, facilitating spatial comparison between anomalies related to density and magnetic-susceptibility contrasts [36].
All transformed layers were normalized to the range [0, 1] and resampled onto a common 5 × 5 km grid. Anisotropic ordinary kriging was used to maintain a consistent spatial framework for the spectral coherence analysis described in Section 2.3.1. These operations harmonized the spatial support of the datasets but did not increase the intrinsic physical resolution of the original gravity and magnetic products.
2.3.1. Spectral Coherence Analysis and Construction of the Geophysical Favourability Index
Spectral coherence analysis was used to quantify the correspondence between the gravity and magnetic datasets in the frequency domain and to identify spatially coincident responses potentially associated with common geological structures [37]. Coherence was calculated for all pairwise combinations of five normalized input layers: Bouguer anomaly, vertical derivative of the Bouguer anomaly, free-air gravity anomaly, magnetic pseudogravity, and reduced-to-the-pole magnetic anomaly. This procedure produced ten unique coherence layers.
Each coherence layer was normalized to the range [0, 1]. A Geophysical Favourability Index (FI_geof) was subsequently calculated as a weighted linear combination of the normalized coherence layers. The weights were derived from their statistical association with geothermal-gradient reference data at 54 IHFC locations. The Bouguer–RTP coherence layer received the highest weight (0.40), whereas lower weights were assigned to combinations dominated by higher-frequency derivatives.
The resulting FI_geof values were smoothed using a two-dimensional Gaussian filter with an approximate standard deviation of 30 km to reduce short-wavelength noise while preserving regional spatial trends. The final FI_geof map represents relative structural favourability derived from the combined gravity and magnetic responses. The coherence values and their geological interpretation are presented in Section 3.4.
2.3.2. Multicriteria Integration Using Fuzzy Logic
The Geophysical Favourability Index (FI_geof) was derived from the weighted integration of the normalized gravity–magnetic coherence layers, as described in Section 2.3.1. Subsequently, the Geothermal Favourability Index (FI_geot) was obtained by combining FI_geof with subsurface temperature at 100 m depth through weighted fuzzy logic [38]. A linear membership function (FuzzyLinear) was used to transform the original FI_geof range [0.306–0.548] into membership values ranging from 0 to 1, with the minimum and maximum values defining the lower and upper favourability thresholds, respectively.
Temperature was transformed using a sigmoidal “Large” membership function (FuzzyLarge), with its midpoint defined by the mean subsurface temperature at 100 m depth (μ = 24.99 °C) and its spread defined by the corresponding standard deviation (σ = 7.40 °C). These parameters represent the transition between below- and above-average thermal conditions across the Iberian Peninsula and are consistent with the minimum operational temperature range considered for geothermal heat-pump applications [24].
The integrated index was calculated as:
where μ_FI_geof and μ_Temp represent the fuzzy membership values of the geophysical favourability index and temperature at 100 m depth, respectively. The 60:40 weighting was adopted as a transparent and geophysically informed reference configuration rather than as a universally optimal solution. A moderately higher weight was assigned to FI_geof because it integrates multiple gravity- and magnetic-derived structural indicators and exhibits greater regional spatial continuity, whereas the temperature at the 100 m layer is more strongly influenced by the uneven distribution of boreholes, variations in thermal conductivity, and interpolation uncertainty. The selected weighting therefore preserves the dominant structural contribution while retaining a substantial thermal component.
FI_geot = 0.60·μ_FI_geof + 0.40·μ_Temp
The robustness of the reference configuration was evaluated by varying the FI_geof weight between 0.50 and 0.80, with the complementary temperature weight adjusted accordingly. The main regional favourability patterns remained spatially stable across the tested scenarios, particularly in north-western Galicia and the Levante–southeastern sector. The 60:40 model was therefore retained as a transparent and reproducible reference configuration. A comprehensive comparison of alternative fuzzy aggregation operators was considered beyond the scope of the present study.
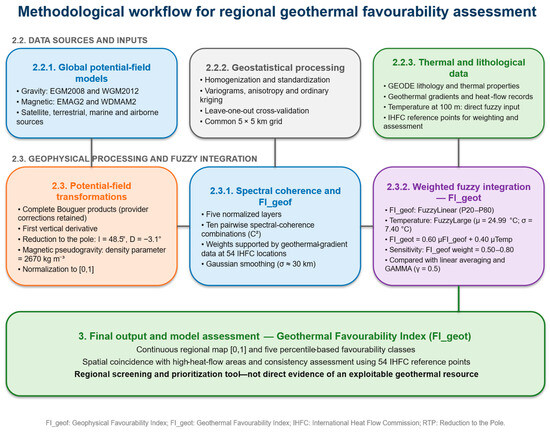
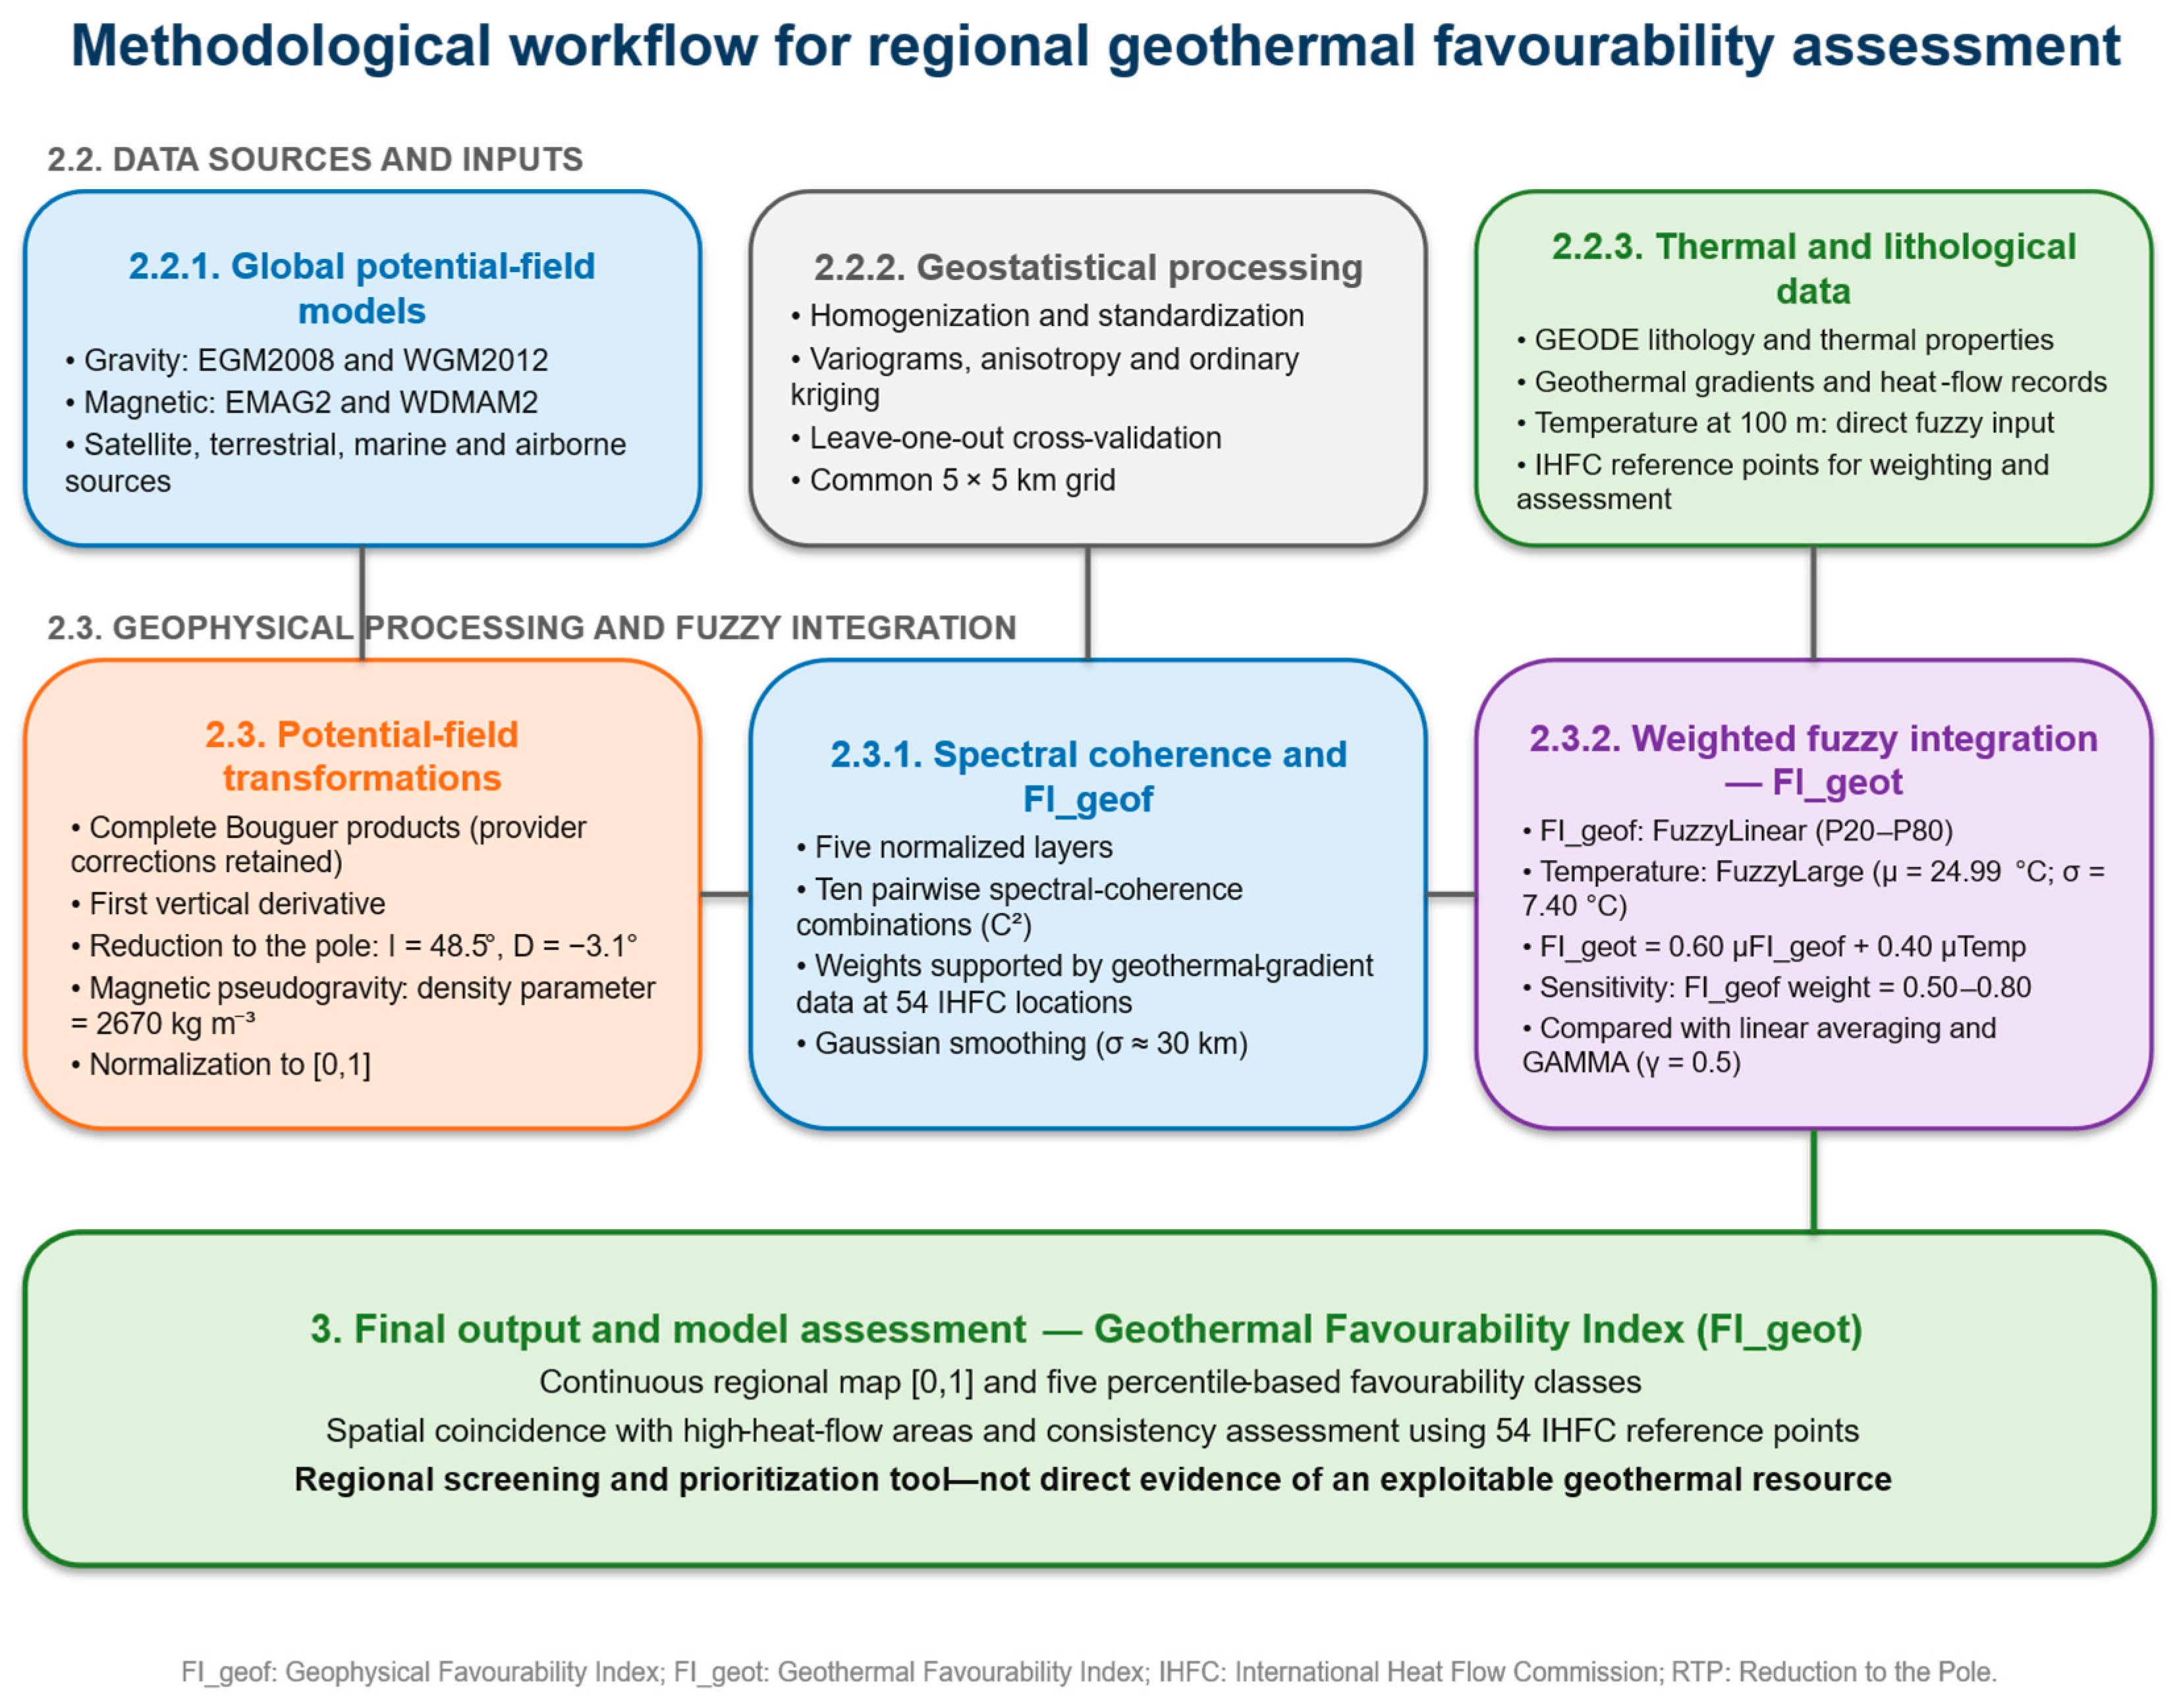
The continuous FI_geot map, with values ranging from 0 to 1, was reclassified into five relative favourability categories using the P20, P40, P60, and P80 percentiles following [39]. The results of the weight-sensitivity analysis are presented in Section 3.6. The complete methodological workflow, from the compilation and geostatistical harmonization of the input datasets to the generation and assessment of FI_geot, is summarized in Figure 2.
Figure 2.
Methodological workflow used to compare and harmonize the gravity, magnetic, thermal, and lithological datasets; derive the Geophysical Favourability Index (FI_geof) through spectral coherence analysis; and integrate FI_geof with temperature at 100 m depth using weighted fuzzy logic to obtain the regional Geothermal Favourability Index (FI_geot).
3. Results
3.1. Comparative Performance and Dataset Selection
A quantitative comparison was performed between the gravity and magnetic models over their common spatial support before their subsequent integration. EGM2008 and WGM2012 were compared at 15,251 coincident grid locations covering the Iberian Peninsula, whereas EMAG2 values were interpolated onto the WDMAM2 grid, resulting in 62,887 valid common locations. Pearson’s correlation coefficient, coefficient of determination, mean difference, mean absolute difference, and root mean square difference were calculated to quantify the agreement and systematic discrepancies between each pair of models; the results are summarized in Table 3.
Table 3.
Quantitative agreement and discrepancy between the gravity and magnetic models over their common spatial support.
The gravity models showed a very strong spatial correspondence, with a Pearson correlation coefficient of 0.995 and an R2 value of 0.990. However, WGM2012 presented a systematic positive offset relative to EGM2008, with a mean difference of 123.87 mGal. The nearly identical mean difference and mean absolute difference indicate that WGM2012 values were consistently higher across almost the entire common domain. This systematic displacement is also reflected in an inter-model RMSE of 124.25 mGal.
In contrast, the magnetic models exhibited only moderate spatial agreement. The correlation between EMAG2 and WDMAM2 was 0.583, corresponding to an R2 value of 0.340. The mean difference was −20.48 nT, while the mean absolute difference and RMSE reached 189.87 and 255.48 nT, respectively. These results indicate that the differences between the magnetic products involve not only a general offset but also substantial variations in anomaly amplitude and spatial detail.
The quantitative comparison confirms that EGM2008 and WGM2012 reproduce similar regional gravity patterns, although WGM2012 exhibits a systematic positive offset relative to EGM2008. In contrast, EMAG2 and WDMAM2 show lower spatial correspondence and substantially larger amplitude differences. Together with the comparisons against higher-resolution local observations presented in the Supplementary Material, these results supported the selection of EGM2008 and EMAG2 as the primary gravity and magnetic reference models, respectively. WGM2012 and WDMAM2 were retained as complementary products for characterizing broader regional variability.
3.2. Geostatistical Performance of the Potential Field Models
Cross-validation of the geostatistical models revealed differences in spatial continuity and predictive performance among the gravity and magnetic datasets. The gravity products exhibited relatively low short-range variability and a dominant regional-scale spatial structure. WGM2012 preserved broader regional trends, whereas EGM2008 showed greater consistency with the observed gravity distribution and lower prediction errors. Comparison with higher-resolution observations from Catalonia also indicated lower dispersion for EGM2008 and a systematic positive bias in WGM2012.
The magnetic datasets displayed a marked directional spatial structure, with the strongest anisotropy occurring approximately along the north–south direction. EMAG2 retained finer-scale magnetic features and showed closer agreement with the local magnetic observations, whereas WDMAM2 emphasized longer-wavelength regional anomalies and exhibited stronger smoothing and larger deviations. The fitted spherical variogram models indicated that EGM2008 and EMAG2 provided the most spatially consistent representations within their respective data groups.
Leave-one-out cross-validation yielded root mean square errors below 10 mGal for the gravity datasets and below 5 nT for the magnetic datasets. Considering prediction error, agreement with local observations, spatial continuity, and the preservation of regional and local structures, EGM2008 and EMAG2 were selected as the primary gravity and magnetic reference models, respectively. WGM2012 and WDMAM2 were retained as complementary sources for representing broader spatial variability.
3.3. Processed Potential Field Maps
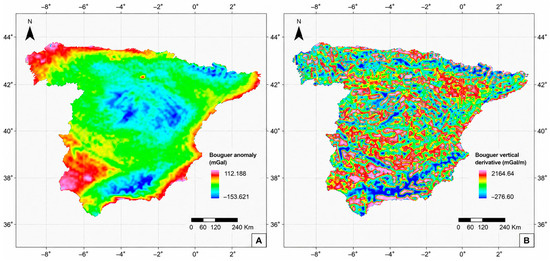
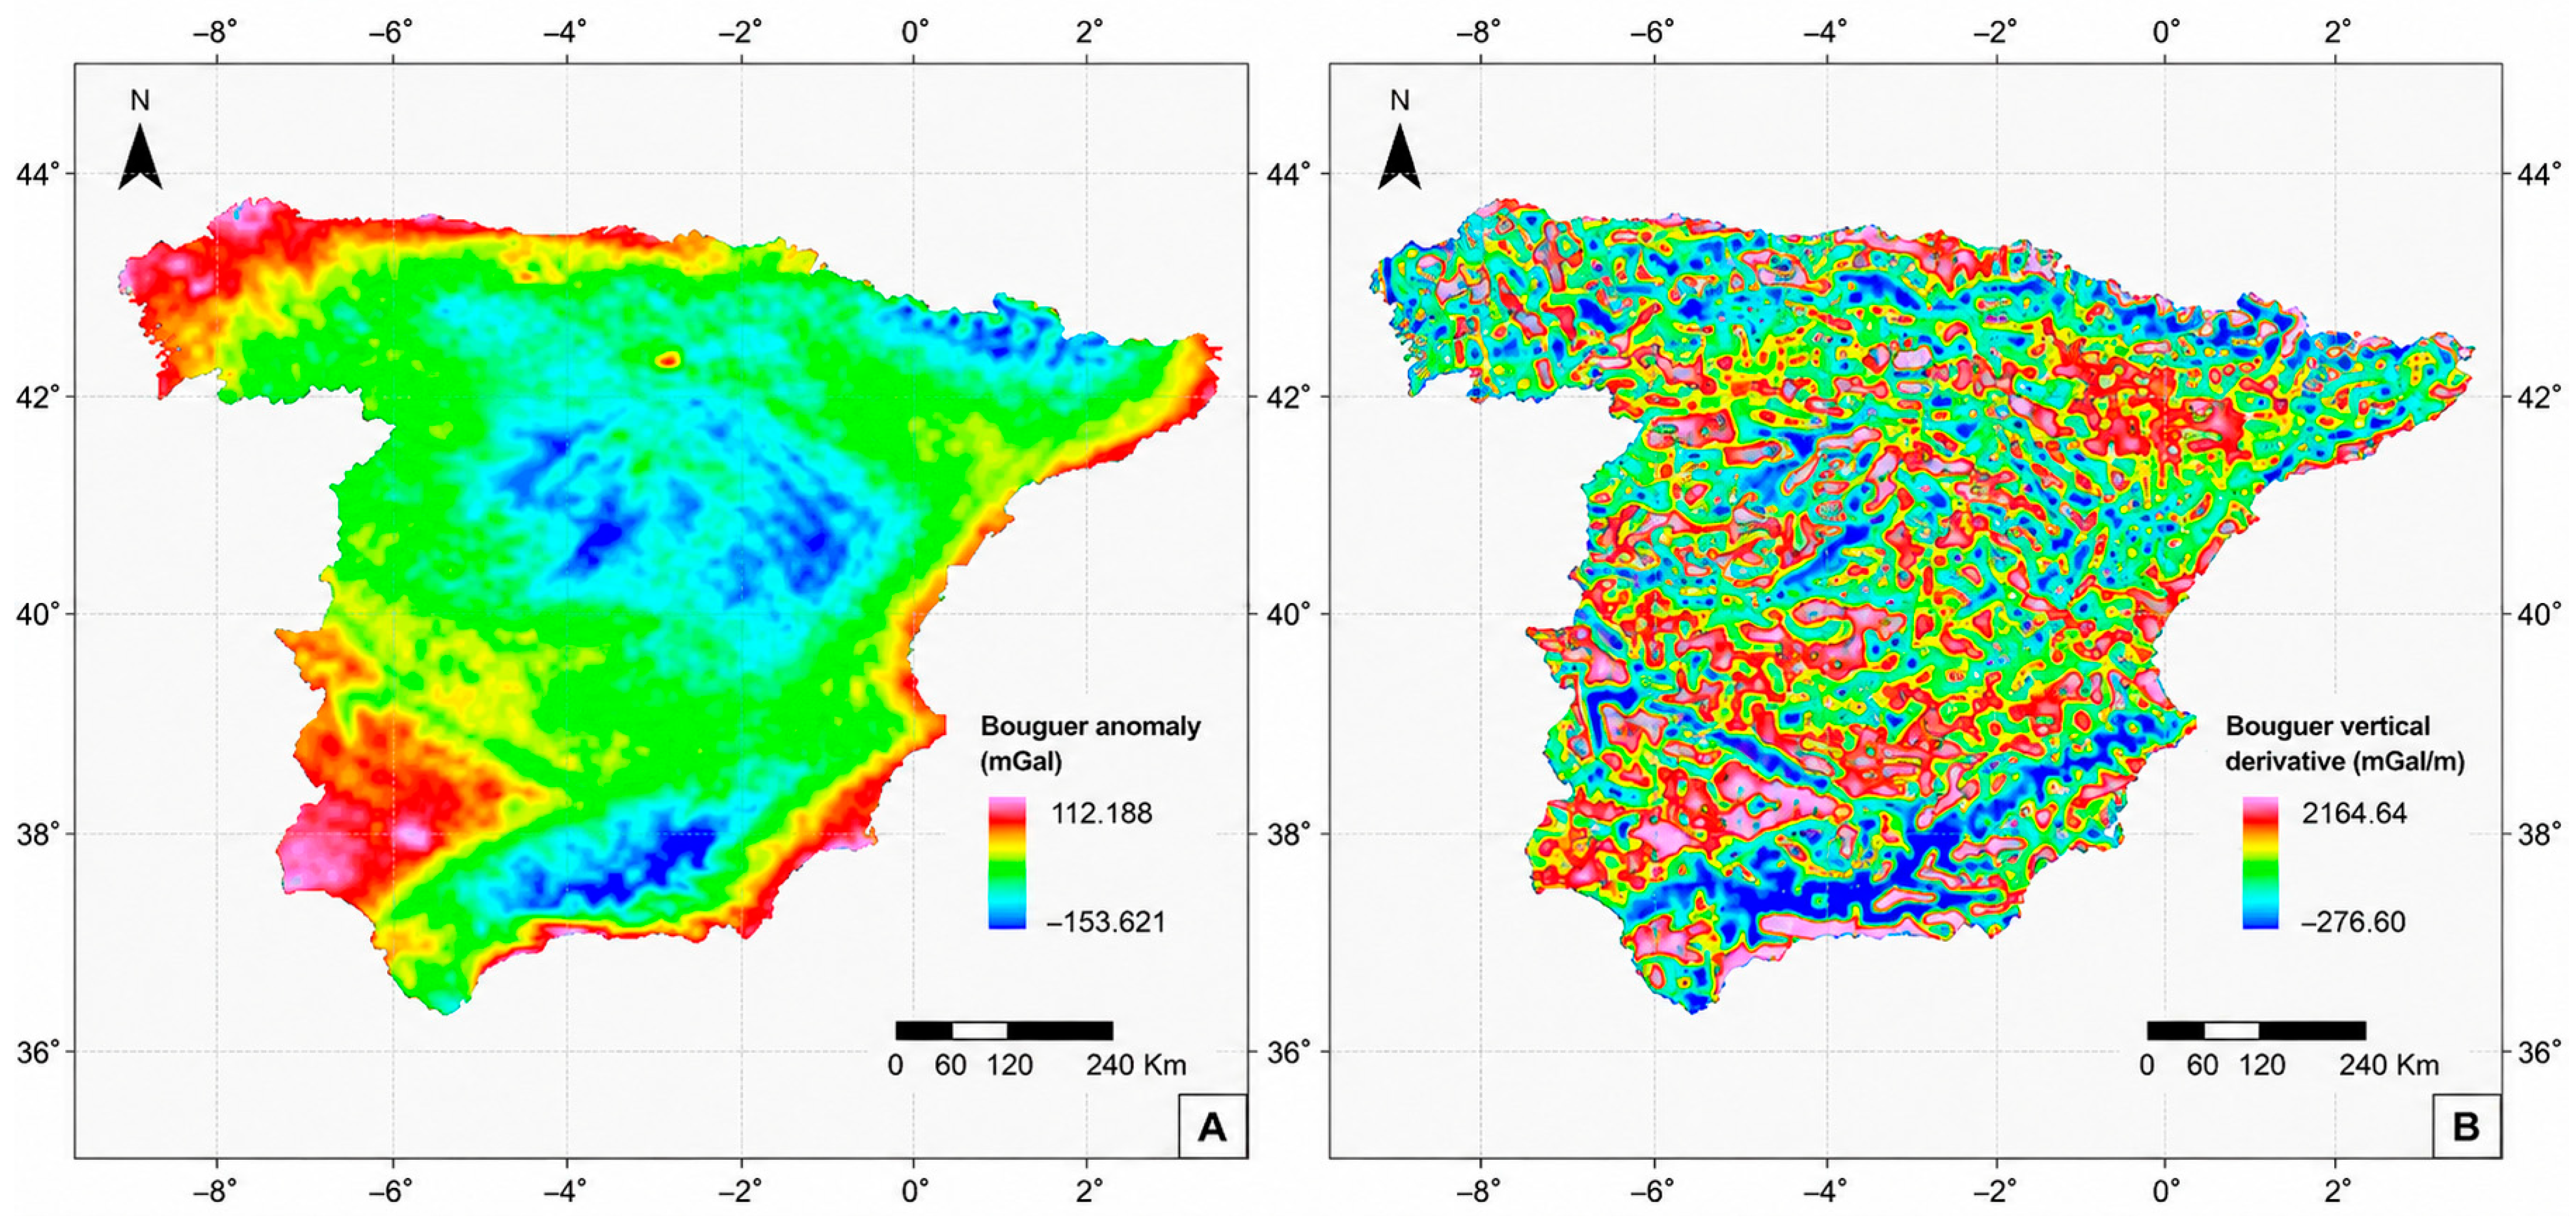
The Bouguer anomaly map (Figure 3A) highlights regional crustal density variations across the Iberian Peninsula. Broad negative anomalies below −100 mGal spatially coincide with major sedimentary and low-density crustal domains, including sectors of the Ebro and Guadalquivir basins, whereas relatively positive anomalies above +50 mGal occur in parts of the western Iberian Massif. Sharp gravity gradients are observed along the margins of the Pyrenees, Betic Cordillera, and major sedimentary basins, suggesting the influence of crustal contacts and inherited tectonic boundaries.
Figure 3.
(A) Total Bouguer anomaly derived from integrated gravity data. (B) Vertical derivative of the Bouguer anomaly highlighting shallow structures and major crustal contacts (red).
The first vertical derivative of the Bouguer anomaly (Figure 3B) enhances shorter-wavelength features and lateral gravity gradients. Higher derivative values delineate several mountain fronts and structural boundaries, particularly in the Pyrenees, Cantabrian domain, and Betic Cordillera, whereas lower values characterize broader and more homogeneous regional domains.
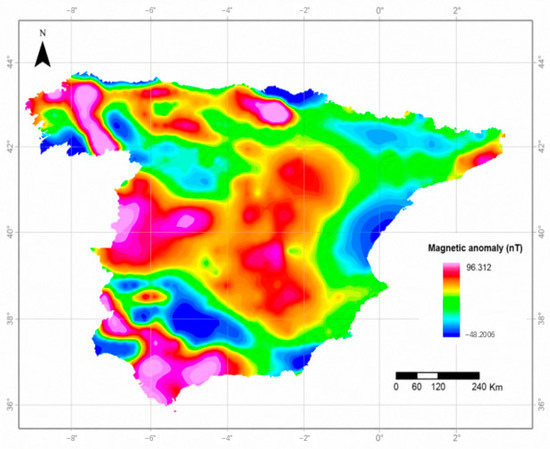
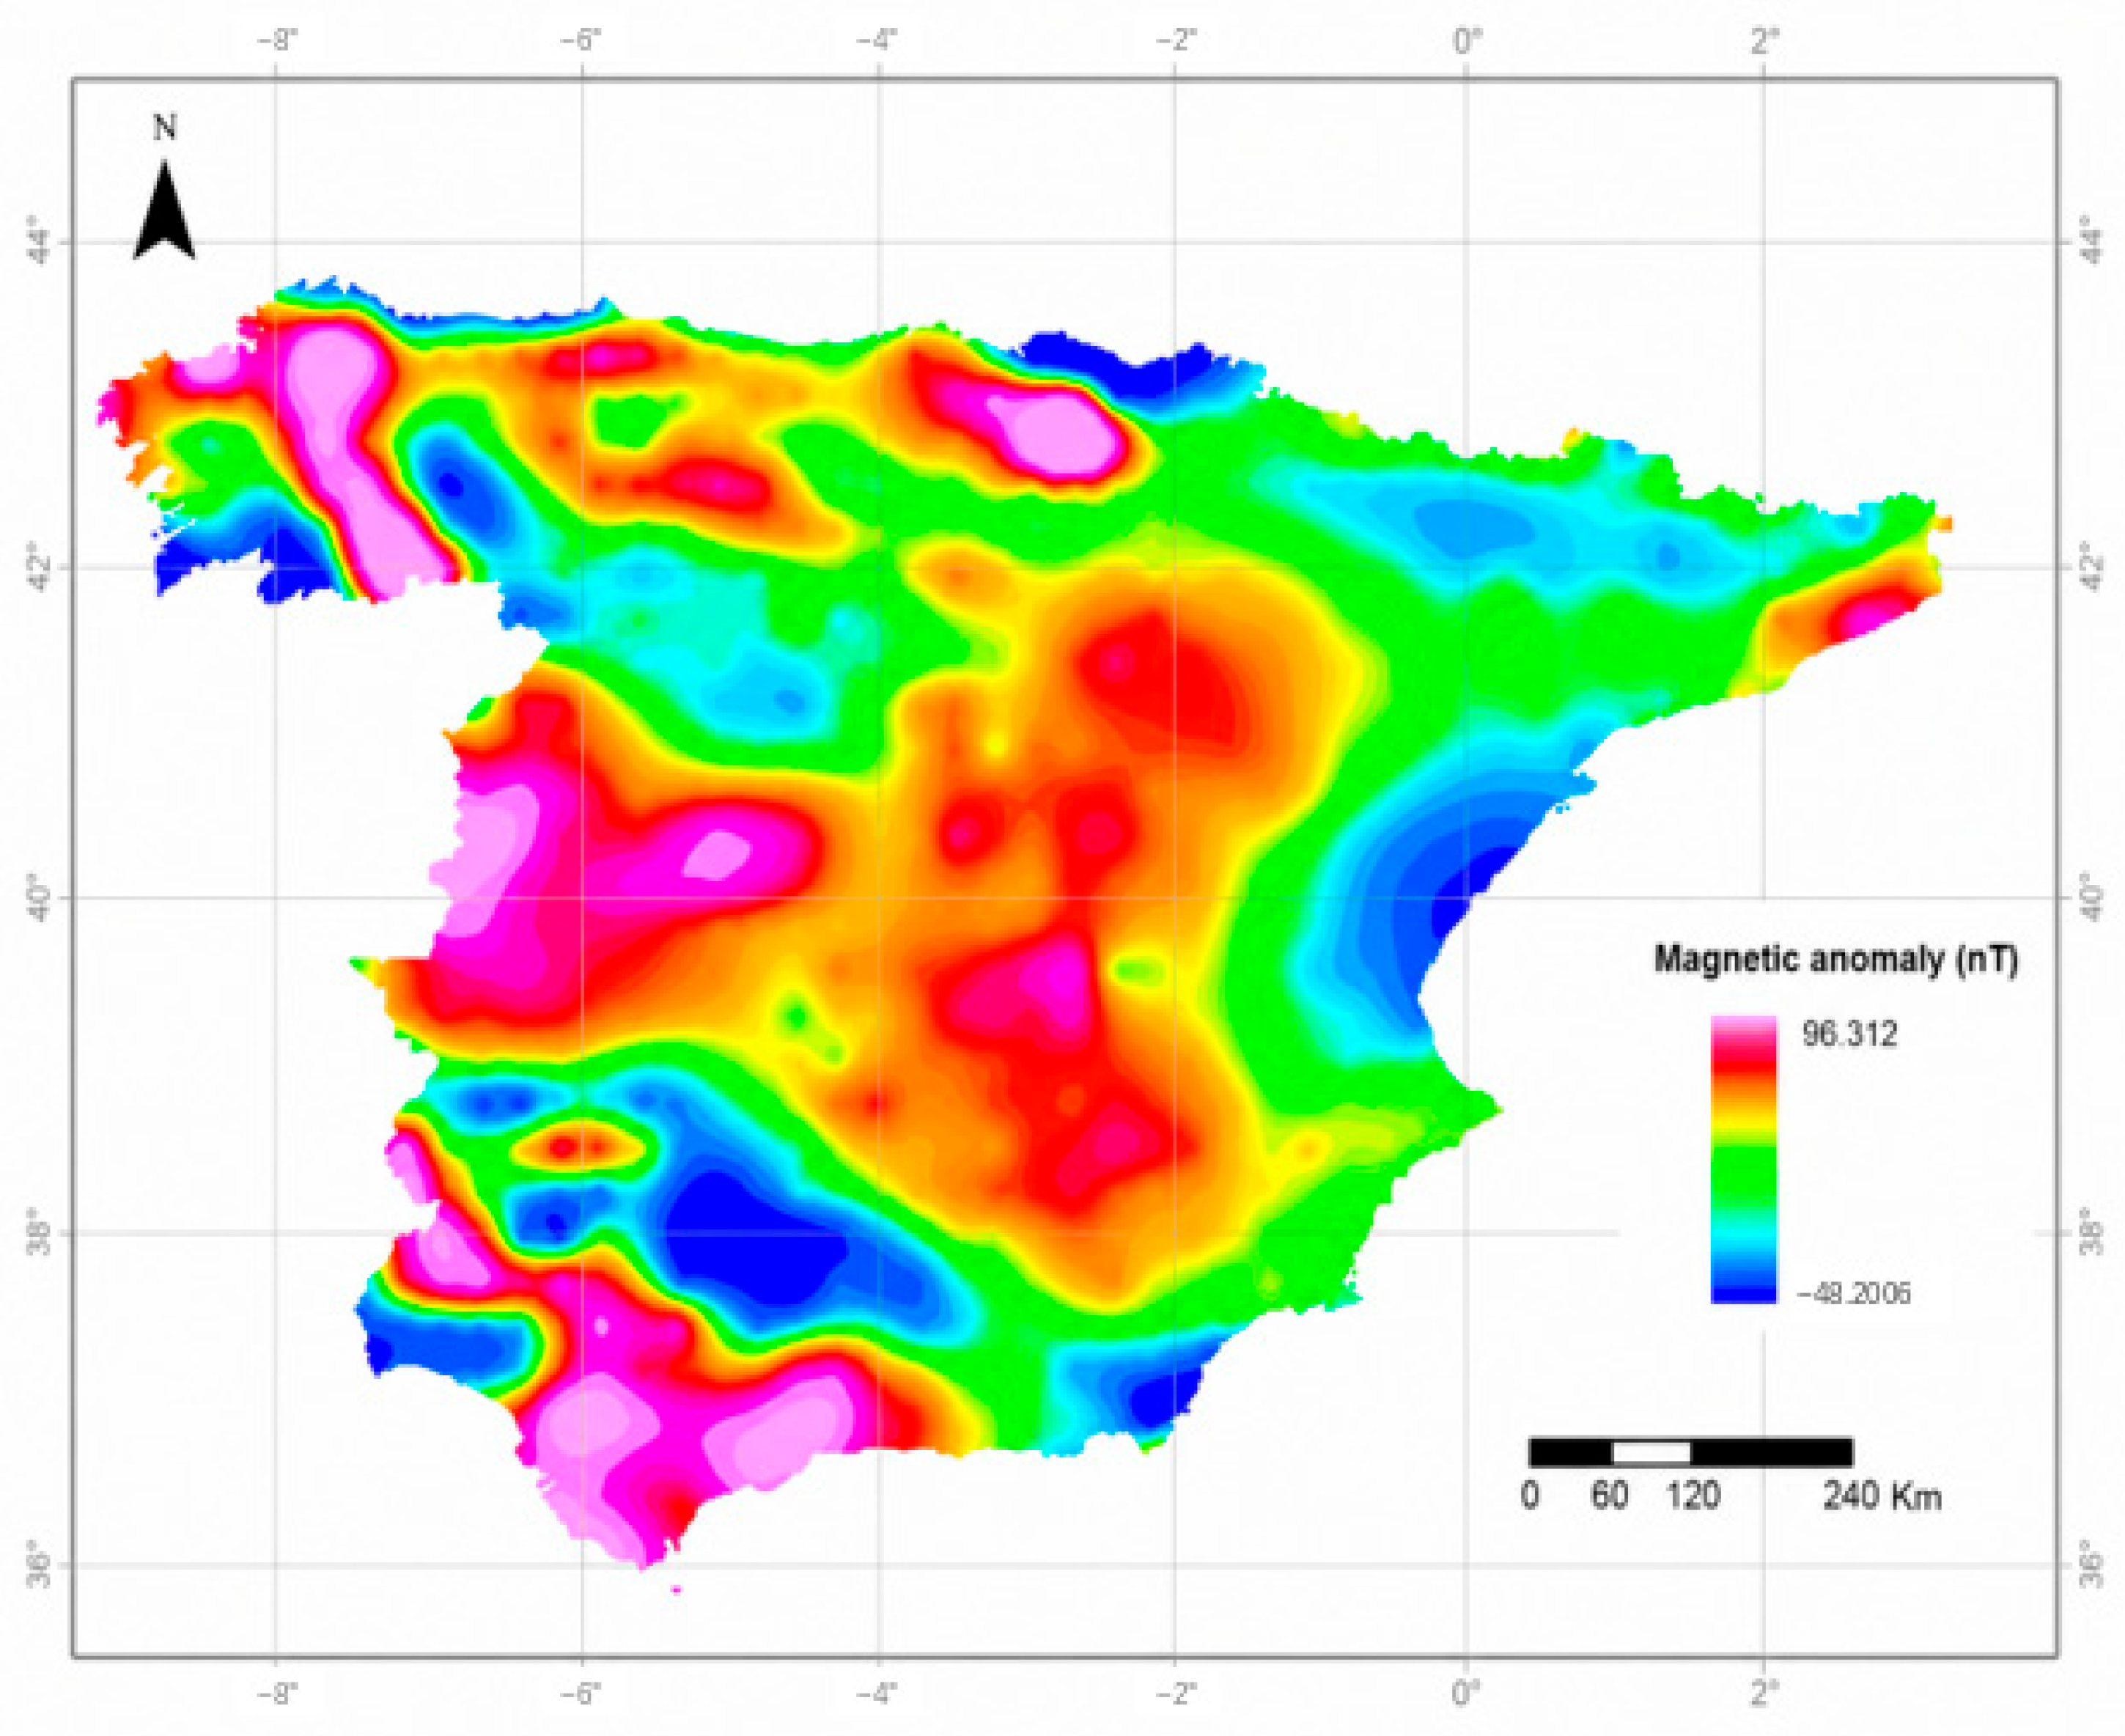
The integrated magnetic anomaly map (Figure 4) shows positive magnetic anomalies of up to approximately +96 nT in parts of the Central Meseta and western Betic ranges, together with negative anomalies down to approximately −48 nT along sectors of the Mediterranean margin and northern Iberia. These patterns reflect regional variations in the amplitude and spatial wavelength of the magnetic field and may be associated with differences in magnetic mineral content, lithology, alteration, and source depth.
Figure 4.
Integrated magnetic anomaly map showing spatial variations in magnetic susceptibility (EMAG2 + WDMAM2 geostatistically processed).
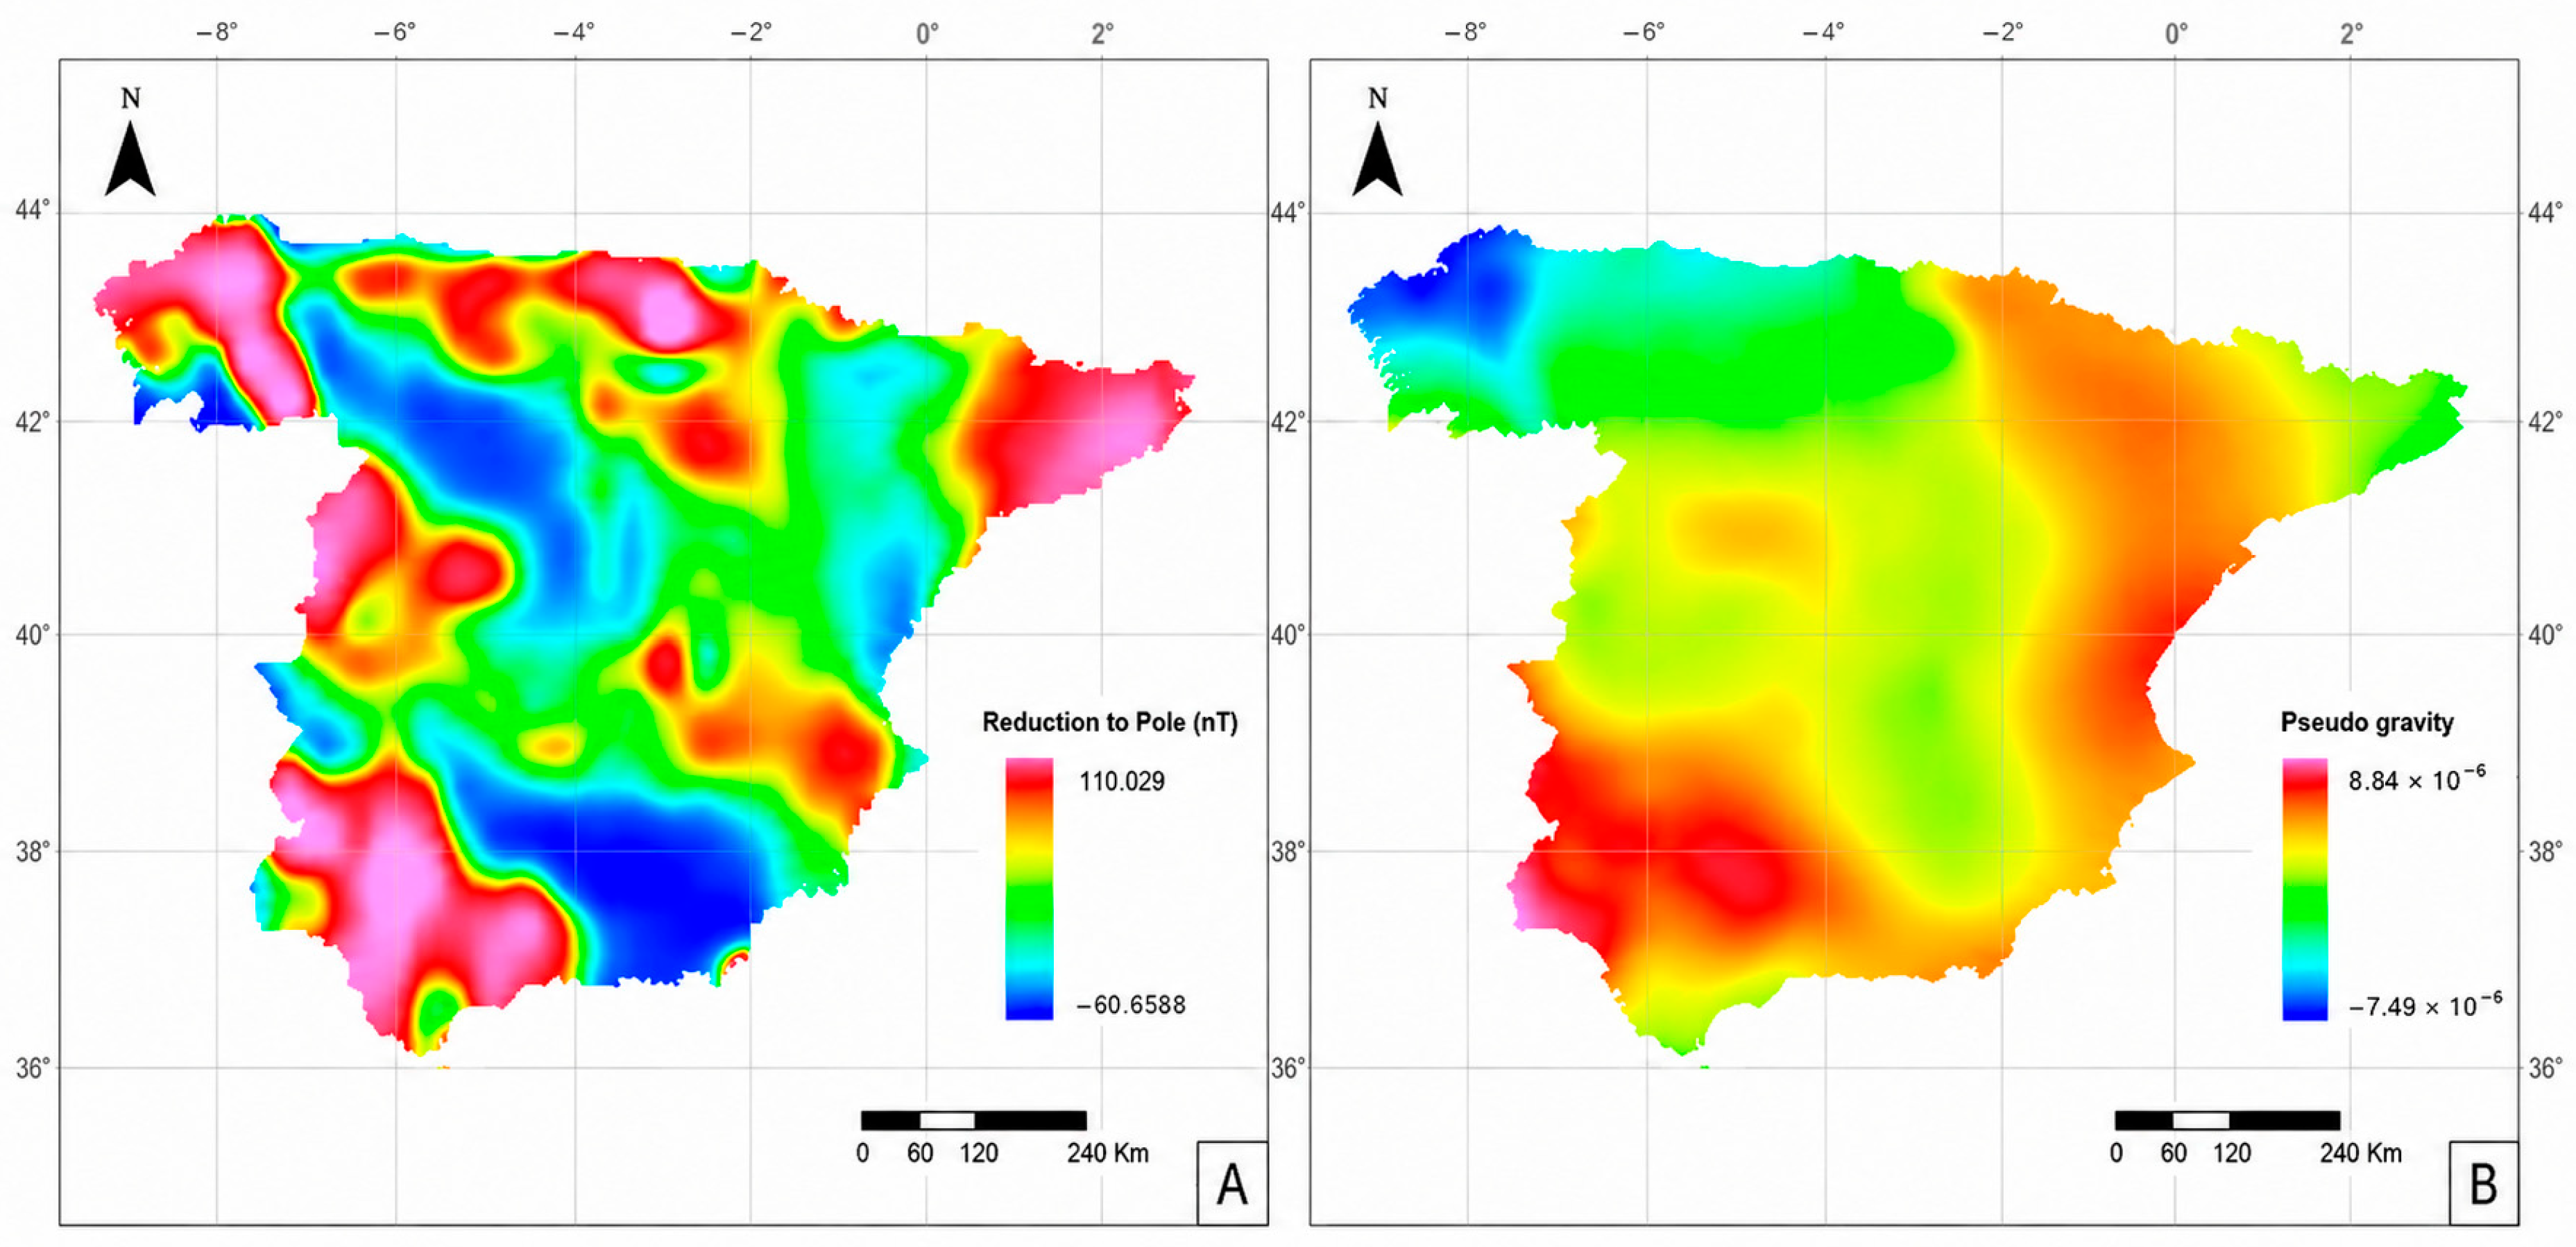
The reduced-to-the-pole magnetic anomaly map (Figure 5A) repositions the main magnetic responses closer to their inferred source locations and highlights regional anomaly belts in the Northern Meseta, Pyrenees, Ebro Depression, and Mediterranean margin. The pseudogravity transformation (Figure 5B) provides a gravity-equivalent representation of the magnetic field, emphasizing broad spatial gradients and facilitating comparison with the gravity products. Positive and negative pseudogravity anomalies should be interpreted as relative variations in the transformed magnetic response rather than as direct measurements of subsurface density.
Figure 5.
(A) RTP magnetic anomaly centres sources and pseudogravity is derived from the integrated magnetic field. (B) Pseudo gravity where high gradients delineate magnetic bodies and lithological contacts.
3.4. Spectral Coherence and Geophysical Favourability Index
The pairwise spectral analysis (Table 4) showed consistently high coherence among the processed potential-field layers. The highest spectral coherence value was obtained between the Bouguer anomaly and magnetic pseudogravity (C2 = 0.998), followed by pseudogravity and RTP (C2 = 0.992), and Bouguer anomaly and RTP (C2 = 0.990). The vertical derivative of the Bouguer anomaly also showed high spectral coherence with RTP (C2 = 0.984) and pseudogravity (C2 = 0.983).
Table 4.
Matrix of pairwise spectral coherence values (C2) among the potential-field layers used to calculate the Geophysical Favourability Index.
These high coherence values indicate that the processed layers share substantial spectral and spatial components over the wavelength range considered. However, they should not be interpreted as evidence of direct physical equivalence between density and magnetic susceptibility. Their magnitude is partly influenced by the common spatial support, normalization, interpolation, shared regional wavelengths, and the mathematical dependence introduced by transformations such as pseudogravity and RTP. The geological implications of these relationships are discussed in Section 4.
The highest spectral coherence value was observed between the Bouguer anomaly and magnetic pseudogravity (C2 = 0.998), followed by pseudogravity and RTP (C2 = 0.992), and Bouguer anomaly and RTP (C2 = 0.990). Similarly, the vertical derivative showed spectral coherence values above 0.98 with both pseudogravity and RTP. These results indicate a strong degree of spectral and spatial correspondence among the processed potential-field layers.
The high correlations are partly related to the common spatial support, normalization, interpolation, and long-wavelength regional structure shared by the processed datasets. Therefore, they should not be interpreted as evidence of a direct physical equivalence between density and magnetic susceptibility. Their geological implications are discussed in Section 4.
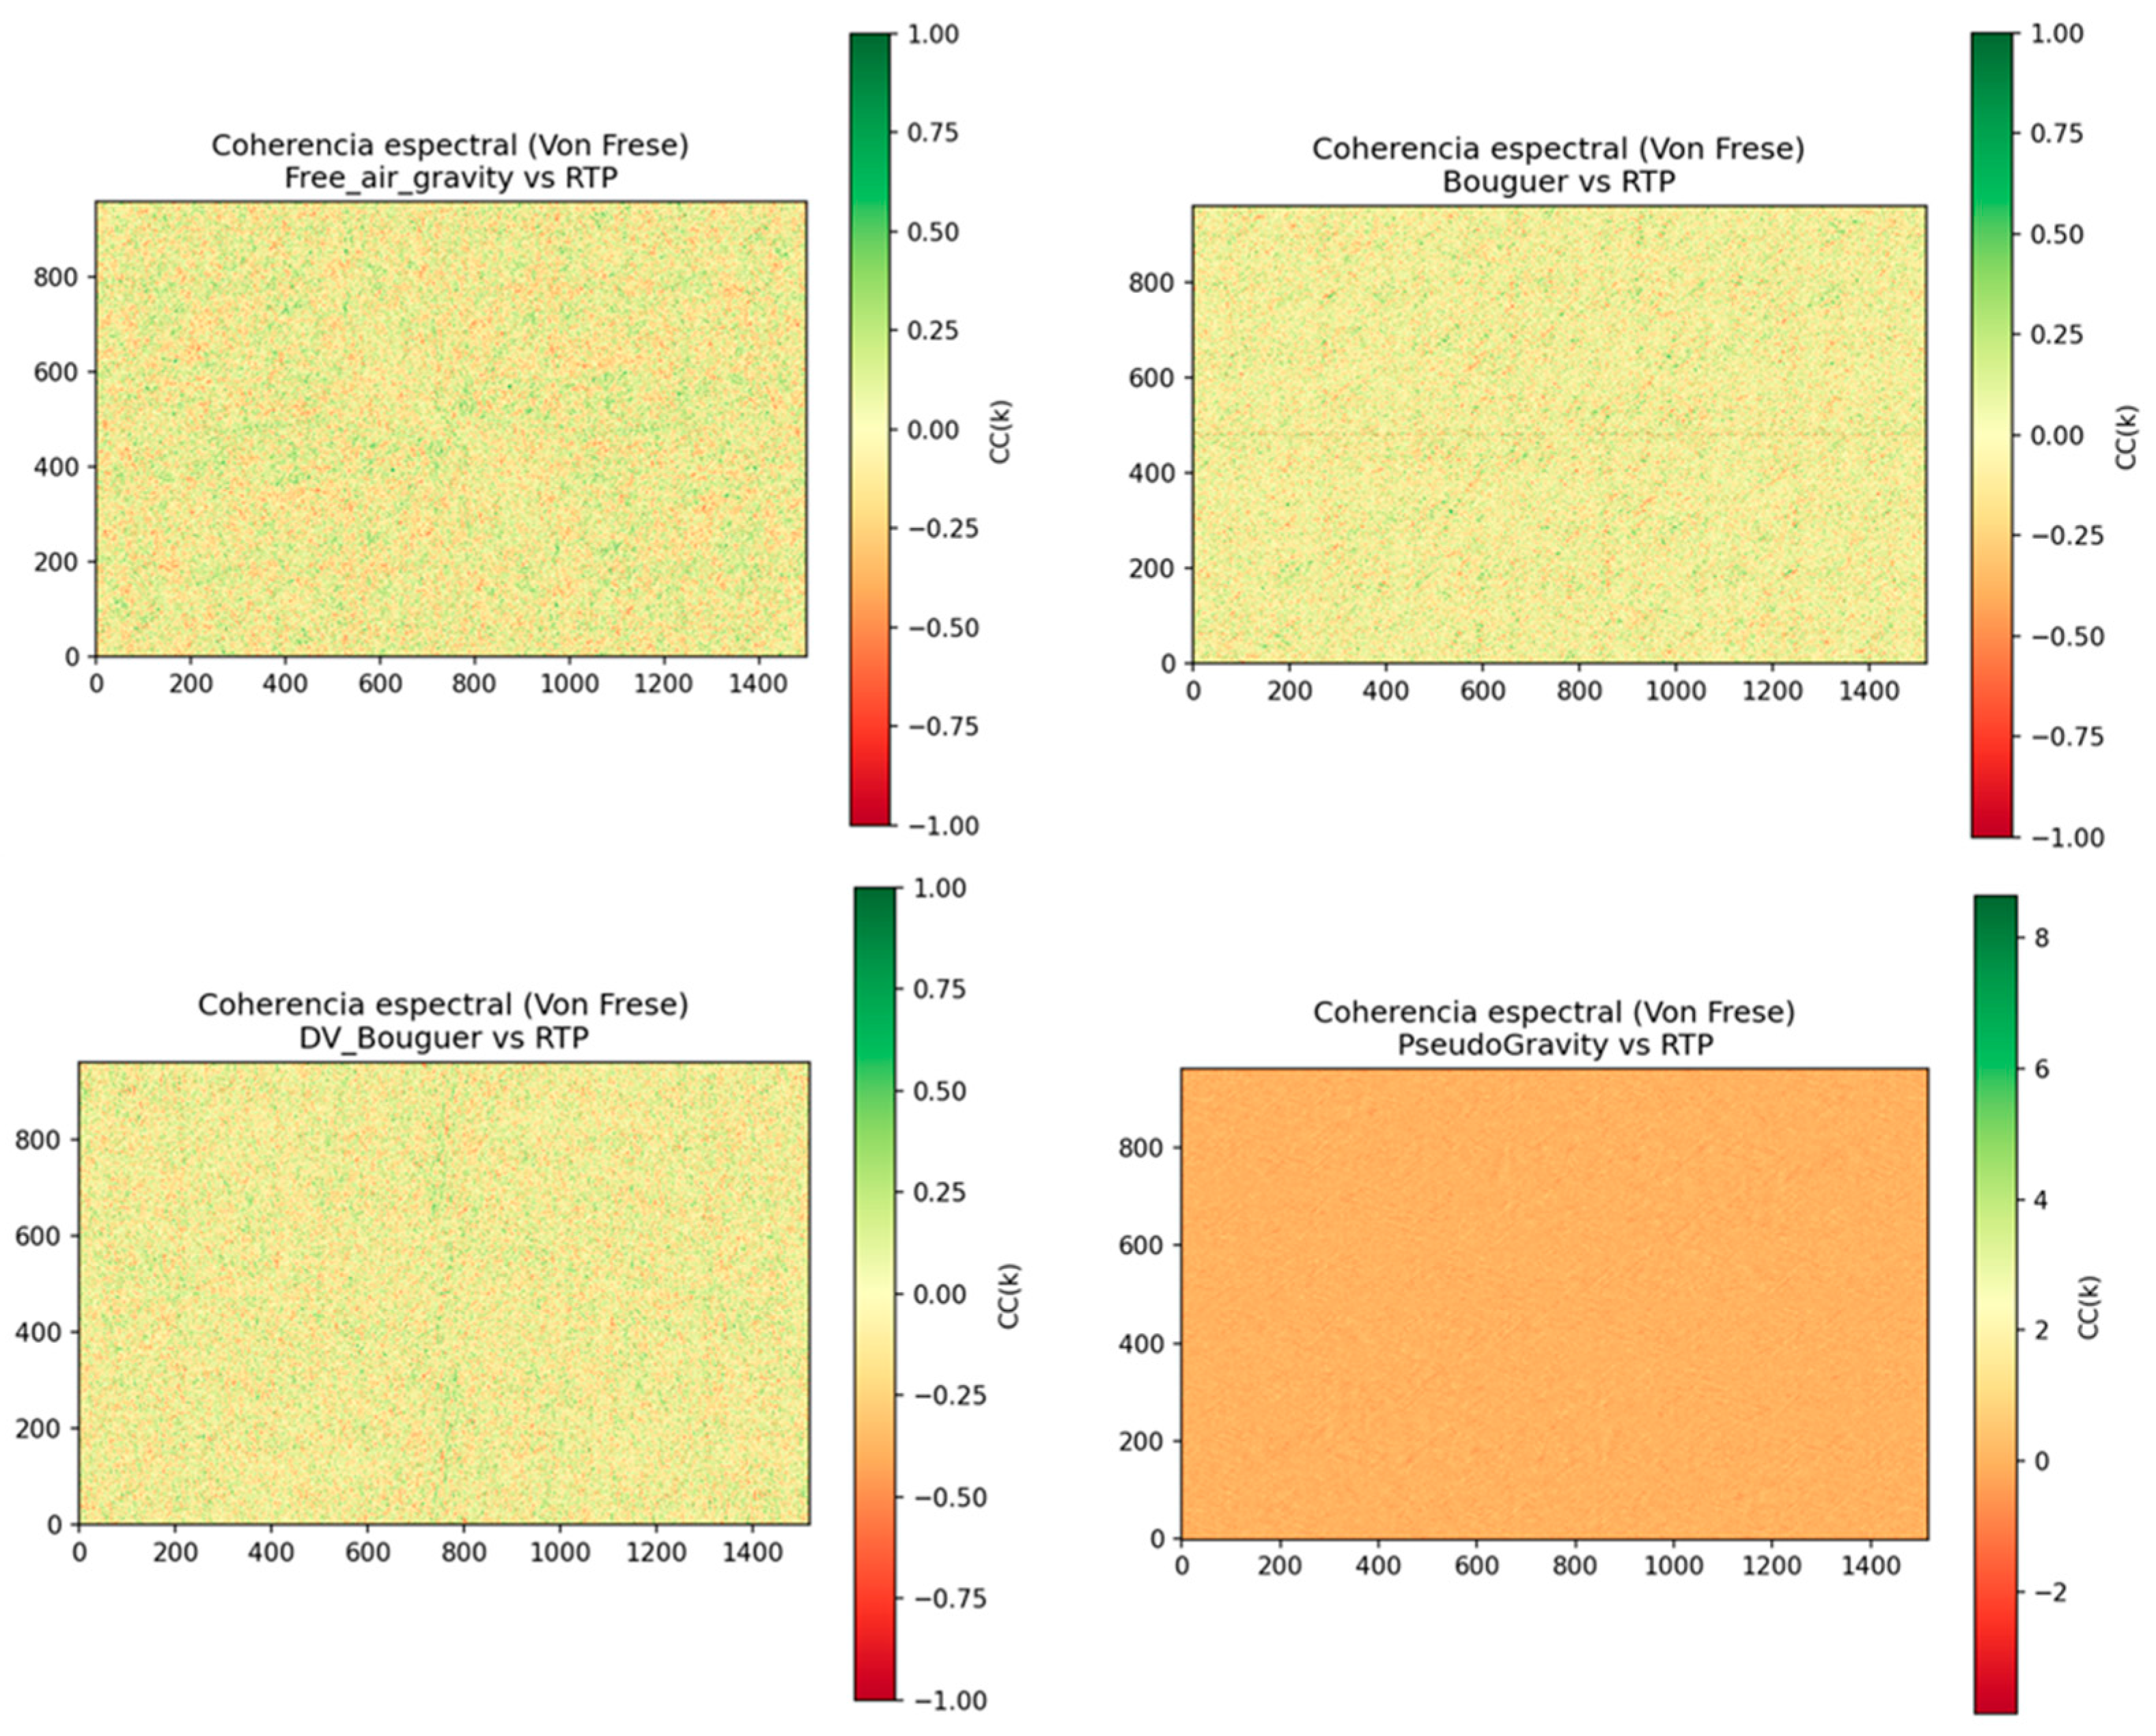
The spectral coherence maps (Figure 6) were consistent with the correlation matrix, showing extensive areas with values close to 1. These patterns reflect strong shared long-wavelength spatial components among the processed potential-field datasets, although local variations remain visible across the study area.
Figure 6.
Spectral coherence maps among potential field layers and the RTP magnetic anomaly.
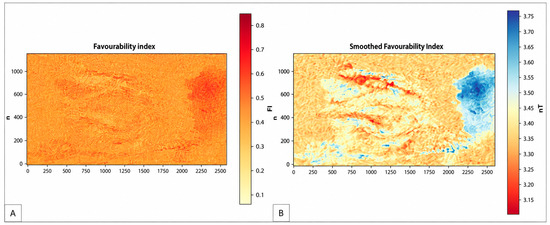
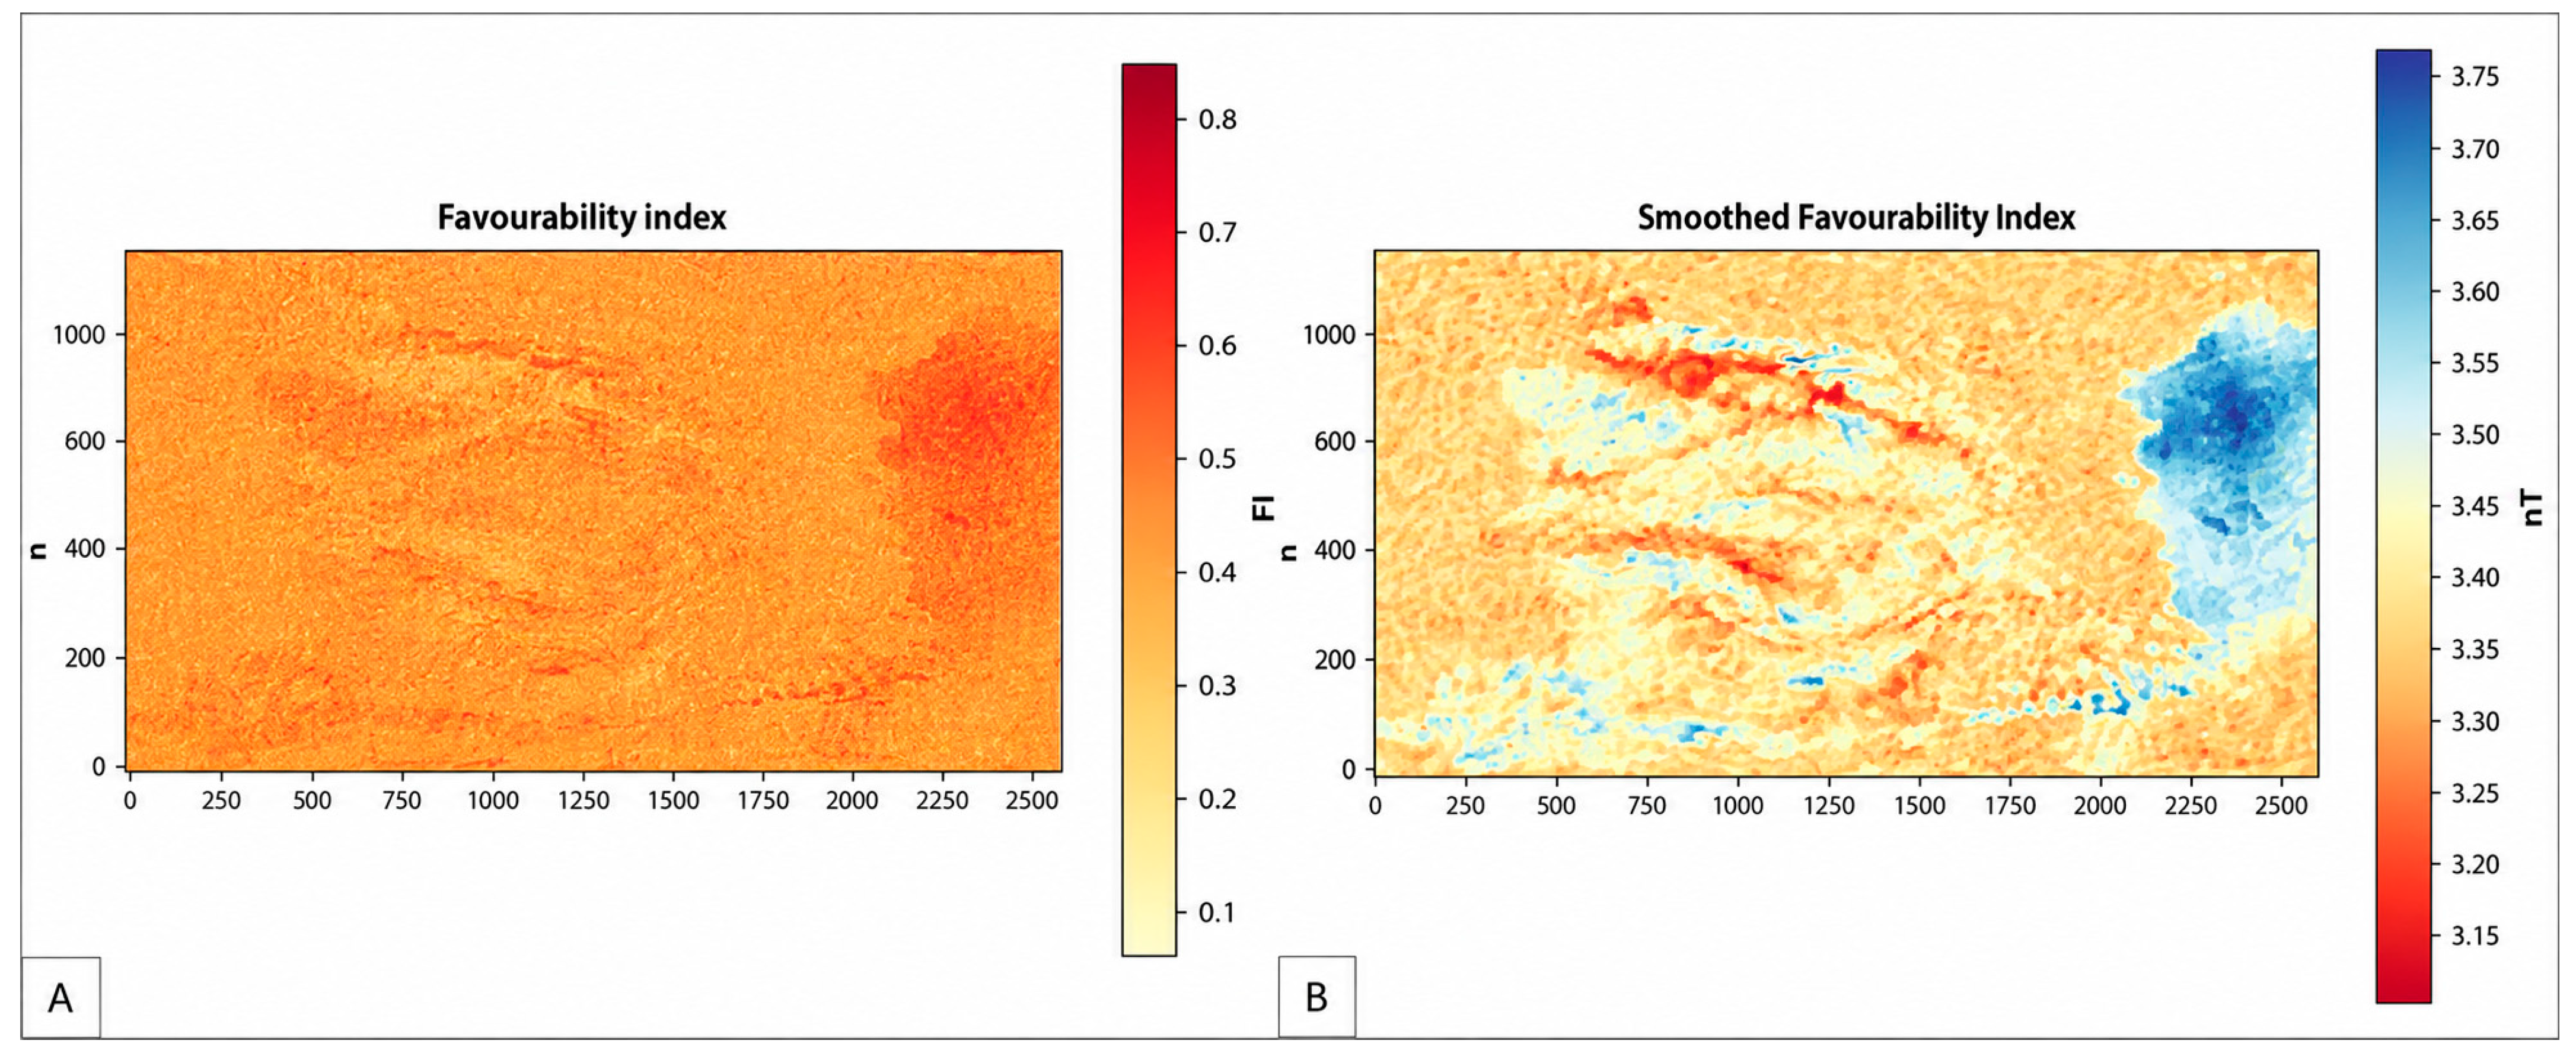
The geophysical Favourability Index (Figure 7A), ranging from 0.1 to 0.8, represents the probability of favourable subsurface conditions, with high values indicating strong gravity–magnetic coherence linked to structural contacts, faults, and intrusive bodies, and low values corresponding to homogeneous sedimentary areas. The smoothed index (Figure 7B) reduces noise and emphasizes regional trends, highlighting coherent anomaly belts in the central and north-eastern areas, potentially associated with deep structures or intrusions.
Figure 7.
Geophysical Favourability Index derived from spectral coherence analysis of potential field datasets: (A) original index distribution (0.1–0.8); (B) smoothed index highlighting regional structural trends.
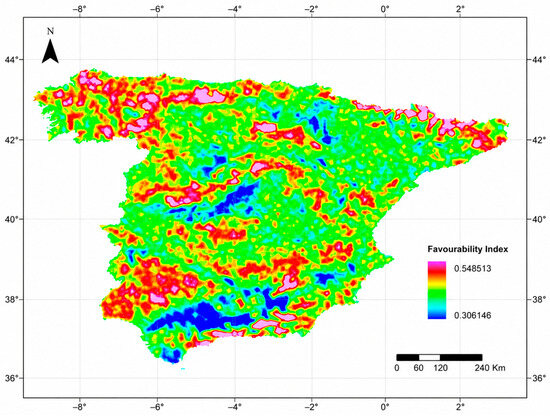
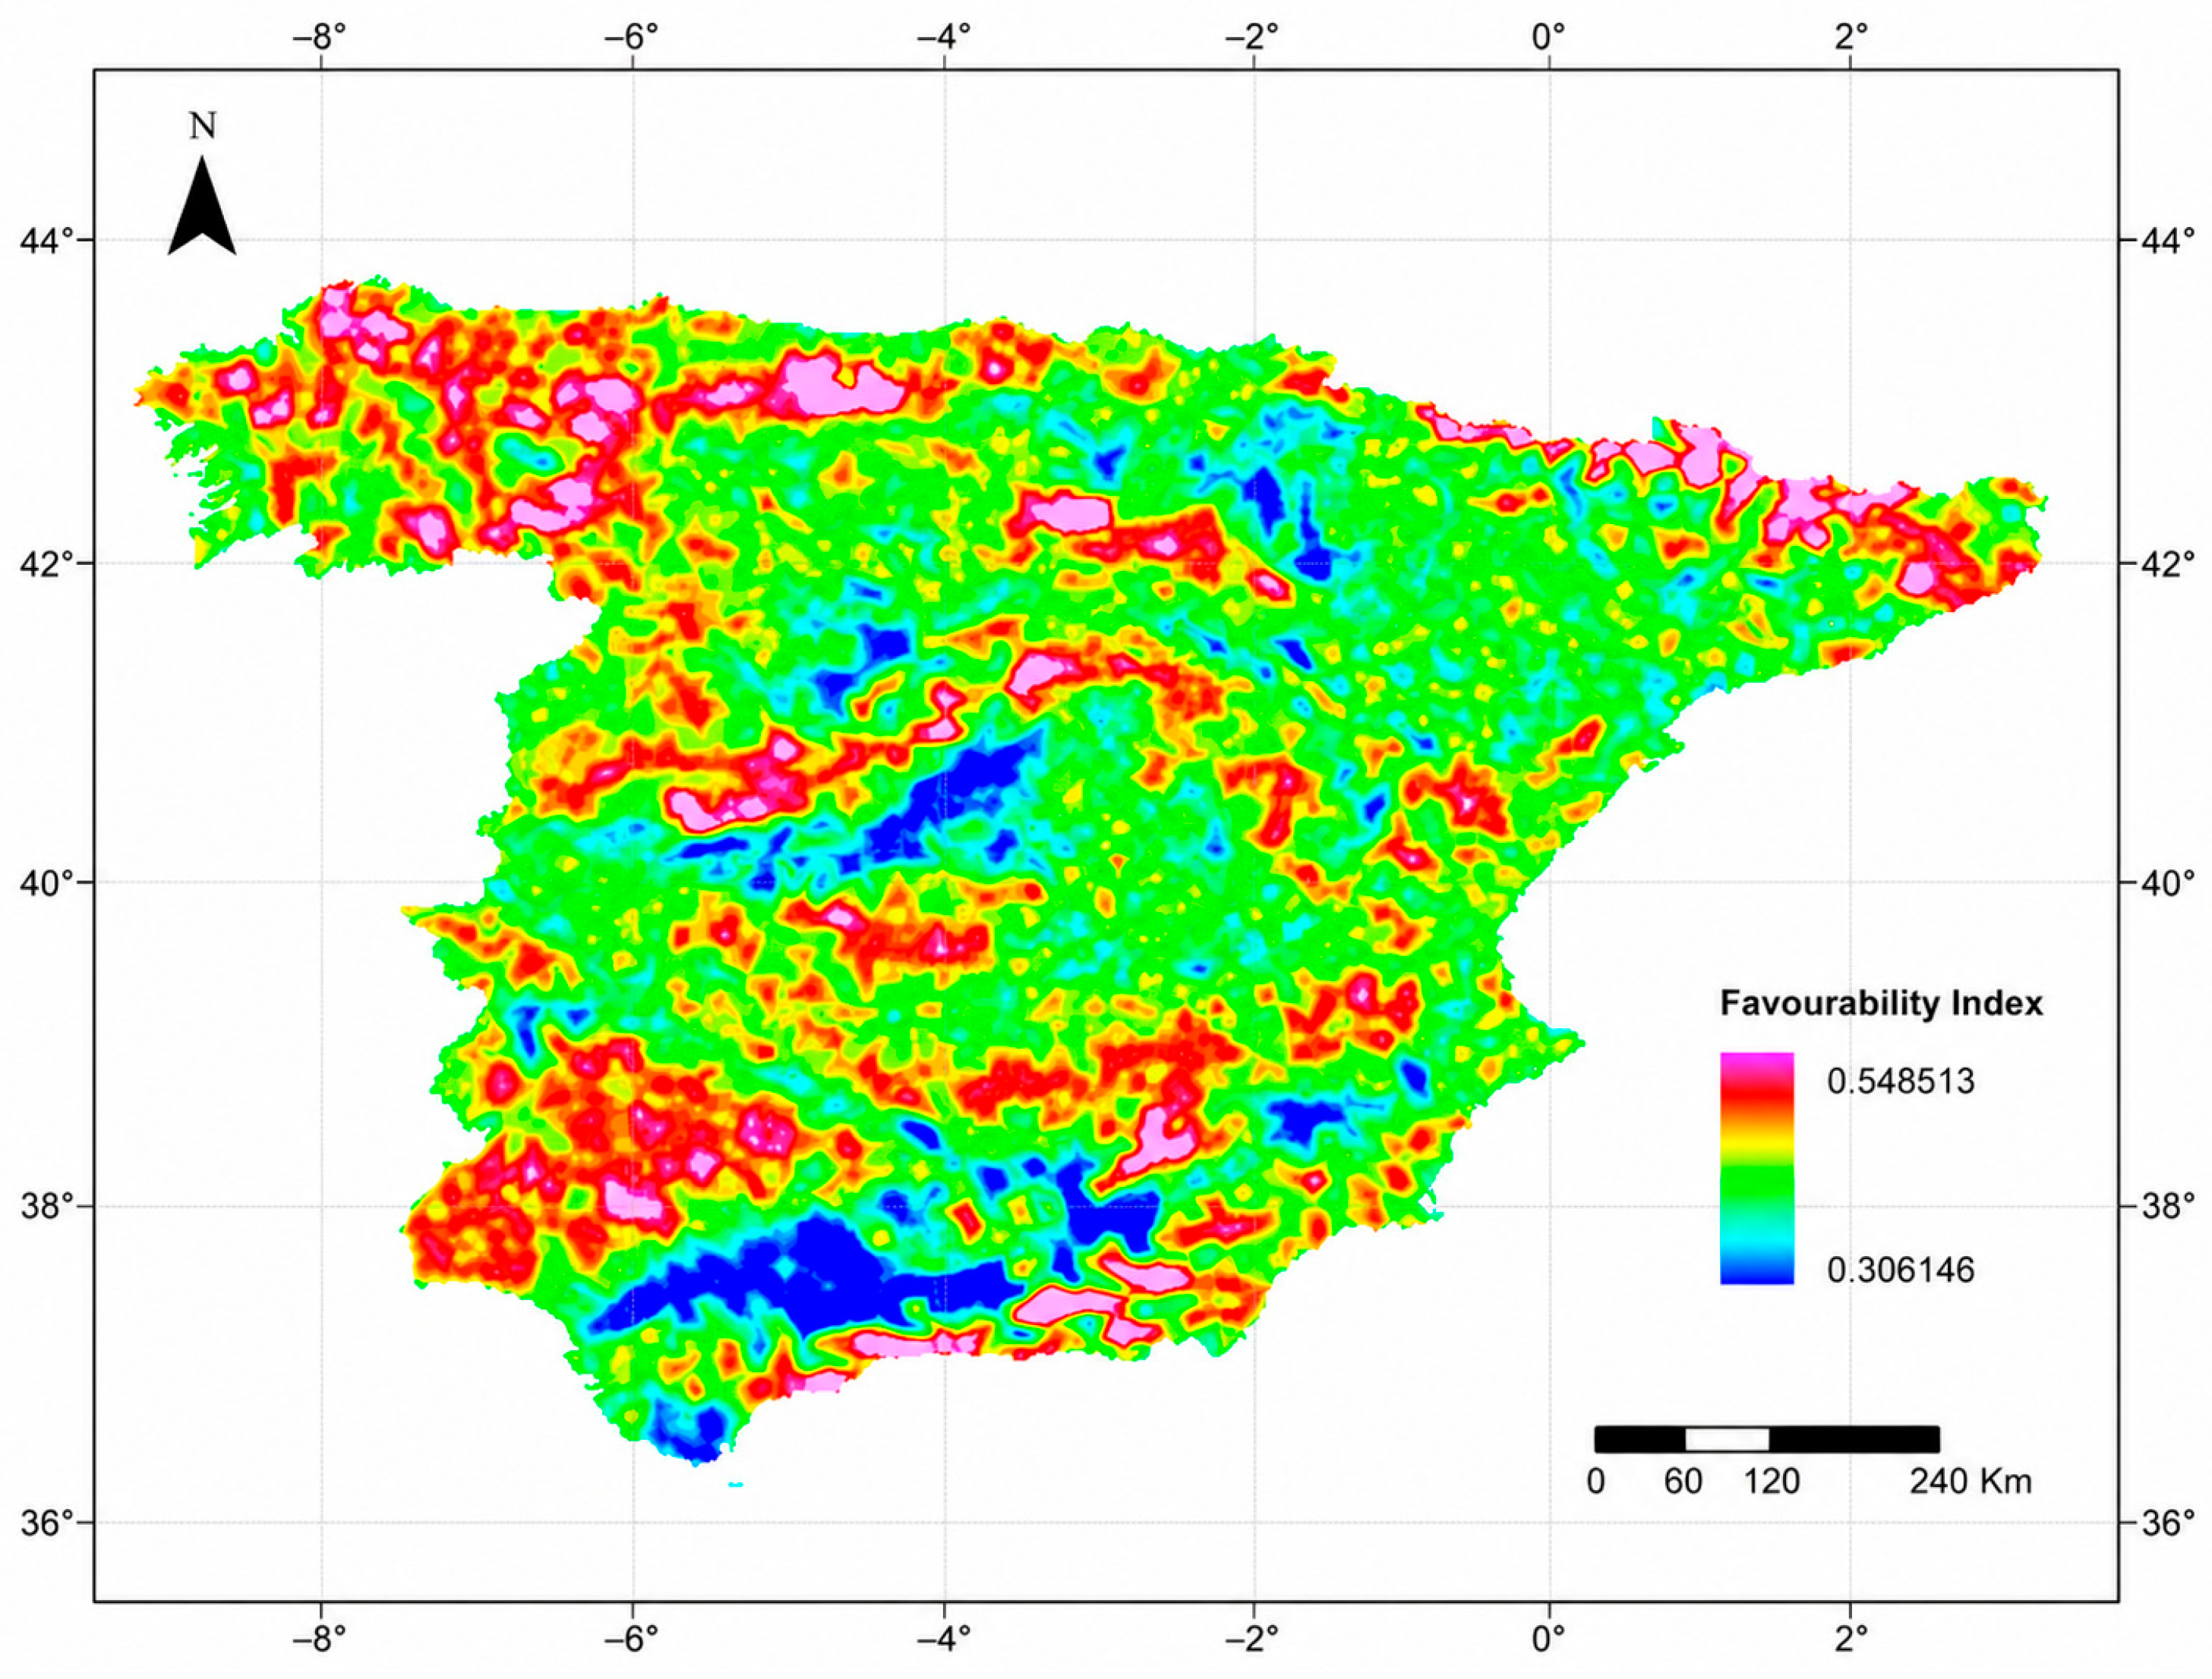
The classified FI_geof (Figure 8), divided into high (red), medium (green), and low (blue) categories using P33 and P66 thresholds, reveals a heterogeneous distribution of geophysical favourability. High-potential areas are mainly in the south and northwest of the Iberian Peninsula, medium values dominate central and eastern regions, and low favourability is concentrated in the southwest and interior zones.
Figure 8.
Classified geophysical favorability index based on percentile thresholds (P33 and P66).
As shown in Figure 8, FI_geof ranges from 0.306 to 0.543 (mean = 0.421; σ = 0.026), reflecting gravity–magnetic spectral coherence. Higher values (>0.43) occur mainly in the Guadalquivir Basin, Betic Cordillera, and Galicia–Trás-os-Montes, while lower values (<0.41) dominate the southwestern Iberian Peninsula and parts of the Northern Meseta. Overall, FI_geof captures crustal heterogeneity linked to density and magnetic contrasts, with thermal gradient data introduced to further refine geothermal interpretation.
3.5. Geothermal Gradient and Heat Flow
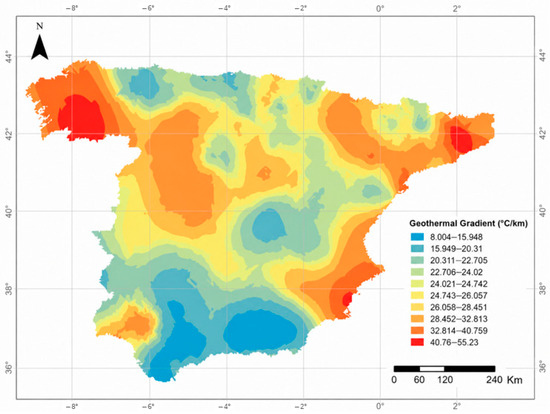
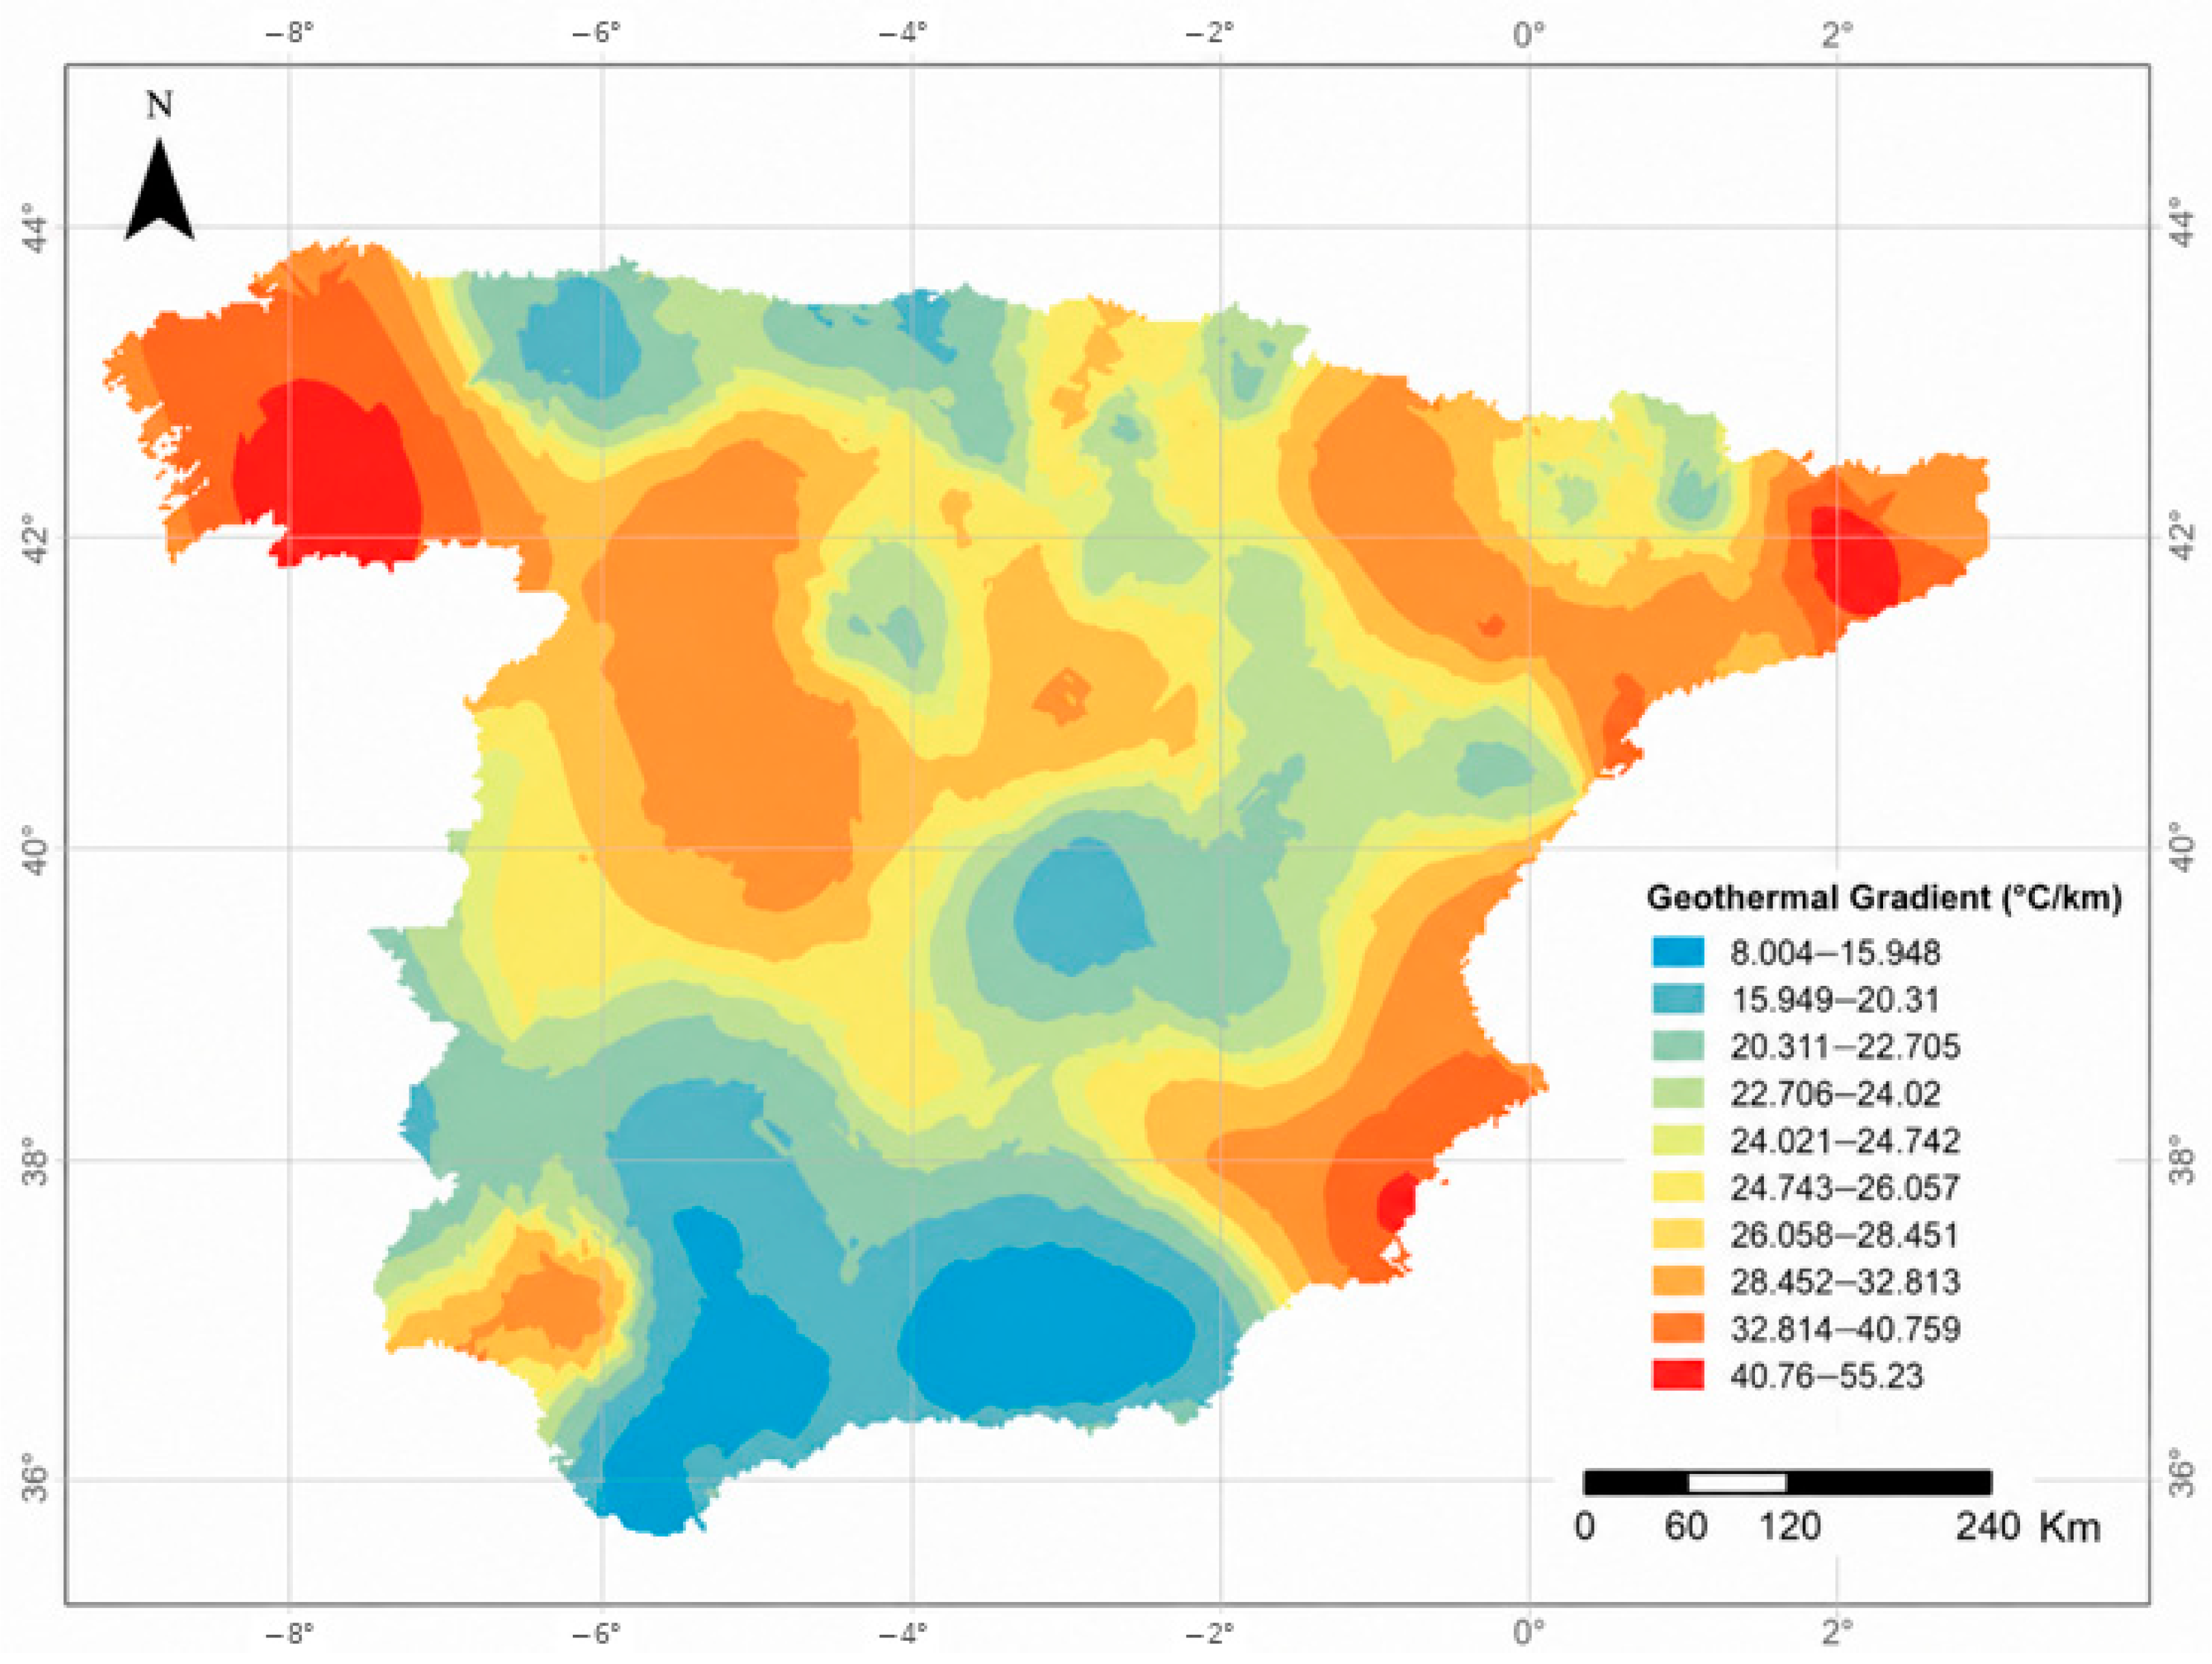
The integrated thermal database combines geothermal-gradient measurements, petroleum-well data, and IHFC records [33,34,35]. The geothermal-gradient map shown in Figure 9 was generated using anisotropic ordinary kriging with a spherical variogram, a range of approximately 0.95°, and directional anisotropy of 320°/230°, after detrending the latitudinal component and applying a normal-score transformation. Comparison with the IHFC reference points showed that 92% were consistent with the predicted geothermal-gradient distribution. The resulting map identifies four broad thermal domains, summarized in Table 5.
Figure 9.
Interpolated geothermal gradient map (°C/km) for the Iberian Peninsula. Contour interval: 5 °C/km.
Table 5.
Main geothermal domains of the Iberian Peninsula.
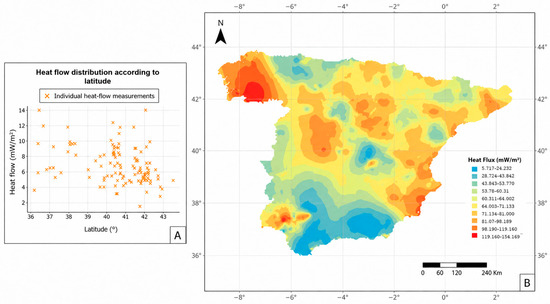
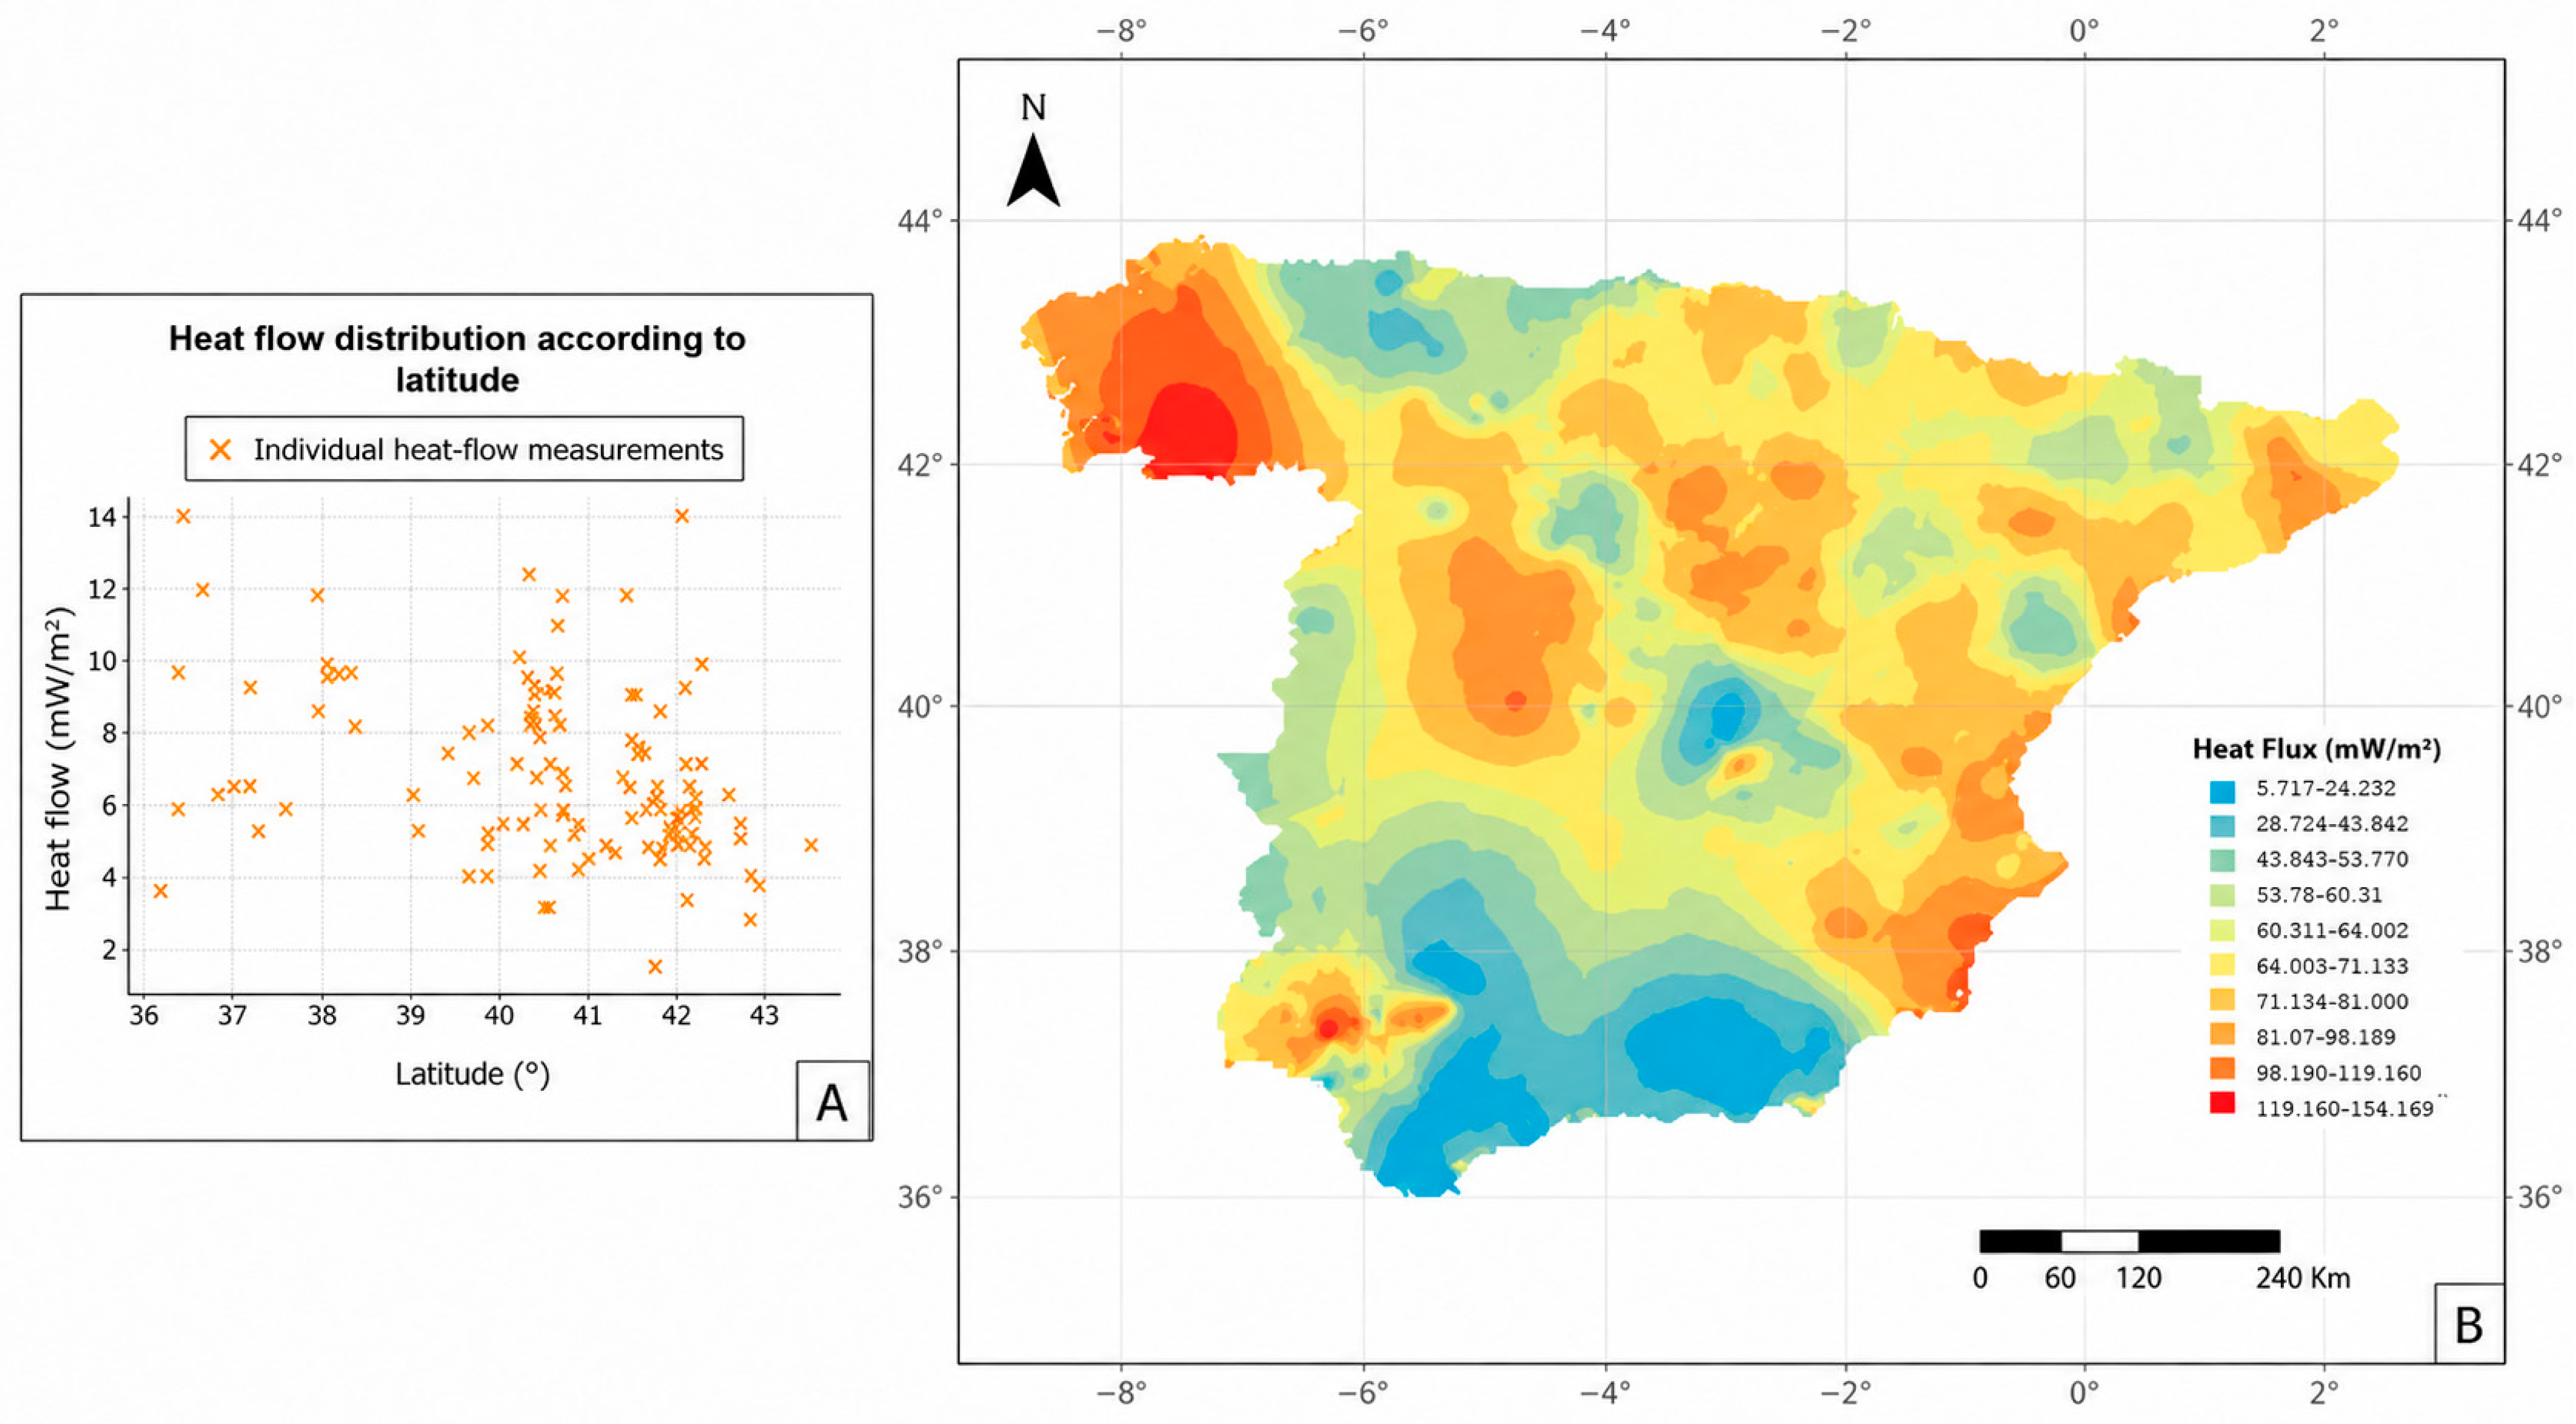
High geothermal gradients (>40 °C/km) align with reactivated tectonic domains, indicating structural and radiogenic control on thermal variability. Heat flow (Figure 10) ranges from 30 to 150 mW/m2, with a main cluster in the Meseta–Pyrenees (40–43° N) and higher values in the southern–southeastern Iberian Peninsula (36–38° N), locally exceeding 120 mW/m2 and well above the European average (~60 mW/m2).
Figure 10.
(A) Latitudinal distribution of the heat flow. (B) Interpolated geothermal heat flow map (mW m−2).
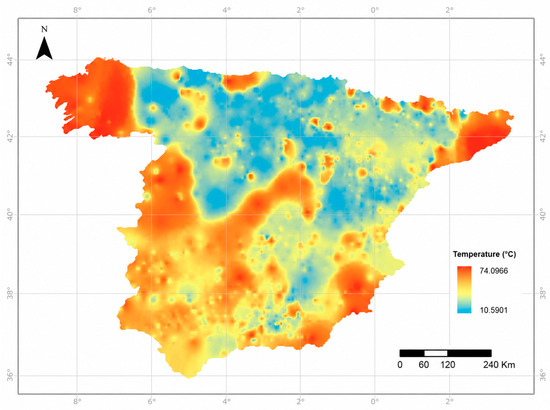
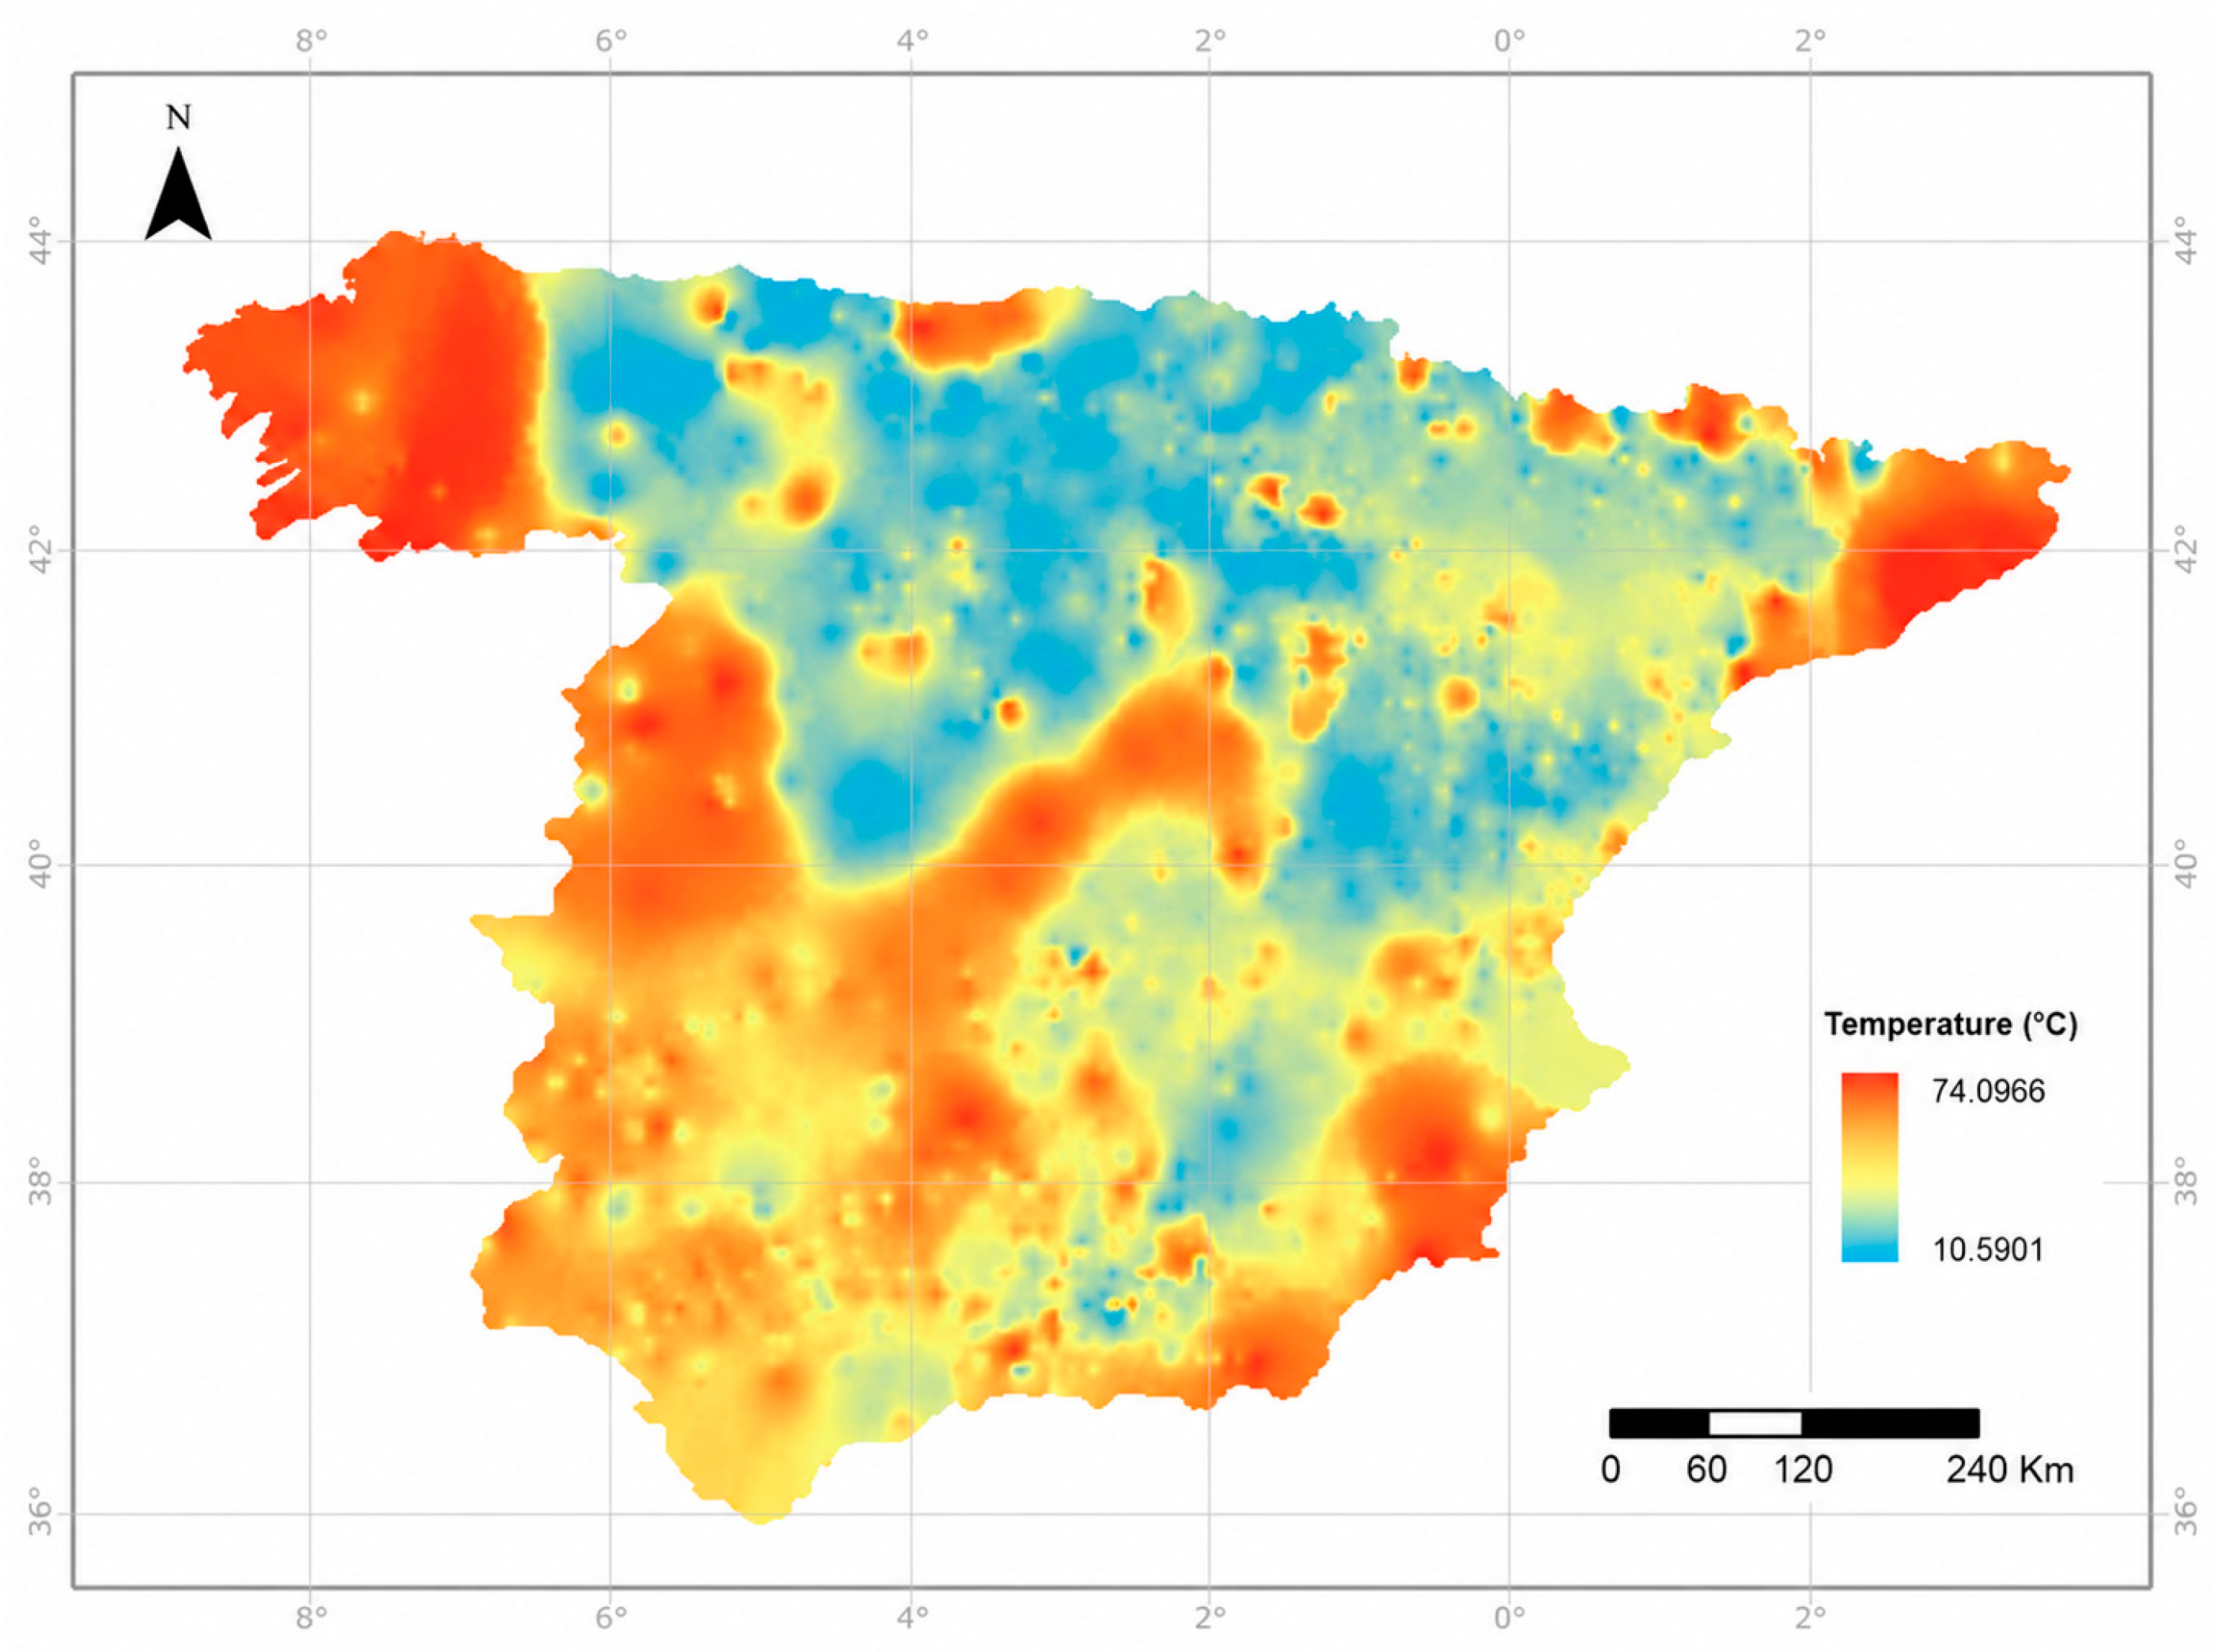
Temperature at 100 m depth (Figure 11) was used as an additional regional thermal indicator. At this depth, the temperature field is less affected by short-term surface fluctuations than near-surface observations, although it may still be influenced by lithology, groundwater circulation, topography, and local boundary conditions. The spatial distribution was obtained through IDW interpolation of 199 unique thermal measurement locations. The results show temperatures of 10–25 °C in the Cantabrian and Pyrenean areas, 25–40 °C in the major sedimentary basins, and 40–74 °C in localized anomalies associated with radiogenic granitic domains in Galicia and the Central System and with Neogene extensional sectors in Levante and Murcia. Overall, the pattern broadly agrees with the regional heat-flow distribution, although local differences remain because the two variables are controlled by additional geological and hydrogeological factors.
Figure 11.
Spatial distribution of temperature at 100 m depth across the area under study.
Based on the above, the main geodynamic sectors characterized by relatively homogeneous thermal patterns are summarized in Table 6, which compares heat flow, temperature at 100 m depth, and their geological interpretation.
Table 6.
Heat flow sectors and geological interpretation in the Iberian Peninsula.
High heat flow (>100 mW·m−2) aligns with elevated temperatures (>40 °C at 100 m) in Galicia and the Levantine sector, while low values in the Northern Meseta and southwestern Iberia (<43 mW·m−2; <25 °C) indicate a stable cold crust. Intermediate conditions in the Central System–Calatrava area (53–71 mW·m−2; 30–45 °C) reflect a moderate regime mainly driven by radiogenic heat. Overall, the broad spatial agreement between heat flow and temperature at 100 m supports the regional consistency of the thermal interpretation, while the local differences highlight the influence of thermal conductivity, lithology, groundwater circulation, and data distribution.
3.6. Integrated Fuzzy Favourability Map
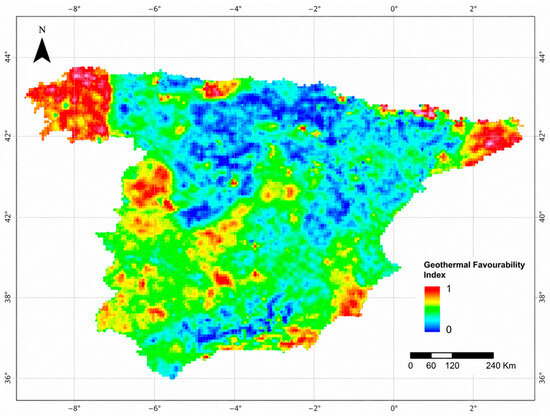
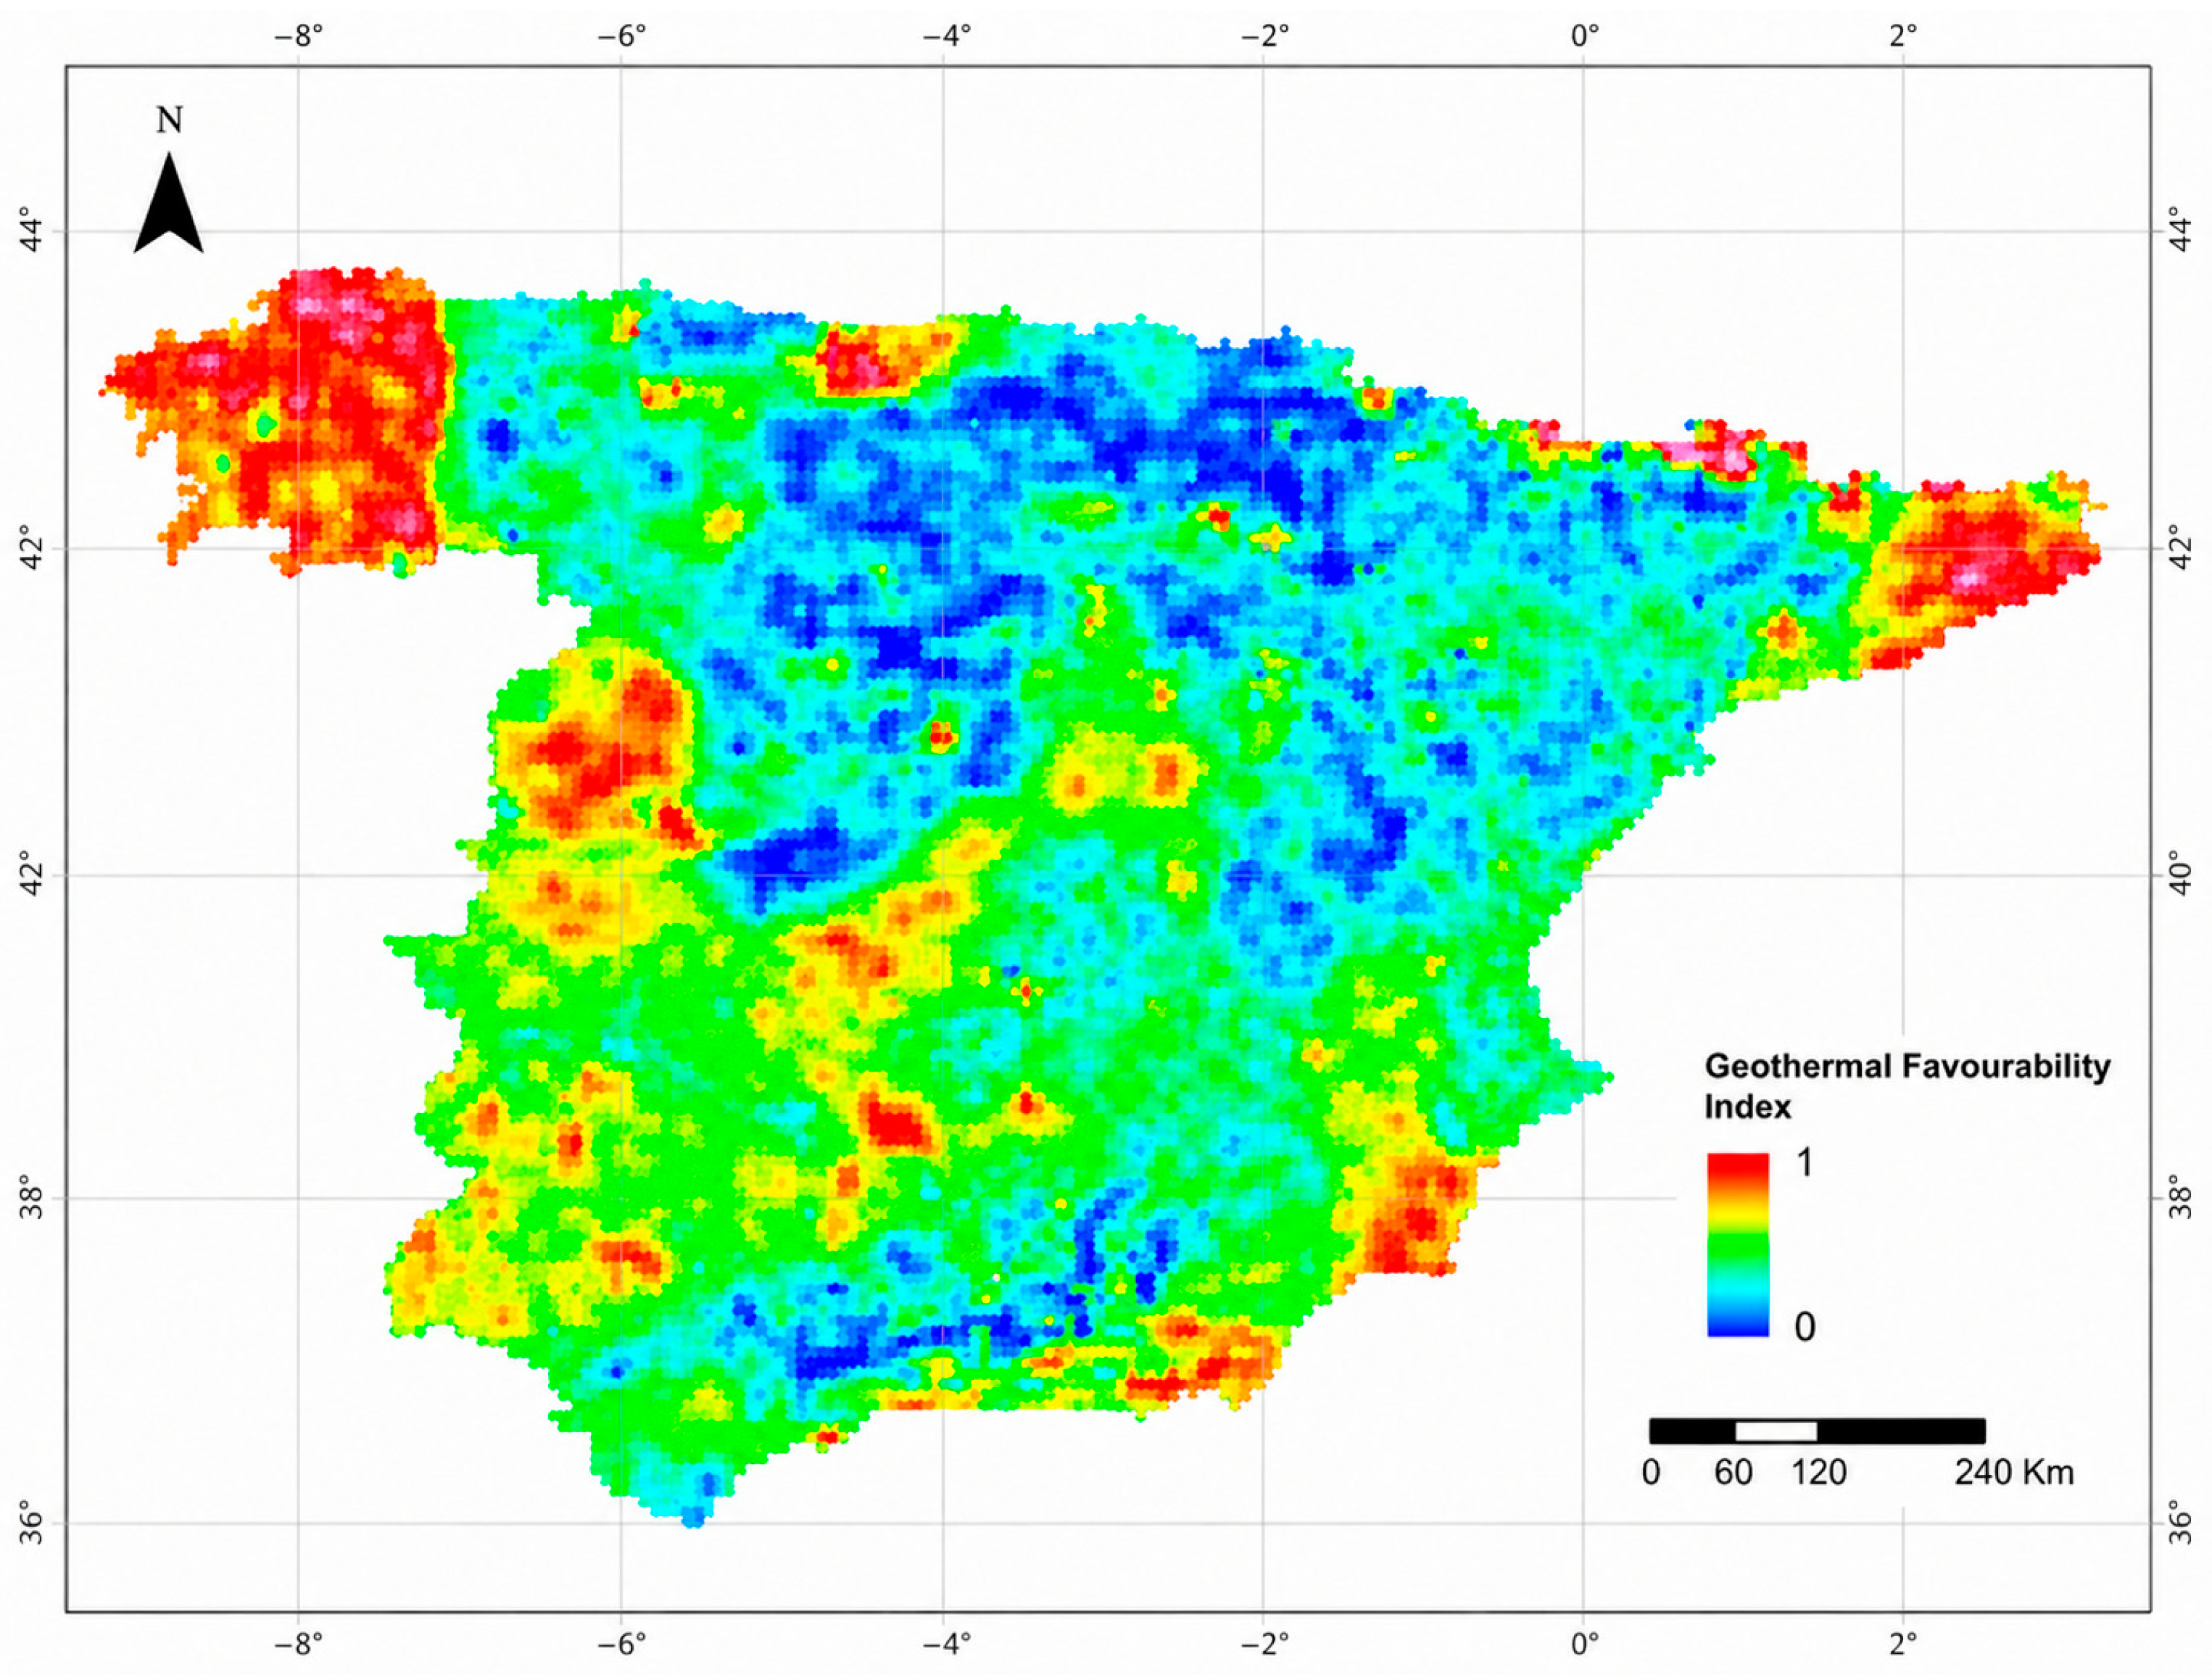
The fuzzy integration of the Geophysical Favourability Index (FI_geof) and subsurface temperature at 100 m depth was performed using FuzzyLinear and FuzzyLarge membership functions, respectively, and combined through a weighted average of 60% FI_geof and 40% temperature. A detailed description of the procedure is provided in Section 2.3.2 and in the Supplementary Material.
The sensitivity analysis showed that varying the FI_geof weight between 0.50 and 0.80 produced changes of less than 3% in the mean FI_geot value, while the main regional spatial patterns remained stable. The 0.60:0.40 configuration therefore provided a balanced representation of the geophysical structure and subsurface thermal conditions without substantially altering the location of the highest-favourability zones. The resulting FI_geot map was subsequently reclassified into five percentile-based favourability categories (Figure 12).
Figure 12.
Integrated geothermal favorability map obtained through weighted fuzzy logic.
The highest FI_geot values were concentrated in the geothermal domains of Galicia, where heat-flow values range from 119 to 154 mW m−2, and in the Levante–southeastern sector, where values range from 96 to 154 mW m−2 [40].
Spatial coincidence analysis showed that 94% of the high-heat-flow areas coincided with cells where both μ_FI_geof and μ_Temp exceeded 0.7. In addition, 92% of the 54 IHFC reference locations were consistent with the predicted favourability pattern. Because the thermal observations contributed to the construction of the temperature at 100 m surface and the IHFC reference locations also contributed to the weighting of the geophysical component, these comparisons should be interpreted as internal thermal-consistency assessments rather than as fully independent external validation.
The resulting FI_geot map represents the final integrated product of the proposed workflow and provides a continuous regional screening of geothermal favourability across the Iberian Peninsula. High values identify areas where structural and thermal indicators spatially reinforce one another, whereas lower values indicate weaker agreement between the geophysical and thermal components. The map should therefore be interpreted as a prioritization tool for subsequent local-scale investigation rather than as direct evidence of an exploitable geothermal resource.
4. Discussion
4.1. Coherence Between Potential Fields and Lithospheric Structure
The spatial correspondence observed among the gravity and magnetic products reflects, at least partly, the regional-scale crustal architecture of the Iberian Peninsula. Broad negative Bouguer anomalies over major sedimentary domains, including sectors of the Ebro and Guadalquivir basins, are consistent with lower-density crustal materials and sedimentary infill, whereas relatively positive anomalies in parts of the Iberian Massif may reflect denser basement units and lateral variations in crustal density [41]. Sharp anomaly gradients along the margins of the Pyrenees, Betic Cordillera, and major sedimentary basins further suggest the influence of crustal contacts and inherited tectonic boundaries.
The high spectral coherence values among Bouguer anomaly, pseudogravity, RTP, and the vertical derivative indicate that these processed layers share broad spatial wavelengths and regional structural patterns. However, their magnitude cannot be attributed exclusively to a common lithological origin. The use of a common grid, normalization, interpolation, and potential-field transformations introduces partial mathematical and spatial dependence among the datasets, particularly because pseudogravity is derived directly from the magnetic field. Consequently, spectral coherence values above 0.98–0.99 should be interpreted as evidence of strong spatial correspondence rather than direct equivalence between density and magnetic susceptibility.
Despite the methodological effects discussed above, the coincidence of coherent anomaly belts with major geological domains suggests that part of the shared response is geologically meaningful. Structures containing simultaneous density and magnetic-susceptibility contrasts, such as mafic intrusions, metamorphic basement blocks, lithological contacts, and fault-controlled zones, may contribute to the observed spatial patterns. The RTP transformation highlights regional magnetic belts that may reflect contrasts in magnetic mineral content, lithology, alteration, and source depth, whereas pseudogravity facilitates comparison with the gravity field but should not be interpreted as a direct estimate of subsurface density. Likewise, the approximately north–south directional structure identified in the magnetic datasets may reflect inherited Variscan and Alpine structural fabrics. These interpretations remain regional and indirect and require confirmation through local geological and geophysical observations.
4.2. Coherence Between Subsurface Temperature and Heat Flow
The integration of temperature at 100 m depth into the fuzzy favourability analysis provides a complementary assessment of the regional thermal pattern. Broad spatial agreement is observed in Galicia, where heat-flow values range from 119 to 154 mW m−2 and temperatures at 100 m depth range from 40 to 74 °C, and in the Levante region, where heat flow ranges from 96 to 154 mW m−2 and temperatures at 100 m depth range from 35 to 55 °C. These coincident high values support the internal consistency of the thermal indicators used in the model, although temperature at 100 m should not be considered an independent validation dataset because it forms part of the fuzzy integration [20].
In contrast, the Northern Meseta shows comparatively low temperatures at 100 m depth, between 15 and 25 °C, together with low to moderate heat-flow values of 22–43 mW m−2. This behaviour is consistent with the comparatively high thermal conductivity of granitic and gneissic formations, approximately 2.8–3.4 W m−1 K−1, which may favour heat diffusion and reduce the geothermal gradient developed for a given heat-flow value [31].
These regional contrasts show that subsurface temperature and heat flow are related but not spatially equivalent. Their correspondence is additionally controlled by thermal conductivity, lithology, groundwater circulation, topography, near-surface boundary conditions, and the distribution and depth of the available borehole measurements. Therefore, the combined interpretation of temperature, heat flow, geothermal gradient, and thermal conductivity provides a more reliable basis for geothermal favourability assessment than the use of any single thermal variable.
4.3. Geothermal Implications of the Favourability Index
The integrated favourability index combines satellite-derived potential-field information with subsurface thermal data through spatial interpolation and weighted fuzzy logic. High FI_geot values broadly coincide with regions characterized by elevated heat flow (>96 mW m−2) and geothermal gradients above 30 °C km−1, particularly in Galicia and the Levante–Betic sector. This spatial agreement supports the regional consistency of the integrated index and indicates that favourable thermal conditions commonly occur where geophysical and thermal indicators reinforce one another.
The correspondence between high FI_geot values and major structural domains suggests that faults, fractured zones, intrusive bodies, crustal contacts, and lithological contrasts may contribute to the observed geothermal favourability. However, the index should not be interpreted as demonstrating a unique or direct causal relationship between density contrasts, magnetic susceptibility, and subsurface heat. Instead, it represents a regional screening tool that identifies areas where multiple indirect indicators coincide [42,43].
Local mismatches remain evident, particularly in parts of Galicia, where high heat-flow values exceeding 140 mW m−2 may coincide with only moderate FI_geof or FI_geot values. These discrepancies are consistent with geothermal anomalies dominated by radiogenic heat production in peraluminous granites, which may generate strong thermal responses without producing equally pronounced magnetic contrasts. This limitation indicates that the coherence-based geophysical component is more sensitive to structures with combined density and magnetic-susceptibility contrasts than to purely radiogenic heat sources.
Therefore, the highest-favourability classes should be interpreted as priority areas for further investigation rather than as direct evidence of exploitable geothermal resources. Local-scale validation using geological mapping, hydrogeological data, geochemistry, seismic or magnetotelluric surveys, and exploratory drilling would still be required before resource development.
Previous geothermal assessments in the Iberian Peninsula have addressed different components of geothermal potential, including deep EGS resource estimation, magnetic-derived thermal characterization, predictive subsurface-temperature mapping, shallow geothermal energy quantification, and district-scale hydrogeothermal favourability. Table 7 compares these approaches in terms of study scale, input information, methodology, validation or uncertainty assessment, and reported quantitative outputs. Because the studies evaluate different geothermal-resource types and apply non-equivalent performance criteria, their numerical indicators should not be interpreted as directly comparable measures of model accuracy.
Table 7.
Comparison of previous geothermal assessment approaches applied in the Iberian Peninsula.
The comparison indicates that previous Iberian studies have generally focused on individual components of geothermal assessment, such as deep thermal-resource estimation, subsurface-temperature prediction, shallow-energy quantification, or local hydrogeothermal screening. In contrast, the present study quantitatively compares alternative global gravity and magnetic products, harmonizes them within a common spatial framework, derives a geophysical index from their spectral correspondence, and integrates this information with temperature at 100 m depth through weighted fuzzy logic. The main contribution is therefore not a direct estimate of recoverable energy or subsurface temperature, but a continuous regional screening of areas where independent structural and thermal indicators spatially reinforce one another.
Accordingly, the highest-favourability classes should be interpreted as priority areas for subsequent investigation rather than as direct evidence of exploitable geothermal resources. Local-scale assessment using geological mapping, hydrogeological and geochemical information, higher-resolution geophysical surveys, and exploratory drilling would still be required before any resource-development decision.
4.4. Methodological Limitations and Uncertainty
Although the results are consistent with previous regional studies and demonstrate the applicability of the proposed workflow to the Iberian Peninsula, several methodological limitations must be acknowledged. The thermal database is spatially uneven, with borehole observations concentrated in selected areas, which increases interpolation uncertainty in poorly sampled regions. In addition, some historical records lack site-specific thermal-conductivity measurements, requiring the use of representative or constant values that may not capture local lithological variability.
Moreover, the 199 thermal measurement locations used to generate the temperature at 100 m surface were not statistically independent of the final FI_geot model. Consequently, the spatial agreement with heat-flow and geothermal-gradient information should be interpreted as an internal thermal-consistency assessment rather than as fully independent external validation.
Further uncertainty arises from the spatial resolution and processing of the global gravity and magnetic products. Resampling, interpolation, normalization, and potential-field transformations were required to establish a common spatial framework, but these procedures do not increase the intrinsic physical resolution of the original datasets. The geophysical favourability component is also based mainly on gravity–magnetic spatial correspondence and therefore does not explicitly include other controls on geothermal resources, such as permeability, fluid availability, reservoir depth, hydraulic connectivity, or geochemical conditions.
The remaining mismatch between the model and some IHFC reference points was mainly observed in areas characterized by elevated radiogenic heat production but only moderate geophysical favourability. This indicates that gravity–magnetic coherence may underestimate geothermal favourability where thermal anomalies are predominantly controlled by radiogenic crustal sources rather than by strong density or magnetic-susceptibility contrasts. Consequently, FI_geot should be interpreted as a regional screening and prioritization tool rather than as direct evidence of an exploitable geothermal resource. Future work should incorporate denser thermal observations, site-specific thermal properties, permeability and hydrogeological information, and complementary geophysical methods such as seismic and magnetotelluric surveys, followed by local field validation and exploratory drilling.
The uncertainty assessment performed in this study focused primarily on the sensitivity of FI_geot to the relative weighting of FI_geof and temperature at 100 m depth. A complete propagation of uncertainty from the original gravity and magnetic products, geostatistical interpolation, thermal measurements, and fuzzy-membership parameters was not undertaken. Future work should address these components through spatially explicit probabilistic or Monte Carlo approaches.
5. Conclusions
This study developed a regional-scale framework for assessing geothermal favourability across the Iberian Peninsula by integrating global gravity and magnetic products with subsurface thermal information. The quantitative comparison showed that EGM2008 and EMAG2 provided the most suitable reference datasets within their respective groups, whereas WGM2012 and WDMAM2 were retained as complementary products for representing broader regional variability.
The geostatistical workflow enabled the harmonization of datasets with different spatial resolutions and sampling characteristics, producing internally consistent potential-field surfaces. The processed gravity and magnetic layers reproduced major regional geological patterns, including sedimentary basin lows, crustal gradients, and structurally complex domains associated with the Iberian Massif, the Pyrenees, and the Betic Cordillera.
The high correlations observed among Bouguer anomaly, pseudogravity, RTP, and vertical-derivative products indicate strong spatial correspondence among the processed layers. However, these relationships are influenced by their common spatial support, normalization, interpolation, and mathematical dependence, and should therefore not be interpreted as direct physical equivalence between density and magnetic susceptibility.
The integration of FI_geof with temperature at 100 m depth through weighted fuzzy logic identified the highest geothermal favourability mainly in Galicia and the Levante–Betic sector. These areas also coincide with elevated heat-flow values and geothermal gradients, supporting the regional consistency of the integrated index. Approximately 20% of the study area was classified within the highest favourability category.
The proposed FI_geot should be interpreted as a regional screening and prioritization tool rather than as direct evidence of an exploitable geothermal resource. Its main limitations arise from the uneven spatial distribution of thermal observations, the intrinsic resolution of the global potential-field products, and the reduced sensitivity of gravity–magnetic coherence to geothermal anomalies dominated by radiogenic heat production. Local geological, hydrogeological, geochemical, and geophysical investigations remain necessary before resource development.
Overall, the methodology provides a reproducible approach for identifying priority areas for further geothermal exploration in large and incompletely characterized regions.
Supplementary Materials
The following supporting information can be downloaded at https://www.mdpi.com/article/10.3390/app16178726/s1.
Author Contributions
All authors (S.A.C.V., C.S.B., M.Á.M.-G.) contributed to the conceptualization, methodology, analysis, and writing of this manuscript. All authors have read and agreed to the published version of the manuscript.
Funding
This research was supported by the GEO-ROAD project (PID2022-142097OA-I00). Miguel Ángel Maté-González and Cristina Sáez Blázquez acknowledge the grants RYC2021-034813-I and RYC2021-034720-I, respectively, funded by the Ministerio de Ciencia e Innovación and by the European Union ‘NextGenerationEU’/PRTR.
Institutional Review Board Statement
Not applicable.
Informed Consent Statement
Not applicable.
Data Availability Statement
The data presented in this study are available upon request from the corresponding author.
Conflicts of Interest
The authors declare no conflicts of interest.
References
- Sharmin, T.; Khan, N.R.; Akram, M.S.; Ehsan, M.M. A state-of-the-art review on geothermal energy extraction, utilization, and improvement strategies: Conventional, hybridized, and enhanced geothermal systems. Int. J. Thermofluids 2023, 18, 100323. [Google Scholar] [CrossRef] [Scilit]
- Wang, J.; Pang, Z.; Cheng, Y.; Huang, Y.; Jiang, G.; Lu, Z.; Kong, Y. Current state, utilization and prospective of global geothermal energy. Sci. Technol. Rev. 2023, 41, 5–11. [Google Scholar]
- Lund, J.W.; Huttrer, G.W.; Toth, A.N. Characteristics and trends in geothermal development and use, 1995 to 2020. Geothermics 2022, 105, 102522. [Google Scholar] [CrossRef] [Scilit]
- Gutiérrez-Negrín, L.C. Evolution of worldwide geothermal power 2020–2023. Geotherm. Energy 2024, 12, 14. [Google Scholar] [CrossRef] [Scilit]
- Sircar, A.; Bist, N.; Yadav, K. A comprehensive review on exploration and exploitation of offshore geothermal energy. Mar. Syst. Ocean Technol. 2023, 17, 135–146. [Google Scholar] [CrossRef] [Scilit]
- Abeysinghe, A.M.A.M.; Thilakarathna, M.P.; Dissanayake, C.B.; Subasinghe, N.D. Application of geological, geochemical, and geophysical techniques in geothermal explorations of Sri Lanka—A review. J. Geol. Soc. Sri Lanka 2023, 23, 11–22. [Google Scholar]
- Blázquez, C.S.; Nieto, I.M.; González MÁ, M.; García, P.C.; Martín, A.F.; González-Aguilera, D. Geophysical exploration for shallow geothermal applications: A case study in Artà,(Balearic Islands, Spain). Geothermics 2022, 105, 102517. [Google Scholar] [CrossRef] [Scilit]
- Sáez Blázquez, C.; Martín Nieto, I.; Carrasco, J.; Carrasco, P.; Porras, D.; Maté-González, M.Á.; Farfán Martín, A.; González-Aguilera, D. Applying Deep Electrical-Resistivity Tomography Techniques for the Exploration of Medium-and Low-Geothermal Energy Resources. Energies 2024, 17, 1836. [Google Scholar] [CrossRef] [Scilit]
- Sedano-Cibrián, J.; Pérez-Álvarez, R.; de Luis-Ruiz, J.M.; Pereda-García, R.; Salas-Menocal, B.R. Thermal Water Prospection with UAV, Low-Cost Sensors and GIS. Application to the Case of La Hermida. Sensors 2022, 22, 6756. [Google Scholar] [CrossRef] [Scilit] [PubMed]
- Alqahtani, F.; Aboud, E.; Ehsan, M.; Naseer, Z.; Abdulfarraj, M.; Abdelwahed, M.F.; El-Masry, N. Geothermal exploration using remote sensing, surface temperature, and geophysical data in Lunayyir volcanic field, Saudi Arabia. Sustainability 2023, 15, 7645. [Google Scholar] [CrossRef] [Scilit]
- Gaber, G.M.; Saleh, S.; Kotb, A. Integrating radiometric and aeromagnetic data for assessment of geothermal potential: A case study in Central Eastern Desert, Egypt. Acta Geophys. 2025, 73, 235–251. [Google Scholar] [CrossRef] [Scilit]
- Darmawan, D.; Daud, Y.; Iskandar, C. Identification of geological structure based on gravity and remote sensing data in “X” geothermal field. AIP Conf. Proc. 2021, 2320, 040004. [Google Scholar] [CrossRef] [Scilit]
- Abdelrahman, K.; Ekwok, S.E.; Ulem, C.A.; Eldosouky, A.M.; Al-Otaibi, N.; Hazaea, B.Y.; Andráš, P.; Akpan, A.E. Exploratory mapping of the geothermal anomalies in the neoproterozoic Arabian Shield, Saudi Arabia, using magnetic data. Minerals 2023, 13, 694. [Google Scholar] [CrossRef] [Scilit]
- Seward, A.; Ashraf, S.; Reeves, R.; Bromley, C. Improved environmental monitoring of surface geothermal features through comparisons of thermal infrared, satellite remote sensing and terrestrial calorimetry. Geothermics 2018, 73, 60–73. [Google Scholar] [CrossRef] [Scilit]
- Pastorutti, A.; Braitenberg, C. A geothermal application for GOCE satellite gravity data: Modelling the crustal heat production and lithospheric temperature field in Central Europe. Geophys. J. Int. 2019, 219, 1008–1031. [Google Scholar] [CrossRef] [Scilit]
- Larasati, N.E.; Laesanpura, A.; Sugianto, A. Integrative Analysis of the Geothermal Structure in Kepahiang: Insights from Magnetotelluric, Gravity, and Remote Sensing Techniques. J. Penelit. Pendidik. IPA 2023, 9, 5971–5978. [Google Scholar] [CrossRef] [Scilit]
- Zhao, J.; Zeng, Z.; Zhou, S.; Yan, J.; An, B. 3-D Inversion of Gravity Data of the Central and Eastern Gonghe Basin for Geothermal Exploration. Energies 2023, 16, 2277. [Google Scholar] [CrossRef] [Scilit]
- Soekarno, H.; Pranoto, B.; Restiana, A.; Martha, A.A.; Setiadi, T.A.P.; Hudayat, N.; Rais, A.F.; Suwarno, Y.; Turmudi, T.; Sutejo, B. Identifying Geological Fault Structures Using GGMplus Satellite Data and Derivative Methods to Characterize Mount Endut Geothermal Systems via 3D-Inversion Gravity Modeling. Geomat. Environ. Eng. 2025, 19, 31–62. [Google Scholar] [CrossRef] [Scilit]
- Diez, J.B.; Bourquin, S.; Broutin, J.; Ferrer, J. The Iberian Permian Triassic ‘Buntsandstein’of the Aragonian Branch of the Iberian range (Spain) in the West-European sequence stratigraphical framework: A combined palynological and sedimentological approach. Bull. Société Géologique Fr. 2007, 178, 179–195. [Google Scholar] [CrossRef] [Scilit]
- Torne, M.; Jiménez-Munt, I.; Negredo, A.M.; Fullea, J.; Vergés i Masip, J.; Marzán, I.; Alcalde, J.; Gómez-Rivas, E.; García de la Noceda, C. The Iberian thermal lithosphere and perspectives on deep geothermal studies. Geo-Temas 2024, 20, 603–606. [Google Scholar]
- Gallart, J.; Azor, A.; Fernández, M.; Pulgar, J.A. Iberia geodynamics: An integrative approach from the Topo-Iberia framework. Tectonophysics 2015, 663, 1–4. [Google Scholar] [CrossRef] [Scilit]
- Custódio, S.; Dias, N.A.; Caldeira, B.; Carrilho, F.; Carvalho, S.; Corela, C.; Diaz, J.; Narciso, J.; Madureira, G.; Matias, L.; et al. Ambient noise recorded by a dense broadband seismic deployment in western Iberia. Bull. Seismol. Soc. Am. 2014, 104, 2985–3007. [Google Scholar] [CrossRef] [Scilit]
- Colmenar-Santos, A.; Folch-Calvo, M.; Rosales-Asensio, E.; Borge-Diez, D. The geothermal potential in Spain. Renew. Sustain. Energy Rev. 2016, 56, 865–886. [Google Scholar] [CrossRef] [Scilit]
- Vargas, S.A.C.; Blázquez, C.S.; Herranz, D.H.; Maté-González, M.Á. High-resolution mapping of shallow geothermal resources in Spain through multivariate spatial analysis. Geothermics 2026, 134, 103524. [Google Scholar] [CrossRef] [Scilit]
- Reigber, C.; Lühr, H.; Schwintzer, P. (Eds.) First CHAMP Mission Results for Gravity, Magnetic and Atmospheric Studies; Springer Science & Business Media: Berlin/Heidelberg, Germany, 2012. [Google Scholar]
- Mandea, M. Magnetic satellite missions: Where have we been and where are we going? Comptes Rendus Geosci. 2006, 338, 1002–1011. [Google Scholar] [CrossRef] [Scilit]
- Guo, X.; Lian, Y.; Sun, Y.; Zhou, H.; Luo, Z. Assessment of the added value of the GOCE GPS data on the GRACE monthly gravity field solutions. Remote Sens. 2024, 16, 1586. [Google Scholar] [CrossRef] [Scilit]
- Grüne, C.R.; Whaler, K.A.; Madsen, F.D. Detecting low-latitude outer core-surface waves with 25 years of satellite secular variation data. Phys. Earth Planet. Inter. 2025, 367, 107435. [Google Scholar] [CrossRef] [Scilit]
- Muravyev, L.A. Identification of the largest impact structures in modern global datasets of geophysical fields. In Proceedings of the Geoinformatics: Theoretical and Applied Aspects 2020, Kyiv, Ukraine, 11–14 May 2020; European Association of Geoscientists & Engineers: Houten, The Netherlands, 2020; Volume 2020, pp. 1–5. [Google Scholar]
- IGME Mapa Geológico Continuo de España (GEODE) a Escala 1:50.000. Instituto Geológico y Minero de España. 2015. Available online: https://info.igme.es/cartografiadigital/geologica/Geode.aspx?language=en (accessed on 1 June 2025).
- Clauser, C.; Huenges, E. Thermal conductivity of rocks and minerals. In Rock Physics & Phase Relations: A Handbook of Physical Constants; AGU Reference Shelf 3; American Geophysical Union: Washington, DC, USA, 1995; pp. 105–126. [Google Scholar]
- Telford, W.M.; Geldart, L.P.; Sheriff, R.E. Applied Geophysics, 2nd ed.; Cambridge University Press: Cambridge, UK, 1990. [Google Scholar]
- Albert-Beltran, J.F. Component Parts of the World Heat Flow Data Collection [Dataset]. PANGAEA. 1979. Available online: https://doi.pangaea.de/10.1594/PANGAEA.796248 (accessed on 15 July 2025).
- Instituto Geológico y Minero de España (IGME-CSIC). Base de Datos de Sondeos Profundos y Documentación Geológica del Subsuelo en España. Madrid, Spain. 2024. Available online: https://www.igme.es/datos-y-mapas/bases-de-datos/ (accessed on 15 September 2025).
- Fuchs, S.; Norden, B.; Artemieva, I.; Chiozzi, P.; Dedecek, P.; Demezhko, D.; Förster, A.; Gola, G.; Gosnold, W.; Hamza, V.; et al. The Global Heat Flow Database: Release 2021. 2021. Available online: https://oceanrep.geomar.de/id/eprint/53736/ (accessed on 25 September 2025).
- Blakely, R.J.; Christiansen, R.L.; Guffanti, M.; Wells, R.E.; Donnelly-Nolan, J.M.; Muffler, L.P.; Clynne, M.A.; Smith, J.G. Gravity anomalies, Quaternary vents, and Quaternary faults in the southern Cascade Range, Oregon and California: Implications for arc and backarc evolution. J. Geophys. Res. Solid Earth 1997, 102, 22513–22527. [Google Scholar] [CrossRef] [Scilit]
- Von Frese, R.R.; Hinze, W.J.; Braile, L.W.; Luca, A.J. Spherical-Earth gravity and magnetic anomaly modeling by Gauss-Legendre quadrature integration. J. Geophys. 1981, 49, 234–242. [Google Scholar]
- Carranza, E.J.M.; Hale, M. Geologically constrained fuzzy mapping of gold mineralization potential, Baguio district, Philippines. Nat. Resour. Res. 2001, 10, 125–136. [Google Scholar] [CrossRef] [Scilit]
- Fernàndez, M.; Marzán, I.; Correia, A.; Ramalho, E. Heat flow, heat production, and lithospheric thermal regime in the Iberian Peninsula. Tectonophysics 1998, 291, 29–53. [Google Scholar] [CrossRef] [Scilit]
- Carranza, E.J.M. Geochemical Anomaly and Mineral Prospectivity Mapping in GIS; Elsevier: Amsterdam, The Netherlands, 2008; Volume 11. [Google Scholar]
- Torne, M.; Fernàndez, M.; Vergés, J.; Ayala, C.; Salas, M.C.; Jiménez-Munt, I.; Buffett, G.G.; Díaz, J. Crust and mantle lithospheric structure of the Iberian Peninsula deduced from potential field modeling and thermal analysis. Tectonophysics 2015, 663, 419–433. [Google Scholar] [CrossRef] [Scilit]
- Noorollahi, Y.; Itoi, R.; Fujii, H.; Tanaka, T. GIS integration model for geothermal exploration and well siting. Geothermics 2008, 37, 107–131. [Google Scholar] [CrossRef] [Scilit]
- Moghaddam, M.K.; Samadzadegan, F.; Noorollahi, Y.; Sharifi, M.A.; Itoi, R. Spatial analysis and multi-criteria decision making for regional-scale geothermal favorability map. Geothermics 2014, 50, 189–201. [Google Scholar] [CrossRef] [Scilit]
- Chamorro, C.R.; García-Cuesta, J.L.; Mondéjar, M.E.; Linares, M.M. An estimation of the enhanced geothermal systems potential for the Iberian Peninsula. Renew. Energy 2014, 66, 1–14. [Google Scholar] [CrossRef] [Scilit]
- Mirfallah Lialestani, S.P.; Parcerisa, D.; Himi, M.; Abbaszadeh Shahri, A. Generating 3D Geothermal Maps in Catalonia, Spain Using a Hybrid Adaptive Multitask Deep Learning Procedure. Energies 2022, 15, 4602. [Google Scholar] [CrossRef] [Scilit]
- Ramos-Escudero, A.; García-Cascales, M.S.; Urchueguía, J.F. Evaluation of the Shallow Geothermal Potential for Heating and Cooling and Its Integration in the Socioeconomic Environment: A Case Study in the Region of Murcia, Spain. Energies 2021, 14, 5740. [Google Scholar] [CrossRef] [Scilit]
- Carreira, P.M.; Marques, J.M.; Marques, J.E.; Chaminé, H.I.; Fonseca, P.E.; Santos, F.M.; Moura, R.M.; Carvalho, J.M. Defining the dynamics of groundwater in Serra da Estrela Mountain area, central Portugal: An isotopic and hydrogeochemical approach. Hydrogeol. J. 2011, 19, 117–131. [Google Scholar] [CrossRef] [Scilit]

Disclaimer/Publisher’s Note: The statements, opinions and data contained in all publications are solely those of the individual author(s) and contributor(s) and not of MDPI and/or the editor(s). MDPI and/or the editor(s) disclaim responsibility for any injury to people or property resulting from any ideas, methods, instructions or products referred to in the content. |
© 2026 by the authors. Licensee MDPI, Basel, Switzerland. This article is an open access article distributed under the terms and conditions of the Creative Commons Attribution (CC BY) license.