


Featured Application
The results can support segment-specific winter ventilation and filtration assessment in metro operation, particularly in sections where passenger load, surface–tunnel air exchange, and main ventilation pathways affect CO2, heat, humidity, and particulate exposure.
Abstract
This study evaluates winter in-car microclimate and aerosol conditions in a Prague Metro line C M1.3 car under real operation. Five Letňany–Háje runs were divided into 19 inter-station segments. TDC, PM10, PM4, PM2.5, PM1, CO2, air temperature, relative humidity, A-weighted sound pressure level, and occupancy were recorded. Aerosol fractions were measured in separate runs and treated as operational optical estimates, not as reference-equivalent or simultaneous size-distribution data. Temperature, relative humidity, CO2, sound level, and occupancy were aggregated to one value per run and segment and analyzed by randomized-block ANOVA with run as the block. Significant segment effects were found for occupancy, CO2, relative humidity, and air temperature; LA showed no stable segment effect. Central segments showed passenger-related CO2 and heat accumulation, whereas aerosol maxima did not coincide with maximum occupancy. Larger cut-point PM runs showed greater dispersion and episodic peaks, consistent with surface–tunnel exchange, resuspension, and station/ventilation pathways. Across 19 segment means, occupancy correlated more strongly with CO2 than with air temperature (r = 0.837 vs. 0.633); after Run adjustment, the slopes were 8.494 ppm/passenger and 0.011 °C/passenger, respectively. An overnight Vltavská–Florenc transect provided qualitative evidence of local ventilation influence near Štvanice. The study is a winter, vehicle-specific segmental case study.
1. Introduction
Underground rail transport is an important component of sustainable urban mobility, and in megacities it is often one of the main components, as it transfers large passenger flows away from the street network. This benefit does not remove the need to assess conditions within the system. Metro tunnels, stations, and cars form connected microenvironments in which limited air exchange, passenger load, and train operation can generate spatially variable exposure to heat, CO2, particulate matter, and noise [1,2,3,4,5,6,7,8].
Previous studies indicate that particulate matter in metro systems is often higher than in above-ground environments and that its composition differs from typical urban aerosol, with substantial contributions from wheel, rail, and brake wear [2,3,4,5,9,10,11,12,13,14,15,16,17,18,19,20,21,22]. For Prague, Braniš reported that PM10 was highest in metro trains, lower in underground station spaces, and lowest outdoors; correlations among outdoor, station, and train concentrations further suggested that ambient sources may influence the underground system [2].
Ventilation is therefore a central interpretive factor. Field measurements and simulations in a subway system further show that draught-relief shaft length, cross-section, and operating conditions can materially influence piston-effect-driven tunnel ventilation efficiency [23]. Ventilation can dilute exhaled CO2 and heat, but it can also couple the vehicle and tunnel environment with surface air and resuspend deposited dust. The piston effect caused by moving trains, local ventilation shafts, station geometry, and the surrounding urban environment can act together, making segment-based interpretation more appropriate than a single network-wide average [6,7,24,25,26,27,28].
Real-time optical particle monitors are suitable for identifying short-term and spatial changes in transport microenvironments, but their readings should be treated as operational mass-concentration estimates unless locally corrected against a gravimetric or reference method [2,29,30,31,32,33,34,35,36,37,38,39]. This limitation is important here because the aerosol fractions were measured descriptively in separate runs.
In-car microclimate is also governed by passenger occupancy. Gao et al. [40] showed in urban rail carriages that the number of passengers explained 97% of the CO2 concentration variation and that recursive modeling better represented cumulative CO2 accumulation than an instantaneous linear model. CO2 responds directly to passenger respiration and ventilation effectiveness; air temperature responds more slowly because of metabolic heat, train operation, and thermal storage in the car and tunnel environment; relative humidity is affected both by passengers and by the moisture content of supplied air [28,41,42,43].
EN 14750:2024 [44] was therefore used here as the primary rail-specific normative framework for the in-car microclimate. The standard is applicable to urban rolling stock equipped with heating, ventilation and/or cooling systems and establishes comfort parameters, performance values and validation/type-test methods for passenger- and staff-accessible areas [44]. In the present paper, air temperature, relative humidity and CO2 are interpreted as the main field-measured indicators of this rail-specific comfort and ventilation framework. The standard is not treated as a generic building-comfort citation, but as the reference context for judging whether the observed winter values indicate adequate thermal and air-quality performance in service.
The aim of this study was to quantify winter in-car microclimatic and aerosol conditions on Prague Metro line C and to interpret them at the inter-station segment level. The analysis focuses on air temperature, relative humidity, CO2, TDC, PM10, PM4, PM2.5, PM1, A-weighted sound pressure level, and passenger occupancy. Particular attention is given to whether the observed patterns are primarily related to passenger load, tunnel ventilation, surface–environment coupling, or short-term operational effects.
2. Materials and Methods
2.1. Description of the Investigated Transport Line C in the Prague Metro
The research and measurements were carried out in the Prague Metro system on line C along the entire route between terminal stations Letňany and Háje. Line C has 20 stations and a route length of 22.41 km. It includes sections with different track geometries, station embedment depths, and relationships to the above-ground environment. These differences are relevant to winter air exchange, thermal inertia, and aerosol transport among the tunnel, station, and vehicle compartments.
For the purpose of spatial evaluation, the route was divided into 19 inter-station segments (S1–S19), defined according to the time stamps of the station stops (arrival/departure). The segments correspond to the intervals between consecutive stations in the direction Letňany → Háje, specifically from the Letňany–Prosek section (S1) to the Opatov–Háje section (S19). An overview of the inter-station segments corresponding to the S1–S19 segments, including their length and approximate travel time, is given in Table 1. For clarity, the segment values in the graphs are assigned to the name of the terminal station of the given inter-station segment (e.g., the value for the “Prosek” station corresponds to the Letňany–Prosek segment). The route diagram of line C within the Prague Metro network is given in Figure 1.
Table 1.
Inter-station segments S1–S19 of line C Letňany–Háje used for data segmentation: approximate travel time and section length.
Figure 1.
Schematic route diagram of Prague Metro line C and inter-station segments S1–S19 used for data aggregation; transfer stations to lines A and B are marked at Muzeum and Florenc, respectively.
The height profile of the rail top is shown in Figure 2. The embedment depth of the Line C stations below the surrounding ground surface is shown in Figure 3. These two descriptors were used not only as background route information, but also as qualitative segment-level covariates for the interpretation of winter air exchange, thermal response, humidity behavior, and possible surface–tunnel aerosol coupling.
Figure 2.
Rail-top elevation at the center of the stations of line C. The shaded interval marks the Vltava River corridor around Nádraží Holešovice and Vltavská.
Figure 3.
Station embedment depth below the ground surface on line C.
To reduce over-attribution of segmental differences to passenger load alone, the rail-top elevation profile in Figure 2 and the station embedment-depth profile in Figure 3 were explicitly converted into qualitative segment descriptors in Table 2. For each inter-station segment, the vertical context was interpreted from the two adjacent stations and combined with the transfer-station context and known surface or ventilation-related setting of the route. The variables were not used as independent predictors in a multivariable statistical model because the analysis was based on 19 segment means and because verified distances to all piston shafts, main ventilation shafts, connecting ducts, and drainage structures were not available for the complete route. The descriptors in Table 2 were therefore used as contextual covariates to prevent over-attribution of the observed microclimatic and aerosol differences to passenger occupancy alone.
2.2. Measurement in a Metro Car with Passengers
The measurements were carried out in winter under standard operating conditions without interference with regular public transport operation. Five repeated measurement runs (R1–R5) were performed along the complete route between the terminal stations. The runs were designed to capture spatial differences along the line and changes associated with passenger occupancy while keeping the measurement procedure identical across runs.
The DustTrak II Aerosol Monitor 8530 was operated with one size-selective aerosol fraction for each run. The instrument did not provide simultaneous PM10, PM4, PM2.5 and PM1 outputs; changing the monitored fraction would have required reconfiguration of the sampling set-up and interruption of the continuous route profile. Therefore, one aerosol fraction was measured per run. In all runs, the remaining variables, namely air temperature, relative humidity, CO2 concentration, A-weighted sound pressure level and passenger occupancy, were recorded. This design is important for interpretation: PM fractions are not treated as a simultaneous aerosol size distribution, but as descriptive segment profiles obtained under comparable winter operating conditions.
2.3. Instrumentation and Sensor Placement
Total dust concentration (TDC) and the mass concentrations of PM10, PM4, PM2.5, and PM1 were measured using a DustTrak II Aerosol Monitor 8530 (TSI Inc., Shoreview, MN, USA). Air temperature, relative humidity, and CO2 concentration were recorded using an AHLBORN ALMEMO 2690-8A data logger (AHLBORN Mess- und Regelungstechnik GmbH, Holzkirchen, Germany) with the corresponding sensors. The A-weighted sound pressure level (LA) was measured with a UNITEST 93411 sound level meter (supplied by GHV Trading, spol. s r.o., Brno, Czech Republic) and stored in the ALMEMO data logger.
The DustTrak instrument is an optical photometer. It reports mass concentration from the light-scattering response using an internal conversion based on assumed aerosol optical properties. In a metro environment, this assumption is uncertain because particles may include metal-rich wear debris, resuspended tunnel dust, and externally supplied urban aerosol. No gravimetric correction factor specific to Prague Metro aerosol was derived during this campaign. Consequently, the reported PM and TDC values are not treated as reference-equivalent concentrations and are not used for regulatory-compliance assessments. Their primary use in this study is the identification of within-route spatial patterns, segmental maxima and minima, short-term episodes, and relative differences within each monitored PM run.
Published metro-specific DustTrak-gravimetric comparisons indicate that the potential optical bias can be large. Smith et al. [9] used a gravimetric correction factor of 1.82 for PM2.5 on the London Underground, and Luglio et al. [11] reported gravimetric PM2.5 concentrations approximately 2–4 times the optical values in northeastern U.S. subway systems. The Prague Metro platform measurements of Cusack et al. [45] provide relevant compositional context because they documented an Fe-rich aerosol fraction, for which light-scattering response can deviate from the calibration aerosol. Therefore, if the aerosol in the monitored car behaved similarly, reference-equivalent PM mass could plausibly differ from the reported DustTrak optical values by a factor of approximately 1.5–4; in the cited metro-specific comparisons, the gravimetric values were higher than the optical values. Because no paired in-car gravimetric sampling was performed, this range is used only as an uncertainty envelope and was not applied as a numerical correction.
No aerodynamic correction of the optical particle data was performed. Accordingly, PM10, PM4, PM2.5 and PM1 denote operational DustTrak size-cut optical mass estimates obtained with the instrument configuration used in this campaign, not independently verified aerodynamic-size-resolved reference mass concentrations.
The DustTrak 8530 did not provide information on chemical or morphological particle composition. No parallel filter-based gravimetric or chemical samples were collected during the in-car campaign. Aerosol composition is therefore discussed only with the support of the published Prague Metro data and is not derived from the present DustTrak measurements.
The reliability of the DustTrak data in this study is therefore understood as the operational repeatability and consistency of spatial profiling rather than reference-equivalent mass accuracy. The same instrument, sampling position, time-synchronization procedure, and segment-averaging method were used within each PM run, which supports a comparison of relative maxima, minima, and short-term episodes along the route. This interpretation is consistent with that of Braniš [2], who used a fast-response photometer in the Prague Metro and concluded that such instruments are suitable for relative aerosol measurements, but not for studies requiring exact aerosol mass concentrations without comparison with reference methods.
A summary of the measuring devices and sensors used in this research is presented in Table 3. The instruments were operated in the manufacturer’s recommended configuration and placed in the seated passenger area. Continuous recording was performed in a uniform time step and subsequently synchronized to a common timeline for data processing.
Table 3.
Summary of measuring devices and sensors.
Occupancy was determined by visual observation, using manual counts after passenger boarding and alighting, and expressed as the absolute number of passengers in the monitored metro car for each inter-station section; these values were subsequently used as the occupancy variable in the segment-level statistical analysis.
Measurements were performed in an intermediate M1.3 metro car operating on Prague Metro line C. The vehicle geometry and the measurement location are shown in Figure 4. The scheme provides spatial context for interpreting passenger occupancy, CO2 accumulation, thermal conditions, and aerosol behavior inside the car. The principal dimensions shown in Figure 4 were taken from technical drawings of the M1.3 intermediate car. The length over couplers is 19.206 m, the vehicle width is 2.712 m, the overall vehicle height is 3.670 m, the passenger door width is 1.300 m, and the floor height above rail level is 1.150 m.
Figure 4.
Schematic representation of the measured M1.3 intermediate metro car used on Prague Metro line C. The principal dimensions are taken from technical drawings. (a) Side elevation with longitudinal dimensions and passenger door width; (b) end view with vehicle width, overall height and floor height above rail level; (c) plan view showing the seating layout, door zones and measurement position. The red marker indicates the measurement location.
The monitored vehicle was an intermediate M1.3 car. Its longitudinal position within the trainset was not controlled and was not included as a factor in the analysis. Possible front–rear differences within the trainset therefore remain part of the unexplained operational variability.
The passenger capacity of the M1.3 car was considered only as a contextual parameter for interpreting the measured occupancy. Available technical sources specify 48 seated places and 252 standing places for the M1.3 car, corresponding to a total nominal capacity of 300 passengers. In the present study, the maximum observed occupancy was therefore interpreted as partial loading rather than fully loaded operation. This distinction is important for evaluating measured increases in CO2 and temperature, because both parameters respond to passenger-generated metabolic emissions as well as to available air volume, ventilation regime, and passenger distribution inside the car.
The measurement location is indicated in Figure 4c by a red marker. The measuring system was placed within the passenger compartment, not in the driver’s cab or a technical space, so that the recorded microclimatic and aerosol data represented the air conditions to which passengers were directly exposed during operation. The public technical specifications provide the overall vehicle height and the floor height above rail level, but do not provide a verified clear internal height of the passenger compartment. Therefore, the clear passenger-compartment height was not introduced as a numerical parameter in this study.
Detailed real-time vehicle-ventilation data were not logged. This included fan flow rate, supplied-air volume, filter class, control state and supply-air temperature. The monitored Prague Metro M1.3 car was not equipped with active passenger-compartment air conditioning or heating; the cabin was ventilated by air drawn from the surrounding tunnel and station environment. The study therefore describes the achieved in-car environment under standard winter service, not the performance of a specified mechanical ventilation setting. Central-segment CO2 and temperature values should be interpreted as the combined result of passenger load, effective ventilation by tunnel/station air, car–tunnel thermal inertia and route context.
2.4. Nighttime Tunnel Transect During Overnight Metro Closure
The nighttime tunnel transect during the overnight service closure was performed as a single qualitative control observation. Train movements were absent, so the normal train-induced piston effect was minimized, but the measurement did not include direct airflow, pressure, or shaft-distance measurements. The transect was carried out from 00:58 to 02:00 in the Florenc–Vltavská tunnel section (segment S7, Table 1) with continuous recording of PM10, PM2.5, air temperature, and relative humidity using a PCE-MPC 15 instrument (Table 3). This section passes near Štvanice, a small island in the Vltava River between Holešovice and the central urban area near Florenc; this setting is relevant to the interpretation of humidity and ventilation effects in segment S7. Because the exact positions of all ventilation structures, connecting channels, and drainage structures were not available in a verified distance-based dataset, the nighttime transect is used qualitatively to support the interpretation of local tunnel response rather than to quantify the mechanism of ventilation influence.
2.5. Data Processing
Measurement results from the DustTrak II Aerosol Monitor 8530 were exported as Excel files. Values from the ALMEMO measuring system were first processed using AMR-Control 5.14 software. The acquired datasets were checked for temporal consistency, synchronized with station stop time stamps and assigned to the corresponding inter-station segments. Graphical processing was carried out in Microsoft Excel 2021 (Microsoft Corporation, Redmond, WA, USA). The primary inferential statistical testing of repeatedly measured variables was performed in TIBCO Statistica 14 PRO (TIBCO Software Inc., Palo Alto, CA, USA) using a randomized-block ANOVA, with Run treated as the blocking factor and Segment as the spatial factor. Variance homogeneity across segments was evaluated using the mean-centered Levene test, and the median-centered Brown–Forsythe version was added as a robustness check. Tukey HSD was retained only as a post hoc diagnostic where applicable. Where the two variance diagnostics differed, post hoc groupings were interpreted conservatively and emphasis was placed on the blocked F-tests, effect sizes, and broad segmental gradients rather than sharply separated segment classes.
To quantify the associations between passenger load, in-car CO2 concentration and air temperature, the occupancy–CO2 and occupancy–air-temperature analyses were recalculated from the numeric run × segment aggregates provided in Supplementary Table S1 (n = 95; five runs × 19 inter-station segments). No second-by-second raw records were used in these correlation or regression calculations. Two complementary levels were evaluated. First, exploratory segment-level associations were calculated from the 19 simple segment means of occupancy, CO2 and air temperature. Pearson’s correlation coefficient and r2 were used to describe the linear association, and Spearman’s ρ was used as a rank-based robustness check. These calculations describe spatial co-variation along the route and were kept separate from the randomized-block ANOVA used for segment inference.
For the segment-level lagged analysis, lagged occupancy was calculated along the ordered route as the current segment occupancy for S1 and as the average of the current and preceding segment means for S2–S19. Second, run-adjusted linear models were fitted to the full 95-observation aggregate dataset: CO2 ~ Run + Occupancy and t ~ Run + Occupancy, with Run treated as a categorical blocking factor. The same models were then repeated with within-run lagged occupancy, defined as the current-segment occupancy for S1 and as the average occupancy of the current and preceding segment within each run for S2–S19. These models were used as supplementary occupancy-association analyses after adjustment for run-to-run shifts; they were not used as segment-inference tests.
The lagged descriptor was included only as an exploratory residual-load descriptor. For CO2, its use is conceptually consistent with the finite mixing and removal times in passenger cabins and with previous cabin studies reporting cumulative passenger-load effects on in-cabin CO2. In the present study, however, the descriptor was not treated as a dynamic ventilation, mass-balance or heat-balance model. Incremental partial R2 was calculated as (SSERun-only − SSEfull)/SSERun-only, i.e., as the additional variance explained by occupancy after adjustment for Run.
2.6. Scope of Inference and Methodological Constraints
The statistical interpretation was restricted by the measurement design. Before inferential testing, time-resolved records of the repeatedly measured variables were aggregated to one value per run and inter-station segment. The statistical dataset for air temperature, relative humidity, CO2, LA, and occupancy therefore contained 95 observations, corresponding to five runs crossed with 19 inter-station segments, with n = 5 run-level values per segment. Each observation represented one aggregated value for one run × one segment combination. Segment differences were evaluated using a randomized-block ANOVA with segment as the spatial factor and run as the blocking factor, specified as variable ~ run + segment. The segment × run interaction was not fitted because only one aggregated value was available in each run × segment cell. The aerosol fractions were measured in separate runs and are therefore interpreted descriptively. The winter-only campaign, the use of one M1.3 car type, the absence of logged vehicle-ventilation parameters, the absence of active passenger-compartment heating and cooling, and the absence of a local gravimetric correction for optical particle readings are explicitly considered when drawing conclusions. The resulting interpretive status of each variable group is summarized in Table 4.
Table 4.
Interpretive status of measured variables and limits of inference.
The uncontrolled position of the monitored car within the trainset and the absence of logged fan flow and supply-air data are additional operational limitations. They were not entered into the statistical model and may contribute to residual run-to-run or segment-to-segment variability.
The comparison with EN 14750:2024 [44] was used as an interpretive assessment, not as a formal type-test certification. The campaign was conducted in regular service, without controlled stabilization of the vehicle, declared ventilation set-points, verified fan flow rate, supply-air temperature, passenger-load condition or prescribed test boundary conditions. Therefore, the measured air temperature, relative humidity and CO2 values are compared with the intent of the standard as operational comfort and air-quality indicators, while formal conformity with EN 14750:2024 [44] is not claimed.
3. Results
The evaluation is based on five winter measurement runs on Prague Metro line C. The basic spatial unit of interpretation is the inter-station segment S1–S19, defined in the methodological section. The results are therefore presented as segment profiles and distributions of values, not as isolated values of individual stations. This approach allows us to distinguish whether the monitored quantities change together along the route, or whether their course reflects different source, ventilation and transport mechanisms.
Outdoor conditions during the measurement period were stable: air temperature ranged between −0.4 °C and 0.1 °C, relative humidity reached between 85% and 88%, no precipitation was recorded, and hourly outdoor aerosol concentrations were between 20 µg/m3 and 35 µg/m3 for PM10 and between 15 µg/m3 and 41 µg/m3 for PM2.5. Under these conditions, spatial differences inside the car can be interpreted primarily in relation to occupancy, ventilation, tunnel geometry, and the segment-specific connection between the metro system and the above-ground environment.
The airborne dust fraction measurements were organized so that individual PM fractions were obtained in separate runs, while air temperature, relative humidity, CO2, LA, and occupancy were measured repeatedly. PM fractions are therefore evaluated descriptively as concentration profiles. The segmental variability of air temperature, relative humidity, CO2, LA, and occupancy was subsequently evaluated statistically because these variables were recorded repeatedly in all runs.
3.1. Spatial Segmentation of the Route on Line C During the Winter Measurement
The spatial segmentation of the route is summarized in Figure 5, which provides the interpretive framework for the Section 3. Line C is divided into segments that differ in inter-station length and in the type of connection among the tunnel, station, and above-ground environment. These differences are important in winter, because the M1.3 car is ventilated by air drawn from the surrounding tunnel and station environment; during stops, door-opening also connects the passenger compartment with station air.
Figure 5.
Spatial framework of Prague Metro line C in winter used for segmental interpretation. Štvanice is marked as a surface reference point in the Vltava River corridor near segment S7; it is not a metro station.
The longest segment, Kobylisy–Nádraží Holešovice (S5), represents a different operating environment than the short central segments, Florenc–Hlavní nádraží and Hlavní nádraží–Muzeum (S8–S9). In the long tunnel section, the train remains in contact with the tunnel air for a longer time and piston transport and resuspension of deposited particles may be more significant. In the short central segments, on the other hand, there is a more frequent exchange of passengers between transfer stations, thus increasing the potential for the accumulation of exhaled air.
The lower part of Figure 5 distinguishes four functional zones. The northern edge of the route (S1–S4) is connected to a more open above-ground environment and a higher potential for contact with cold outdoor air. Segments S5–S7 form the Vltava River/ventilation interface, involving Nádraží Holešovice, Vltavská and the surface-connected ventilation pathways. Segments S8–S13 represent the central core, with high passenger turnover, interchange connections, a dense urban development and heavily loaded surface roads. The southern part (S14–S19) is more heterogeneous and includes operational connections to Kačerov, residential and commercial development, more open green areas and the traffic influence of the Chodov–Opatov area.
Ventilation shafts are elements of the main ventilation of the metro, i.e., technical interfaces between the tunnel, stations and the outdoor environment. Their effect is not assessed here as a separate site study, but as part of air exchange within specific line segments. In winter, such interfaces may introduce cold and relatively humid air, or air with a different aerosol load, depending on the proximity of paved surfaces, traffic intensity, vegetation and the Vltava River corridor. Other local factors cannot be ruled out.
The spatial framework of Prague Metro line C in the winter period used for segmental interpretation is shown in Figure 5. The upper panel shows the length of the inter-station segments; the lower panel divides the route into functional zones according to their relationship to the above-ground environment and ventilation. Štvanice is marked only as a surface reference point in the Vltava River corridor near S7. It is not a metro station, but a small island in the Vltava River relevant to the nighttime tunnel profile discussed below. The depth of the stations is shown separately in Figure 3 and is not repeated here.
3.2. Occupancy, CO2, Air Temperature and Relative Humidity as a Connected Response of the Car Interior
The integrated response of the microclimate in the car to occupancy along Line C in winter is shown in Figure 6. The bars show the number of passengers; the lines show CO2, air temperature and relative humidity as a coupled response to occupancy, tunnel conditions and air exchange with the above-ground environment.
Figure 6.
Integrated response of the in-car microclimate to occupancy along Line C in winter: (a) passenger occupancy; (b) CO2 concentration; (c) air temperature; and (d) relative humidity. Values are simple segment means from Supplementary Table S1; error bars show ±SD across the five runs.
Occupancy was lowest in the peripheral segments and reached 55.6–59.6 passengers per monitored car in the central part of the line. In the same descriptive segment profile, CO2 increased from 511 ppm in S1 and 553 ppm in S2 to 1067 ppm in S13. The segment means therefore exceeded 1000 ppm in S9, S10, S13, and S14. This value is used only as an operational indicator of ventilation demand, not as a statutory exposure limit. Descriptive segment means are used here for route-pattern interpretation and are kept separate from the randomized-block inference.
Across the 19 segment means from Supplementary Table S1, occupancy was strongly associated with CO2 concentration (Pearson r = 0.83716, p = 7.822 × 10⁻⁶, r2 = 0.70084; Spearman ρ = 0.74506, p = 0.000252). With lagged occupancy, the association remained similarly strong for Pearson correlation and increased for rank order (r = 0.83897, p = 7.161 × 10⁻⁶, r2 = 0.70387; ρ = 0.78596, p = 6.633 × 10⁻⁵). The lagged descriptor therefore better-followed the ordered CO2 accumulation profile, but it was not interpreted as a ventilation-rate estimate.
The relationship with air temperature was weaker. For current occupancy, Pearson r was 0.63294 (p = 0.003630, r2 = 0.40061) and Spearman ρ was 0.63361 (p = 0.003583). For lagged occupancy, Pearson r was 0.62900 (p = 0.003914, r2 = 0.39564) and Spearman ρ was 0.63860 (p = 0.003253). Passenger load therefore described the segment-level CO2 profile more clearly than the air-temperature profile.
The run-adjusted models fitted to the 95 run × segment aggregates confirmed this difference. After adjustment for Run, occupancy predicted CO2 more strongly (β = 8.49384 ppm per passenger, p = 3.339 × 10⁻⁹, partial R2 = 0.32640, model R2 = 0.50813) than air temperature (β = 0.01134 °C per passenger, p = 0.01604, partial R2 = 0.06342, model R2 = 0.14353). With lagged occupancy, the CO2 model gave β = 8.68546 ppm per passenger (p = 8.322 × 10⁻⁹, partial R2 = 0.31274, model R2 = 0.49815), whereas the air-temperature model gave β = 0.01267 °C per passenger (p = 0.009857, partial R2 = 0.07249, model R2 = 0.15183).
Overall, occupancy was the main descriptor of CO2 variability. Air temperature also increased with occupancy, but the signal was weaker and more buffered by car–tunnel thermal inertia, the preceding vehicle state, metabolic heat, and the temperature and flow of supplied tunnel/station air.
In segments S1–S4, low occupancy was combined with the marginal position of the route and more direct contact with the outdoor environment. The lower CO2 and air temperature values therefore cannot be attributed solely to the lower number of passengers; they are also consistent with the winter supply of cooler air through stations and ventilation connections. The situation changes in S5–S7: Kobylisy–Nádraží Holešovice is the longest assessed tunnel segment and the adjacent Nádraží Holešovice–Vltavská area belongs to the Vltava River/ventilation interface. Here, CO2 increases with occupancy, while relative humidity is simultaneously affected by the properties of the supplied air.
Passenger-related accumulation was strongest in the central core, mainly in S8–S13 (Figure 6). This section combines high passenger turnover, transfer links and dense urban surroundings. CO2 followed passenger load more closely than air temperature. Temperature changed more smoothly, indicating thermal inertia of the car–tunnel system and the influence of the previous vehicle state and standard winter ventilation by tunnel and station air.
In segments S14–S19, the occupancy decreases and CO2 is gradually diluted. However, the decrease is not immediate, which indicates a residual load on the car interior after passing through the central part of the line. Relative humidity does not have the same course as CO2. Its development in the vicinity of Vyšehrad and in the following southern segments corresponds to the more open position of the route, the influence of the Nuselské Valley and the different moisture content in the supplied air. Figure 6 therefore shows the common response of the car interior to occupancy, but at the same time separates the quantities controlled mainly by the passengers from the quantities more sensitive to air exchange with the surroundings.
3.3. Accumulation, Dilution and Residual Loading in a Segmental Profile
The standardized profile in Figure 7 summarizes the segmental deviations of all monitored quantities on a common dimensionless scale. Each row is standardized separately; therefore, the color expresses the deviation of a given segment from the typical state of the respective quantity. This display allows for a comparison of the spatial coincidence of quantities with different units and ranges.
Figure 7.
Robust standardized anomaly map of winter in-car microclimate and aerosol conditions along Prague Metro line C. Values are standardized separately for each variable; therefore, colors indicate deviations from the typical segment value within a given variable, not absolute concentrations or directly comparable physical magnitudes. Positive values indicate above-typical segment values, whereas negative values indicate below-typical values. PM fractions were measured in separate runs and are therefore interpreted descriptively. Robust standardization used the median and the IQR. The diverging color scale is centered at zero. The horizontal separator distinguishes the repeatedly measured in-car variables from the PM fractions measured in separate runs.
The standardized anomalies in Figure 7 show that the central part of line C forms the main zone of passenger-related accumulation. Positive anomalies of passenger occupancy, CO2 and air temperature occur mainly in the inner and south–central segments, where the high passenger load coincides with transfer stations and a more enclosed tunnel–station environment. This pattern indicates that the winter in-car microclimate was not controlled by one variable alone. CO2 responded most directly to passenger presence, whereas air temperature showed a smoother spatial response, consistent with the thermal inertia of the car interior and the surrounding tunnel environment.
Relative humidity did not follow the same spatial pattern as CO2. Its anomalies were less closely linked to central occupancy and were more evident in segments where the properties of supplied air and local ventilation links could have played a greater role. In winter, RH may be affected by the contrast between cold outdoor air and warmer tunnel air, by high outdoor relative humidity, by the Vltava River corridor, by the more open valley setting near Vyšehrad, and by local ventilation connections. Relative humidity therefore cannot be interpreted only as a product of passenger respiration.
The aerosol rows in Figure 7 do not reproduce the same anomaly structure as passenger occupancy, CO2 and air temperature. Positive anomalies of TDC, PM10, PM4, PM2.5 and PM1 are not restricted to the most occupied central segments but also occur in peripheral and locally exposed sections. This indicates that aerosol concentrations inside the car were not a simple consequence of passenger numbers. They reflected a combination of external entrainment, tunnel resuspension, train-induced piston transport, station air quality and filtration of the air supplied to the M1.3 car.
The interpretation of segment S7 is further informed by the nighttime tunnel survey between Florenc and Vltavská, performed during service closure when regular train movement and the train-induced piston effect were absent. Figure 8 provides a single control observation of local tunnel microclimatic response near the ventilation-influenced Štvanice interval. The result was interpreted together with the rail-top and embedment-depth context shown in Figure 2 and Figure 3: S7 lies in the Vltava/Štvanice corridor and connects stations with a changing vertical and embedment setting. Because airflow rate, pressure conditions, and exact distances to tunnel ventilation structures were not measured, the nighttime profile is used as qualitative evidence of a local response rather than as proof of a unique ventilation mechanism.
Figure 8.
Single nighttime tunnel profile measured during service closure in segment S7 between Florenc and Vltavská. (a) Air temperature and relative humidity; (b) PM10 and PM2.5 concentrations. The shaded interval indicates the part of the tunnel interpreted as ventilation influenced near Štvanice. Exact distances to all ventilation structures were not available for quantitative shaft-distance analysis.
In the first part of the passage, air temperature ranged mainly between 17 °C and 19 °C and relative humidity ranged between 60% and 64%. In the shaded interval of Figure 8, temperature decreased from 17 °C to a minimum of 8.26 °C at 01:46:50. At the same time, relative humidity increased to 77.05%. This coupled response is consistent with inflow or the mixing of colder and more humid air through the ventilation pathway connected to the Vltava River corridor.
The airborne dust response in the lower panel of Figure 8 had a different temporal character than temperature and relative humidity. The most pronounced short particle episode occurred at the beginning of the ventilation-influenced interval, when PM10 reached 93 µg/m3 and PM2.5 reached 73 µg/m3 at 01:39:10. Subsequently, PM10 ranged mainly between 40 µg/m3 and 55 µg/m3, and PM2.5 between 33 µg/m3 and 39 µg/m3. This pattern is consistent with short-term particle redistribution rather than a sustained increase in airborne dust along the entire affected interval.
The nighttime measurement should therefore be regarded as a single control observation under minimized train-induced piston flow. The combined temperature, humidity, and particle response indicates that a local tunnel interval near Štvanice can behave differently from the rest of the segment under winter closure conditions. However, this response should not be attributed to the ventilation pathway alone. According to Figure 2 and Figure 3, the segment is also part of a low-elevation river corridor with a changing station embedment-depth context, so cold humid inflow, local tunnel geometry, residual air movement, resuspension of deposited dust, transport from another tunnel zone, or their combination remain plausible. Repeated nighttime transects and direct airflow or pressure measurements would be required to quantify the relative role of the main ventilation system.
3.4. Airborne Dust Concentration, External Input and Tunnel Resuspension
The segmental concentrations of airborne dust fractions are shown in Figure 9. The y-axis gives DustTrak optical mass-concentration estimates in µg/m3, not gravimetric reference values. The PM results are interpreted at two levels. First, local maxima and minima within each PM run are used as relative spatial patterns. This level is less sensitive to an unknown multiplicative calibration factor if the optical bias remains broadly consistent within a run. Second, the absolute values in µg/m3 are shown as operational estimates and are sensitive to aerosol composition, particle morphology, refractive index, and density. Because TDC, PM10, PM4, PM2.5, and PM1 were measured in separate runs, the profiles are descriptive and do not represent a simultaneous particle-size distribution.
Figure 9.
Aerosol concentration profiles along Prague Metro line C. Segmental averages of TDC, PM10, PM4, PM2.5, and PM1 are given in µg/m3. PM fractions were measured in separate runs and are therefore interpreted descriptively.
The 1.5–4× range was not used to rescale the plotted data. It only indicates the likely DustTrak optical bias in the absence of paired gravimetric calibration. Figure 9 therefore supports relative segment comparison within each PM run.
The highest airborne dust load in the northern part of the route was observed for TDC and PM10. In segment S1, TDC reached 199 µg/m3 and PM10 reached 167 µg/m3, which is clearly higher than most values in the central segments. Given the low occupancy, this situation cannot be explained by particles introduced by passengers. A combination of the open surroundings of Letňany, surface dust input, station ventilation, and the resuspension of deposited tunnel particles is a more consistent explanation.
In segments S2–S5, elevated values remained, especially for TDC, PM10, and PM4. PM2.5 also remained elevated in the northern part of the route, but within the measured range of 57–118 µg/m3. This profile corresponds the longer period contact of between the train and the tunnel air and the resuspension of deposited dust. The local influence of more open station areas and surface roads near the northern stations may also contribute, but the measurement design does not allow these components to be separated quantitatively.
The central segments S8–S13 did not show an aerosol maximum, although occupancy, CO2, and temperature peaked there. In this part of the line, PM10 was between 79 µg/m3 and 91 µg/m3 and PM2.5 was between 65 µg/m3 and 83 µg/m3. The increased fine-particle values near Muzeum and I. P. Pavlova are consistent with dense urban development and traffic-loaded surface roads. However, the aerosol profile does not simply follow passenger numbers; it also reflects tunnel resuspension, station air exchange, and filtration in the car.
In the southern segments S17–S19, PM10 and PM2.5 increased again. PM10 reached between 104 µg/m3 and 115 µg/m3 and PM2.5 between 83 µg/m3 and 89 µg/m3. This return of higher values is consistent with the Chodov–Opatov area, where highway traffic, commercial and residential development, open surfaces, and vegetation are combined. The fine fraction may partly reflect traffic aerosol, while the coarser fraction may be linked to resuspension from station and tunnel surfaces.
Figure 10 summarizes the distribution of aerosol concentrations recorded inside the M1.3 car. The boxplots complement the segment profiles by showing not only the central tendency of each fraction, but also the spread of values and the occurrence of short-term concentration episodes. The circles above the whiskers represent observations outside the non-outlying range of the boxplot. In this dataset, these points are not treated as measurement errors, but as short-term aerosol peaks associated with tunnel resuspension, station air exchange, train-induced piston transport, and local entrainment from surface-connected environments.
Figure 10.
Distribution of aerosol fractions measured inside the M1.3 metro car during winter operation. Boxes represent the interquartile range, horizontal lines indicate medians, whiskers extend to the non-outlying range, and circles denote observations outside the whiskers. These points are interpreted as short-term concentration episodes rather than measurement errors unless supported by independent evidence. PM fractions were measured in separate runs and are therefore compared descriptively; the figure does not represent a simultaneous particle-size distribution.
Runs representing larger cut-point fractions, especially TDC and PM10, showed the highest variability. TDCs ranged between 90 µg/m3 and 290 µg/m3, and upper outlying points indicate short-term increases rather than a uniform background level. PM10 showed a similar, although less extreme, pattern, with a mean concentration of 98.01 ± 14.17 µg/m3 and maximum values reaching 212 µg/m3. Because these are optical estimates and because PM fractions were not measured simultaneously, the result is interpreted as higher episodic variability in the larger cut-point PM runs, not as a quantified coarse-mode mass fraction.
Runs representing intermediate and smaller cut-point fractions showed narrower distributions under the measured winter conditions. PM4 ranged between 60 µg/m3 and 132 µg/m3, PM2.5 between 57 µg/m3 and 118 µg/m3, and PM1 between 38 µg/m3 and 61 µg/m3. This suggests a less episodic optical response in the smaller cut-point PM runs. It does not demonstrate a simultaneously stable fine-particle component, because the fractions were obtained in different runs.
The pattern shown in Figure 10 therefore suggests two descriptive response patterns across separate winter PM runs rather than two simultaneously measured aerosol components. Larger cut-point runs were more episodic and more sensitive to short-term increases consistent with resuspension, station air exchange, and piston-driven air movement. Smaller cut-point runs were less dispersed in this dataset, but their absolute concentration level remains sensitive to the unknown DustTrak response to local metro aerosol. Accordingly, Figure 10 is used to compare variability and episodic behavior, not to reconstruct particle-size composition.
3.5. Segmental Variability of Microclimate in a Metro Car Expressed by Box Plots
The segmented box plots in Figure 11 complement the average profiles by showing the distribution of values within individual inter-station segments. The panels show whether the segment differences are due to a systematic shift in the distribution or short-term extremes. This display is particularly suitable for distinguishing a systematic shift in the entire distribution from a few short-term extremes.
Figure 11.
Segmented box plots of main microclimatic variables and occupancy: (a) CO2 concentration; (b) air temperature; (c) relative humidity; and (d) passenger occupancy. Boxes indicate the interquartile range, horizontal lines indicate medians, whiskers show the non-outlying range, and circles denote observations outside the whiskers.
For CO2, the central segments show a shift in the entire distribution toward higher values. This is not just an isolated peak caused by a single delay or passenger boarding, but a repeatedly higher level of exhaled air in the busiest part of the route. This result corresponds to Figure 6 and Figure 7 and is evaluated statistically in the corrected randomized-block model in Table 5. The mean-centered Levene test indicated unequal variances, whereas the median-centered Brown–Forsythe test did not reject homogeneity (Table 6). Because the variance diagnosis was sensitive to centering, the segmental CO2 pattern is interpreted conservatively as a broad central–peripheral gradient rather than as sharply separated individual segment classes defined only by Tukey letters.
Table 5.
Corrected randomized-block ANOVA for repeatedly measured in-car variables. The model was specified as variable ~ run + segment; run was treated as the blocking factor and segment as the spatial factor.
Table 6.
Mean-centered Levene and median-centered Brown–Forsythe tests for homogeneity of variances across the 19 inter-station segments, calculated on the aggregated run × segment dataset.
Air temperature in Figure 11 has a smaller dispersion than CO2 and changes more smoothly. This corresponds to the thermal inertia of the car interior, tunnel, and technical elements. Therefore, the segment differences cannot be explained only by instantaneous occupancy; the previous thermal state of the train, contact time with the tunnel, and winter ventilation mode are also significant factors.
Relative humidity has a different segmental structure. Its box plots do not replicate CO2, confirming the influence of supplied air, the Vltava River corridor, more open track sections, and local ventilation conditions. The occupancy panel, by contrast, shows a clear gradient from the edge segments to the middle part of the line. The combination of panels in Figure 11 confirms that CO2 and temperature are mainly accumulation variables, whereas relative humidity has a stronger link to the source and pathway of supplied air.
3.6. A-Weighted Sound Pressure Level (LA) as an Operational Comfort Value
The A-weighted sound pressure level (LA) was evaluated as an additional comfort parameter. Unlike CO2, air temperature, relative humidity, and airborne particle concentration, it is not a direct indicator of air exchange or of the quality of outside air supplied to the system. Its spatial variability is mainly related to train speed, acceleration, braking, curves, switches, and the technical condition of the track; it should therefore be interpreted in the context of railway-acoustics measurement standards [46,47].
For this reason, increased LA values were not interpreted as microclimatic anomalies. If higher noise levels appeared in any segment, they were understood as an operational-technical phenomenon, not as evidence of the local influence of the above-ground environment. LA therefore complements the comfort assessment, but is not used as the primary variable for assessing the link between the outside environment and the metro system.
The present segment-level dataset was not designed to test whether short PM10 peaks coincide with braking events. Such analysis would require synchronized PM10, high-frequency LA, speed, braking and train-position records. This should be addressed in a targeted follow-up experiment, because braking and wheel–rail interaction may contribute to short coarse-particle episodes.
3.7. Statistical Verification of Segment Differences and Operational Interpretation
Segment-level inference was evaluated using a randomized-block ANOVA because the measurement design consisted of five complete runs crossed with 19 inter-station segments. For each repeatedly measured variable, exactly one aggregated value per run × segment cell entered the model (n = 95; n = 5 per segment). Run was included as a blocking factor to account for run-to-run shifts in occupancy and car state, and segment was used as the spatial factor. PM fractions were not included in this inferential comparison because they were measured in separate runs and are evaluated descriptively.
The corrected model confirmed that passenger occupancy had the strongest segmental differentiation, F(18, 72) = 17.086, p < 0.001, partial η2 = 0.810. CO2 also retained a significant segment effect after accounting for run-to-run variability, F(18, 72) = 3.409, p = 0.000108, partial η2 = 0.460. Segment effects were also significant for relative humidity, F(18, 72) = 2.67, p = 0.001674, partial η2 = 0.401, and air temperature, F(18, 72) = 2.01, p = 0.019629, partial η2 = 0.335. LA did not show a statistically significant segment effect after the inclusion of run as a blocking factor, F(18, 72) = 1.46, p = 0.132512.
The final ranking of segmental differentiation was therefore based on the corrected segment effect rather than on the absolute range of segment means. According to partial η2 for the segment term, the ranking was passenger occupancy > CO2 > relative humidity > air temperature > LA, with LA classified as non-significant. This wording separates the magnitude of the observed mean gradient from the statistical strength of segmental differentiation.
For CO2, the significant segment effect supports the interpretation of a central–peripheral accumulation pattern. The mean-centered Levene test rejected equal variances, F(18, 76) = 5.910, p < 0.001, whereas the median-centered Brown–Forsythe test did not, F(18, 76) = 1.001, p = 0.468. Thus, the variance diagnosis was sensitive to centering. The conservative post hoc interpretation was retained, and the central part of the route is described as a broader CO2 plateau rather than as a set of sharply separated individual segment classes.
Air temperature and relative humidity also retained significant segment effects in the blocked model. Their mean-centered Levene tests rejected homogeneity, whereas the median-centered Brown–Forsythe checks did not [air temperature: F(18, 76) = 1.237, p = 0.255; relative humidity: F(18, 76) = 1.000, p = 0.469]. The Brown–Forsythe test likewise did not reject homogeneity for LA (p = 0.098) or passenger occupancy (p = 0.771). The temperature and humidity patterns are therefore interpreted as broad winter gradients linked to occupancy, tunnel thermal inertia, supplied-air properties, the Vltava River corridor, and local ventilation context; the results do not imply uniquely separated adjacent segments for every pairwise comparison.
The A-weighted sound pressure level did not show a significant stable segment effect after run-to-run variability was included in the model. This confirms that LA should be interpreted mainly as an operational comfort indicator affected by train speed, braking, acceleration, track geometry, curves, switches, and local infrastructure, rather than as a microclimatic or ventilation-related segment descriptor.
Overall, the corrected statistical analysis supports the main interpretation while making the inferential wording more conservative. Passenger occupancy and CO2 remain the most relevant variables for the winter accumulation response of the car interior. Relative humidity and air temperature show significant but broader segmental gradients. LA is retained as a comfort-related operational variable without a statistically significant stable segment effect. The PM fractions remain outside the inferential model because they were measured in separate aerosol runs.
Viewed against EN 14750:2024 [44], the winter segment means indicate a cool passenger-compartment environment with moderate humidity. Air temperature ranged from 13.76 to 15.66 °C and was the main comfort limitation of the campaign. This points to the need for targeted ventilation and comfort assessment under EN 14750:2024 [44]-type boundary conditions, especially for the winter operation of M1.3 cars without active passenger-compartment heating or cooling.
4. Discussion
A number of publications dedicated to urban transport present the question of the accessibility of large cities; the use of urban transport [48,49,50,51], the issue of air cleanliness [52] and the conditions during transport [53] are also related to this, providing the motivation for conducting the presented research and the preparation of this article. According to some results, it is appropriate and promising to solve these conditions with regard to the changing climate and sudden weather changes [54]. The following considerations are based on the results of own measurements, along with findings from the cited studies.
4.1. Airborne Dust Concentration and Coupling with the Above-Ground Environment
The airborne dust measurements show that the interior of the M1.3 metro car cannot be interpreted as a spatially isolated cabin. The spatial profiles in Figure 9 and the distribution summary in Figure 10 show different descriptive response patterns among separately measured PM runs. Runs representing larger cut-point fractions, especially TDC and PM10, showed wider dispersion and more frequent episodic peaks, whereas the PM1 run was less dispersed under the measured winter conditions. This comparison does not represent a simultaneous particle-size distribution. The circles in Figure 10 identify observations outside the whiskers and therefore document short-term concentration episodes, especially in the TDC and PM10 runs. This structure is consistent with studies of underground transport environments, where the resuspension of deposited material, wear-derived particles, station ventilation, and external air exchange contribute to PM variability.
The interpretation of PM fractions should also consider particle composition, but the available Prague evidence must be used cautiously. Braniš [2] did not provide a chemical or morphological speciation of particles in the Prague Metro. However, his year-long PM10 measurements are directly relevant to source interpretation. PM10 was highest inside Prague Metro trains (113.7 µg/m3 on average), lower in underground station spaces (102.7 µg/m3), and lowest outdoors (74.3 µg/m3). At the same time, strong associations among outdoor, station, and train PM10 indicated both coupling with ambient sources and a common underground aerosol component: outdoor PM10 was associated with underground station spaces (R2 = 0.820) and metro trains (R2 = 0.774), while the association between station spaces and trains was even stronger (R2 = 0.964).
Braniš [2] also discussed likely Prague Metro aerosol pathways, including wheel–rail friction, brake wear, metal vaporization due to sparking, resuspension by passengers and train movement, and ingress of outdoor aerosol through ventilation systems, escalator tunnels, and corridors. In addition, the same paper summarized evidence from analogous metro systems in which underground aerosol was enriched in metals, including Mn, and London Underground samples were dominated by Fe and Si. Thus, the available evidence supports a mixed-source interpretation for Prague and provides qualitative support for distinguishing more episodic larger cut-point PM responses from less dispersed smaller cut-point responses. It does not, however, prove the chemical composition of the particles measured in the present campaign.
The Prague-specific evidence was further strengthened by Cusack et al. [45], who chemically characterized PM10, PM2.5, and PM1 on an underground platform of the Prague Metro. They reported gravimetric operational concentrations of 214.8, 93.9, and 44.8 µg/m−3 for PM10, PM2.5, and PM1, respectively. Their results showed that PM mass was strongly affected by train operation, with the largest response in the coarse fraction, whereas PM1 and submicron particle number concentrations were comparatively more stable. The aerosol was highly enriched in Fe, especially in PM10, where Fe accounted for 46% of the mass during operational hours, supporting wheel–rail mechanical abrasion as a major underground source. Other enriched elements included Ba, Cu, Mn, Cr, Mo, Ni, and Co. At the same time, the behavior of secondary inorganic aerosol and submicron particles indicated that surface-air entrainment may also contribute to the underground aerosol mixture.
These Prague-specific findings complement Braniš [2]. Braniš supports the interpretation of ambient coupling between outdoor air, underground spaces, and trains, whereas Cusack et al. [45] provide direct chemical evidence that Prague Metro aerosol contains a train-operation-related metal-enriched component, particularly in the larger PM fractions. This supports the qualitative interpretation of metro aerosol as a mixed-source system combining train-related mechanical emissions, tunnel resuspension, and surface–air coupling. However, because the present study did not include chemical or morphological analysis and because PM fractions were measured in separate runs, this evidence is used only to support source-pathway interpretation, not quantitative chemical apportionment or direct health-risk estimation.
These studies constrain the interpretation of the present DustTrak data. Cusack et al. [45] provide Prague-specific gravimetric and chemical context, while Smith et al. [9] and Luglio et al. [11] indicate the possible DustTrak bias in metro aerosols. As no paired in-car gravimetric sampling was performed, these factors are used only as an uncertainty range, not as correction factors.
In the present data, a comparable mixed-source pattern is indicated by the fact that aerosol maxima did not simply coincide with the highest occupancy. Elevated PM responses were more apparent in segments with stronger surface coupling, traffic-influenced surroundings, and ventilation or river-corridor context, whereas central high-occupancy segments primarily showed CO2 and heat accumulation. Therefore, the PM findings are interpreted as descriptive source-pathway indicators. Because PM fractions were measured in separate runs and no chemical or morphological analysis was performed, they cannot be used for quantitative chemical apportionment, regulatory compliance, or direct health-risk estimation.
4.2. Occupancy, CO2 and Thermal-Humidity Response
The relationship between occupancy and CO2 is more direct than the relationship between occupancy and airborne dust. The study by Gao et al. [40] is particularly relevant here because it identified passenger density as the dominant determinant of in-carriage CO2 and explicitly considered cumulative accumulation across train sections. Consistent with previous subway-car CO2 work and bus-cabin measurements showing approximately linear CO2 relationships with cumulative passenger counts [28,55], the present descriptive segment-profile results indicate that CO2 concentration was strongly affected by passenger load and residual accumulation. Figure 6 and Figure 7 show that the central part of the line acts as the main accumulation zone of exhaled air and heat. Figure 11 further shows that the increase is not limited to single extreme values, but is reflected in the whole segmental distribution. This pattern is supported by the corrected randomized-block ANOVA in Table 5, while the centering-sensitive variance diagnostics in Table 6 support conservative interpretation of detailed post hoc grouping.
The correlation results should be interpreted in the context of a simplified CO2 mass-balance concept. In general, in-car CO2 concentration increases with passenger CO2 generation and decreases with effective ventilation or dilution. Therefore, for the same supplied-air or background CO2 concentration, a higher passenger load is expected to increase the CO2 excess, whereas higher effective dilution is expected to reduce it.
Supplementary Table S1 supports an occupancy-related central CO2 accumulation with a limited carry-over signal. Across the 19 segment means, current occupancy was strongly associated with CO2 (r = 0.83716, p = 7.822 × 10⁻⁶, r2 = 0.70084). Using lagged occupancy changed the linear fit only marginally (r = 0.83897, p = 7.161 × 10⁻⁶, r2 = 0.70387), but increased Spearman ρ from 0.74506 to 0.78596. Thus, the preceding segment improved the rank-order description of CO2 accumulation, consistent with the delayed removal of passenger-generated CO2 by mixing and ventilation. Separately, the randomized-block ANOVA confirmed a significant CO2 segment effect after adjustment for Run, F(18, 72) = 3.409, p = 0.000108, partial η2 = 0.460.
These results do not provide a direct measurement of ventilation performance. The actual vehicle ventilation airflow, supplied-air volume, filter class, supply-air temperature, and real-time control state were not logged during the measurement campaign. Therefore, the correlations cannot be used to determine the technical ventilation rate of the M1.3 car. They should be read only as evidence of passenger-related CO2 accumulation under the effective ventilation achieved during the monitored winter service.
Different ventilation settings can be interpreted only conceptually. If passenger load and the CO2 concentration of the supplied tunnel/station air remained unchanged, increasing the effective dilution flow would be expected to reduce the CO2 excess above background. For example, doubling the effective dilution would approximately halve the excess CO2 under simplified quasi-steady conditions, and a 50% increase in effective dilution would reduce the excess by roughly one third. These estimates are only order-of-magnitude interpretations of the central plateau and should not be used as ventilation design calculations, because fan flow rate, filter characteristics and supply-air properties were not measured.
Air temperature showed a weaker occupancy response than CO2. Across the 19 segment means, current occupancy was significantly related to air temperature (r = 0.63294, p = 0.003630, r2 = 0.40061; Spearman ρ = 0.63361, p = 0.003583). The lagged descriptor did not improve the linear fit (r = 0.62900, p = 0.003914, r2 = 0.39564; ρ = 0.63860, p = 0.003253). In the 95-observation models, current and lagged occupancy remained significant after adjustment for Run, but their additional contribution was small (partial R2 = 0.06342 and 0.07249). The corresponding CO2 models showed much stronger occupancy association (partial R2 = 0.32640 and 0.31274).
Within the EN 14750:2024 [44] rolling-stock comfort framework, the main limitation was the low winter cabin temperature. Segment-mean air temperature ranged from 13.76 to 15.66 °C, whereas relative humidity remained moderate at 42.86–48.44%. CO2 ranged from 511 to 1067 ppm at the segment-mean level and identified the central ventilation-demand signal, with several central and south–central segment means exceeding 1000 ppm. These values should be read as operational screening results for the M1.3 car, not as a formal EN 14750 type test.
Overall, CO2 was more closely linked to passenger load than air temperature. The temperature profile retained a significant occupancy signal, but it was smoother and more buffered, consistent with car–tunnel thermal inertia, previous vehicle state, metabolic heat, and unlogged ventilation parameters rather than active heating or cooling.
In segments S9–S18, CO2 and air temperature co-varied because both were affected by passenger load, residual cabin air and the tunnel/station air supplied to the car. This co-variation should not be interpreted as a direct insulating effect of CO2. At the observed in-car concentrations, the radiative influence of CO2 on heat transfer to car surfaces is negligible relative to passenger heat release, ventilation, and car–tunnel thermal inertia. The CO2–temperature relationship is therefore treated as a common response to operating conditions, not as a separate heat-transfer mechanism.
4.3. Nighttime Tunnel Response Under Minimized Train-Induced Piston Flow
The nighttime transect in segment S7 complements the results from normal operation as a single service-closure observation under minimized train-induced piston flow. Figure 8 shows that the ventilation-influenced interval near Štvanice was associated with a short-term temperature drop to 8.26 °C and an increase in relative humidity to 77.05%. This coupled response is physically consistent with inflow or mixing of cooler and more humid air from the Vltava River corridor. However, S7 should not be interpreted only as a ventilation-shaft effect. Figure 2 and Figure 3 show that this part of the route is located in a specific vertical and river-corridor context, with low rail-top elevation in the Vltava corridor and a changing station embedment-depth setting between the adjacent stations. Because airflow direction, pressure, and exact distances to ventilation structures were not measured, the observation cannot determine the relative contributions of main ventilation, local pressure conditions, tunnel geometry, river-corridor exposure, and cold outdoor-air inflow.
The airborne dust measurement during the nighttime passage shows that ventilation-influenced intervals may also be associated with particle episodes. A short episode of PM10 = 93 µg/m3 and PM2.5 = 73 µg/m3 occurred at the beginning of the affected interval. This episode may reflect local resuspension, transport from a surface-connected airflow path, redistribution from another tunnel zone, or a combination of these processes. The finding is consistent with the literature describing the importance of ventilation pathways and external source coupling in underground transport systems [24,25,26,29,30], but it should be interpreted as a localized observation rather than as evidence that all main-ventilation shafts behave as particle sources.
4.4. Operational Significance and Limitations of Interpretation
Practical interpretation of the results does not indicate a single universal measure for the entire line. In the central segments, the priority is to manage CO2 and heat in relation to passenger load and effective ventilation, consistent with the findings summarized in [14,28,53]. In segments with stronger connection to surface sources, filtration of supplied air and control of airborne dust input are more important. In the S6–S7 Vltava River/ventilation interface, winter operation must also consider that cold and humid air supplied from the surface can improve dilution but may simultaneously create local thermal and humidity anomalies and mobilize deposited particles. The qualitative segment descriptors in Table 2 show that these effects overlap with vertical context, embedment-depth variation, transfer-station influence, and route geometry; therefore, segmental differences should not be attributed to passenger load, ventilation, or depth as isolated factors. The scope of this interpretation remains limited to winter operation, one M1.3 car type, moderate occupancy, and the available segment-level contextual data.
5. Conclusions
Winter measurements on Prague Metro line C showed segmental heterogeneity of the in-car environment in the monitored M1.3 car. The pattern reflected passenger load, tunnel conditions, station air exchange, ventilation pathways and local surface coupling. The randomized-block ANOVA confirmed significant segment effects for occupancy, CO2, relative humidity and air temperature after Run was included as a blocking factor. LA did not show a significant stable segment effect. Based on partial η2, the segment effect was strongest for occupancy, followed by CO2, relative humidity and air temperature.
Supplementary Table S1 further showed that occupancy was more closely related to CO2 than to air temperature. At the segment level, the occupancy–CO2 correlation was r = 0.837, whereas the occupancy–temperature correlation was r = 0.633. In the run-adjusted model, occupancy increased CO2 by 8.49 ppm per passenger, but air temperature increased by only 0.011 °C per passenger. The central route section showed the clearest CO2 and temperature increase, coinciding with higher occupancy and passenger turnover. The recalculated CO2 segment means exceeded 1000 ppm in several central and south–central segment means.
When interpreted through EN 14750:2024 [44] as the rail-specific normative framework, the key microclimatic finding is that winter air temperature was the most critical comfort-related parameter, whereas relative humidity remained moderate and CO2 identified central-segment ventilation demand. The results therefore support targeted EN 14750:2024-oriented [44] ventilation and comfort assessment of M1.3 cars under controlled winter boundary conditions. Because these cars do not provide active passenger-compartment heating or cooling, such assessment should focus on the air drawn from tunnel and station environments, fan-flow conditions, and the resulting in-car comfort.
Airborne dust fractions did not follow the same pattern as CO2. Increased optical PM estimates also occurred in marginal and transition segments with lower occupancy. The most robust aerosol-related conclusion is therefore spatial and relative: PM variability was not governed by passenger numbers alone. Because PM values were obtained from an optical monitor without a local gravimetric correction and because individual PM fractions were measured in separate runs, the aerosol results should be interpreted as operational indicators of relative segmental variability, not as reference-equivalent concentrations, regulatory-compliance data, or simultaneous particle-size distribution.
Because neither local gravimetric calibration nor aerodynamic-size correction of the optical signal was applied, PM and TDC are reported as operational DustTrak estimates. Their absolute mass scale may be biased by an unknown factor. The data are therefore used to interpret relative segment profiles and short-term episodes within each PM run, not reference-equivalent PM concentrations or regulatory compliance.
The single nighttime transect in segment S7 documented a local tunnel response under service-closure conditions: in the ventilation-influenced interval, temperature dropped to 8.26 °C, relative humidity increased to 77.05%, and a short aerosol episode with PM10 = 93 µg/m3 and PM2.5 = 73 µg/m3 occurred. This observation supports the existence of localized ventilation-related microclimatic variability in a segment with a specific Vltava/Štvanice vertical and river-corridor context, but it does not uniquely identify whether the particle episode resulted from cold humid inflow, local resuspension, transport from another tunnel zone, tunnel geometry, or their combination.
From an operational point of view, the results indicate that ventilation and filtration assessment should consider segment character rather than only line-wide averages. CO2 and heat require attention mainly in highly occupied central segments, whereas particulate variability requires attention in sections with stronger surface-air exchange, ventilation pathways, and tunnel-dust resuspension. Further measurements should include other seasons, peak occupancy, additional vehicle types, the recorded position of the monitored car within the trainset, repeated nighttime transects, direct airflow or pressure measurements, verified fan flow and supply-air conditions, local gravimetric or chemical validation of PM, and synchronized PM10, speed, braking and high-frequency acoustic records.
Supplementary Materials
The following supporting information can be downloaded at: https://www.mdpi.com/article/10.3390/app16147161/s1, Supplementary Table S1 is provided as an .xlsx spreadsheet. It contains the 95 run × segment aggregates (five runs × 19 inter-station segments) used for the randomized-block ANOVA and run-adjusted occupancy models. The same file includes the corrected randomized-block ANOVA tables, mean-centered Levene and median-centered Brown–Forsythe tests, model-estimated segment means, the PM segment means used in Figure 7 and Figure 9, and the PM observations used in Figure 10. PM fractions were measured in separate runs. Descriptive segment means support route-profile interpretation, whereas the 95 run × segment aggregates form the basis of the corrected inferential and run-adjusted analyses.
Author Contributions
Conceptualization, P.K. and J.H.; methodology, P.K. and J.H.; software, P.K. and J.H.; validation, P.K. and J.H.; formal analysis, P.K. and J.H.; investigation, P.K. and J.H.; resources, P.K. and J.H.; data curation, P.K. and J.H.; writing—original draft preparation, P.K. and J.H.; writing—review and editing, P.K. and J.H.; visualization, P.K. and J.H.; supervision, P.K. and J.H.; project administration, P.K. and J.H.; funding acquisition, P.K. and J.H. All authors have read and agreed to the published version of the manuscript.
Funding
This research was funded by the Internal Grant Agency of the Faculty of Engineering, Czech University of Life Sciences Prague (2024:31170/1312/3109 and 2025:31170/1312/3101).
Institutional Review Board Statement
Not applicable.
Informed Consent Statement
Not applicable. Passenger occupancy was recorded only as the number of people, and no individual passenger data were collected.
Data Availability Statement
The aggregated run × segment dataset used for the statistical analyses is provided as Supplementary Table S1 (.xlsx). Raw time-resolved records are not publicly archived because they are operational measurements from a public transport system, but they are available from the corresponding author upon reasonable request.
Acknowledgments
The authors would like to thank Prague Metro staff for their helpfulness during all measurements, especially during the nighttime measurement in the tunnel section of line C.
Conflicts of Interest
The authors declare no conflicts of interest. The funders had no role in the design of the study; in the collection, analyses, or interpretation of data; in the writing of the manuscript; or in the decision to publish the results.
Abbreviations
The following abbreviations are used in this manuscript:
| ANOVA | Analysis of variance |
| CO2 | Carbon dioxide |
| HVAC | Heating, ventilation and air conditioning |
| LA | A-weighted sound pressure level |
| PM1 | Particulate matter with aerodynamic diameter up to 1 µm |
| PM2.5 | Particulate matter with aerodynamic diameter up to 2.5 µm |
| PM4 | Particulate matter with aerodynamic diameter up to 4 µm |
| PM10 | Particulate matter with aerodynamic diameter up to 10 µm |
| RH | Relative humidity |
| SD | Standard deviation |
| TDC | Total dust concentration |
| S1 to S19 | Inter-station segment |
| IQR | interquartile range |
References
- Hu, S.C.; Lee, J.H. Influence of platform screen doors on energy consumption of the environment control system of a mass rapid transit system: Case study of the Taipei MRT system. Energy Convers. Manag. 2004, 45, 639–650. [Google Scholar] [CrossRef] [Scilit]
- Braniš, M. The contribution of ambient sources to particulate pollution in spaces and trains of the Prague underground transport system. Atmos. Environ. 2006, 40, 348–356. [Google Scholar] [CrossRef] [Scilit]
- Nieuwenhuijsen, M.J.; Gómez-Perales, J.E.; Colvile, R.N. Levels of particulate air pollution, its elemental composition, determinants and health effects in metro systems. Atmos. Environ. 2007, 41, 7995–8006. [Google Scholar] [CrossRef] [Scilit]
- Querol, X.; Moreno, T.; Karanasiou, A.; Reche, C.; Alastuey, A.; Viana, M.; Font, O.; Gil, J.; de Miguel, E.; Capdevila, M. Variability of levels and composition of PM10 and PM2.5 in the Barcelona metro system. Atmos. Chem. Phys. 2012, 12, 5055–5076. [Google Scholar] [CrossRef] [Scilit]
- Zhang, X.; Xu, Y.; Su, J. Temporal and spatial characteristics of particulate matters in metro stations of Shanghai, China. Build. Environ. 2020, 179, 106956. [Google Scholar] [CrossRef] [Scilit]
- Pan, S.; Fan, L.; Liu, J.; Xie, J.; Sun, Y.; Cui, N.; Zhang, L.; Zheng, B. A review of the piston effect in subway stations. Adv. Mech. Eng. 2013, 2013, 950205. [Google Scholar] [CrossRef] [Scilit]
- Wen, Y.; Leng, J.; Shen, X.; Han, G.; Sun, L.; Yu, F. Environmental and health effects of ventilation in subway stations: A literature review. Int. J. Environ. Res. Public Health 2020, 17, 1084. [Google Scholar] [CrossRef] [Scilit] [PubMed]
- Yang, F.; Kaul, D.; Wong, K.C.; Westerdahl, D.; Sun, L.; Ho, K.F.; Tian, L.; Brimblecombe, P.; Ning, Z. Heterogeneity of passenger exposure to air pollutants in public transport microenvironments. Atmos. Environ. 2015, 109, 42–51. [Google Scholar] [CrossRef] [Scilit]
- Smith, J.D.; Barratt, B.M.; Fuller, G.W.; Kelly, F.J.; Loxham, M.; Nicolosi, E.; Priestman, M.; Tremper, A.H.; Green, D.C. PM2.5 on the London Underground. Environ. Int. 2020, 134, 105188. [Google Scholar] [CrossRef] [Scilit] [PubMed]
- Sheikh, H.A.; Tung, P.Y.; Ringe, E.; Harrison, R.J. Magnetic and microscopic investigation of airborne iron oxide nanoparticles in the London Underground. Sci. Rep. 2022, 12, 20298. [Google Scholar] [CrossRef] [Scilit] [PubMed]
- Luglio, D.G.; Katsigeorgis, M.; Hess, J.; Kim, R.; Adragna, J.; Raja, A.; Gordon, C.; Fine, J.; Thurston, G.; Gordon, T.; et al. PM2.5 concentration and composition in subway systems in the northeastern United States. Environ. Health Perspect. 2021, 129, 027001. [Google Scholar] [CrossRef] [Scilit] [PubMed]
- Azad, S.; Luglio, D.G.; Gordon, T.; Thurston, G.; Ghandehari, M. Particulate matter concentration and composition in the New York City subway system. Atmos. Pollut. Res. 2023, 14, 101767. [Google Scholar] [CrossRef] [Scilit] [PubMed]
- Van Ryswyk, K.; Kulka, R.; Jeong, C.H.; Anastasopolos, A.T.; Shin, T.; Blanchard, P.; Veikle, D.; Evans, G.J. Sources of subway PM2.5: Investigation of a system with limited mechanical ventilation. Transp. Res. Part D Transp. Environ. 2024, 133, 104164. [Google Scholar] [CrossRef] [Scilit]
- Wang, S.; Qin, T.; Tu, R.; Li, T.; Chen, G.I.; Green, D.C.; Zhang, X.; Feng, J.; Liu, H.; Hu, M.; et al. Indoor air quality in subway microenvironments: Pollutant characteristics, adverse health impacts, and population inequity. Environ. Int. 2024, 190, 108873. [Google Scholar] [CrossRef] [Scilit] [PubMed]
- Chillrud, S.N.; Epstein, D.; Ross, J.M.; Sax, S.N.; Pederson, D.; Spengler, J.D.; Kinney, P.L. Elevated airborne exposures of teenagers to manganese, chromium, and iron from steel dust and New York City’s subway system. Environ. Sci. Technol. 2004, 38, 732–737. [Google Scholar] [CrossRef] [Scilit] [PubMed]
- Johansson, C.; Johansson, P.-A. Particulate matter in the underground of Stockholm. Atmos. Environ. 2003, 37, 3–9. [Google Scholar] [CrossRef] [Scilit]
- Furuya, K.; Kudo, Y.; Okinaga, K.; Yamuki, M.; Takahashi, S.; Araki, Y.; Hisamatsu, Y. Seasonal variation and their characterization of suspended particulate matter in the air of subway stations. J. Trace Microprobe Tech. 2001, 19, 469–485. [Google Scholar] [CrossRef] [Scilit]
- Sitzmann, B.; Kendall, M.; Williams, I. Characterisation of airborne particles in London by computer-controlled scanning electron microscopy. Sci. Total Environ. 1999, 241, 63–73. [Google Scholar] [CrossRef] [Scilit]
- Pfeifer, G.D.; Harrison, R.M.; Lynam, D.R. Personal exposures to airborne metals in London taxi drivers and office workers in 1995 and 1996. Sci. Total Environ. 1999, 235, 253–260. [Google Scholar] [CrossRef] [Scilit] [PubMed]
- Adams, H.S.; Nieuwenhuijsen, M.J.; Colvile, R.N.; McMullen, M.A.S.; Khandelwal, P. Fine particle (PM2.5) personal exposure levels in transport microenvironments, London, UK. Sci. Total Environ. 2001, 279, 29–44. [Google Scholar] [CrossRef] [Scilit] [PubMed]
- Adams, H.S.; Nieuwenhuijsen, M.J.; Colvile, R.N. Determinants of fine particle (PM2.5) personal exposure levels in transport microenvironments, London, UK. Atmos. Environ. 2001, 35, 4557–4566. [Google Scholar] [CrossRef] [Scilit]
- Chan, L.Y.; Chan, C.Y.; Qin, Y. The effect of commuting microenvironment on commuter exposures to vehicular emission in Hong Kong. Atmos. Environ. 1999, 33, 1777–1787. [Google Scholar] [CrossRef] [Scilit]
- Lin, C.J.; Chuah, Y.K.; Liu, C.W. A study on underground tunnel ventilation for piston effects influenced by draught relief shaft in subway system. Appl. Therm. Eng. 2008, 28, 372–379. [Google Scholar] [CrossRef] [Scilit]
- Wang, C.; Li, X. Improvement measures for air quality in subway stations: Selection of ventilation mode. J. Build. Eng. 2025, 108, 112812. [Google Scholar] [CrossRef] [Scilit]
- Yang, B.; Yao, H.; Wang, F. A review of ventilation and environmental control of underground spaces. Energies 2022, 15, 409. [Google Scholar] [CrossRef] [Scilit]
- Wang, Y.; Feng, H.; Xi, X. Monitoring and autonomous control of Beijing subway HVAC system for energy sustainability. Energy Sustain. Dev. 2017, 39, 1–12. [Google Scholar] [CrossRef] [Scilit]
- Wang, Y.; Feng, H.; Qi, X. SEED: Public energy and environment dataset for optimizing HVAC operation in subway stations. arXiv 2013, arXiv:1312.2632. [Google Scholar]
- Yang, H.; Wang, H.; Wu, Y. Analysis of dynamic characteristics of CO2 concentration in subway cars. E3S Web Conf. 2022, 356, 02019. [Google Scholar] [CrossRef] [Scilit]
- Chan, L.Y.; Lau, W.L.; Zou, S.C.; Cao, Z.X.; Lai, S.C. Exposure level of carbon monoxide and respirable suspended particulate in public transportation modes while commuting in urban area of Guangzhou, China. Atmos. Environ. 2002, 36, 5831–5840. [Google Scholar] [CrossRef] [Scilit]
- Chan, L.Y.; Lau, W.L.; Lee, S.C.; Chan, C.Y. Commuter exposure to particulate matter in public transportation modes in Hong Kong. Atmos. Environ. 2002, 36, 3363–3373. [Google Scholar] [CrossRef] [Scilit]
- Gulliver, J.; Briggs, D.J. Personal exposure to particulate air pollution in transport microenvironments. Atmos. Environ. 2004, 38, 1–8. [Google Scholar] [CrossRef] [Scilit]
- Monn, C. Exposure assessment of air pollutants: A review on spatial heterogeneity and indoor/outdoor/personal exposure to suspended particulate matter, nitrogen dioxide and ozone. Atmos. Environ. 2001, 35, 1–32. [Google Scholar] [CrossRef] [Scilit]
- Chow, J.C.; Engelbrecht, J.P.; Watson, J.G.; Wilson, W.E.; Frank, N.H.; Zhu, T. Designing monitoring networks to represent outdoor human exposure. Chemosphere 2002, 49, 961–978. [Google Scholar] [CrossRef] [Scilit] [PubMed]
- Görner, P.; Bemer, D.; Fabriès, J.F. Photometer measurement of polydisperse aerosols. J. Aerosol Sci. 1995, 26, 1281–1302. [Google Scholar] [CrossRef] [Scilit]
- Jenkins, R.A.; Ilgner, R.H.; Tomkins, B.A.; Peters, D.W. Development and application of protocols for the determination of response of real-time particle monitors to common indoor aerosols. J. Air Waste Manag. Assoc. 2004, 54, 229–241. [Google Scholar] [CrossRef] [Scilit] [PubMed]
- Morawska, L.; He, C.; Hitchins, J.; Mengersen, K.; Gilbert, D. Characteristics of particle number and mass concentrations in residential houses in Brisbane, Australia. Atmos. Environ. 2003, 37, 4195–4203. [Google Scholar] [CrossRef] [Scilit]
- Ramachandran, G.; Adgate, J.L.; Pratt, G.C.; Sexton, K. Characterizing indoor and outdoor 15-minute average PM2.5 concentrations in urban neighborhoods. Aerosol Sci. Technol. 2003, 37, 33–45. [Google Scholar] [CrossRef] [Scilit]
- Wu, Y.; Hao, J.; Fu, L.; Wang, Z.; Tang, U. Vertical and horizontal profiles of airborne particulate matter near major roads in Macao, China. Atmos. Environ. 2002, 36, 4907–4918. [Google Scholar] [CrossRef] [Scilit]
- Yanosky, J.D.; Williams, P.L.; MacIntosh, D.L. A comparison of two direct-reading aerosol monitors with the Federal Reference Method for PM2.5 in indoor air. Atmos. Environ. 2002, 36, 107–113. [Google Scholar] [CrossRef] [Scilit]
- Gao, Y.; Chen, F.; Wang, Z. The distribution and influential factors of PM2.5 and CO2 in urban rail carriages. Indoor Built Environ. 2019, 28, 1383–1395. [Google Scholar] [CrossRef] [Scilit]
- Wang, Q.; Wu, L.; Jiang, Y.; Xu, Z. A study of thermal environment patterns in subway cars and the influence of age on passenger comfort. Case Stud. Therm. Eng. 2025, 72, 106268. [Google Scholar] [CrossRef] [Scilit]
- ISO 7730:2005; Ergonomics of the Thermal Environment—Analytical Determination and Interpretation of Thermal Comfort Using Calculation of the PMV and PPD Indices and Local Thermal Comfort Criteria. International Organization for Standardization: Geneva, Switzerland, 2005.
- ASHRAE Standard 55-2023; Thermal Environmental Conditions for Human Occupancy. ASHRAE: Atlanta, GA, USA, 2023.
- EN 14750:2024; Railway Applications—Air Conditioning for Urban, Suburban and Regional Rolling Stock: Comfort Parameters and Type Tests. European Committee for Standardization: Brussels, Belgium, 2024.
- Cusack, M.; Talbot, N.; Ondráček, J.; Minguillón, M.C.; Martins, V.; Klouda, K.; Schwarz, J.; Ždímal, V. Variability of aerosols and chemical composition of PM10, PM2.5 and PM1 on a platform of the Prague underground metro. Atmos. Environ. 2015, 118, 176–183. [Google Scholar] [CrossRef] [Scilit]
- ISO 3381:2021; Railway Applications—Acoustics—Noise Measurement inside Railbound Vehicles. International Organization for Standardization: Geneva, Switzerland, 2021.
- ISO 3095:2013; Acoustics—Railway Applications—Measurement of Noise Emitted by Railbound Vehicles. International Organization for Standardization: Geneva, Switzerland, 2013.
- Niewczas, A.; Mórawski, Ł.; Debicka, E.; Rymarz, J.; Kasperek, D.; Hołyszko, P. A Comparative Study of the Availability of Electric Buses in the Public Transport System. Appl. Sci. 2025, 15, 1212. [Google Scholar] [CrossRef] [Scilit]
- Dacarro, F.; Musante, G. Trams: Bridging the Past and Future—Example Guidelines for Tram Redesign Illustrated by a Case Study from Korea. Appl. Sci. 2025, 15, 990. [Google Scholar] [CrossRef] [Scilit]
- Bosch-Checa, C.; Lorenzo-Saez, E.; Haza, M.J.P.d.l.; Lerma-Arce, V.; Coll-Aliaga, E. Evaluation of the Accessibility to Urban Mobility Services with High Spatial Resolution—Case Study: Valencia (Spain). Appl. Sci. 2025, 15, 1382. [Google Scholar] [CrossRef] [Scilit]
- Roszkowska, E.; Wachowicz, T. Smart Cities and ResidentWell-Being: Using the BTOPSISMethod to Assess Citizen Life Satisfaction in European Cities. Appl. Sci. 2024, 14, 11051. [Google Scholar] [CrossRef] [Scilit]
- Jiménez García, C.; Porres de la Haza, M.J.; Coll Aliaga, E.; Lerma-Arce, V.; Lorenzo-Sáez, E. Methodology for Measuring Mobility Emissions with High Spatial Resolution: Case Study in Valencia, Spain. Appl. Sci. 2025, 15, 669. [Google Scholar] [CrossRef] [Scilit]
- Xu, B.; Hao, J. Air quality inside subway metro indoor environment worldwide: A review. Environ. Int. 2017, 107, 33–46. [Google Scholar] [CrossRef] [Scilit] [PubMed]
- Cui, Y.; Liu, Z.; Wu, H.; Sun, P.; Zhou, F. Evaluation of Urban Transportation Resilience under ExtremeWeather Events. Appl. Sci. 2024, 14, 4947. [Google Scholar] [CrossRef] [Scilit]
- Zhao, Y.; Gu, C.; Song, X. Evaluation of indoor environmental quality, personal cumulative exposure dose, and aerosol transmission risk levels inside urban buses in Dalian, China. Environ. Sci. Pollut. Res. 2023, 30, 55278–55297. [Google Scholar] [CrossRef] [Scilit] [PubMed]
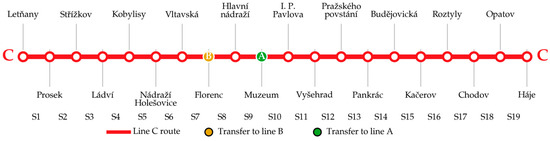
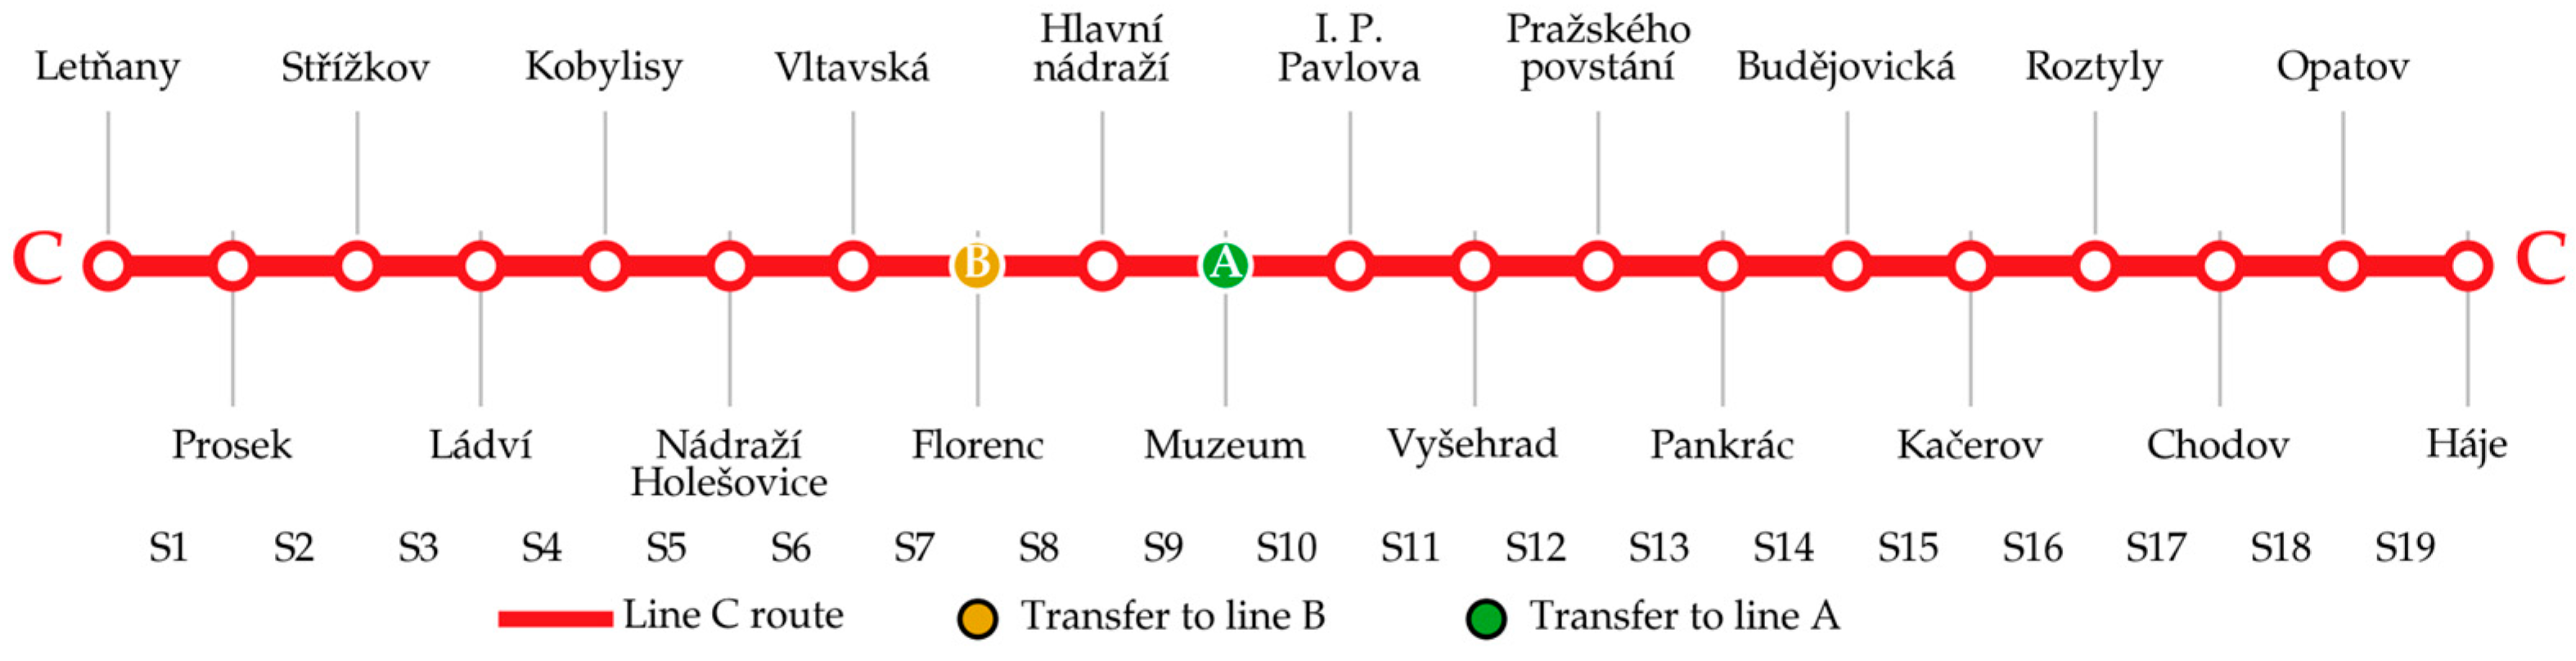
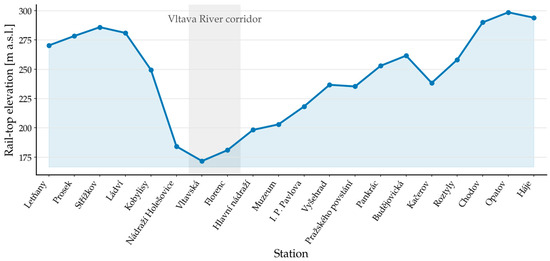
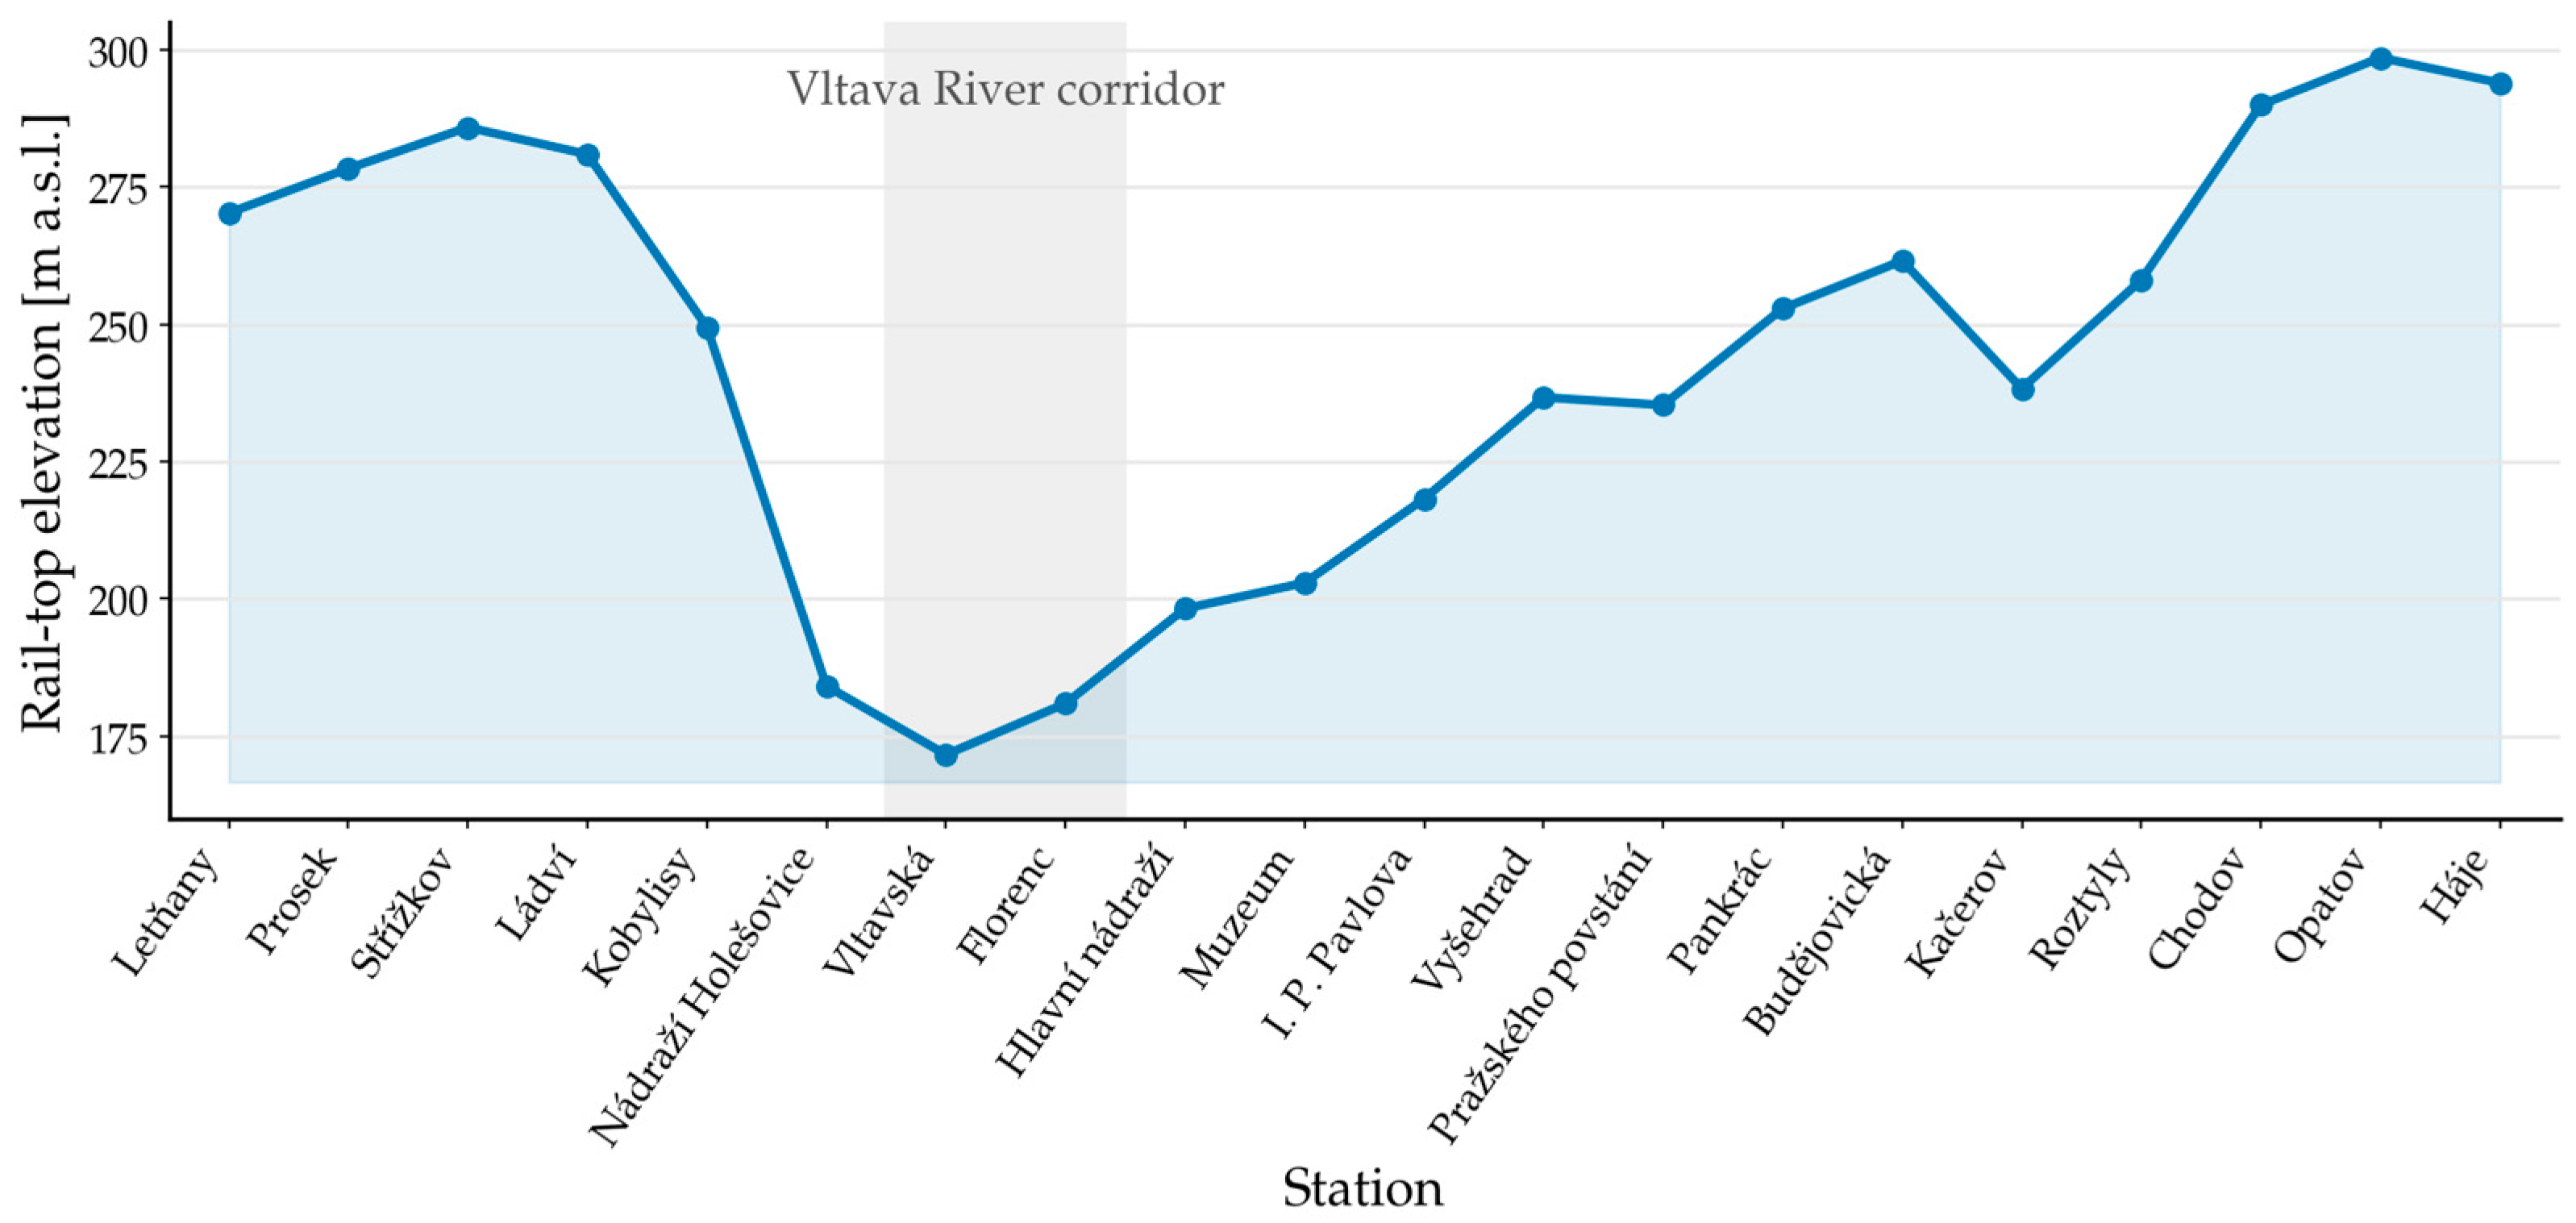
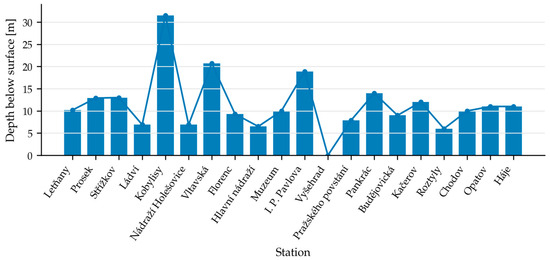
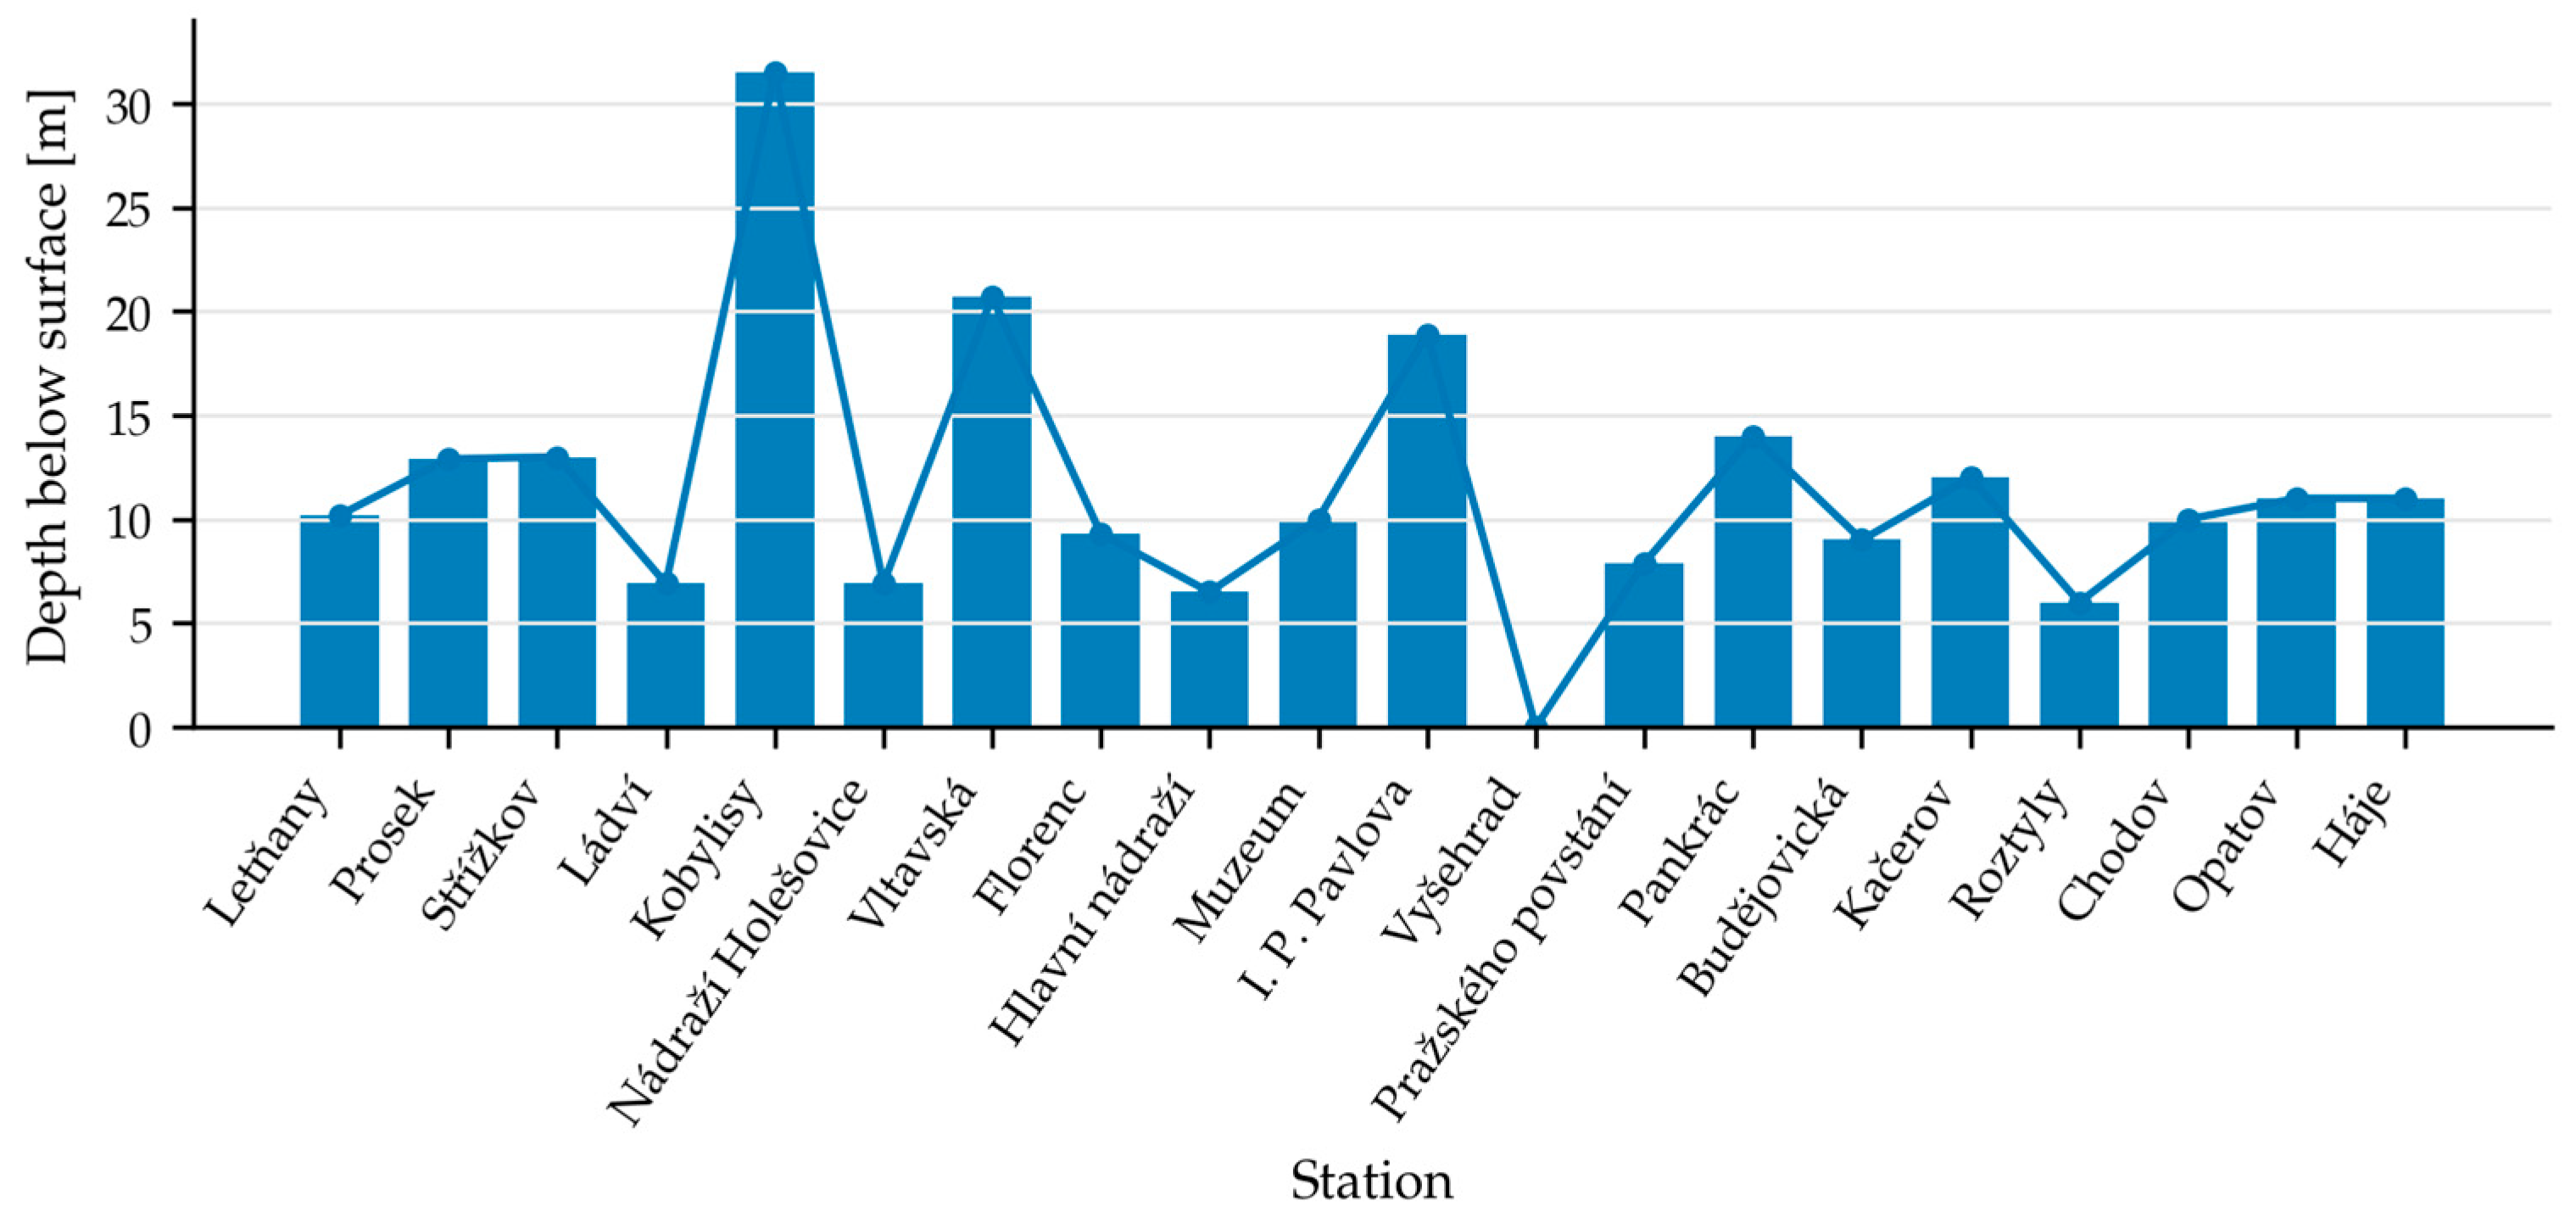
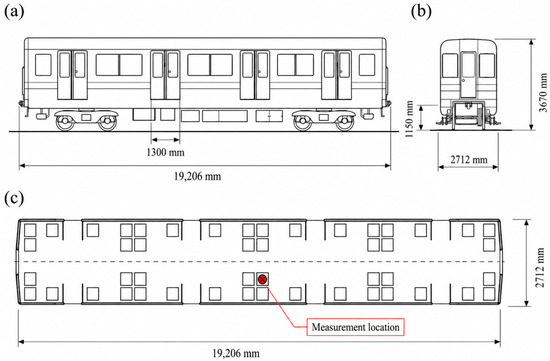
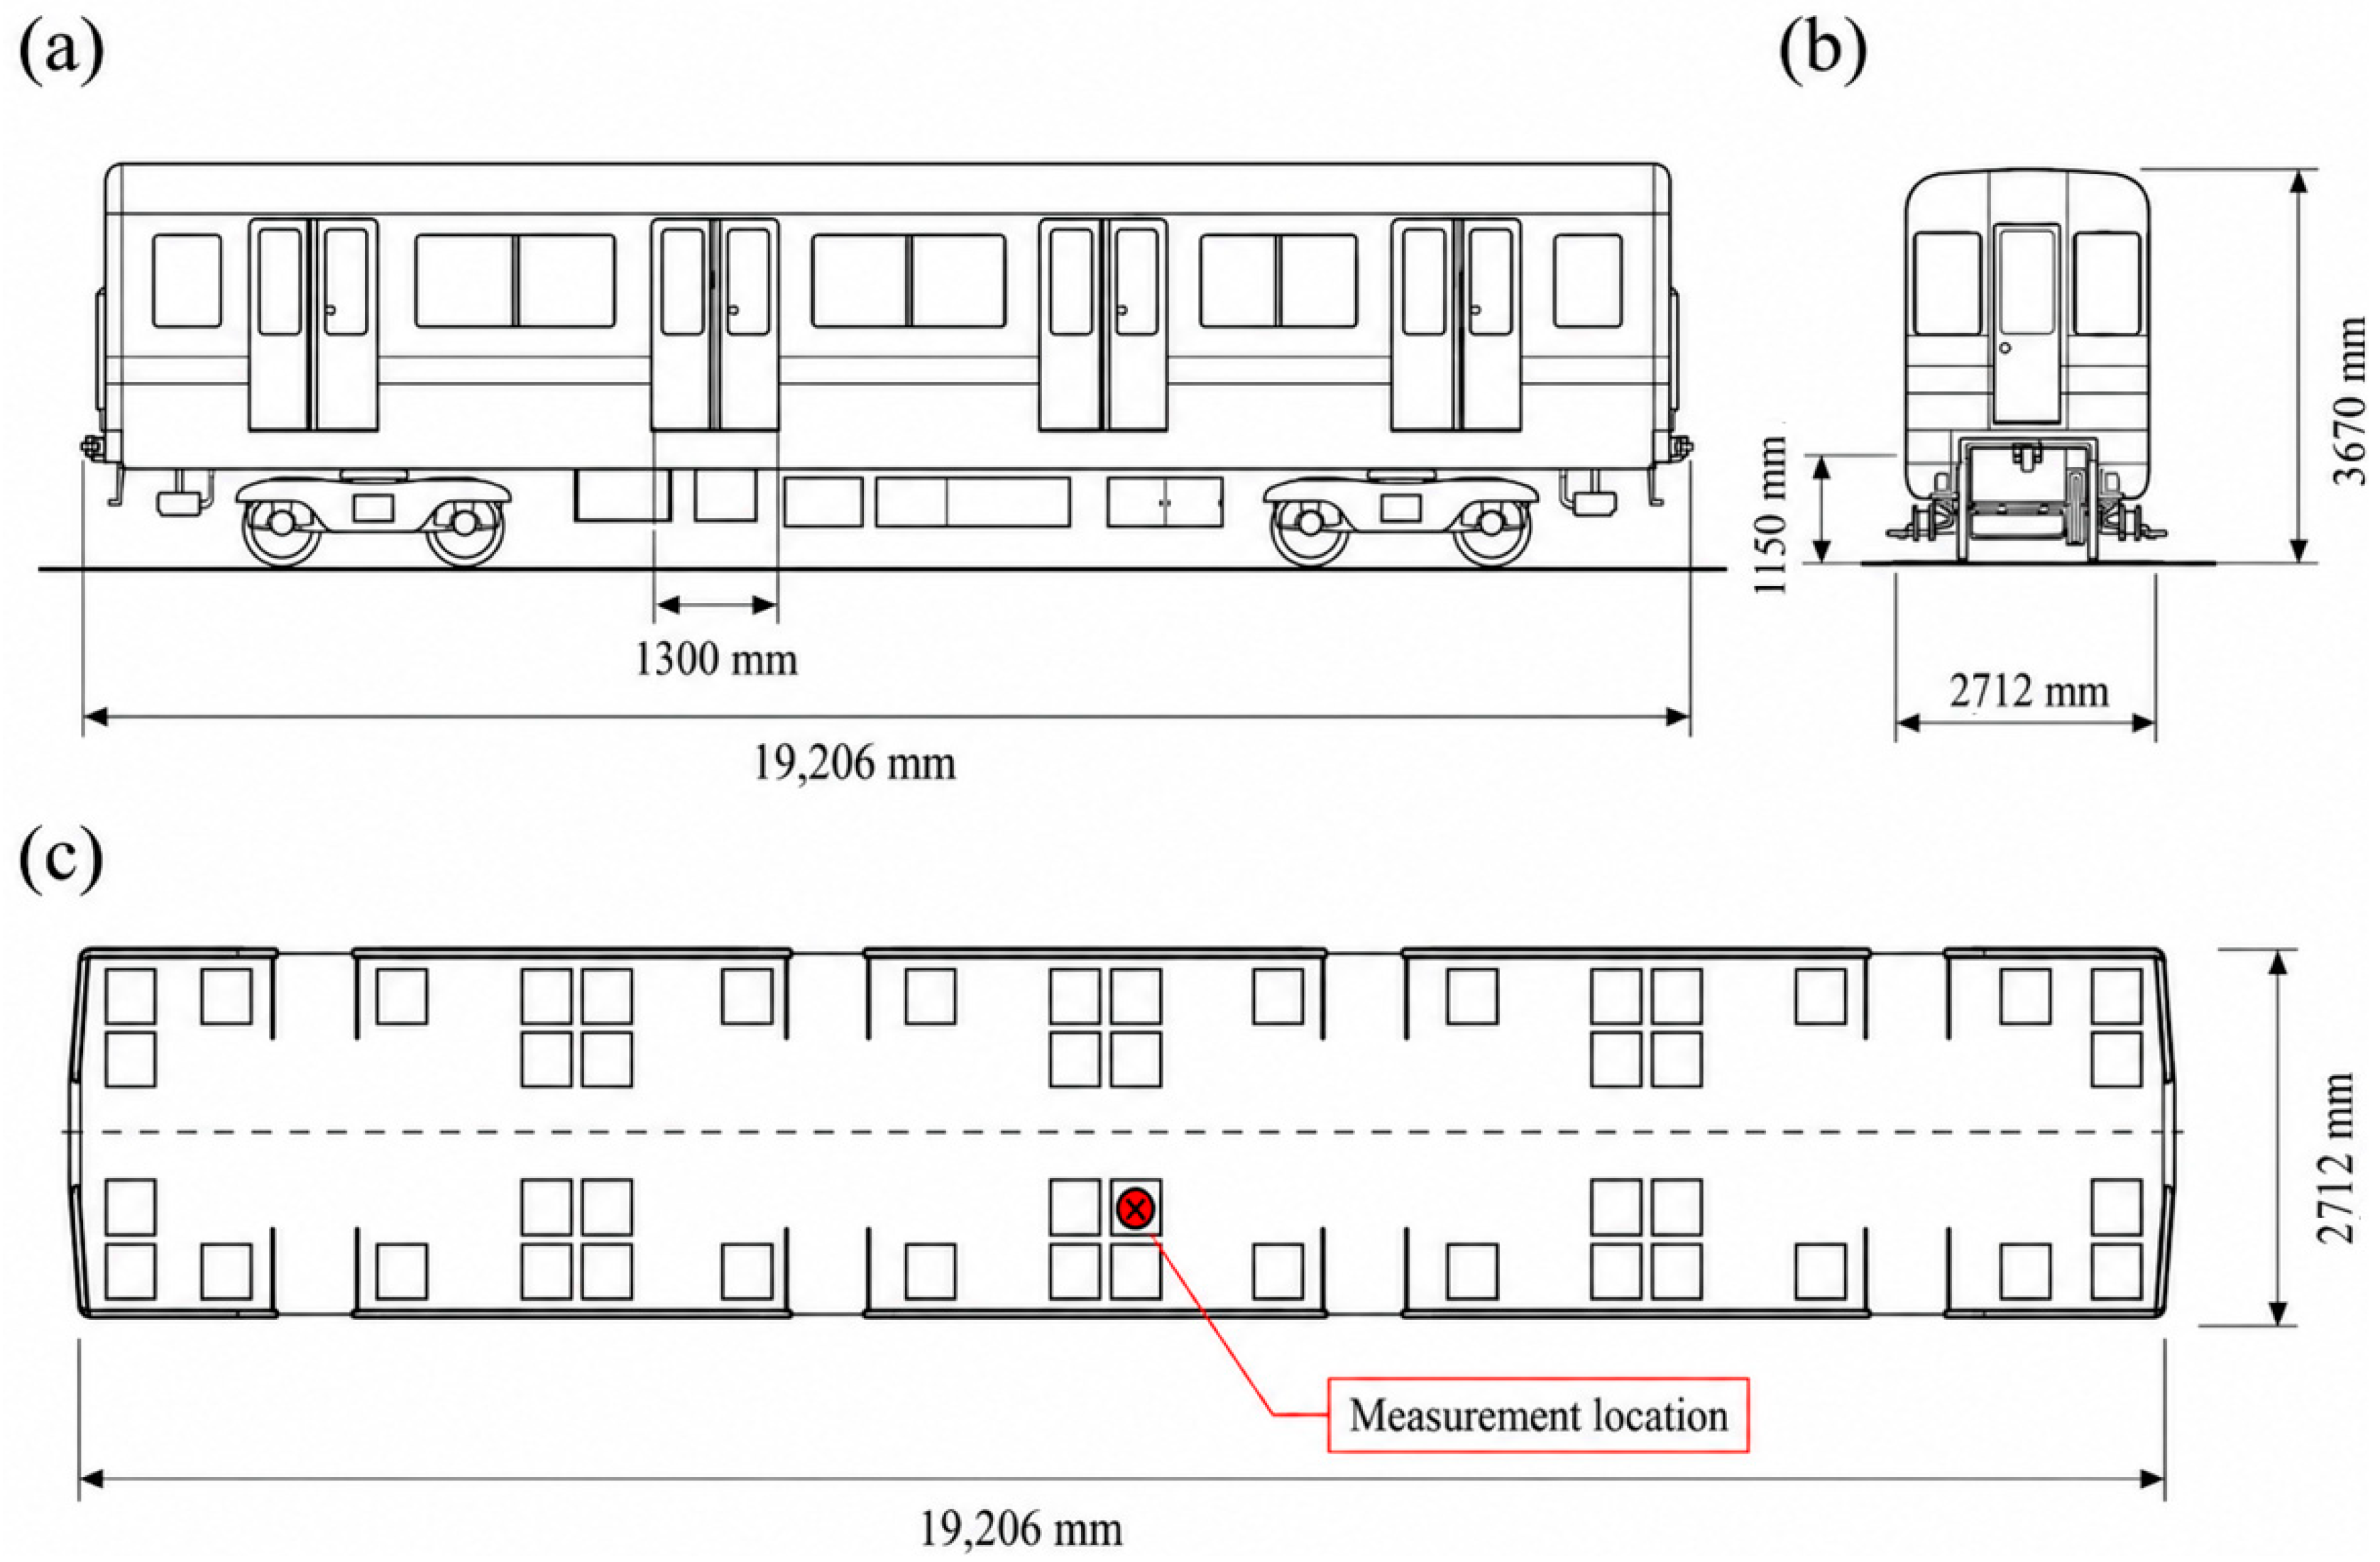
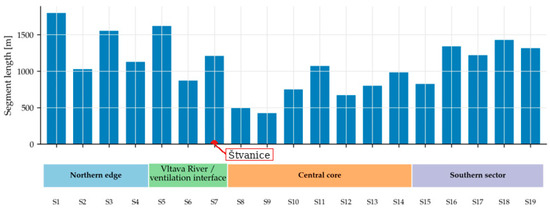
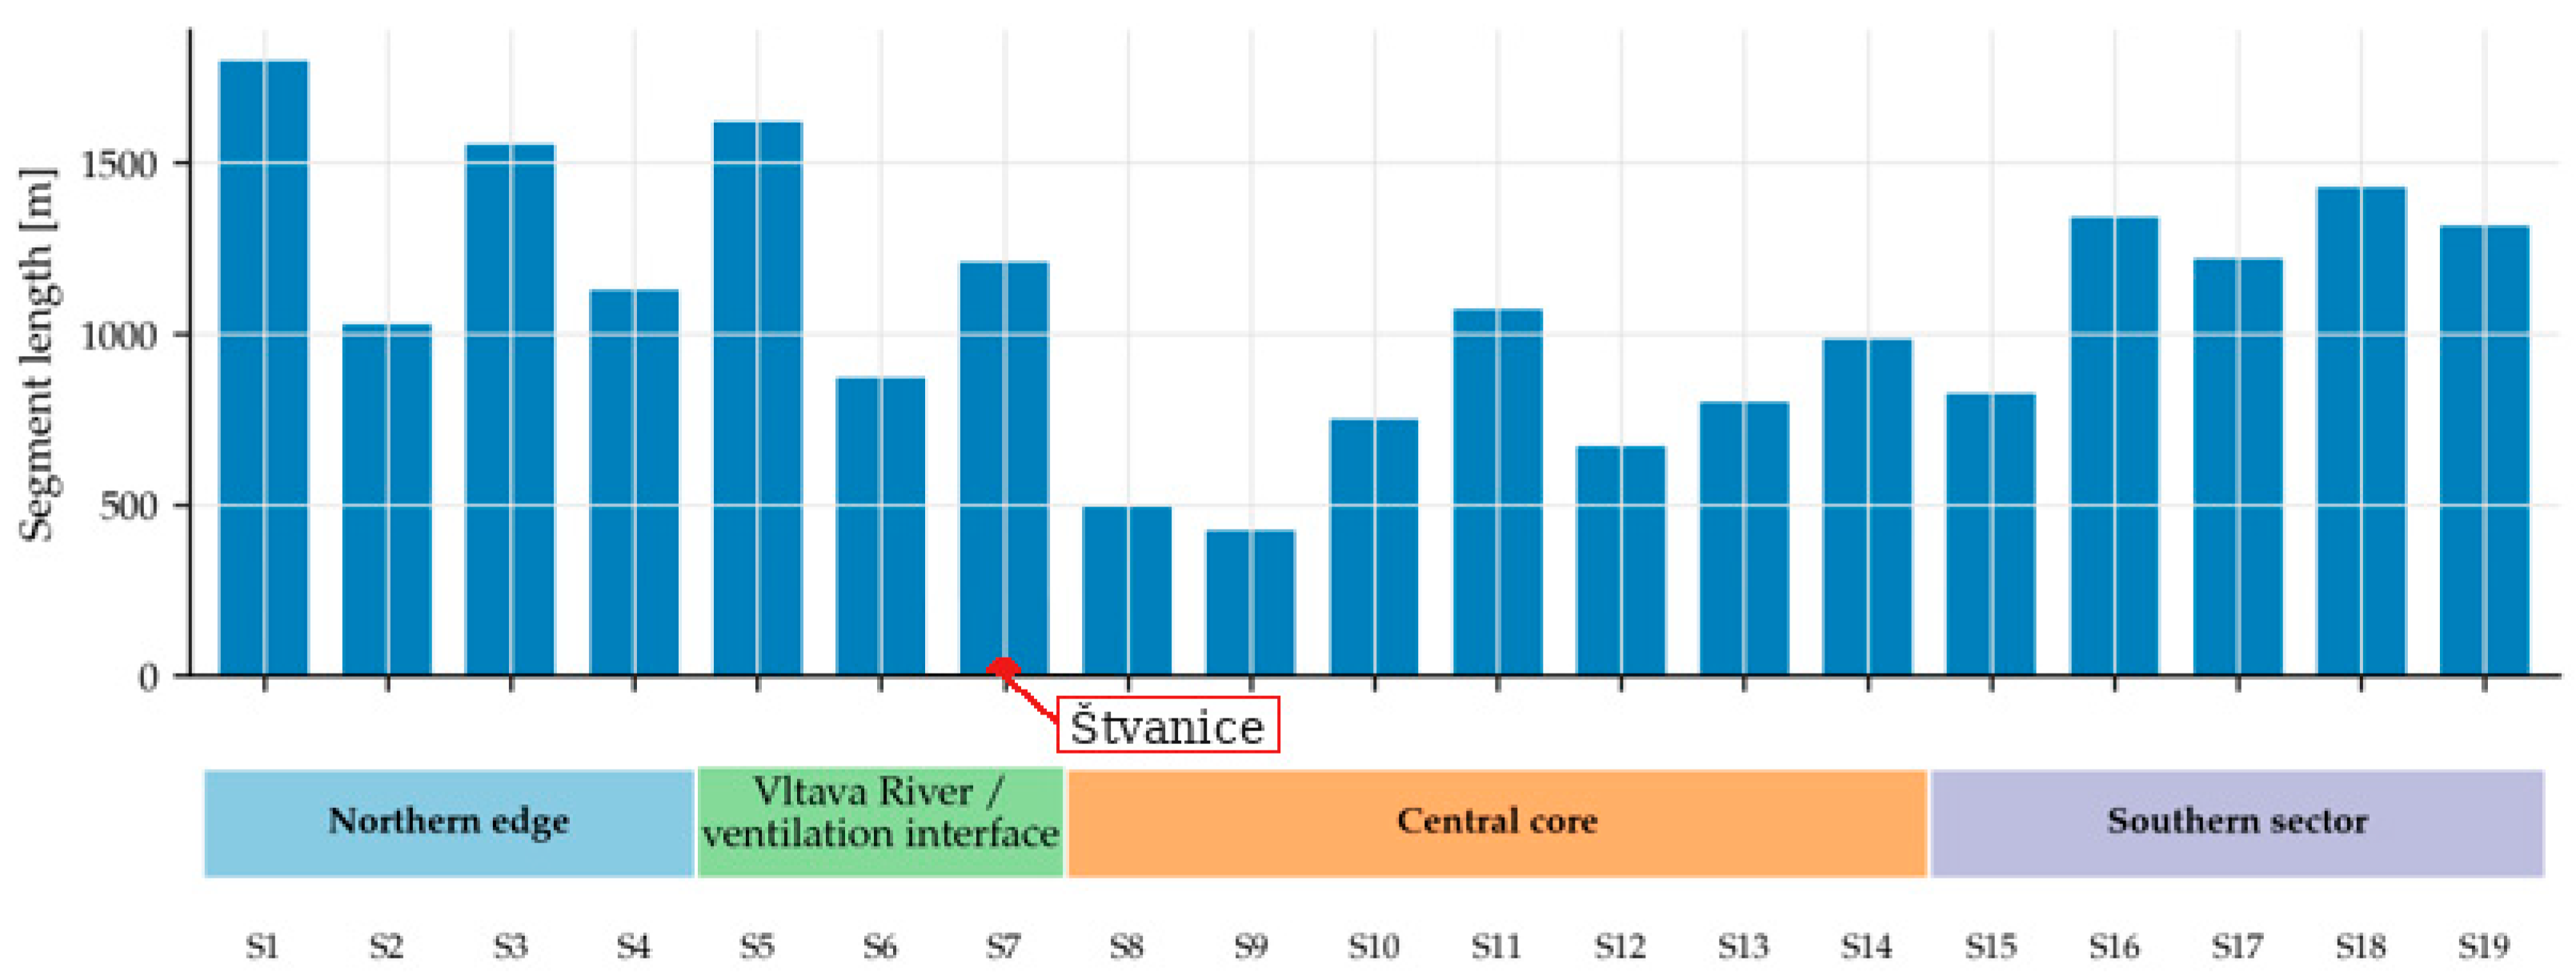
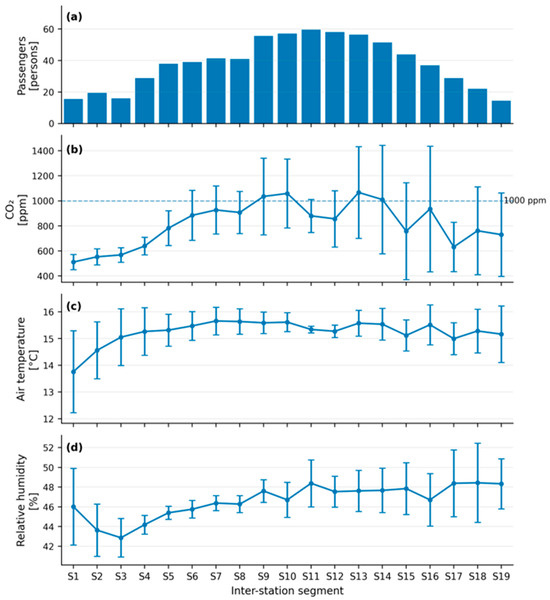
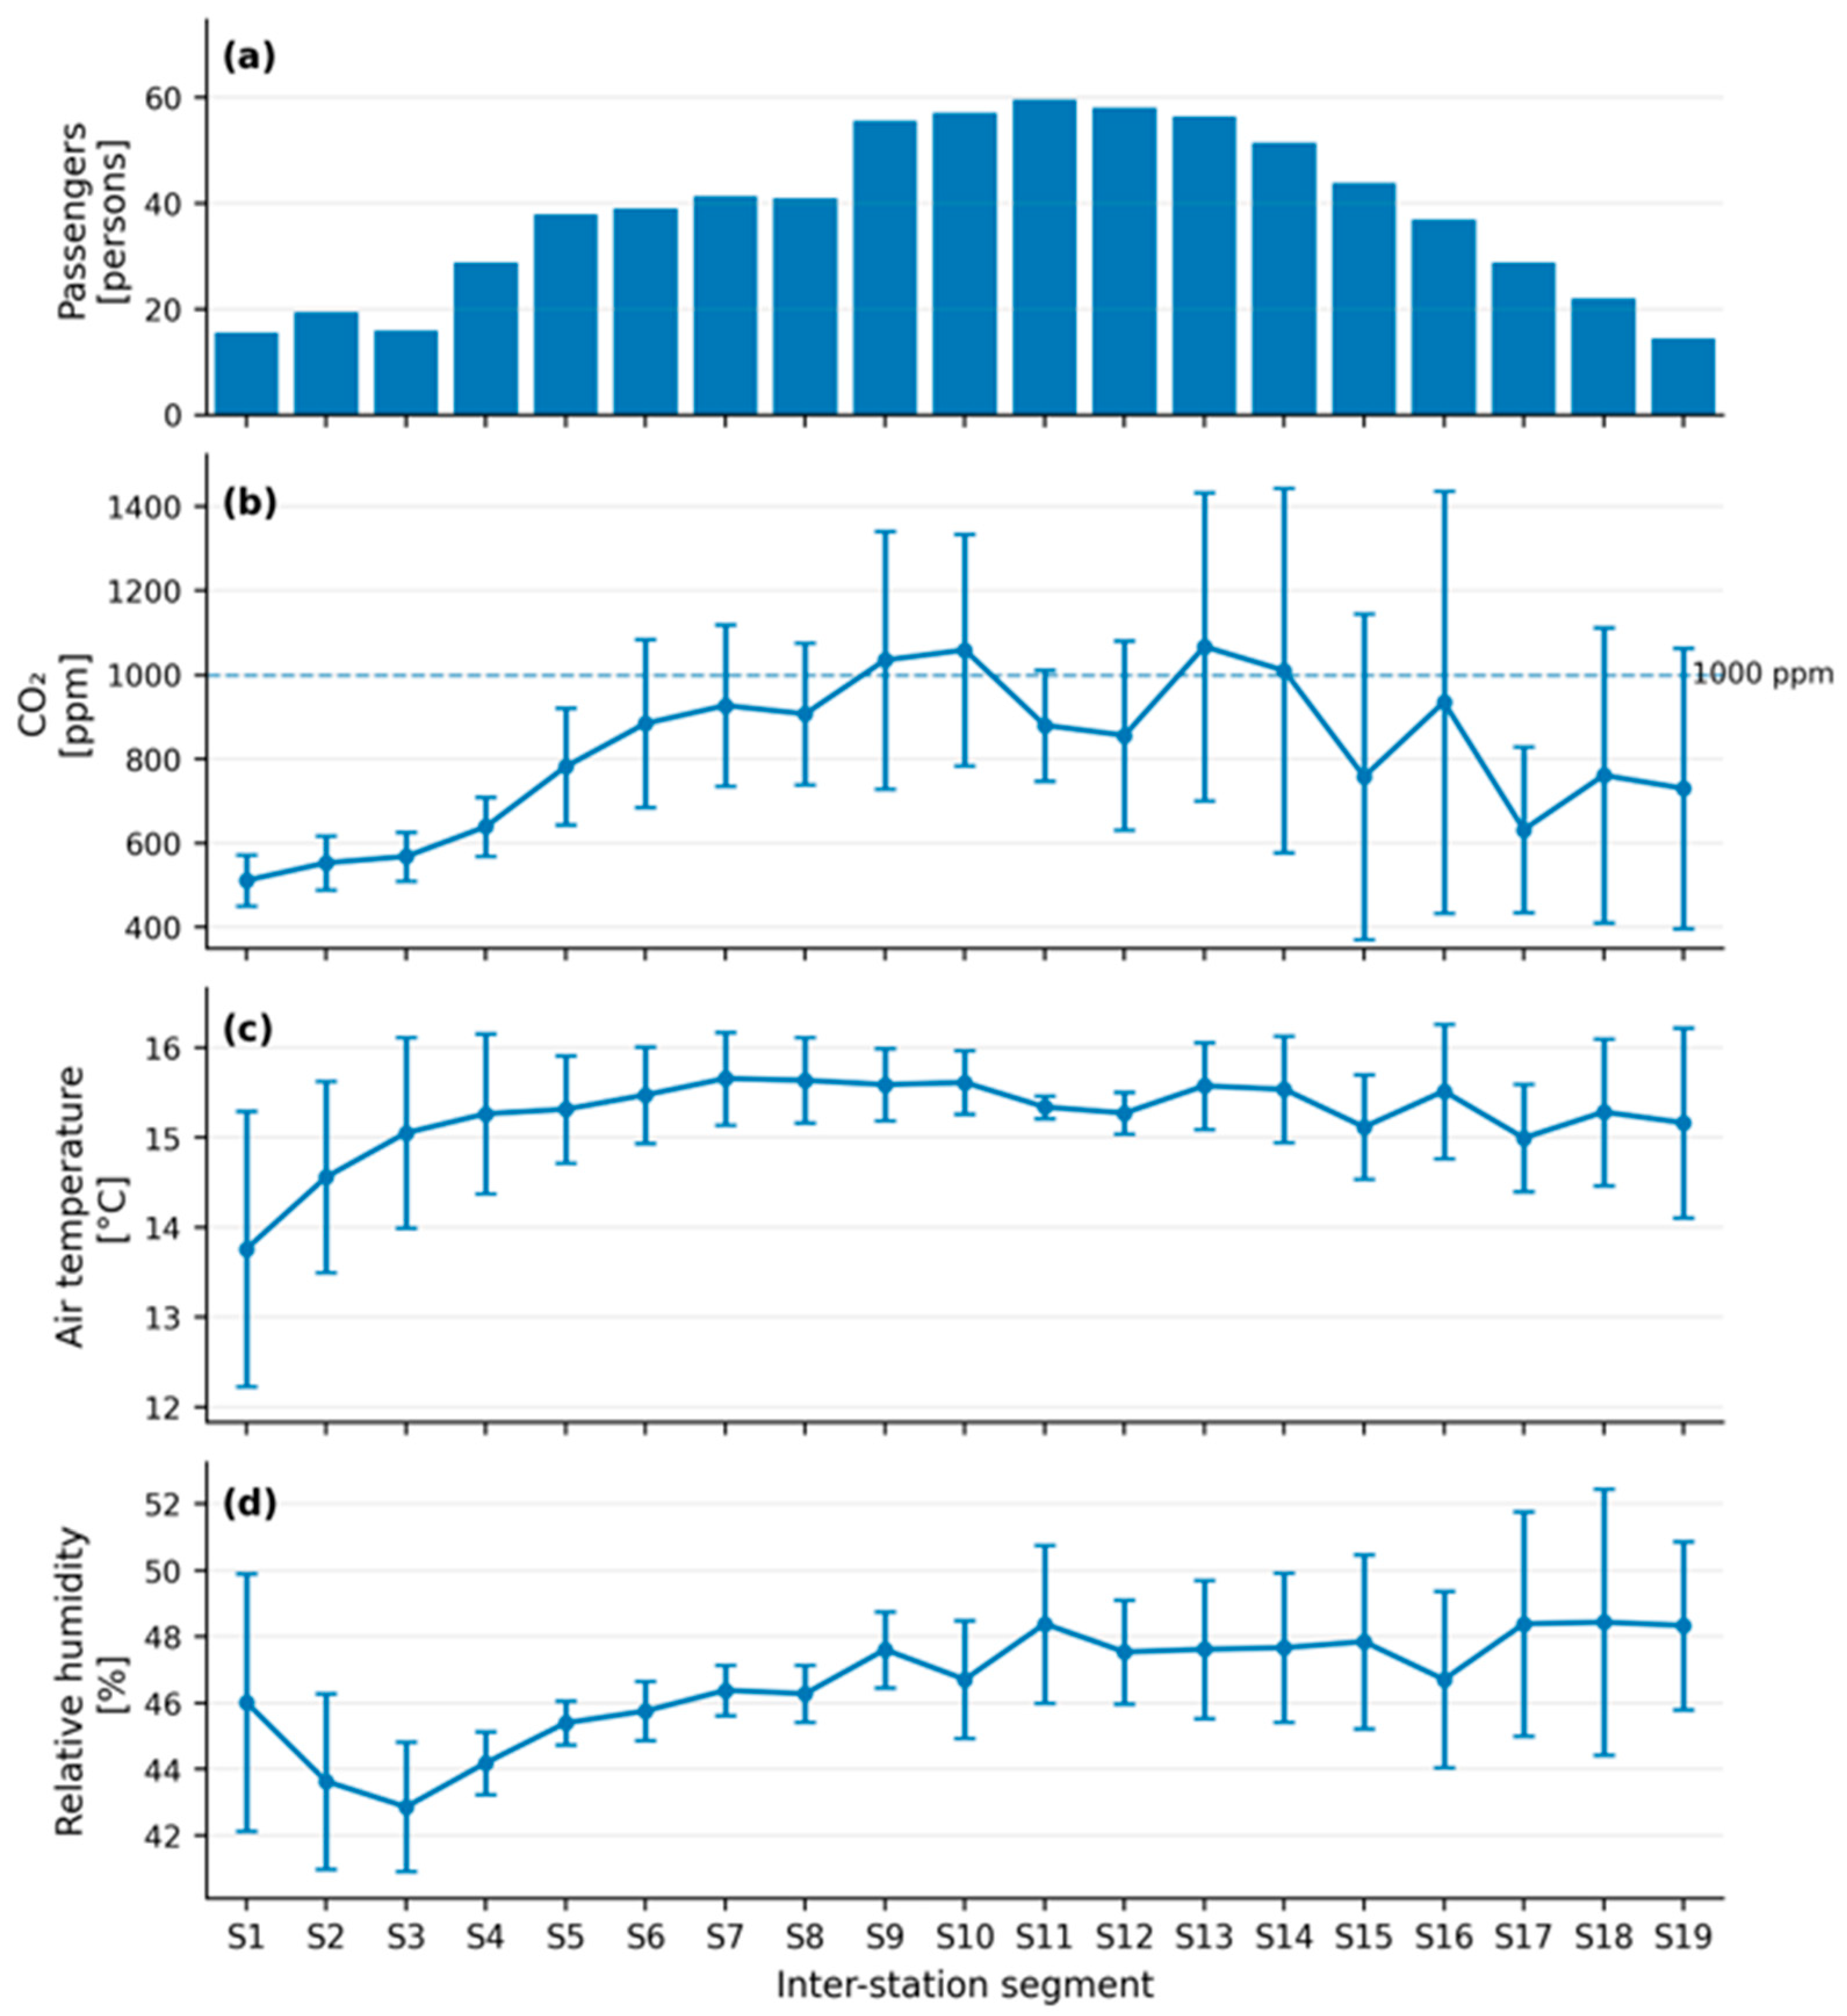
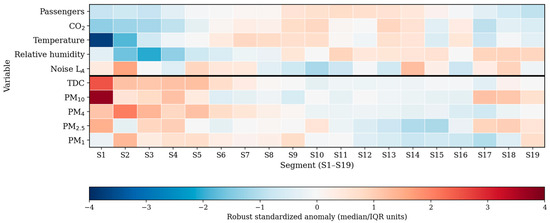
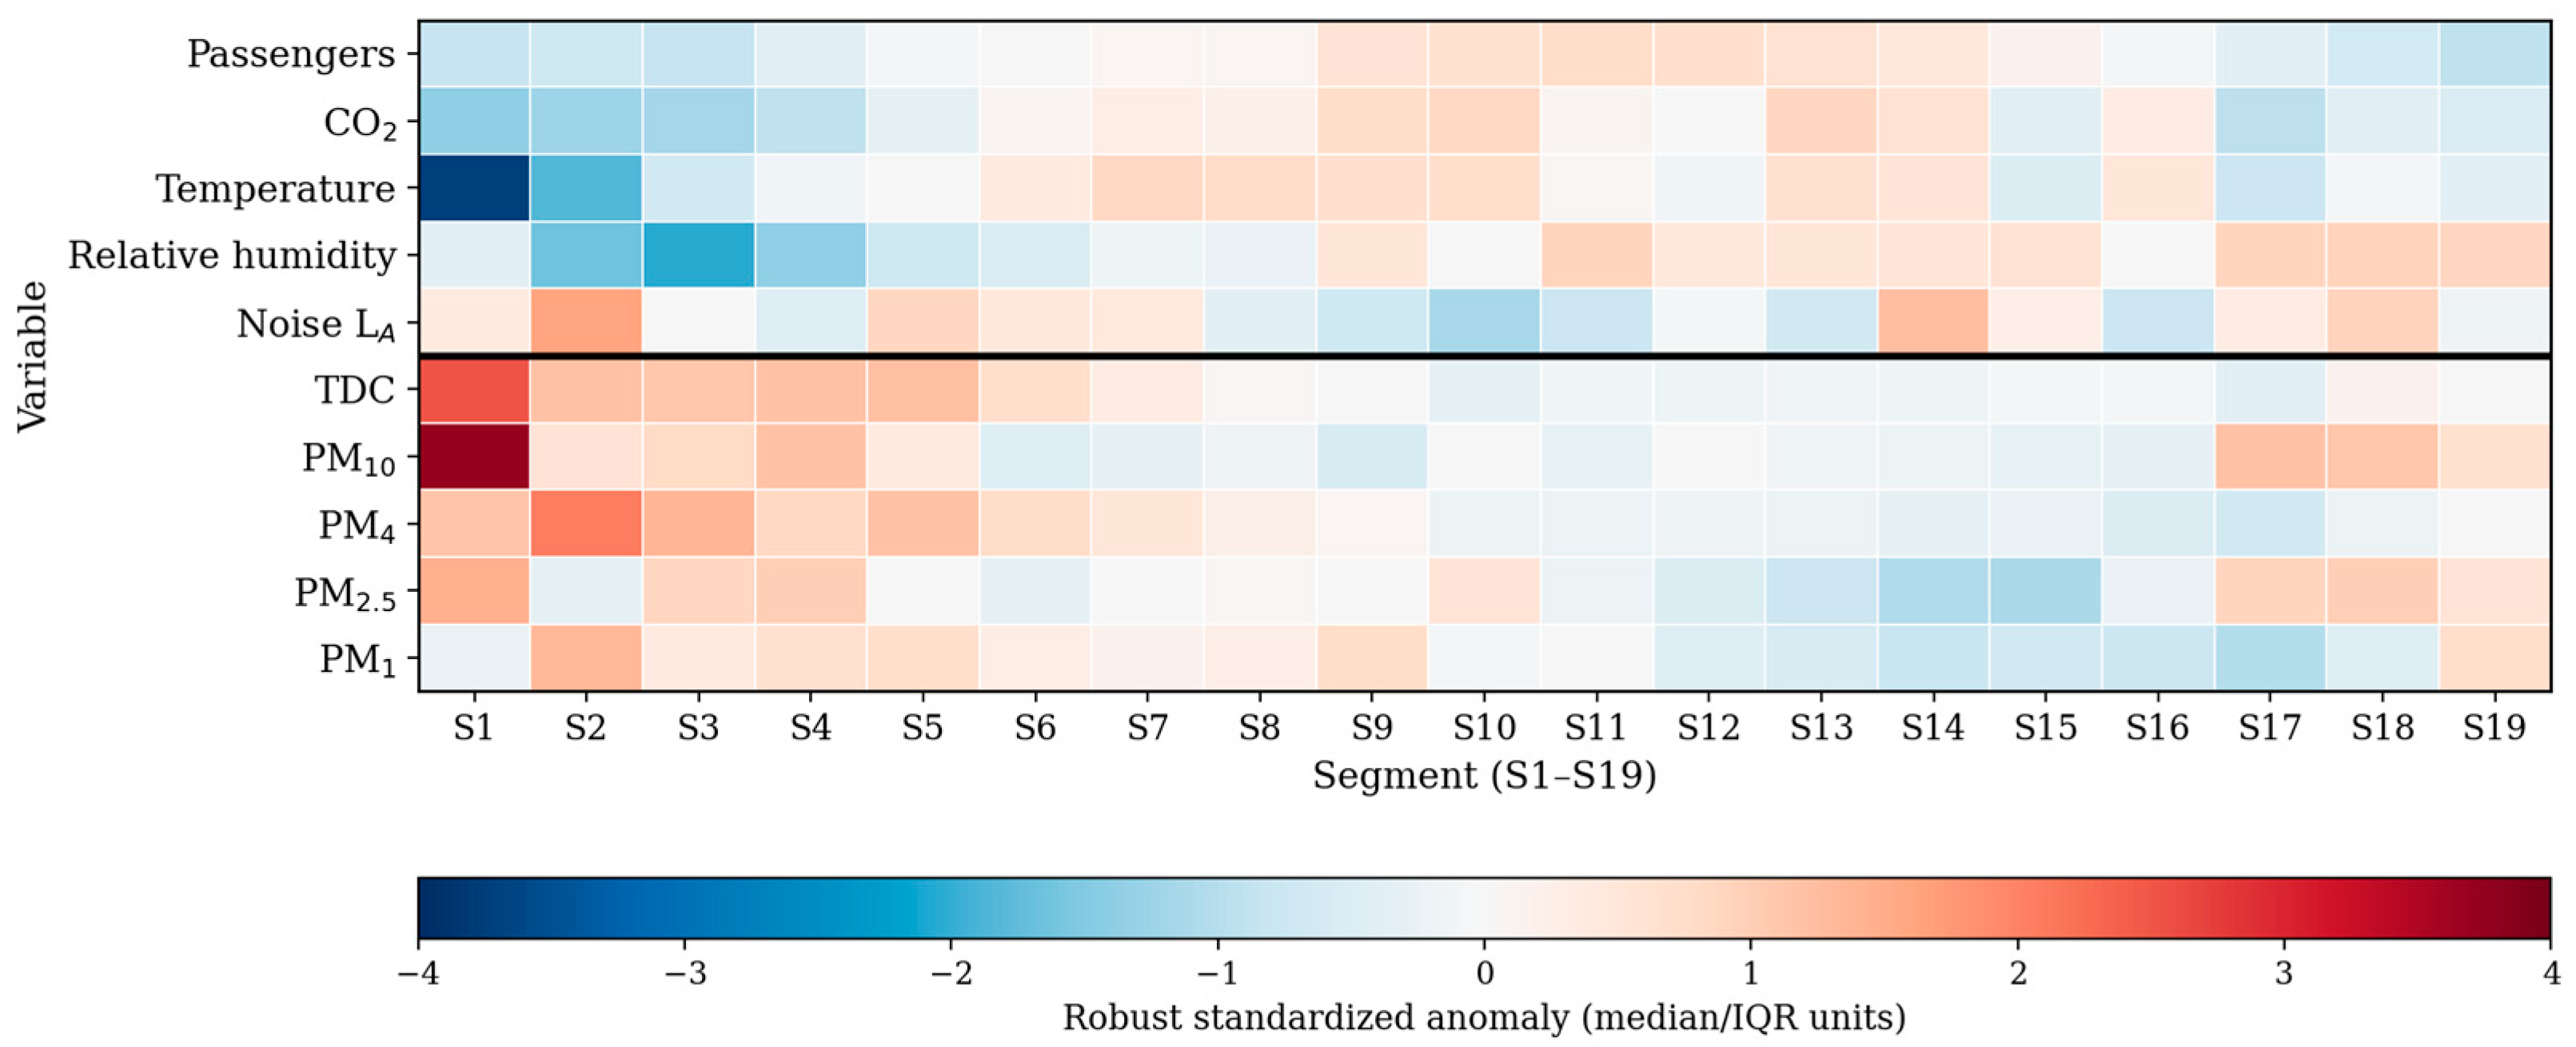
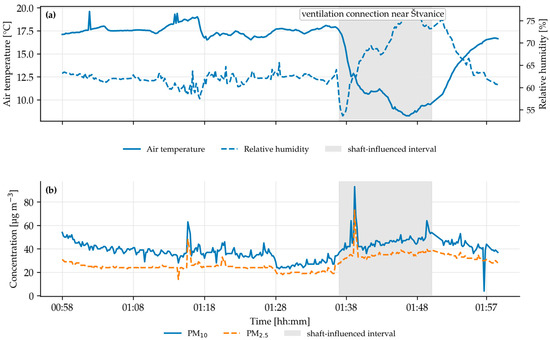
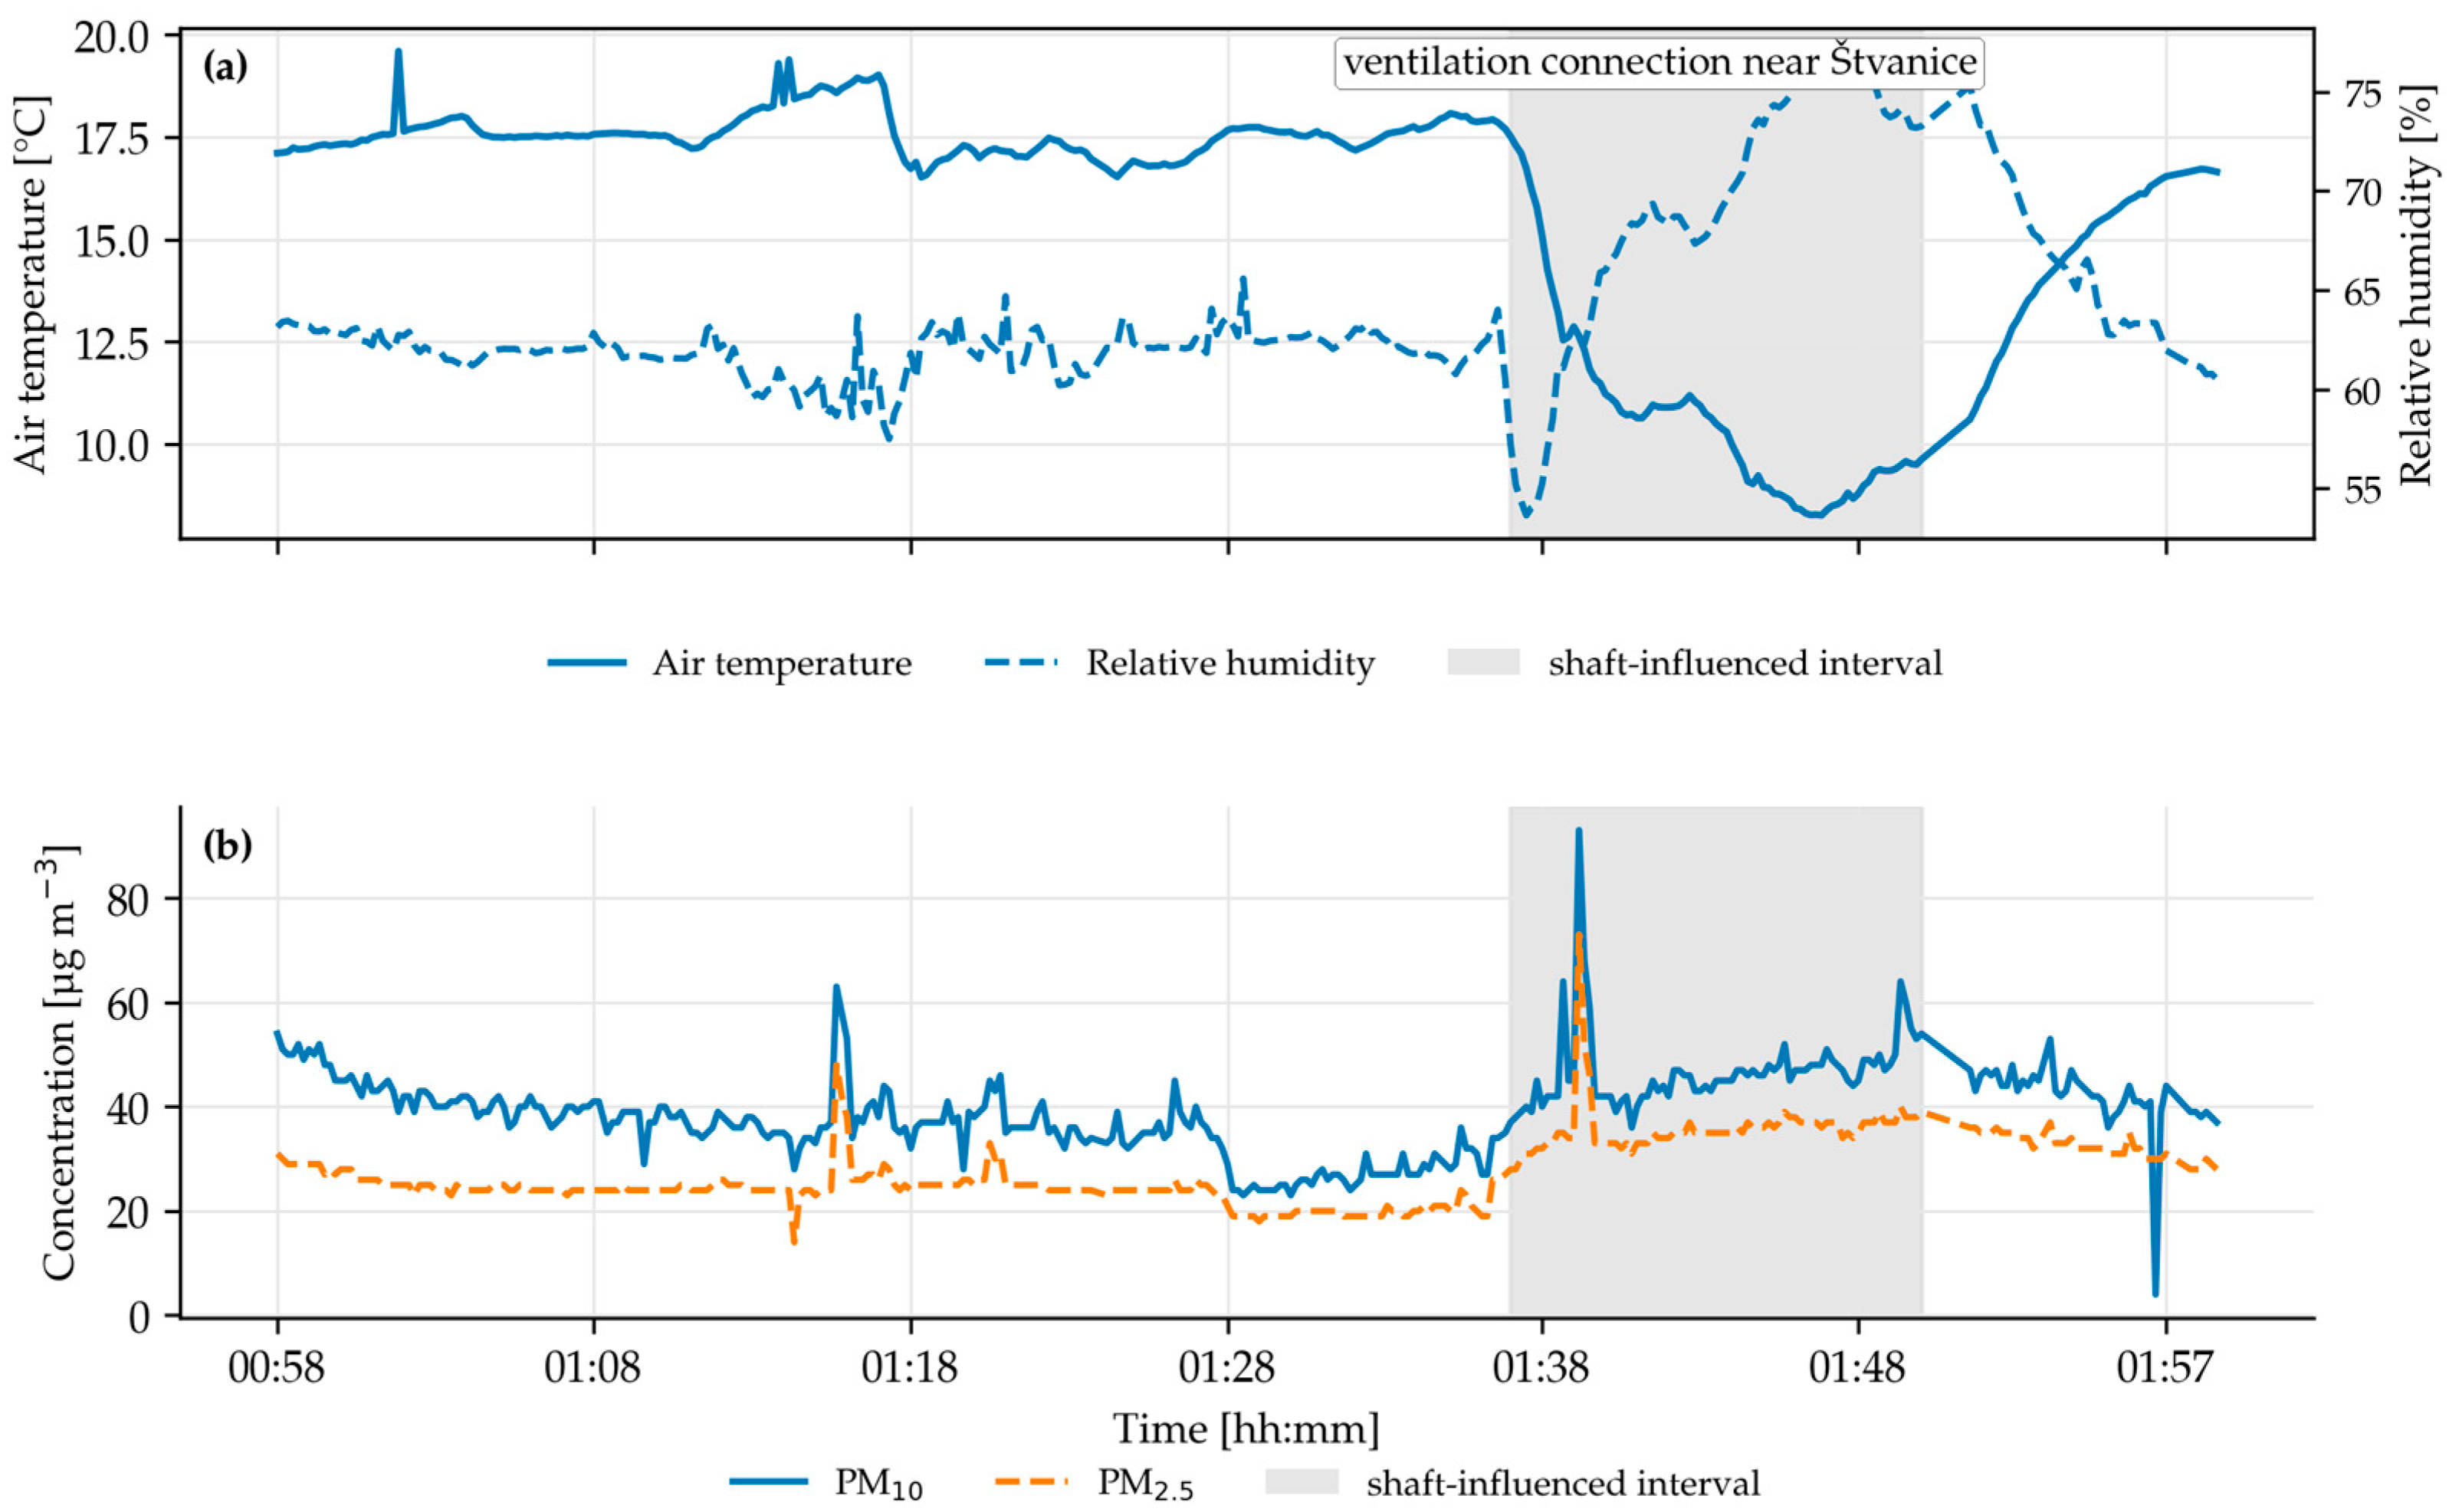
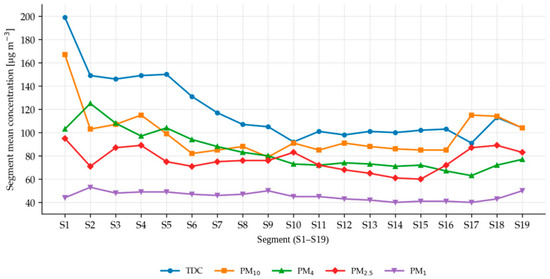
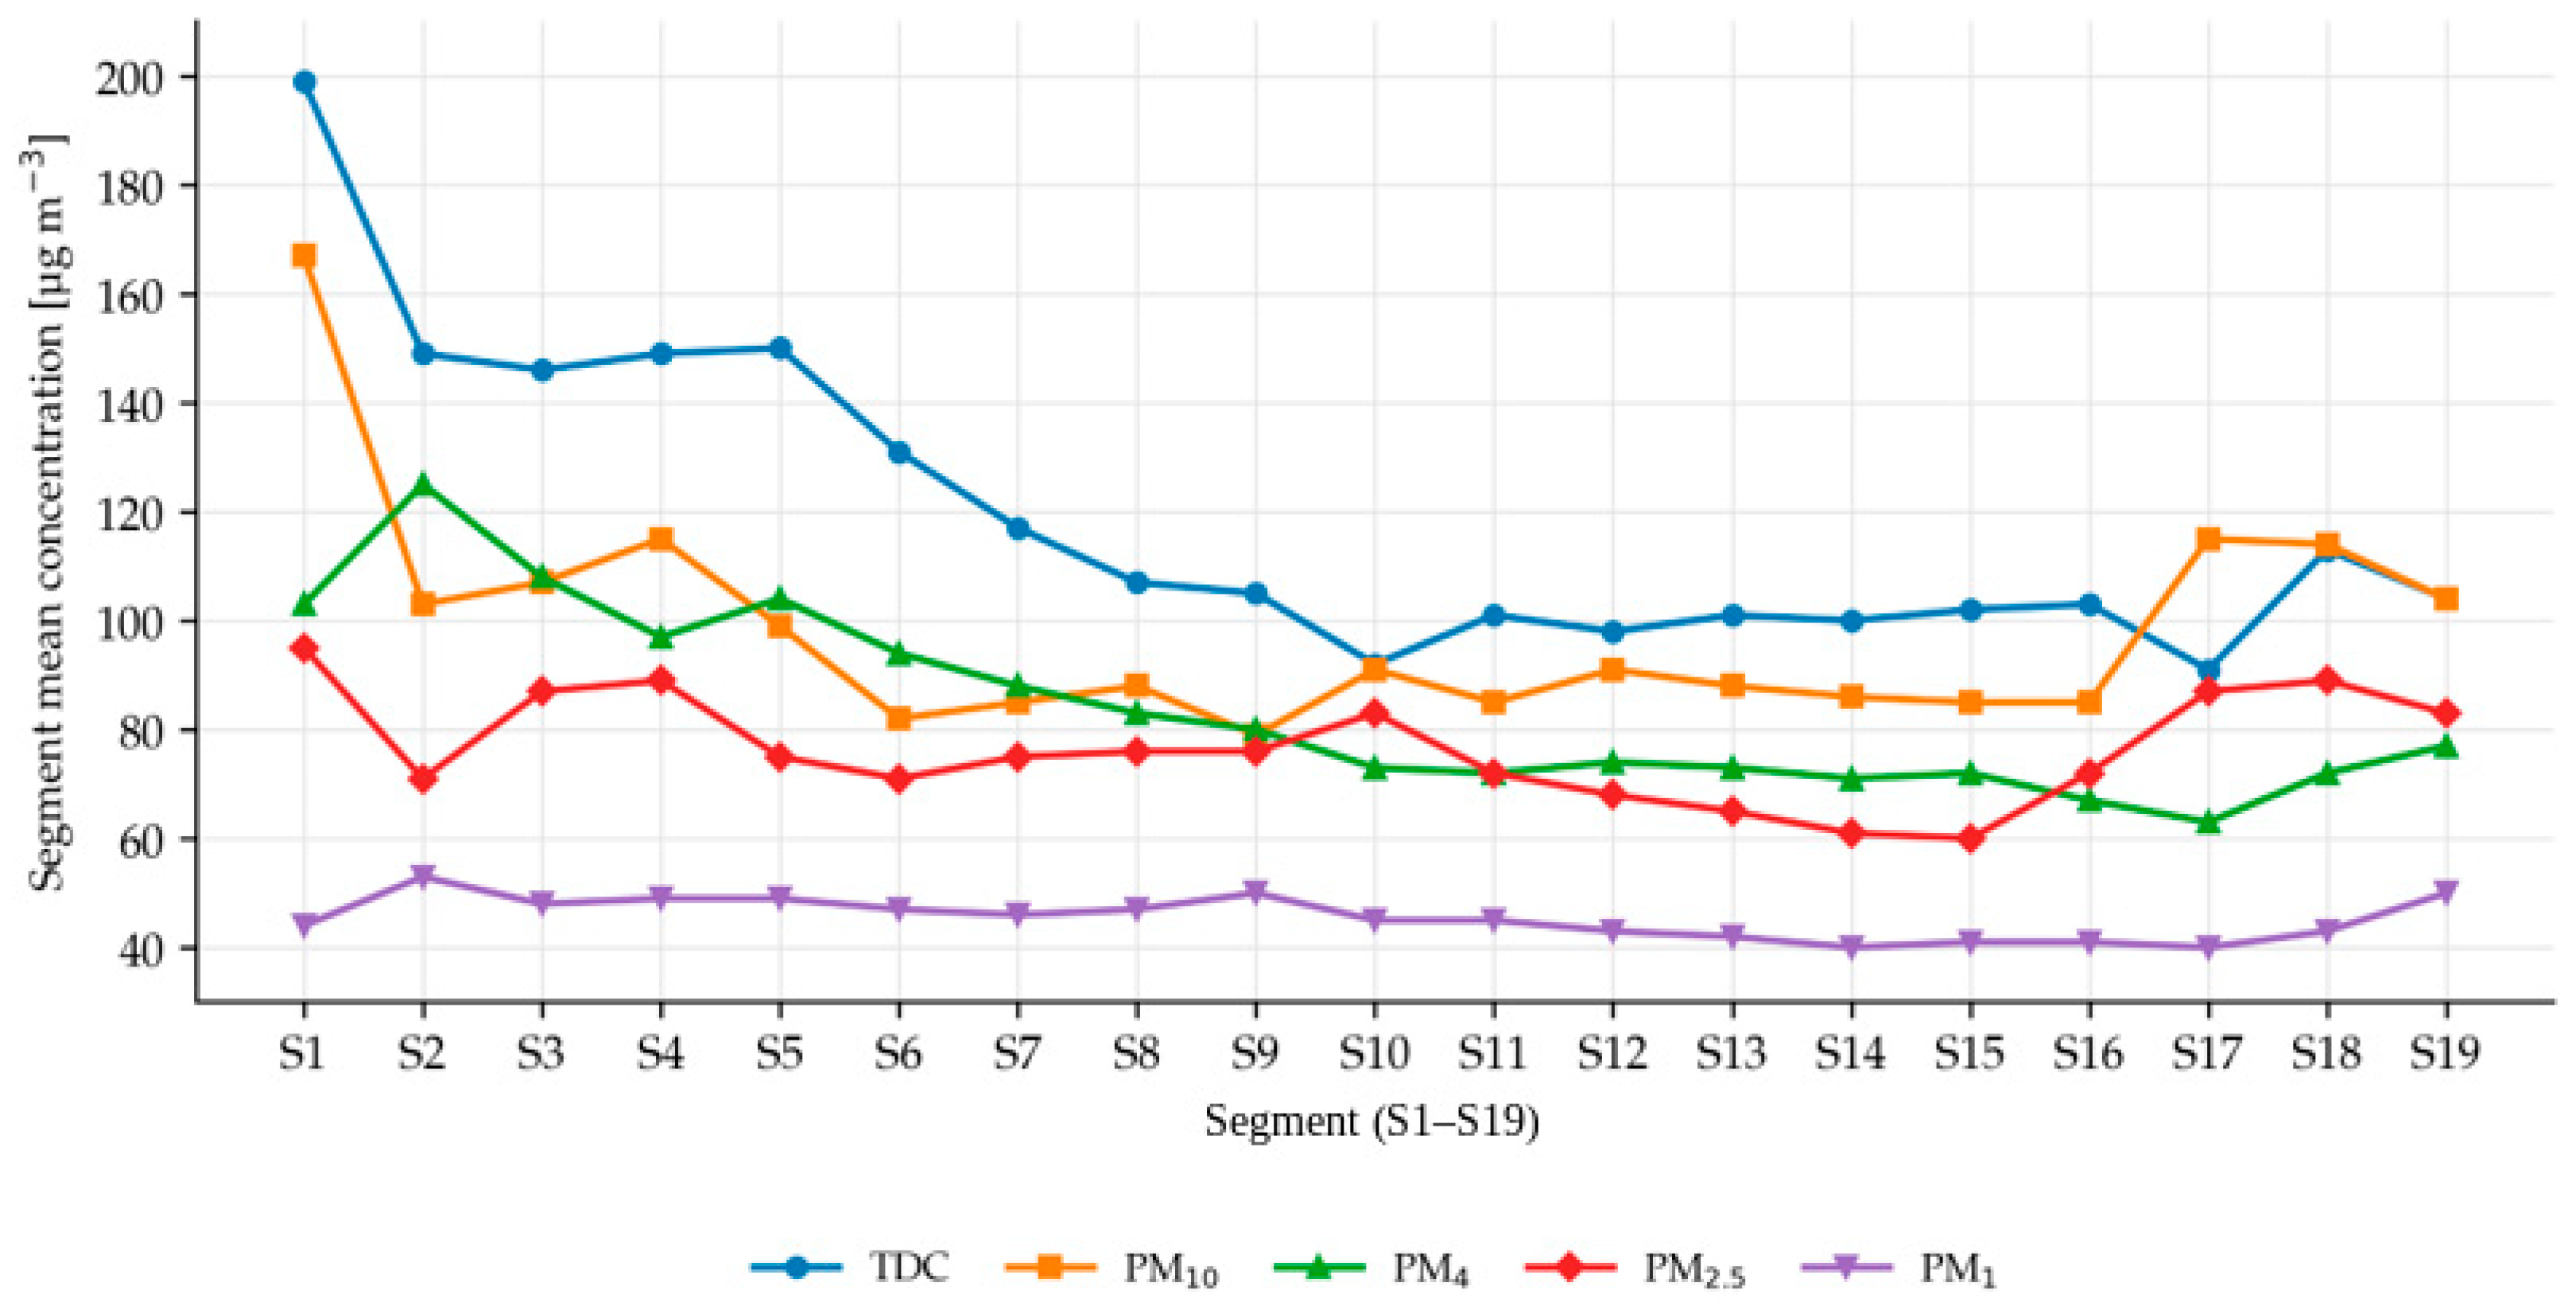
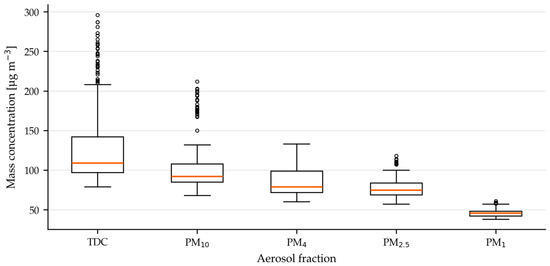
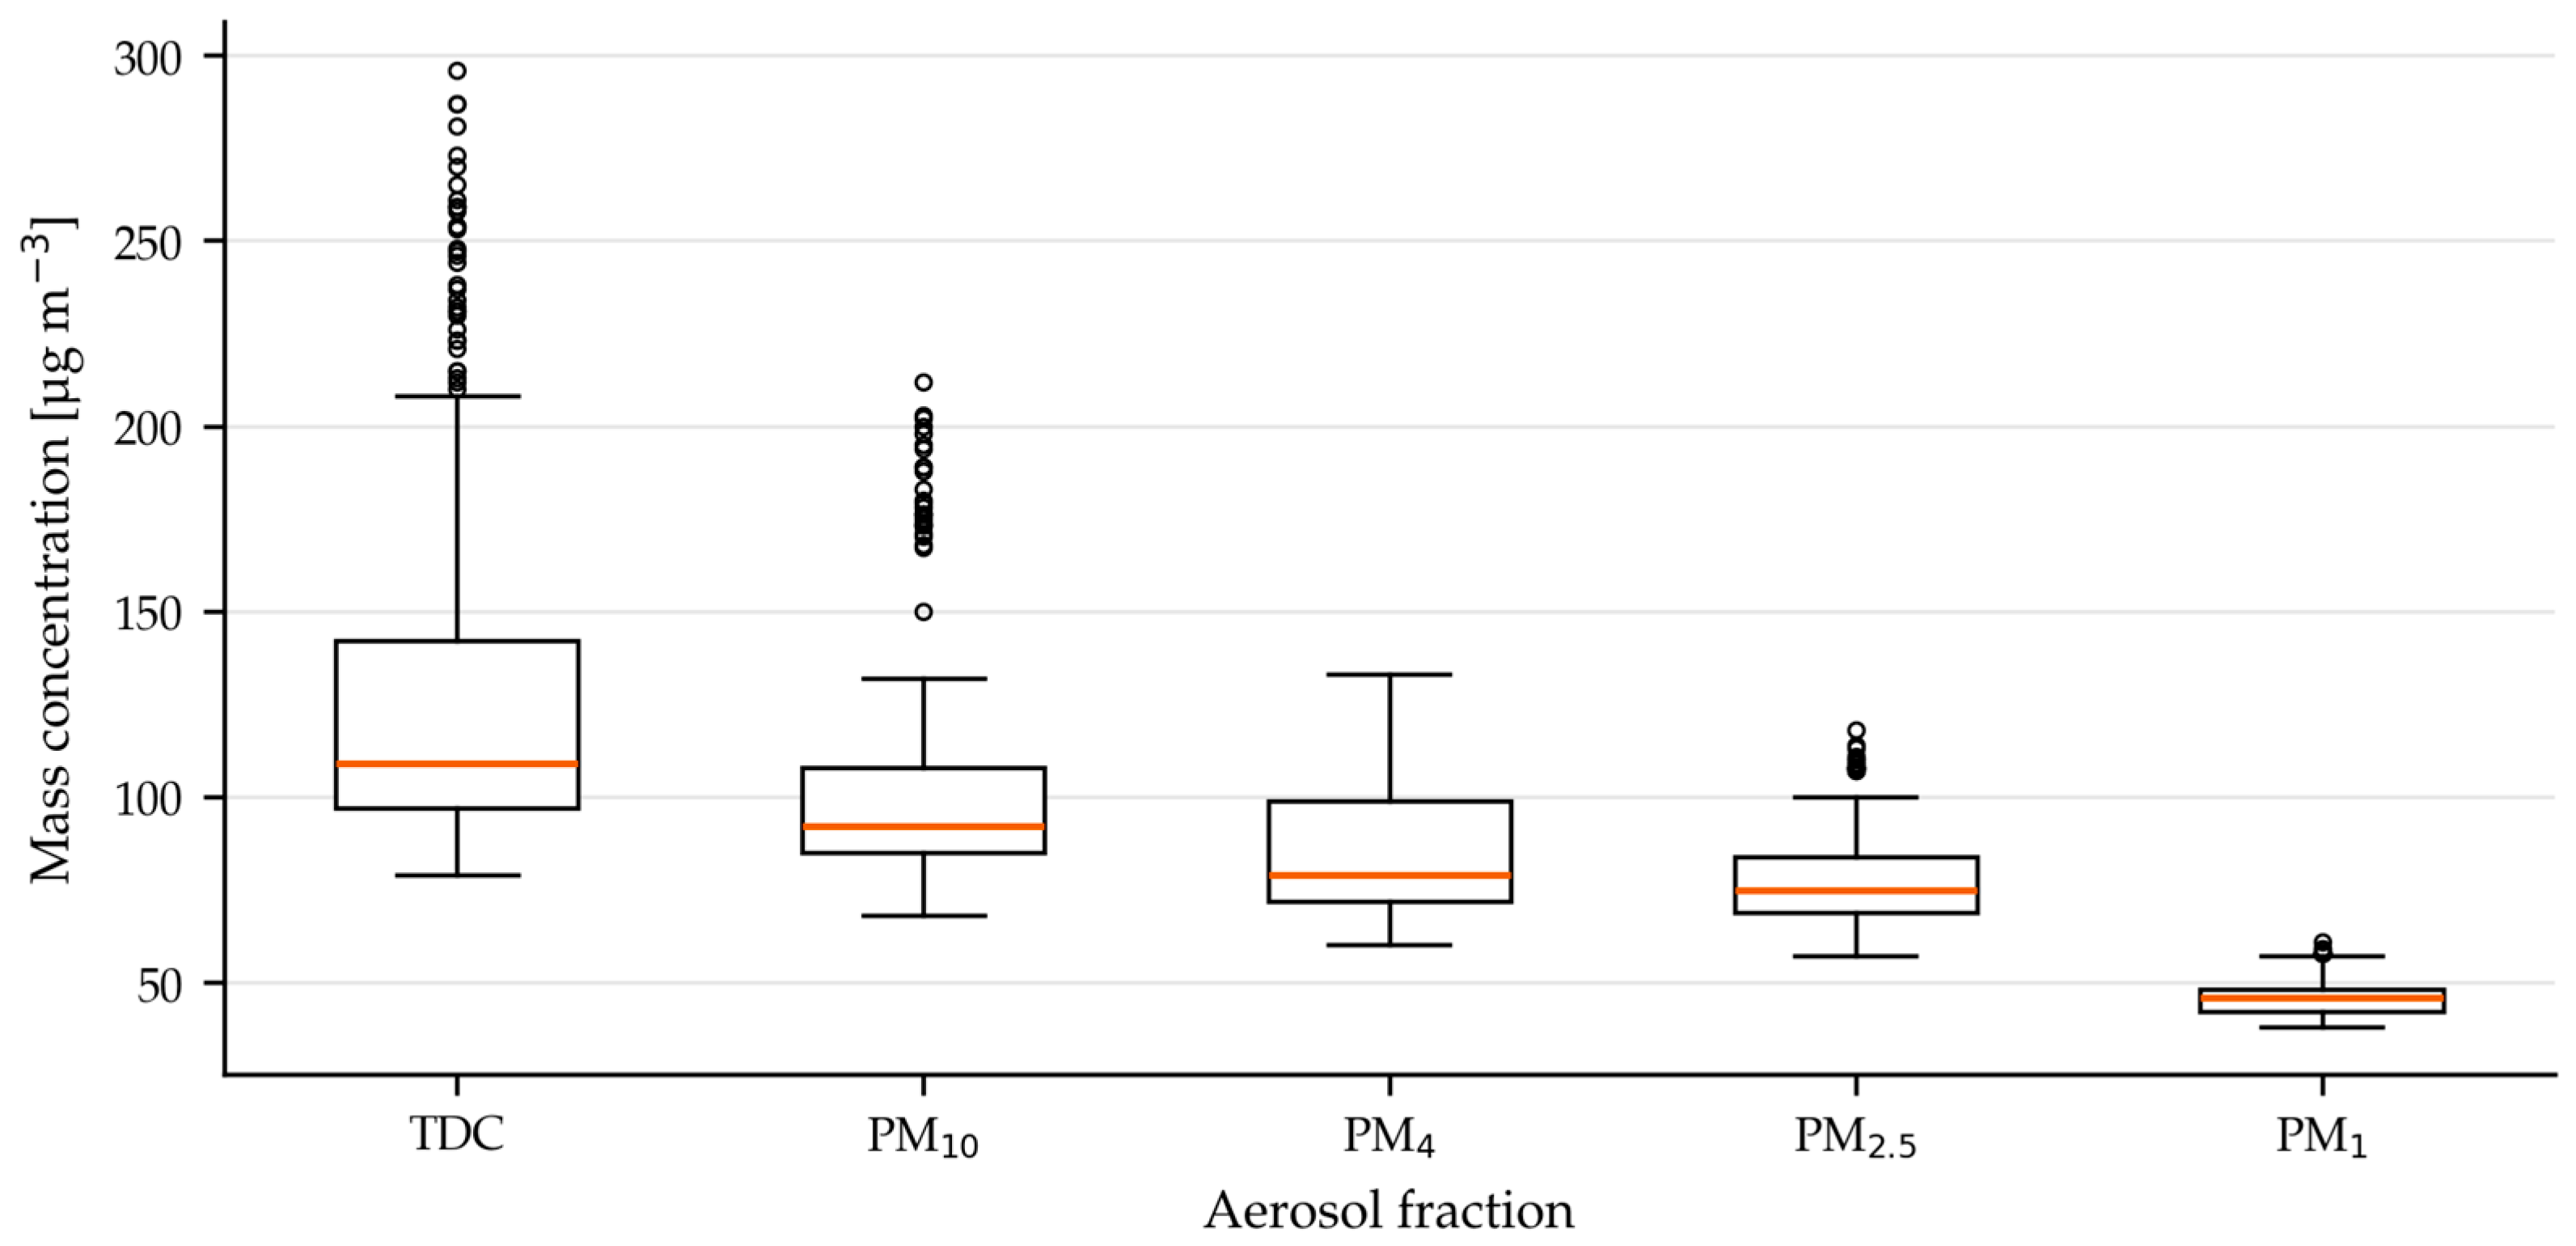
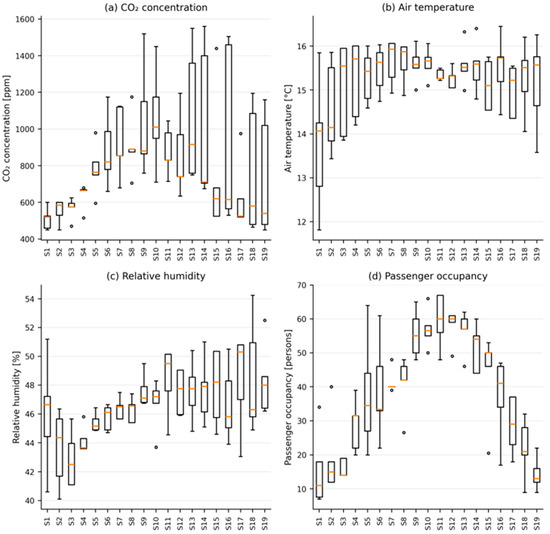
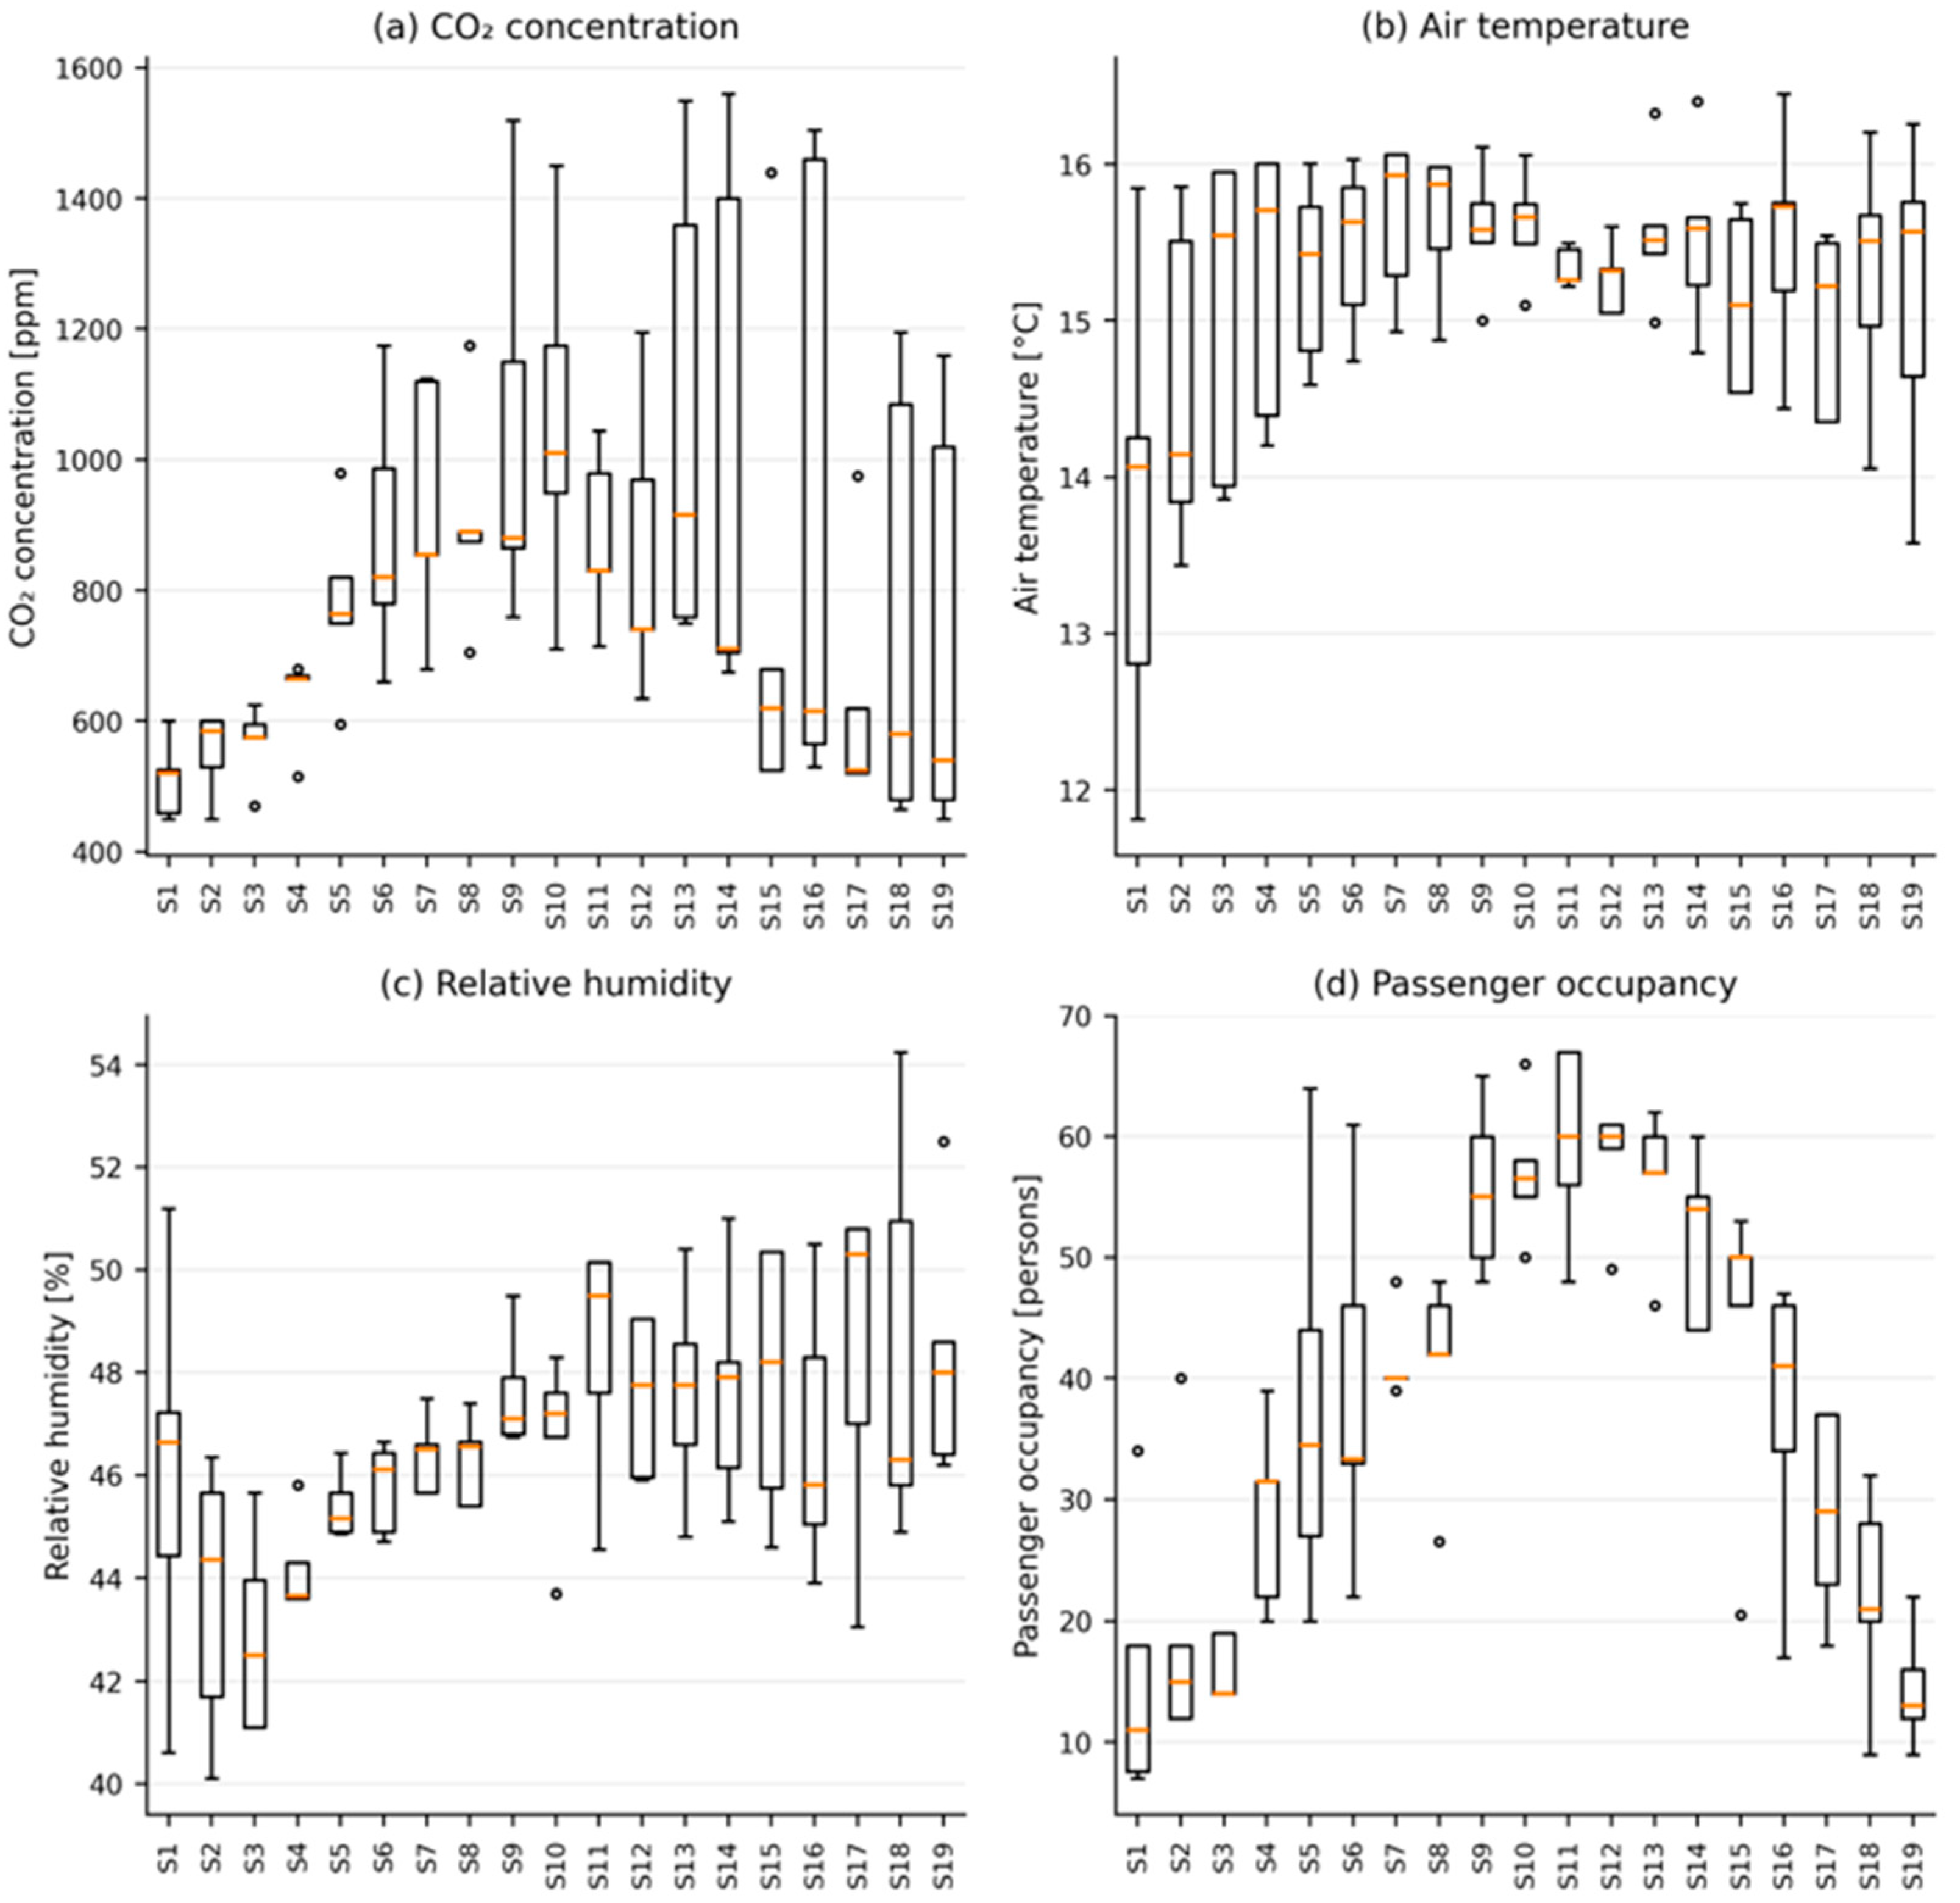

Disclaimer/Publisher’s Note: The statements, opinions and data contained in all publications are solely those of the individual author(s) and contributor(s) and not of MDPI and/or the editor(s). MDPI and/or the editor(s) disclaim responsibility for any injury to people or property resulting from any ideas, methods, instructions or products referred to in the content. |
© 2026 by the authors. Licensee MDPI, Basel, Switzerland. This article is an open access article distributed under the terms and conditions of the Creative Commons Attribution (CC BY) license.