


Abstract
The surface quality of wafers processed by double-sided polishing (DSP) is significantly influenced by pad morphology. However, quantitative analysis remains challenging due to the complexity of dynamic contact conditions and the coupled effects of pressure and trajectory. To address material removal non-uniformity on wafer surfaces during DSP, this study focuses on the pressure–trajectory coupling mechanism and develops a material removal model incorporating pad topography effects. First, a kinematic model is established to derive the relative velocity of any point on the wafer. Secondly, a 3D elastic contact simulation model is constructed based on a linear elastic small-deformation model to obtain spatial pressure distribution under different pad morphologies. The full-cycle transient process is obtained by averaging typical steady-state conditions. A material removal calculation method is proposed by integrating time-dependent relative velocity and dynamic pressure within a modified Preston framework, and the model is validated against experimental results reported in the literature. Simulations and reported experiments demonstrate that pads with varying radial topographies generate differentiated pressure distribution. The results show that wafer radial within-wafer non-uniformity (WIWNU) can be effectively reduced to 1.002 by adjusting pad shape. This study extends the applicability of material removal rate models and provides a predictive framework for precision control in DSP wafer planarization.
1. Introduction
As a critical process in wafer flattening [1], DSP is indispensable in advanced integrated circuit manufacturing [2]. It demonstrates excellent performance in enhancing wafer surface smoothness and reducing defect rates, enabling precise thickness control and nanoscale surface roughness and providing high-quality surfaces for subsequent processes [3,4,5,6].
Compared to single-sided Chemical Mechanical Polishing (CMP), DSP exhibits greater complexity in its kinematic motion and contact mechanics. The analysis of wafer surface formation requires comprehensive consideration of equipment structure, polishing pad topography, wafer rotation, and their coupled effects on pressure and velocity distribution [7]. Due to its process variability, wafer flatness tends to become unpredictable [8,9]. Consequently, systematic theoretical analysis and predictive models for DSP processing uniformity have become crucial for enhancing polishing flatness and enabling quantitative control of material removal behavior.
In the DSP process, the workpiece is placed between upper and lower polishing pads and driven by internal and external gears, achieving material removal through abrasive and pad friction [10]. The material removal rate (MRR) is commonly described by the Preston equation [11,12], in which the removal rate is proportional to the relative velocity and contact pressure. However, the classical Preston framework assumes uniform or quasi-static pressure distribution, which is not valid in practical DSP processes due to pad deformation and complex motion.
Scholars have investigated DSP process mechanisms based on kinematic modeling, focusing on analyzing the influence of rotation and revolution speed on the material removal distribution [13,14]. To achieve more uniform material removal, C.J. Evans and L. Vainer further proposed quantitative metrics for trajectory distribution uniformity to regulate kinematic parameters, thus establishing a process optimization framework based on kinematic models [15,16]. However, these models are based on the assumptions that the contact pressure is uniformly distributed and therefore cannot capture the spatial variation of pressure in practical polishing processes, where significant non-uniformity arises due to pad deformation and equipment conditions.
To address this issue, some researchers adopted finite element analysis (FEA) to calculate the contact pressure. Wang et al. [17] established a 2D axisymmetric quasi-static finite element model of the wafer to analyze the influence of the pad’s Young’s modulus, Poisson’s ratio, and the thickness ratio of the upper to lower pads on the stress distribution on the wafer surface. However, this model is constrained by its limited consideration of the effect of complex radial pad topography variations on wafer surface distribution. Chen et al. [18] utilized numerical simulation and experimental validation to investigate the mechanism of edge roll-off in double-sided polishing, focusing on the influence of the gap on the stress distribution at the wafer edge. Their results indicated that the gap has a significant influence on the contact state, thereby affecting the edge stress distribution. Therefore, precise control of the wafer edge can be achieved by adjusting the wafer thickness and gap during the polishing process.
In recent years, research focus has gradually shifted toward the “pressure–trajectory coupling” mechanism. Hashimoto et al. [19] proposed utilizing the radial thickness distribution of polishing pads to modulate the pressure field in double-sided grinding. However, this model did not account for dynamic pressure change resulting from the continuous wafer sliding on the pad surface. Lei et al. [20] incorporated pad deformation into their model, calculating the contact pressure during DSP and combining it with the Preston equation to predict surface topography. Nevertheless, this approach neglected the influence of pad topography itself, thus imposing certain limitations on the model. Satake et al. [21] conducted experiments to demonstrate that pad topography has a significant influence on center-to-edge removal discrepancies. The study further highlighted that pressure distribution can be controlled through pad design to compensate for trajectory-induced non-uniformity, providing direct evidence for the pressure compensation strategy in this study. However, this work mainly focuses on experimental observation and does not explicitly provide a predictive framework that quantitatively couples the dynamic evolution of pressure with trajectory-dependent velocity.
Based on previous study, this research proposes a pressure–trajectory coupled prediction model for the post-polishing wafer topography under various pad designs. The model integrates wafer surface stress distribution with kinematic velocity, and the prediction results are consistent with experimental results reported in the literature. By incorporating pad topography into the pressure–trajectory coupling framework, this approach extends the prediction model applicability and offers an enhanced predictive framework for precise control of wafer surface topography.
2. Model Establishment and Validation
2.1. Velocity Derivation
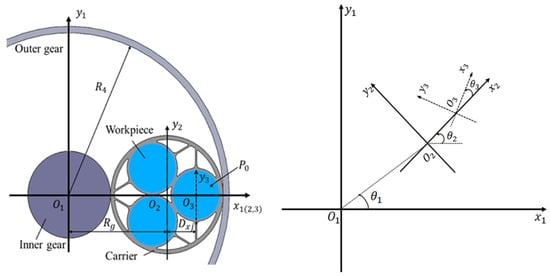
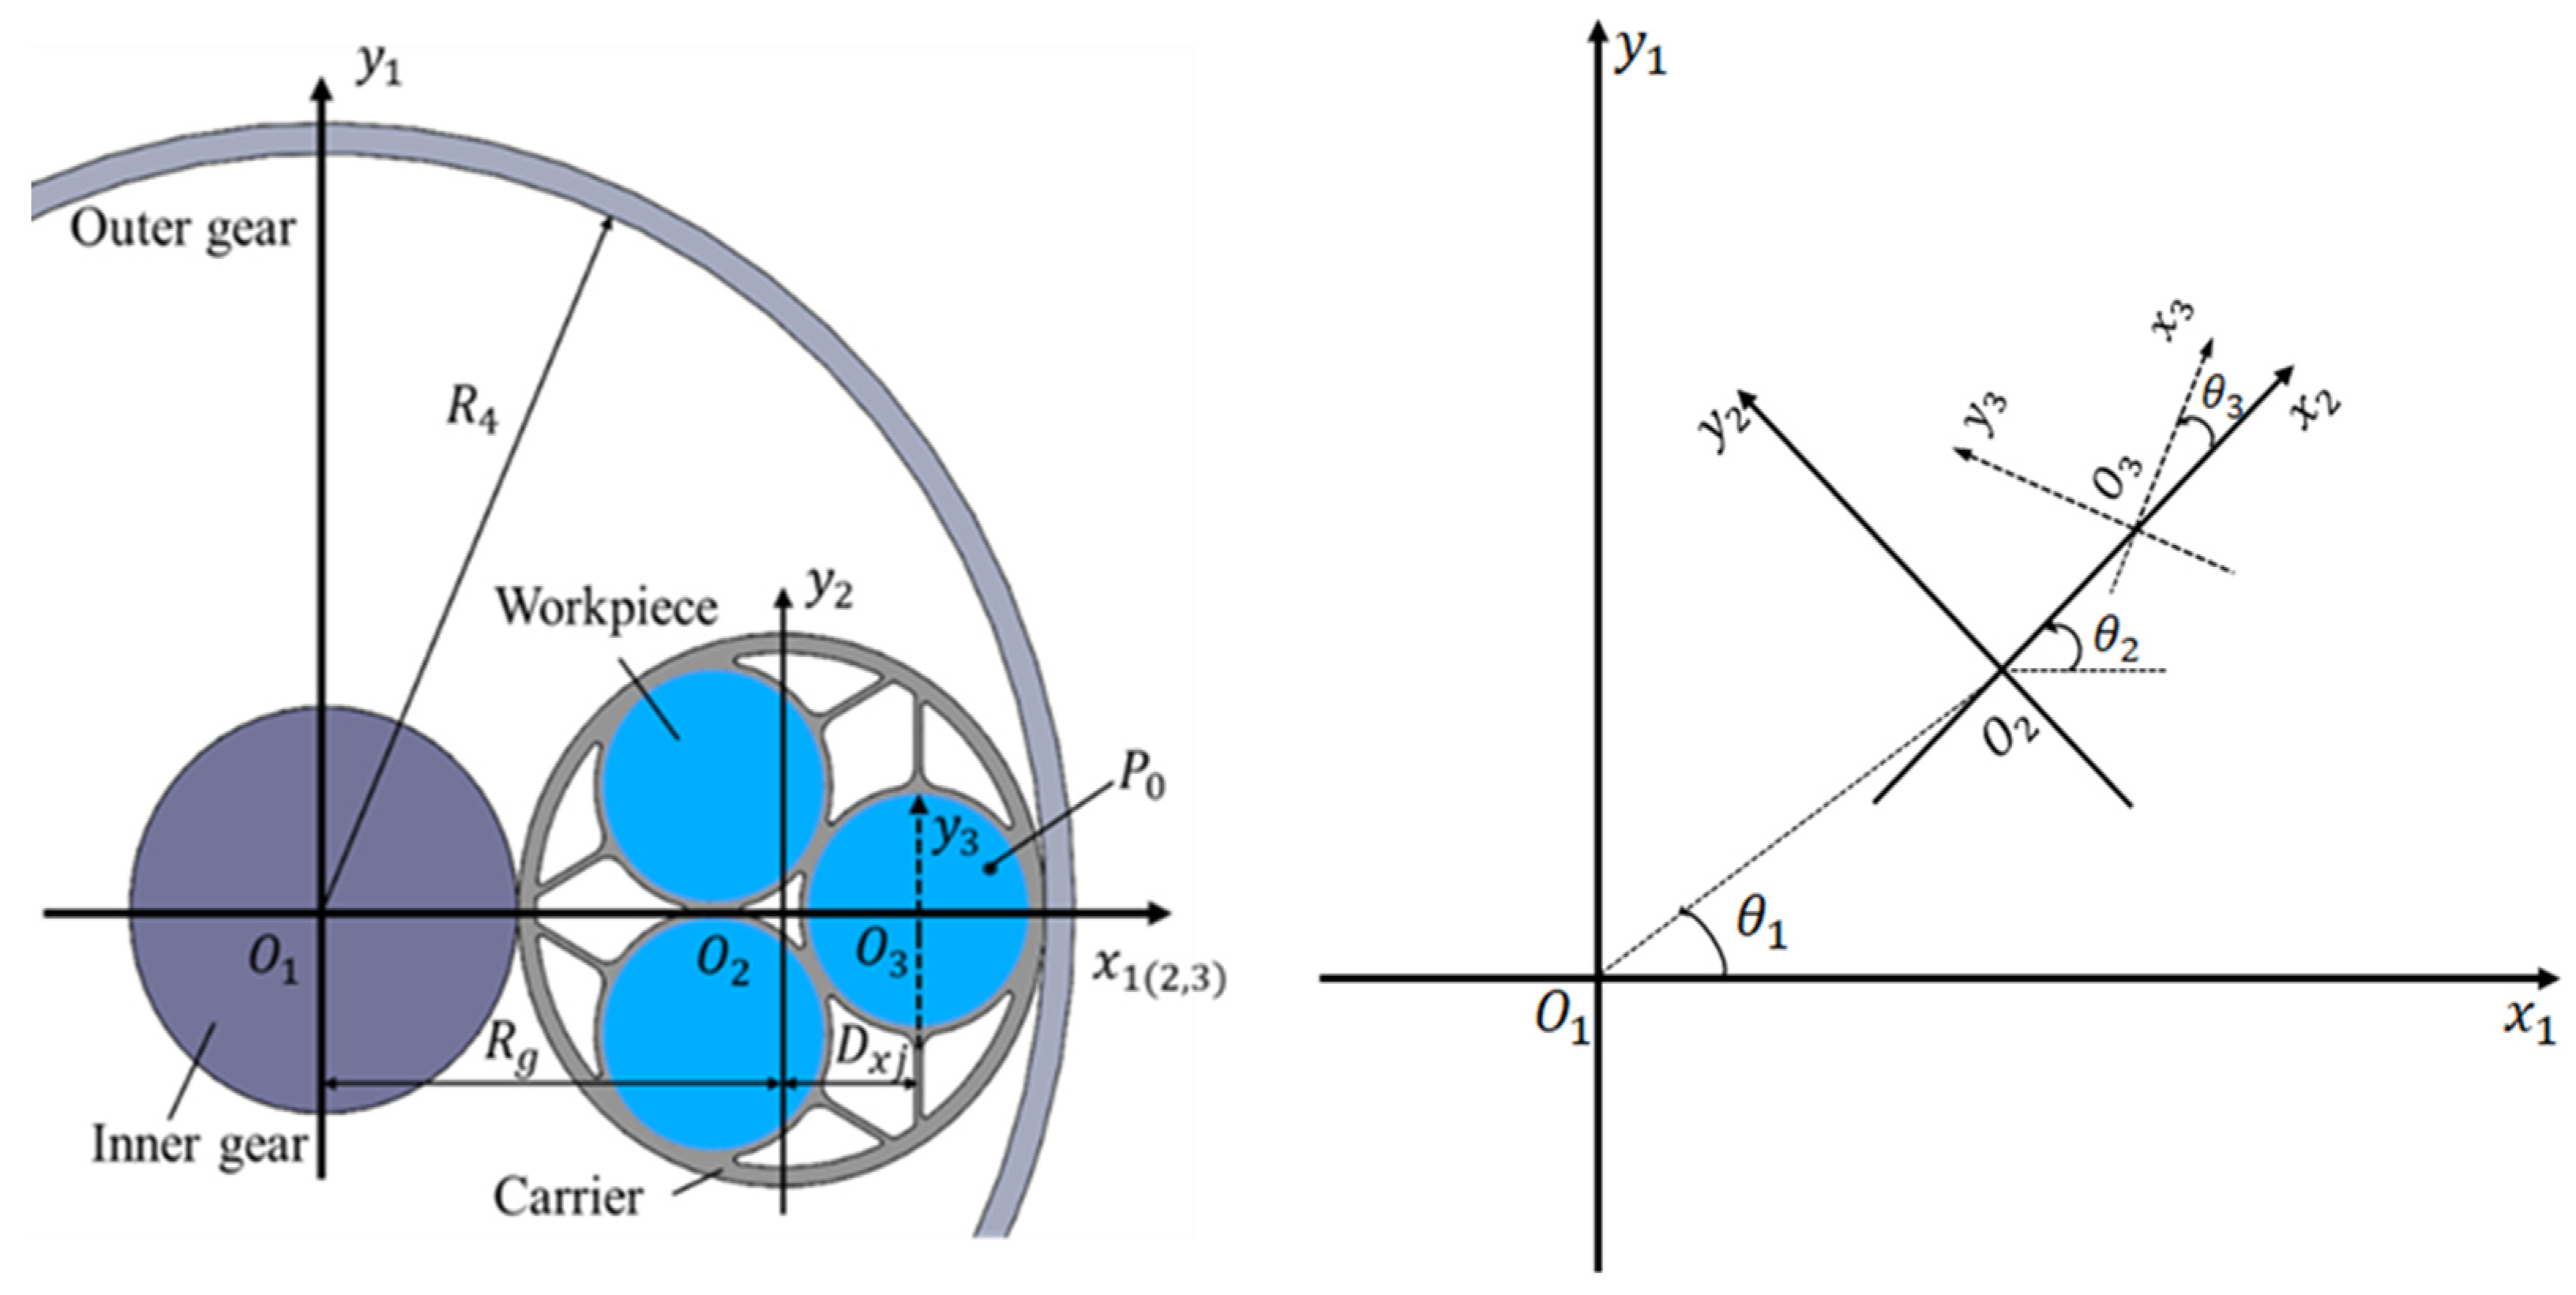
Prior to formula derivation, it is essential to establish both a global coordinate system and local coordinate systems. As illustrated in Figure 1, the global coordinate system is defined with its origin located at the platen center. Additionally, co-rotating local coordinate systems , , are established for the polishing pad, carrier, and wafer.
Figure 1.
Schematic diagram of the polishing motion.
For any point on the silicon wafer , its coordinates in the wafer coordinate system remain constant at (). After time , the carrier undergoes a revolution angle of relative to the pad and a rotation angle of . The wafer rotates by an angle of relative to the carrier.
The origin of is fixed at () in the system, which is rotated by relative to . The nomenclature and corresponding process parameters used in the present study are summarized in Table 1. Thus, the coordinate () of in satisfies
where is the distance from the wafer center to the carrier center. The following results can be obtained by simplifying the equations above:
Table 1.
Nomenclature and parameters.
The coordinate of in is (), and rotates relative to . Therefore, the coordinate () of in satisfies
Given that the distance between and is , and rotates in relative to the x-axis, we can conclude that and . By substituting Equations (2) and (3), we can obtain
By combining Equations (4)–(6), the trajectory of any point on the pad satisfies
The rotation and revolution speeds of the carrier are and , and the upper and lower pad rotation speeds are and . The rotation speed of the wafer relative to carrier is related to the carrier rotation speed, carrier revolution speed, upper pad rotation speed, and lower pad rotation speed, and can be measured by experiment. Taking the wafer relative to the upper pad as an example, the revolution and rotation angles are
When the carrier is under uniform rotation, the velocity of relative to the pad can be obtained by differentiating Equations (7) and (8) with respect to time:
where ω1 and ω2 are the time derivatives of the corresponding angular terms in Equations (7) and (8), respectively.
2.2. Finite Element Analysis
2.2.1. Governing Equation
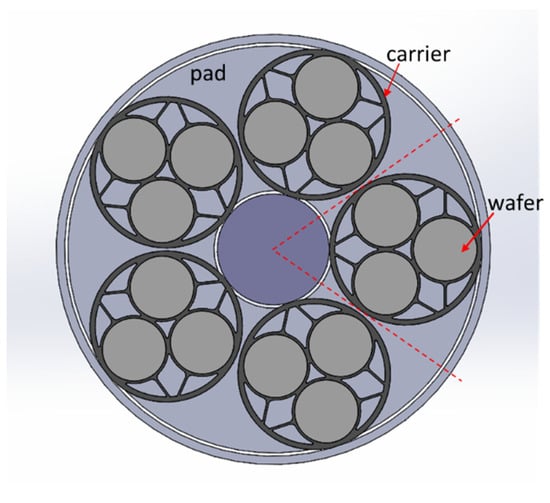
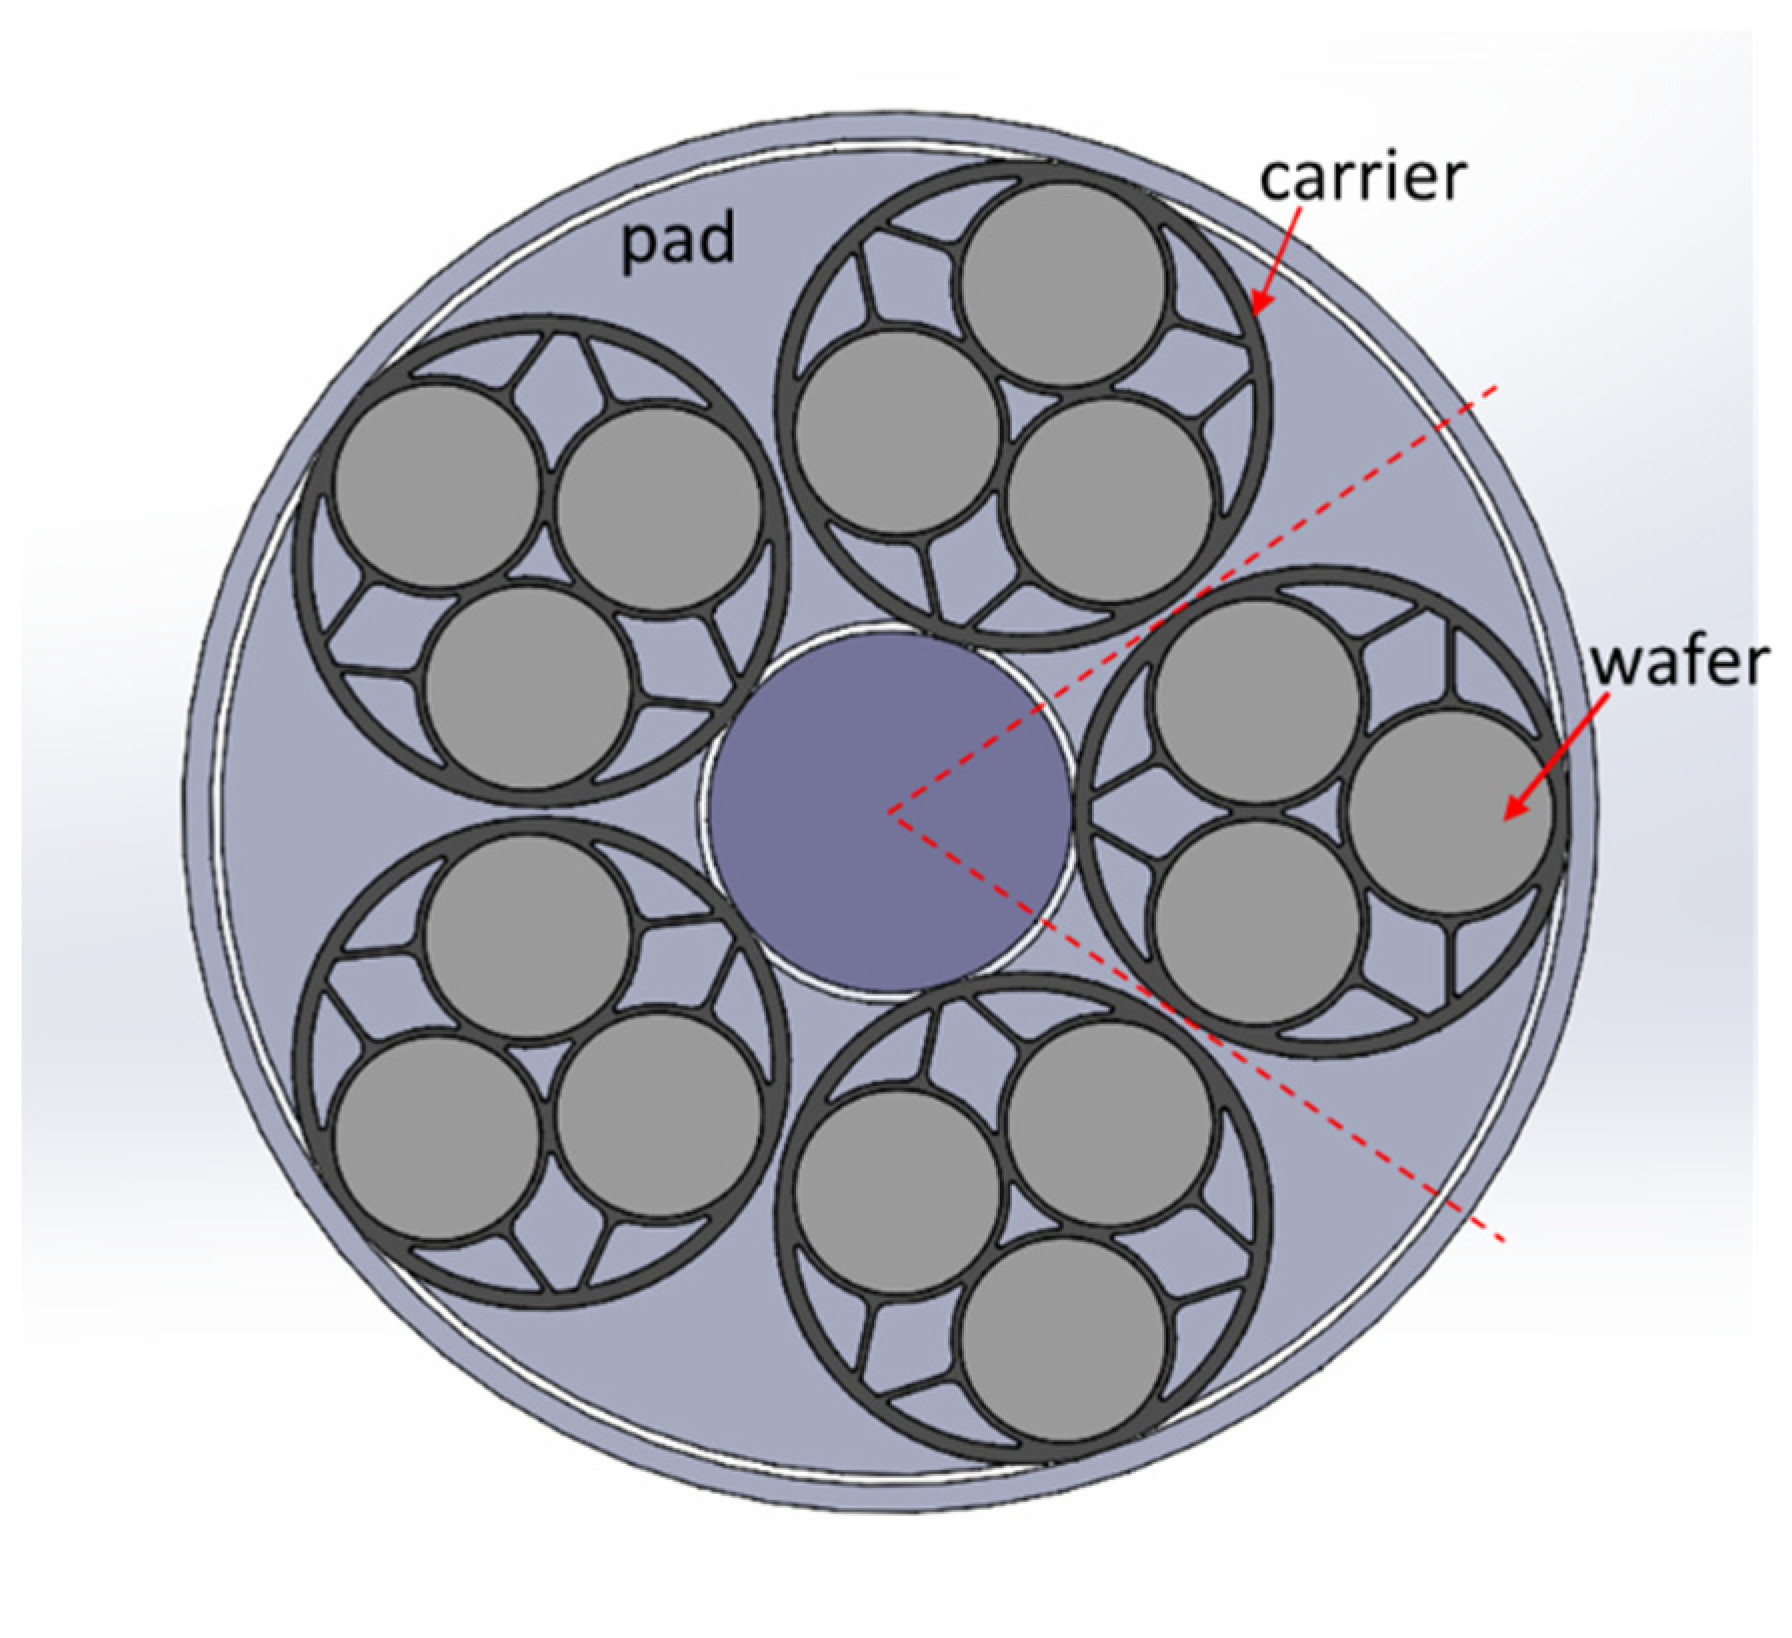
To elucidate the contact mechanics at the wafer–pad interface, this study develops a numerical model to describe the stress distribution on the wafer surface during DSP under different pad topologies based on three-dimensional elastic contact theory. By integrating small-deformation assumption linear elasticity theory with the Preston equation, the model achieves a cross-scale mapping from macroscopic mechanical behavior to microscopic material removal. As shown in Figure 2, the model key components include the upper and lower pads, carriers and wafers. The simulation domain is highlighted between the two red dashed lines.
Figure 2.
Schematic diagram of finite element model.
Under the steady polishing assumption, the quasi-static stress field of the wafer–pad system satisfies the three-dimensional elastic equilibrium equation:
where is the components of the stress tensor, and is the body force (e.g., gravity, which is neglected in this study). For isotropic linear elastic materials, the stress–strain relationship is given by the generalized Hooke’s law:
where and are the Lamé constants, is the Kronecker delta, and is the strain tensor.
2.2.2. Boundary Condition
The boundary condition of the finite element model can be described as below:
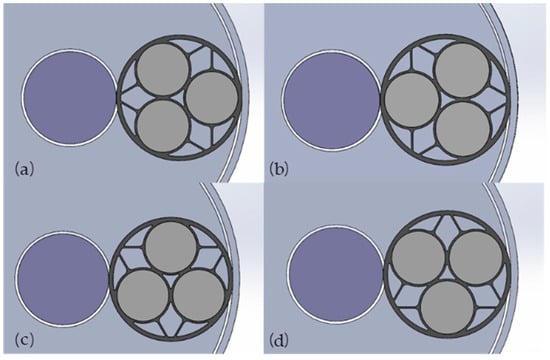
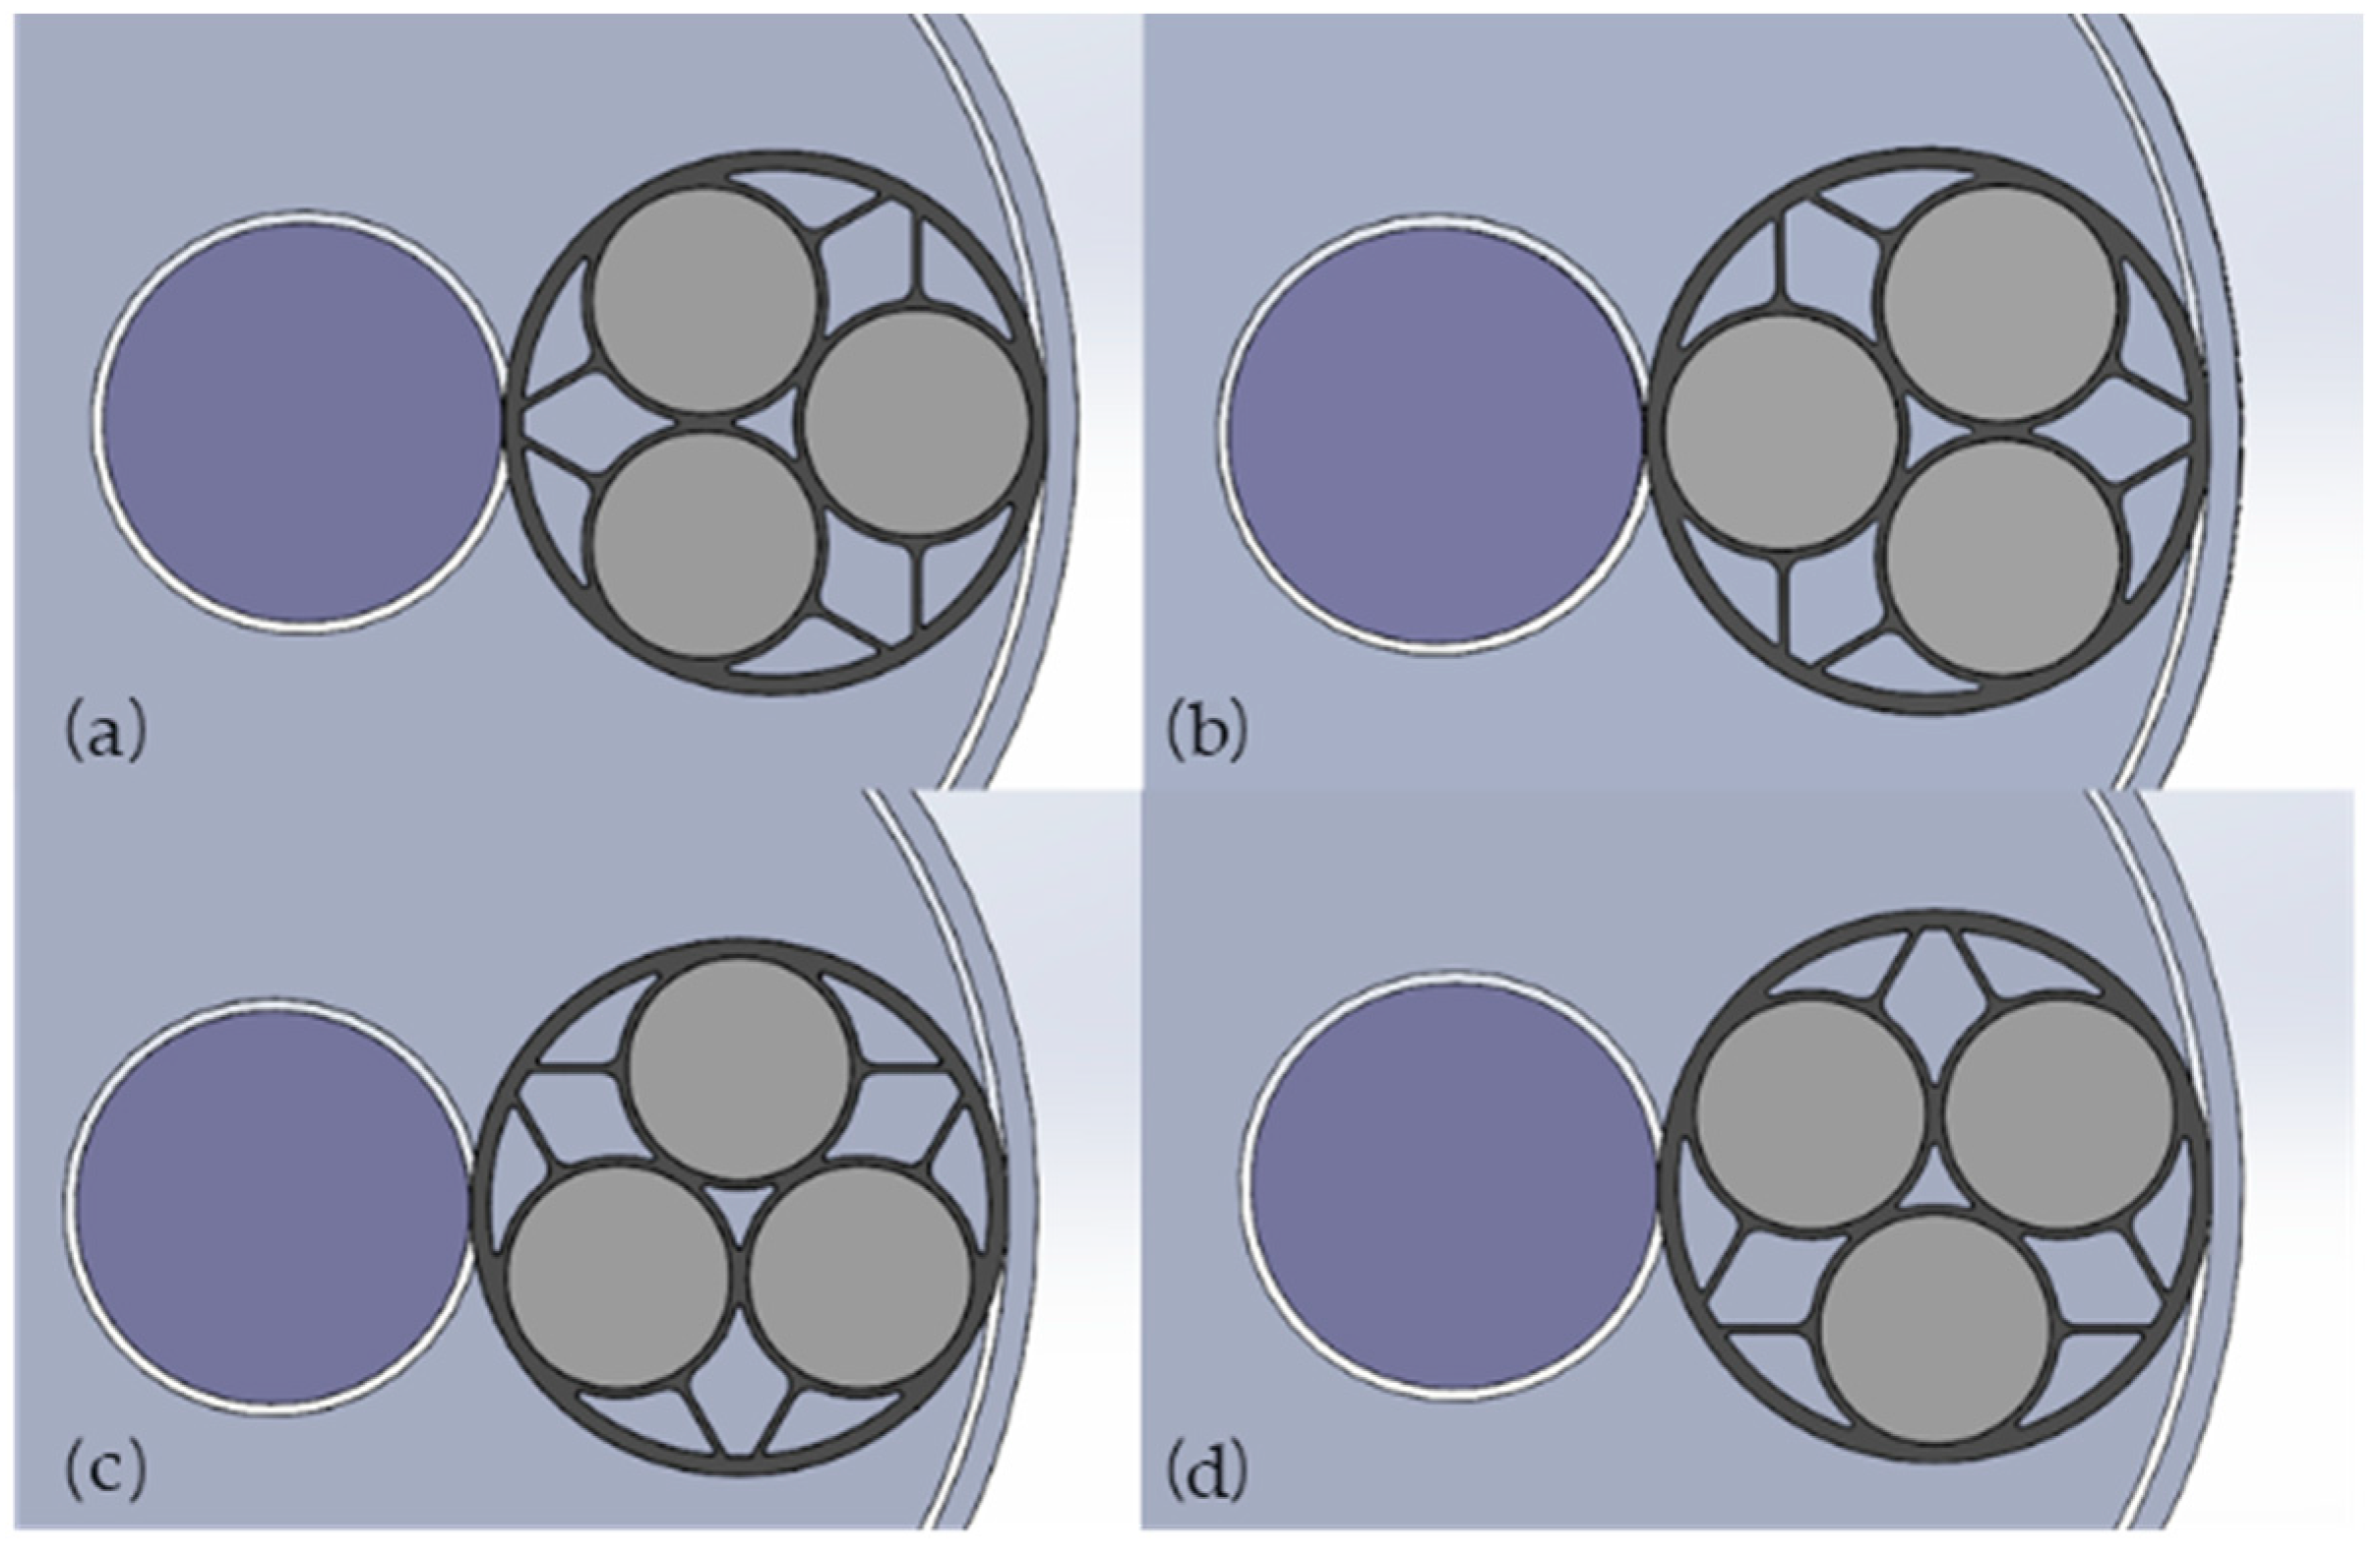
- This study employs a steady-state model to calculate the wafer surface stress distribution. Since the actual polishing process is transient, the wafer position relative to the pad is continuously varied. To simplify the transient process, the process is discretized into multiple typical relative positions between the wafer and the pad, as shown in Figure 3. For each position, the steady-state contact problem is solved independently to obtain the pressure distribution function P(r) along the wafer radius, where r is the distance from a point on the wafer to the origin of the global coordinate system. The arithmetic mean of the P(r) results from these scenarios is then taken as the representative pressure field for the wafer over the entire polishing cycle. Since the carrier revolves relative to the polishing pad with a constant angular velocity, the typical positions are evenly distributed in time. Each position can be considered representative of the pressure characteristics within its adjacent 90° range, and all positions carry equal temporal weight throughout the polishing cycle. Therefore, taking the arithmetic average of the P(r) values from the four conditions directly yields a representative pressure field for the entire cycle. This approach helps to effectively capture the statistical characteristics of the transient process with minimal computational cost.Figure 3. Representative top view of wafer–pad relative position: (a) Position 1; (b) Position 2; (c) Position 3; (d) Position 4.
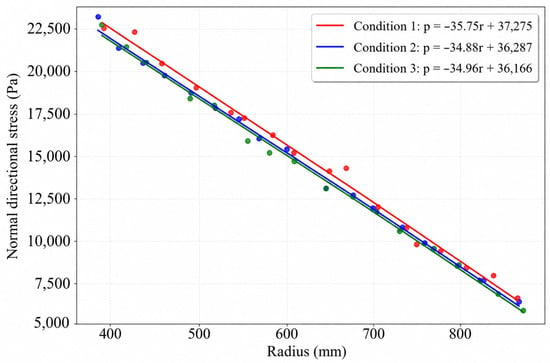
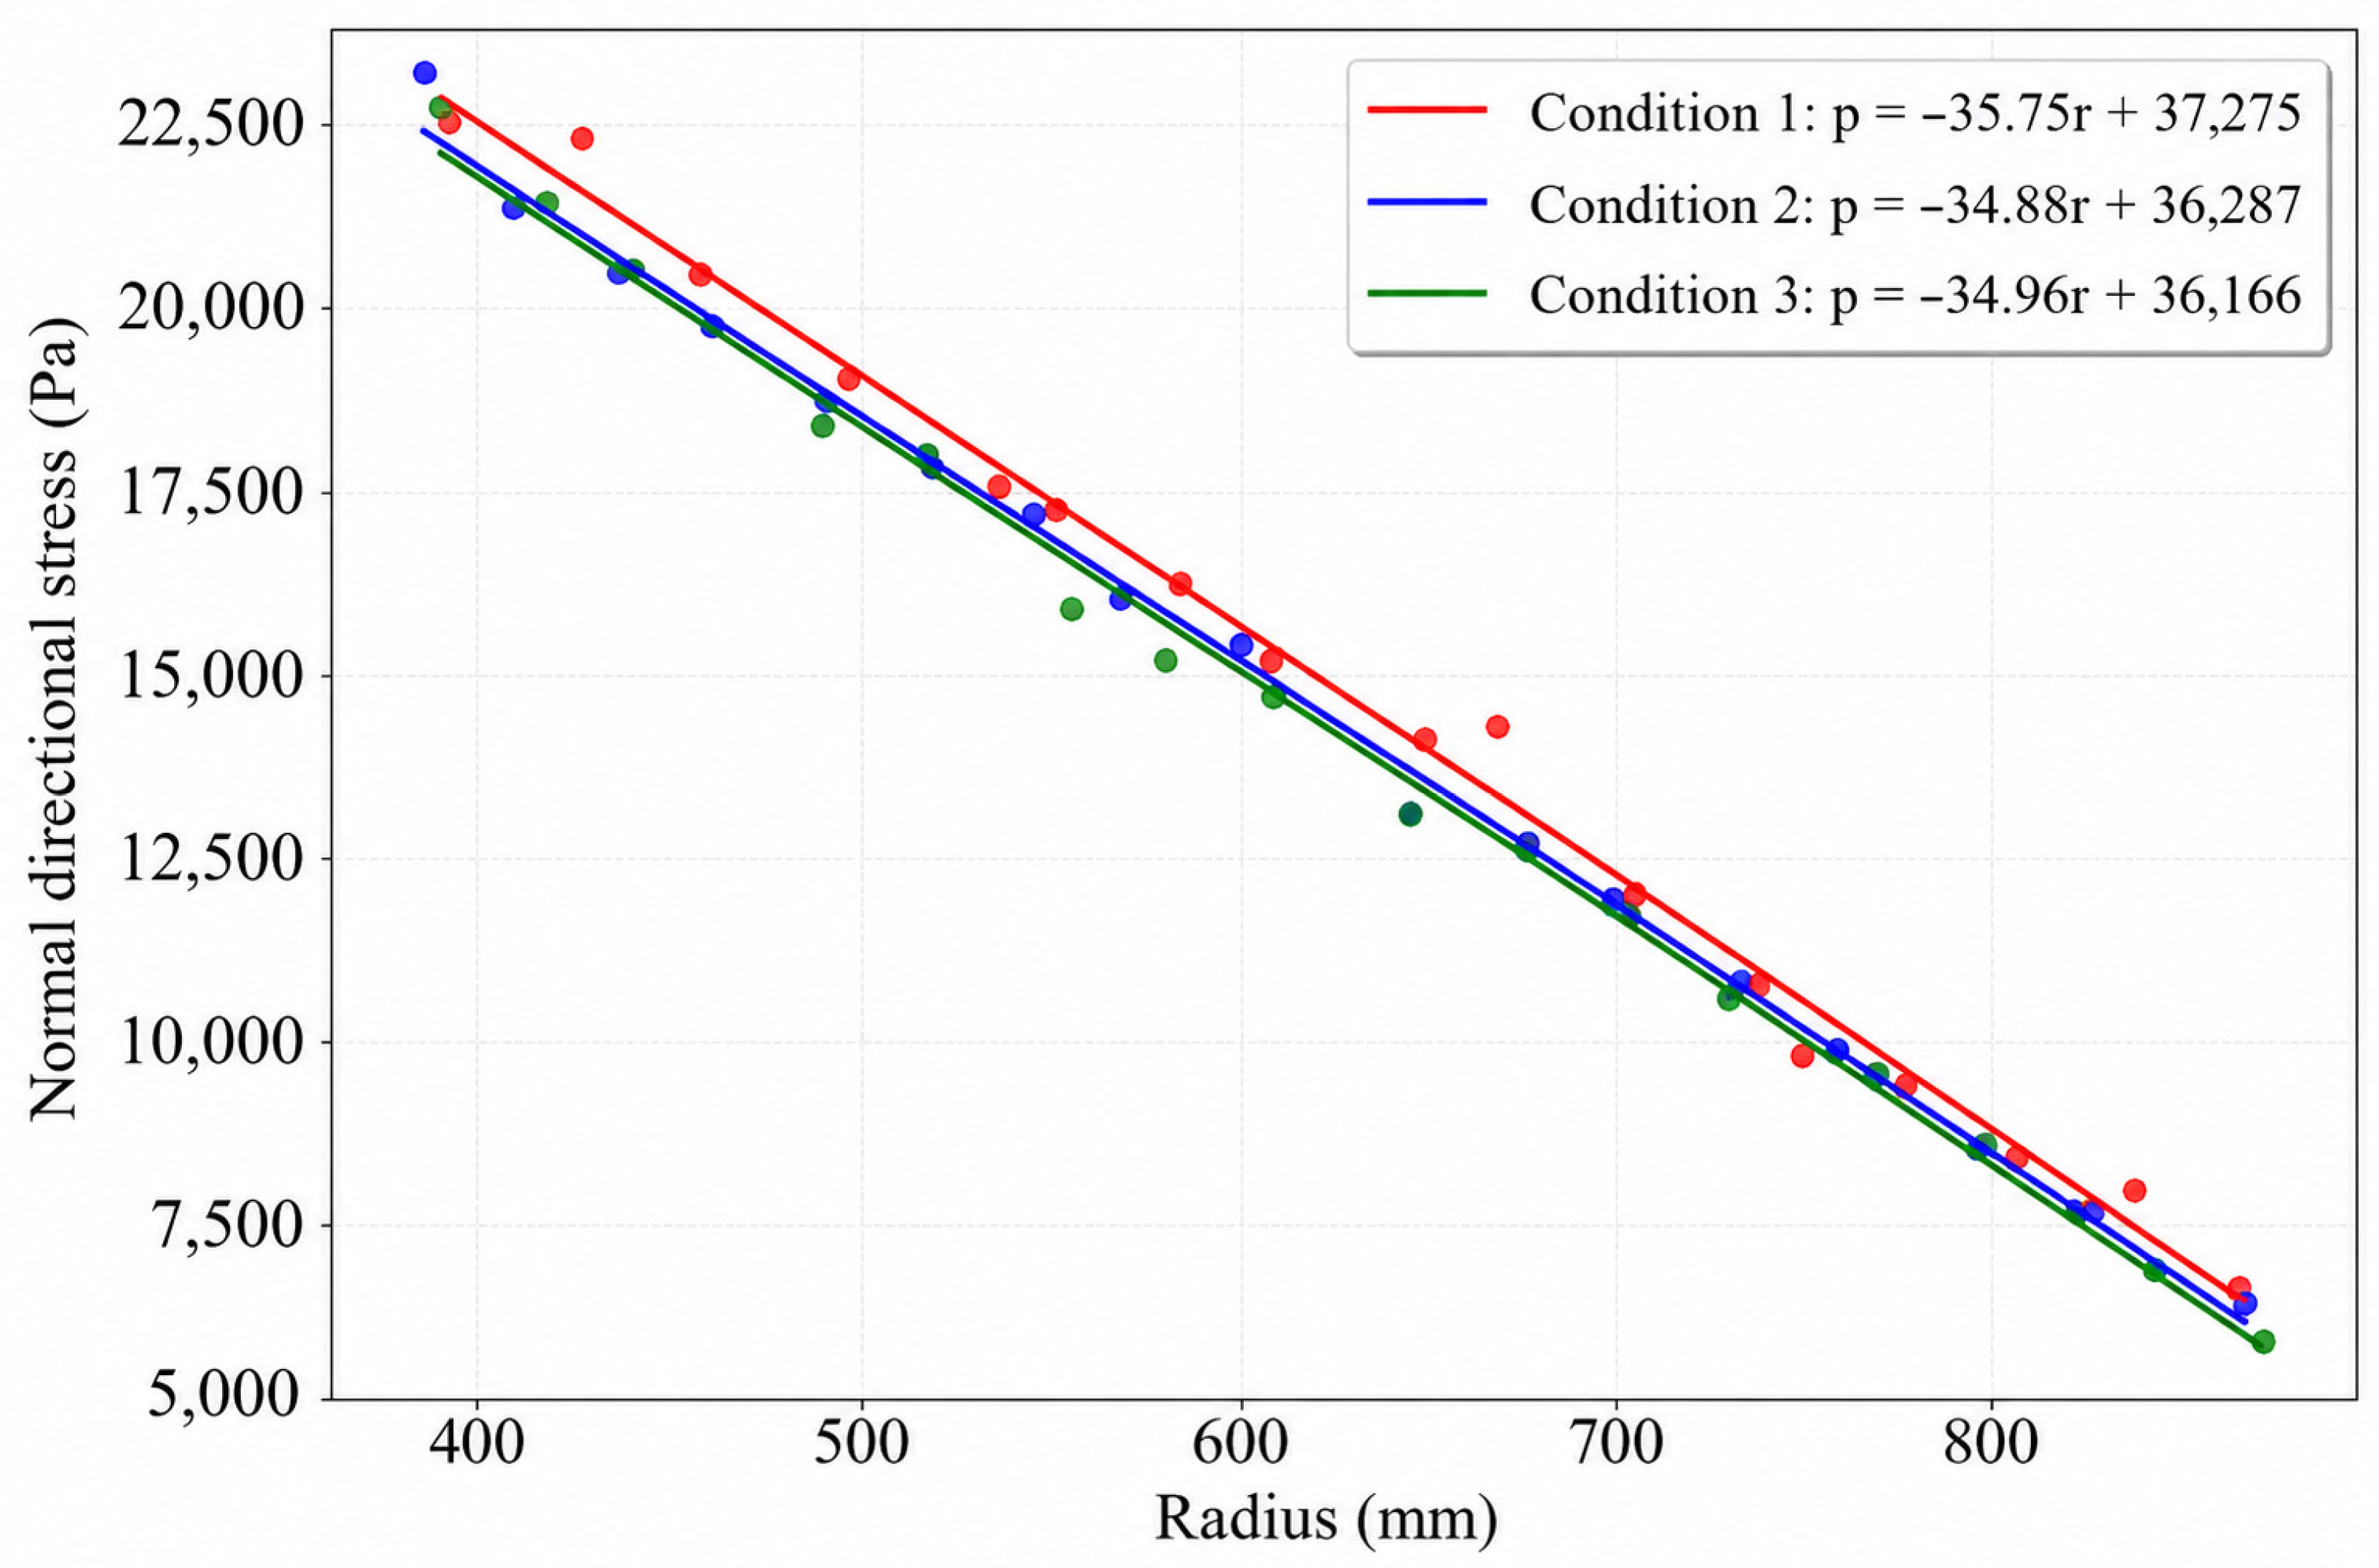
To evaluate the rationality and convergence of simplifying the full-cycle transient polishing process into several representative static positions, the pressure distributions obtained using 4, 6, and 8 discrete positions were compared. Several representative points were selected from the averaged pressure fields for linear fitting analysis, as shown in Figure 4.
Figure 4.
Convergence verification of the stress distribution with different numbers of representative static positions.
Condition 1, Condition 2, and Condition 3 correspond to the pressure distributions obtained using 4, 6, and 8 static positions, respectively. Taking Condition 3 as the reference, the slope error of Condition 1 is only 2.26%, while the intercept error is only 3.01%. These results indicate that the four-position approximation already provides sufficient accuracy for describing the cycle-averaged pressure distribution while maintaining computational efficiency.
- 2.
- The lower surface of the lower pad is rigidly supported by the equipment with zero displacement, thus defined as fixed support:
- 3.
- The upper pad is constrained to move only vertically for pressure adjustment. A rigid surface is established on the top of the upper pad, applying a uniformly distributed load of 15,000 N along the negative direction of the global Z-axis. This load remains perpendicular to the upper pad to prevent the additional bending that could cause tilting.
- 4.
- The contact between the upper/lower pads and the wafer during polishing is defined as frictional contact, with a coefficient of friction of 0.3. Under the assumption of small deformations, the deformation of the polishing pad is minimal and will not lead to contact with the carrier.
2.2.3. Calculation Parameters
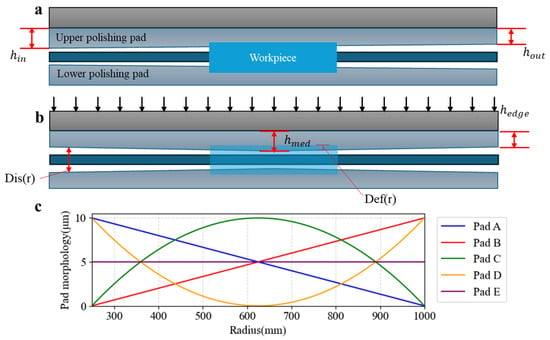
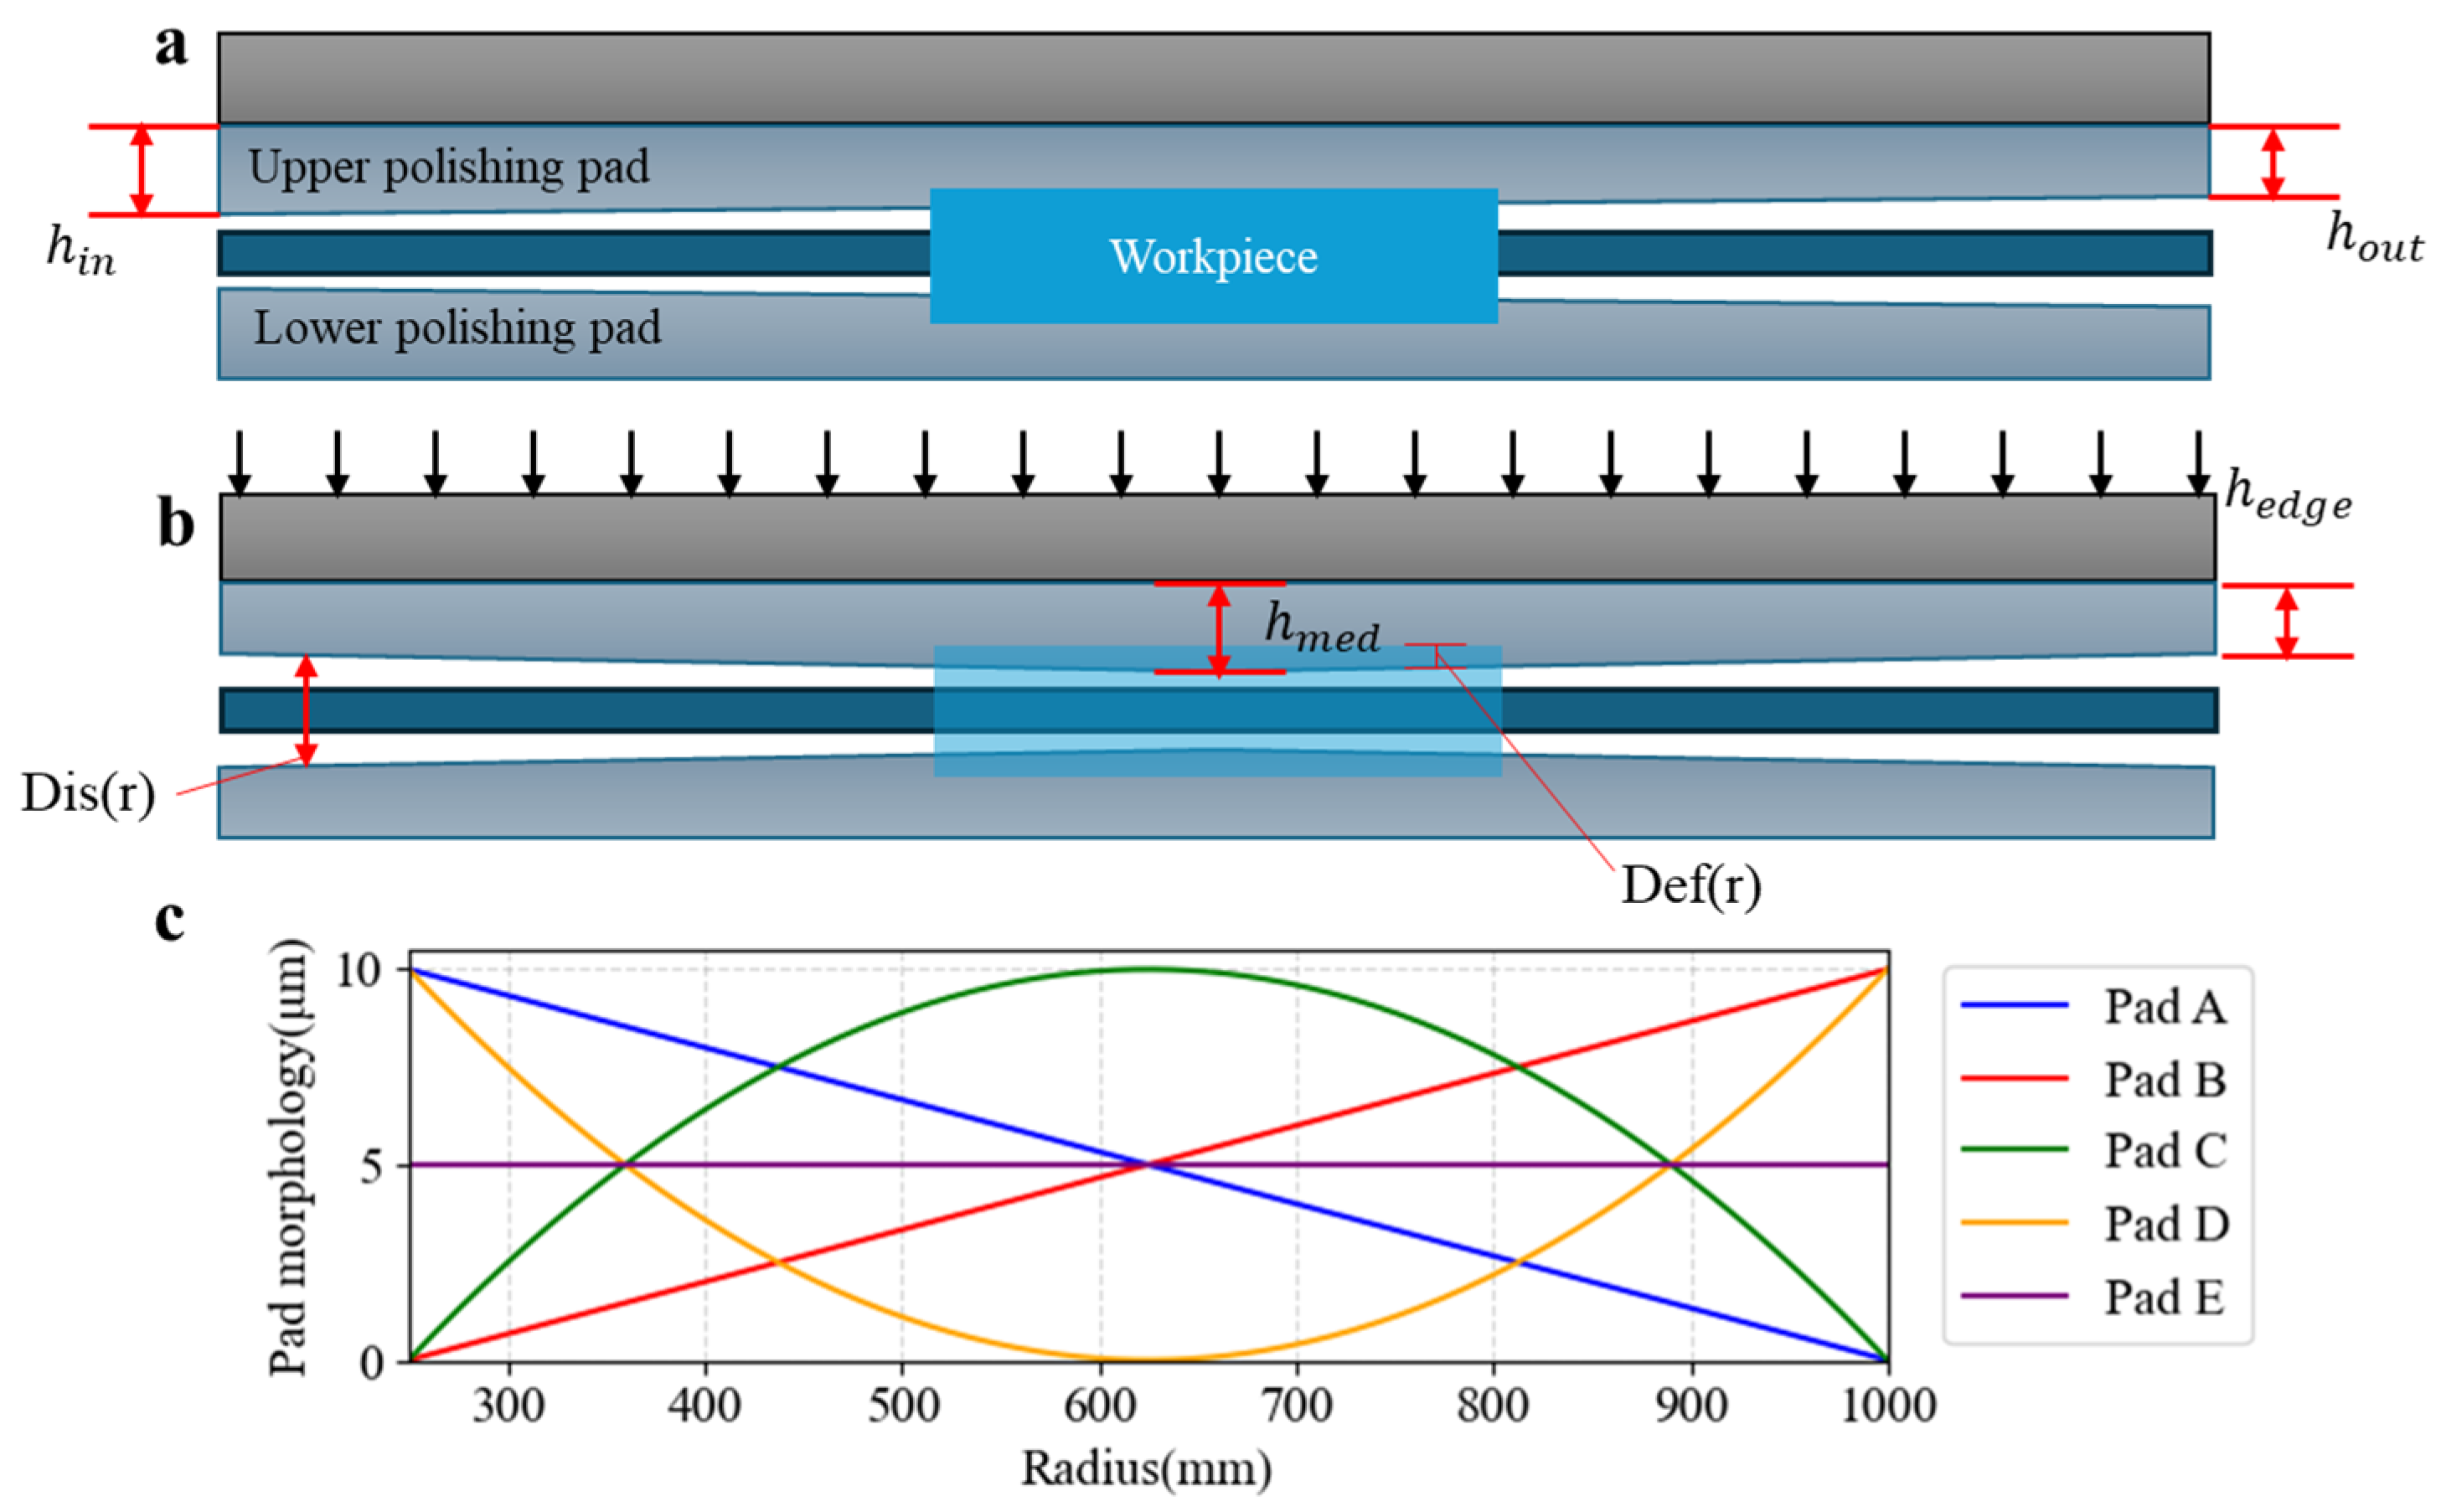
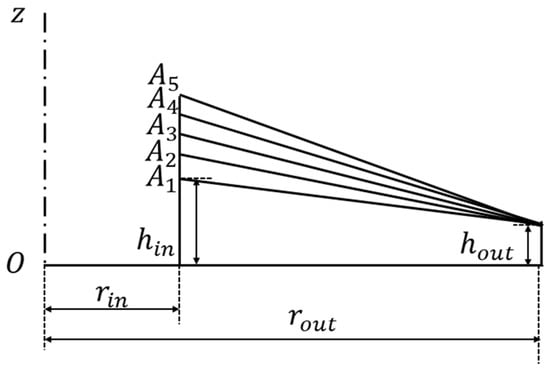
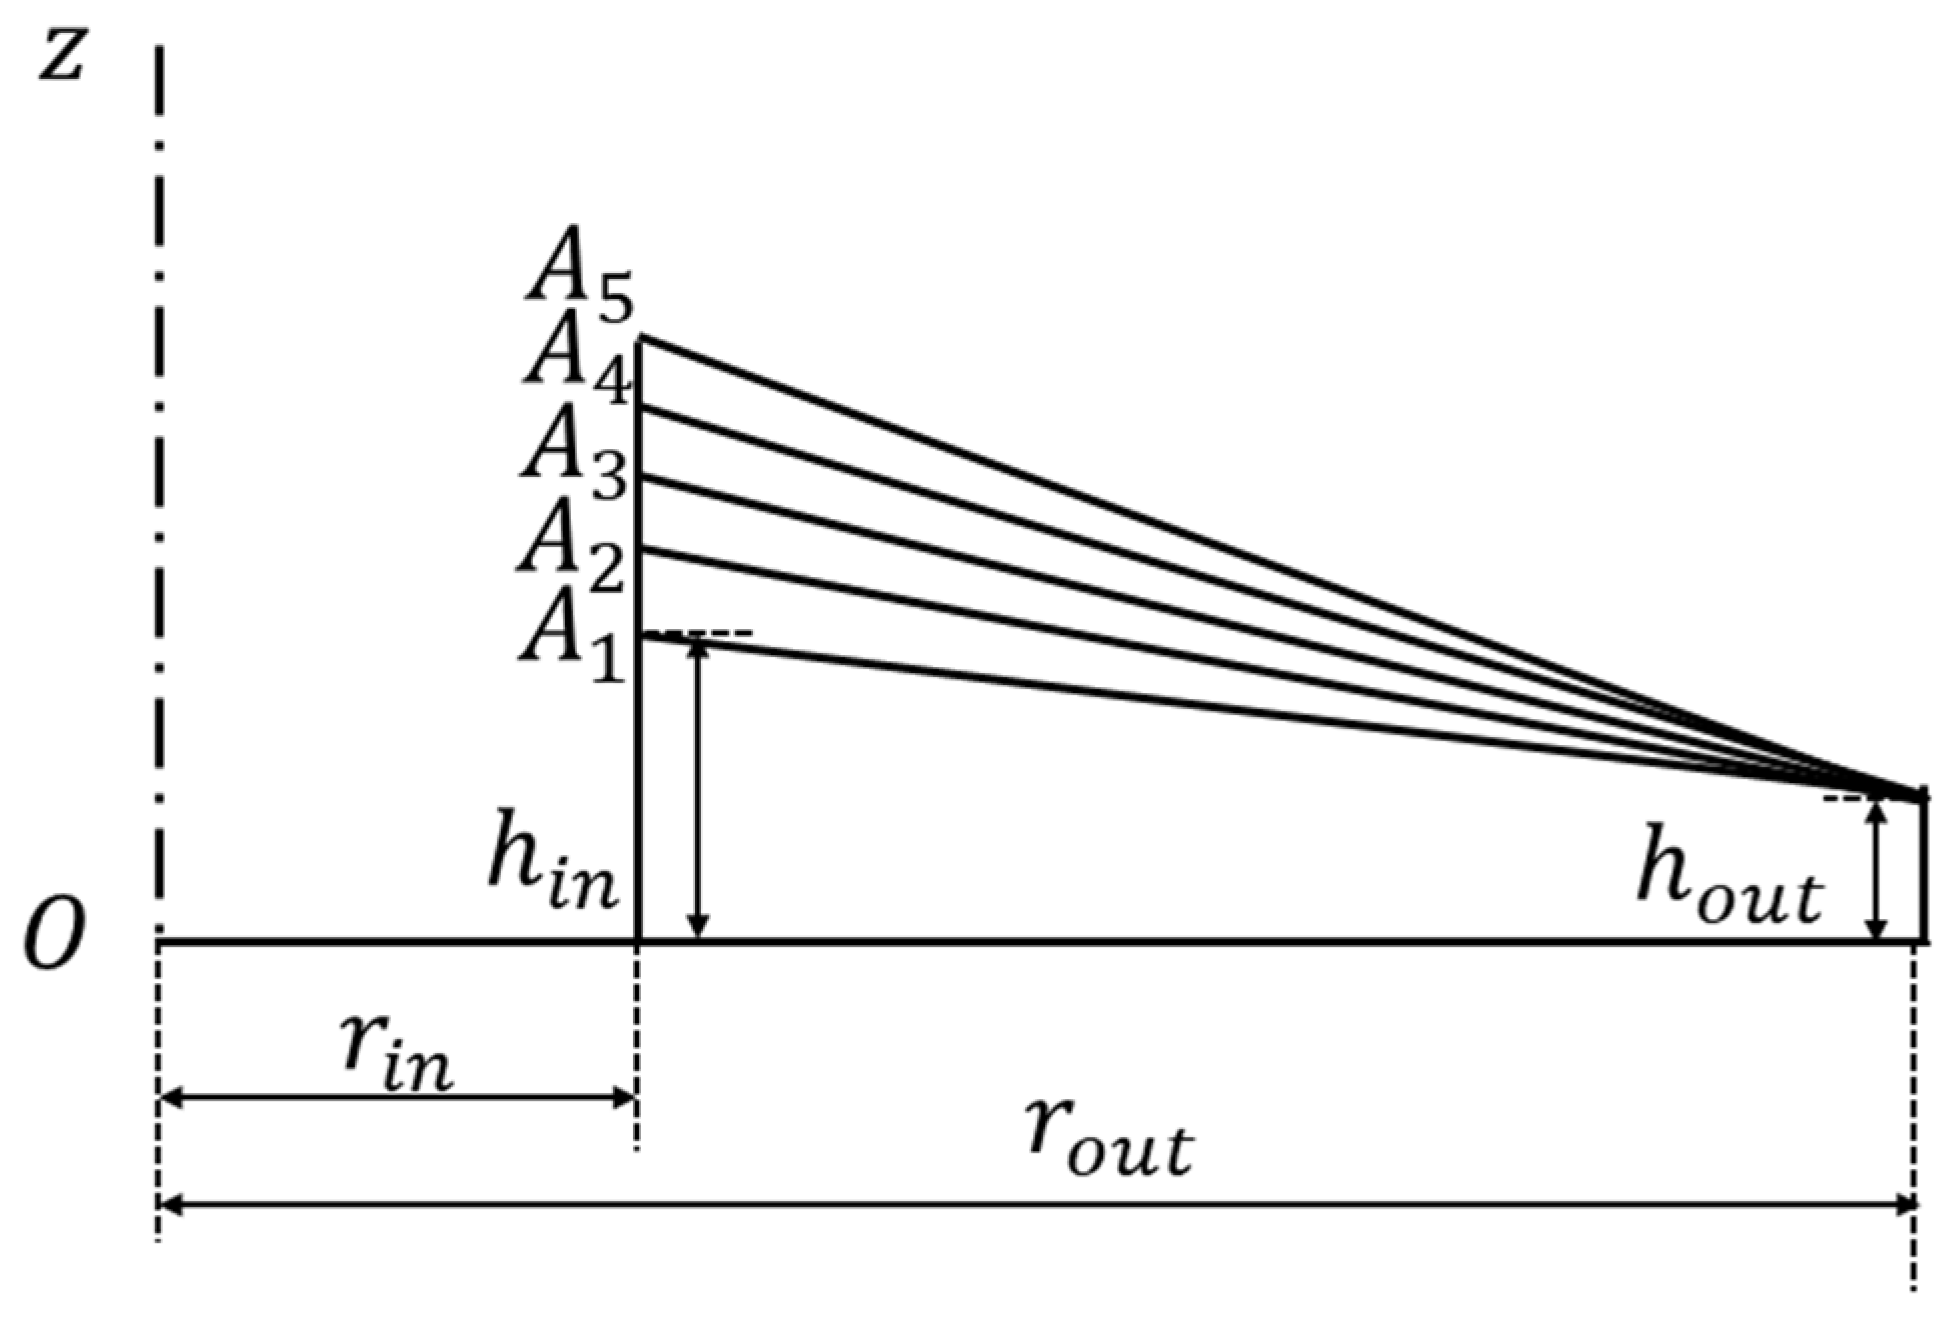
Finite element analysis is conducted to investigate the pressure distribution on the wafer surface for different pad topographies. The geometry dimensions and material properties adopted in the finite element model are summarized in Table 2. In DSP, pads with different surface topologies exhibit different “upper–lower pad” distance along the radial direction. During polishing, the wafer is clamped between the upper and lower pads, and the deformation of the pads varies at different radial positions. Consequently, pad surface topography directly affects the pressure distribution on the wafer surface. The pad surface can be adjusted through a conditioning process. As shown in Figure 4, five types of pads with different radial thickness distribution are studied: A. thick inside, thin outside (); B. thin inside, thick outside (); C. thick in the middle, thin at the edges (); D. thin in the middle, thick at the edges (); E: flat. Finite element analysis is conducted to investigate the pressure distribution on the wafer surface for these five pad topographies. In the simulation, both the upper and lower pads are assigned identical radial topography.
Table 2.
Model geometry parameters.
Taking pad type A () as an example, pads with are named respectively, as shown in Figure 5 and Figure 6. The naming rule with other topographies is consistent with that of type A.
Figure 5.
(a) Side view of pad A; (b) side view of pad D; (c) schematic diagram of 5 types of pads.
Figure 6.
Pad naming guidelines.
2.2.4. Mesh Independent Verification
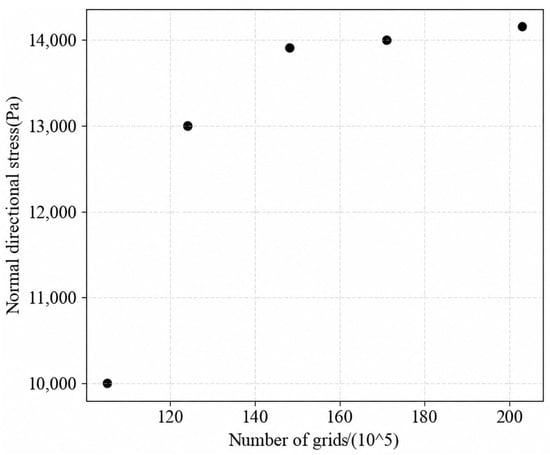
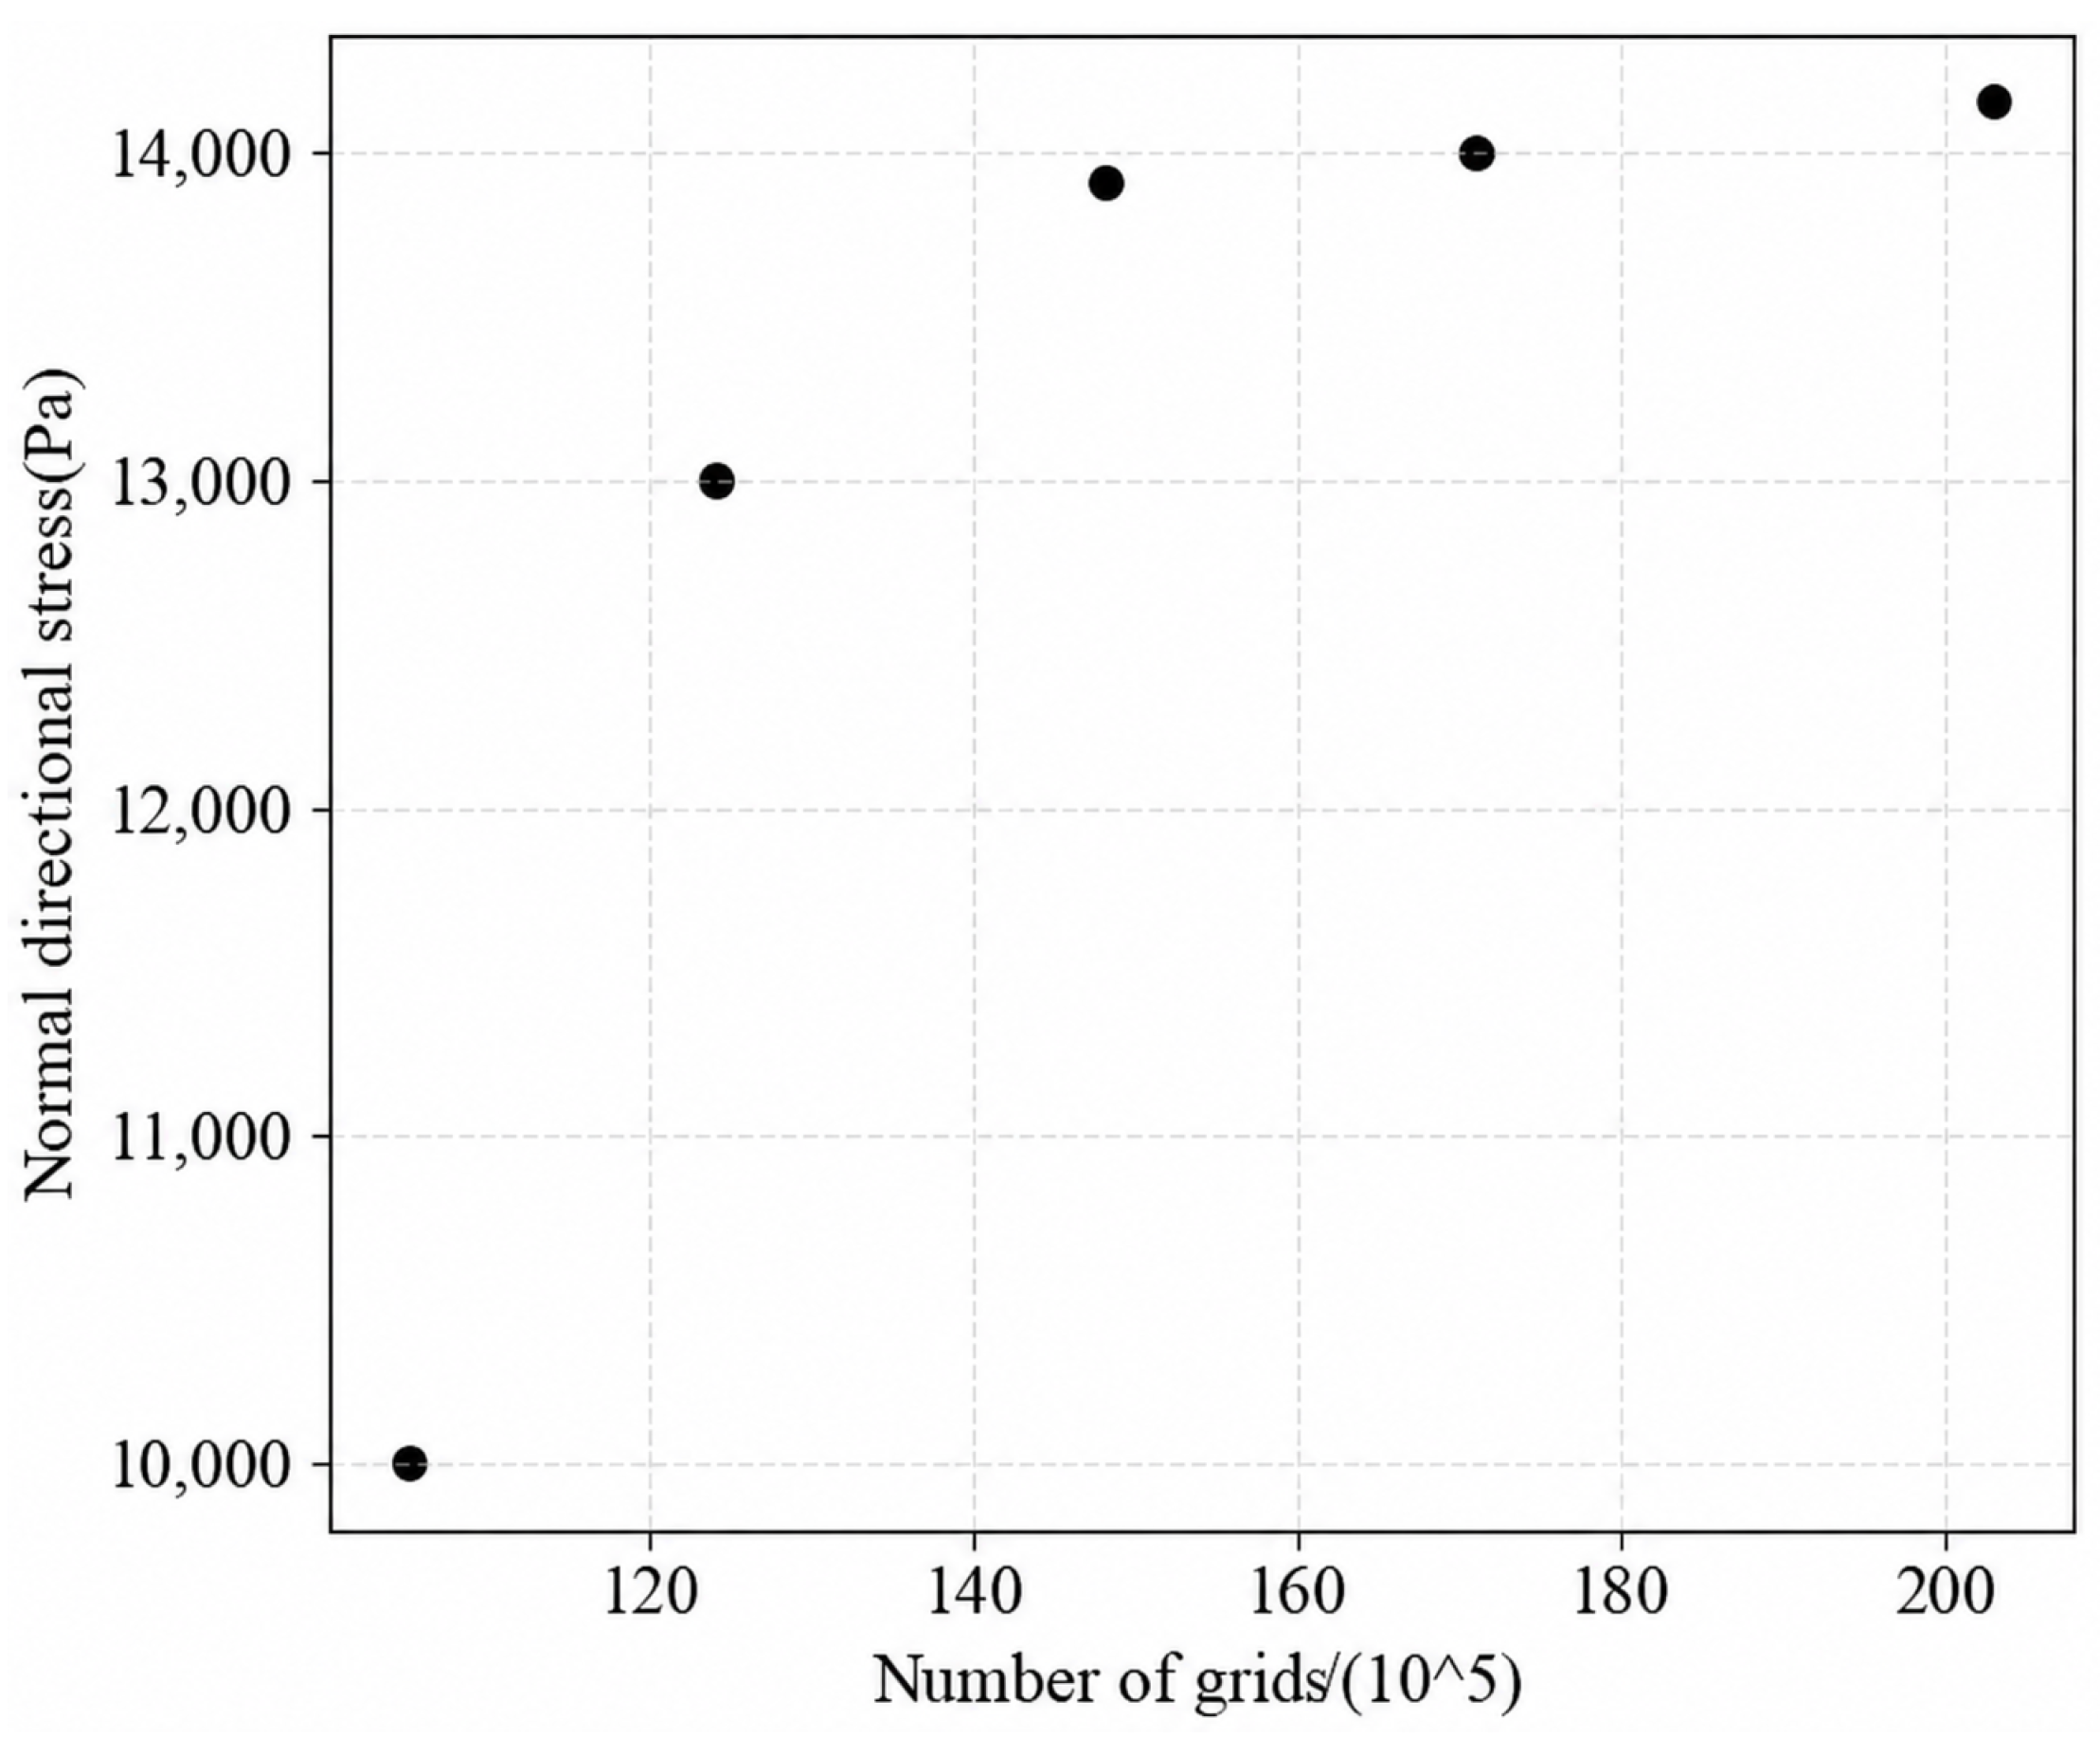
Mesh independent verification is conducted using () as an example to mitigate the influence of meshing on the simulation results. By adjusting the maximum element size on the wafer surface, comparative analysis is conducted on models with 2.03 million, 1.71 million, 1.48 million, 1.24 million, and 1.05 million grids. The average normal stress on the wafer surface is selected as the benchmark to evaluate the effect of meshing density on the simulation results. As illustrated in Figure 7, gradually stabilizes as the number of grids increases to 1.48 million. This trend indicates a diminishing influence of meshing density on the simulation results. Therefore, the model with 1.48 million elements was ultimately selected to balance accuracy and computational cost.
Figure 7.
Effect of the number of grids on the normal directional stress.
2.2.5. Finite Element Analysis Feasibility Verification
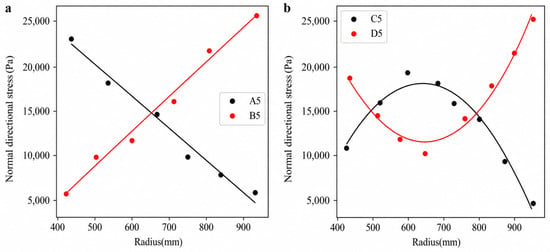
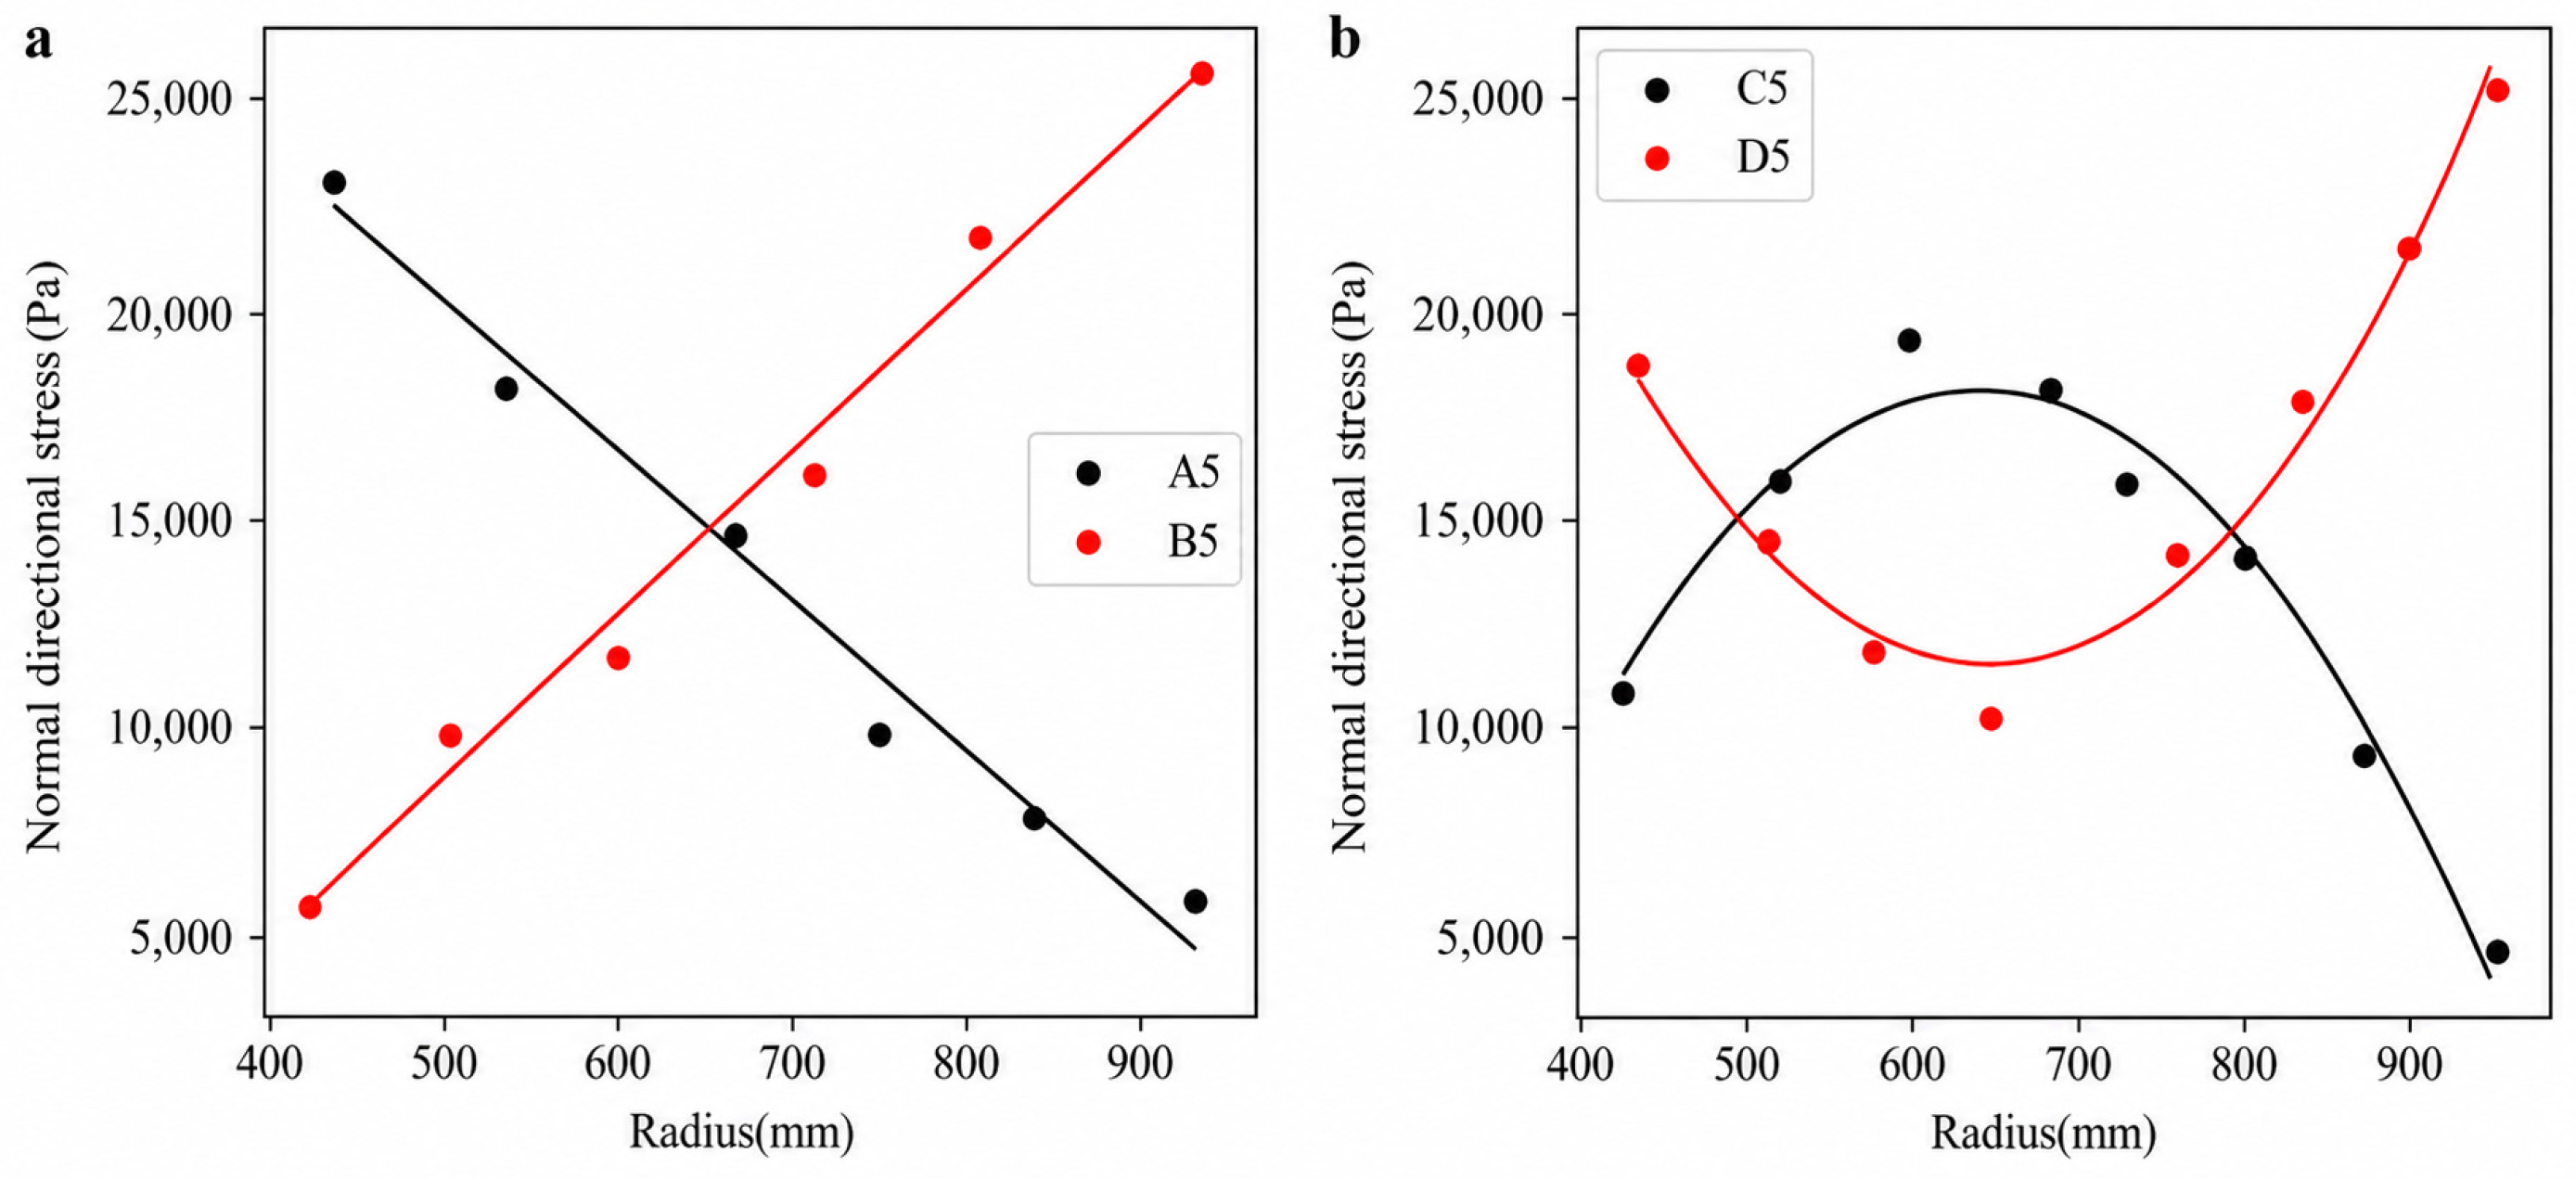
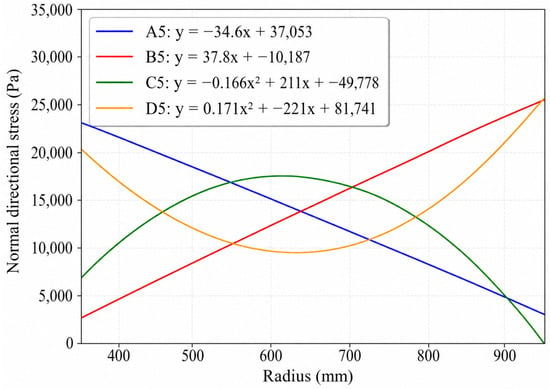
Taking pads and as examples for analysis, a scatter plot is created with the normal stress on the wafer surface as the vertical axis and the distance r from the corresponding points (x, y) to the origin in the coordinate system of the polishing pad during the polishing process as the horizontal axis. A linear relationship between the two can be observed in Figure 8a.
Figure 8.
Radial distribution of normal stress for different polishing pad topographies.
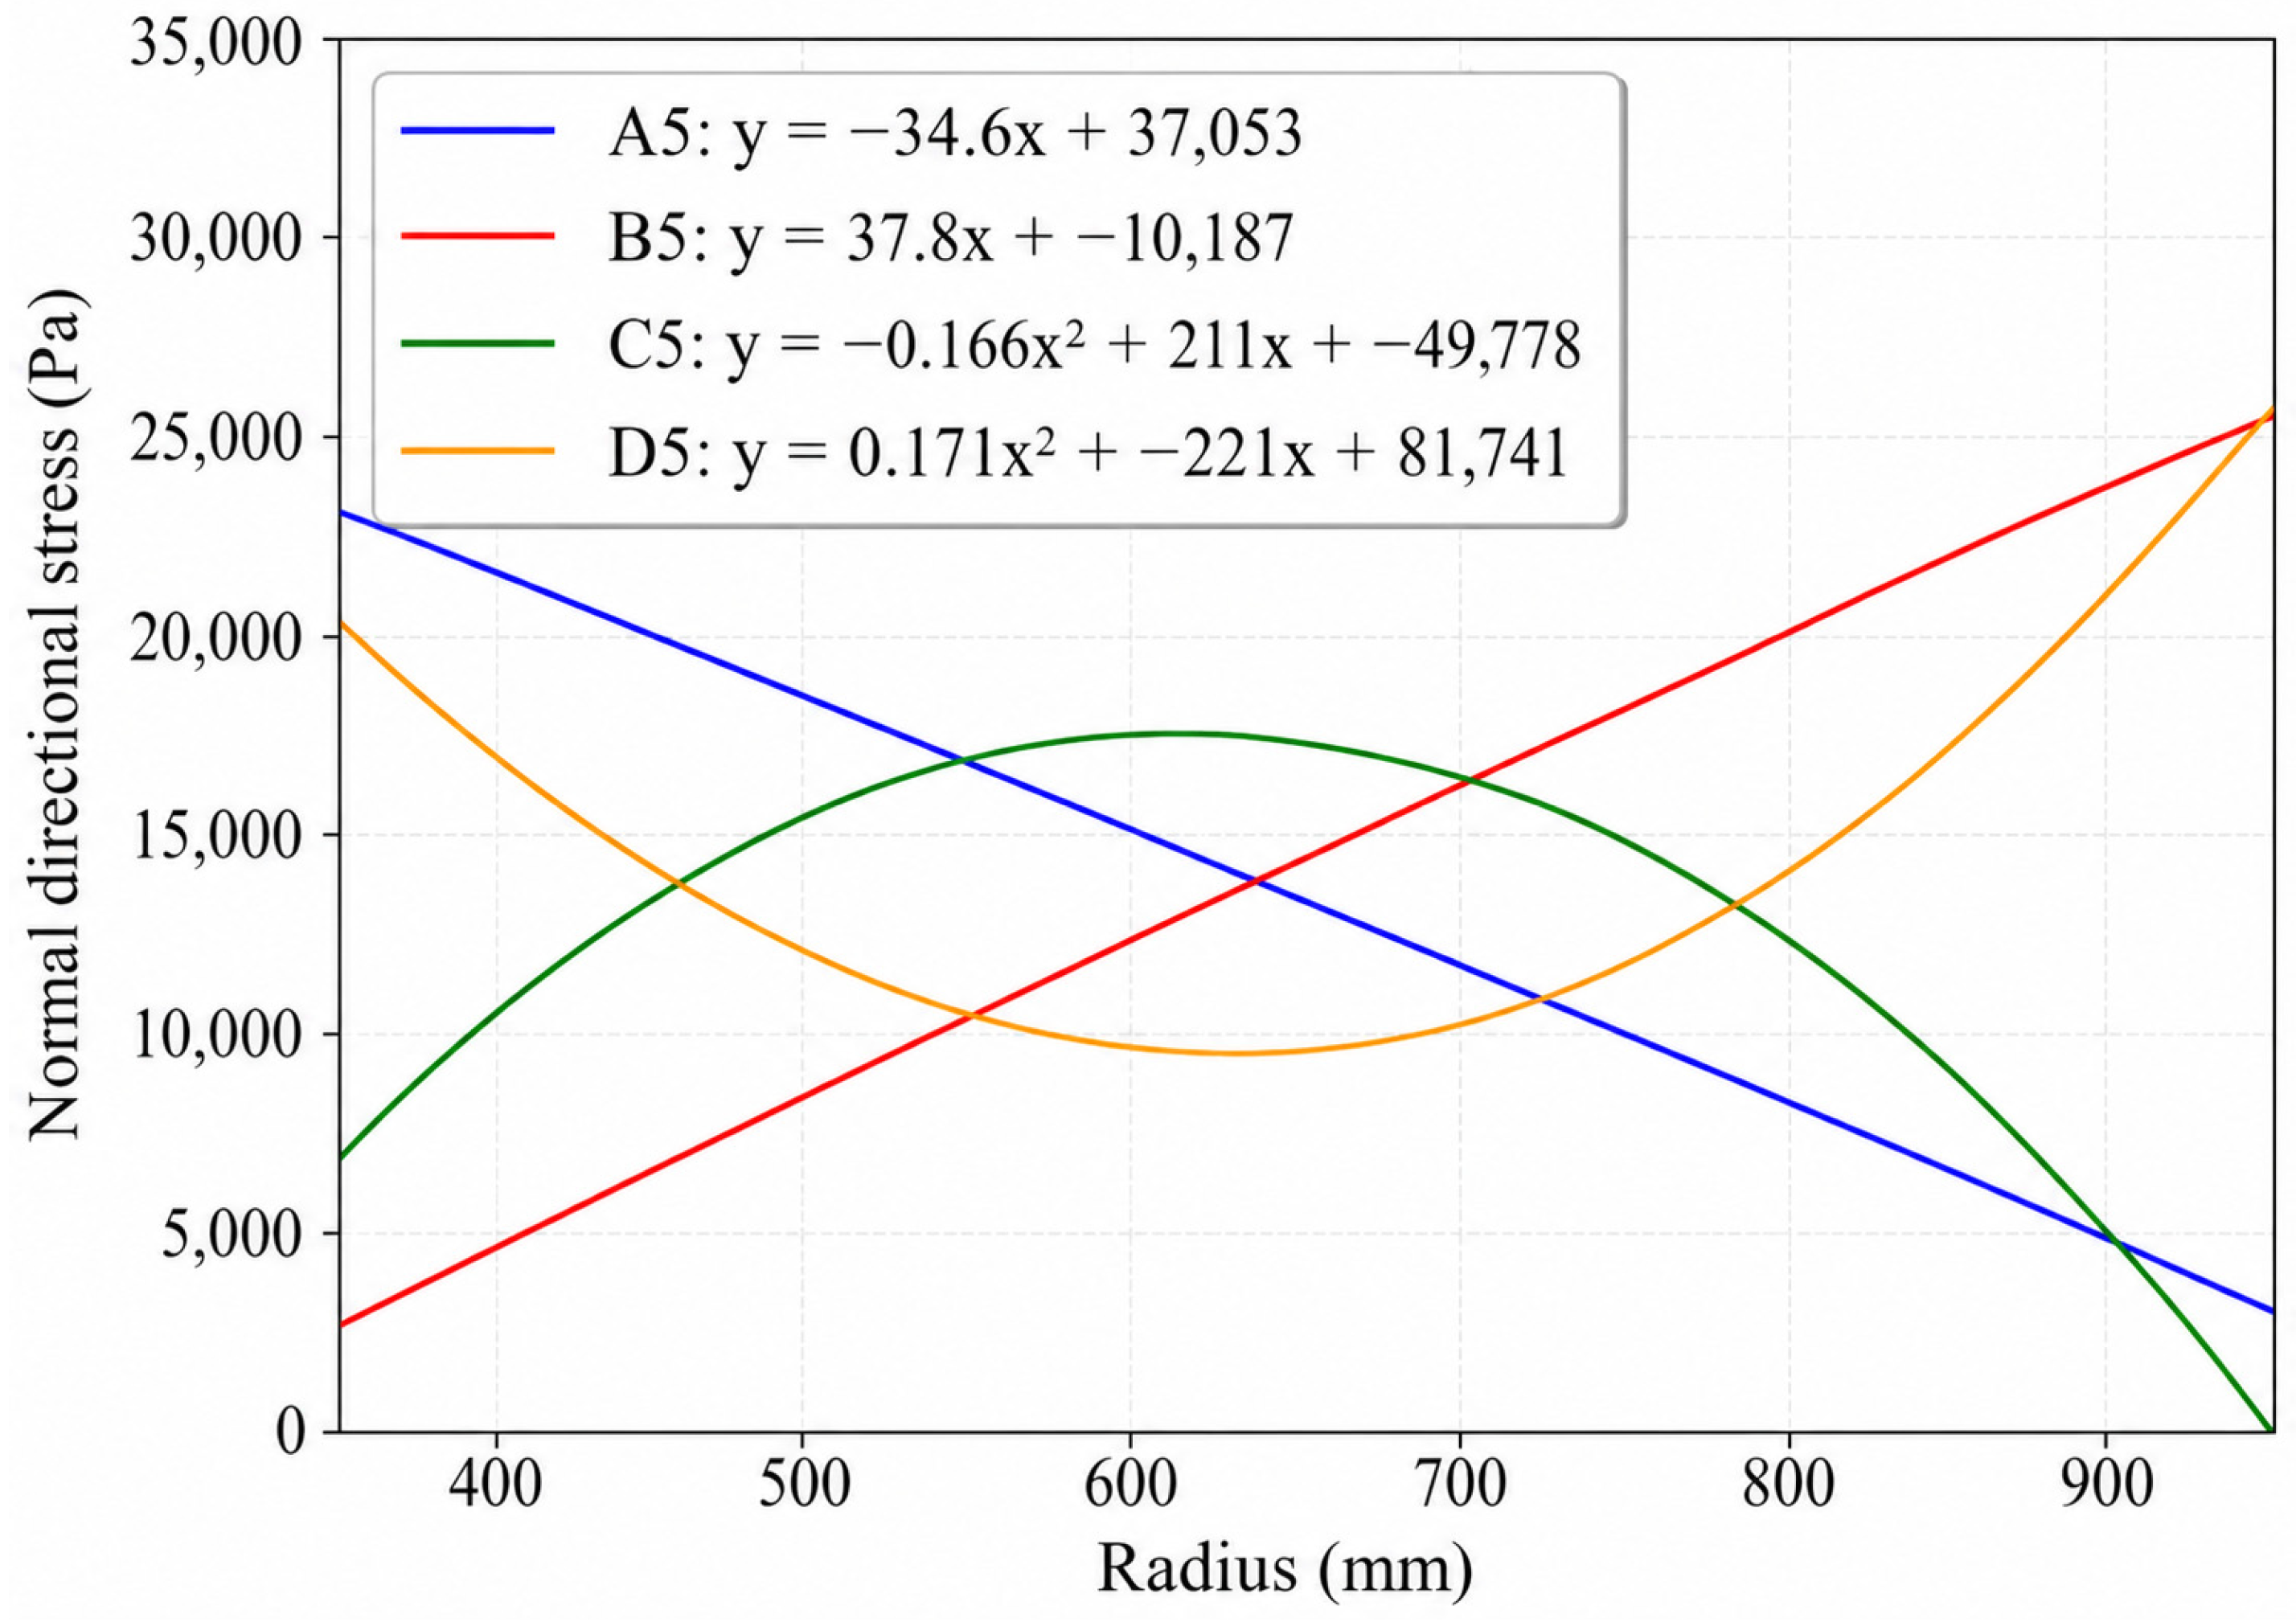
The simulation and fitting procedures are also applied to pads C5 and D5. Figure 8b indicates that for pads with either a concave or convex middle profile, the pressure distribution trend aligns with the pad topography. This correlation occurs because thicker regions of the pad experience a larger deformation upon contact with the wafer, whereas thinner regions deform less, consequently leading to variations in pressure distribution. In summary, pad topographies result in different normal pressure distributions across the wafer surface during polishing. Appropriately modifying the pad topography helps to achieve a desired pressure profile, thereby mitigating non-uniform material removal rates.
2.3. Pressure–Trajectory Coupling
For any given point on the wafer surface, its position relative to the pad continuously changes during the polishing process. At different positions, the pad experiences varying levels of deformation, and accordingly, the pressure exerted on that point also changes continuously. Based on the preceding simulation results, the pressure acting on any point on the wafer is a function of the radial distance r, expressed as P = P(r).
During the polishing process, pressure (P) and relative velocity (V) in the Preston equation change with time. For any point on the wafer, its coordinate is fixed at in the wafer coordinate system. According to the Preston equation, the material removal amount at this point is proportional to P and V. The relationship can be expressed by the following equation, where k is the Preston constant:
The pressure distribution for different pad topographies is obtained from the function P(r) based on the simulation. Taking pad types , , , as examples, their fitted pressure distribution curves are shown in Figure 9. For a fixed point (x*, y*) on the wafer, its radial distance r continuously changes during the polishing process, which can be calculated based on the trajectory Equations (7) and (8):
Figure 9.
Radial stress distribution for different polishing pad topographies.
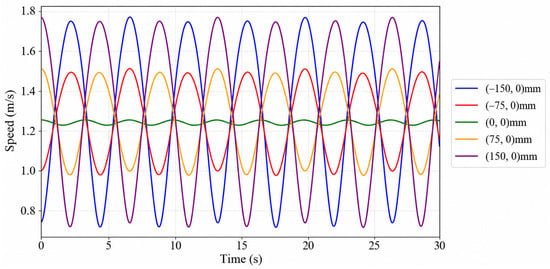
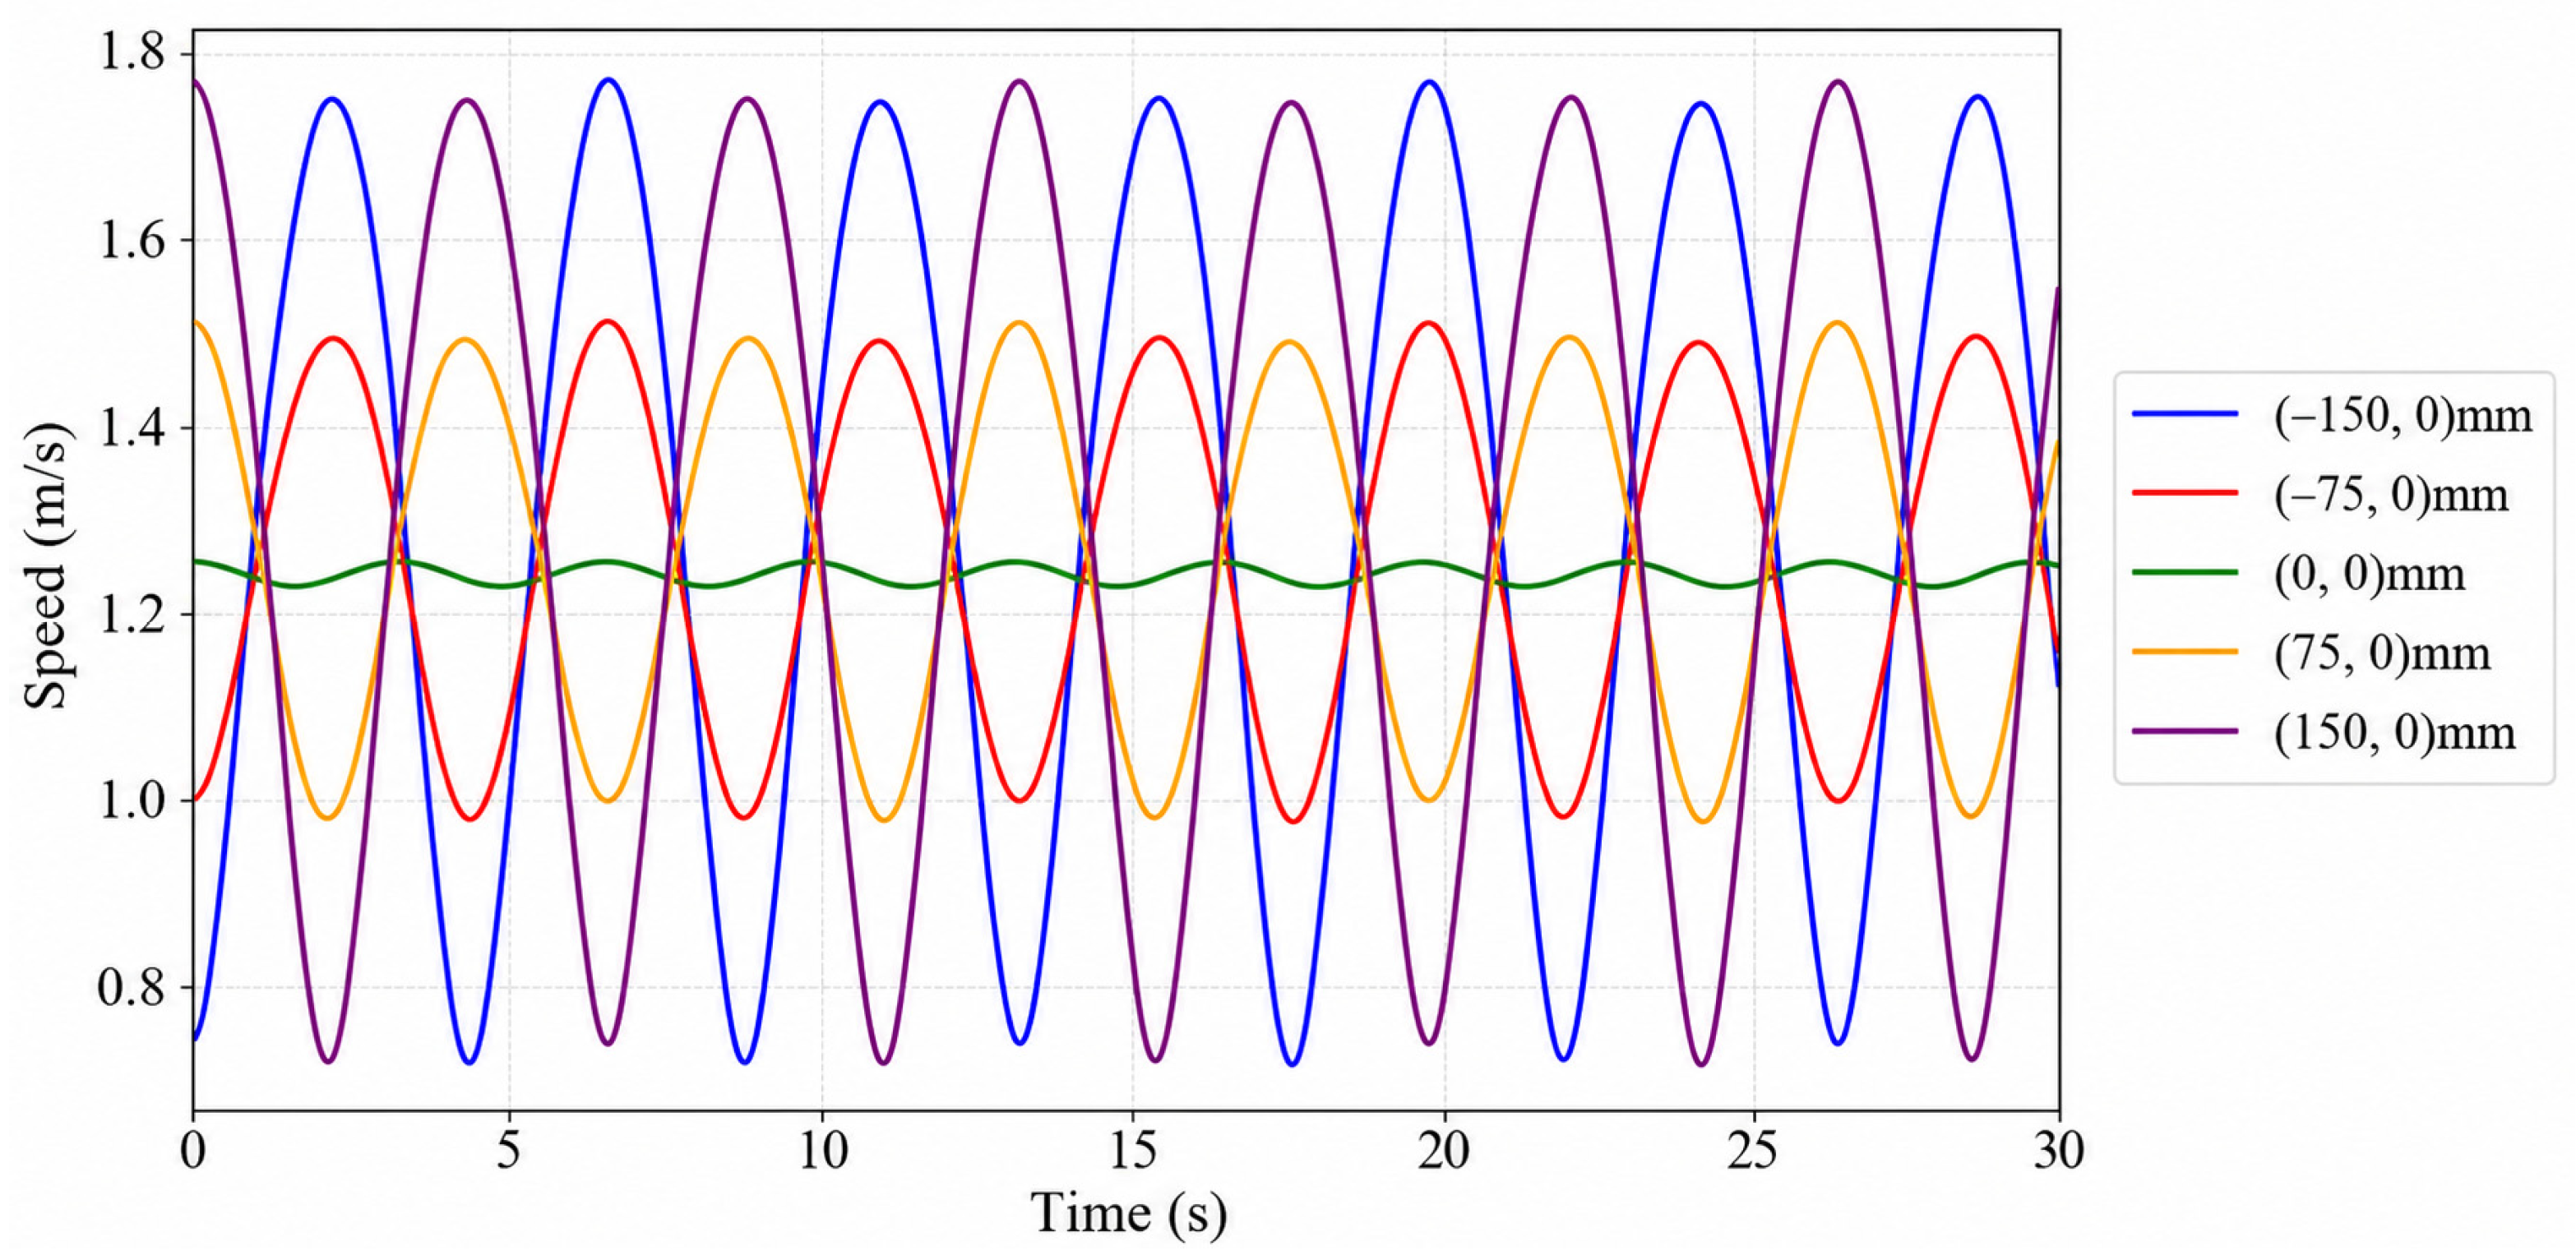
Once r is determined, is known. Additionally, can be calculated using Equation (13). Consequently, the material removal amount at any point on the wafer can be calculated. Figure 10 shows the distribution of the relative velocity over time at different positions on the wafer surface.
Figure 10.
Velocity variation of different points on wafer.
3. Verification and Results Discussion
3.1. Experiment Validation
Experimental data reported in the paper by Urara Satake [21] is used to compare with the simulation results to evaluate the validity of the proposed pressure–trajectory coupling model. The DSP process is conducted on 12-inch single-crystal silicon wafers, and the pad material is polyurethane. The inner gear diameter, the carrier diameter, and the distance between the wafer center and the carrier center are 751 mm, 700 mm, and 182.5 mm, respectively. The upper and lower pad rotational speed are −10 and 20 rpm. The cited literature indicates that the wafer’s rotational speed varies periodically between −4 and 10 rpm during the polishing process. Since the present model focuses on cycle-averaged material removal behavior, the use of the experimentally averaged rotational speed mainly affects local transient velocity fluctuations while having limited influence on the overall radial removal distribution. The pressure field used in the present model is also obtained through cycle averaging of several representative positions, which further reduces the influence of instantaneous rotational speed variation on the final predicted WIWNU.
In this study, the average rotational speed is used to approximate this periodically varying wafer rotation. The carrier rotation speed and revolution speed are −4 and 5 rpm. The polishing pressure is set to 20 kPa. The material removal results are measured and normalized at a radius of 140 mm.
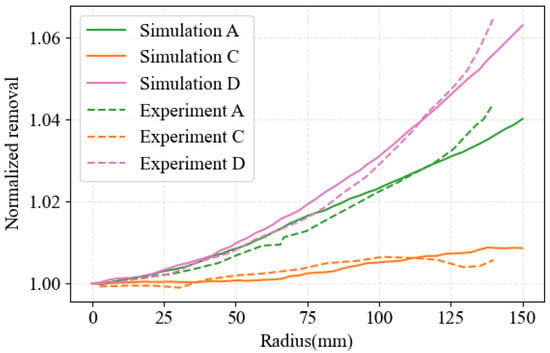
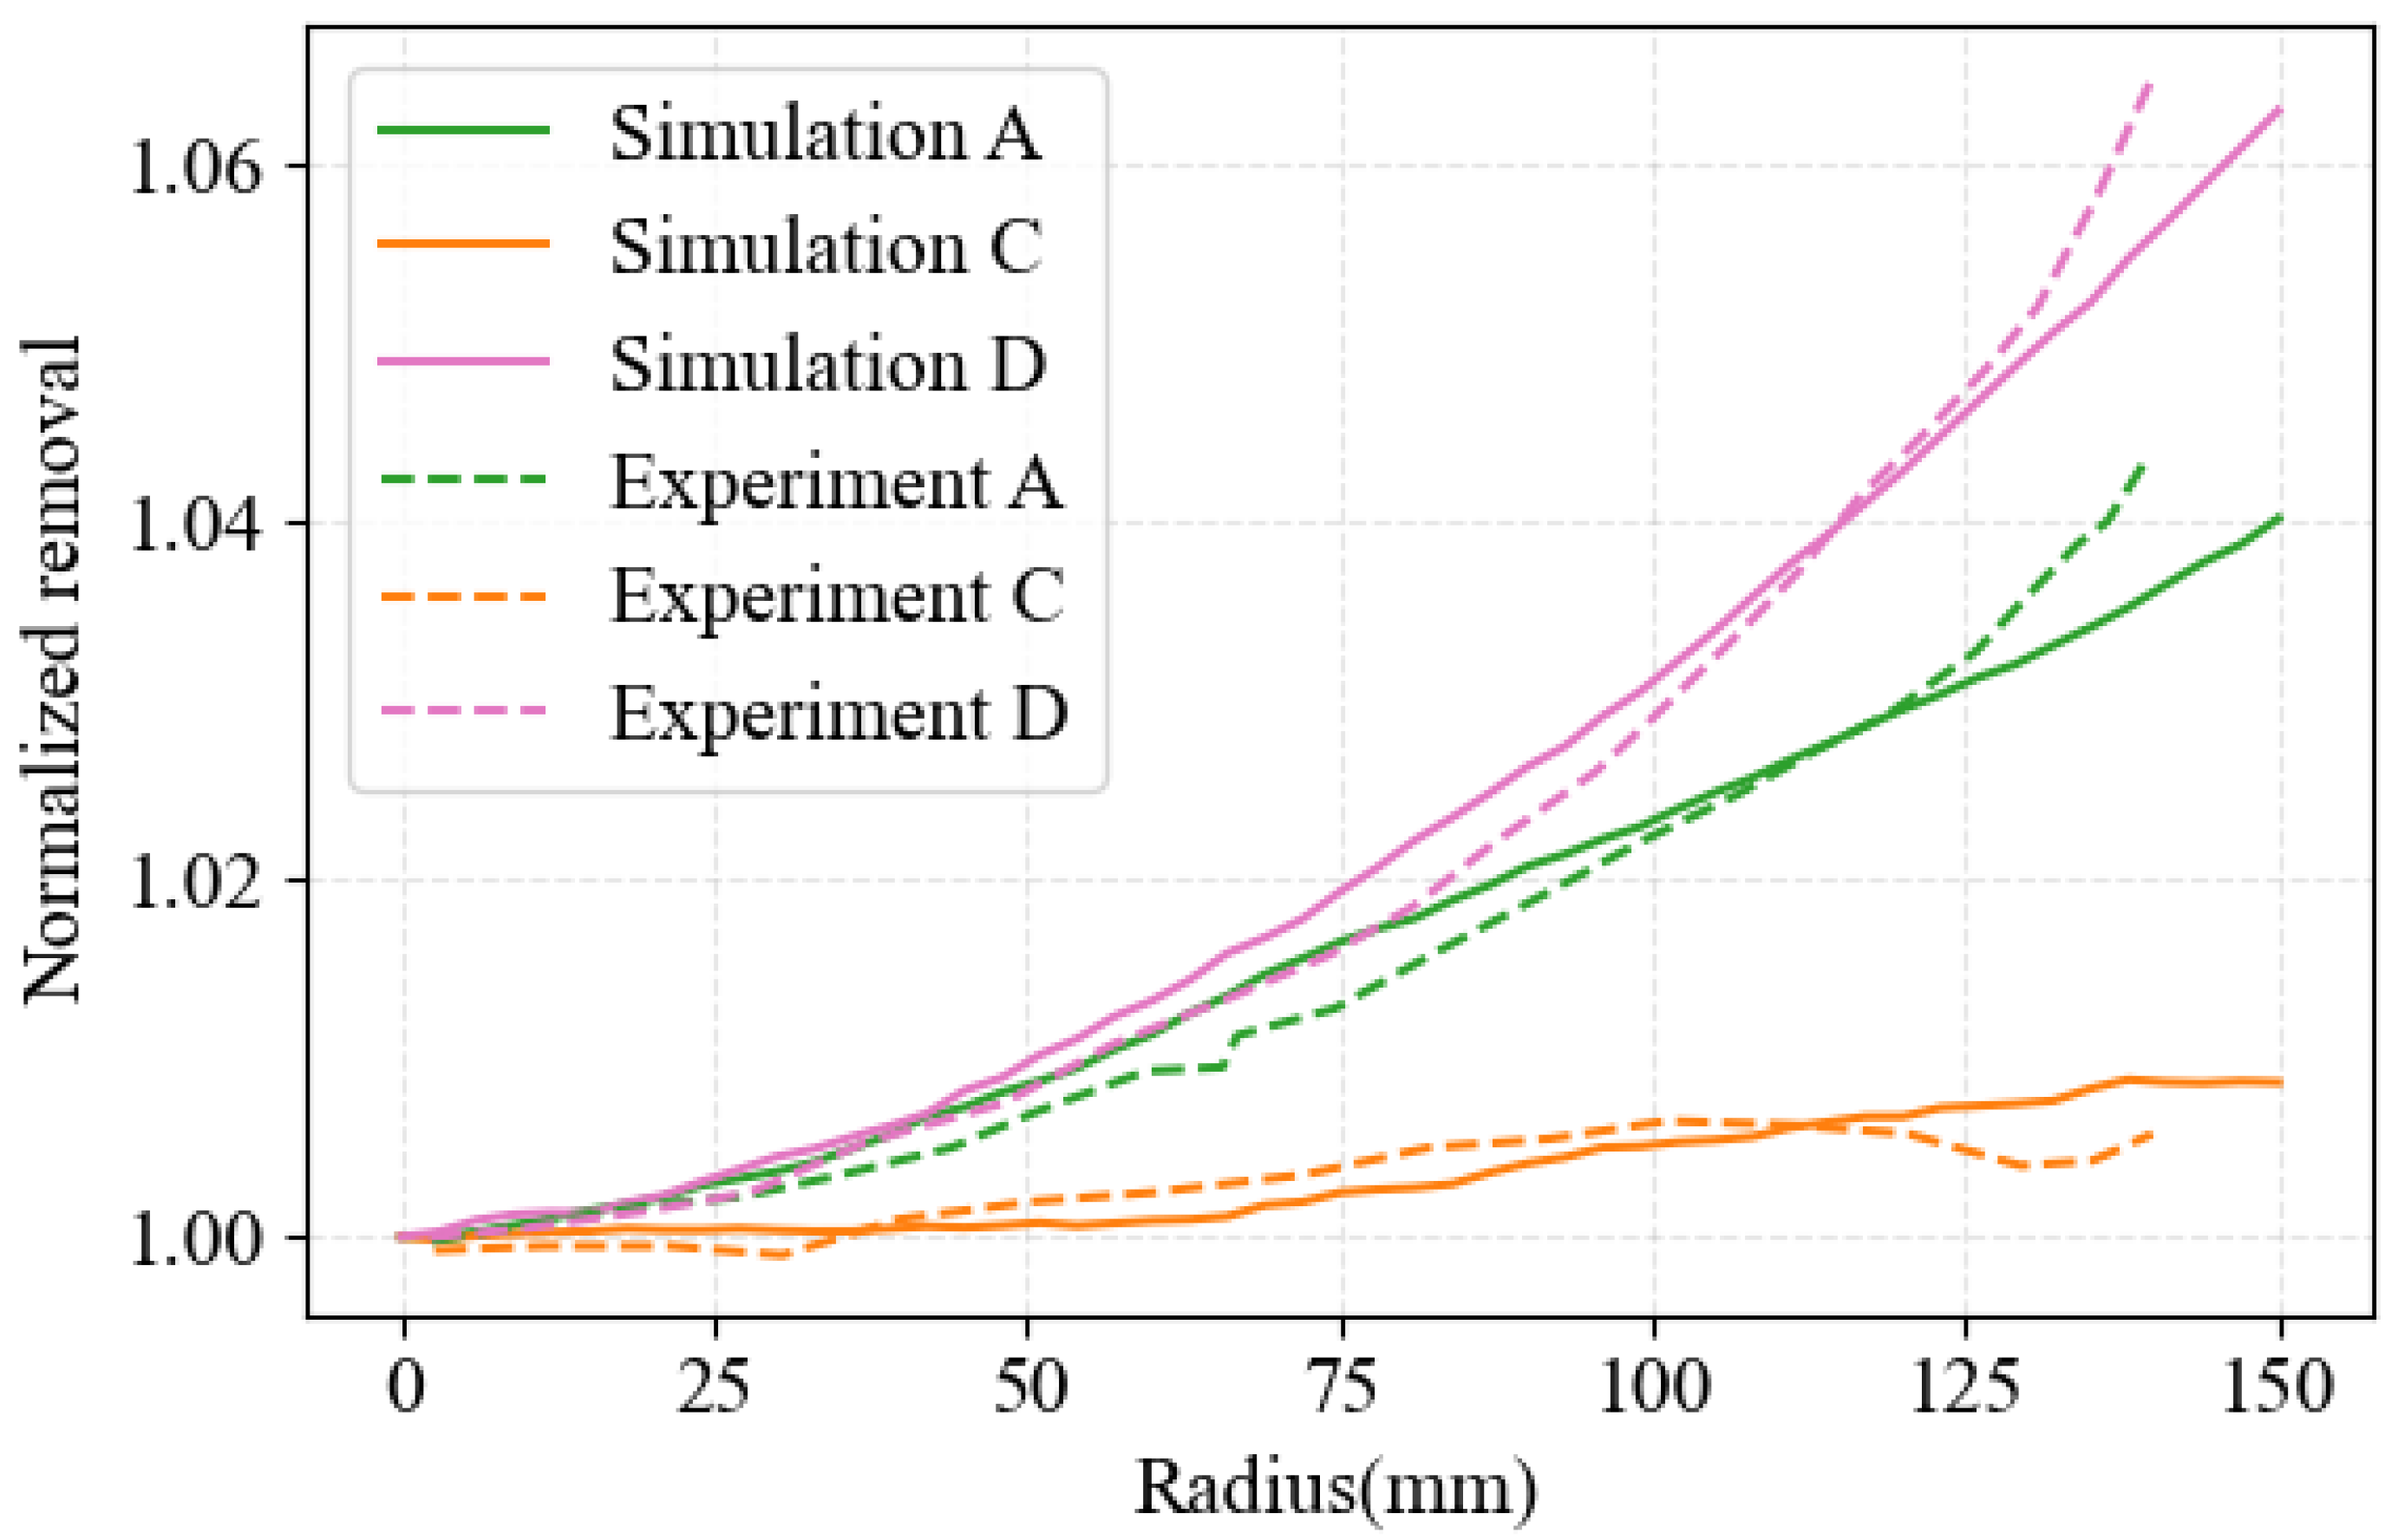
Pad types A, C, and D are used in experiments and simulations. The normalized removal distribution for pad types A, C and D shown in the paper by Urara Satake are extracted using Origin 2018 software. The original pad B in Ref. [21] was not separately included because its radial removal trend is similar to that of pad C and does not provide additional representative characteristics for the present discussion. Firstly, the spatial pressure distribution on the wafer surface is obtained from the finite element simulation under different pad topographies. Subsequently, the relative velocity between the wafer and the polishing pad at each time point is calculated using Equation (13). By integrating the time-dependent pressure and velocity, the material removal amount at any point is determined. In order to compare WIWNU, a normalized comparison between the experimental results and theoretical calculations is presented in Figure 11. The comparison shows good agreement in the overall trend, indicating that the proposed pressure–trajectory coupling model can reasonably capture the essential physics governing the interaction between pad morphology, pressure distribution, and material removal. Although local deviations exist for pad type C, especially near the wafer edge region, the overall radial removal tendency remains consistent with the experimental observations. The slight discrepancies may originate from the difference between the idealized pad topography used in the present model and the actual conditioned pad morphology in experiments [22].
Figure 11.
Comparison between simulated and experimental radial material removal distributions for representative pad topographies corresponding to pads A, C, and D.
3.2. Results and Discussion
3.2.1. Effect of Pad Topography on Wafer Removal Distribution
The normalized material removal amount is plotted to compare WIWNU, showing the distribution of material removal along the radius for different pad topographies. The normalization method is based on
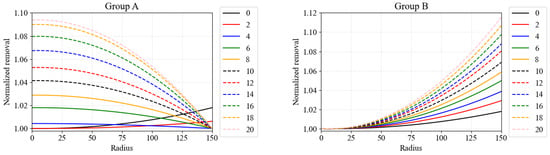
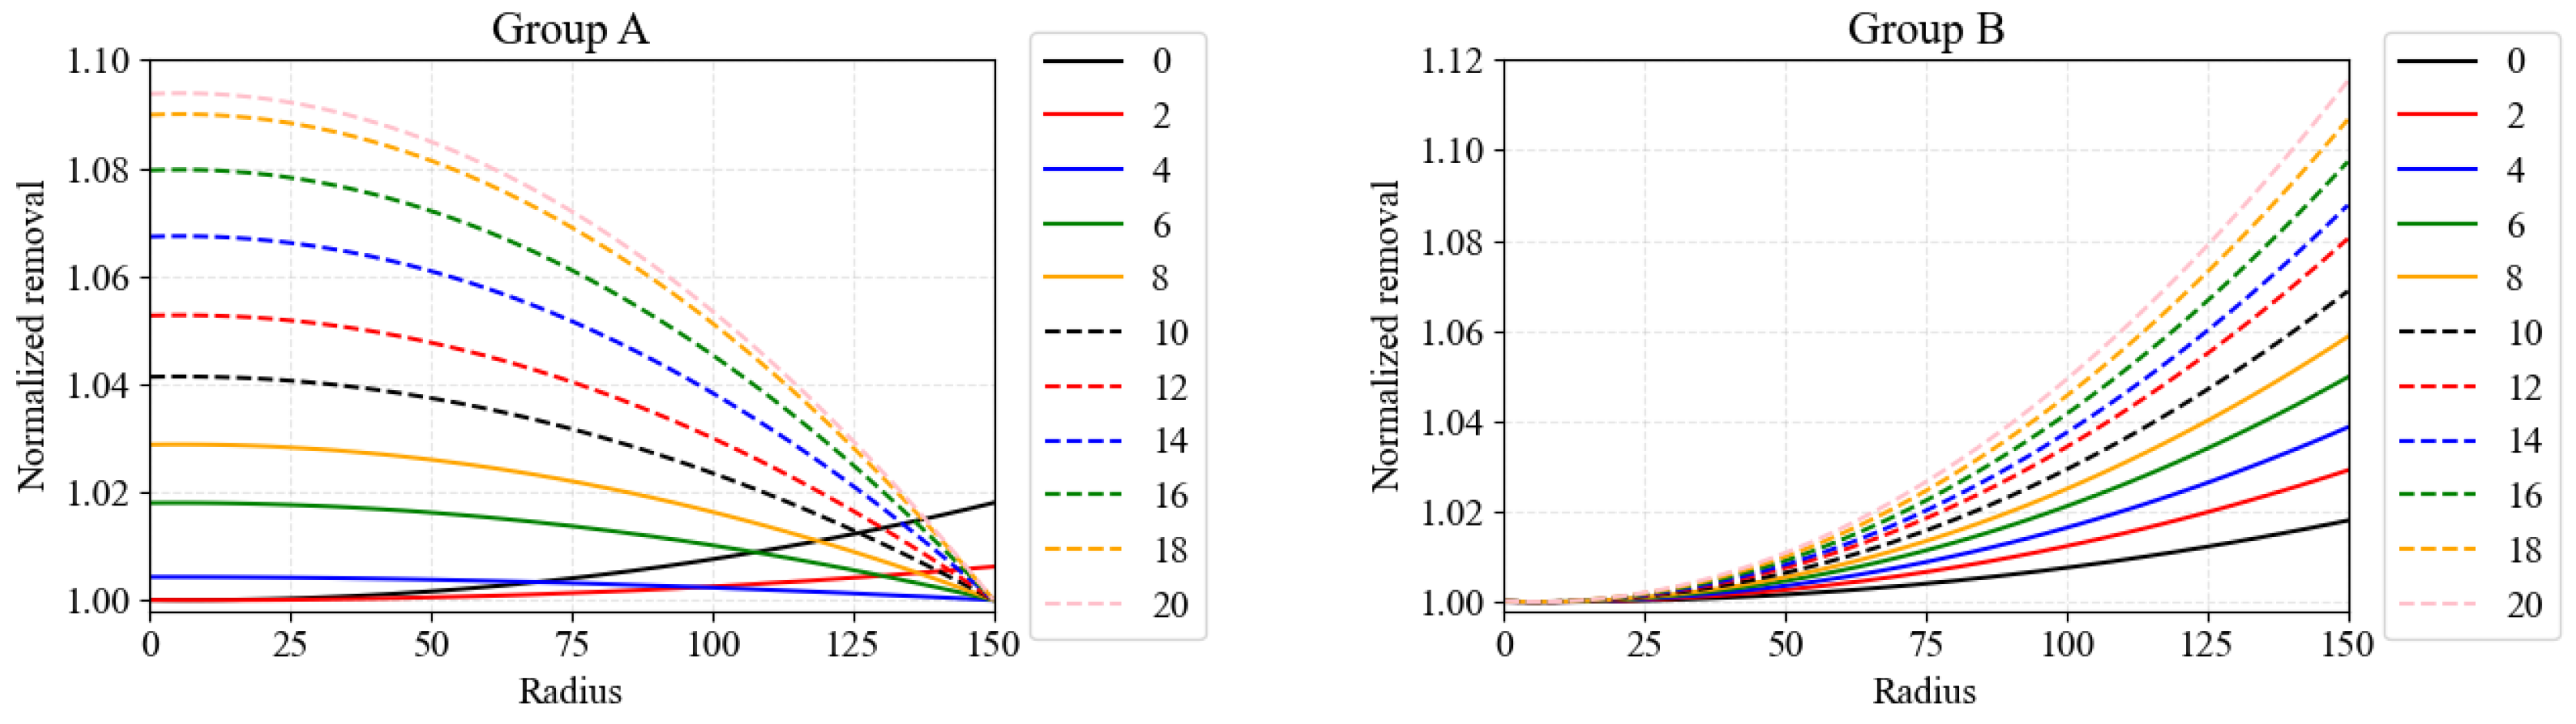
For pad types A and B, with used as the data label, Figure 12 shows that except for , wafers polished with pad type A all exhibit a concave profile— lower near the center and higher near the edge. As increases, the non-uniformity of the polishing pressure distribution intensifies, leading to a more uneven distribution of material removal across the wafer. However, this does not imply that a perfectly flat pad () produces the most uniform wafer surface. Even with uniform pressure distribution, the average velocity of different points on the wafer during polishing can vary, which also contributes to non-uniform material removal. For , the maximum material removal on the wafer surface is 1.018 times the minimum. In contrast, with a slightly tilted pad such as , the maximum material removal is only 1.004 times the minimum, indicating a significant improvement in removal uniformity.
Figure 12.
Normalized material removal distribution of pad types A and B.
For pad type B, the polished wafers all show a convex profile—higher near the center and lower near the edge. As increases, the pressure distribution becomes more non-uniform, and the material removal distribution likewise grows more uneven.
Comparing the two figures, it can be concluded that pad type A can produce concave wafers or reduce the convexity of the wafer, while Group B pads can only produce convex wafers and enhance the wafer convexity. Such removal tendencies are also consistent with previously reported experimental observations under different DSP pad gap conditions, where positive gap values tend to produce convex wafer profiles while negative gap values tend to generate concave morphology tendencies [23].
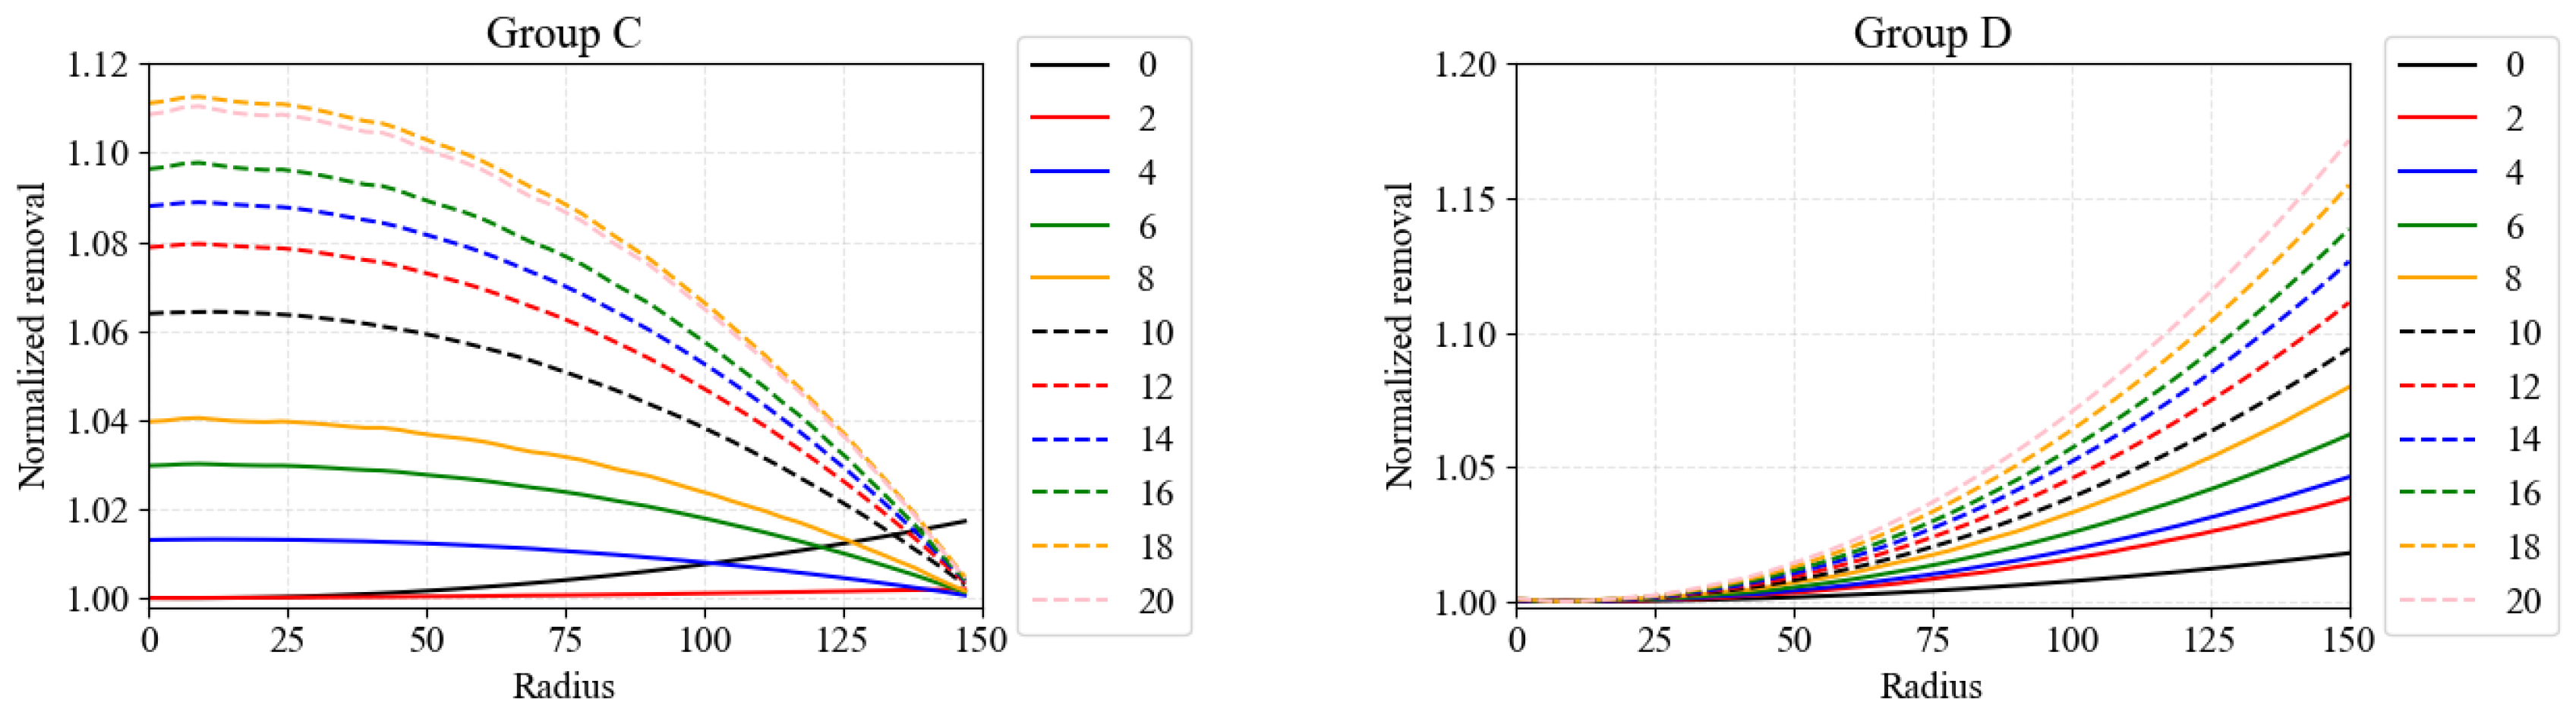
For pad types C and D, with used as the data label, Figure 13 shows that the results for pad type C are similar to those of pad type A. With the exception of the case where , the wafers polished with pad type C all exhibit a concave profile—lower near the center and higher near the edges. Notably, the pad with in pad type C produces the most uniform material removal distribution among all pads tested in this study, where the maximum material removal on the wafer surface was only 1.002 times the minimum. Pad type D, similar to pad type B, produces wafers with a convex profile. However, the comparison results show that the wafers polished with pad type D exhibit worse uniformity compared to those polished with pad type B.
Figure 13.
Normalized material removal distribution of pad types C and D.
From these four figures, it can be observed that pad types B and D tend to produce convex wafers, and the degree of convexity increases with the increase of . In contrast, Type A and type C pads tend to produce concave wafers. The superior material removal rate uniformity achieved with pad type A at and pad type C at can be attributed to the higher relative velocity at the wafer edge relative to the center, given the specific rotational speeds employed in this study. This inherent trajectory non-uniformity tends to polish a convex wafer profile, while the specific pressure fields generated by the pad type A and pad type C topographies compensate for this effect. Previous computational and experimental studies have found that a height difference of around is a critical point where the contact state of the polishing interface changes [18,24], which is why significant changes in polishing outcomes are also prone to occur near . Therefore, the material removal distribution in DSP is governed by the coupling between pressure distribution and relative velocity, rather than by either factor alone. When the pressure distribution is inversely correlated with the velocity distribution, the removal non-uniformity can be effectively compensated. Conversely, when both pressure and velocity exhibit the same radial trend, the non-uniformity is amplified.
3.2.2. Discussion on the Influence of Polishing Pressure
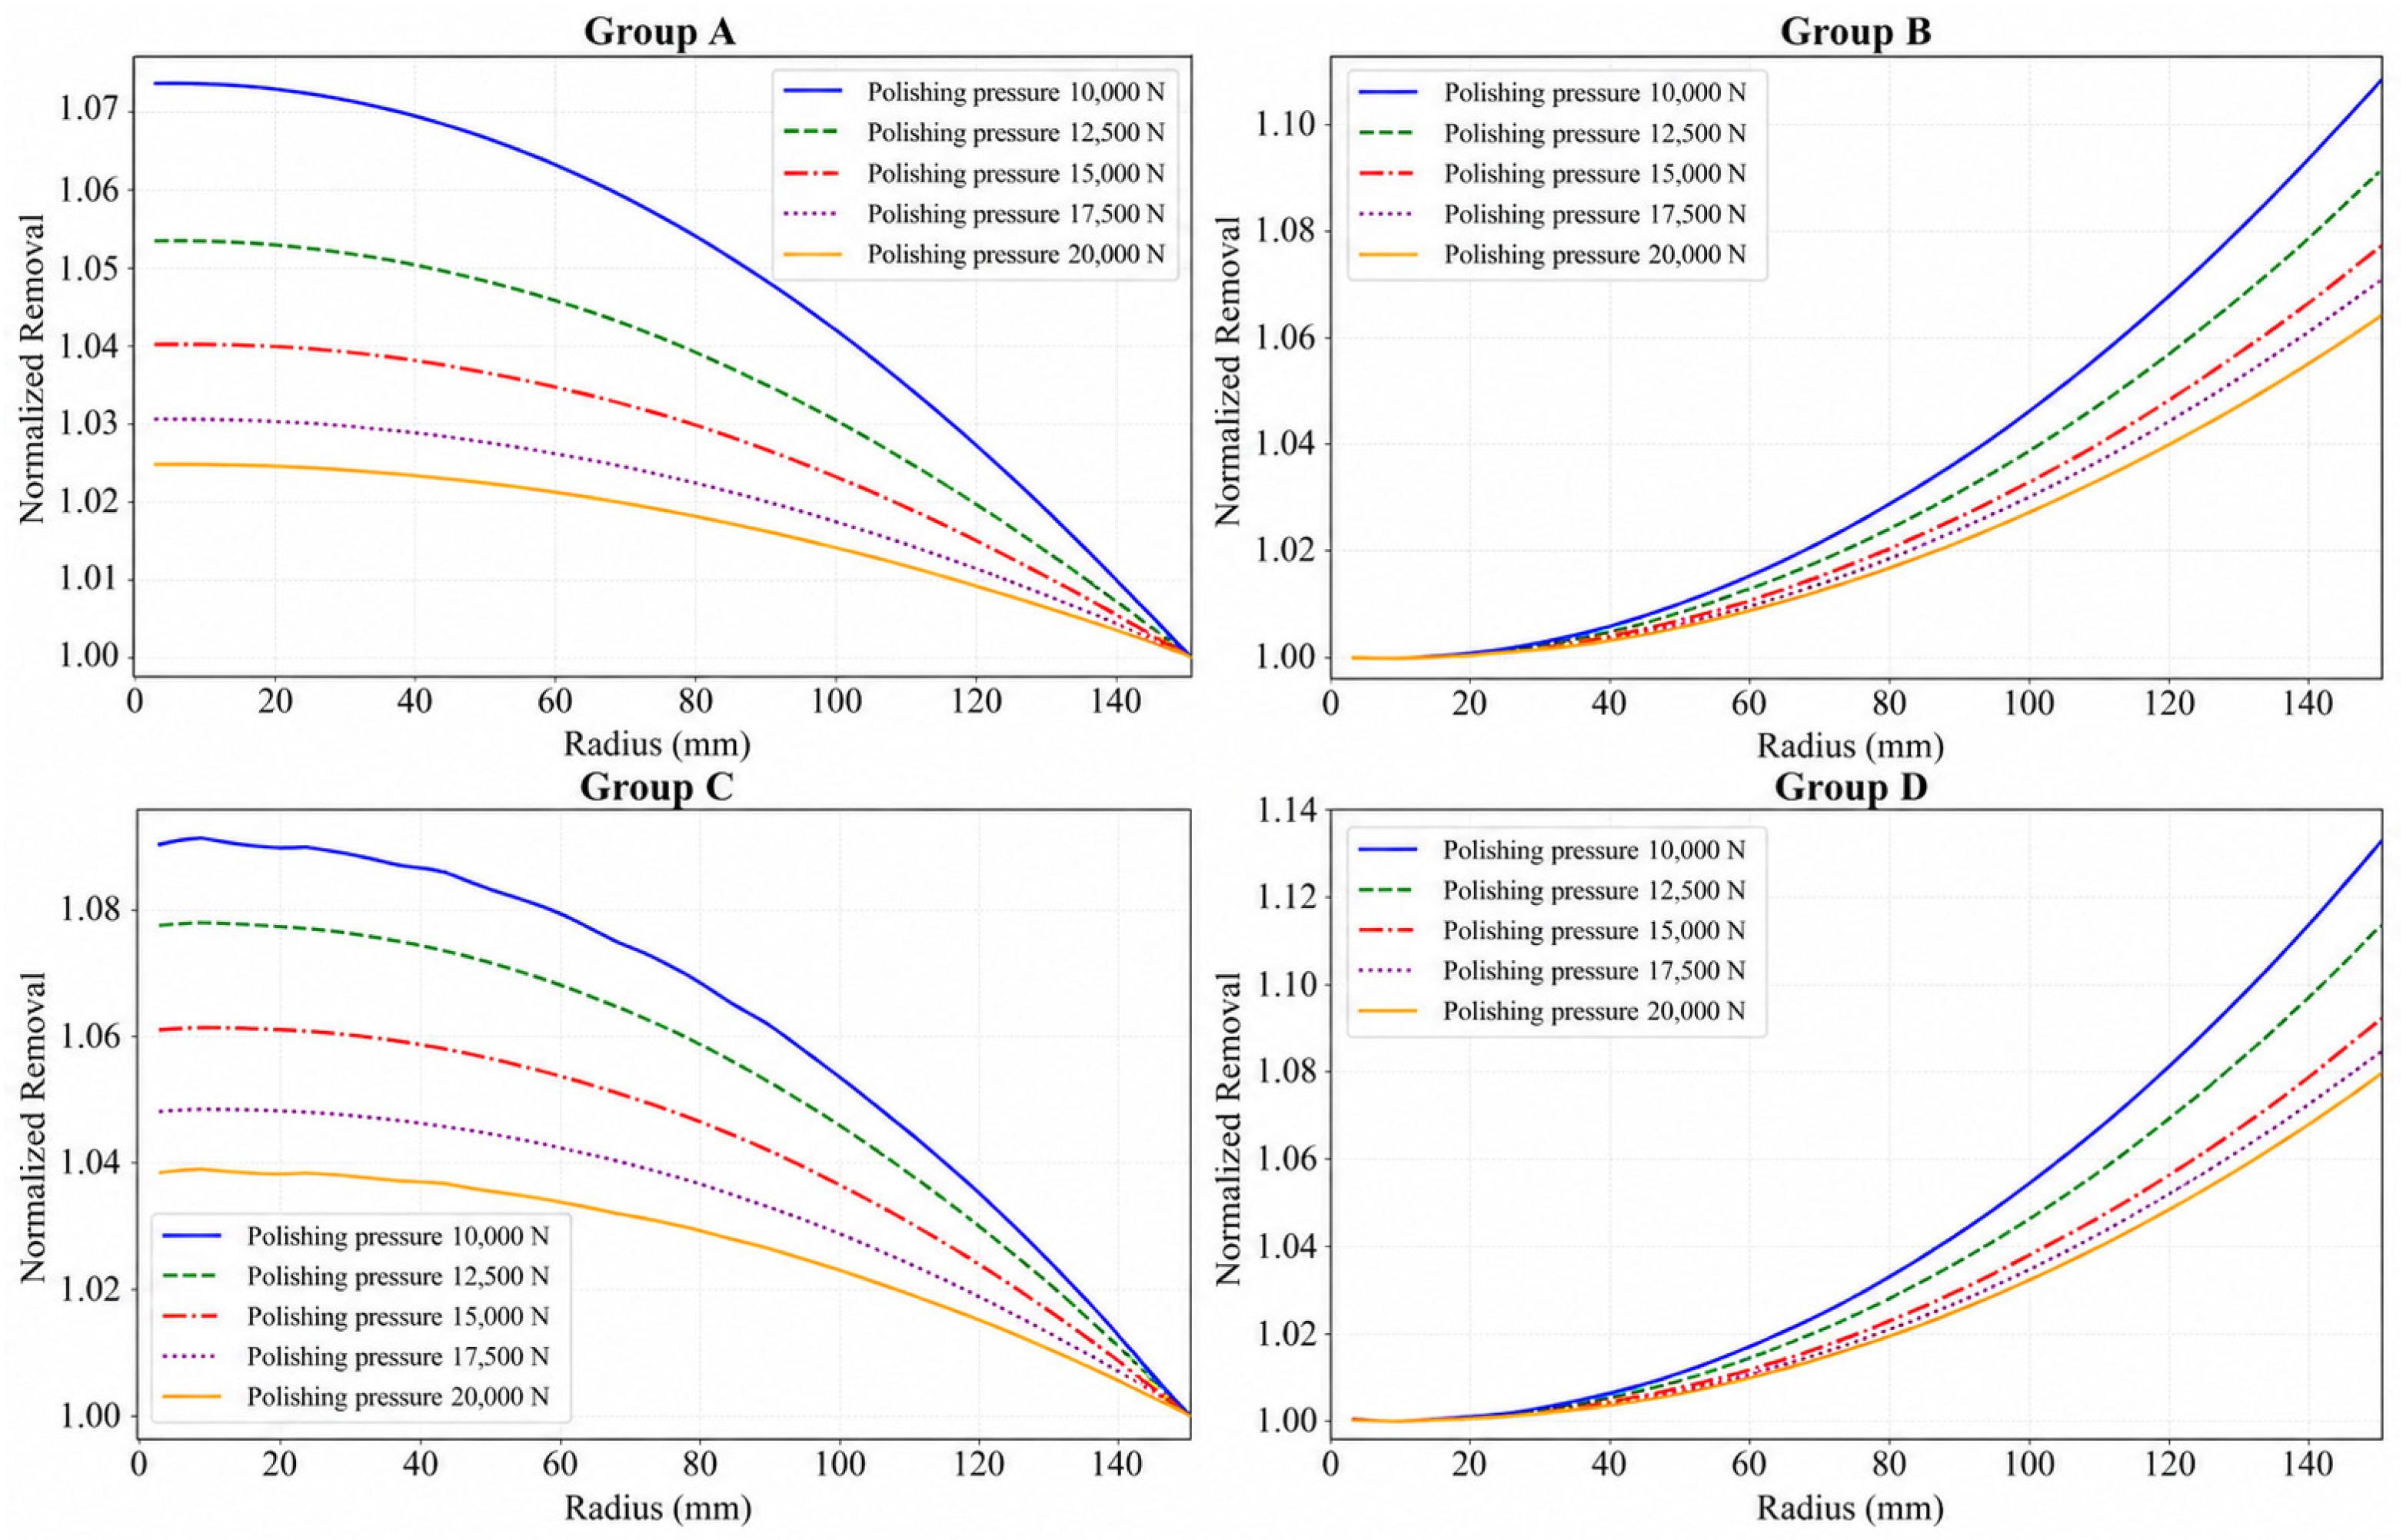
To further evaluate the influence of process parameters on the proposed pressure–trajectory coupling mechanism, a representative analysis under different polishing pressures was conducted, as shown in Figure 14. The results indicate that polishing pressure significantly affects the wafer–pad contact condition and consequently influences the uniformity of material removal distribution.
Figure 14.
Variation in WIWNU under different polishing pressures.
At relatively low pressures, insufficient local contact between the wafer and polishing pad leads to noticeable radial non-uniformity in material removal. As the polishing pressure increases, the contact state becomes more stable and uniform, thereby improving WIWNU. However, when the polishing pressure exceeds a certain range, the improvement in removal uniformity gradually saturates. This behavior suggests that once sufficient wafer–pad contact has been established, further pressure increase contributes limited additional improvement to the overall removal uniformity.
These observations are physically consistent with the pressure–trajectory coupling mechanism proposed in the present work and indicate that the model maintains reasonable predictive behavior under moderate process parameter variations.
4. Conclusions
Based on the “pressure–trajectory coupling” mechanism, this study systematically investigates the center-to-edge thickness variation in wafers caused by non-uniform material removal during DSP. Through a combination of theoretical modeling, simulation analysis, and experimental validation reported in the literature, it achieves the modulation of the material removal rate distribution by tailoring the polishing pad topography, thereby providing pad and conditioning design insights for optimizing polishing flatness.
First, by establishing a global coordinate system along with body-attached local coordinate systems for the pad, carrier, and wafer, the trajectory formulas for any point on the wafer surface within the pad coordinate system are derived. This model provides the theoretical foundation for subsequent material removal calculations. Second, a stress-field finite analysis model for the wafer–pad system is developed based on linear elastic small-deformation theory. By discretizing the transient process into a series of steady-state positions, a DSP characteristic pressure field is efficiently obtained. Subsequently, by coupling the dynamic pressure on the wafer surface with the time integral of the relative velocity, a model for the material removal amount on the wafer surface is established. The reliability of the model is validated by experiments.
Based on the model established above, the regulation mechanism of pad topography on wafer removal uniformity is elucidated. Simulation and experimental analysis of five distinct types of pad topographies reveals that distribution of material removal across the wafer surface can be effectively controlled by designing pads with irregular topographies. Pressure generated by pads with “inner-thick–outside-thin” and “center-thick–edge-thin” topographies can compensate for trajectory-induced non-uniformity through pressure adjustment, whereas pads with “inner-thin–outside-thick” and “center-thin–edge-thick” topographies tend to exacerbate non-uniform removal.
This research provides a theoretical foundation and technical support for precise control of wafer morphology under various irregular pad topographies during DSP. By overcoming the limitations of traditional models regarding pad topology constraints, the proposed method extends the existing model’s applicability, and helps to improve wafer flatness quality in advanced integrated circuit manufacturing.
Author Contributions
Conceptualization, Y.L.; methodology, Y.L. and B.L.; software, Y.L. and J.C.; validation, S.L.; formal analysis, Y.L. and S.L.; investigation, S.L.; resources, W.Y., L.Z. and B.L.; data curation, S.L.; writing—original draft preparation, Y.L. and S.L.; writing—review and editing, Y.L. and S.L.; visualization, Y.L. and S.L.; supervision, B.L.; project administration, W.Y.; funding acquisition, W.Y., L.Z. and B.L. All authors have read and agreed to the published version of the manuscript.
Funding
This research is funded by Shanghai Science and Technology Program grant number 25JC1400902 and NICE Research Fellowship Program grant number 25XY001.
Institutional Review Board Statement
Not applicable.
Informed Consent Statement
Not applicable.
Data Availability Statement
The data presented in this study are available within the article.
Acknowledgments
The authors would like to acknowledge the support of David Wei Zhang from the School of Microelectronics, Fudan University.
Conflicts of Interest
Authors Yiran Liu, Wenjie Yu, Lei Zhu and Bing Liu were employed by the company Shanghai Institute of IC Materials. The remaining authors declare that the research was conducted in the absence of any commercial or financial relationships that could be construed as a potential conflict of interest.
References
- Luo, J.; Guo, D.; Yang, H.; Ye, X.; Qian, L.; Ju, B.; Jiang, L.; Shao, J.; Zhang, Z.; Chen, L.; et al. Key basic scientific issues in atomic level manufacturing. Bull. Natl. Nat. Sci. Found. China 2024, 38, 86–98. [Google Scholar]
- Chang, P.; Huang, Z.; Chen, Y.; Ling, H.; Wu, Y.; Li, M.; Shacham-Diamand, Y.; Hang, T. Rational utilization of the size and electronic effect of inhibitors enabling high polishing rate with minimum corrosion in copper chemical mechanical polishing. Appl. Surf. Sci. 2024, 674, 160919. [Google Scholar] [CrossRef] [Scilit]
- Carpio, R.; Jaworski, A. Review—Management of Copper Damascene Plating. J. Electrochem. Soc. 2019, 166, D3072–D3096. [Google Scholar] [CrossRef] [Scilit]
- Wang, Z.; Wang, Y.; He, H.; Chen, F.; Shi, J.; Peng, Y.; Zhang, T.; Zhu, R. Nanosecond laser irradiation assisted chemical mechanical polishing (CMP) process for promoting material removal of single crystal 4H–SiC. Ceram. Int. 2024, 50, 34702–34709. [Google Scholar] [CrossRef] [Scilit]
- Chen, Y.; Xia, Y.; Wang, C.; Pan, J.; Wang, T.; Chen, A. Nanocasting synthesis of mesoporous CeO2 particle abrasives from mesoporous SiO2 hard templates for enhanced chemical mechanical polishing performance. Ceram. Int. 2024, 15, 53818–53834. [Google Scholar] [CrossRef] [Scilit]
- Wang, Z.; Liu, P.; Lee, S.; Lee, J.; Lee, H.; Kim, H.; Oh, S.; Kim, T. Investigation of the removal mechanism in amorphous carbon chemical mechanical polishing for achieving an atomic-scale roughness. Appl. Surf. Sci. 2024, 671, 160721. [Google Scholar] [CrossRef] [Scilit]
- Wenski, G.; Altmann, T.; Winkler, W.; Heier, G.; Hölker, G. Doubleside polishing—A technology mandatory for 300mm wafer manufacturing. Mater. Sci. Semicond. Process. 2002, 5, 375–380. [Google Scholar] [CrossRef] [Scilit]
- Suratwala, T.; Steele, R.; Feit, M.; Dylla-Spears, R.; Desjardin, R.; Mason, D.; Wong, L.; Geraghty, P.; Miller, P.; Shen, N. Convergent polishing: A simple, rapid, full aperture polishing process of high quality optical flats & spheres. J. Vis. Exp. JoVE 2014, 94, 51965. [Google Scholar] [CrossRef] [Scilit]
- Suratwala, T.; Steele, R.; Feit, M.; Desjardin, R.; Mason, D. Convergent pad polishing of amorphous silica. Int. J. Appl. Glass Sci. 2012, 3, 14–28. [Google Scholar] [CrossRef] [Scilit]
- Stanley, W.; Tauber, R.N. Silicon Processing for the VLSI Era, Volume 1; Lattice Press: San Francisco, CA, USA, 1996; pp. 559–581. [Google Scholar]
- Zhang, J.; Jiang, Y.; Luo, H.; Yin, S. Prediction of Material Removal Rate in Chemical Mechanical Polishing via ResidualConvolutional Neural Network. Control Eng. Pract. 2021, 107, 104673. [Google Scholar] [CrossRef] [Scilit]
- Luo, Z.; Zhang, Z.; Zhao, F.; Fan, C.; Feng, J.; Zhou, H.; Meng, F.; Zhuang, X.; Wang, J. Advanced Polishing Methods forAtomic-Scale Surfaces: A Review. Mater. Today Sustain. 2024, 27, 100841. [Google Scholar] [CrossRef] [Scilit]
- Wang, L.J.; Hu, Z.W.; Fang, C.F.; Yu, Y.Q.; Xu, X.P. Study on the double-sided grinding of sapphire substrates with the trajectory method. Precis. Eng. 2018, 51, 308–318. [Google Scholar] [CrossRef] [Scilit]
- Zhao, D.; Lu, X. Chemical mechanical polishing: Theory and experiment. Friction 2013, 1, 306–326. [Google Scholar] [CrossRef] [Scilit]
- Evans, C.J.; Paul, E.; Dornfeld, D.; Lucca, D.A.; Byrne, G.; Tricard, M.; Klocke, F.; Dambon, O.; Mullany, B.A. Material removal mechanisms in lapping and polishing. CIRP Ann. 2003, 52, 611–633. [Google Scholar] [CrossRef] [Scilit]
- Vainer, L.; Gamolya, U. Analysis and modeling of workpieces’ kinematic in the process of two-sided face grinding. Mater. Today Proc. 2021, 38, 1794–1798. [Google Scholar] [CrossRef] [Scilit]
- Wang, Y.; Ku, L.; Suo, S.; Dang, Y.; Ge, Z.; Yan, Z.; Zhou, Q. Finite element analysis on von Mises stress distributions of Si DSP. Mater. Sci. Semicond. Process. 2013, 16, 165–170. [Google Scholar] [CrossRef] [Scilit]
- Chen, J.; Liu, Y.; Wang, D.; Yu, W.; Zhu, L. Numerical Analysis in Double-Sided Polishing: Mechanism Exploration of Edge Roll-Off. Materials 2024, 17, 4761. [Google Scholar] [CrossRef] [Scilit] [PubMed]
- Hashimoto, Y.; Ozaki, R.; Furumoto, T.; Hosokawa, A. A calculation method for workpiece profile variation during double-sided lapping by considering workpiece elastic deformation. Precis. Eng. 2022, 73, 457–469. [Google Scholar] [CrossRef] [Scilit]
- Yang, L.; Guo, X.; Kang, R.; Zhu, X.; Zhu, Z.; Jia, Y. Theoretical and experimental analysis for the surface shape evolution of ultrathin workpiece considering the pad surface shape in double-sided polishing. Mater. Sci. Semicond. Process. 2024, 169, 107917. [Google Scholar] [CrossRef] [Scilit]
- Satake, U.; Enomoto, T. Polishing pad design for uniform removal distributions in double-sided polishing. CIRP Ann.-Manuf. Technol. 2023, 72, 289–292. [Google Scholar] [CrossRef] [Scilit]
- Ren, Y.; Liu, Y.; Guan, Z.; Zhu, L.; Gao, Y.; Yu, W. Effects of process to material removal in CMP: Modelling and experiments. In Proceedings of the 2023 China Semiconductor Technology International Conference (CSTIC), Shanghai, China, 26–27 June 2023; pp. 1–4. [Google Scholar] [CrossRef] [Scilit]
- Chen, J.; Liu, Y.; Wang, X.; Cao, J.; Yu, W.; Zhu, L. Mechanistic Analysis of the Effect of Gap on Convex Curves of Wafer in Double-Sided Polishing. IEEE Trans. Semicond. Manuf. 2025, 38, 571–578. [Google Scholar] [CrossRef] [Scilit]
- Wei, T.; Liu, Y.; Li, M.; Zhu, L.; Yu, W.; Xue, Z.; Wei, X. Experimental and numerical analysis of wafer-to-wafer uniformity in double-sided polishing. Precis. Eng. 2023, 82, 383–391. [Google Scholar] [CrossRef] [Scilit]

Disclaimer/Publisher’s Note: The statements, opinions and data contained in all publications are solely those of the individual author(s) and contributor(s) and not of MDPI and/or the editor(s). MDPI and/or the editor(s) disclaim responsibility for any injury to people or property resulting from any ideas, methods, instructions or products referred to in the content. |
© 2026 by the authors. Licensee MDPI, Basel, Switzerland. This article is an open access article distributed under the terms and conditions of the Creative Commons Attribution (CC BY) license.