Article

Virtual Reality-Induced Changes in Lower-Limb Kinematics During Obstacle Crossing

1
Graduate School of Design, Kyushu University, Fukuoka 815-8540, Japan
2
Faculty of Design, Kyushu University, Fukuoka 815-8540, Japan
3
Faculty of Computer Science and Systems Engineering, Okayama Prefectural University, Okayama 719-1197, Japan
*
Author to whom correspondence should be addressed.
Appl. Sci. 2026, 16(11), 5670; https://doi.org/10.3390/app16115670
Submission received: 16 April 2026 / Revised: 27 May 2026 / Accepted: 28 May 2026 / Published: 4 June 2026
(This article belongs to the Special Issue Biomechanical Analysis for Sport Performance)

Abstract

Obstacle crossing is a fundamental, yet complex, motor task commonly observed in daily life and occupational settings. Nevertheless, accurately replicating real-world crossing strategies in a virtual reality environment (VRE) remains challenging, potentially limiting the broader application of virtual reality (VR) in these domains. In this context, this study compared individuals’ gait and lower-limb kinematics during their performance of obstacle crossing in a real environment (RE) and a VRE to determine whether the latter alters their crossing behavior. Participants completed obstacle-crossing tasks over three obstacles (low: 100 mm, middle: 200 mm, and high: 300 mm) in both environments. Our results indicated that the participants’ overall crossing speed was reduced in the VRE (low obstacle: −9.0 cm/s; middle obstacle: −6.0 cm/s; high obstacle: −2.0 cm/s). Specifically, we observed that in the VRE, the leading leg exhibited greater lower-limb flexion (low obstacle: +13.8°; middle obstacle: +11.1°; high obstacle: +8.2°), which resulted in a higher toe clearance (low obstacle: +76.4 mm; middle obstacle: +40.0 mm; high obstacle: +23.5 mm). In addition, the horizontal distance from the peak vertical position was extended (low obstacle: +93.1 mm; middle obstacle: +79.0 mm; high obstacle: +73.8 mm). For the trailing leg, a trend similar to that of the crossing leg was observed under the VRE low-obstacle condition; however, with increasing obstacle height, the VRE showed smaller lower-limb flexion (high obstacle: −12.7°) and toe clearance than the RE (middle obstacle: −68.2 mm; high obstacle: −115.2 mm). These findings provide insight into gait adaptation in virtual contexts and support the design of more effective VR-based interventions for rehabilitation and fall prevention.

1. Introduction

Obstacle crossing is a dynamic motor task commonly observed in daily life and various occupational settings. Situations such as pedestrians crossing curbs or workers navigating construction sites often involve obstacle-crossing behaviors. During such tasks, individuals must continuously perceive environmental changes and adjust their real-time gait strategies to safely and efficiently complete these movements [1,2]. Given its relevance to daily activities and functional challenges, obstacle crossing is widely used to assess and train motor control [3]. It is particularly valuable in rehabilitation, geriatric assessment, and sports performance research [4,5,6].
With the continuous advancement of virtual reality (VR) technology, the application of obstacle-crossing tasks in a virtual reality environment (VRE) has demonstrated multiple advantages, gradually surpassing the traditional usage of these tasks in real-world settings. VR offers a highly controllable and programmable platform compared to a real environment (RE). This allows for the flexible manipulation of key task parameters, such as obstacle height, number, location, and timing, facilitating the construction of obstacle-crossing tasks with clearly defined difficulty levels and diverse scenarios [7,8]. Moreover, VR provides a safe training setting, allowing users to engage in high-challenge tasks without the risk of actual falls, making it particularly suitable for older adults and individuals undergoing rehabilitation [7,9,10,11]. Further, obstacle-crossing tasks in VR can be integrated with game elements to enhance user immersion and engagement [12,13]. Therefore, VR optimizes the implementation of obstacle-crossing training and expands its interdisciplinary applications across movement science, rehabilitation, and interactive systems design.
Nevertheless, accurately reproducing real-world obstacle-crossing strategies in a VRE remains a considerable challenge. A key reason for this is the lack of actual physical consequences within the VRE. In other words, participants are fully aware that errors such as striking an obstacle or unstable foot placement during obstacle-crossing tasks will not result in actual falls, injuries, or other adverse physical outcomes. He et al. [11] compared visual-only VR obstacle crossing with VR obstacle crossing incorporating physical-feedback. They found that the group receiving physical-feedback exhibited significantly fewer collisions with obstacles. Therefore, the absence of realistic physical consequences may influence participants’ risk perception and behavioral strategies.
In addition, obstacle crossing is not a relatively simple cyclical movement like walking; rather, it is a dynamic process that strongly depends on perception–action coupling [14]. Successful obstacle crossing relies not only on motor execution capabilities but also on the integration of multiple sensory cues to enable precise movement planning and real-time adjustments [15]. Findings from previous studies indicate that current VR systems have limitations in terms of spatial resolution, depth perception, and field of view (FOV), which may impair the accuracy of users’ perception and the reliability of visual information [16,17,18]. Under such conditions, users are more likely to misjudge object positions and distances, leading to deviations in lower-limb movements, missteps, or even collisions. Such disruptions in perception–action coupling may degrade the overall user experience and constrain the effectiveness and potential for skill transfer of VR-based obstacle avoidance training in rehabilitation and movement interventions contexts [14].
Previous studies have made initial efforts to examine obstacle-crossing movements in VREs; however, their findings remain somewhat inconsistent. Derby et al. [19] reported that individuals exhibited similar gait kinematics during obstacle crossing in both VREs and REs. In contrast, Wang et al. [20] found that the VRE affected gait performance during obstacle crossing, as reflected by reduced approach velocity and step length, as well as increased toe clearance and foot placement. Overall, the existing evidence remains inconsistent and is insufficient to determine whether individuals adopt different crossing strategies in VREs.
Moreover, it remains unclear whether changes in obstacle height further affect obstacle-crossing movements in VREs. Increasing the height of obstacles typically imposes greater motor demands, requiring enhanced perceptual processing and motor control [20,21]. Notably, manipulating obstacle height may also magnify the influence of environmental contexts, such as crossing strategies used in REs versus in VREs. Therefore, systematically examining the effect of obstacle height within the VRE may deepen our understanding of motor-adaptation mechanisms and inform the design of more effective and transferable VR-based gait-training protocols. Accordingly, this study aimed to examine individuals’ gait and lower-limb kinematics during their performance of obstacle crossing in both an RE and a VRE. The study was guided by the following research questions:
(1)
Do individuals show altered crossing movements when performing obstacle-crossing tasks in a VRE compared with an RE?
(2)
How does obstacle height influence these differences?
We hypothesized that obstacle-crossing patterns would differ between the VRE and RE, and that the crossing pattern in the VRE might be more conservative. In addition, these environment-related differences were expected to become more pronounced as obstacle height increased.

2. Method

2.1. Participants

Healthy volunteers recruited from Kyushu University participated in the study. The inclusion criteria were as follows: (1) self-reported normal or corrected-to-normal vision, (2) a body height of between 155 and 185 cm, (3) no injury to the lower extremities in the past six months, and (4) right lower-limb dominance, defined as participants’ preference for using the right limb when they perform simulated dynamic tasks (e.g., kicking a ball).
The sample size of the present study was determined based on previous similar studies [19,22,23]. There were 14 participants (7 males: age = 26.57 ± 2.66 years, height = 175.24 ± 3.25 cm, lower-limb length = 91.31 ± 2.34 cm, weight = 70.84 ± 9.42 kg; 7 females: age = 25.8 ± 2.41 years, height = 165.42 ± 5.36 cm, lower-limb length = 82.42 ± 3.82 cm, weight = 57.25 ± 8.87 kg). All participants provided consent after being briefed on the study’s procedures. This study was approved by the Research Ethics Committee of Kyushu University (Approval no. 577).

2.2. Experimental Environment

2.2.1. Real Environment

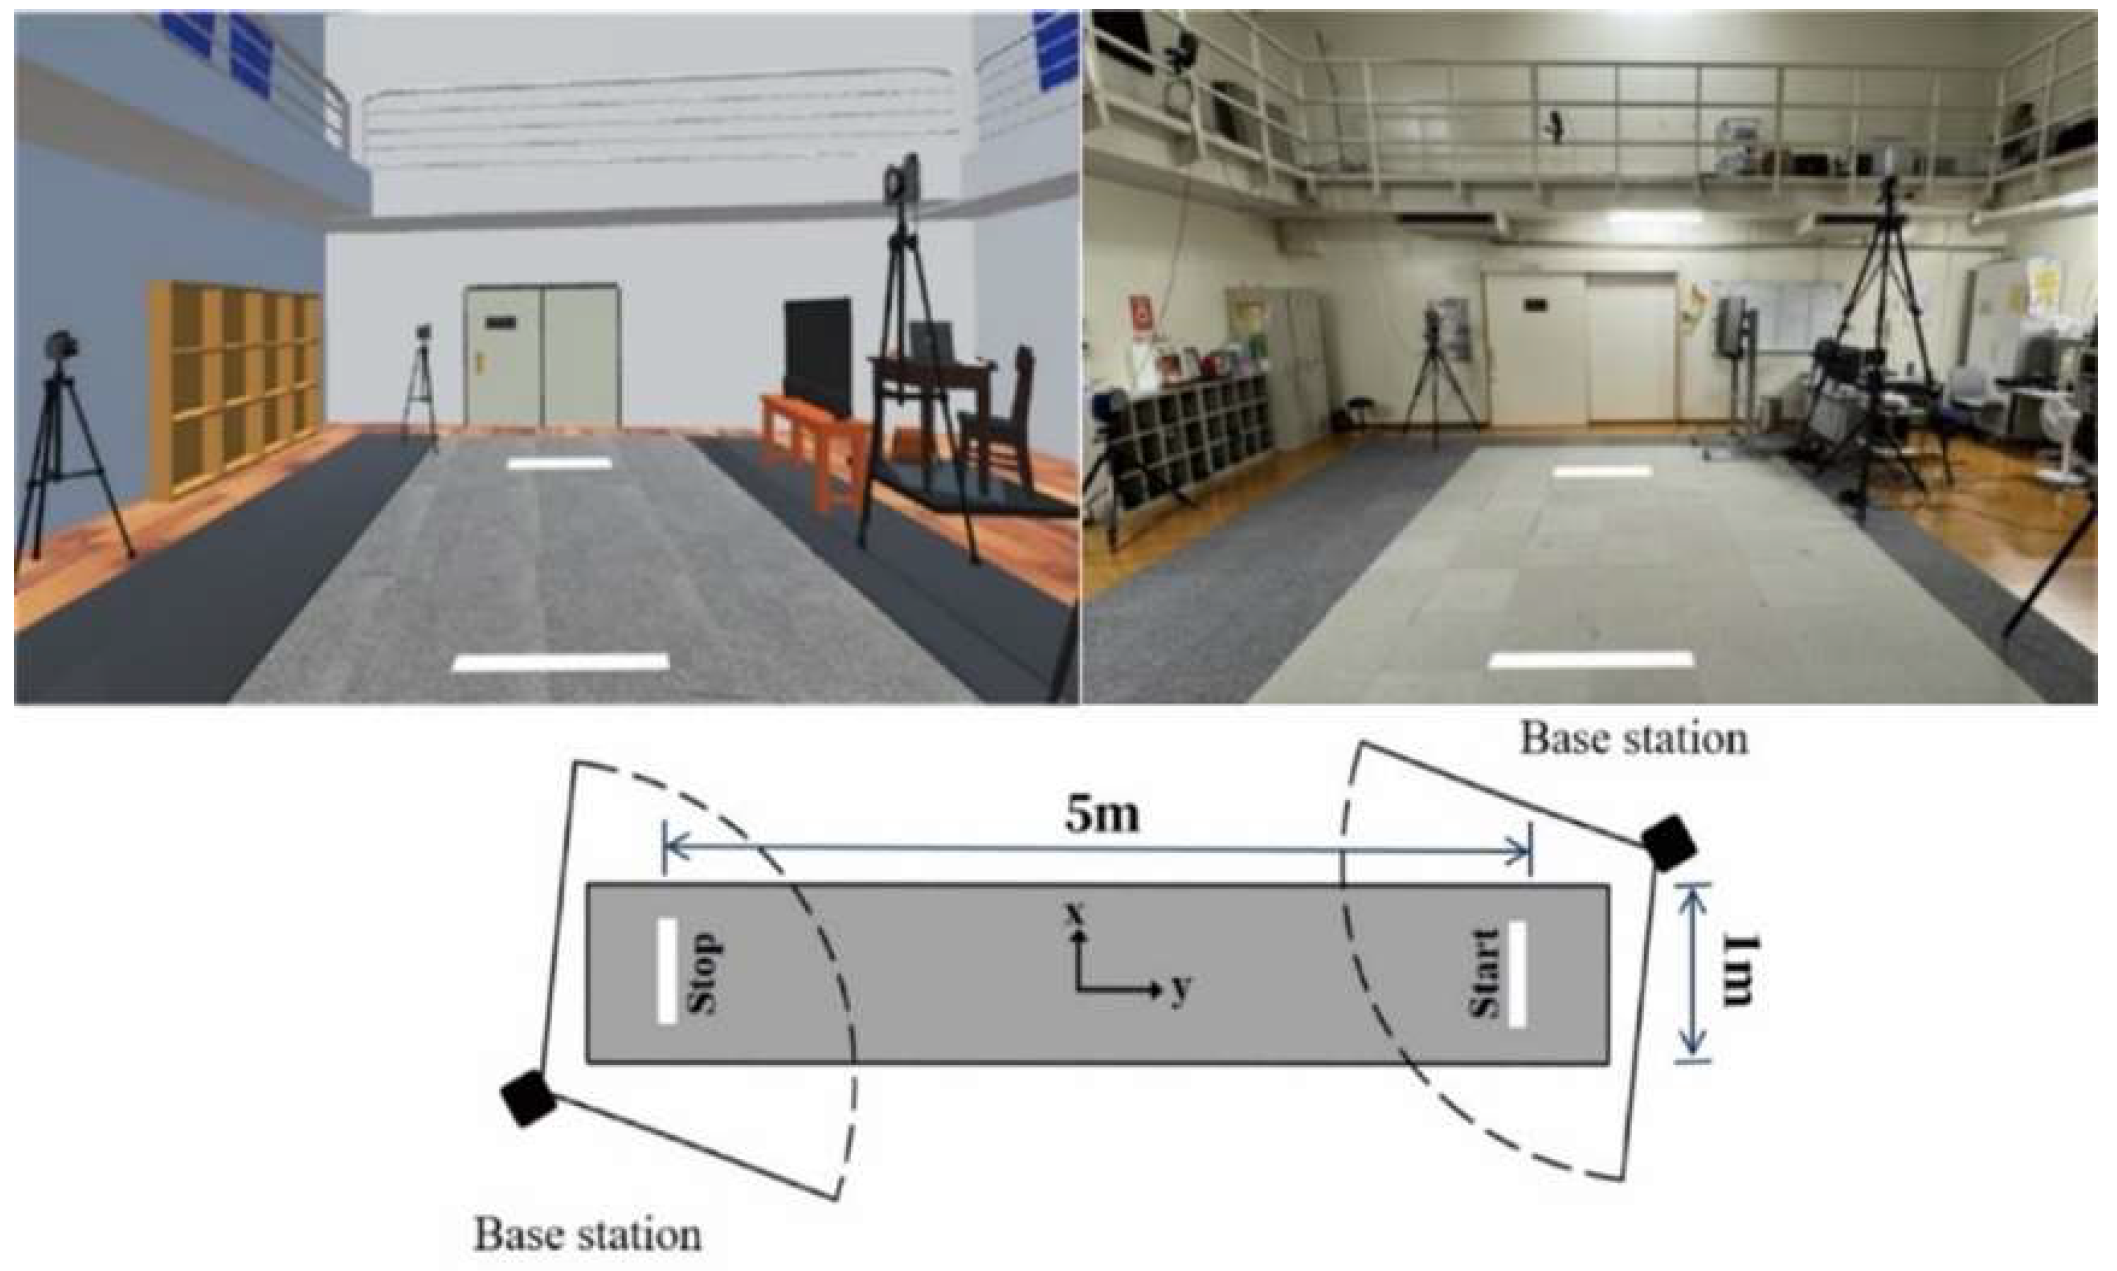
The RE used in this experiment was an indoor space with a floor area of approximately 160 m2. The environment was free from noise and lighting disturbances. A gray carpet was laid on the walking surface to support barefoot walking and obstacle-crossing tasks, effectively reducing the risk of slipping or falling during the crossing process. To ensure comparability of the participants’ walking behaviors in both the VRE and RE, identical start and end points were set with a distance of 5 m between them (Figure 1). This VRE design has been used in our previous study [24].

2.2.2. Virtual Reality Environment

The VRE was developed using Unity3D software (version 2021.3.6f1; Unity Technologies, San Francisco, CA, USA) on a computer equipped with an Intel i9-12900H processor (Intel Corporation, Santa Clara, CA, USA), 32 GB RAM, and an NVIDIA GeForce RTX 3070 graphics card (NVIDIA Corporation, Santa Clara, CA, USA). The RE layout was faithfully replicated on a 1:1 scale. The participants experienced the VRE through a head-mounted display (HTC Corporation, Taoyuan City, Taiwan), which featured a refresh rate of 90 Hz and a FOV of 110°. Spatial tracking of the VR system was achieved using two HTC base stations fixed on opposite sides of the physical space, approximately 1 m apart and covering an area of approximately 5 m2 (Figure 1). To enable virtual body representation, VIVE Tracker 3.0 devices (HTC Corporation, Taoyuan City, Taiwan) were attached to the participants’ waist and ankles, allowing them to observe their lower-limb movements in real time within the VRE.

2.3. Obstacle Setup

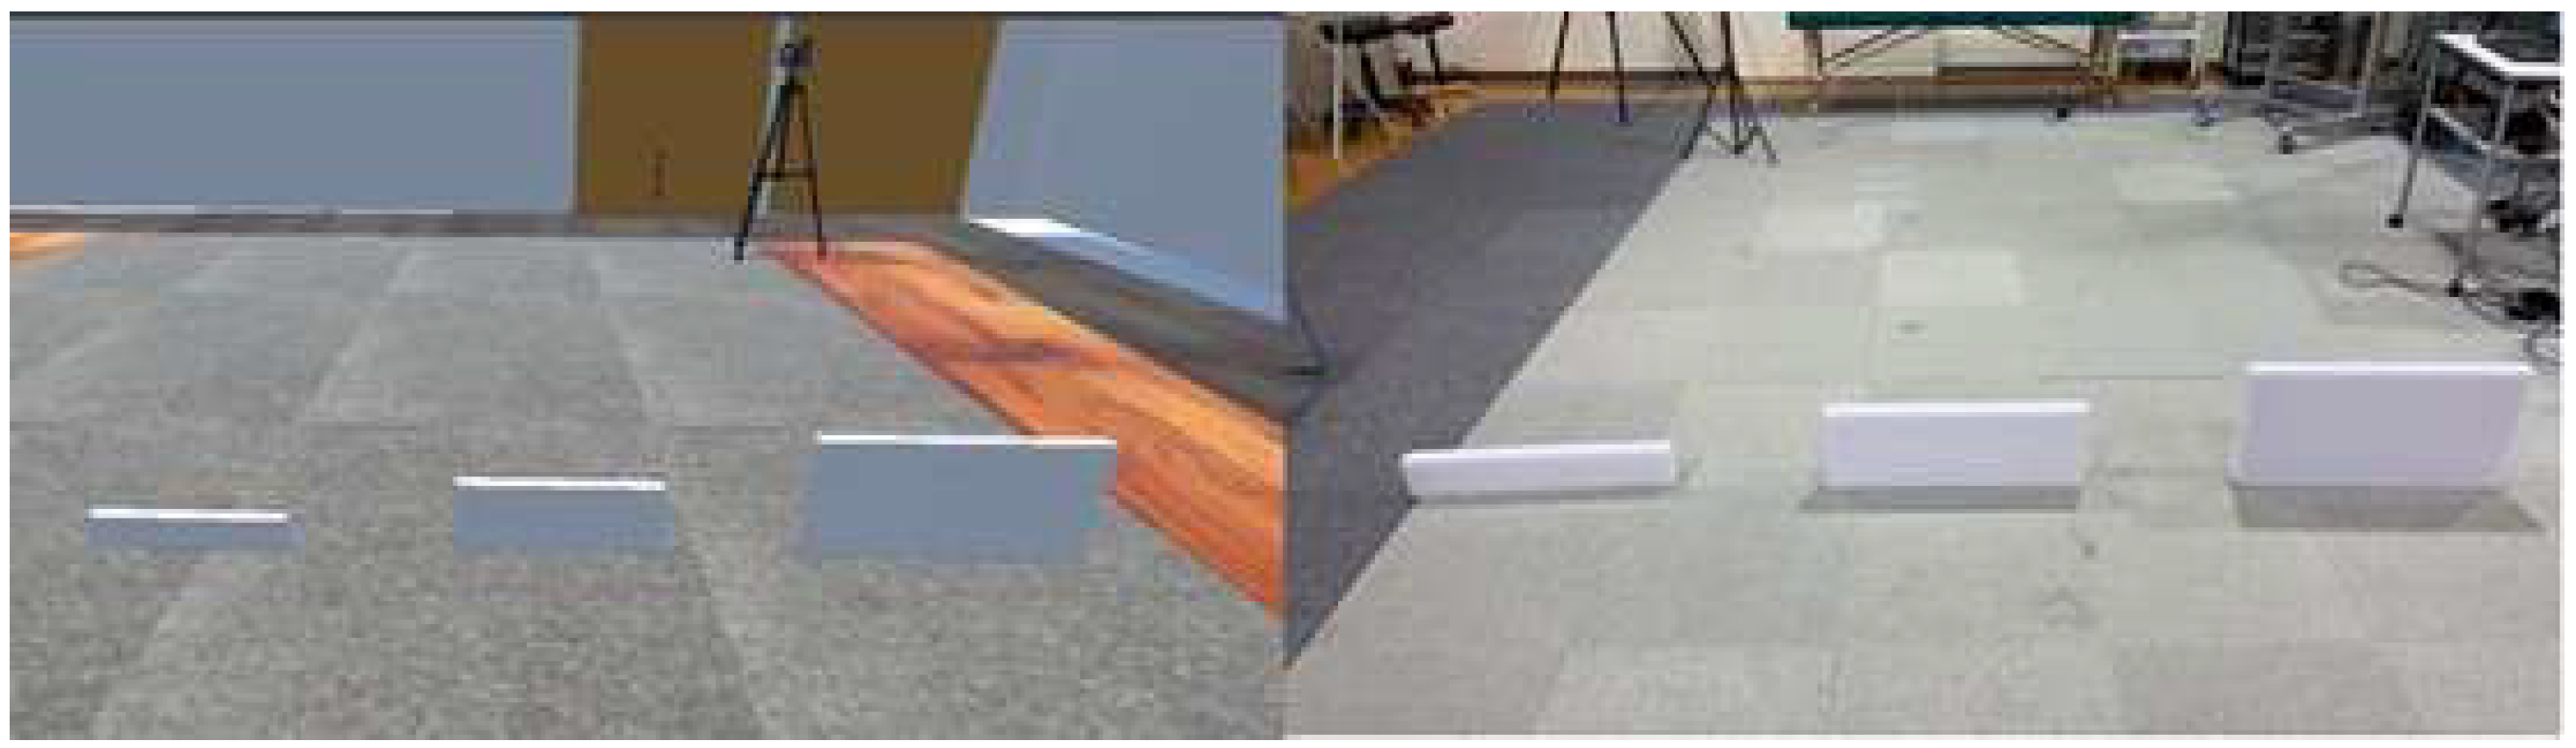
In the RE, three white obstacles made of polyurethane foam were used, differing in height but identical in shape (depth = 50 mm, width = 500 mm, and heights = 100, 200, and 300 mm). These dimensions are commonly used in gait-related obstacle research [25] because they effectively induce varying degrees of gait adaptation while avoiding excessive physical burdens or safety risks for participants. To prevent falls in case of contact, the obstacles were not fixed to the ground under the RE condition. Corresponding virtual obstacles with the same dimensions and colors were constructed in the VRE. Before the formal experiment, each participant confirmed that the virtual obstacles visually matched their physical counterparts. The spatial placements of these virtual obstacles were precisely aligned with the coordinates of the real-world obstacles to ensure environmental consistency. Figure 2 shows the obstacles in both environments.

2.4. Experimental Conditions and Protocol

2.4.1. Conditions

During the formal experiment, one of the three obstacle heights was placed along either the real or virtual walking path, and the participants were instructed to cross the obstacle in both environments. Each participant performed the obstacle-crossing tasks under six experimental conditions (2 environments × 3 obstacle heights). Three trials were repeated for each condition, resulting in 18 trials per participant.

2.4.2. Protocol

All the participants wore tight-fitting suits with reflective markers attached at designated anatomical locations. They were instructed to use handheld controllers and wear ankle trackers in all conditions. The HMD was installed only during the VRE condition. As the HMD used in this study was wired, the cable was taped to the participants’ backs with sufficient excess length to ensure that it did not restrict their walking movements.
Prior to the formal experiment, it was necessary to confirm whether the participants were wearing the HMD correctly. The following procedure was used to ensure proper HMD installation. First, the comfort of the HMD was evaluated to verify that it was correctly placed. Subsequently, the participants verified their virtual body alignment in the VRE. Finally, they compared the VRE with the RE to assess consistency in perceived spatial dimensions. If no significant differences were observed, the HMD was considered properly fitted. The participants were then allowed to practice and determine their starting positions, which were set approximately two to three steps away from the obstacle, to ensure that they could follow the instructions and complete the tasks safely and consistently.
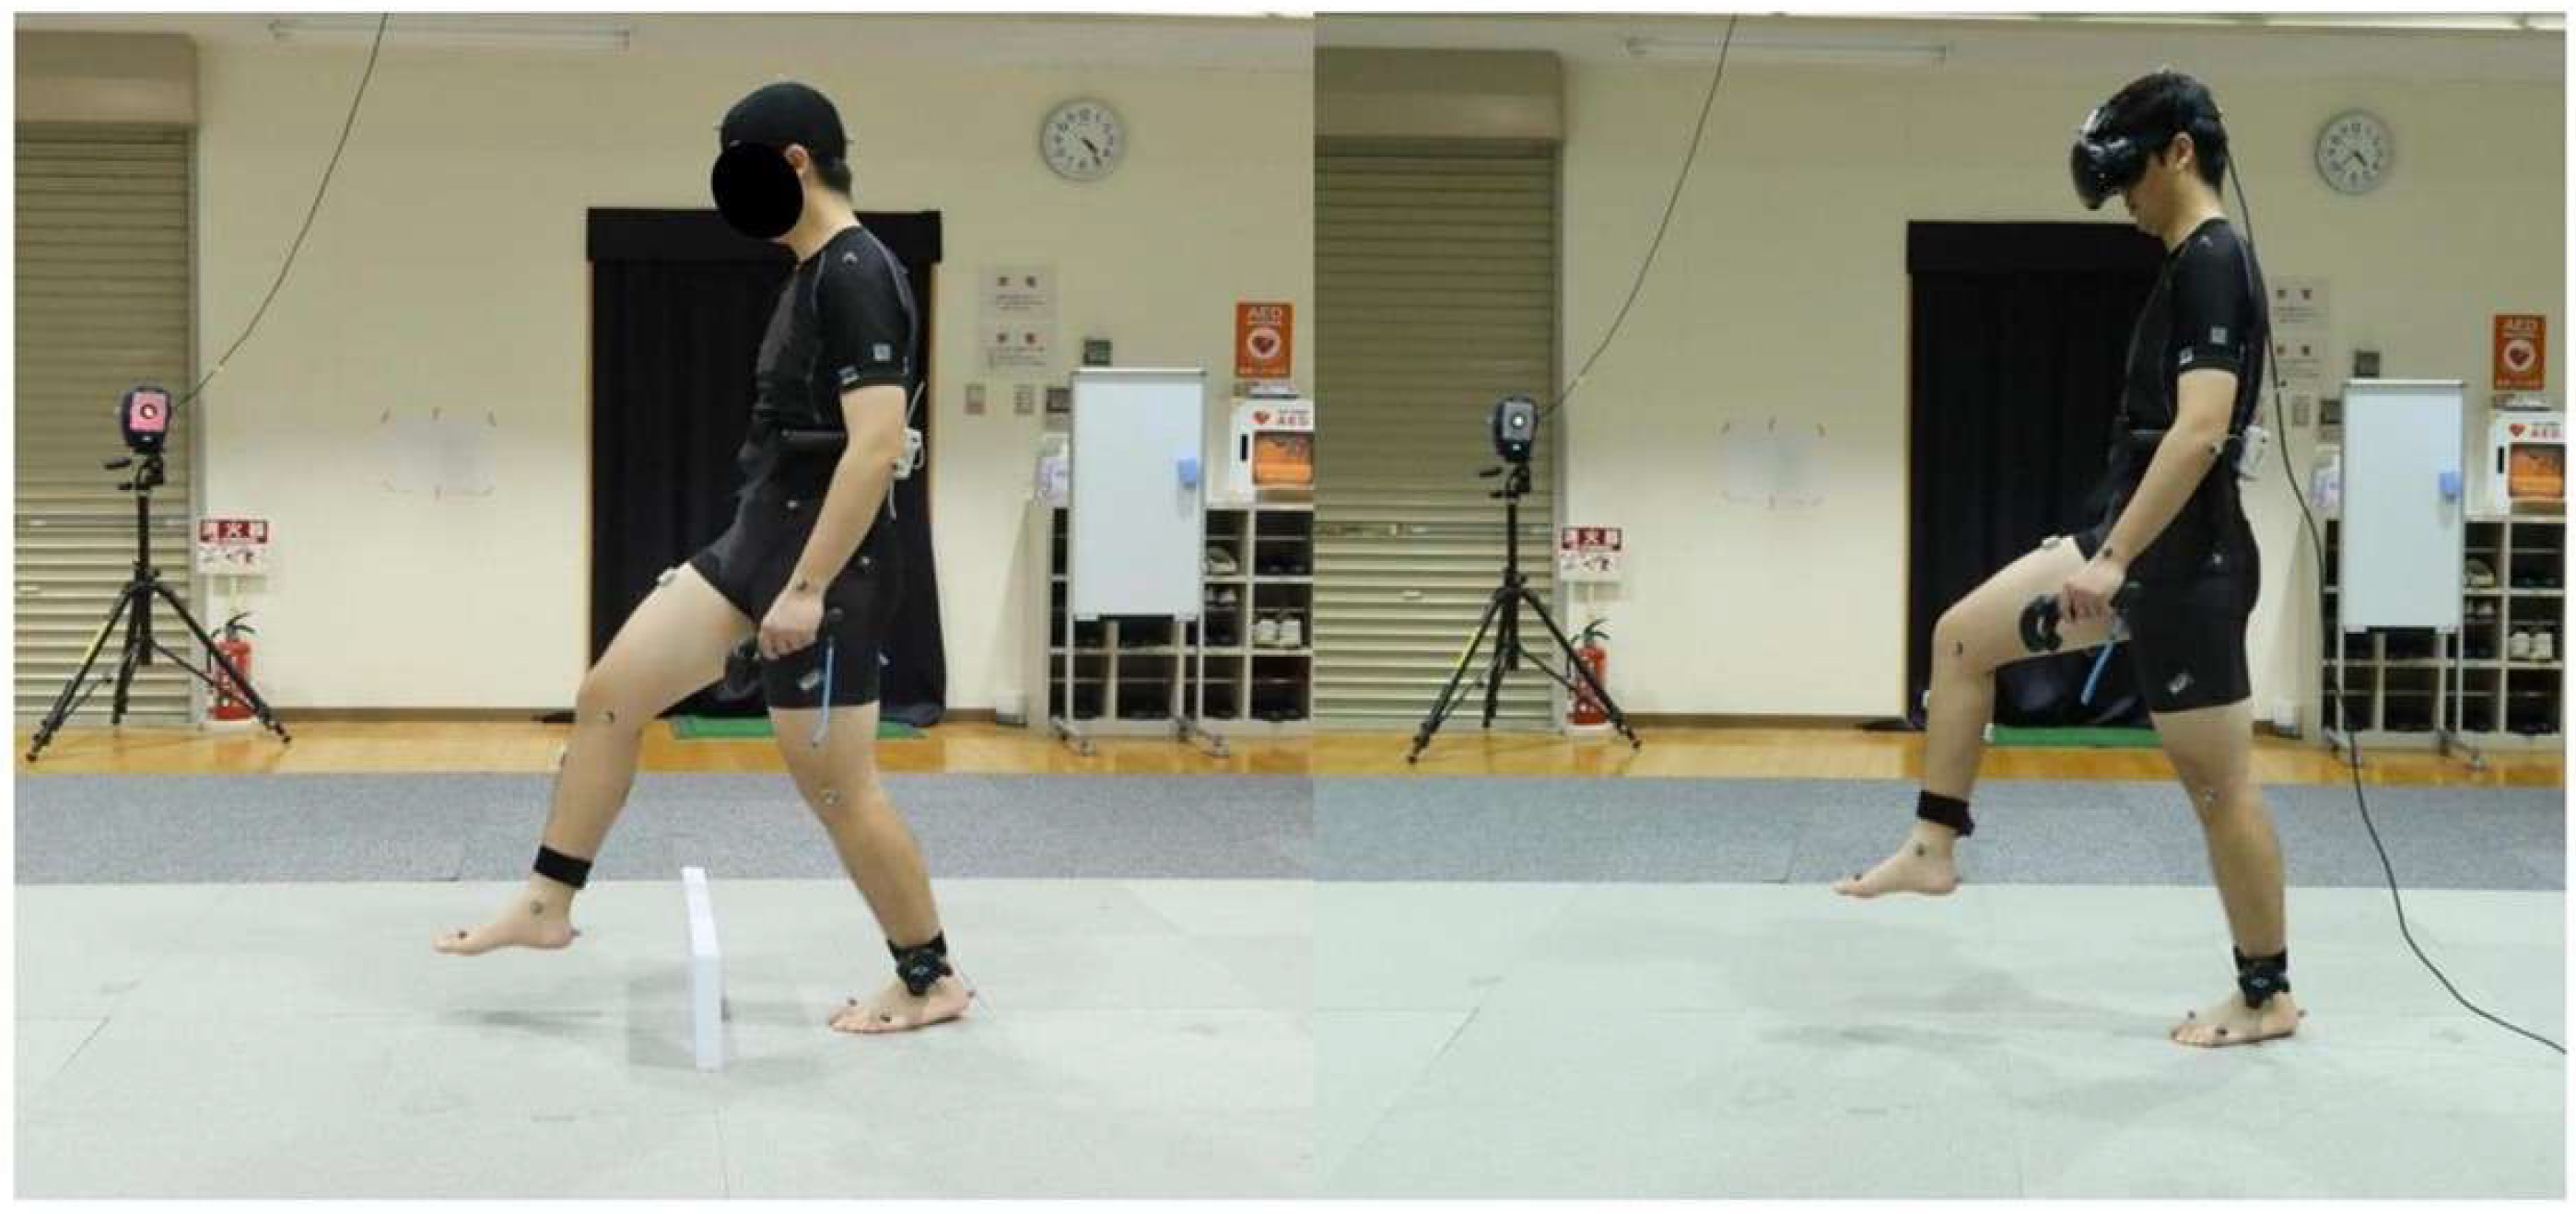
During the experiment, the participants walked at a natural pace and were instructed to maintain their natural walking speed across all conditions. In both the RE and VRE, the participants were required to initiate obstacle crossing with their right limb, thereby designating the right limb as the leading limb. Figure 3 illustrates how the participants crossed obstacles in both the VRE and RE. Trials were considered unsuccessful if the left limb (trailing limb) was observed to initiate the crossing or if any part of the foot came into contact with the obstacle. The order of obstacle-height conditions was randomized for each participant to minimize potential learning and order effects. A one-minute rest was given between trials, and a ten-minute rest was provided when the participants switched from the RE to VRE.

2.5. Measurements

Infrared reflective markers were placed on 29 anatomical locations on each participant: the head (fore, top, back), upper limbs (acromion of shoulders, medial epicondyle of elbows, ulnar styloid process of wrists, and right scapula outer edge), pelvic regions (anterosuperior iliac spines and sacrum), and lower limbs (greater trochanters, lateral and medial epicondyle of femurs, lateral and medial malleolus, calcaneus of the ankles, and first and fifth metatarsophalangeal (MTP) joints). The motion was captured using nine infrared cameras from a Cortex 3D Motion Analysis System (Motion Analysis Corporation, Santa Rosa, CA, USA). Kinematic data were sampled at 100 Hz and filtered using a 6 Hz Butterworth low-pass filter. The 6 Hz cutoff frequency was considered unlikely to substantially affect the accuracy of kinematic peak measurements because the relevant events and variables in the present study were primarily derived from marker trajectories and joint-angle changes, and the obstacle-crossing task did not involve high-speed limb movements such as running.
Spatiotemporal gait characteristics, including crossing length, step width, and walking speed under all gait conditions were analyzed using the KineAnalyzer software (Version 3.8.4.1403; Kissei Comtec, Nagano, Japan). Crossing length (mm) was defined as the distance between the toe-off of the right limb and heel contact of the left limb. Step width (mm) was defined as the lateral distance between the midlines of the heels during two consecutive steps in a bipedal stance. Crossing speed (m/s) was calculated as the total crossing distance divided by the total crossing time.
Further, to examine variations in the joint angle during obstacle crossing, an eight-segment geometric model was created in KineAnalyzer (Version 3.8.4.1403; Kissei Comtec, Nagano, Japan) to generate the gait kinematic curves. The Cardan sequence order of rotations (XYZ) was adopted, with the x-axis corresponding to the mediolateral direction, the y-axis to the anterior–posterior direction, and the z-axis to the axial direction. The hip angle was determined by the pelvis and femur, the knee angle was determined by the thigh and shank, and the ankle angle was determined by the foot and shank.
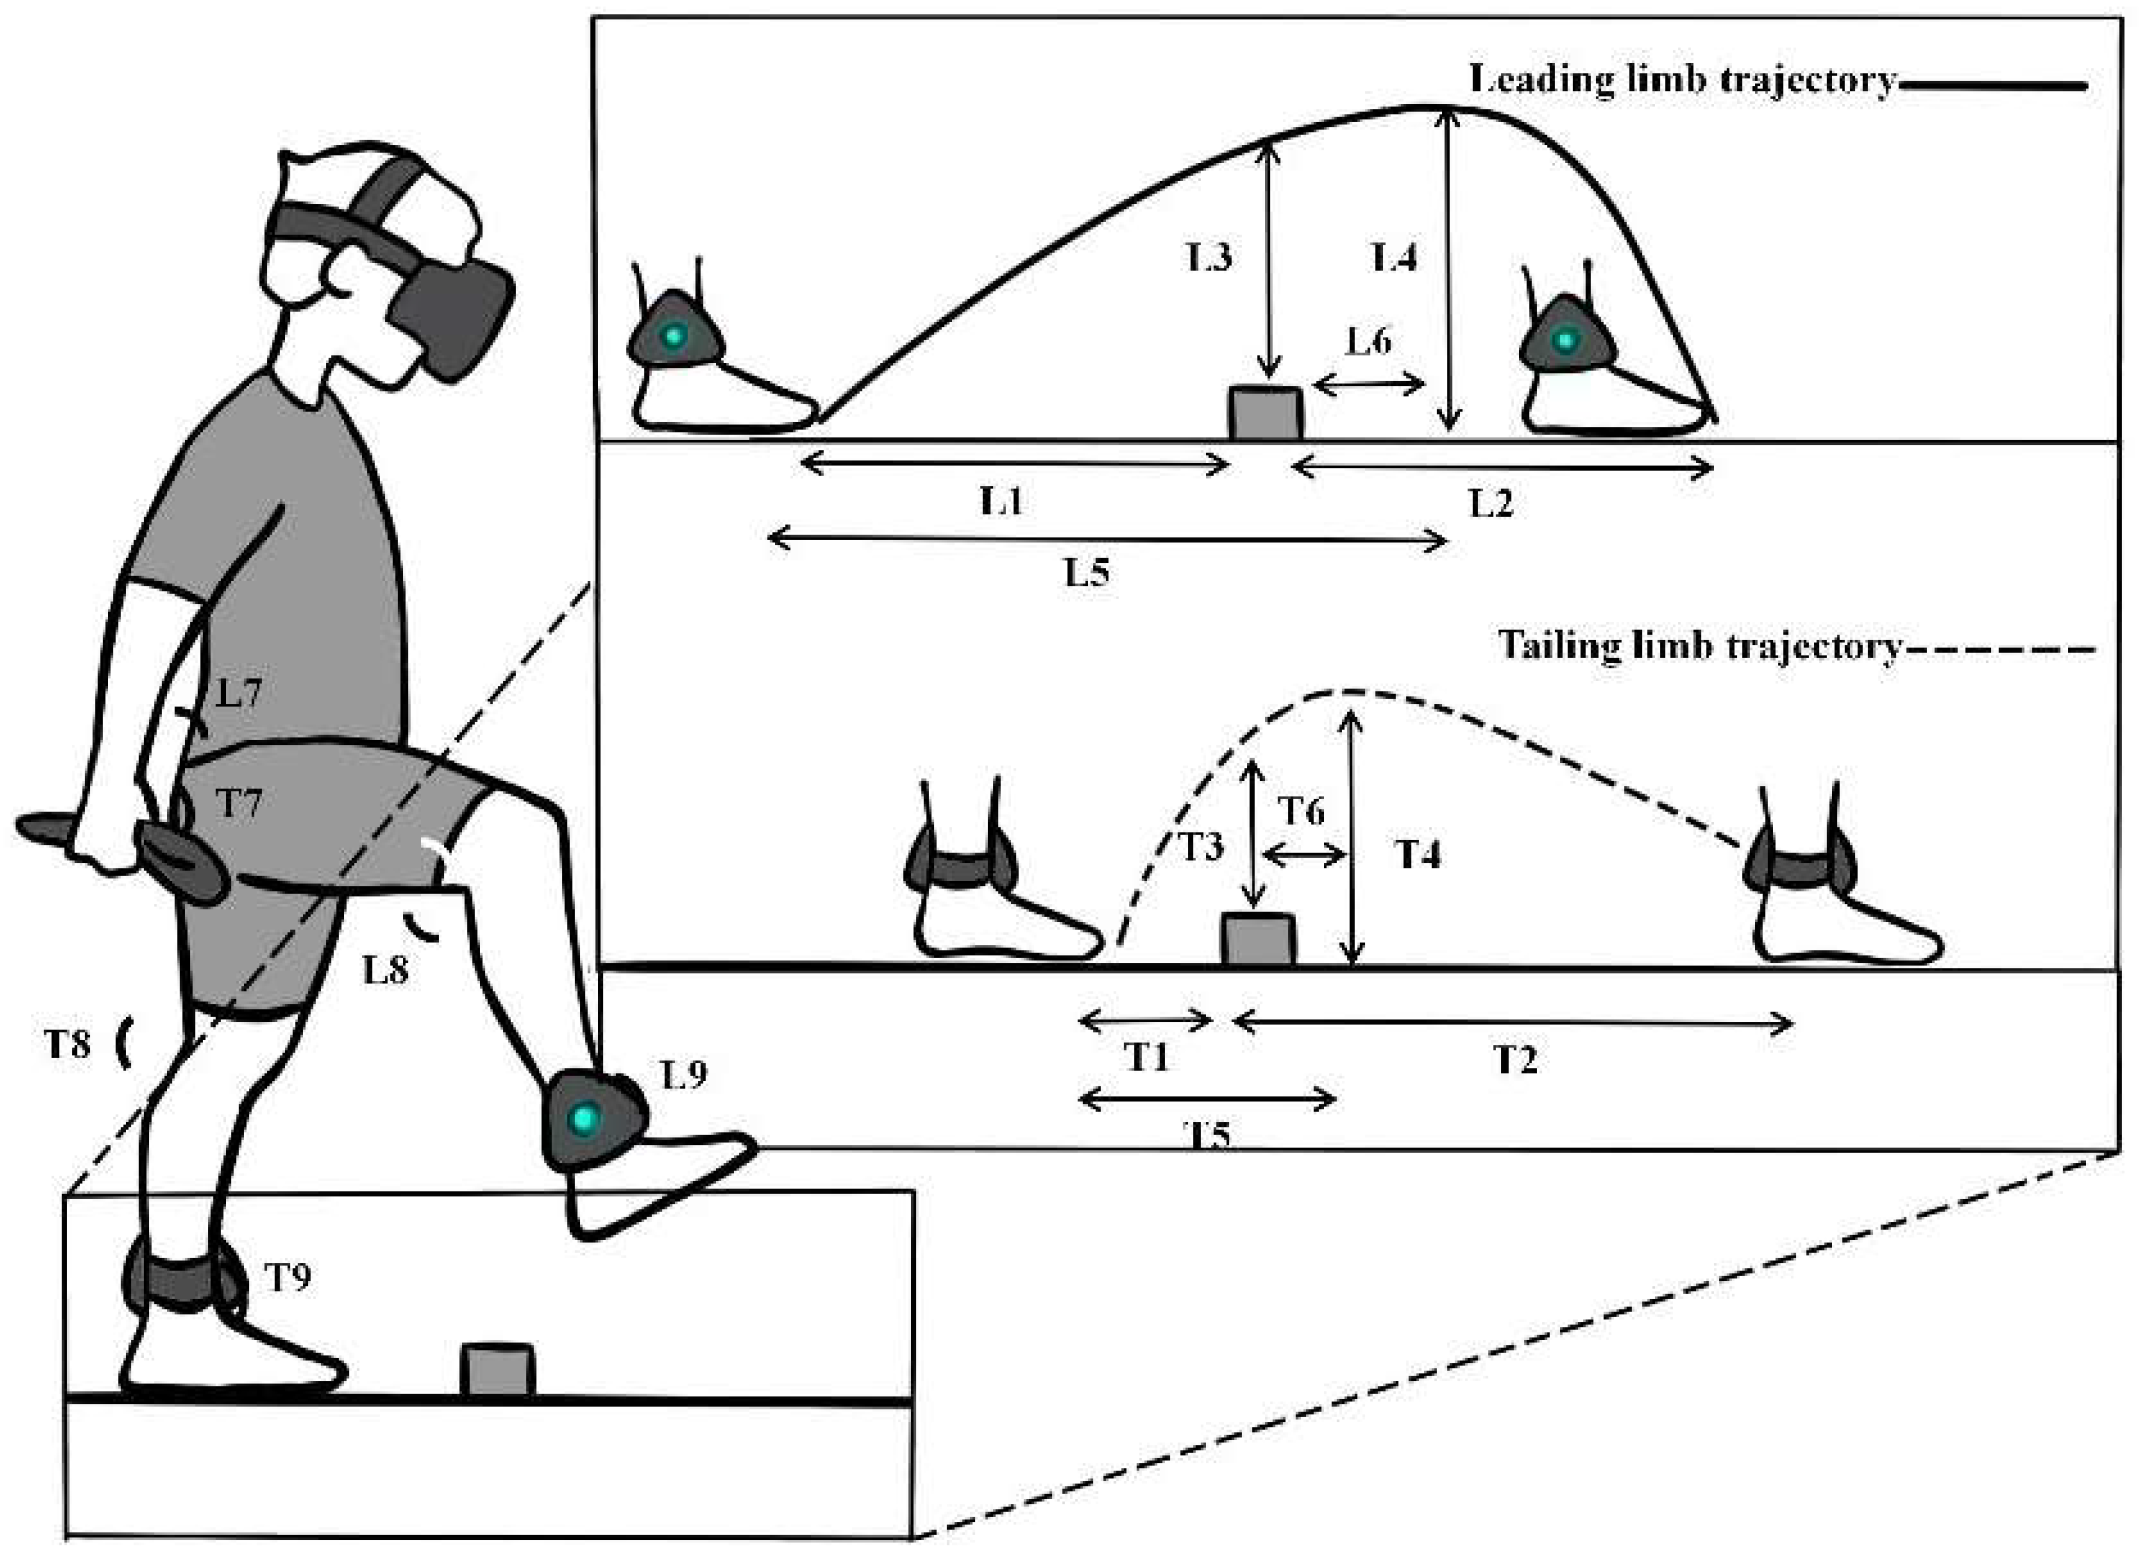
The dependent variables used to evaluate obstacle-crossing performance included prestep distance, poststep distance, toe clearance (TC), peak vertical distance (PVD), peak horizontal distance (PHD), and horizontal distance between the obstacle and the point of peak vertical distance (HDOV), calculated for both the leading and trailing limbs. Prestep distance was defined as the horizontal distance between the obstacle and the first MTP marker at toe-off. Poststep distance was defined as the horizontal distance between the obstacle and the first MTP marker at toe landing after obstacle crossing. TC was calculated as the vertical distance between the top of the obstacle and the first MTP marker when the toe was directly above the obstacle. PVD was defined as the highest vertical displacement of the first MTP marker from the ground. PHD was defined as the horizontal distance traveled by the first MTP marker from the moment the toe left the ground to the instant it reached its PVD. HDOV was defined as the horizontal distance between the obstacle and the first MTP marker at the instant the marker reached its PVD. Figure 4 summarizes the key indicators.

2.6. Statistical Analysis

Statistical analyses were conducted using SPSS software (version 28.0; SPSS Inc., Chicago, IL, USA). Repeated-measures analysis of variance (ANOVA) was performed to examine the main and interaction effects of obstacle height (low, medium, and high) and environment (RE and VRE) on the studied variables. Prior to the ANOVA, normality of the data was assessed using the Shapiro–Wilk test. Geisser’s epsilon adjustment was applied when Mauchley’s test indicated a violation of the sphericity assumption. In case of any significant interaction, a Bonferroni post hoc test was performed. For ANOVA, partial eta squared (η2p) was reported as the effect size measure. Statistical significance was set at p < 0.05. Descriptive statistics are reported as mean ± standard deviation.

3. Results

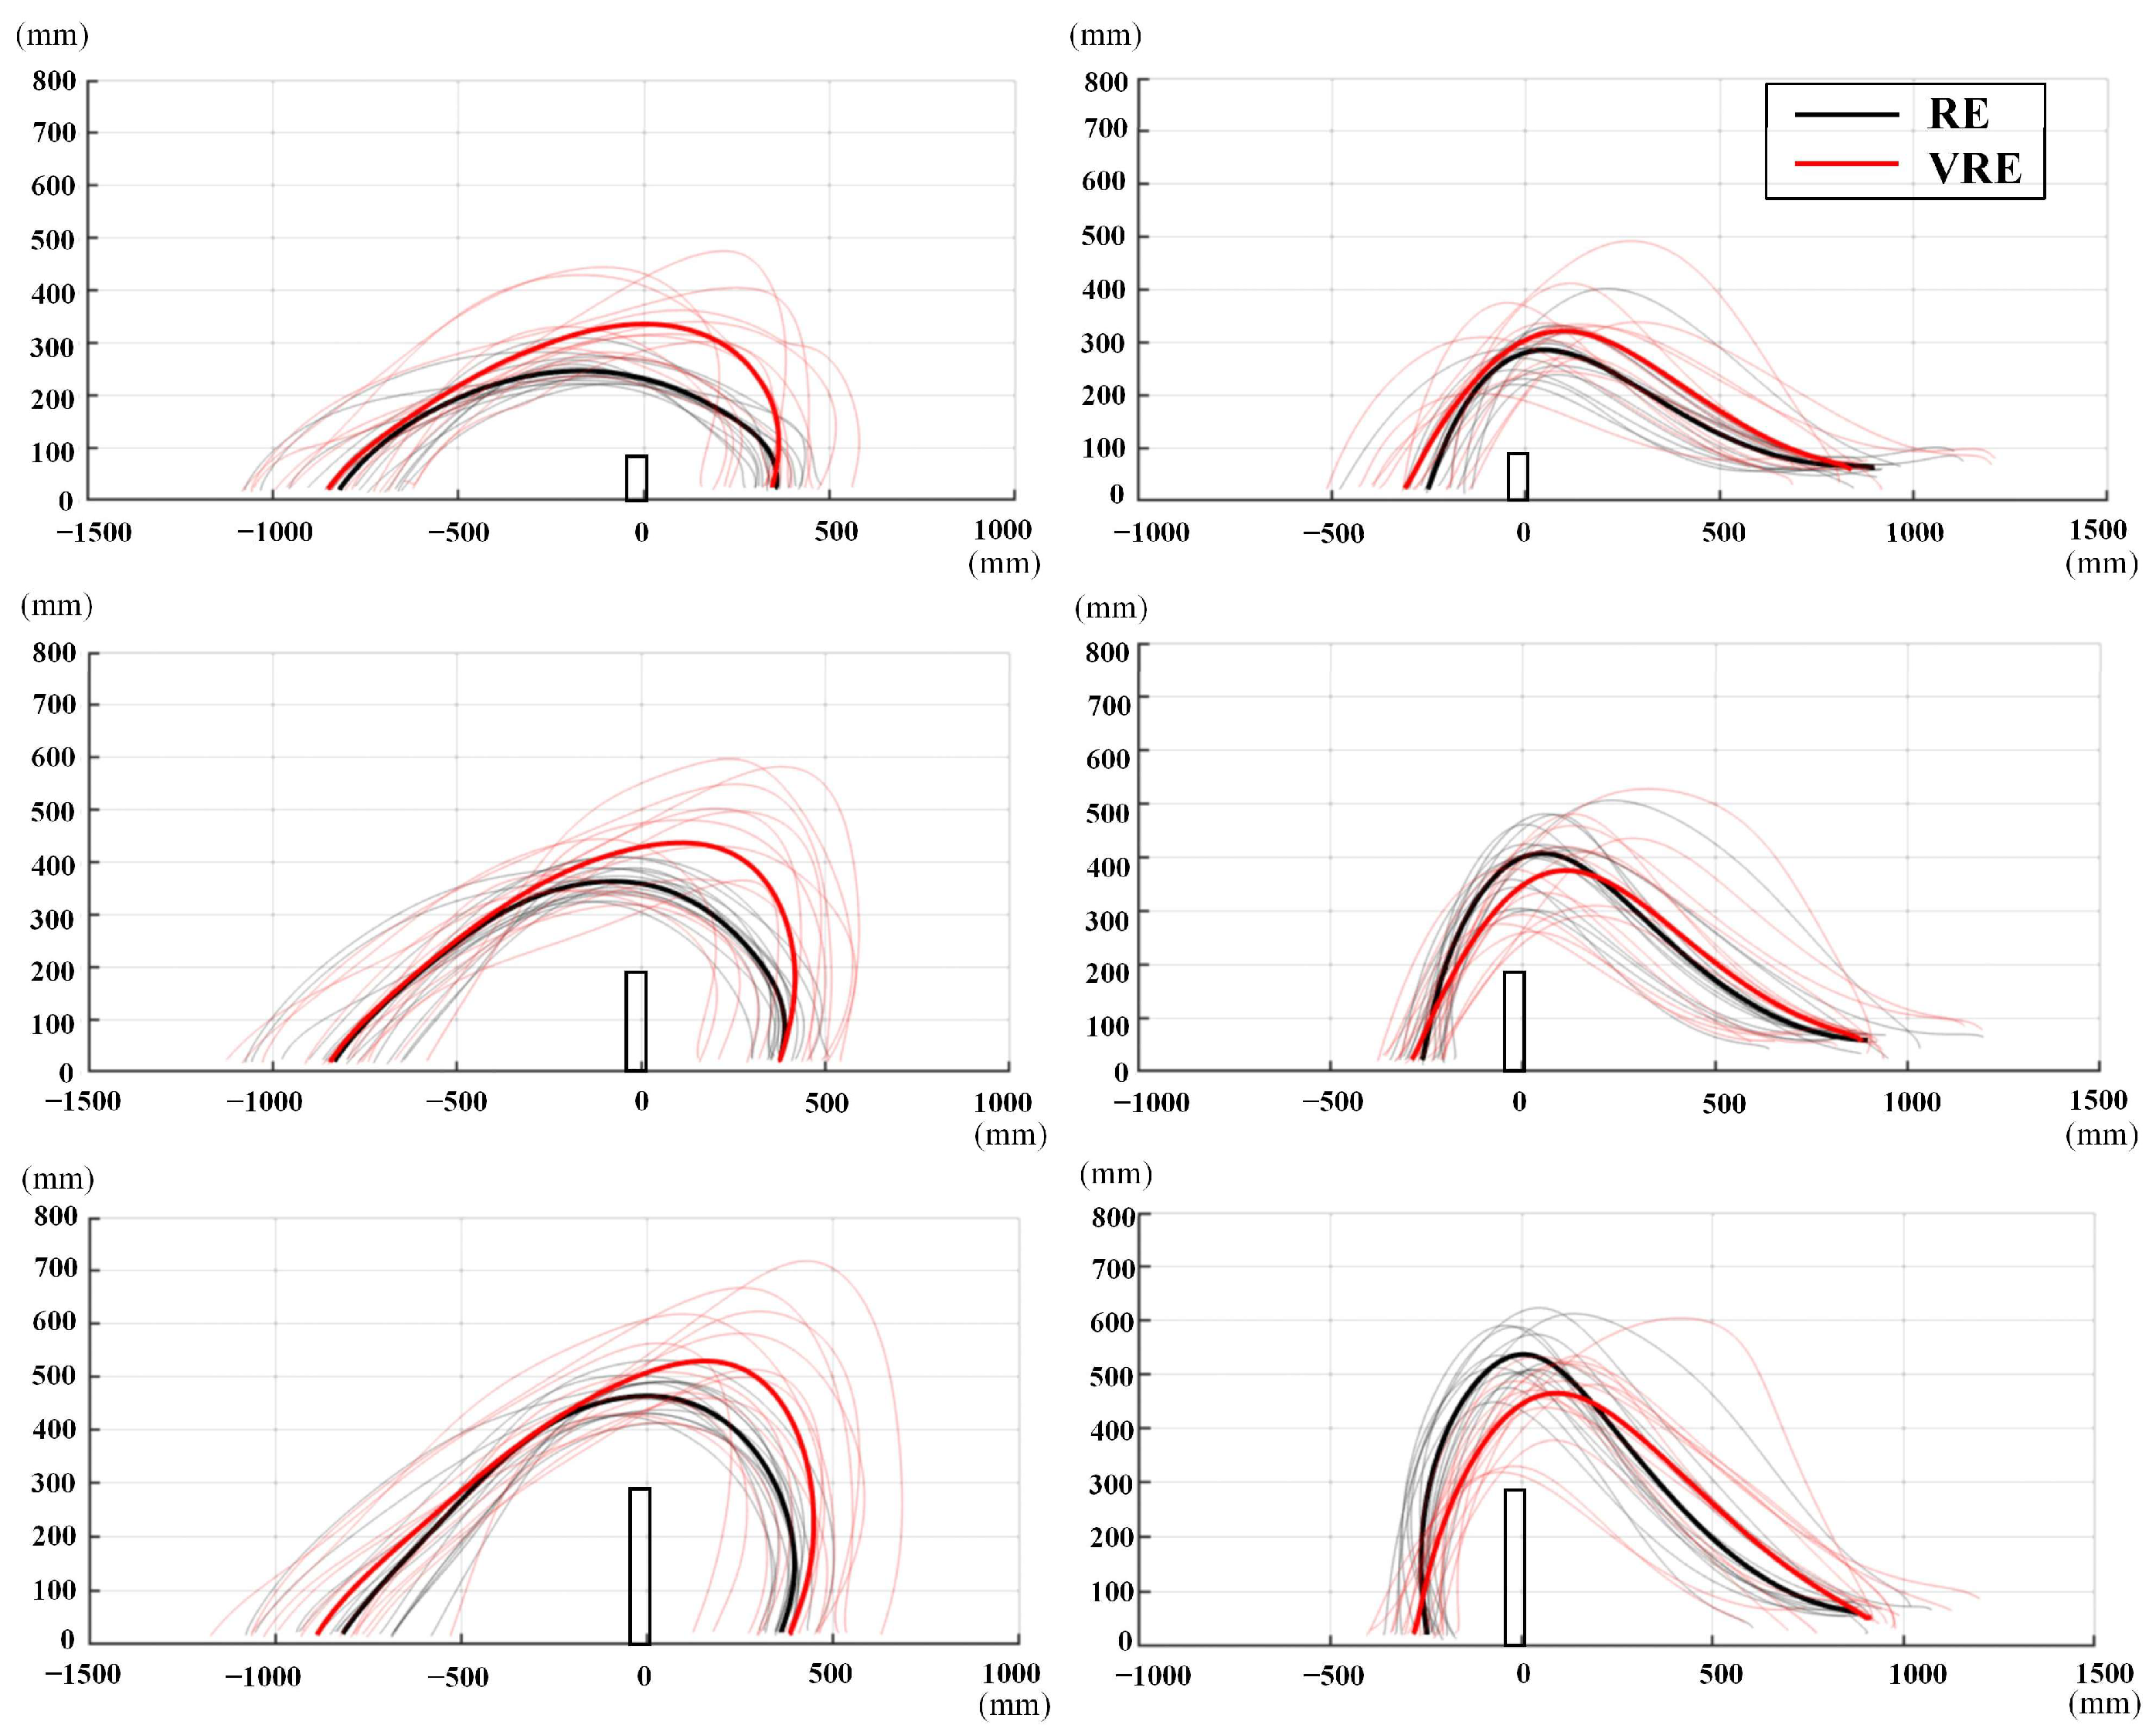
Figure 5 illustrates the foot trajectories during obstacle crossing in the two environments (RE and VRE) and at three obstacle heights (low, medium, and high).

3.1. Spatiotemporal Parameters

Table 1 summarizes the spatiotemporal parameters across the two environments for three obstacle heights. The ANOVA revealed a significant main effect of the environment on walking speed [F (1, 14) = 5.88, p = 0.029, η2p = 0.296]. In addition, obstacle height had a significant main effect on walking speed [F (2, 28) = 10.67, p < 0.001, η2p = 0.432].
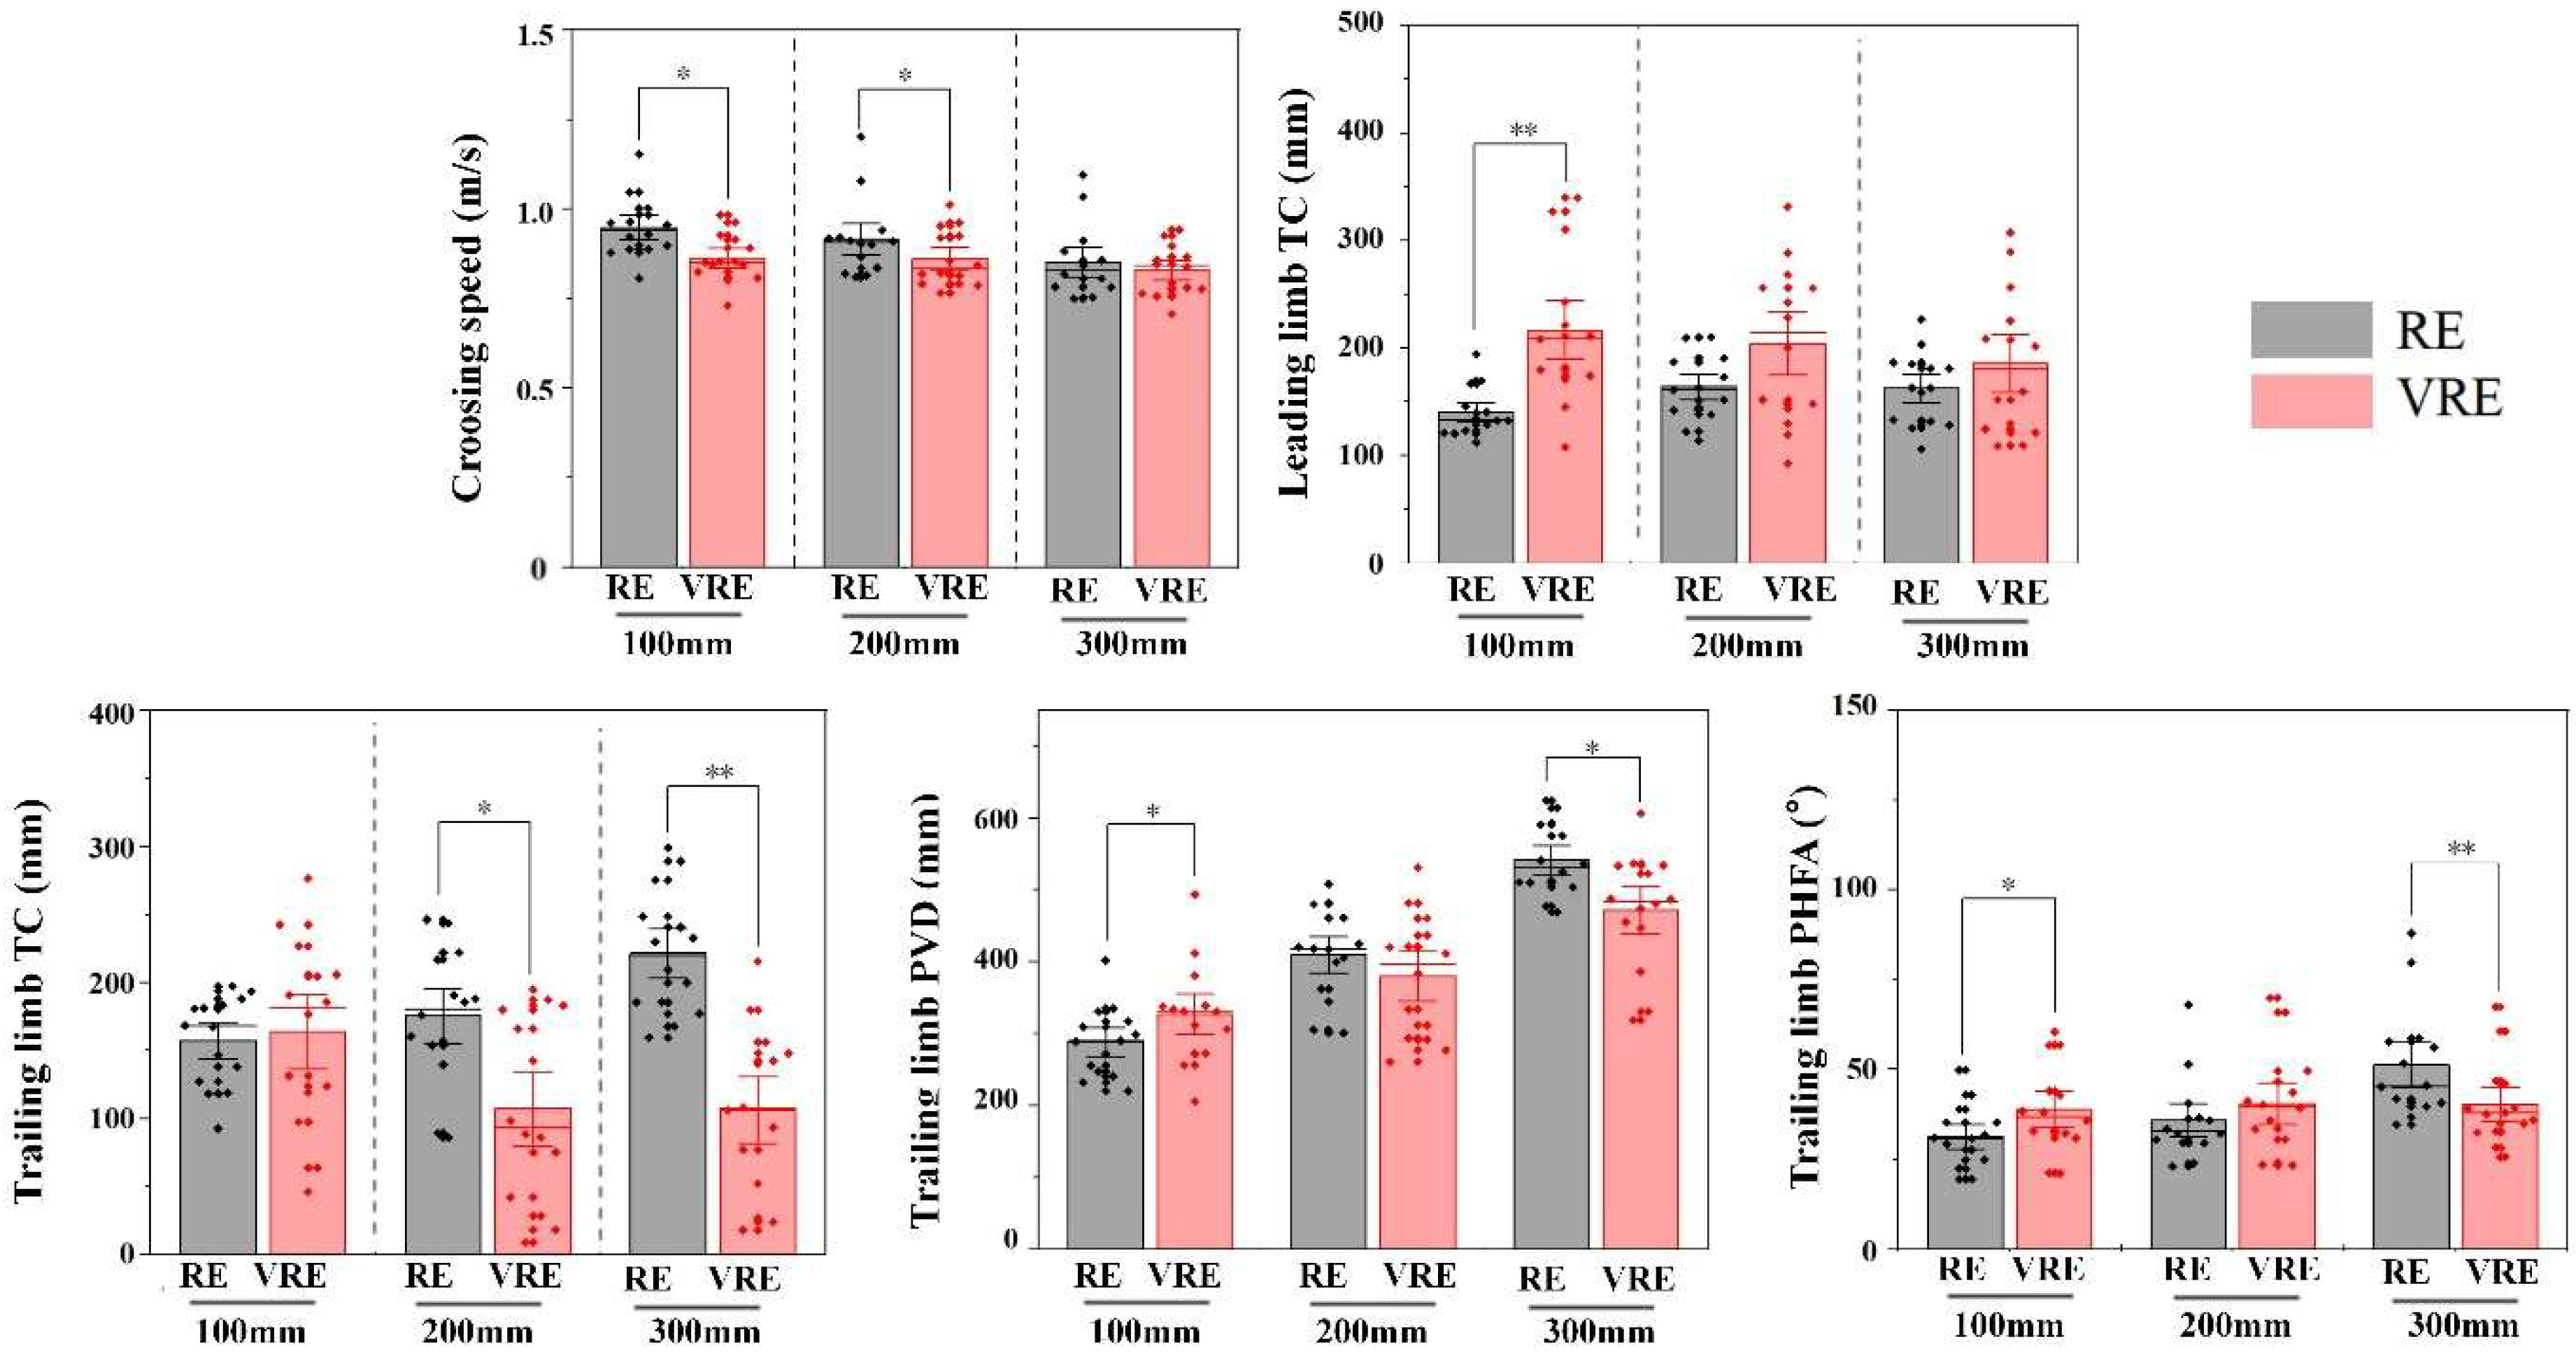
Additionally, there was a significant interaction effect on walking speed [F (2, 28) = 4.90, p = 0.015, η2p = 0.259]. A simple effects analysis showed that the walking speed of the participants in the RE was significantly higher than that in the VRE when they crossed low or medium obstacles. However, no significant difference was observed between the environments when they crossed high obstacles (see Figure 6).

3.2. Leading Limb

Table 2 presents the kinematic parameters of the leading limb, comparing both environments at three obstacle heights. A significant main effect of environment was found on TC [F (1, 13) = 15.75, p = 0.002, η2p = 0.548], PVD [F (1, 13) = 29.77, p < 0.001, η2p = 0.696], PHD [F (1, 13) = 15.85, p = 0.002, η2p = 0.549], HDOV [F (1, 13) = 7.922, p = 0.002, η2p = 0.379] and peak hip flexion angle (PHFA) [F (1, 13) = 30.88, p < 0.001, η2p = 0.704], with all values being greater in the VRE than in the RE. Further, obstacle height showed significant main effects on PVD [F (2, 26) = 70.38, p < 0.001, η2p = 0.844], PHD [F (2, 26) = 16.70, p < 0.001, η2p = 0.562], HDOV [F (2, 26) = 13.881, p < 0.001, η2p = 0.516], PHFA [F (2, 26) = 163.81, p < 0.001, η2p = 0.926], and peak knee flexion angle (PKFA) [F (2, 26) = 77.51, p < 0.001, η2p = 0.856], indicating higher values for these variables when participants crossed higher obstacles than when they crossed lower ones.
Additionally, a significant interaction was found for TC [F (2, 26) = 4.70, p = 0.018, η2p = 0.265]. A simple effects analysis revealed that TC in the VRE was significantly greater than that in the RE under low-obstacle-height conditions. However, this difference diminished as the obstacle height increased, and no significant difference was observed between the environments under high-obstacle conditions (see Figure 6).

3.3. Trailing Limb

Table 3 summarizes the kinematic parameters of the trailing limb across the two environments and three obstacle heights. The main effect of environment was significant for TC [F (1, 13) = 19.80, p = 0.001, η2p = 0.604], PHD [F (1, 13) = 21.26, p < 0.001, η2p = 0.621] and HDOV [F (1,13) = 22.50, p < 0.001, η2p = 0.634], and lower TC and higher PHD were observed in the VRE than in the RE. A significant main effect of obstacle height was also found for PVD [F (2, 26) = 52.57, p < 0.001, η2p = 0.802], PHD [F (2, 26) = 8.45, p = 0.003, η2p = 0.394], HDOV [F (2,26) = 8.135, p = 0.002, η2p = 0.385], PHFA [F (2, 26) = 13.80, p < 0.001, η2p = 0.515] and PKFA [F (2, 26) = 39.34, p < 0.001, η2p = 0.752], showing that these variables were higher for higher obstacles.
Significant interactions were found for TC [F (2, 26) = 21.76, p < 0.001, η2p = 0.626], PVD [F (2, 26) = 18.72, p < 0.001, η2p = 0.590], and PHFA [F (2, 26) = 17.24, p < 0.001, η2p = 0.570]. The results of the simple effects analysis indicated that under the low-obstacle condition, both PVD and PHFA were significantly higher in the VRE than in the RE. Under high-obstacle conditions, the opposite pattern emerged: PVD and PHFA were lower in the VRE than in the RE. Additionally, TC was significantly higher in the RE than in the VRE under the medium- and high-obstacle conditions, whereas no significant difference was found under the low-obstacle condition (see Figure 6).

4. Discussion

4.1. Effects of Obstacle Height

As expected, the participants crossed lower obstacles faster (0.95 ± 0.10 m/s), and their speed decreased when they crossed higher obstacles (0.85 ± 0.10 m/s). With increasing obstacle height, both the leading and trailing limbs exhibited greater hip and knee flexion, resulting in a higher PVD. These results are consistent with those of previous studies [20,26,27], indicating that when obstacles were low, participants prioritized efficiency and maintained forward momentum. However, crossing higher obstacles required the foot to travel along a longer movement path to ensure successful clearance, which increased movement duration and consequently reduced crossing speed.
The leading and trailing limbs exhibited divergent strategies. As shown in Table 2, when the leading limb crossed a higher obstacle, individuals tend to extend their PHD, resulting in a reduced absolute value of HDOV. This adjustment helped the participants keep their feet elevated when approaching an obstacle, thereby ensuring sufficient clearance to avoid collisions [28,29]. However, as obstacle height increased, the PHD of the trailing limb decreased, indicating a shorter horizontal distance traveled before reaching the PVD. A plausible explanation is that the trailing limb, initiates take-off from a position closer to the obstacle than the leading limb. As obstacle height increased, it had to achieve sufficient vertical clearance within a more limited horizontal distance, resulting in a steeper movement trajectory. Overall, as obstacle height increased, the movement of the leading limb was actively adjusted to enhance crossing safety. In contrast, the trailing limb, constrained by the take-off position, exhibited a more passive adaptive control strategy.

4.2. Effects of Environment

Similarly to obstacle height, the type of environment also altered crossing behavior. Consistent with previous studies [13,30,31], this study showed that the participants generally exhibited slower crossing speeds in the VRE (low obstacle: −9.0 cm/s; middle obstacle: −6.0 cm/s; high obstacle: −2.0 cm/s). In addition, obstacle height modulated TC differently across environments. Specifically, in the RE, the TC of both the leading and trailing limbs increased with obstacle height, whereas in the VRE, the TC of both limbs decreased as obstacle height increased (see Figure 6). The obstacle-crossing characteristics observed in the VRE may be due to inherent physical constraints of HMDs. These factors may also influence obstacle-crossing behavior. The following sections further elucidate how these constraints shape crossing strategies by separately examining the movement patterns of the leading and trailing limbs.

4.3. Leading Limb Strategy

In the VRE, greater flexion of the lower-limb joints (low obstacle: +13.8°; middle obstacle: +11.1°; high obstacle: +8.2°) elevated the PVD (low obstacle: +93.1 mm; middle obstacle: +79.0 mm; high obstacle: +73.8 mm), thereby increasing TC (low obstacle: +76.4 mm; middle obstacle: +40.0 mm; high obstacle: +23.5 mm) during obstacle crossing. TC is widely regarded as a key indicator influencing obstacle-crossing safety [32]. An increased TC effectively reduces the risk of contact with an obstacle, thereby decreasing the likelihood of tripping [32,33], which reflects a typical strategy adaption in VRE.
The study results showed that, compared with the RE, the VRE was associated with a greater absolute HDOV value and a significantly increased PHD and TC of the leading limb, indicating a longer ascending-phase displacement. Together with the lower crossing speed observed in the VRE, these findings suggest a longer movement duration during the ascending phase. This may be because prolonging the ascending trajectory provides additional temporal and spatial margins to address uncertainty about the obstacle position [34]. Another interesting finding is that although the ascending trajectory was prolonged in the VRE, the crossing length did not differ significantly between the two environments. Under typical obstacle-crossing conditions, the ascending and descending trajectories tend to change in a coordinated manner, such that an extended ascending phase is usually accompanied by a corresponding extension of the descending phase [21]. However, in the VRE, this coordination appeared to be redistributed, with participants shortening the descending trajectory instead. Such trajectory adjustments may facilitate earlier preparation for foot contact and weight support, reflecting a more cautious motor control strategy in the VRE. Therefore, we speculate that individuals may perceive obstacles in the VRE as more uncertain and consequently adjust their crossing strategically and proactively to ensure safe crossing.
The altered obstacle-crossing gait in the VRE may stem from multiple factors. Previous studies have suggested that the physical characteristics of HMDs, such as a reduced FOV [24,35,36], HMD weight [24,37], and system motion-to-photon latency (approximately 20–30 ms) [38], may influence crossing movements. Specifically, the HTC Vive Pro headset used in the present study weighs over 500 g, which alters the user’s center of mass and increases the moment of inertia of the head. The additional head load not only increases the need for continuous postural adjustments but also constrains the flexibility of head movements, thereby reducing participants’ ability to efficiently obtain spatial information during crossing. Moreover, the reduced FOV caused by the HMD and system motion-to-photon latency limit participants’ perception of the obstacle location and delay visual feedback updates. These factors may increase uncertainty in motor control during obstacle crossing. Therefore, the HMD-related mechanical constraints may have encouraged participants to adopt a more cautious crossing strategy in the VRE.

4.4. Trailing Limb Strategy

In the VRE, the horizontal parameters of the trailing limb (PHD and HDOV), consistent with those of the leading limb, were always located farther from the obstacle than those in the RE, and mostly occurred after the obstacle was crossed. As previously noted, this may reflect an adaptive crossing strategy adopted by individuals to manage their uncertainty about obstacles in the VRE. However, for the vertical parameters, the interaction between the obstacle height and the environment exhibited a different trend from that of the leading limb. There was no significant difference in TC under low-obstacle conditions, but as obstacle height increased, this was reversed; the trailing limb in the RE demonstrated greater hip flexion (high obstacle: −12.7°) and TC (middle obstacle: −68.2 mm; high obstacle: −115.2 mm).
The horizontal and vertical parameters exhibited different trends. We believe that this is related to their characteristics and underlying motor control. The horizontal parameters are primarily associated with the anteroposterior depth of the obstacle. When the obstacle is wider in the anteroposterior direction, individuals must increase their step placement in the forward–backward direction to ensure sufficient horizontal clearance [39]. However, in this study, the anteroposterior depth of the obstacle remained constant. Therefore, differences in horizontal parameters primarily reflect the environmental effects and were less influenced by the obstacle height. In contrast, both obstacle height and environmental factors simultaneously affected the vertical parameters. Individuals must actively increase lower-limb joint flexion as the obstacle height increases to ensure sufficient TC; however, the limitations of the VRE further interfere with this adjustment process. The vertical parameters exhibited a significant interaction between the obstacle height and environment.
During obstacle crossing, the trailing limb is typically outside the FOV, forcing it to rely more heavily on spatial memory of the obstacle and proprioceptive estimation of lower-limb position [40,41]. Initially, under low-obstacle conditions, the overall demands of the crossing task were relatively low; therefore, the influence of environmental factors on obstacle-crossing behavior was limited, and no significant differences were observed in the vertical direction between RE and VRE. However, this trend changed with the increase in obstacle height. Under higher obstacle conditions in RE, individuals would normally be expected to enhance crossing clearance to avoid risks, and the demand for movement control would be correspondingly greater [26,27,30,42]. Nevertheless, as noted above, the trailing limb lacks direct visual monitoring during obstacle crossing. Additionally, in the VRE, object size or spatial distance may be underestimated when individuals make judgments based on spatial memory [43]. Therefore, proprioceptive information, together with potentially biased spatial memory, may be insufficient to accurately update the position of the trailing limb relative to the obstacle, especially when the crossing task becomes more demanding (obstacle height increases). Consequently, the crossing strategy of the trailing limb may not have maintained the same level of caution as that of the leading limb.

4.5. Limitations

Although this study revealed distinct characteristics of individuals’ obstacle-crossing behavior in the RE and VRE, several limitations should be noted. First, the sample size was relatively small, which may have reduced the statistical power to detect smaller effects. Second, potential learning effects in the VRE were not considered, leaving it unclear whether repeated practice would align participants’ movements more closely with those in the RE. Third, the participants consisted mainly of young healthy individuals, which limited the generalizability of the findings to populations such as older adults and those with gait impairment. Fourth, cybersickness and perceptual experience were not directly assessed. Therefore, the extent to which discomfort or perceptual uncertainty contributed to the observed crossing-movement changes remains unclear. Finally, although multiple kinematic parameters were examined, the absence of neuromuscular and perceptual-cognitive measures restricted a comprehensive understanding of the mechanisms underlying crossing-strategy adjustment.

4.6. Implications

The present study revealed different adaptation patterns between the leading and trailing limbs in VREs. Therefore, practitioners should consider implementing limb-specific training strategies for VR-based rehabilitation. Regarding the leading limb, precise foot-trajectory control should be emphasized to prevent excessively high foot elevations and horizontal step distances. For the trailing limb, the observation that crossing behavior differed across the two environments as a function of obstacle height suggests that training programs may need to be adjusted according to obstacle height. For example, under low-obstacle conditions, the existing crossing strategy may be maintained, whereas under higher obstacle conditions, individuals should be intentionally guided and encouraged to increase the elevation of the trailing limb to better approximate movement patterns observed in the RE. It should be noted that the above implications are based on a relatively small sample of young adults; therefore, further validation is needed in larger samples and broader populations.
Given the asymmetry of bilateral limb control in VR-based obstacle-crossing, future VR systems could integrate real-time feedback based on lower-limb performance. For example, visual or auditory cues can prompt users to adjust when the TC is too high or low. Such limb-specific feedback would promote more natural obstacle-crossing movements.

5. Conclusions

VRE may alter the control strategies adopted during obstacle crossing. Specifically, lower-limb flexion of the leading limb increased in the VRE, which resulted in higher TC. For the trailing limb, the differences were mainly observed under middle- and high-obstacle conditions, where smaller lower-limb flexion and lower TC was observed in the VRE than the RE. These findings provide preliminary evidence for the potential influence of the VRE on obstacle-crossing control strategies.

Author Contributions

Conceptualization, Z.T. and S.M.; methodology, Z.T. and S.M.; software, Z.T.; validation, Z.T. and S.M.; formal analysis, Z.T.; investigation, Z.T. and T.L.; resources, S.M. and P.Y.L.; data curation, Z.T.; writing—original draft preparation, Z.T.; writing—review and editing, all authors; visualization, Z.T. and S.M.; supervision, S.M., T.L., S.S. and P.Y.L.; project administration, Z.T., S.S. and S.M.; funding acquisition, S.M. and P.Y.L. All authors have read and agreed to the published version of the manuscript.

Funding

This research did not receive any specific grant from funding agencies in the public, commercial, or not-for-profit sectors.

Institutional Review Board Statement

The study was conducted in accordance with the principles of human research ethics. Ethical approval was obtained from the Research Ethics Committee of the Faculty of Design at Kyushu University (Approval No. 577; date of approval: 31 October 2023).

Informed Consent Statement

Informed consent was obtained from all subjects involved in the study.

Data Availability Statement

The data presented in this study are available on request from the corresponding author due to ethical concerns and privacy protections for study participants.

Acknowledgments

We express our sincere gratitude to all the participants who participated in this research.

Conflicts of Interest

The author Teerapapa Luecha is an employee of MDPI. However she does not work for the journal Applied Science at the time of submission and publication.

Abbreviations

AbbreviationDefinition
VRVirtual Reality
VREVirtual Reality Environment
REReal Environment
HMDHead-Mounted Display
FOVField of View
MTPMetatarsophalangeal
TCToe Clearance
PVDPeak Vertical Distance
PHDPeak Horizontal Distance
PHFAPeak Hip Flexion Angle
PKFAPeak Knee Flexion Angle
PAFAPeak Ankle Flexion Angle
HDOVHorizontal Distance between the Obstacle and Peak Vertical Distance

References

  1. Patla, A.E. Understanding the roles of vision in the control of human locomotion. Gait Posture 1997, 5, 54–69. [Google Scholar] [CrossRef]
  2. Chen, H.-C.; Ashton-Miller, J.A.; Alexander, N.B.; Schultz, A.B. Age effects on strategies used to avoid obstacles. Gait Posture 1994, 2, 139–146. [Google Scholar] [CrossRef]
  3. Weerdesteyn, V.; Nienhuis, B.; Duysens, J. Advancing age progressively affects obstacle avoidance skills in the elderly. Hum. Mov. Sci. 2005, 24, 865–880. [Google Scholar] [CrossRef]
  4. Wan, X.; Zhu, Z.; Xu, F.; Li, Q. Association between gait characteristics during obstacle crossing and fall risk in stroke patients: A prospective cohort study. Gait Posture 2025, 120, 9–16. [Google Scholar] [CrossRef]
  5. Caetano, M.J.D.; Lord, S.R.; Schoene, D.; Pelicioni, P.H.S.; Sturnieks, D.L.; Menant, J.C. Age-related changes in gait adaptability in response to unpredictable obstacles and stepping targets. Gait Posture 2016, 46, 35–41. [Google Scholar] [CrossRef]
  6. Chang, Y.-T.; Huang, C.-F.; Chang, J.-H. The Effect of Tai Chi Chuan on Obstacle Crossing Strategy in Older Adults. Res. Sports Med. 2015, 23, 315–329. [Google Scholar] [CrossRef]
  7. Mirelman, A.; Maidan, I.; Herman, T.; Deutsch, J.E.; Giladi, N.; Hausdorff, J.M. Virtual Reality for Gait Training: Can It Induce Motor Learning to Enhance Complex Walking and Reduce Fall Risk in Patients with Parkinson’s Disease? J. Gerontol. Ser. A 2011, 66A, 234–240. [Google Scholar] [CrossRef] [PubMed]
  8. Wasaki, N.; Hiranai, K.; Takahashi, A. Age-related differences in the effect of mental fatigue on obstacle crossing in virtual reality. Sci. Rep. 2025, 15, 9527. [Google Scholar] [CrossRef]
  9. Chen, J.; Yan, S.; Yin, H.; Lin, D.; Mei, Z.; Ding, Z.; Wang, M.; Bai, Y.; Xu, G. Virtual reality technology improves the gait and balance function of the elderly: A meta-analysis of randomized controlled trials. Arch. Med. Sci. 2024, 20, 1918–1929. [Google Scholar] [CrossRef]
  10. Ip, W.K.; Soar, J.; Fong, K.; Wang, S.-Y.; James, C. An Exploratory Study on Virtual Reality Technology for Fall Prevention in Older Adults with Mild Cognitive Impairment. Sensors 2025, 25, 3123. [Google Scholar] [CrossRef]
  11. He, Y.; Lee, J.; Kim, J.; Brodie, M.A.; Mitri, G.; van Schooten, K.S.; Lovell, N.H.; Lord, S.R.; Okubo, Y. Virtual obstacle-avoidance training using daily-life obstacles with physical feedback in older people: A cross-over trial. Arch. Gerontol. Geriatr. 2025, 135, 105866. [Google Scholar] [CrossRef]
  12. Kim, J.; Son, J.; Ko, N.; Yoon, B. Unsupervised Virtual Reality-Based Exercise Program Improves Hip Muscle Strength and Balance Control in Older Adults: A Pilot Study. Arch. Phys. Med. Rehabil. 2013, 94, 937–943. [Google Scholar] [CrossRef]
  13. Coolen, B.; Beek, P.J.; Geerse, D.J.; Roerdink, M. Avoiding 3D Obstacles in Mixed Reality: Does It Differ from Negotiating Real Obstacles? Sensors 2020, 20, 1095. [Google Scholar] [CrossRef]
  14. Weber, A.; Hartmann, U.; Werth, J.; Epro, G.; Seeley, J.; Nickel, P.; Karamanidis, K. Limited transfer and retention of locomotor adaptations from virtual reality obstacle avoidance to the physical world. Sci. Rep. 2022, 12, 19655. [Google Scholar] [CrossRef] [PubMed]
  15. Billington, J.; Wilkie, R.M.; Wann, J.P. Obstacle avoidance and smooth trajectory control: Neural areas highlighted during improved locomotor performance. Front. Behav. Neurosci. 2013, 7, 9. [Google Scholar] [CrossRef] [PubMed][Green Version]
  16. Klymenko, V.; Rash, C.E. Human factors evaluation of visual field-of-view effects of partial binocular overlap designs in helmet-mounted displays. In Proceedings of the American Helicopter Society 51st Annual Forum, Fort Worth, TX, USA, 9–11 May 1995; pp. 1450–1465. [Google Scholar]
  17. Gerig, N.; Mayo, J.; Baur, K.; Wittmann, F.; Riener, R.; Wolf, P. Missing depth cues in virtual reality limit performance and quality of three dimensional reaching movements. PLoS ONE 2018, 13, e0189275. [Google Scholar] [CrossRef] [PubMed]
  18. Stauffert, J.-P.; Niebling, F.; Latoschik, M.E. Latency and cybersickness: Impact, causes, and measures. A review. Front. Virtual Real. 2020, 1, 582204. [Google Scholar] [CrossRef]
  19. Derby, H.; Conner, N.; Knight, A.C.; Chander, H. Influence of Virtual Reality on Lower Extremity Joint Kinematics During Overground Walking. Appl. Sci. 2025, 15, 12000. [Google Scholar] [CrossRef]
  20. Wang, C.; Guo, Y.; Du, W.; Li, Z.; Chen, W. Gender Differences in Joint Biomechanics During Obstacle Crossing with Different Heights. Bioengineering 2025, 12, 189. [Google Scholar] [CrossRef]
  21. Austin, G.P.; Garrett, G.E.; Bohannon, R.W. Kinematic analysis of obstacle clearance during locomotion. Gait Posture 1999, 10, 109–120. [Google Scholar] [CrossRef]
  22. Martelli, D.; Xia, B.; Prado, A.; Agrawal, S.K. Gait adaptations during overground walking and multidirectional oscillations of the visual field in a virtual reality headset. Gait Posture 2019, 67, 251–256. [Google Scholar] [CrossRef]
  23. Chan, Z.Y.S.; MacPhail, A.J.C.; Au, I.P.H.; Zhang, J.H.; Lam, B.M.F.; Ferber, R.; Cheung, R.T. Walking with head-mounted virtual and augmented reality devices: Effects on position control and gait biomechanics. PLoS ONE 2019, 14, e0225972. [Google Scholar] [CrossRef]
  24. Tao, Z.; Luecha, T.; Loh, P.Y.; Saito, S.; Muraki, S. Biomechanical Differences During Overground Walking in Virtual Reality: A Comparative Study with a Real Environment. J. Appl. Biomech. 2026. published online ahead of print. [Google Scholar] [CrossRef]
  25. Rietdyk, S.; Rhea, C.K. The effect of the visual characteristics of obstacles on risk of tripping and gait parameters during locomotion. Ophthalmic Physiol. Opt. 2011, 31, 302–310. [Google Scholar] [CrossRef]
  26. Wang, T.; Chen, H.; Lu, T. Effects of obstacle height on the control of the body center of mass motion during obstructed gait. J. Chin. Inst. Eng. 2007, 30, 471–479. [Google Scholar] [CrossRef]
  27. Yamaji, S.; Demura, S.; Sugiura, H. Influence of degraded visual acuity from light-scattering goggles on obstacle gait. Health 2011, 3, 99–105. [Google Scholar] [CrossRef]
  28. Mohagheghi, A.A.; Moraes, R.; Patla, A.E. The effects of distant and on-line visual information on the control of approach phase and step over an obstacle during locomotion. Exp. Brain Res. 2004, 155, 459–468. [Google Scholar] [CrossRef]
  29. Hahn, M.E.; Chou, L.-S. Age-related reduction in sagittal plane center of mass motion during obstacle crossing. J. Biomech. 2004, 37, 837–844. [Google Scholar] [CrossRef]
  30. Wang, C.-H.; Chang, C.-C. Gait performance in obstacle crossing: Impact of virtual information on an optical head-mounted display. Gait Posture 2025, 121, 295–300. [Google Scholar] [CrossRef] [PubMed]
  31. Gioia, A.; Libera, T.; Burks, G.; Arena, S.; Hamel, R.N.; Zukowski, L.A. The effect of virtual reality treadmill training on obstacle crossing parameters in older adults. Hum. Mov. Sci. 2024, 96, 103247. [Google Scholar] [CrossRef] [PubMed]
  32. Chou, L.-S.; Draganich, L.F. Placing the trailing foot closer to an obstacle reduces flexion of the hip, knee, and ankle to increase the risk of tripping. J. Biomech. 1998, 31, 685–691. [Google Scholar] [CrossRef] [PubMed]
  33. Kuo, C.-C.; Wang, J.-Y.; Chen, S.-C.; Lu, T.-W.; Hsu, H.-C. Aging Affects Multi-Objective Optimal Control Strategies during Obstacle Crossing. Appl. Sci. 2021, 11, 8040. [Google Scholar] [CrossRef]
  34. da Silva, J.J.; Barbieri, F.A.; Gobbi, L.T.B. Adaptive Locomotion for Crossing a Moving Obstacle. Mot. Control 2011, 15, 419–433. [Google Scholar] [CrossRef] [PubMed]
  35. Sivak, B.; MacKenzie, C.L. Integration of visual information and motor output in reaching and grasping: The contributions of peripheral and central vision. Neuropsychologia 1990, 28, 1095–1116. [Google Scholar] [CrossRef]
  36. Iosa, M.; Fusco, A.; Morone, G.; Paolucci, S. Effects of Visual Deprivation on Gait Dynamic Stability. Sci. World J. 2012, 2012, 974560. [Google Scholar] [CrossRef]
  37. Ito, K.; Tada, M.; Ujike, H.; Hyodo, K. Effects of the Weight and Balance of Head-Mounted Displays on Physical Load. Appl. Sci. 2021, 11, 6802. [Google Scholar] [CrossRef]
  38. Salinas, M.M.; Wilken, J.M.; Dingwell, J.B. How humans use visual optic flow to regulate stepping during walking. Gait Posture 2017, 57, 15–20. [Google Scholar] [CrossRef]
  39. Cui, Z.; Mao, D.; Riskowski, J.; Song, Q. Strategies of stepping over obstacles: The effects of long-term exercise in older adults. Gait Posture 2011, 34, 191–196. [Google Scholar] [CrossRef]
  40. Chu, N.C.W.; Sturnieks, D.L.; Lord, S.R.; Menant, J.C. Visuospatial working memory and obstacle crossing in young and older people. Exp. Brain Res. 2022, 240, 2871–2883. [Google Scholar] [CrossRef]
  41. Heijnen, M.J.H.; Romine, N.L.; Stumpf, D.M.; Rietdyk, S. Memory-guided obstacle crossing: More failures were observed for the trail limb versus lead limb. Exp. Brain Res. 2014, 232, 2131–2142. [Google Scholar] [CrossRef] [PubMed]
  42. Jansen, S.E.M.; Toet, A.; Werkhoven, P.J. Obstacle Crossing with Lower Visual Field Restriction: Shifts in Strategy. J. Mot. Behav. 2010, 43, 55–62. [Google Scholar] [CrossRef] [PubMed]
  43. Itaguchi, Y. Size Perception Bias and Reach-to-Grasp Kinematics: An Exploratory Study on the Virtual Hand with a Consumer Immersive Virtual-Reality Device. Front. Virtual Real. 2021, 2, 712378. [Google Scholar] [CrossRef]
Figure 1. Schematic setup of experiment. (Right) real environment. (Left) virtual reality environment. (Bottom) The VR tracking area measures 5 m between the start and end points, with a width of 1 m. The base stations are placed diagonally.
Applsci 16 05670 g001
Figure 2. Obstacle setup in the VRE and RE. The obstacle heights are 100 mm, 200 mm, and 300 mm from left to right.
Applsci 16 05670 g002
Figure 3. Obstacle crossing in the RE (left) and VRE (right).
Applsci 16 05670 g003
Figure 4. Key indicators during obstacle crossing. Limb-specific classifications are defined as leading limb (L) and trailing limb (T): 1. Prestep distance, 2. Poststep distance, 3. TC, 4. PVD, 5. PHD, 6. HDOV 7. PHFA, 8. PKFA, 9. PAFA.
Applsci 16 05670 g004
Figure 5. Crossing trajectories of the leading limb (left) and trailing limb (right) during obstacle crossing in VRE and RE at three obstacle heights: 100 mm (top), 200 mm (middle), and 300 mm (bottom). The thick lines represent group means, and the thin lines represent individual participants. The rectangles represent the obstacles at the three different height conditions.
Applsci 16 05670 g005
Figure 6. Interaction effects of obstacle height and environment on kinematic parameters of both limbs. * p < 0.05, ** p < 0.01. The symbol ° indicates joint angle degrees.
Applsci 16 05670 g006
Table 1. Spatiotemporal gait parameters across different environments and obstacle heights.
Spatiotemporal Parameters
Obstacle
Height
RE VRE ANOVA (1)
p-Value
RE vs. VRE (2)
p-Value
S1
Crossing length (mm)
100 mm2229.6 ± 288.6 2250.4 ± 321.2E: 0.1140.757
200 mm2271.5 ± 253.2 2292.1 ± 310.8H: 0.6810.447
300 mm2208.5 ± 260.92369.2 ± 349.2E × H: 0.1250.052
S2
Step width
(mm)
100 mm187.2 ± 38.1200.2 ± 42.7E: 0.5690.364
200 mm194.3 ± 29.3203.3 ± 50.1H: 0.7000.473
300 mm199.1 ± 31.6192.5 ± 47.9E × H: 0.4180.574
S3
Crossing speed
(m/s)
100 mm0.95 ± 0.100.86 ± 0.07E: 0.029 *0.016 *
200 mm0.92 ± 0.110.86 ± 0.08H: <0.001 **0.041 *
300 mm0.85 ± 0.100.83 ± 0.07E × H: 0.015 *0.144
Note: E = main effect of environment; H = main effect of obstacle height; E × H = interaction between environment and obstacle height. (1) Results of the two-way repeated-measures ANOVA. (2) Pairwise comparisons were conducted between RE and VRE. * p < 0.05, ** p < 0.01.
Table 2. Leading-limb kinematic parameters across environments and obstacle height conditions.
Leading Limb
Obstacle
Height
RE VRE ANOVA (1)
p-Value
RE vs. VRE (2)
p-Value
L1
Prestep distance
(mm)
100 mm770.5 ± 135.5 821.9 ± 176.7E: 0.2360.358
200 mm783.0 ± 136.4 793.6 ± 152.9H: 0.9010.913
300 mm768.4 ± 150.6837.3 ± 169.1E × H: 0.5700.143
L2
Poststep distance
(mm)
100 mm356.5 ± 58.7330.2 ± 134.8 E: 0.9660.395
200 mm378.4 ± 56.6376.9 ± 131.5H: 0.2070.961
300 mm360.2 ± 42.5391.5 ± 127.7E × H: 0.0930.322
L3
TC
(mm)
100 mm140.2 ± 22.6216.6 ± 68.0E: 0.002 **0.001 **
200 mm164.0 ± 30.3204.0 ± 73.0 H: 0.8050.056
300 mm162.4 ± 34.0185.9 ± 66.7E × H: 0.018 *0.106
L4
PVD
(mm)
100 mm249.6 ± 26.2342.7 ± 76.6E: <0.001 **<0.001 **
200 mm366.9 ± 28.2445.9 ± 94.0H: <0.001 **0.002 **
300 mm466.6 ± 35.6540.4 ± 94.5E × H: 0.6550.003 **
L5
PHD
(mm)
100 mm660.4 ± 129.0842.1 ± 255.7E: 0.002 **0.017 *
200 mm757.6 ± 126.9935.3 ± 255.2H: <0.001 **0.013 *
300 mm821.5 ± 157.21041.1 ± 224.1E × H: 0.7780.002 **
L6
HDOV
(mm)
100 mm110.1 ± 86.5−20.3 ± 166.7E: 0.002 **0.014 *
200 mm25.4 ± 41.9−141.7 ± 108.0H: <0.001 **0.011 *
300 mm−67.4 ± 45.2−161.0 ± 104.6E × H: 0.4350.007 **
L7
PHFA (°)
100 mm47.8 ± 7.461.6 ± 8.4E: <0.015 *0.001 **
200 mm62.4 ± 7.273.5 ± 10.9H: <0.001 **0.001 **
300 mm75.8 ± 8.584.0 ± 9.4E × H: 0.0620.006 **
L8
PKFA (°)
100 mm98.6 ± 6.8100.7 ± 11.8E: 0.3830.238
200 mm112.4 ± 5.6110.3 ± 10.1H: <0.001 **0.378
300 mm115.7 ± 7.3118.3 ± 6.1E × H: 0.2520.203
L9
PAFA (°)
100 mm12.2 ± 4.810.1 ± 7.5E: 0.0670.217
200 mm13.4 ± 5.011.0 ± 7.0H: 0.7880.175
300 mm11.9 ± 8.410.2 ± 9.7E × H: 0.9280.139
Note: E = main effect of environment; H = main effect of obstacle height; E × H = interaction between environment and obstacle height. (1) Results of the two-way repeated-measures ANOVA. (2) Pairwise comparisons were conducted between RE and VRE. * p < 0.05, ** p < 0.01. The symbol ° indicates joint angle degrees.
Table 3. Trailing-limb kinematic parameters across environments and obstacle height conditions.
Trailing Limb
Obstacle
Height
RE VRE ANOVA (1)
p-Value
RE vs. VRE (2)
p-Value
T1
Prestep distance
(mm)
100 mm202.5 ± 83.0261.6 ± 104.7E: 0.0560.148
200 mm212.0 ± 51.2238.8 ± 60.4H: 0.5680.220
300 mm198.4 ± 57.5234.6 ± 71.0E × H: 0.6780.170
T2
Poststep distance
(mm)
100 mm899.9 ± 113.5836.6 ± 193.7E: 0.6670.201
200 mm898.0 ± 123.4882.6 ± 163.0H: 0.6730.670
300 mm881.3 ± 106.0905.7 ± 162.9E × H: 0.1180.582
T3
TC
(mm)
100 mm157.3 ± 33.3163.7 ± 68.2E: <0.001 **0.663
200 mm175.4 ± 49.4107.2 ± 67.7H: 0.2260.006 **
300 mm221.5 ± 45.3106.3 ± 61.2E × H: <0.001 **<0.001 **
T4
PVD
(mm)
100 mm288.6 ± 49.1327.5 ± 70.6E: 0.1220.005 **
200 mm409.5 ± 63.4379.8 ± 85.1 H: <0.001 **0.162
300 mm541.9 ± 49.7471.7 ± 80.8E × H: <0.001 **0.001 **
T5
PHD
(mm)
100 mm300.1 ± 80.8398.9 ± 101.0E: <0.001 **<0.001 **
200 mm308.5 ± 78.4400.7 ± 107.8H: 0.003 **<0.001 **
300 mm252.3 ± 85.0378.4 ± 142.4E × H: 0.2590.002 **
T6
HDOV
(mm)
100 mm40.7 ± 83.6−137.3 ± 104.2E: <0.001 **<0.001 **
200 mm−96.5 ± 70.0−161.8 ± 113.3H: 0.002 ** 0.016 *
300 mm−82.9 ± 49.9−152.4 ± 108.0E × H: 0.080.010 **
T7
PHFA (°)
100 mm31.4 ± 8.737.2 ± 11.0E: 0.9510.006 **
200 mm36.6 ± 13.838.2 ± 12.1H: <0.001 **0.090
300 mm52.0 ± 17.739.3 ± 9.0E × H: <0.001 **0.001 **
T8
PKFA (°)
100 mm87.2 ± 9.691.0 ± 13.2E: 0.9130.179
200 mm103.4 ± 8.3101.5 ± 12.2H: <0.001 **0.463
300 mm112.9 ± 6.9110.4 ± 11.7E × H: 0.1850.437
T9
PAFA (°)
100 mm15.6 ± 8.317.6 ± 8.0E: 0.1110.387
200 mm16.5 ± 7.916.3 ± 8.1H: 0.8340.957
300 mm12.8 ± 8.218.1 ± 10.1E × H: 0.3030.057
Note: E = Main effect of environment; H = Main effect of obstacle height; E × H = interaction between environment and obstacle height. (1) Results of the two-way repeated-measures ANOVA. (2) Pairwise comparisons were conducted between RE and VRE. * p < 0.05, ** p < 0.01. The symbol ° indicates joint angle degrees.
Disclaimer/Publisher’s Note: The statements, opinions and data contained in all publications are solely those of the individual author(s) and contributor(s) and not of MDPI and/or the editor(s). MDPI and/or the editor(s) disclaim responsibility for any injury to people or property resulting from any ideas, methods, instructions or products referred to in the content.