


Featured Application
A computer-aided prognosis system for cardiovascular diseases can be a valuable tool for primary health care. Even users without medical expertise can utilize such tools to screen cardiovascular disease risk early, hence decongesting the National Healthcare Service.
Abstract
Coronary artery disease (CAD) remains a leading cause of morbidity and mortality worldwide, emphasizing the need for early and scalable risk stratification approaches. While recent Machine Learning (ML) studies have reported high diagnostic performance using multimodal clinical, laboratory, imaging, and genetic data, they do not provide early screening or prognosis. In this study, we investigate the extent to which CAD prognosis can be achieved using lifestyle and medical history variables alone. We pooled a cohort of 571 participants with and without CAD and evaluated multiple ML models, including Random Forest, CatBoost, AdaBoost, XGBoost, TabPFN, and k-Nearest Neighbors, using 10-fold cross-validation. Across models, predictive performance converged in a narrow range (72–76% accuracy), with the best-performing models reaching approximately 76% accuracy, compared to a clinician baseline of 78.8%. To enhance transparency and clinical interpretability, we further outline an explainability analysis for the top-performing model using SHAP-based approaches. Overall, this work highlights both the potential and the limitations of lifestyle-based ML models for CAD prognosis and supports their role as complementary tools for early screening and preventive cardiology.
1. Introduction
Cardiovascular diseases (CVDs) remain the leading cause of death globally, representing a persistent public health crisis. The World Health Organization reports that approximately 19.8 million people died from CVDs in 2022, accounting for 32% of all global deaths [1,2]. As of 2023, there were 437 million disability-adjusted life years (DALYs) globally due to CVD—a 1.4-fold increase from 320 million in 1990 [3]. Alarmingly, projections suggest a 90% increase in cardiovascular disease prevalence and 73.4% increase in crude mortality between 2025 and 2050 [4]. Among CVDs, coronary artery disease (CAD) is among the most frequently diagnosed and a principal driver of mortality. Early identification of individuals at elevated risk is critical for implementing timely preventive strategies.
The economic burden is equally substantial. In the United States, CAD contributes to an estimated $140 billion in annual CVD-related healthcare expenditures, with 10-year cumulative costs per patient exceeding $23,000, of which 78% is attributed to medication management [5,6]. This dual burden—in lives and resources—is particularly acute in low- and middle-income countries (LMICs), where over three-quarters of CVD deaths occur [1]. In resource-constrained settings where access to advanced diagnostics is limited, preventive care must rely on readily available clinical and lifestyle information. Targeted early interventions based on accurate risk stratification can substantially reduce downstream costs. Understanding the prognostic capacity of simple, universally available data is therefore essential for informing equitable, globally scalable prevention strategies.
Traditional CAD risk assessment tools, such as the Framingham Risk Score [7], SCORE [8], and ASCVD risk estimator [9], rely on relatively simple demographic and clinical variables. While these models have been widely adopted in clinical practice, their predictive performance is moderate, with discrimination (C-statistics/AUC) typically in the range 0.70–0.80 and sensitivity/specificity values that vary substantially by cohort and risk threshold [10]. As such, they may fail to capture complex, nonlinear interactions among risk factors. In response to these limitations, ML techniques have increasingly been applied to cardiovascular risk prediction and CAD prognosis, often demonstrating improved discrimination, with pooled C-statistics around 0.77–0.80 and statistically significant gains over traditional scores in meta-analyses [10]. Recently, Artificial Intelligence (AI) has significantly supported healthcare intervention decisions via customized Medical Decision Support Systems (MDSS) [11]. Several models based on boosted trees, random forests, and straightforward Deep Learning (DL) have provided highly accurate predictions for multi-parameter and complex designs in medicine [12].
As shown in Table 1, a substantial body of recent studies has explored the application of ML techniques for the prediction and diagnosis of CAD, reporting a wide spectrum of predictive performance depending on dataset size, feature composition, and modeling strategy. Recent reviews and comparative studies indicate that ML-based CAD models typically achieve accuracies ranging from approximately 70% to over 95%, with the highest values most frequently reported in studies incorporating multimodal inputs such as cardiac imaging, laboratory biomarkers, or advanced physiological signals [13,14,15,16]. In large-cohort settings, where datasets exceed several hundred or thousands of patients, reported accuracies are generally more modest, often below 85%, reflecting increased heterogeneity and more realistic clinical conditions [14,17]. Contemporary studies have employed a variety of ML approaches, including ensemble methods, support vector machines, and deep learning architectures, frequently combining structured clinical variables with imaging modalities such as SPECT, PET, or coronary computed tomography angiography (CCTA) to enhance diagnostic performance [15]. Notably, recent longitudinal investigations using multimodal ML frameworks have demonstrated improved long-term outcome prediction—such as all-cause mortality or major adverse cardiac events—when combining imaging and clinical data, compared to the use of either modality alone. While these studies highlight the potential of ML to enhance CAD-related prediction tasks, they predominantly focus on diagnosis or outcome prediction using rich, high-dimensional data, leaving open the question of how much prognostic information can be extracted from simpler, lifestyle- and history-based variables alone.
Table 1.
Selected machine-learning studies on CAD-related prediction and comparison with the present work.
However, the majority of contemporary ML-based CAD studies integrate rich and heterogeneous data sources, including laboratory biomarkers, electrocardiographic signals, cardiac imaging, and even genomic or polygenic risk scores. Although these approaches can yield high predictive accuracy, they are often expensive, invasive, and unsuitable for early screening or deployment in low-resource settings. Consequently, there is a growing interest in understanding the predictive value of simpler, low-cost data sources that are universally available in routine clinical encounters [7,18,19,20].
An important and underexplored question is therefore: how much prognostic information regarding CAD is contained in lifestyle and medical history variables alone? Addressing this question is essential for defining the realistic limits of ML-based risk prediction under constrained information settings and for guiding the development of scalable prevention-oriented tools. In this study, we systematically evaluate multiple ML models for CAD prognosis using exclusively lifestyle and historical clinical variables and compare their performance to a clinician baseline. Furthermore, we propose an explainability framework to elucidate the contribution of individual risk factors in the top-performing models. This is paramount as ML systems that are not interpretable may be viewed as untrustworthy by patients and healthcare professionals [21,22,23], and they might also fall short of regulatory requirements that mandate clear explanations for automated decision-making systems [24].
The remainder of this paper is structured as follows. Section 2 details the patient dataset, the ML algorithms employed for classification, and the procedures used to evaluate the results. Section 3 describes the experimental methodology and presents the obtained results. Section 4 provides a comparative discussion of the proposed models, highlighting their performance, strengths, and limitations in relation to existing studies. Lastly, Section 5 offers concluding remarks along with potential directions for future research.
2. Materials and Methods
The methodology of this research was executed in a Linux environment, specifically on a system equipped with a 14-core i5 CPU, 32 GB DDR4 RAM, RTX-3060 GPU and running Ubuntu 20.04 LTS. Python v3.11.0 served as the primary programming language for the ne e project, complemented by various machine learning-specific libraries such as sklearn and torch.
2.1. Patient Population
Patient data were retrospectively collected from the Clinical Sector of the Department of Nuclear Medicine at the University Hospital of Patras over the period from 16 February 2018 to 28 February 2022. The study protocol was reviewed and approved by the Ethical and Research Committee of the University General Hospital of Patras (protocol number 108/10-3-2022). Due to the retrospective design of the study, the requirement for informed consent was waived. All data were processed in an anonymized manner, and the study was conducted in full compliance with the principles outlined in the Declaration of Helsinki.
The study cohort comprised 571 individuals, of whom 248 patients (43.43%) were confirmed to have CAD based on invasive coronary angiography (ICA), while the remaining participants were healthy. The dataset exhibited considerable heterogeneity across clinical characteristics. From a demographic perspective, 79.68% of the participants were male, with ages spanning 32 to 90 years. Body mass index (BMI) values ranged widely, from 16.53 kg/m2, corresponding to underweight status, to 87.2 kg/m2, indicative of extreme obesity. As depicted in Table 2, the dataset utilized by this study focuses solely on lifestyle and historical features. It does not include the medical expert’s opinion or any clinical test results.
Table 2.
Features used as input by prediction models, after binary normalization. This dataset is a derived form of the original used in [25].
All individuals included in the study underwent gated single-photon emission computed tomography (SPECT) myocardial perfusion imaging (MPI) as part of their diagnostic evaluation and subsequently received invasive coronary angiography within a 60-day interval following MPI. ICA represents the current clinical gold standard for the definitive assessment of CAD and was therefore used as the ground truth for CAD status in this study.
Participants were consecutively enrolled from the Clinical Sector of the Department of Nuclear Medicine, University Hospital of Patras, among patients undergoing evaluation for suspected coronary artery disease. Accordingly, the cohort reflects a referred, clinically pre-selected population rather than an unselected screening sample. Invasive coronary angiography (ICA) served as the reference standard for the outcome label (CAD vs. no CAD). Although most patients were clinically suspicious for CAD at referral, ICA confirmed disease in 43.4% of cases (248/571); the remaining 56.6% (323/571) were classified as healthy by the reference standard. This distribution underscores that referral indication alone does not equate to anatomically significant CAD.
The primary objective of this work was to determine whether lifestyle-related and clinical predisposing factors alone (without symptom descriptors or imaging-derived scores) carry prognostic information for ICA-defined CAD in this referred cohort.
2.2. Data Preprocessing
Given that the majority of features included in the dataset are categorical in nature, the problem formulation naturally lends itself to a binary classification framework. Most features are inherently binary, indicating the presence or absence of specific conditions or characteristics (e.g., diabetes status, biological sex). However, two variables—age and BMI—were originally represented as continuous values and therefore required appropriate transformation to align with the binary modeling approach.
To discretize age, participants were stratified into four categorical groups. This stratification was guided by established clinical knowledge indicating that the incidence of CAD increases markedly between the ages of 40 and 60 years [26]. Although substantial heterogeneity exists within this age interval, age alone is generally considered a less discriminative factor for CAD in individuals younger than 40 or older than 60 [27]. Accordingly, age was encoded into four mutually exclusive categories: <40 years, 40–50 years, 50–60 years, and >60 years.
For BMI categorization, we adopted the classification scheme proposed by the WHO [28]. BMI values were grouped into three non-overlapping categories: underweight, normal weight, and obese. Additional subclassifications within the obese category (e.g., moderate, severe, or morbid obesity) were not considered, as previous evidence suggests that such granularity does not meaningfully improve discrimination for CAD-related outcomes [29].
The outputs of all ML models were evaluated against the results of invasive coronary angiography, which represents the clinical gold standard for assessing coronary artery patency. ICA is an X-ray-based imaging technique used to visualize coronary blood flow and is most commonly employed in patients with suspected acute coronary syndromes or myocardial infarction.
2.3. ML Algorithms
Random Forest, CatBoost, AdaBoost, XGBoost, TabPFN, and k-Nearest Neighbors represent the set of ML classification methods investigated in this work. These algorithms have been widely employed in the cardiovascular research community and shown to provide competitive performance in predicting CAD and related outcomes across various clinical datasets. Ergo, their utility has been demonstrated for structured clinical risk prediction tasks [25,30,31,32,33,34].
Random forest [35] is a supervised ML method belonging to the family of ensemble tree-based algorithms. It operates by constructing a collection of decision trees during training and is applicable to both classification and regression tasks. Each decision tree independently generates a prediction, and the final model output is determined through an aggregation process. In classification problems, the predicted class corresponds to the outcome receiving the highest number of votes across all trees, thereby improving robustness and reducing the risk of overfitting compared to a single decision tree.
CatBoost [36] is a gradient boosting-based supervised ML algorithm that constructs an ensemble of decision trees in a sequential manner. Unlike traditional boosting methods, CatBoost is specifically designed to handle categorical features effectively and to mitigate prediction bias through ordered boosting techniques. During training, each successive tree is optimized to correct the errors made by the previous ensemble, leading to progressively improved predictive performance. CatBoost supports both classification and regression tasks and is known for its strong performance on structured clinical datasets, often requiring minimal preprocessing while maintaining robustness against overfitting.
Adaptive Boosting [37], commonly referred to as AdaBoost, is an ML algorithm for classification introduced by Yoav Freund and Robert Schapire in 1995. It is primarily used for binary classification tasks. AdaBoost works by combining the outputs of multiple “weak learners” into a weighted sum, which forms the final prediction of the boosted model. The algorithm adjusts subsequent weak learners to focus more on instances that were misclassified by earlier learners. Decision Trees are frequently employed as the weak learners in AdaBoost. The method is considered adaptive because it iteratively emphasizes the harder-to-classify examples. In certain situations, AdaBoost can be less prone to overfitting compared to other algorithms. Even though individual learners may perform only slightly better than random chance, the ensemble can theoretically be proven to produce a strong overall model.
XGBoost [38], short for Extreme Gradient Boosting, is a powerful ML algorithm designed for classification and regression tasks. It is an advanced implementation of gradient boosting, introduced by Tianqi Chen in 2014, which builds an ensemble of decision trees in a sequential manner. Each new tree is trained to correct the errors of the previous trees, with the goal of minimizing a specified loss function. XGBoost incorporates regularization techniques, such as L1 and L2 penalties, to reduce overfitting and improve model generalization. It is highly efficient and scalable, capable of handling large datasets while offering parallel and distributed computing options. Even though individual trees are weak predictors, the algorithm combines them iteratively to form a strong and accurate overall model, often outperforming other boosting methods.
TabPFN (Tabular Prior-Data Fitted Network) [39] is an ML model specifically designed for handling tabular datasets in classification and regression tasks. Unlike traditional algorithms that train a new model from scratch for each dataset, TabPFN is a pre-trained transformer-based foundation model that performs in-context learning—it processes a new dataset in a single forward pass without costly per-dataset training or hyperparameter tuning. During its offline pre-training, TabPFN is exposed to millions of synthetic tabular datasets generated from a rich prior over structural causal models, enabling it to learn a general inference strategy that approximates Bayesian posterior predictive distributions. When presented with a small to medium tabular dataset, the model applies attention mechanisms across both samples and features to capture relationships and make predictions quickly and accurately. This approach often yields competitive or superior performance compared to traditional boosted tree ensembles and other AutoML methods, especially on smaller datasets where conventional models struggle with tuning and overfitting.
The working theory behind K-nearest neighbors [40] revolves around the k parameter. This parameter is used to assign the number of nearest neighbors that are tested for similarity to the new input with the use of a distance function. For instance, for k = 2, the algorithm assigns to a new instance the label that minimizes its distance from 2 of its neighbors.
2.4. Results Evaluation
This study involves evaluating the top-performing prediction models generated by each ML classifier and selecting the most effective one. To assess performance, we employed widely used metrics: accuracy, sensitivity, specificity, and the confusion matrix. These metrics measure model performance by analyzing the relationships among True Positive (TP), True Negative (TN), False Positive (FP), and False Negative (FN) predictions.
Accuracy is one of the most commonly used metrics for evaluating ML model performance. It represents the proportion of correctly predicted instances out of the total number of cases and is calculated as follows:
Accuracy = (TP + TN)/(TP + TN + FP + FN)
Sensitivity (also called recall) measures the percentage of correctly predicted positive instances—in this case, patients with CAD. It quantifies how well the model identifies all actual positive cases and is expressed as:
Sensitivity = TP/(TP + FN)
Specificity, in contrast, measures the proportion of correctly predicted negative instances, reflecting how accurately the model identifies healthy individuals. It is calculated as:
Specificity = TN/(TN + FP)
The confusion matrix provides a summary of the model’s classification results. For binary classification problems such as this study, it is a 2 × 2 table consisting of TP, TN, FP, and FN, structured as follows:
| Actual\Predicted | Positive (PP) | Negative (PN) |
| Positive (P) | TP | FN |
| Negative (N) | FP | TN |
Each ML algorithm’s predictions were evaluated using 10-fold stratified cross-validation. The cross-validated predictions were then used to calculate the performance metrics for each model, which are reported in the Section 3.
The expert’s verdict, which serves as a benchmark with an accuracy of 78.81%, is based on a comprehensive evaluation that includes all clinical data, multiple medical tests, and imaging such as SPECT/PET scans, alongside years of theoretical knowledge and practical experience. In contrast, the models in this study rely solely on lifestyle and other limited features and do not have access to the full spectrum of information available to the medical expert.
Beyond aggregate cross-validation metrics, we analysed out-of-fold misclassifications from the best-performing model (Random Forest, 10-fold stratified cross-validation). Each patient was labelled as correctly classified, false negative (FN; ICA-defined CAD predicted as no CAD), or false positive (FP; no CAD predicted as CAD). For each group we summarised the prevalence of predisposing factors (CAD history, previous AMI, PCI, CABG, stroke, diabetes, smoking), recurrent diseases (chronic kidney disease, family history of CAD), and demographics (sex, BMI category, age category). Sex-stratified accuracy was reported because of cohort imbalance (79.7% male).
2.5. Results Interpretation
In this study, the highest-performing prediction model is analyzed to provide insight into its outputs. This step enhances transparency and helps users understand the model’s decision-making process, increasing trust and reliability. Most AI systems are often considered “black boxes,” which can reduce confidence, particularly when they produce unexpected results. By making the prediction tool more interpretable and clarifying how it generates predictions, we aim to improve user confidence and acceptance.
To achieve this, we apply two main interpretability techniques: Cohen’s effect size and SHAP values. Cohen’s effect size is a statistical metric that quantifies the magnitude of difference between two groups. It is calculated by dividing the difference between group means by the pooled standard deviation. According to Cohen (1988) [41], effect sizes of 0.2, 0.5, and 0.8 are typically considered small, medium, and large, respectively. This metric is widely used across disciplines such as psychology and medicine to assess the practical significance of experimental results and to facilitate comparisons with previous studies.
SHAP (SHapley Additive exPlanations) analysis [42], on the other hand, is a widely adopted method for enhancing model transparency. Drawing on concepts from cooperative game theory, SHAP treats each feature as a “player” in a game, with the model’s prediction as the outcome. The method distributes the prediction’s contribution among all features, assigning each an importance value based on how much it influenced the final prediction. This approach allows for a clear understanding of which features are driving individual predictions.
3. Results
Model evaluation was performed using 10-fold stratified cross-validation, and performance was assessed based on accuracy, sensitivity, specificity, and confusion matrix analysis. Parameters for all models are shown in Appendix A Table A1.
3.1. Model Metrics
Table 3 and Table 4 summarize the performance metrics achieved by each model when trained on the complete feature set. The Random Forest and CatBoost classifiers achieved the highest overall testing accuracy (76.21% and 76.18% respectively), closely followed by AdaBoost (76.01%), TabPFN (75.66%), and XGBoost (75.48%). The KNN classifier demonstrated the lowest accuracy among the evaluated models (72.50%).
Table 3.
Metrics scores achieved by the models (best values are formatted in bold).
Table 4.
Confusion matrix components for the evaluated models on the test set (best values are formatted in bold).
Overall, Random Forest and CatBoost demonstrated the most balanced performance across all metrics, achieving strong accuracy while maintaining reasonable sensitivity and specificity. AdaBoost also showed competitive results, particularly in sensitivity. Although TabPFN and XGBoost performed comparably, they did not surpass the ensemble-based tree methods. KNN, despite its high specificity, was limited by its low sensitivity, making it less suitable for CAD prediction where minimizing false negatives is critical.
3.2. Interpretation of Best-Performing Model
Based on the comparative analysis of the six ML classifiers, the RF model was selected for further interpretation due to its superior testing accuracy of 76.21% and its balanced performance across sensitivity and specificity. To ensure the model’s predictions are transparent and clinically grounded, its decision-making process was analyzed using Cohen effect sizes and SHAP values.
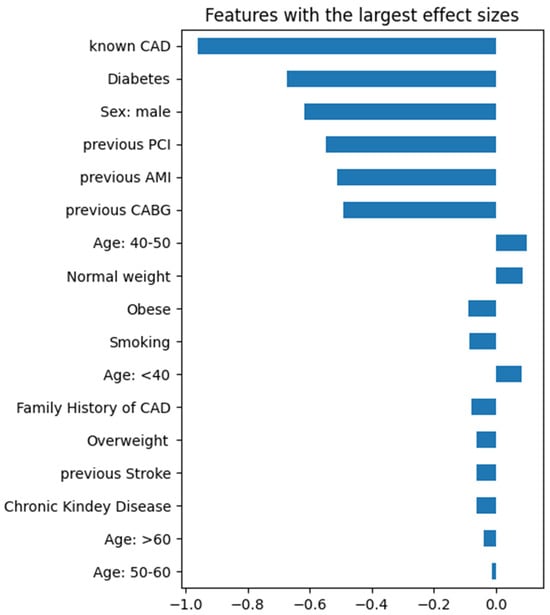
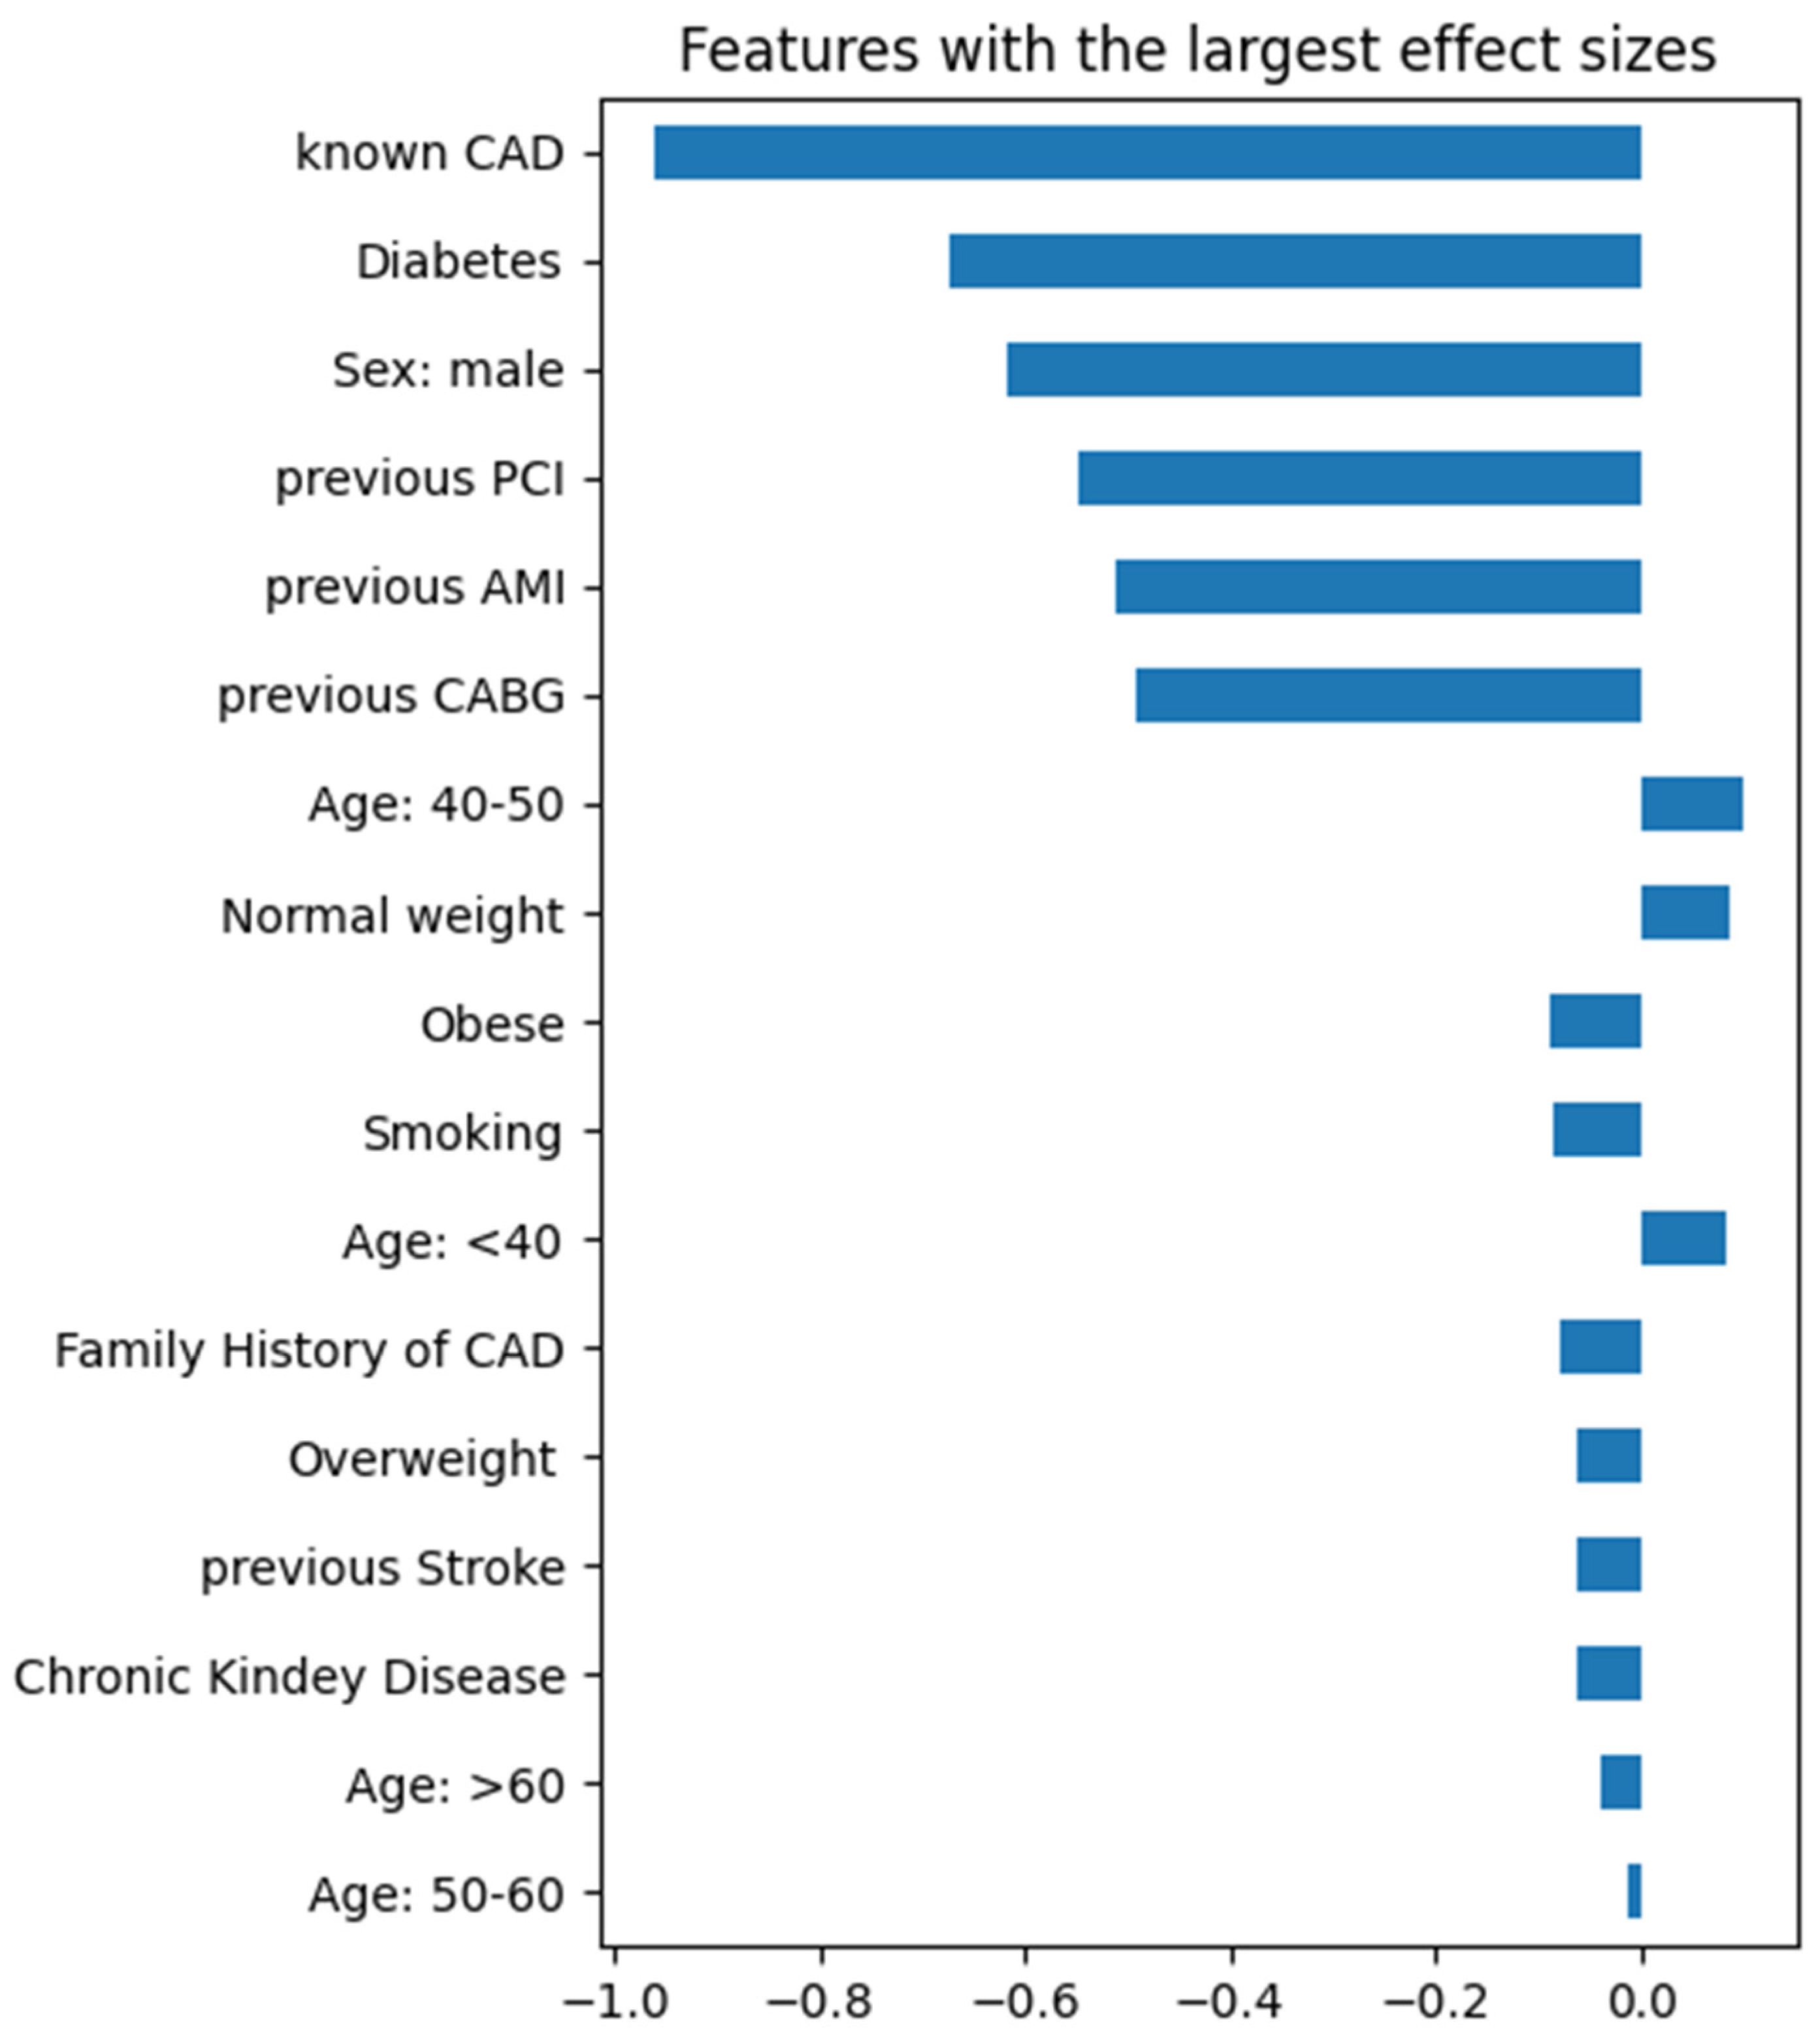
As shown in Figure 1, features related to clinical history and demographics exhibit the most significant magnitude of effect. Known CAD is the most influential predictor, followed by Diabetes, Sex: male, and previous cardiac procedures such as PCI, AMI, and CABG.
Figure 1.
Cohen’s d effect sizes for all features, sorted by absolute magnitude. Negative values indicate features more prevalent or higher in the CAD group, whereas positive values indicate features more prevalent or higher in the non-CAD group.
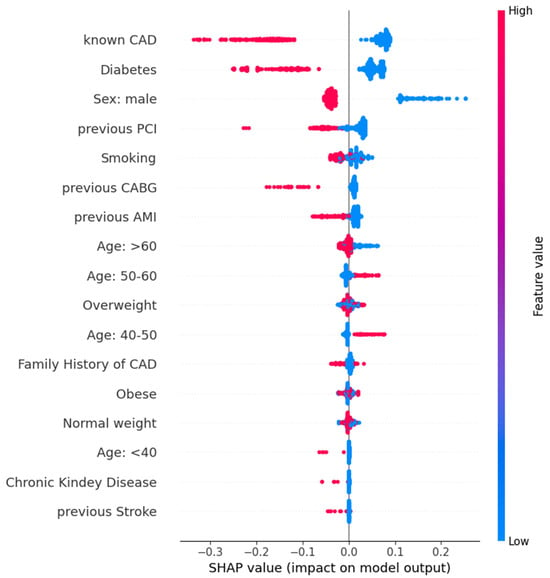
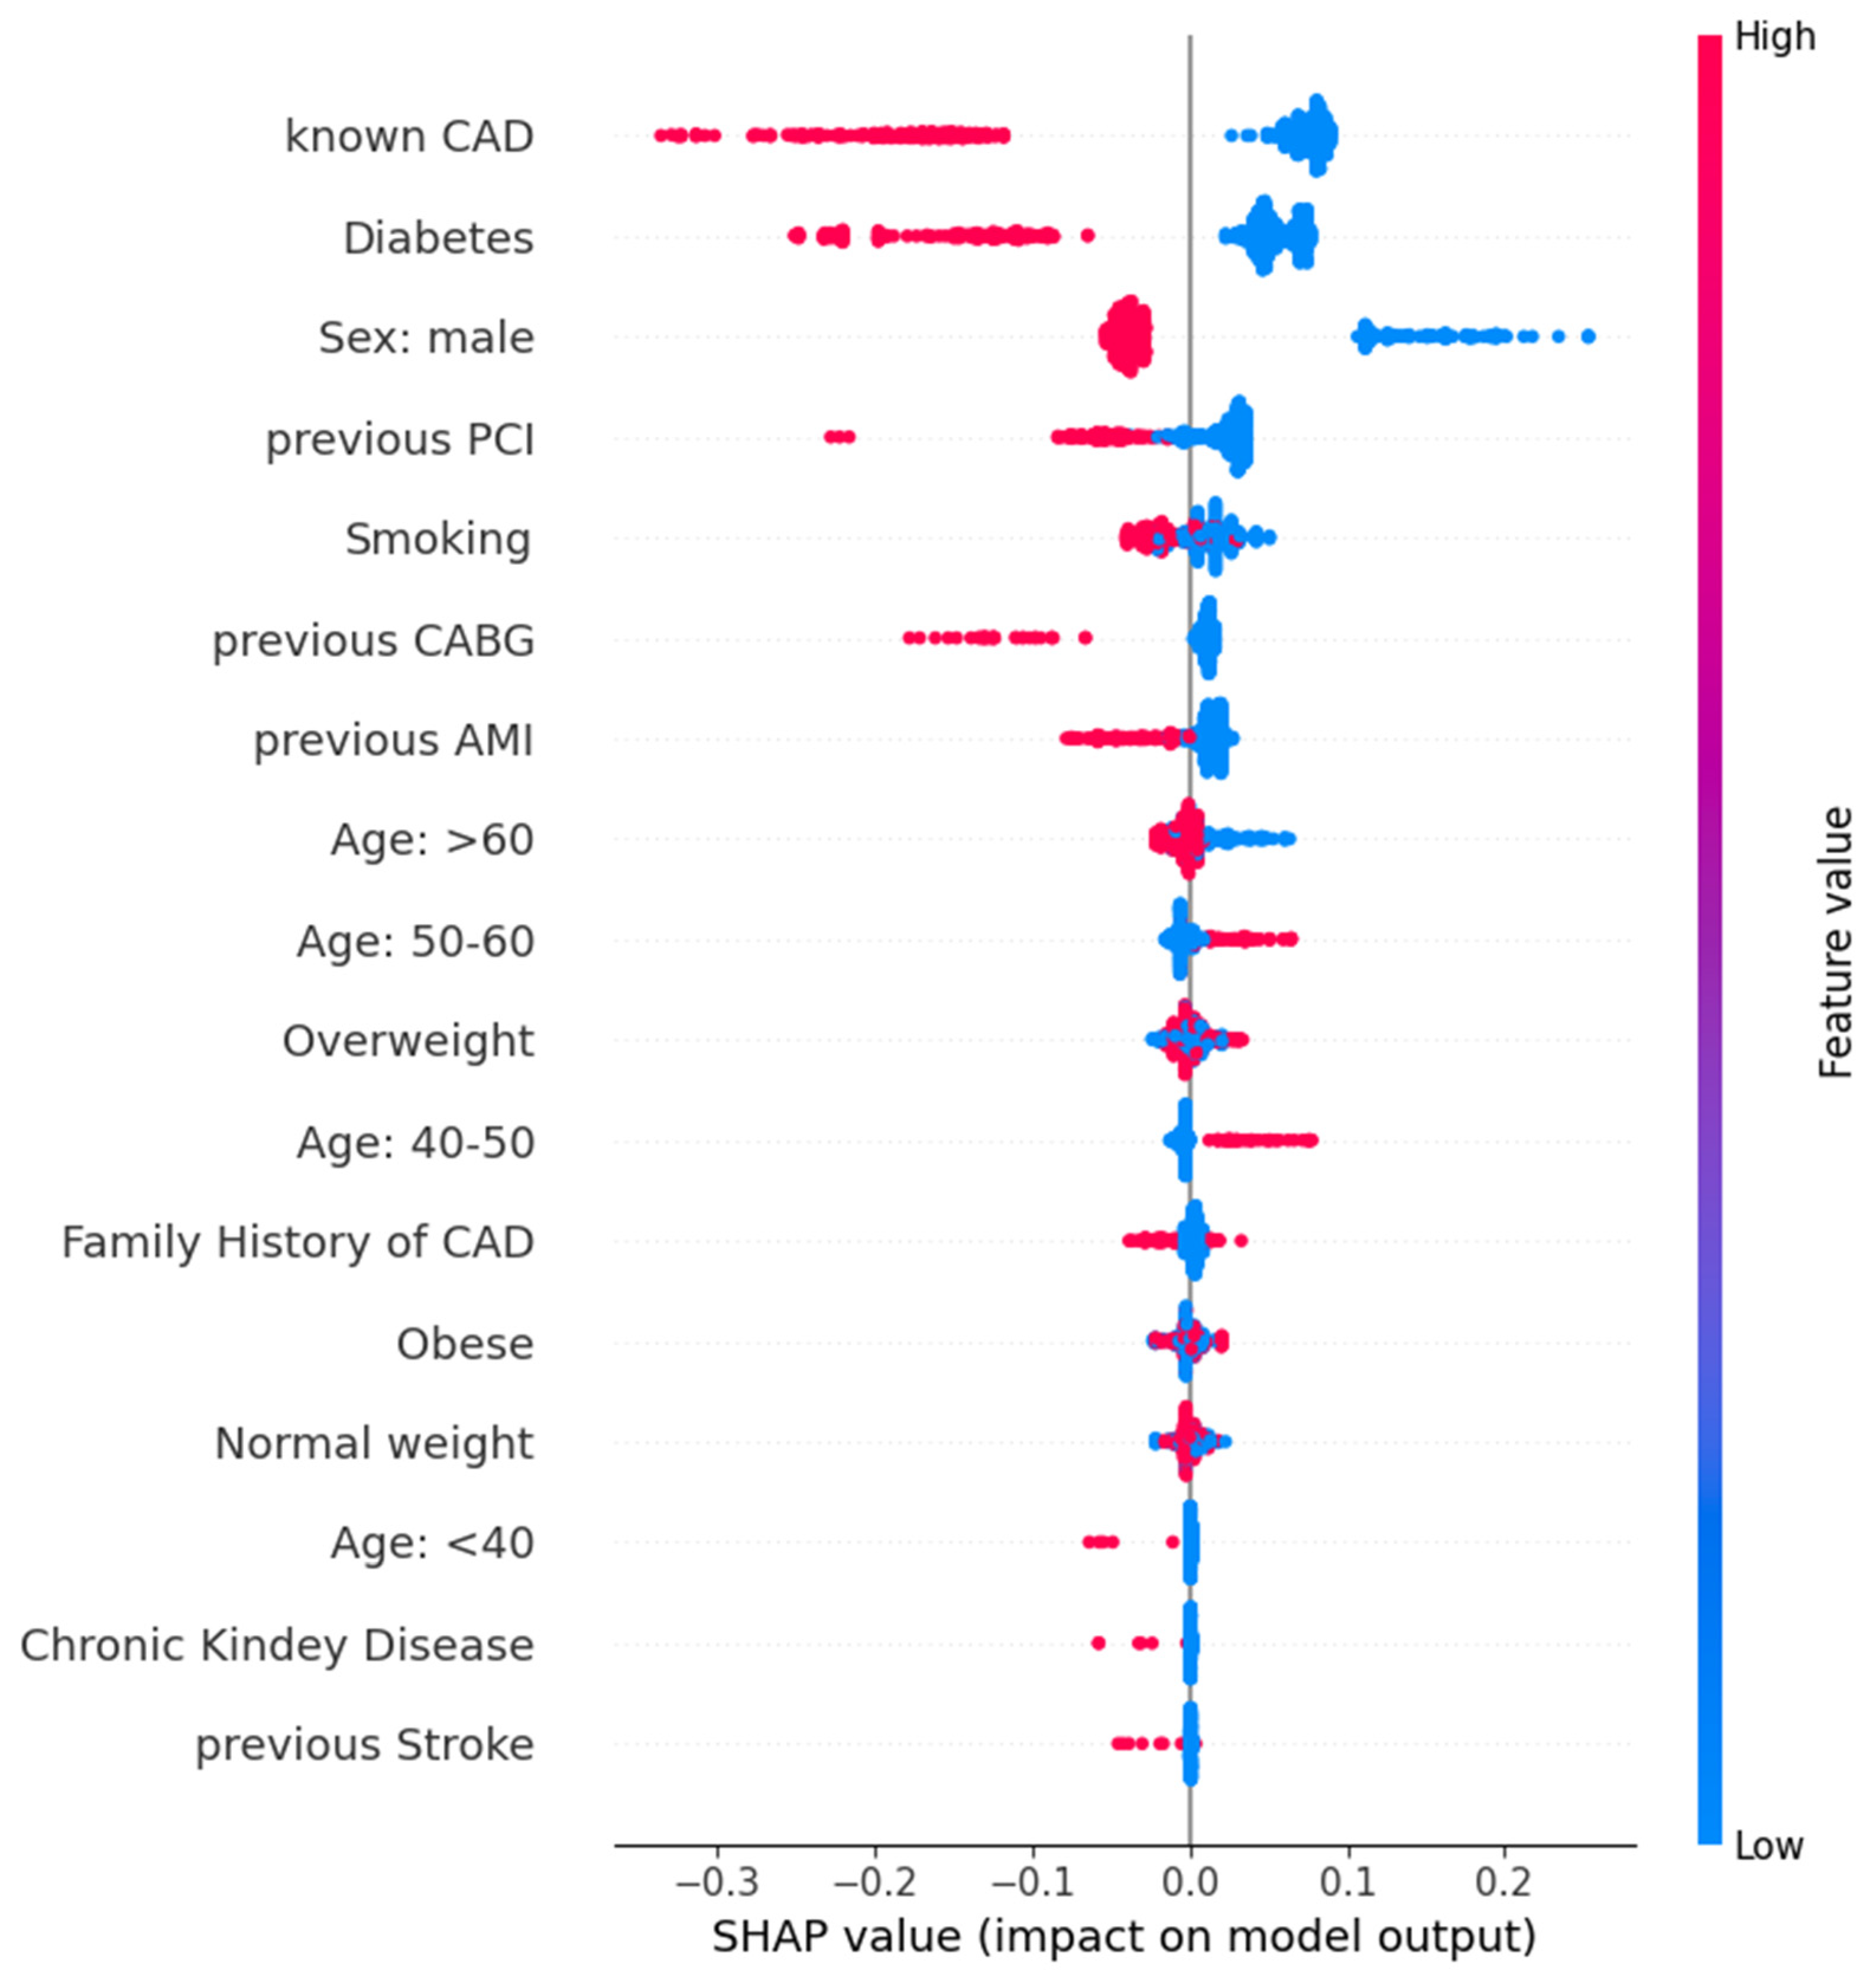
Figure 2 reinforces these findings, demonstrating that high values (represented in red) for known CAD, Diabetes, and Sex (male) are strongly associated with higher model output scores, thereby increasing the likelihood of a CAD diagnosis.
Figure 2.
SHAP summary plot depicting the relative importance of each.
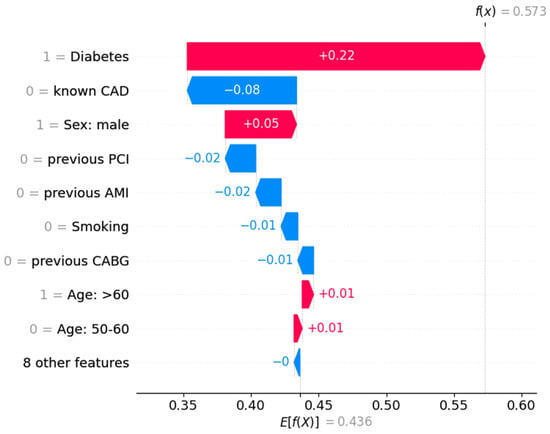
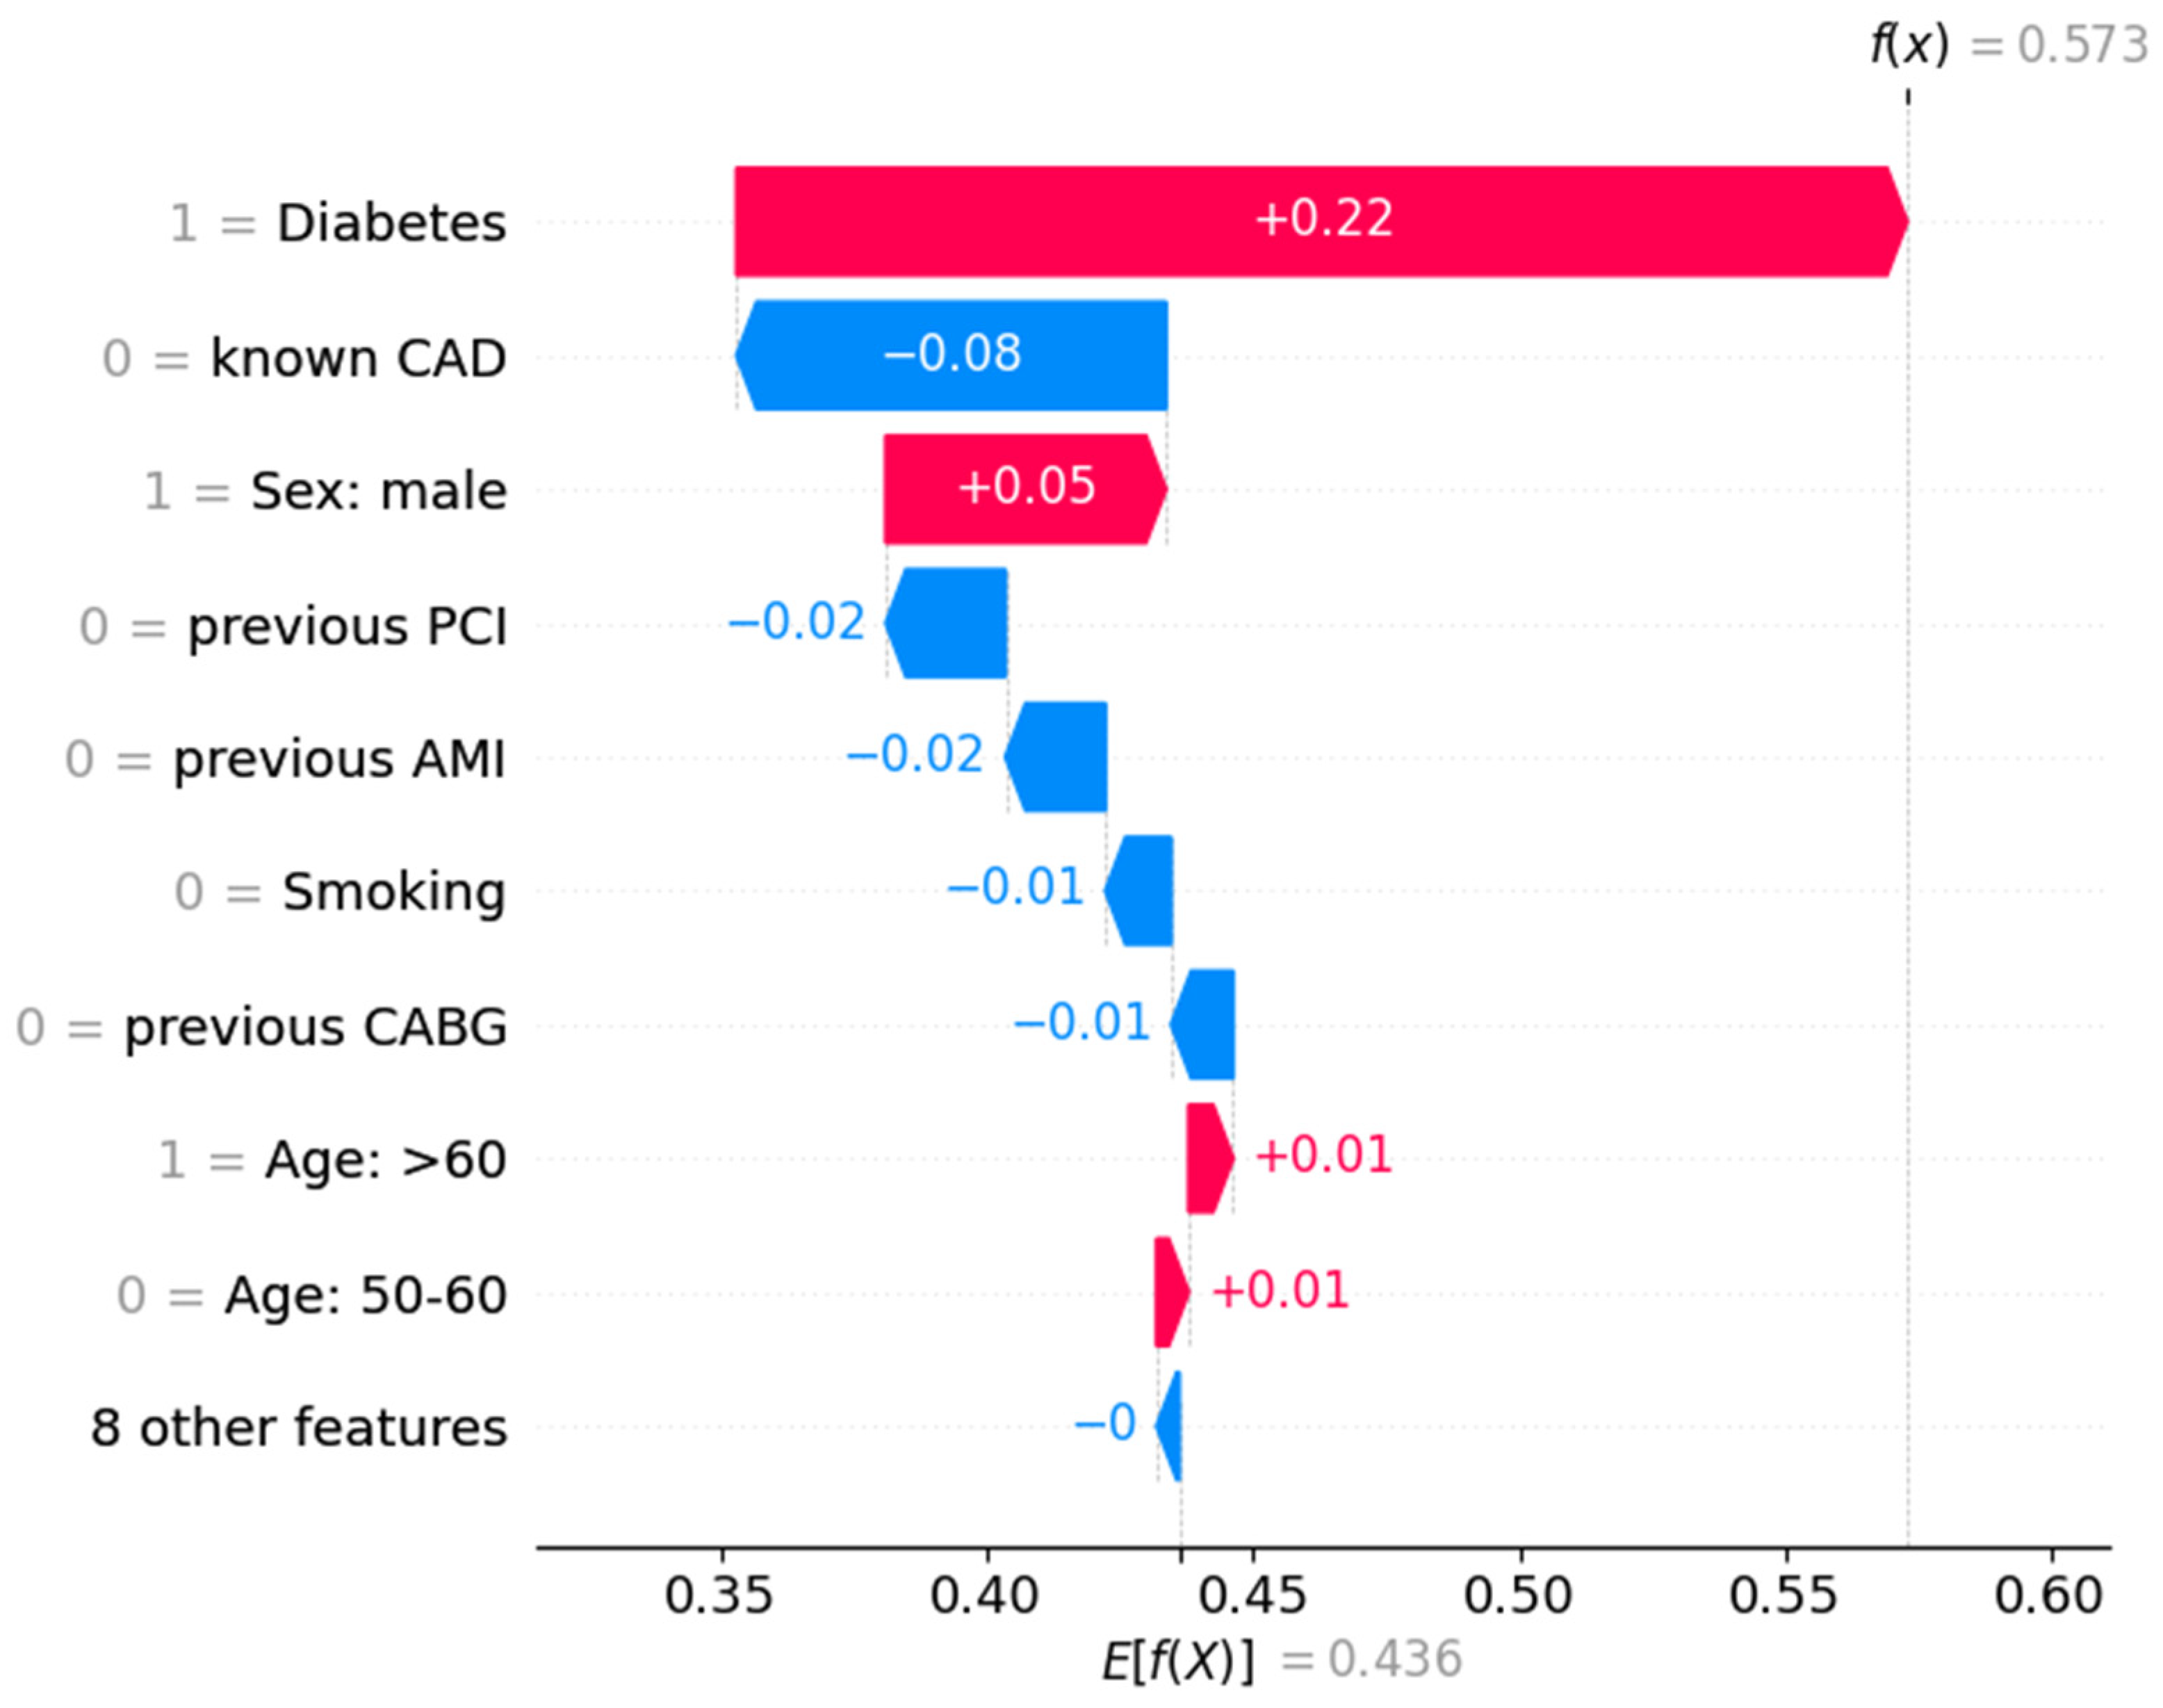
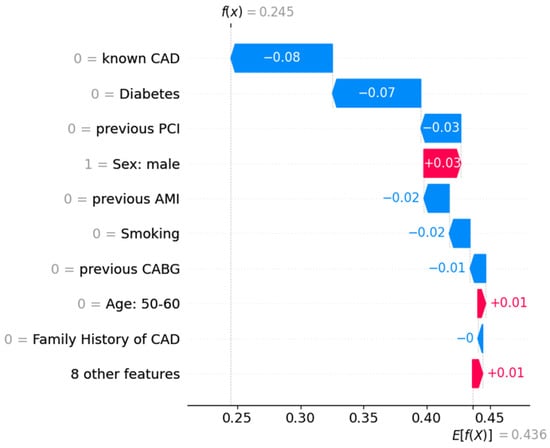
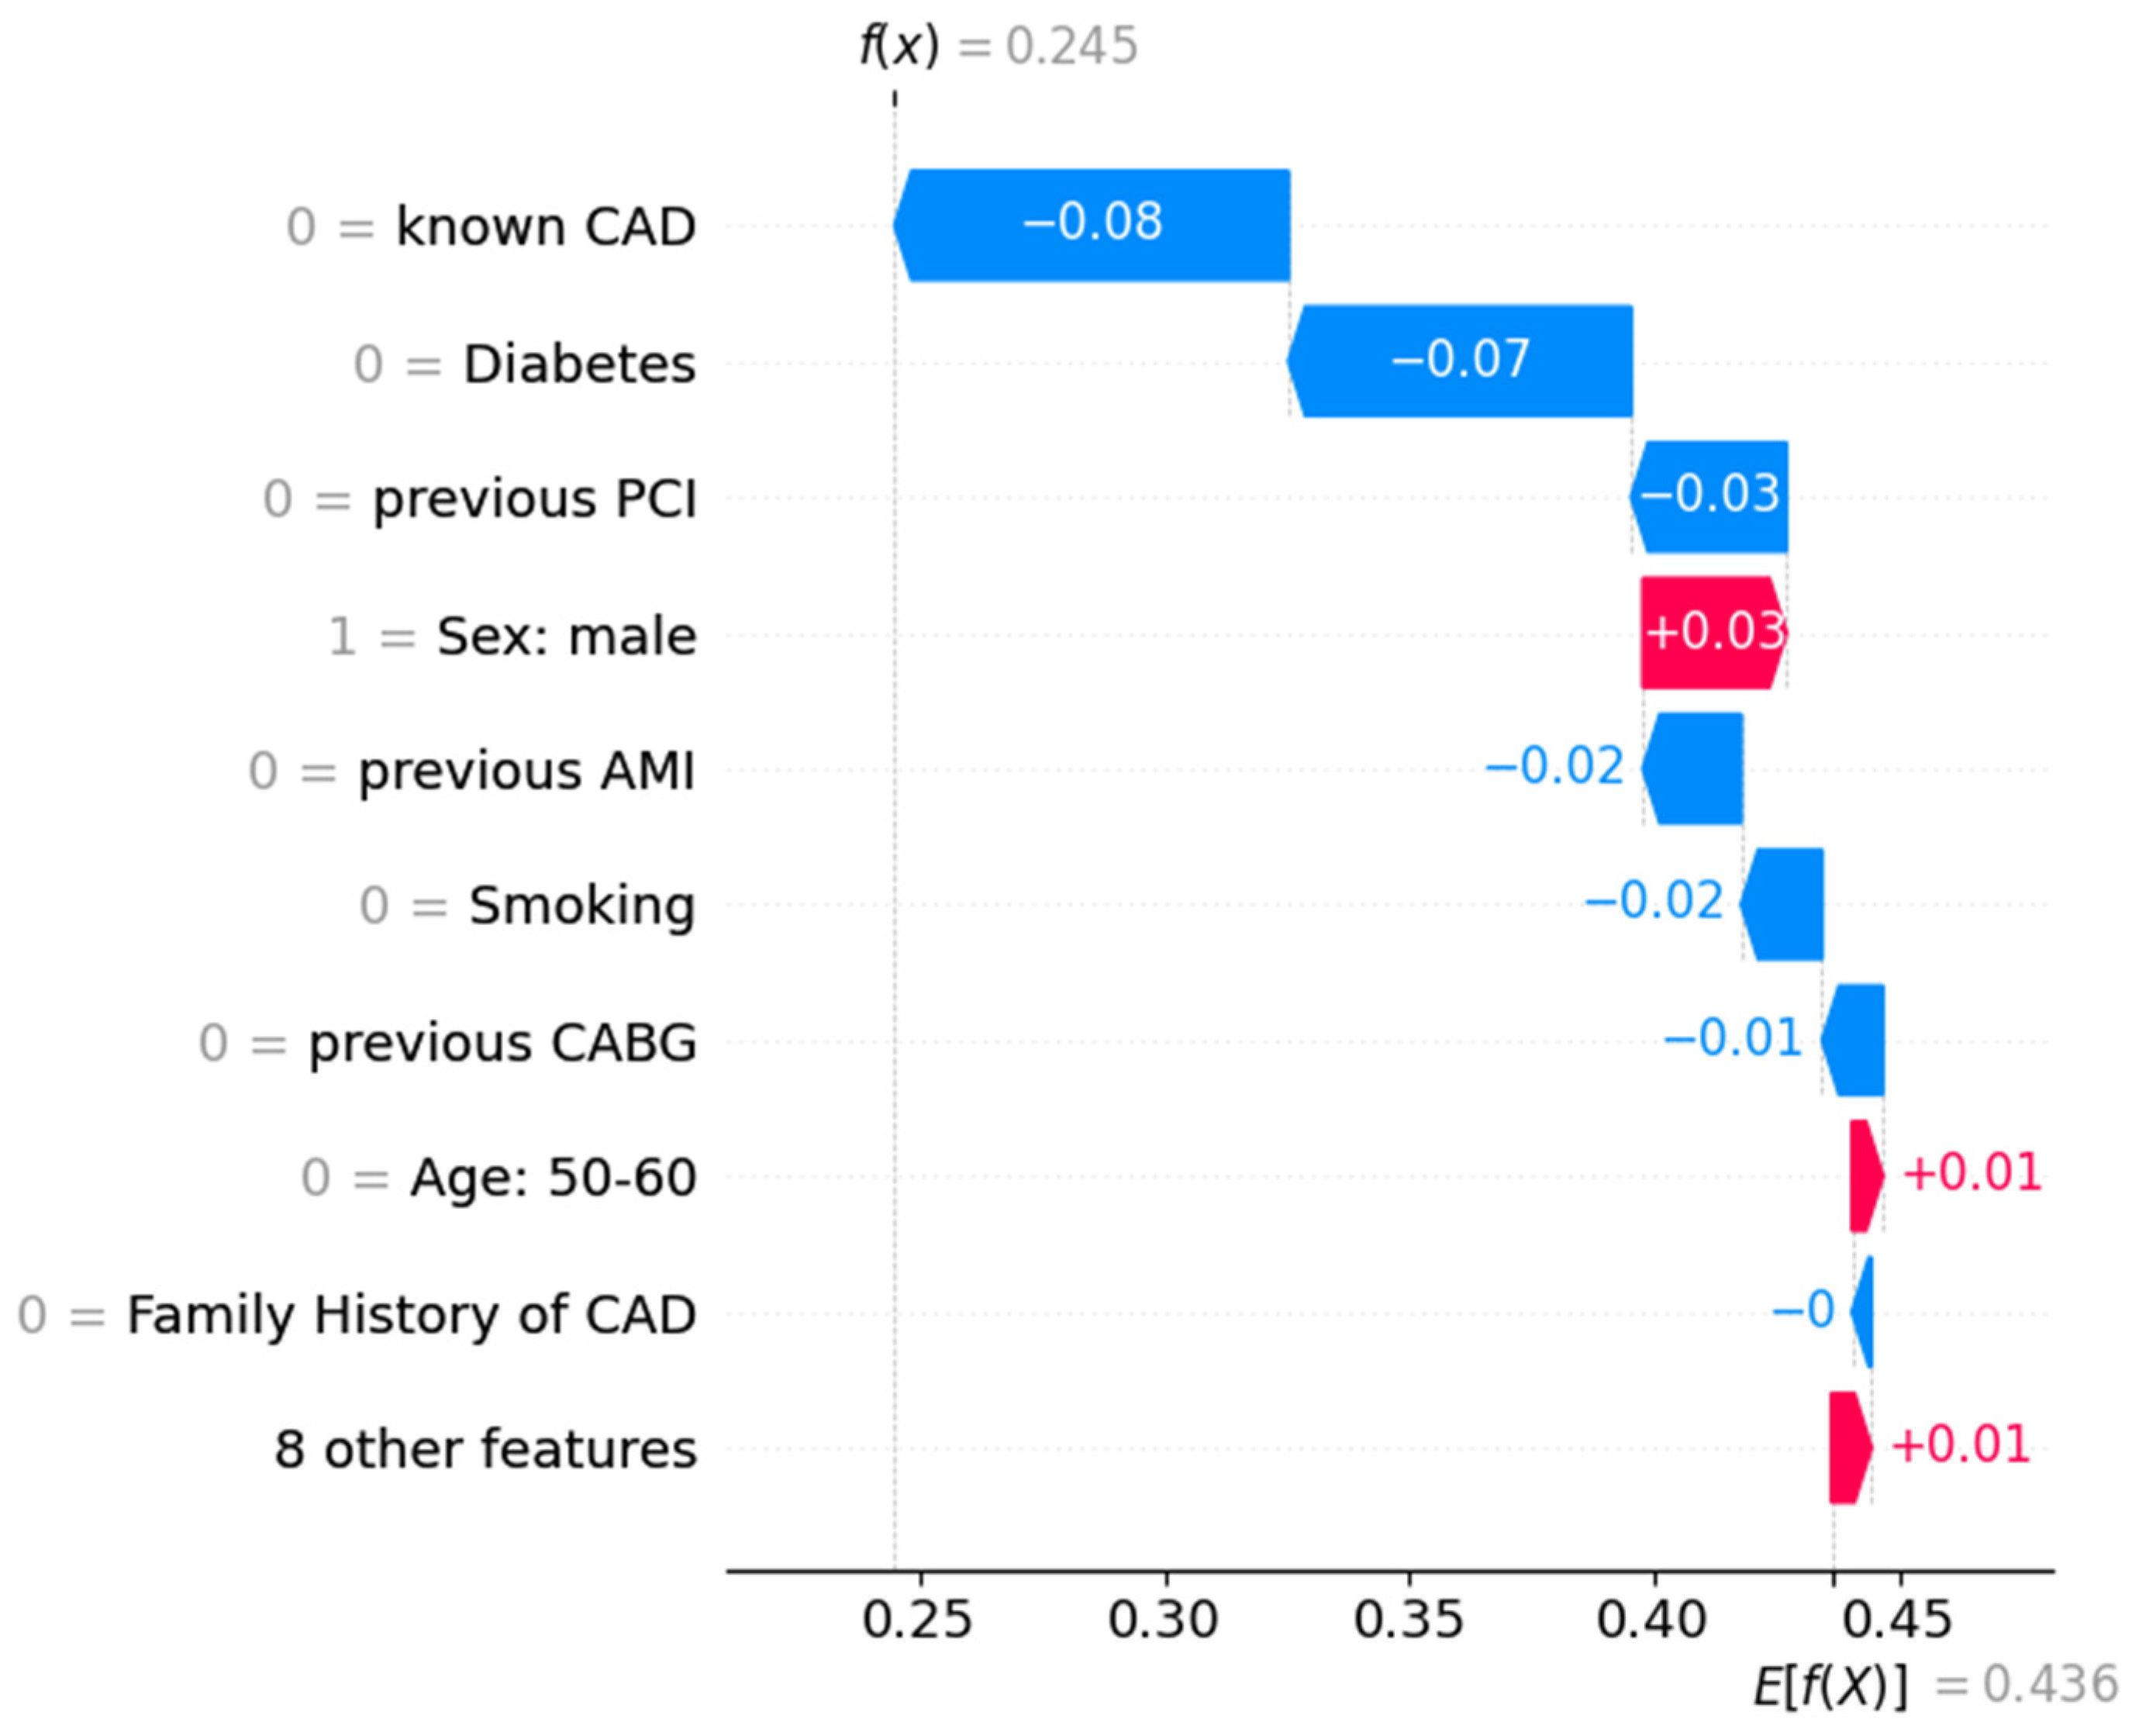
To understand how the Random Forest model arrives at individual classifications, waterfall diagrams were utilized. These diagrams illustrate how specific patient features shift the final prediction from a baseline expected value (E[f(x)]) of 0.436 toward a final score (f(x)). Predictions exceeding this threshold are classified as CAD, while those below it are categorized as NO-CAD.
In Figure 3, the model predicted a high probability of CAD with a score of f(x) = 0.573. The primary driver for this classification was the patient’s Diabetes status, which increased the risk score by +0.22. Additionally, being male and over the age of 50 contributed further positive increments to the final score. Even though the absence of a known CAD history provided a negative adjustment of −0.08, it was not enough to counter the weight of the other risk factors.
Figure 3.
SHAP waterfall diagram for a prediction of a CAD positive patient. The features that drove the model to this classification are listed in order of relative importance.
Conversely, Figure 4 displays a case where the model correctly identified a healthy patient with a low score of f(x) = 0.245. The most significant factors driving the score below the decision threshold were the absence of known CAD (−0.08) and the absence of Diabetes (−0.07). While the patient’s status as male provided a slight risk increase of +0.03, the cumulative effect of having no history of PCI, AMI, or CABG ensured a final negative prediction.
Figure 4.
SHAP waterfall diagram for a prediction of a healthy patient. The features that drove the model to this classification are listed in order of relative importance.
These interpretations confirm that the Random Forest model prioritizes established clinical risk factors, ensuring its logic aligns with standard medical diagnostic expectations for CAD.
3.3. Misclassification and Error Analysis
Of 571 patients, 135 (23.6%) were misclassified under out-of-fold evaluation (TN = 266, FP = 57, FN = 78, TP = 170). The FN rate among ICA-positive patients was 31.5% (78/248); the FP rate among ICA-negative patients was 17.7% (57/323). Positive predictive value was 74.9% and negative predictive value 77.3%. These findings are depicted in Table 4.
As shown in Table 5, False negatives (CAD undetected) FN patients (n = 78) were predominantly male (79.5%) and aged ≥60 years (62.8%). Compared with correctly classified patients, FN cases showed a markedly lower prevalence of documented CAD history (5.1% vs. 34.2%) and prior revascularisation (previous AMI 2.6% vs. 17.7%; previous PCI 5.1% vs. 21.3%; previous CABG 0% vs. 6.9%). Diabetes was also less frequent (12.8% vs. 25.0%), whereas smoking was more frequent (51.3% vs. 37.8%). Family history of CAD (21.8%) and chronic kidney disease (1.3%) were comparable to or slightly higher than in correctly classified patients. BMI and age distributions were broadly similar to the correctly classified group (normal weight 67.9%, overweight 48.7%, obese 32.1%; age ≥60 years 62.8%). These findings suggest that FN errors occur mainly in patients without a strong documented cardiovascular history, in whom predisposing clinical features may have insufficient weight relative to the ICA reference diagnosis.
Table 5.
Prevalence of clinical and demographic features among correctly classified and misclassified patients (Random Forest, out-of-fold predictions; values are % of patients within each group with the feature present).
False positives (healthy classified as CAD). FP patients (n = 57) were almost exclusively male (98.2%) and had a high burden of predisposing disease: CAD history 64.9%, previous AMI 40.4%, previous PCI 49.1%, previous CABG 5.3%, and diabetes 49.1%, all substantially above the correctly classified group. Smoking was reported in 52.6% of FP cases. Most FP patients were aged ≥60 years (64.9%). Family history of CAD (14.0%) was similar to that of correctly classified patients. FP errors therefore cluster in male patients with extensive prior coronary disease and metabolic risk, suggesting that historical cardiac events and comorbidities may drive CAD prediction even when the ICA reference classification is negative.
The correctly classified subset (n = 436) showed intermediate predisposing-factor rates (e.g., CAD history 34.2%, diabetes 25.0%, smoking 37.8%), consistent with a more balanced risk profile.
Regarding sex-stratified performance, out-of-fold accuracy was 74.1% in men (n = 455) and 85.3% in women (n = 116). FP cases were almost exclusively male; FN sex distribution reflected the cohort composition. These subgroup estimates should be interpreted cautiously given the limited number of women.
4. Discussion
The driving objective behind this research is multifaceted, while mainly focusing on the development of early and scalable risk stratification tools for CAD. A primary goal of this work is to investigate the extent to which accurate CAD prognosis can be achieved by relying solely on lifestyle and medical history variables, thereby offering a viable screening solution for low-resource clinical settings where complex diagnostic data may be unavailable. To this end, the study evaluated the performance of several ML models against established clinician baselines. Furthermore, this work prioritizes clinical transparency and interpretability by implementing a comprehensive explainability framework. This involves assessing the global impact of features through Cohen effect sizes and SHAP summary plots, as well as providing local model interpretations that illustrate how specific clinical factors drive individual risk predictions, as depicted in Figure 3 and Figure 4.
The findings demonstrate that ML models, particularly ensemble-based tree methods like Random Forest and CatBoost, can effectively predict CAD using clinical and demographic data. With the RF model achieving a peak accuracy of 76.21%, the results are encouraging. This could be a possible representation of an initial step toward integrating automated predictive tools into clinical workflows.
While the models achieved competitive metrics, it is essential to note that a direct comparison with physician performance may be limited in this context. Clinicians typically evaluate the entire clinical picture, incorporating holistic observations and patient history that may not be fully captured in the specific feature set provided to the ML models. Hence, the model should be viewed as a complementary tool to aid clinical decision-making rather than a replacement for expert medical judgment.
Misclassifications were not random: false negatives were associated with absent or minimal documented CAD history and revascularisation despite ICA positivity, whereas false positives occurred mainly in men with prior AMI/PCI, known CAD, and diabetes. These patterns indicate that the model relies heavily on predisposing clinical history and may under-represent ICA-confirmed disease in patients without prior documentation, supporting its role as an adjunct to—not a replacement for—invasive and clinical assessment in referred patients.
The interpretability analysis confirms that the best-performing model aligns with established medical knowledge [43,44,45,46,47]. The global feature importance metrics—both the Cohen effect sizes and the SHAP summary plot—consistently identify known CAD, Diabetes, Sex: male, and previous cardiac interventions (PCI, AMI, and CABG) as the most influential predictors (Figure 1 and Figure 2). This clinical grounding is further evidenced in local interpretations (Figure 3 and Figure 4). For instance, the presence of Diabetes can significantly “push” the model’s prediction toward a CAD diagnosis by adding as much as +0.22 to the risk score. Conversely, the absence of a known CAD history or Diabetes serves as a primary driver for classifying a patient as healthy.
A significant consideration regarding the utility of these models is the nature of the dataset. The data used for training and testing is not representative of the general population; rather, it reflects a specific subset of individuals who sought hospital care. These patients often presented due to minor symptoms, comorbidities, or age-related preventative concerns. Consequently, while the trained model is effective for evaluating symptomatic or high-risk hospital visitors, its performance may vary when applied to the broader, asymptomatic general population.
For these predictive tools to find broader application in population-wide screening or prognosis, further research is required. Future studies should focus on collecting data from more diverse, non-hospitalized populations to enhance generalizability. Moreover, incorporating a wider array of clinical features to more closely mirror the “full clinical picture” available to physicians.
In conclusion, the results of this study are a promising start. While recognizing the inherent limitations regarding population representation and the breadth of clinical data, the ability of models like Random Forest to prioritize established risk factors suggests they can play a valuable role in the early identification of CAD within clinical settings.
5. Conclusions
This study investigated the potential of using ML to predict CAD by relying exclusively on lifestyle and medical history variables. By evaluating six different classifiers, the research identified the Random Forest model as the most effective, achieving a peak testing accuracy of 76.21% and demonstrating balanced performance between sensitivity and specificity.
A key focus of this work was ensuring the transparency and interpretability of the model’s decisions in alignment with clinical expectations. Analysis of global feature importance through Cohen effect sizes and SHAP values revealed that known CAD, diabetes, and sex are the most influential factors in predicting CAD. Local interpretability demonstrated how individual predictions are calculated.
While the models performed slightly below the clinician baseline of 78.8%, the results are nevertheless encouraging. This research serves as a promising initial step, illustrating that interpretable ML models can function as effective screening tools in low-resource settings and act as a valuable complement to expert clinical judgment in preventive cardiology.
Author Contributions
Design and conduct of the study, A.-D.S.; data collection, I.D.A.; data processing, A.-D.S. and I.D.A.; manuscript preparation, A.-D.S. and I.D.A.; manuscript review, N.P. and E.P.; medical expertise, N.P. All authors have read and agreed to the published version of the manuscript.
Funding
The research project was supported by the Hellenic Foundation for Research and Innovation (H.F.R.I.) under the “2nd Call for H.F.R.I. Research Projects to support Faculty Members & Re-searchers” (Project Number: 3656).
Institutional Review Board Statement
This study was approved on 3 March 2022 by the ethical committee of the University General Hospital of Patras (Ethical & Research Committee of University Hospital of Patras—protocol number 108/10-3-2022). The requirement to obtain informed consent was waived by the director of the diagnostic center due to its retrospective nature.
Informed Consent Statement
Due to the retrospective design of the study, the requirement for informed consent was waived. All data were processed in an anonymized manner, and the study was conducted in full compliance with the principles outlined in the Declaration of Helsinki.
Data Availability Statement
The datasets used and/or analyzed during the current study are available from the corresponding author on reasonable request.
Conflicts of Interest
The authors declare no competing interests.
Abbreviations
The following abbreviations are used in this manuscript:
| AI | Artificial Intelligence |
| AMI | Acute Myocardial Infarction |
| ASCVD | Atherosclerotic Cardiovascular Disease |
| AUC | Area Under the Curve |
| BMI | Body Mass Index |
| CABG | Coronary Artery Bypass Grafting |
| CAD | Coronary Artery Disease |
| CatBoost | Categorical Boosting |
| CCTA | Coronary Computed Tomography Angiography |
| CVD | Cardiovascular Disease |
| CVDs | Cardiovascular Diseases |
| DL | Deep Learning |
| FN | False Negative |
| FP | False Positive |
| ICA | Invasive Coronary Angiography |
| KNN | K-Nearest Neighbors |
| MDSS | Medical Decision Support Systems |
| ML | Machine Learning |
| MPI | Myocardial Perfusion Imaging |
| PCI | Percutaneous Coronary Intervention |
| PET | Positron Emission Tomography |
| RF | Random Forest |
| SCORE | Systematic Coronary Risk Evaluation |
| SHAP | SHapley Additive exPlanations |
| SPECT | Single-Photon Emission Computed Tomography |
| TabPFN | Tabular Prior-Data Fitted Network |
| TN | True Negative |
| TP | True Positive |
| WHO | World Health Organization |
| XGBoost | Extreme Gradient Boosting |
Appendix A. Hyperparameter Fine-Tuning
Table A1.
Best hyperparameters and 10-fold cross-validated tuning accuracy (optimisation metric: accuracy).
References
- WHO. W.H.O. Cardiovascular diseases (CVDs). 2025. Available online: https://www.who.int/en/news-room/fact-sheets/detail/cardiovascular-diseases-%28cvds%29 (accessed on 5 February 2026).
- British Heart Foundation. Global Cardiovascular Disease Factsheet. 2025. Available online: https://www.bhf.org.uk/-/media/files/for-professionals/research/heart-statistics/bhf-cvd-statistics-global-factsheet-jan26.pdf (accessed on 3 May 2026).
- Global Burden of Cardiovascular Diseases and Risks 2023 Collaborators. Global, regional, and national burden of cardiovascular diseases and risk factors in 204 countries and territories, 1990–2023. J. Am. Coll. Cardiol. 2025, 86, 2167–2243. [Google Scholar] [CrossRef] [Scilit]
- Chong, B. Global burden of cardiovascular diseases: Projections from 2025 to 2050. Eur. J. Prev. Cardiol. 2025, 32, 1001–1015. [Google Scholar] [CrossRef] [Scilit]
- van Gils, P.F. The polypill in the primary prevention of cardiovascular disease: Cost-effectiveness in the Dutch population. BMJ Open 2011, 1, e000363. [Google Scholar] [CrossRef] [Scilit]
- Shaw, L.J. 10-year resource utilization and costs for cardiovascular care. J. Am. Coll. Cardiol. 2018, 71, 1078–1089. [Google Scholar] [CrossRef] [Scilit] [PubMed]
- Lloyd-Jones, D.M. Framingham risk score and prediction of lifetime risk for coronary heart disease. Am. J. Cardiol. 2004, 94, 20–24. [Google Scholar] [CrossRef] [Scilit] [PubMed]
- European Society of Cardiology. SCORE2 and SCORE2-OP. 2026. Available online: https://www.escardio.org/Education/Practice-Tools/CVD-prevention-toolbox/SCORE-Risk-Charts# (accessed on 3 May 2026).
- American College of Cardiology. ASCVD Risk Estimator. 2013. Available online: https://tools.acc.org/ascvd-risk-estimator-plus/#!/calculate/estimate/ (accessed on 3 May 2026).
- Liu, W. Machine-learning versus traditional approaches for atherosclerotic cardiovascular risk prognostication in primary prevention cohorts: A systematic review and meta-analysis. Eur. Heart J.-Qual. Care Clin. Outcomes 2023, 9, 310–322. [Google Scholar] [CrossRef] [Scilit]
- Samaras, A.D.; Feleki, A.; Apostolopoulos, I.D.; Moustakidis, S.; Papageorgiou, E.; Kokkinos, K.; Papandrianos, N. Medical Decision Support System in Nuclear Medicine Diagnosis for Non-Small Cell Lung Cancer and Coronary Artery Disease: A First Stage Prototype. In 2024 15th International Conference on Information, Intelligence, Systems & Applications (IISA); IEEE: New York, NY, USA, 2024. [Google Scholar]
- Spänig, S. The virtual doctor: An interactive clinical-decision-support system based on deep learning for non-invasive prediction of diabetes. Artif. Intell. Med. 2019, 100, 101706. [Google Scholar] [CrossRef] [Scilit]
- Alizadehsani, R.; Abdar, M.; Roshanzamir, M.; Khosravi, A.; Kebria, P.M.; Khozeimeh, F.; Nahavandi, S.; Sarrafzadegan, N.; Acharya, U.R. Machine learning-based coronary artery disease diagnosis: A comprehensive review. Comput. Biol. Med. 2019, 111, 103346. [Google Scholar] [CrossRef] [Scilit] [PubMed]
- Yu, Y.; Peng, C.; Zhang, Z.; Shen, K.; Zhang, Y.; Xiao, J.; Xi, W.; Wang, P.; Rao, J.; Jin, Z.; et al. Machine learning methods for predicting long-term mortality in patients after cardiac surgery. Front. Cardiovasc. Med. 2022, 9, 831390. [Google Scholar] [CrossRef] [Scilit]
- Betancur, J.; Commandeur, F.; Motlagh, M.; Sharir, T.; Einstein, A.J.; Bokhari, S.; Fish, M.B.; Ruddy, T.D.; Kaufmann, P.; Sinusas, A.J.; et al. Deep learning for prediction of obstructive disease from fast myocardial perfusion SPECT: A multicenter study. JACC Cardiovasc. Imaging 2018, 11, 1654–1663. [Google Scholar] [CrossRef] [Scilit]
- Motwani, M.; Dey, D.; Berman, D.S.; Germano, G.; Achenbach, S.; Al-Mallah, M.H.; Andreini, D.; Budoff, M.J.; Cademartiri, F.; Callister, T.Q.; et al. Machine learning for prediction of all-cause mortality in patients with suspected coronary artery disease: A 5-year multicentre prospective registry analysis. Eur. Heart J. 2017, 38, 500–507. [Google Scholar] [CrossRef] [Scilit]
- Ambale-Venkatesh, B.; Yang, X.; Wu, C.O.; Liu, K.; Hundley, W.G.; McClelland, R.; Gomes, A.S.; Folsom, A.R.; Shea, S.; Guallar, E.; et al. Cardiovascular event prediction by machine learning: The multi-ethnic study of atherosclerosis. Circ. Res. 2017, 121, 1092–1101. [Google Scholar] [CrossRef] [Scilit]
- Banerjee, T.; Paçal, İ. A systematic review of machine learning in heart disease prediction. Turk. J. Biol. 2025, 49, 600–634. [Google Scholar] [CrossRef] [Scilit]
- Alaa, A.M. Cardiovascular disease risk prediction using automated machine learning: A prospective study of 423,604 UK Biobank participants. PLoS ONE 2019, 14, e0213653. [Google Scholar] [CrossRef] [Scilit] [PubMed]
- Gautam, N. Machine learning in cardiovascular risk prediction and precision preventive approaches. Curr. Atheroscler. Rep. 2023, 25, 1069–1081. [Google Scholar] [CrossRef] [Scilit] [PubMed]
- Kundu, S. AI in medicine must be explainable. Nat. Med. 2021, 27, 1328. [Google Scholar] [CrossRef] [Scilit] [PubMed]
- Caspers, J. Translation of predictive modeling and AI into clinics: A question of trust. Eur. Radiol. 2021, 31, 4947–4948. [Google Scholar] [CrossRef] [Scilit]
- Lysaght, T. AI-assisted decision-making in healthcare: The application of an ethics framework for big data in health and research. Asian Bioeth. Rev. 2019, 11, 299–314. [Google Scholar] [CrossRef] [Scilit]
- Middleton, S.E. Trust, regulation, and human-in-the-loop AI: Within the European region. Commun. ACM 2022, 65, 64–68. [Google Scholar] [CrossRef] [Scilit]
- Samaras, A.-D. Classification models for assessing coronary artery disease instances using clinical and biometric data: An explainable man-in-the-loop approach. Sci. Rep. 2023, 13, 6668. [Google Scholar] [CrossRef] [Scilit]
- Schildkraut, J.M. Coronary risk associated with age and sex of parental heart disease in the Framingham Study. Am. J. Cardiol. 1989, 64, 555–559. [Google Scholar] [CrossRef] [Scilit]
- Hoff, J.A. Age and gender distributions of coronary artery calcium detected by electron beam tomography in 35,246 adults. Am. J. Cardiol. 2001, 87, 1335–1339. [Google Scholar] [CrossRef] [Scilit]
- World Health Organization. A Healthy Lifestyle—WHO Recommendations. 2010. Available online: https://www.who.int/europe/news-room/fact-sheets/item/a-healthy-lifestyle---who-recommendations (accessed on 13 October 2022).
- Eid, O. Prevalence and impact of high BMI in CAD patients. Eur. J. Prev. Cardiol. 2022, 29, zwac056.179. [Google Scholar] [CrossRef] [Scilit]
- Kim, J. Machine learning models of clinically relevant biomarkers for the prediction of stable obstructive coronary artery disease. Front. Cardiovasc. Med. 2022, 9, 933803. [Google Scholar] [CrossRef] [Scilit] [PubMed]
- Teja, M.D.; Rayalu, G.M. Optimizing heart disease diagnosis with advanced machine learning models: A comparison of predictive performance. BMC Cardiovasc. Disord. 2025, 25, 212. [Google Scholar] [CrossRef] [Scilit]
- Sen, J.; Bhattacharya, S. An explainable hybrid framework for early detection of cardiovascular diseases using Categorical Boosting and Bees algorithm. Sci. Rep. 2025, 15, 45748. [Google Scholar] [CrossRef] [Scilit] [PubMed]
- Si, Y. Optimized feature selection and advanced machine learning for stroke risk prediction in revascularized coronary artery disease patients. BMC Med. Inform. Decis. Mak. 2025, 25, 276. [Google Scholar] [CrossRef] [Scilit]
- Tasmurzayev, N. Explainable AI for Coronary Artery Disease Stratification Using Routine Clinical Data. Algorithms 2025, 18, 693. [Google Scholar] [CrossRef] [Scilit]
- Biau, G.; Scornet, E. A random forest guided tour. Test 2016, 25, 197–227. [Google Scholar] [CrossRef] [Scilit]
- Prokhorenkova, L. CatBoost: Unbiased boosting with categorical features. In Advances in Neural Information Processing Systems; Curran Associates Inc.: Red Hook, NY, USA, 2018; pp. 6639–6649. [Google Scholar]
- Schapire, R.E. Explaining Adaboost, in Empirical Inference; Springer: Berlin/Heidelberg, Germany, 2013; pp. 37–52. [Google Scholar]
- Chen, T.; He, T.; Benesty, M.; Khotilovich, V.; Tang, Y.; Cho, H.; Chen, K.; Mitchell, R.; Cano, I.; Zhou, T.; et al. Xgboost: Extreme gradient boosting. In R Package Version 0.4-2; R Foundation: Vienna, Austria, 2015; Volume 1, pp. 1–4. [Google Scholar]
- Hollmann, N. Tabpfn: A transformer that solves small tabular classification problems in a second. arXiv 2022, arXiv:2207.01848. [Google Scholar]
- Guo, G.; Wang, H.; Bell, D.; Bi, Y.; Greer, K. KNN model-based approach in classification. In OTM Confederated International Conferences “On the Move to Meaningful Internet Systems”; Springer: Berlin/Heidelberg, Germany, 2003. [Google Scholar]
- Cohen, J. Statistical Power Analysis for the Behavioral Sciences; Routledge: London, UK, 1988. [Google Scholar]
- Winter, E. The shapley value. In Handbook of Game Theory with Economic Applications; Elsevier: Amsterdam, The Netherlands, 2002; Volume 3, pp. 2025–2054. [Google Scholar]
- Khot, U.N. Prevalence of conventional risk factors in patients with coronary heart disease. JAMA 2003, 290, 898–904. [Google Scholar] [CrossRef] [Scilit] [PubMed]
- Gensini, G.; Comeglio, M.; Colella, A. Classical risk factors and emerging elements in the risk profile for coronary artery disease. Eur. Heart J. 1998, 19, A53–A61. [Google Scholar]
- Hajar, R. Risk factors for coronary artery disease: Historical perspectives. Heart Views 2017, 18, 109–114. [Google Scholar] [CrossRef] [Scilit] [PubMed]
- Wilson, P.W. Established risk factors and coronary artery disease: The Framingham Study. Am. J. Hypertens. 1994, 7, 7S–12S. [Google Scholar] [CrossRef] [Scilit]
- Giannakoulas, G. Burden of coronary artery disease in adults with congenital heart disease and its relation to congenital and traditional heart risk factors. Am. J. Cardiol. 2009, 103, 1445–1450. [Google Scholar] [CrossRef] [Scilit] [PubMed]

Disclaimer/Publisher’s Note: The statements, opinions and data contained in all publications are solely those of the individual author(s) and contributor(s) and not of MDPI and/or the editor(s). MDPI and/or the editor(s) disclaim responsibility for any injury to people or property resulting from any ideas, methods, instructions or products referred to in the content. |
© 2026 by the authors. Licensee MDPI, Basel, Switzerland. This article is an open access article distributed under the terms and conditions of the Creative Commons Attribution (CC BY) license.