1. Introduction
Landslides are among the most common and highly destructive geological disasters. According to statistics, over 80% of slope instabilities are closely related to water activities [
1,
2,
3,
4]. In waterfront slopes such as riverbanks, reservoir banks, dams, and seawalls, external water level fluctuations caused by rainfall, floods, tides, and reservoir operations trigger the transition of the slope mass between saturated and unsaturated states. This process alters the mechanical properties of the soil and the distribution of pore water pressure, generating loading and unloading effects of hydrodynamic pressure, which ultimately lead to slope deformation or even failure. Typical cases include the large-scale landslide at the Longyangxia Dam induced by water level changes, as well as the frequent landslides in the Three Gorges Reservoir area (e.g., Qianjiangping, Shuping, Liangshuijing, and Baijiabao landslides) triggered by water level fluctuations between 145–175 m [
5,
6,
7], posing severe threats to the lives and property of residents.
Numerous scholars have conducted extensive research on bank slope stability subjected to water level fluctuations. The primary methods encompass field monitoring, physical model tests, and numerical simulations [
8,
9,
10]. Existing findings indicate that a rising water level alters the pore water pressure distribution within the slope, while a falling water level—especially rapid drawdown—makes the slope more susceptible to sliding [
11]. Deng et al. [
12] explored the relationship between groundwater seepage and slope stability, elucidating the impact of seepage on slope performance. Jiang et al. [
13] revealed the effects of water level fluctuations on slope deformation and instability through model tests of the Three Gorges Reservoir. Berilgen [
14] demonstrated that the stability of high slopes primarily depends on soil permeability and the rate of water level change. Using the finite element strength reduction method, Lane [
15] comparatively analyzed the differences in slope displacement, deformation, and safety factors under slow and rapid drawdown conditions, comparing the results with those obtained via the limit equilibrium method. Based on the limit equilibrium theory, Viratjandr et al. [
16] analyzed slope stability under rapid, slow, and unsaturated drawdown conditions, taking into account slope gradients, soil properties, and hydraulic boundary conditions. Overall, previous studies have successfully revealed the mechanisms by which water level fluctuations induce landslides, providing theoretical support for engineering protection.
To mitigate the risk of bank slope instability induced by water level fluctuations, sheet piles have been widely utilized as an effective protective structure. Traditional sheet piles predominantly consist of timber, steel, and reinforced concrete, for which the relevant theories and construction techniques are relatively mature [
17]. However, these traditional materials exhibit certain inherent drawbacks: timber piles possess low strength and are susceptible to biodegradation; steel sheet piles suffer from poor durability and severe corrosion issues; reinforced concrete sheet piles demand high site requirements, involve complex and costly construction processes, and cause significant environmental disruption. In recent years, Polyvinyl Chloride (PVC) sheet piles have gradually emerged as a novel bank protection material due to their advantages of being lightweight, corrosion-resistant, easy to install, recyclable, and cost-effective, aligning with the environmental policy of “replacing steel and wood with plastics.” European and American countries have established relatively comprehensive design specifications for PVC sheet piles, extending their application to levee protection, wharves, and revetment engineering. Nevertheless, the systematic application of PVC sheet piles in many emerging markets is still in its relatively early stages. Current research globally often prioritizes material mechanical properties, long-term creep characteristics, and localized pilot projects, while comprehensive investigations into their hydro-mechanical performance under dynamic hydrological cycles remain an area for further development. In particular, there is a prominent lack of research on the mechanical and deformation characteristics of PVC sheet piles and their influence on bank slope stability under dynamic water level fluctuations. Li et al. [
18] investigated the design parameters of PVC sheet piles for foundation pit support, while Wu et al. [
19] proposed that plastic-steel composite sheet piles exert a positive effect on the anti-sliding stability of levees. Touchstone [
20] conducted experimental and numerical comparisons on the mechanical properties of PVC sheet piles, highlighting that their elastic modulus is significantly influenced by temperature. Through field tests, Xu et al. [
21] verified the reliability and deformation-control effectiveness of plastic-steel sheet piles in bank protection. Vaidya et al. [
22] combined experiments with numerical models to analyze the loading modes and pile-soil coupling characteristics of PVC sheet piles. In recent years, domestic engineering practices have demonstrated that PVC sheet piles possess the advantages of convenient construction, environmental friendliness, and short project duration, showing strong application potential [
23]. Overall, however, existing studies largely concentrate on material properties and isolated engineering cases, lacking a systematic investigation into the mechanical and stability mechanisms under dynamic water level fluctuations.
To address the aforementioned gaps, this study combines indoor physical model tests with numerical simulations to systematically investigate the influence laws of PVC sheet pile supports with varying stiffnesses on the bank slope’s moisture content evolution, pore water pressure distribution, pile mechanical deformation, and slope stability. The findings aim to provide a theoretical basis and engineering reference for the promotion and application of PVC sheet piles in ecological slope protection.
3. Experimental Results and Analysis
3.1. Spatiotemporal Variation in Bank Slope Moisture
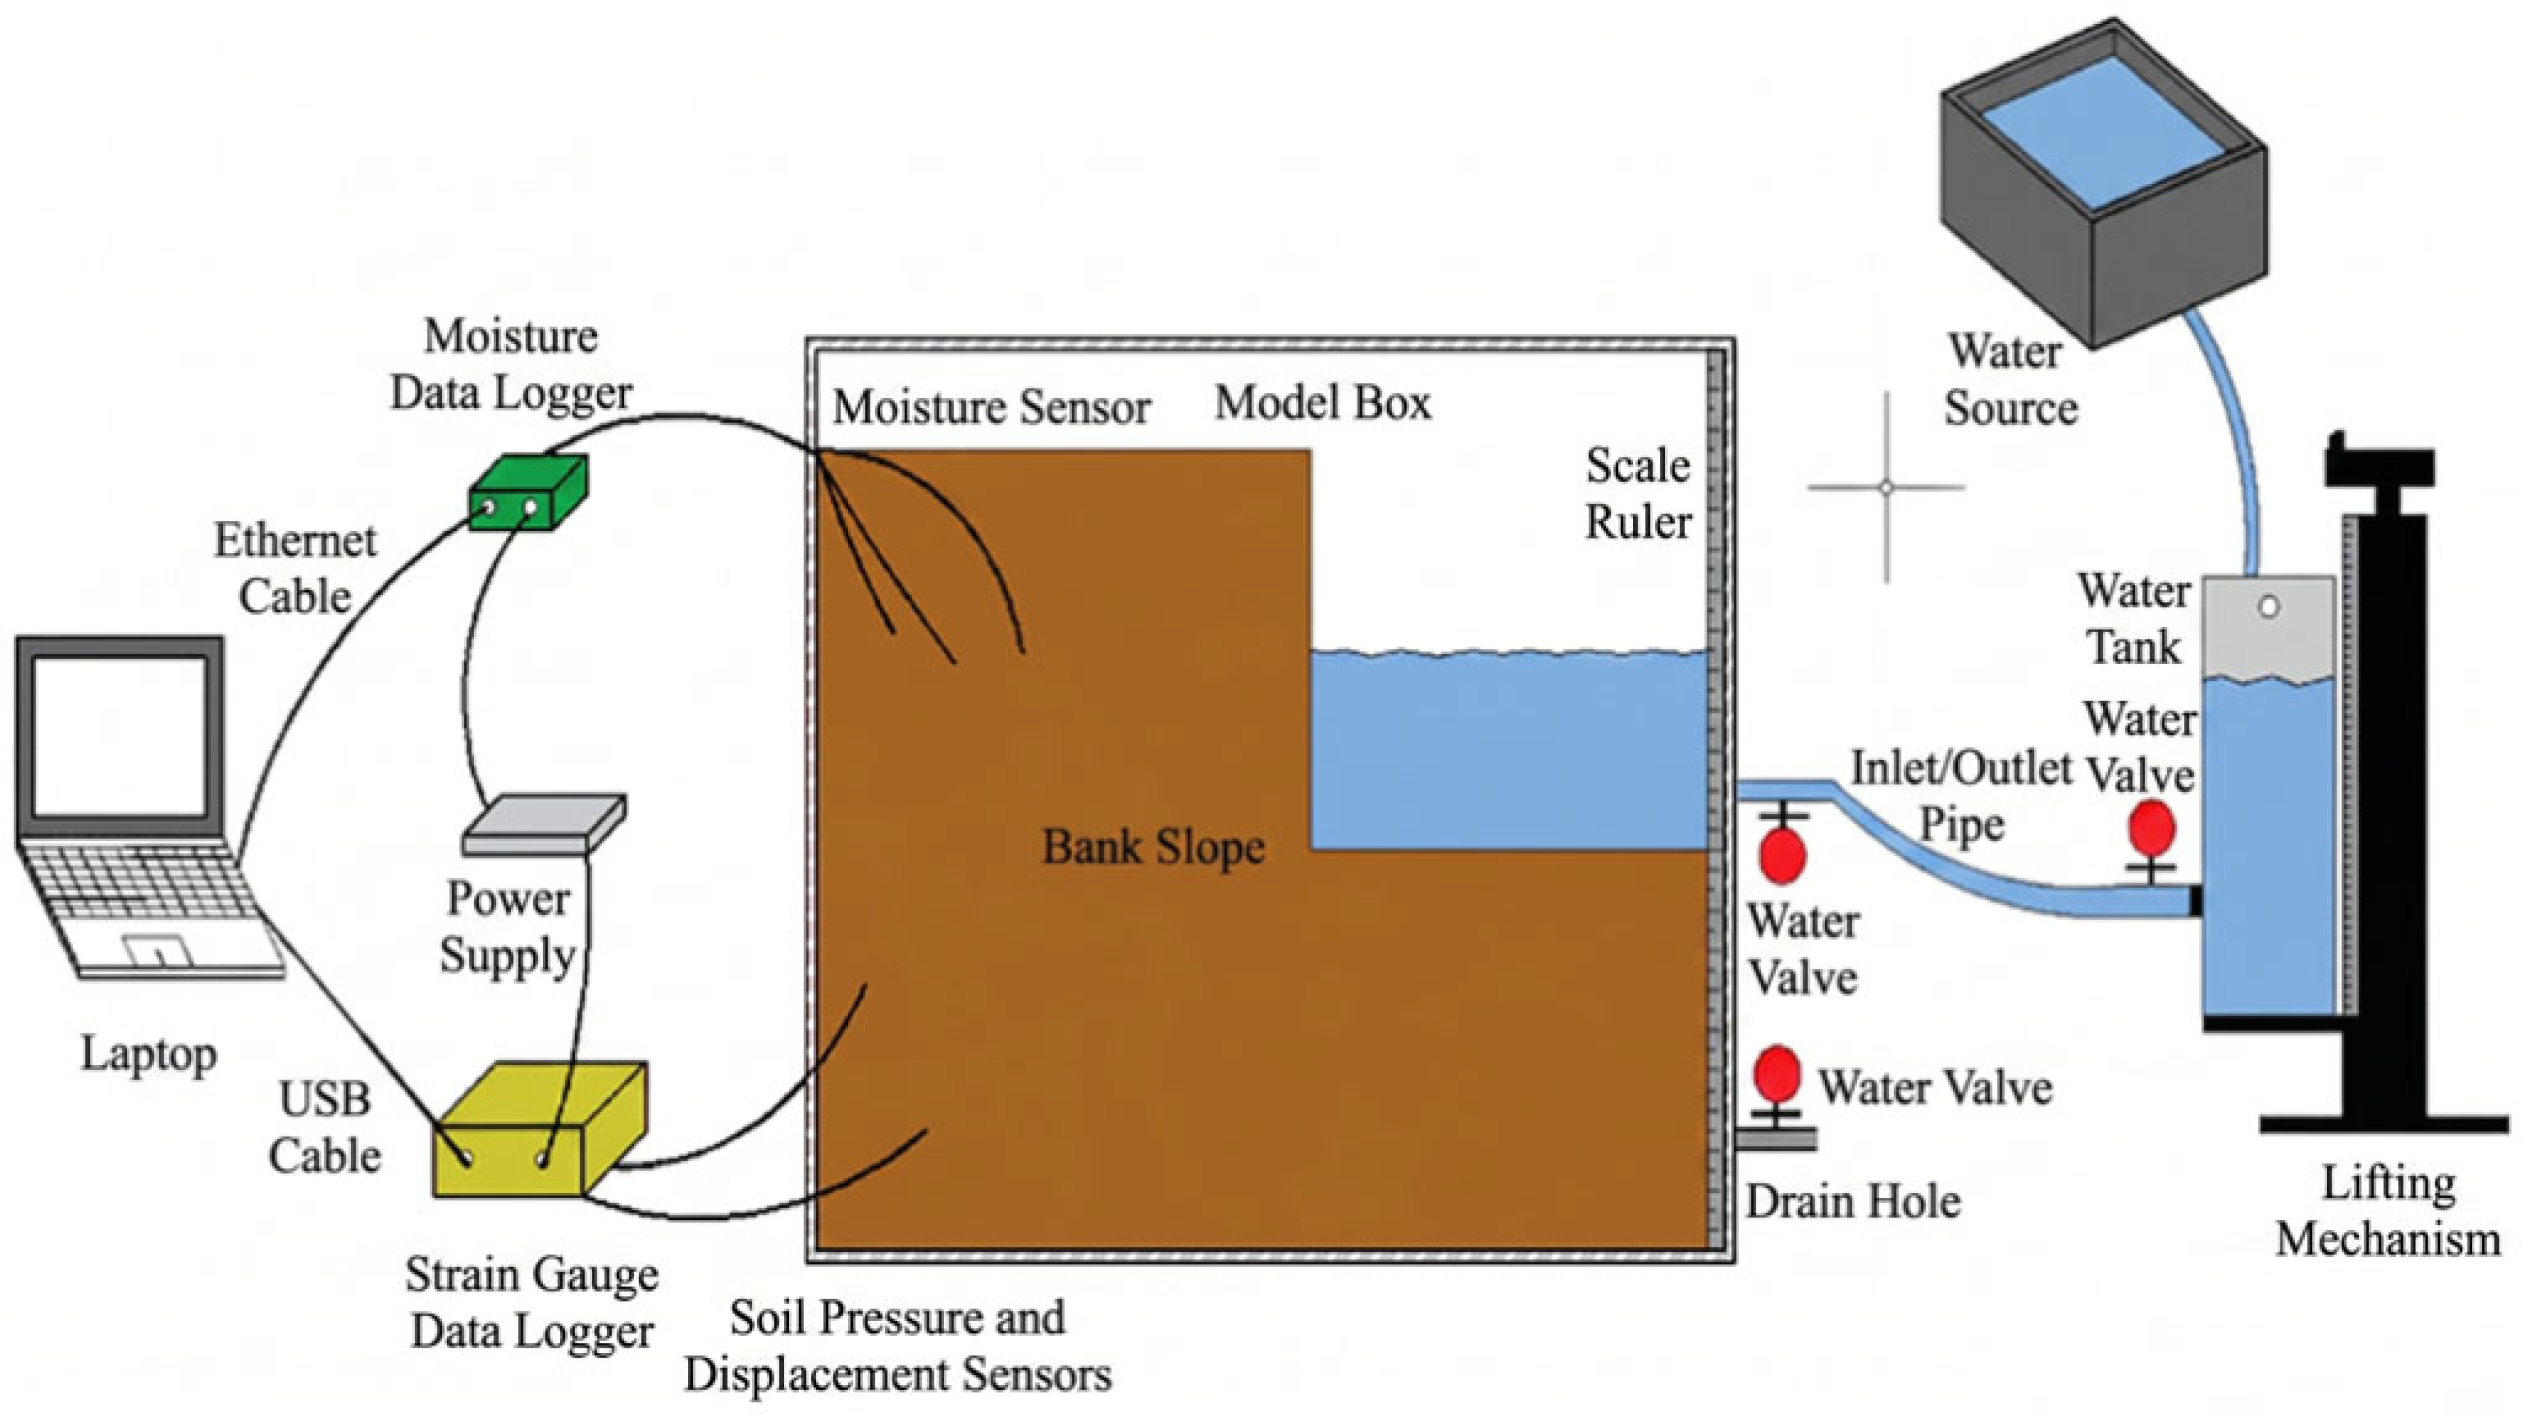
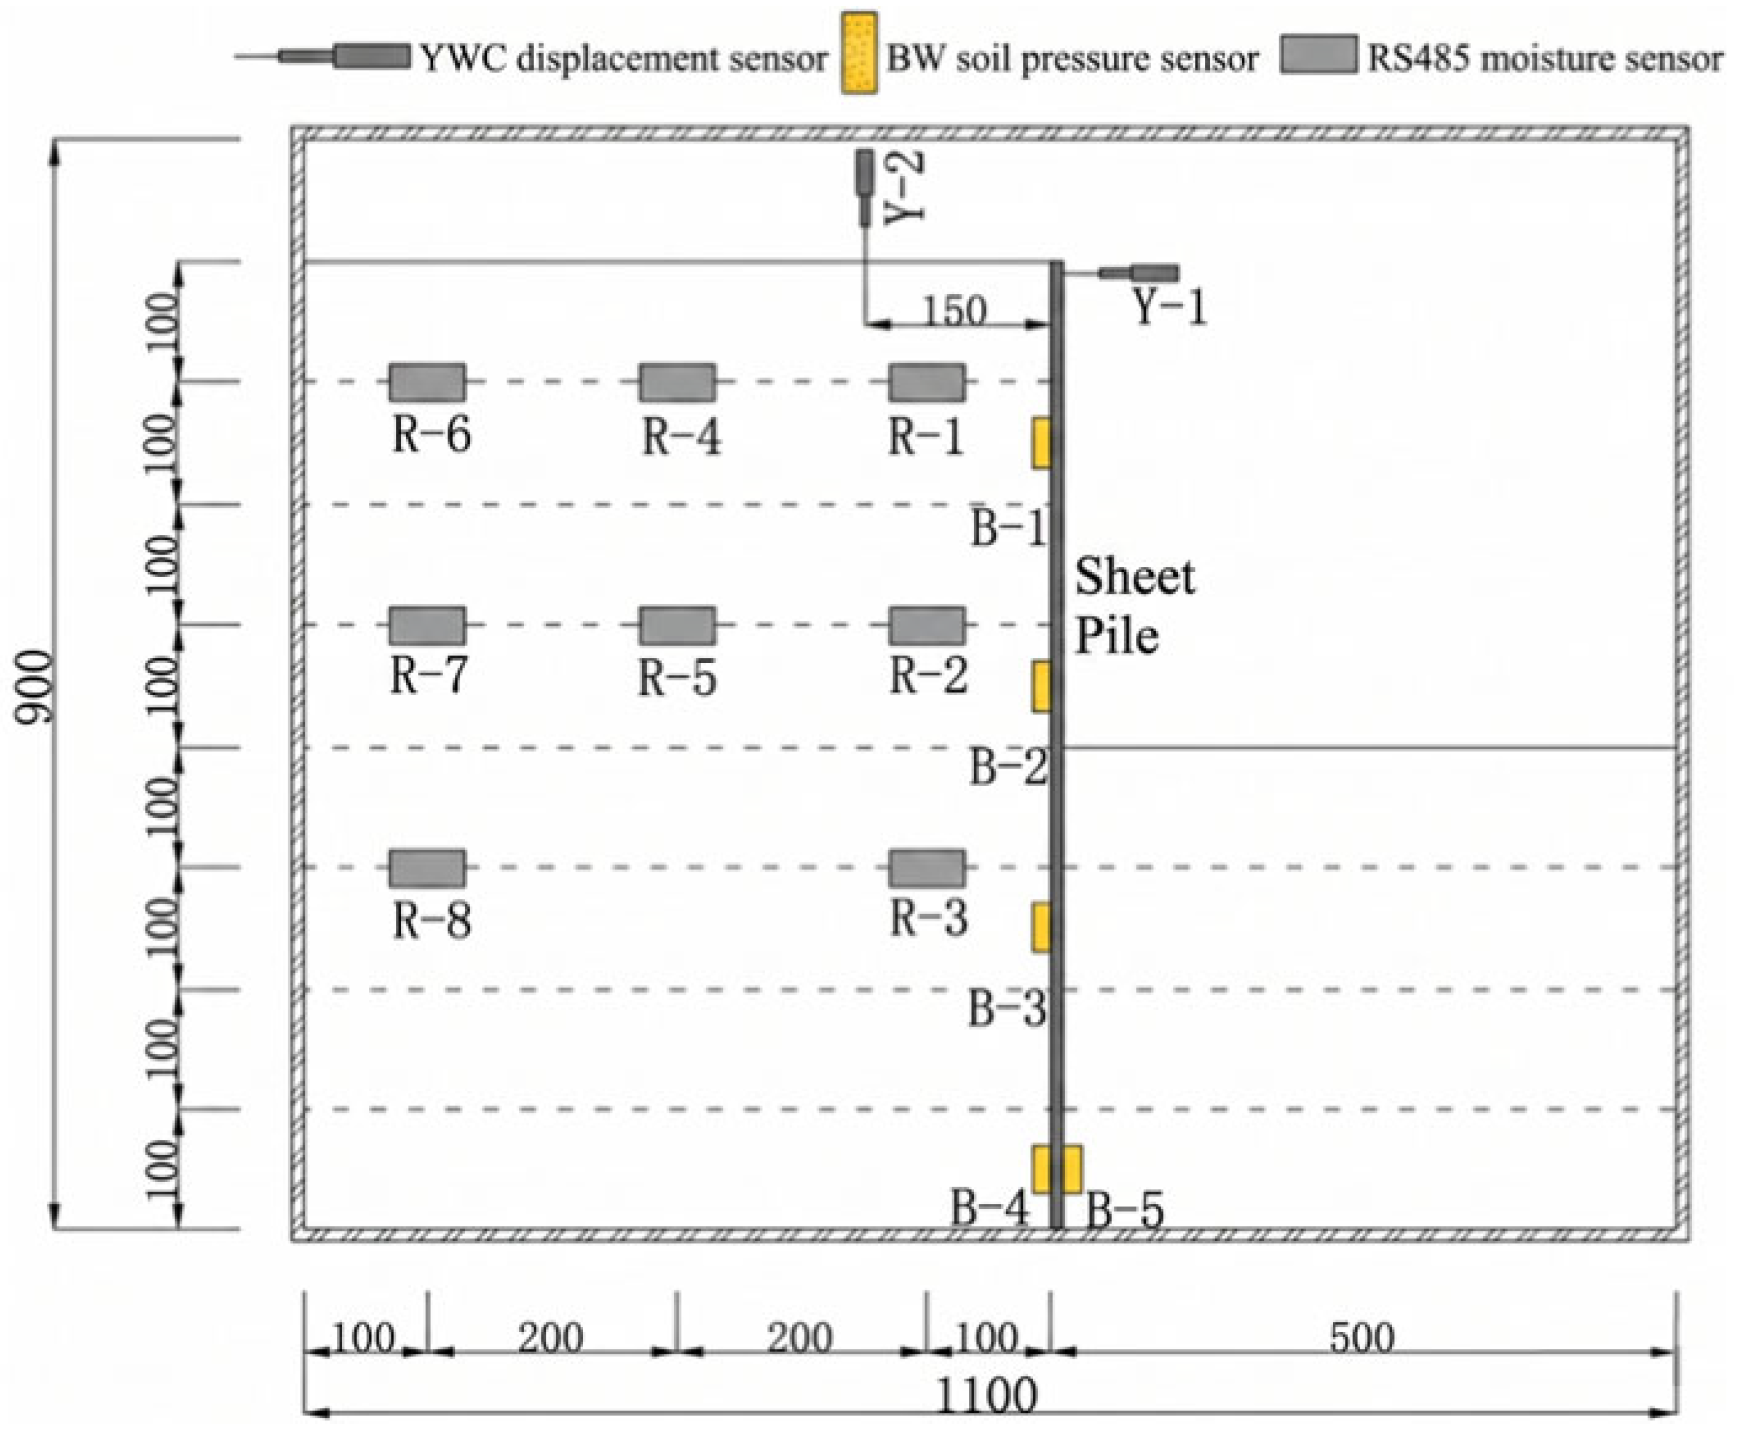
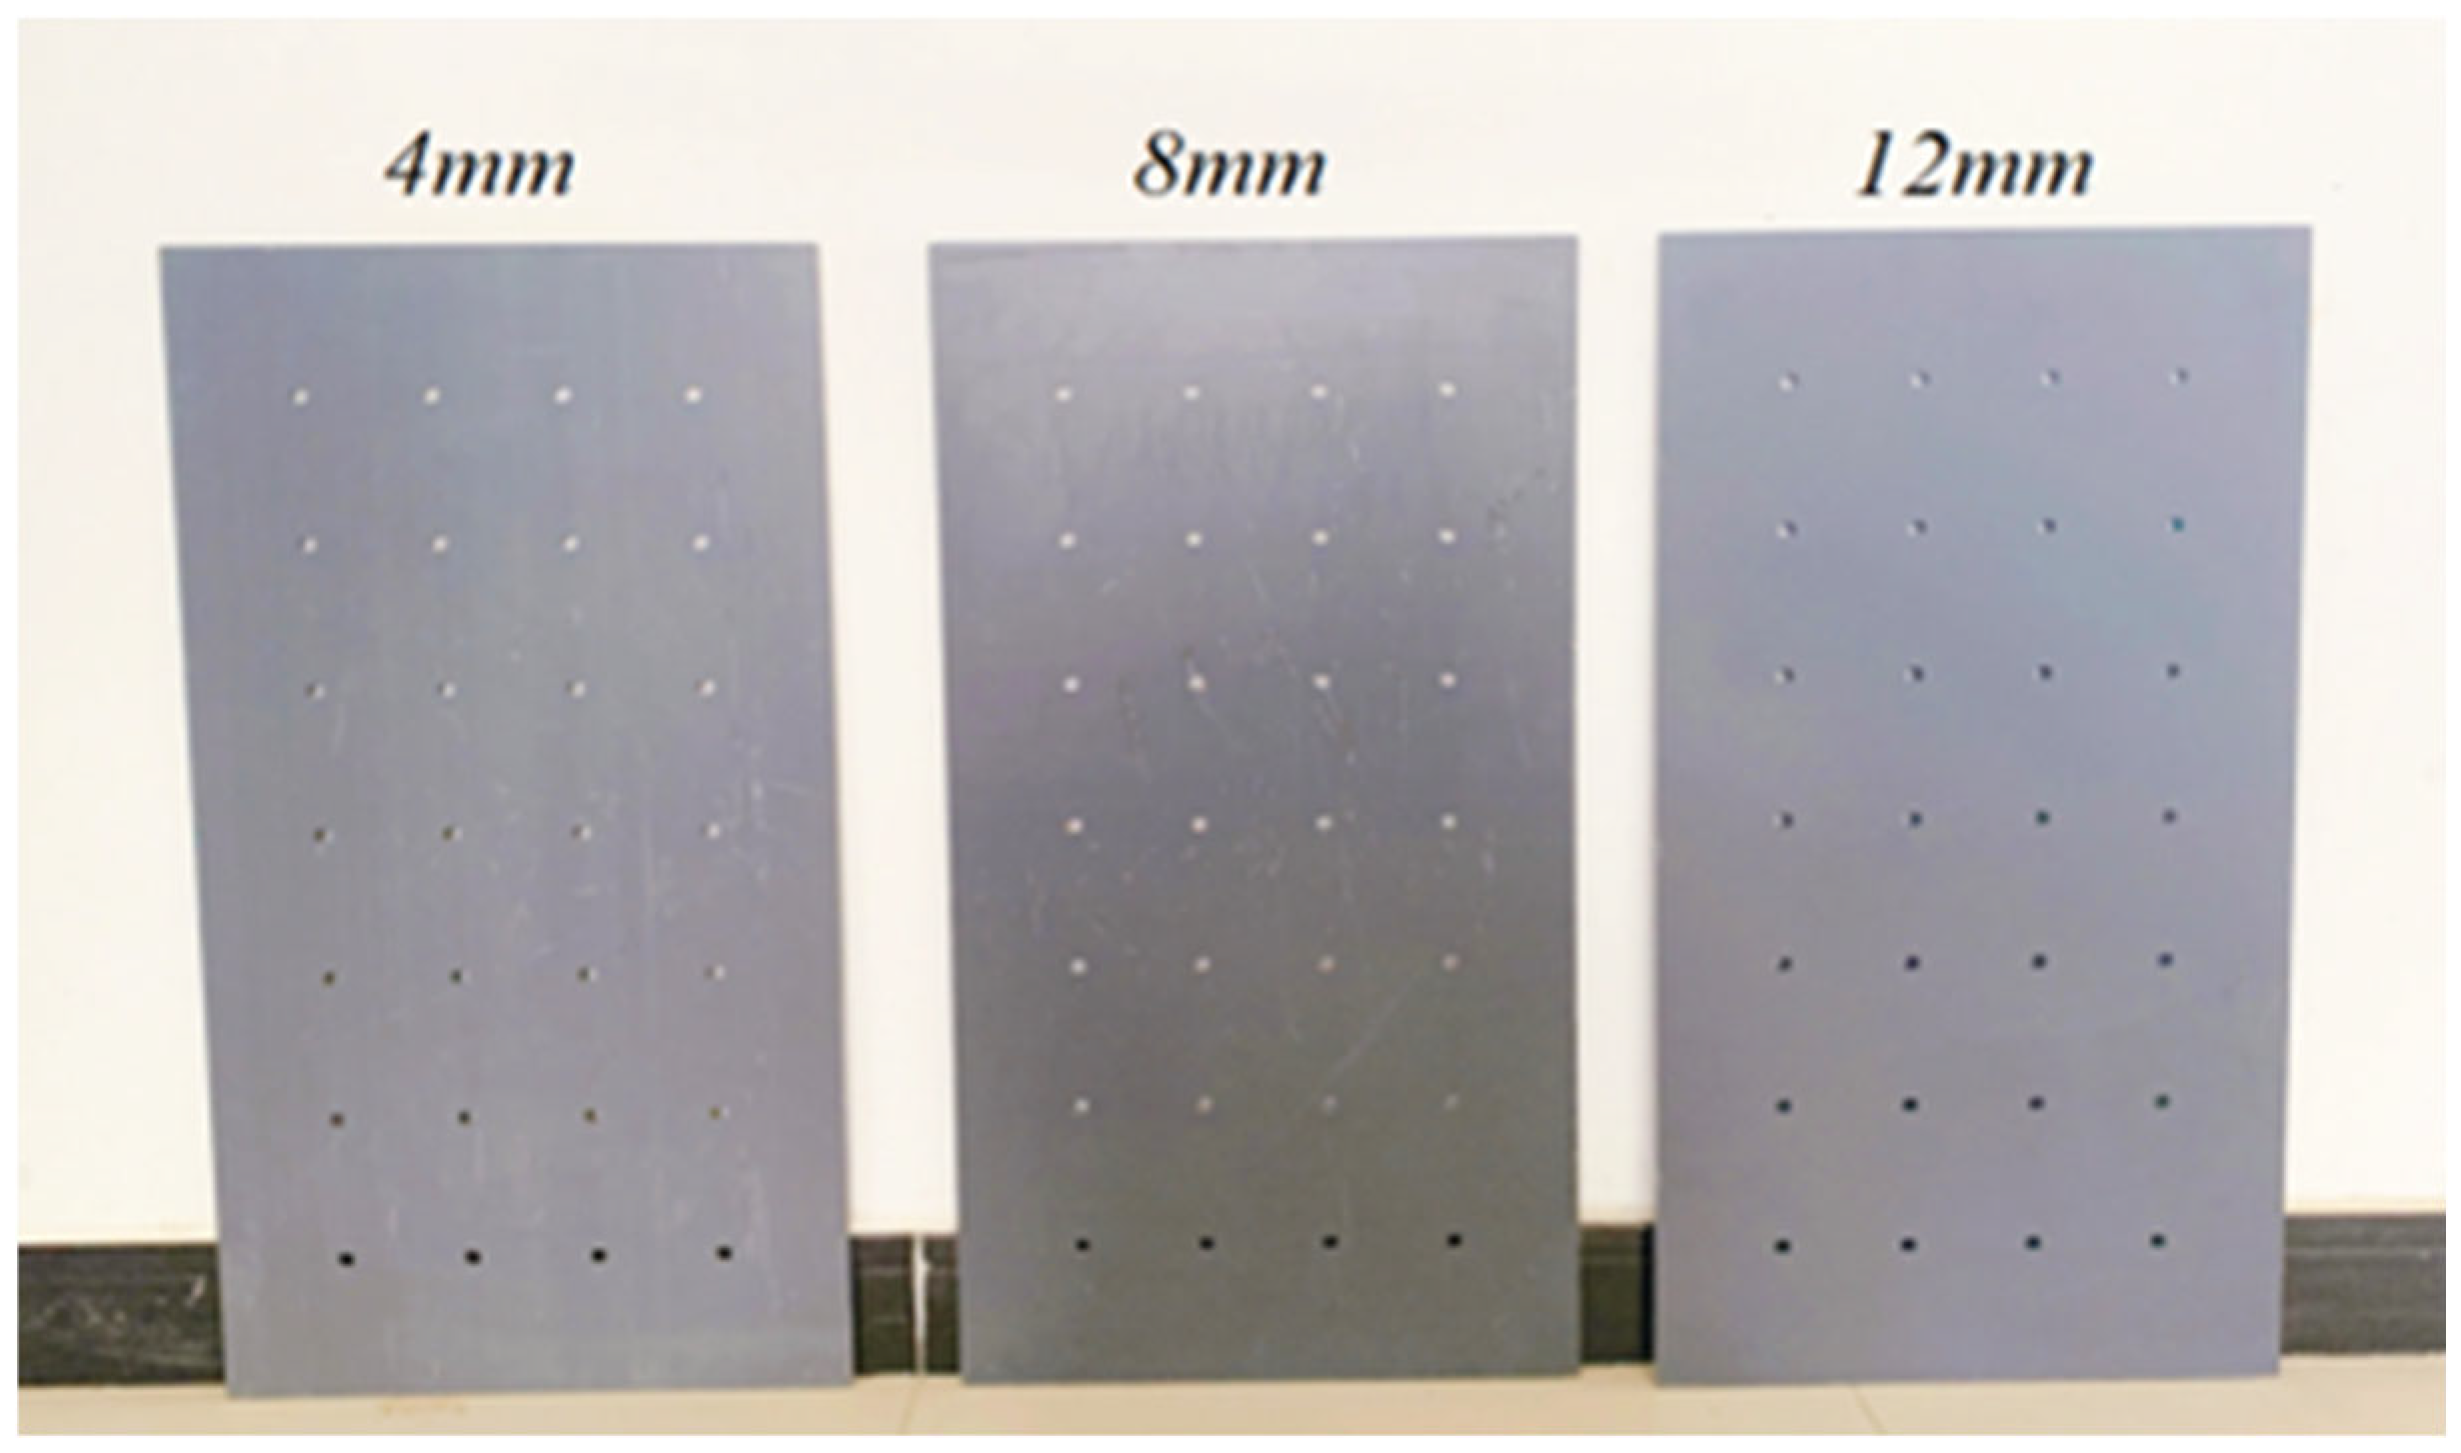
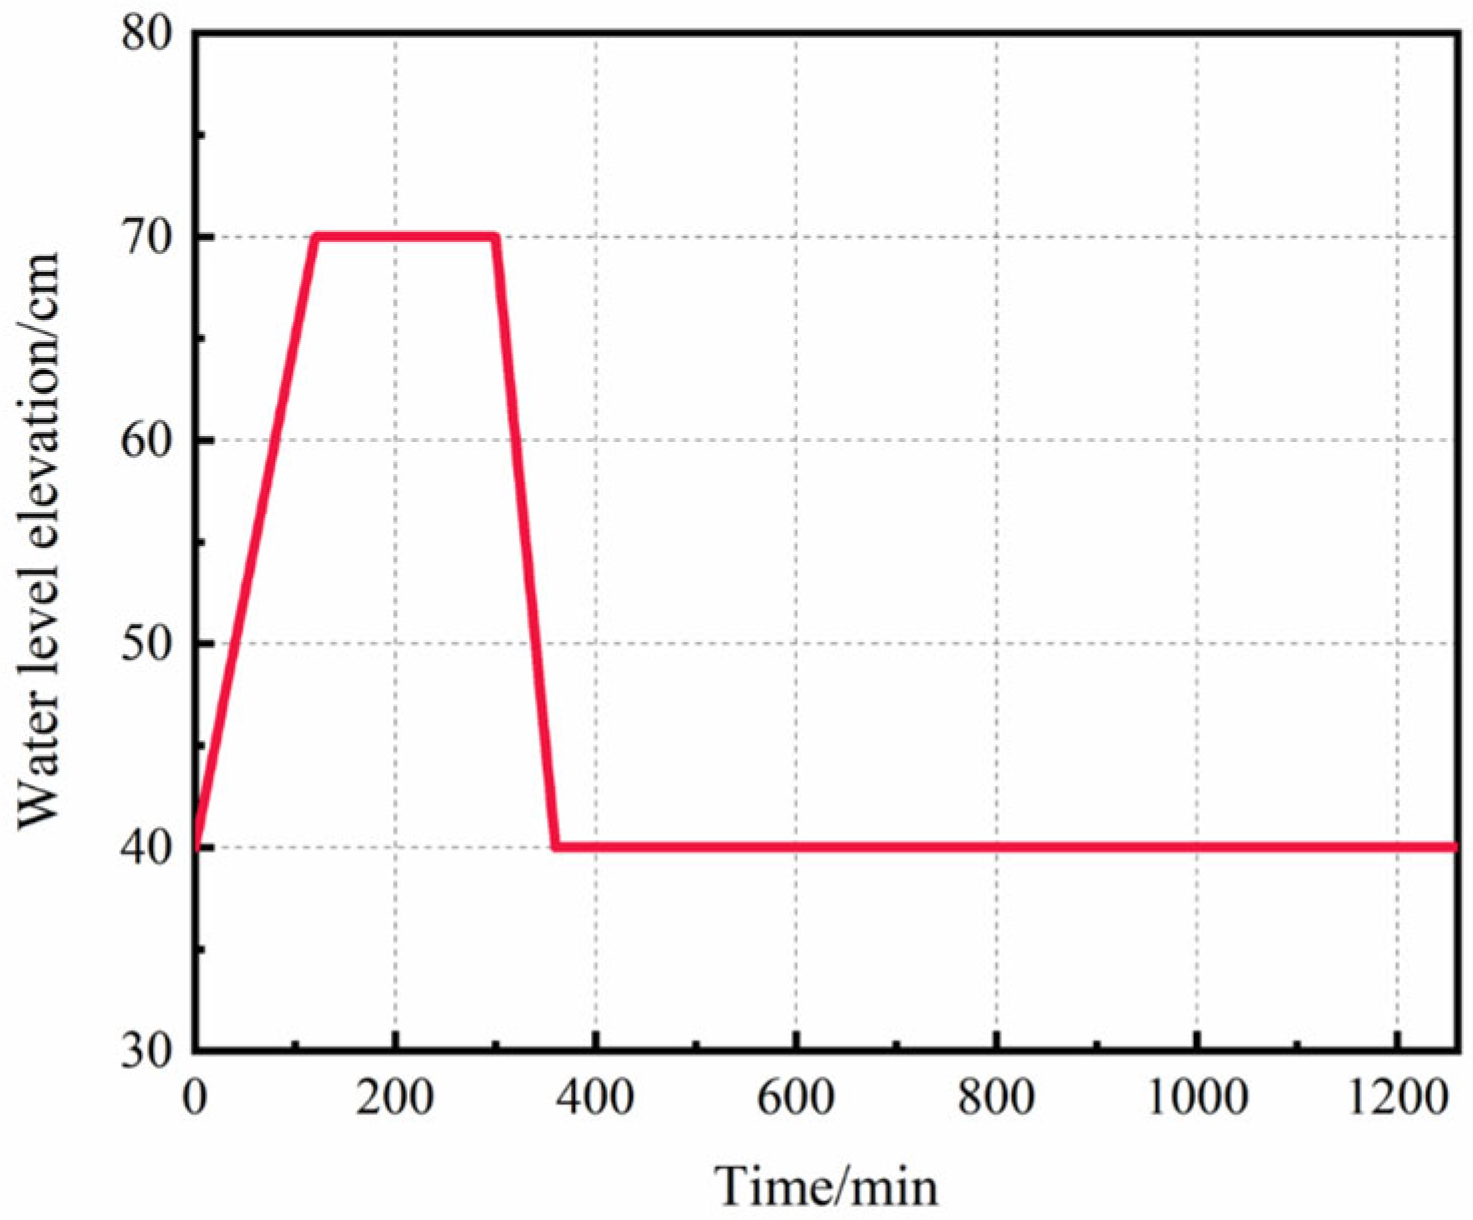
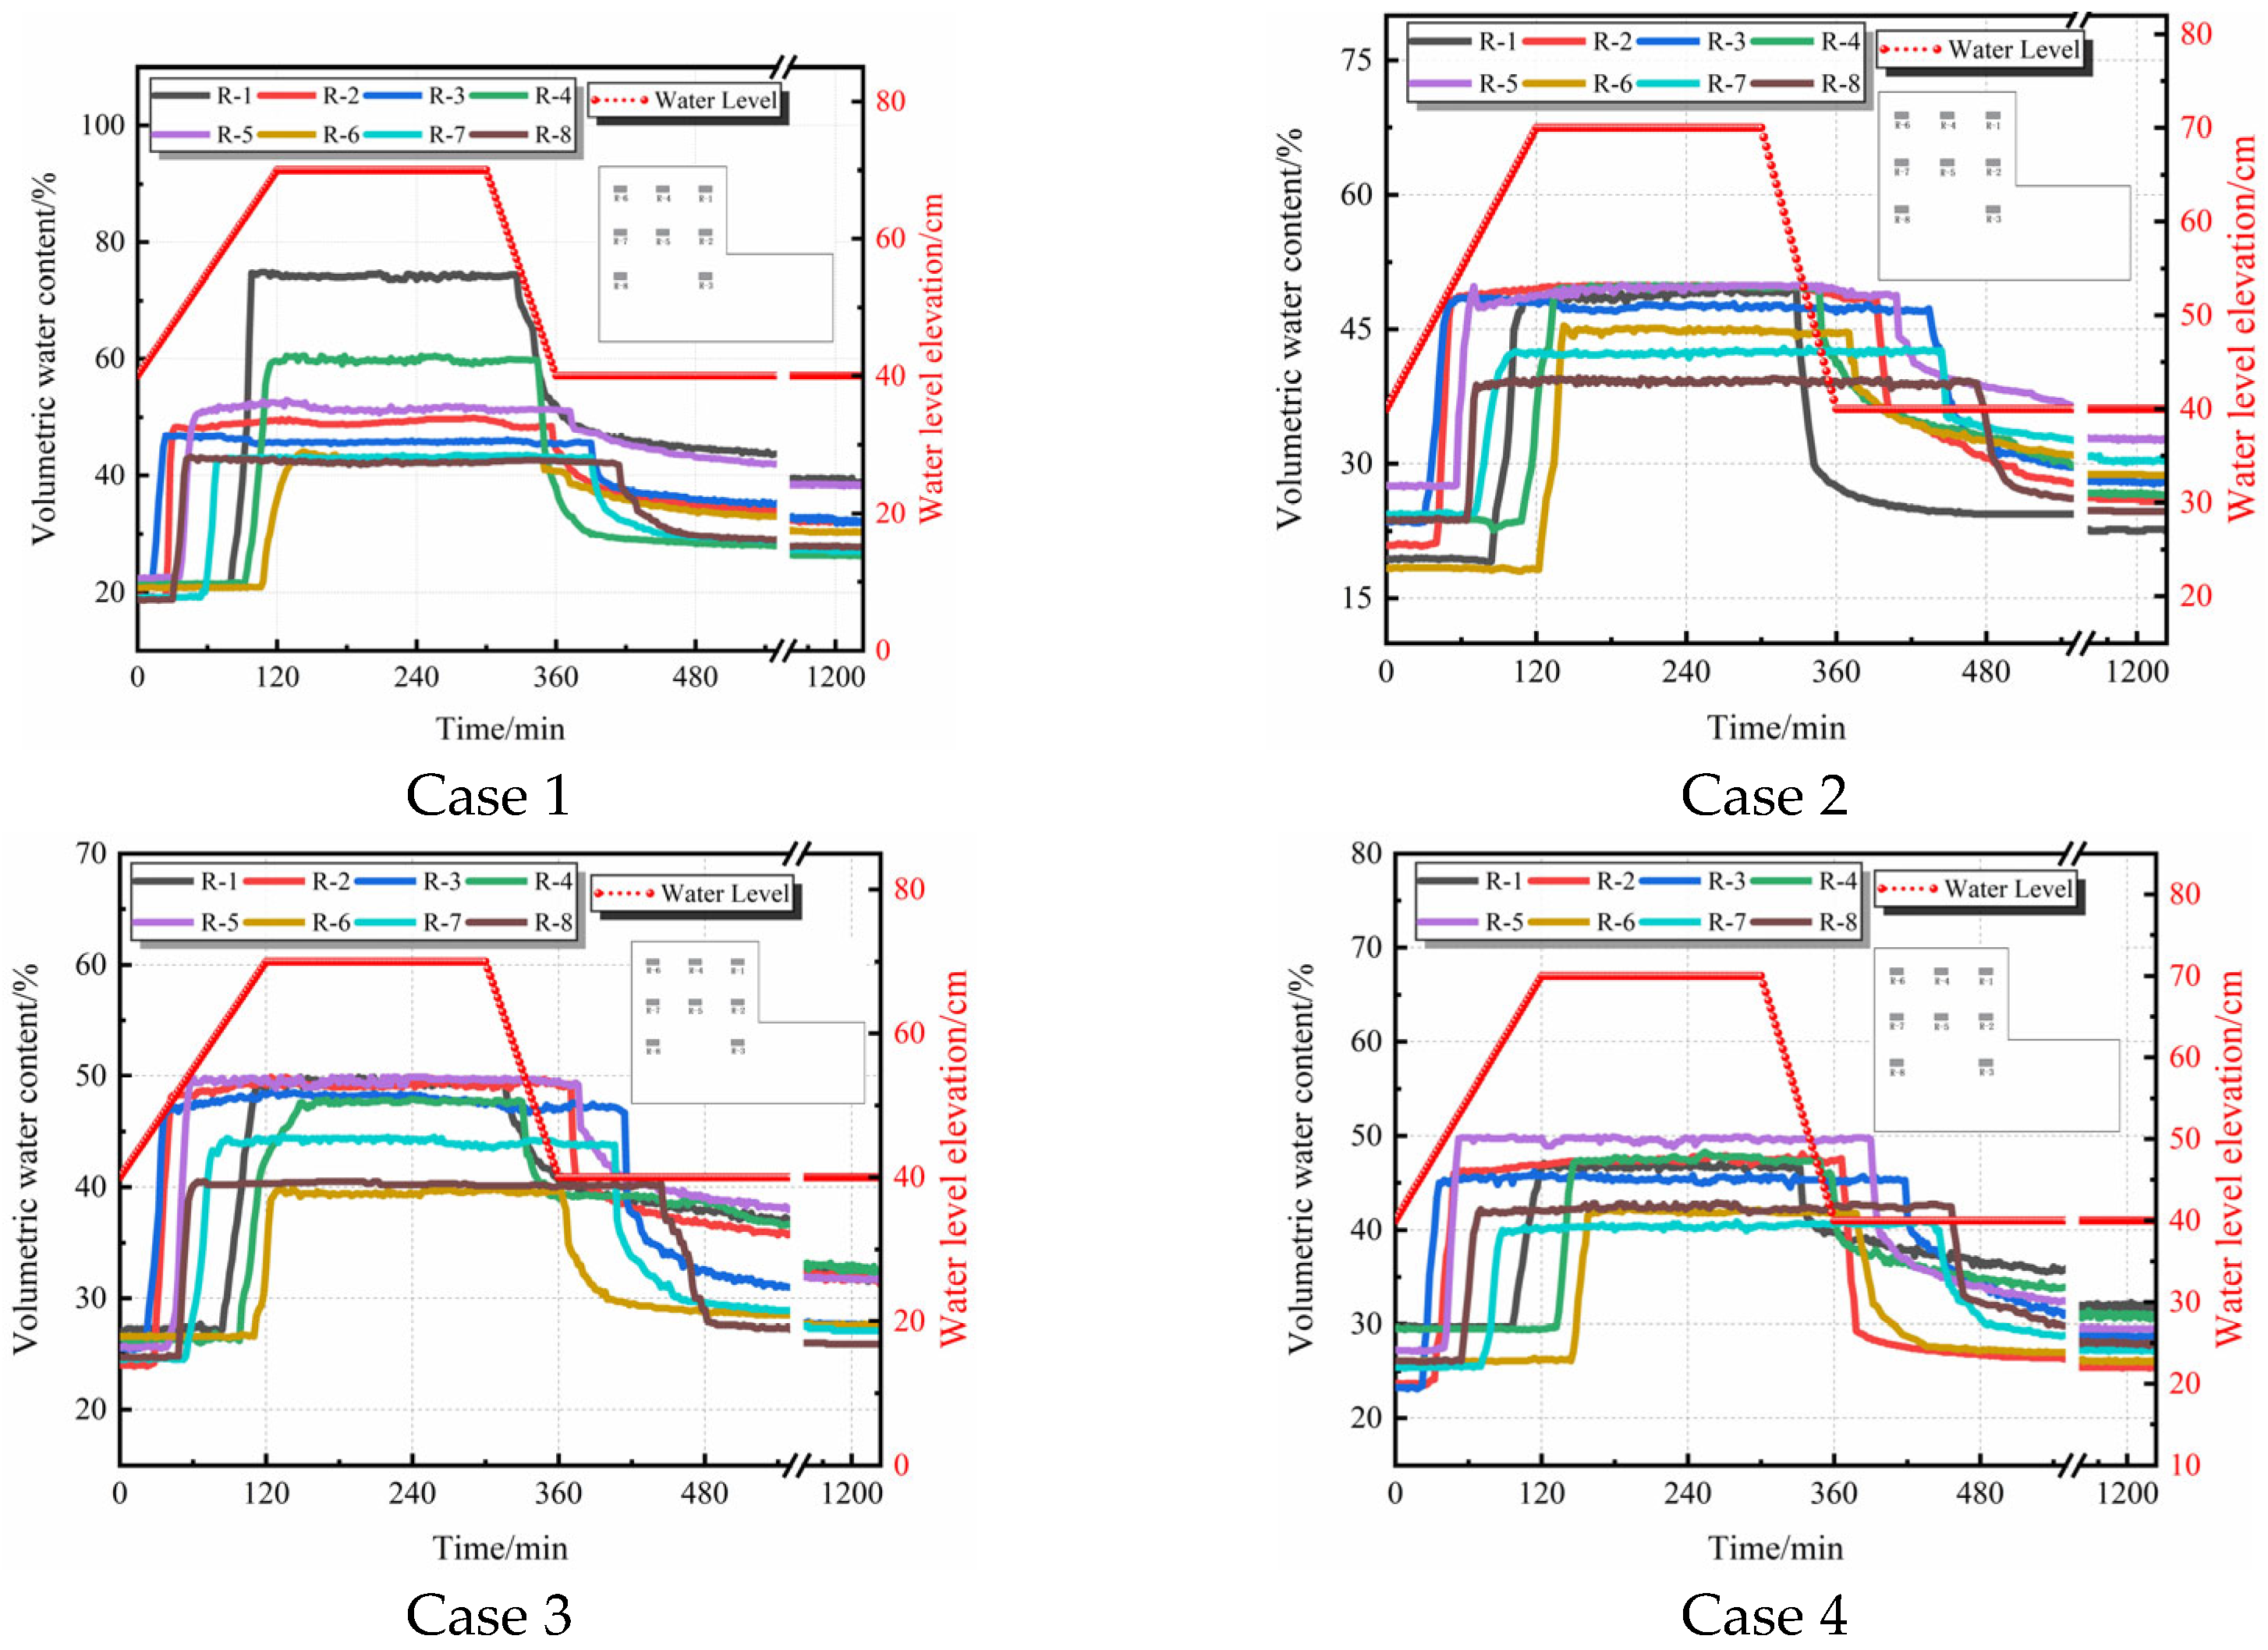
Figure 10 illustrates the variation in the volumetric water content of the bank slope soil over time under the conditions of no sheet pile and sheet pile supports with thicknesses of 4 mm, 8 mm, and 12 mm. Overall, the water content curves are highly consistent with the water level fluctuations: during the water level rising stage, the soil water content increases rapidly and tends to stabilize during the constant water level stage; when the water level drops, the water content decreases accordingly until a new equilibrium state is reached. However, under different support conditions, significant differences exist in the initiation time, growth rate, and decline response of the water content variations.
During the gradual rise in the water level, taking measuring point No. 6 (which exhibited the longest response time) as an example, the water content in the unsupported group began to increase at 108 min, whereas in the 4 mm, 8 mm, and 12 mm sheet pile groups, the initiation was delayed to 112 min, 124 min, and 146 min, respectively. The primary reason is that the sheet piles exerted a direct water-blocking effect, thereby increasing the resistance to inward moisture seepage.
During the gradual drawdown of the water level, conversely, the sheet piles prolonged the time required for internal moisture to drain from the bank slope. Taking the deep measuring point No. 8 as an example, the water content of the unsupported group began to decrease at 416 min. Following the installation of the 4 mm, 8 mm, and 12 mm sheet piles, the decline at measuring point No. 8 lagged to 446 min, 474 min, and 458 min, respectively. This indicates that the sheet piles impeded the outward dissipation of moisture within the slope, resulting in a general delay of 30 to 58 min in the water level drawdown in the middle and deep layers of the slope mass.
3.2. Variation Law of Lateral Earth Pressure on the Pile Shaft
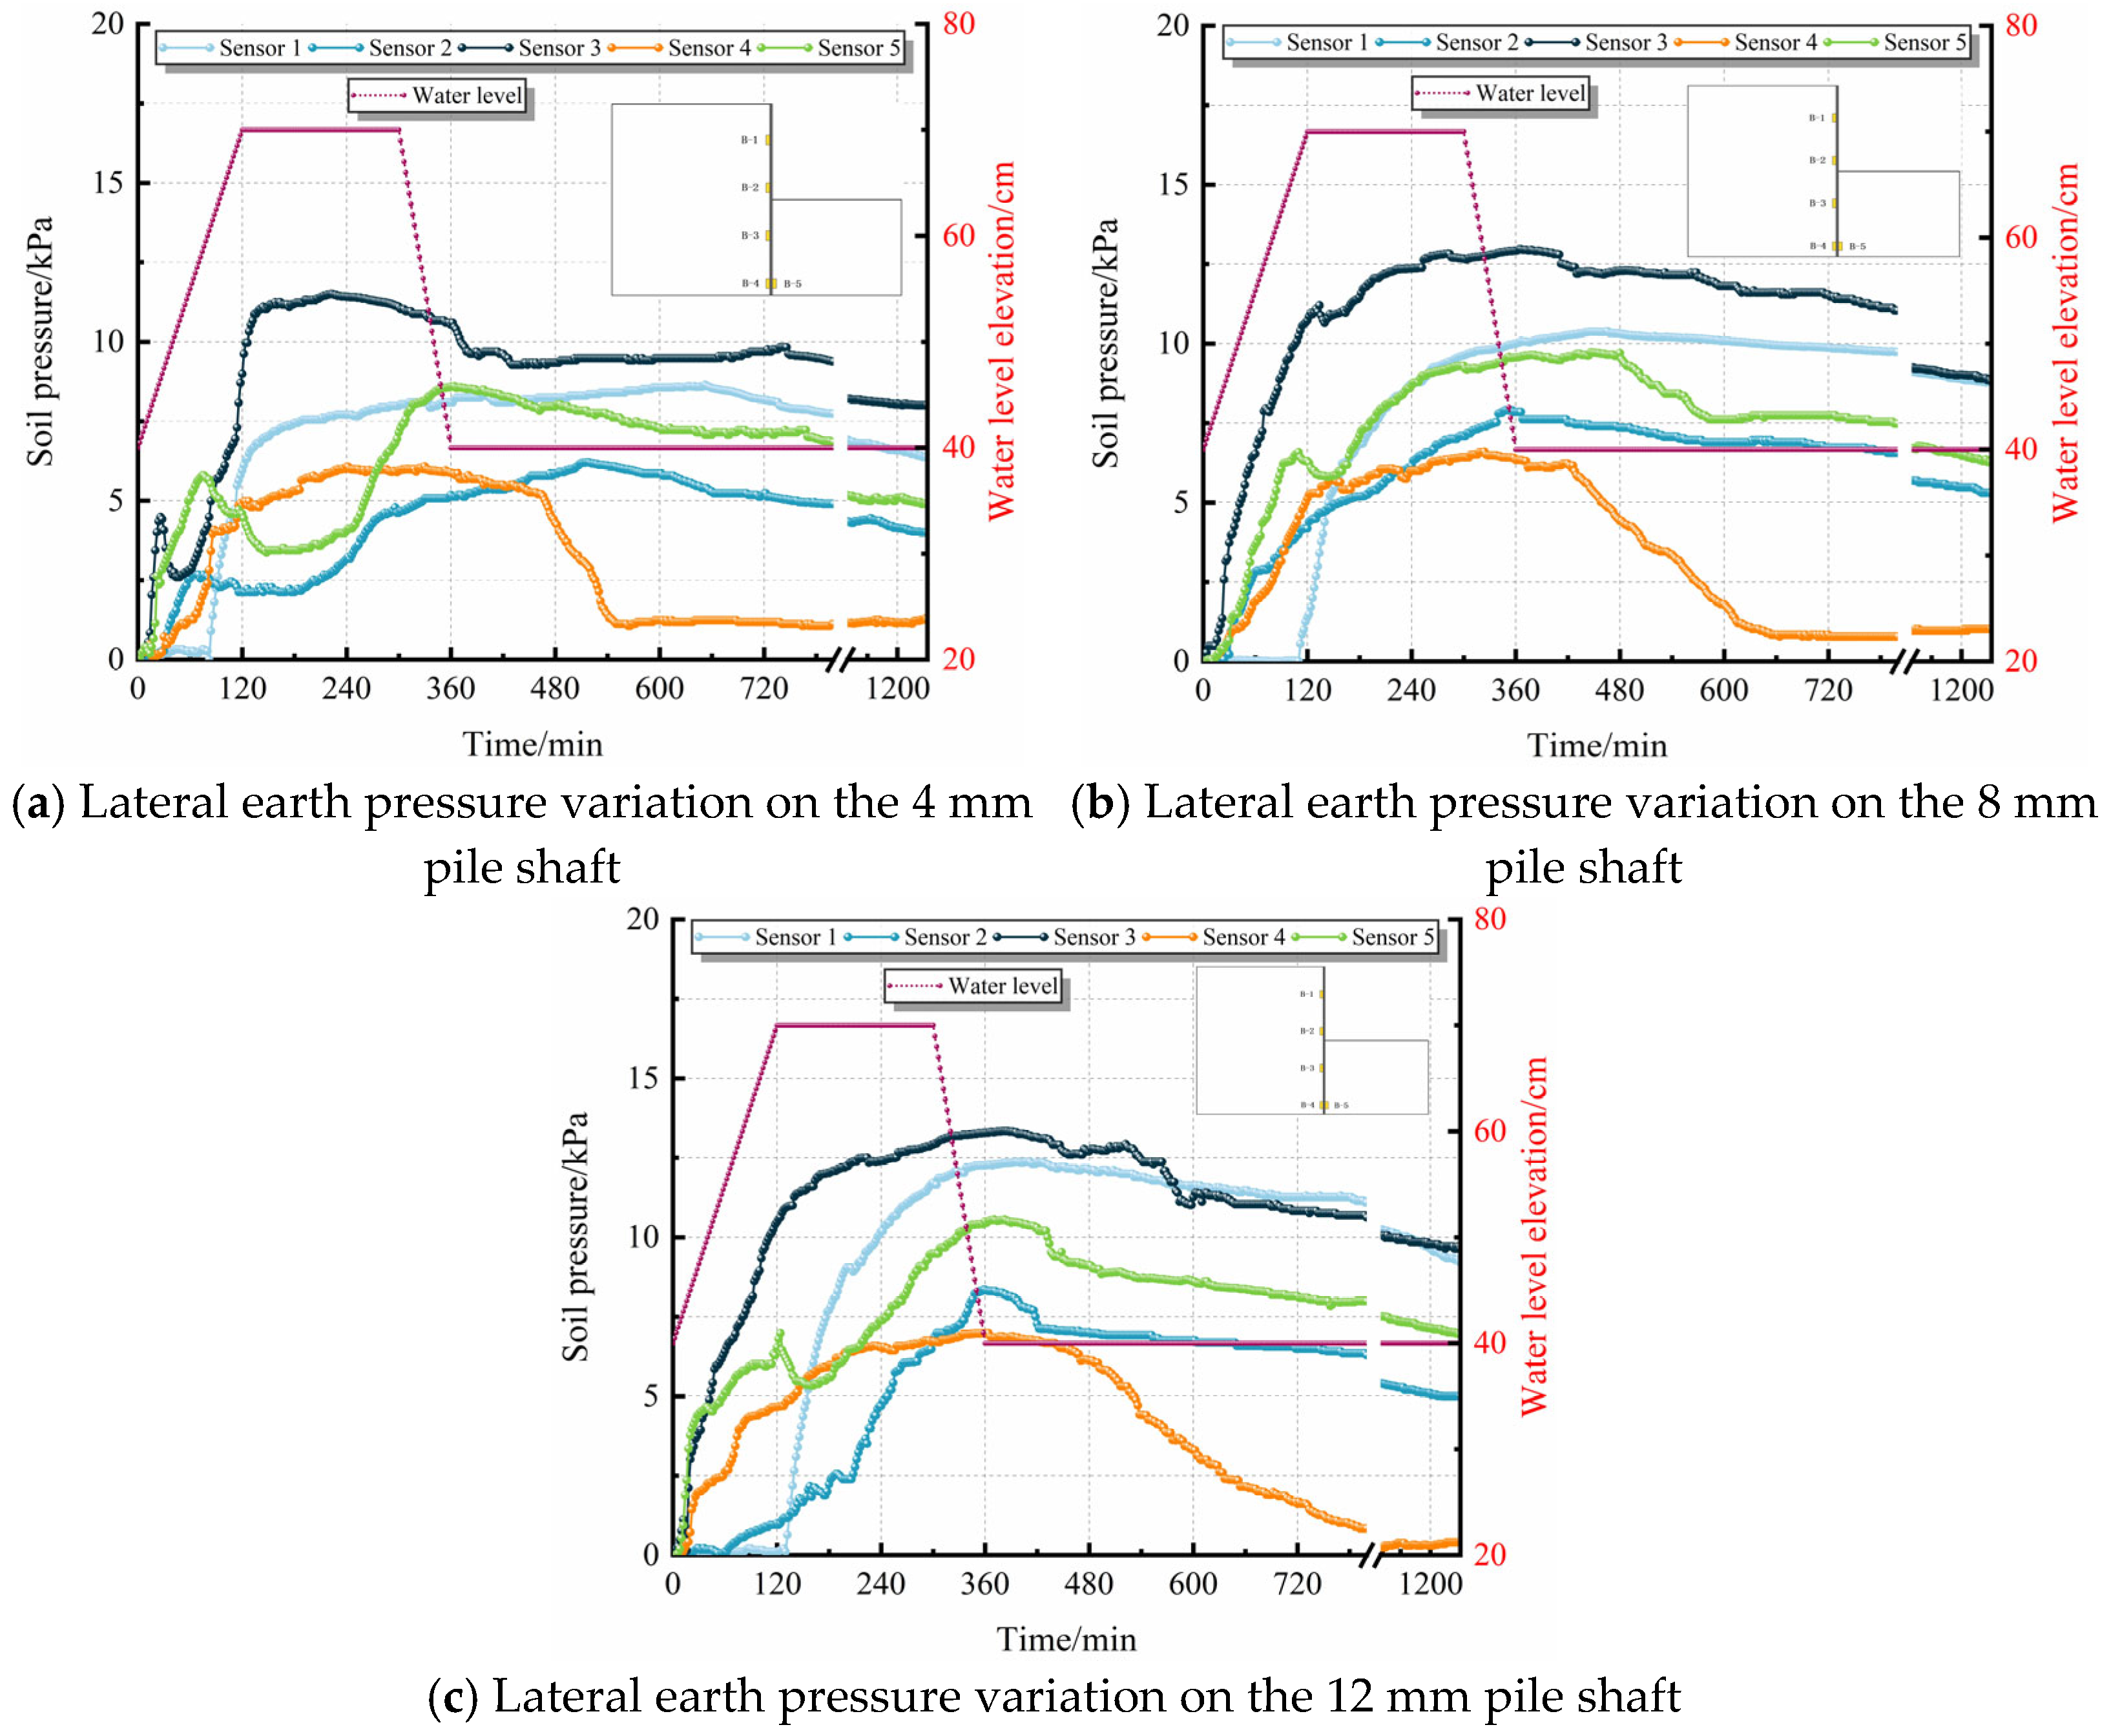
As shown in
Figure 11, during the water level fluctuation cycles, the lateral earth pressure on the pile shaft generally exhibited an evolutionary characteristic of “continuous increase—delayed peak—slow decline.” During the water level rising and maintaining stages, the lateral earth pressure continuously increased. However, during the drawdown stage, because the moisture drainage within the slope was slower than the external water level drop, the lateral earth pressure did not decrease synchronously; instead, it universally lagged, reaching its global peak only after the water level dropped to the initial line (around 360 min). Regarding spatial distribution and stiffness response, the maximum earth pressures were concentrated near the riverbed (measuring point No. 3), and the peak values significantly increased with the greater stiffness of the sheet piles. The maximum values measured for the 4 mm, 8 mm, and 12 mm sheet piles were 11.5 kPa, 12.9 kPa, and 13.3 kPa, respectively. This directly indicates that sheet piles with greater stiffness exert stronger displacement constraints on the soil, thereby passively bearing higher local sliding thrust. Furthermore, the experimental monitoring captured a nonlinear fluctuation of “initial increase—brief decrease—subsequent increase” in the earth pressure in the stressed area (measuring points No. 2, 3, and 5) of the low-stiffness 4 mm sheet pile, a phenomenon essentially absent in the 8 mm and 12 mm sheet piles. This data difference visually confirms the “yielding unloading mechanism” of flexible sheet piles: during the initial loading phase, low-stiffness sheet piles undergo significant elastic yielding deformation, actively releasing the accumulated stress within the soil and creating a macroscopic, temporary depressurization effect. Conversely, medium-to-high stiffness sheet piles, due to their minimal deformation and near-rigid constraint, fail to release stress effectively, causing their earth pressure to remain continuously high.
3.3. Variation Law of Bank Slope Top Settlement
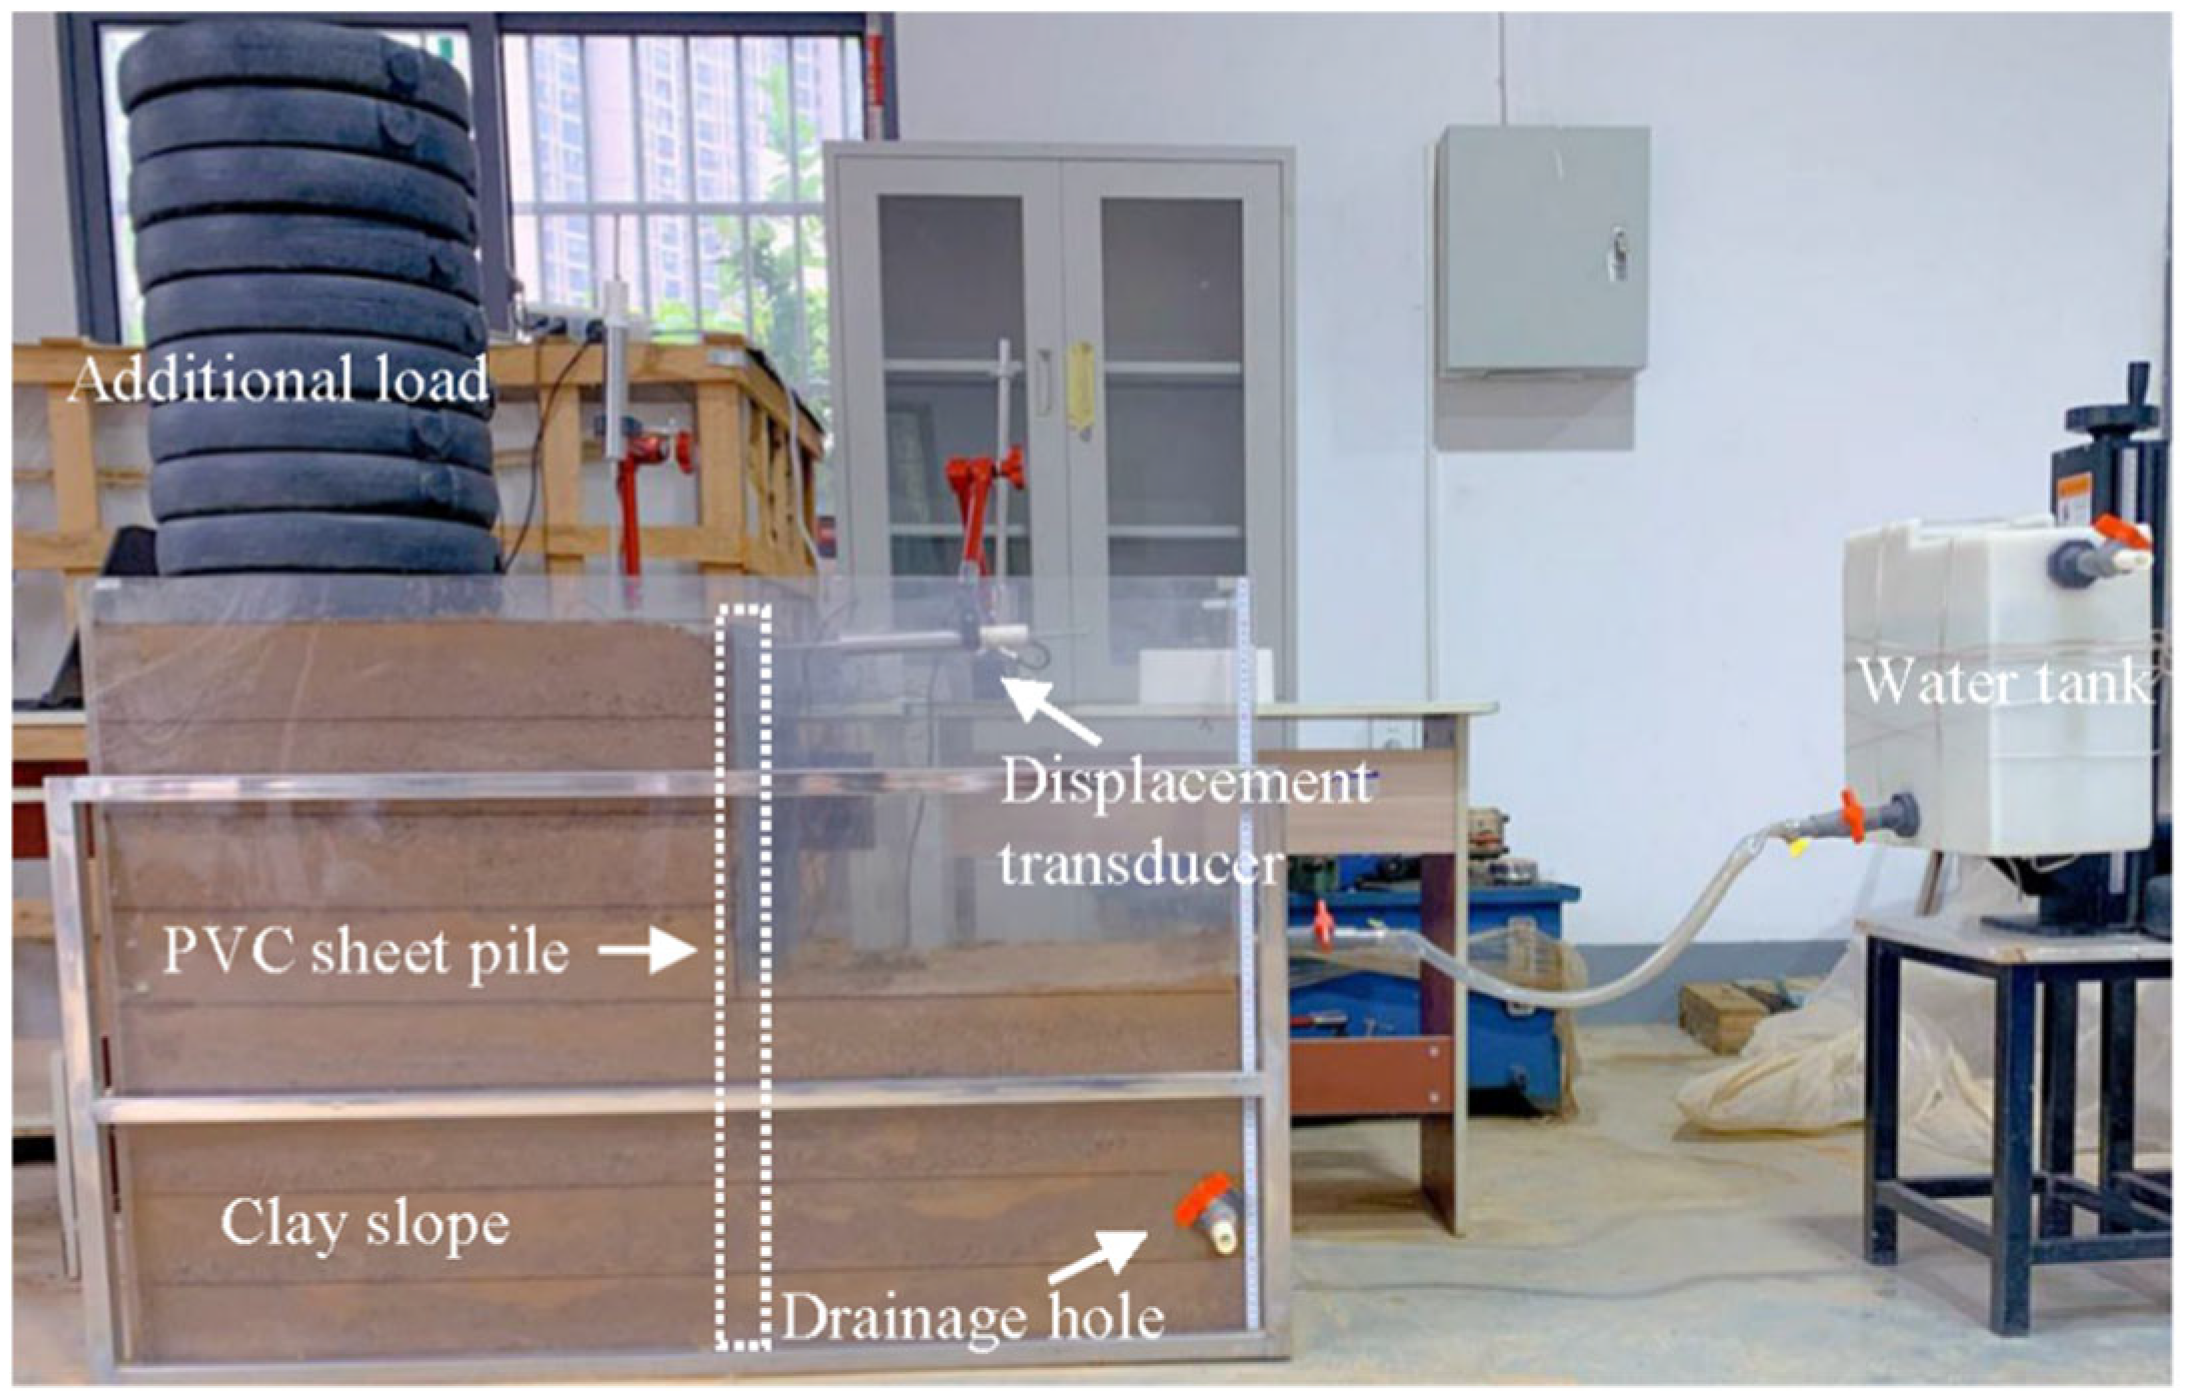
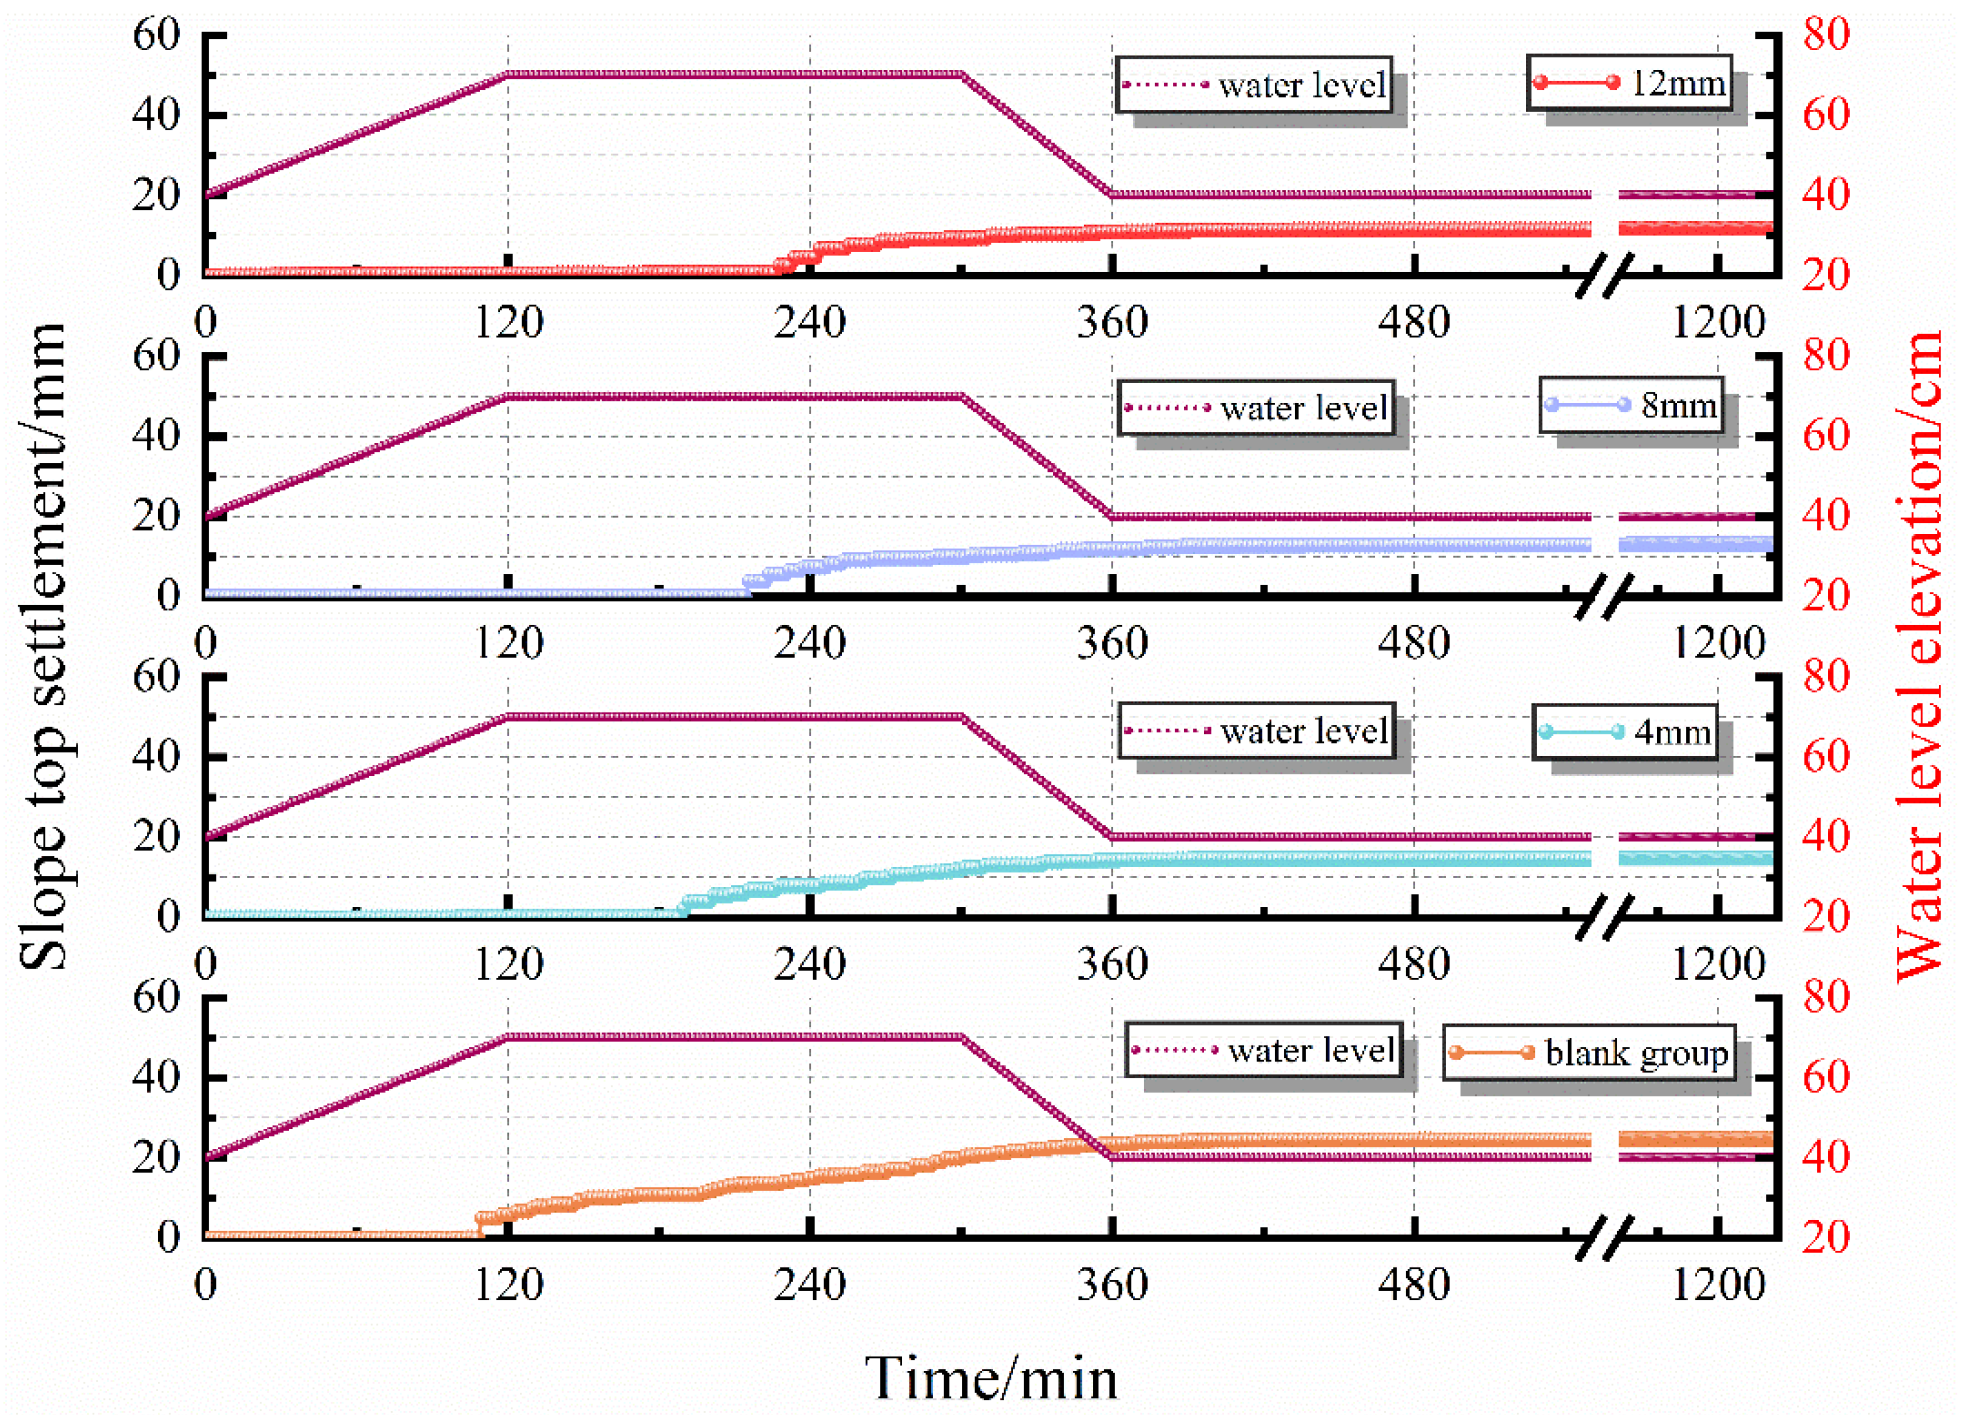
Figure 12 illustrates the comparison of the bank slope top settlement under the four sets of experimental conditions. Under the cyclic action of water level fluctuations, the sheet pile stiffness exerted a strong control effect on the initiation time and ultimate displacement of the bank slope settlement. Using a 1 mm settlement as the deformation initiation baseline, the initial settlement of the unsupported group occurred at 110 min during continuous moisture infiltration. However, following the installation of the 4 mm, 8 mm, and 12 mm sheet piles, the settlement initiation times were significantly delayed to 190 min, 216 min, and 228 min, respectively. Regarding the control of ultimate settlement, the maximum settlement at the slope top in the unsupported group reached 24.6 mm. The 4 mm, 8 mm, and 12 mm sheet pile groups effectively reduced this to 14.7 mm, 13.0 mm, and 11.8 mm, respectively, with the 12 mm sheet pile achieving a 52.0% reduction in ultimate settlement. Additionally, when the external water level dropped to its lowest point at 360 min, the slope settlement in all groups did not cease, indicating a significant lag in settlement deformation relative to water level changes. The primary reason for these trends is that the greater the stiffness of the sheet pile, the stronger the reverse structural constraint force it provides, forcing the soil mass to accumulate moisture over a longer period to overcome the resistance and produce macroscopic deformation.
3.4. Variation Law of Horizontal Displacement at the Pile Top
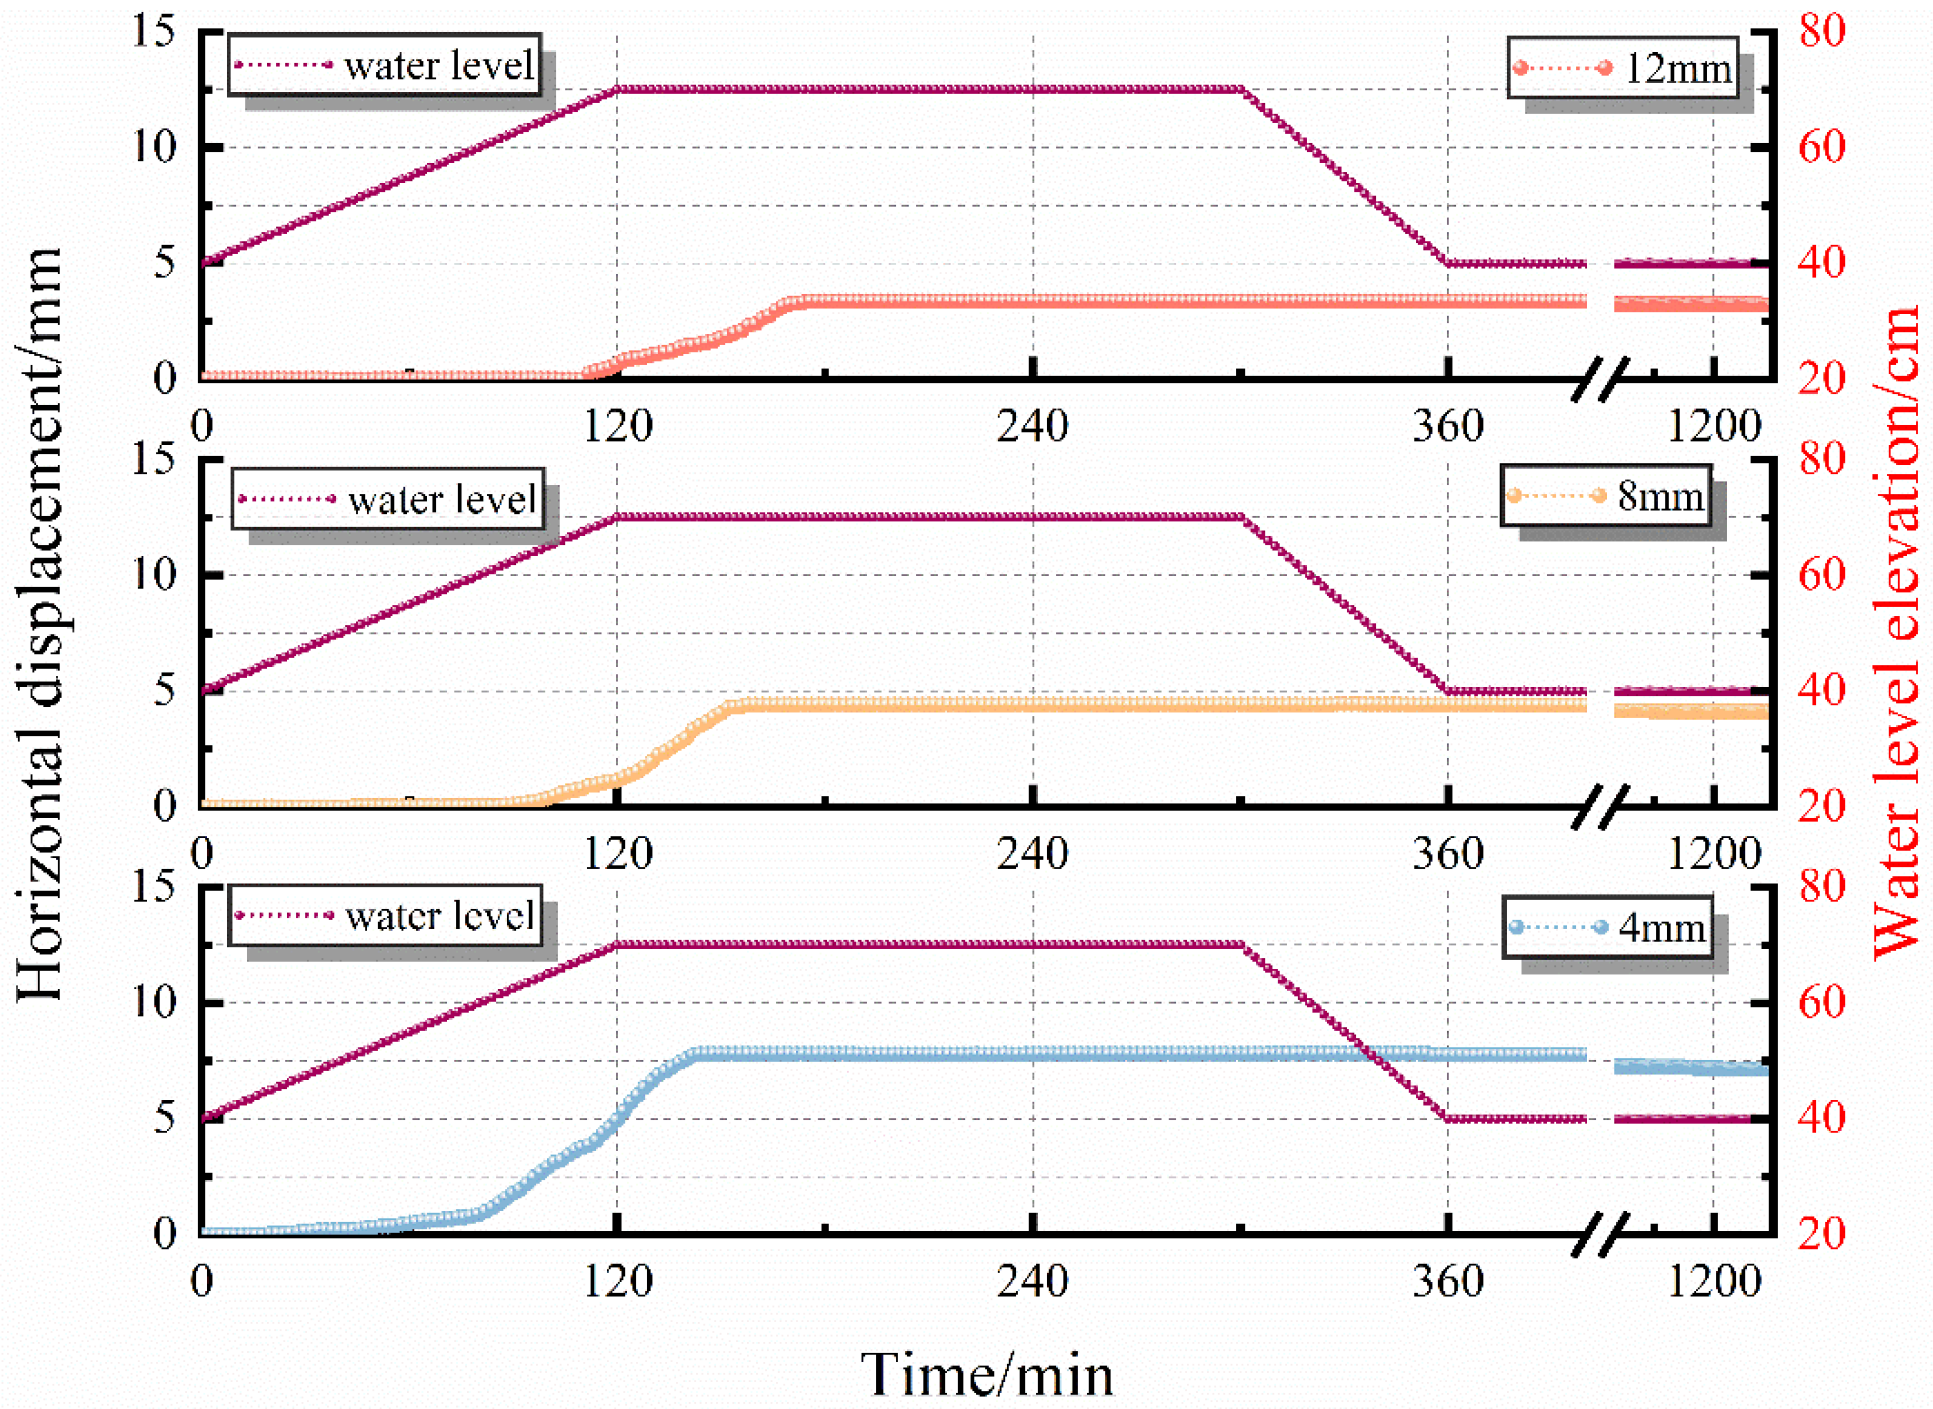
Figure 13 displays the dynamic evolution process of the horizontal displacement at the top of the sheet piles with different stiffnesses. Overall, the horizontal displacement at the pile top presented a trend of “stability—sudden increase—rebound convergence.” As the sheet pile stiffness increased, the displacement initiation time (based on reaching 0.6 mm) was gradually prolonged from 66 min for the 4 mm sheet pile to 104 min and 120 min for the 8 mm and 12 mm sheet piles, respectively. Concurrently, the maximum horizontal displacement was sequentially reduced from 7.8 mm for the 4 mm sheet pile to 4.45 mm and 3.4 mm for the 8 mm and 12 mm sheet piles, respectively. During the moisture dissipation stage after the water level dropped to its lowest point, all three groups of PVC sheet piles exhibited varying degrees of rebound reduction trends. The rebound amounts for the 4 mm, 8 mm, and 12 mm sheet piles were 0.70 mm, 0.37 mm, and 0.17 mm, respectively. This phenomenon indicates that flexible PVC materials are prone to flexural elastic deformation under load, and the lower the stiffness of the sheet pile, the higher the proportion of its elastic deformation. In the later stages of the experiment, as the moisture content in the slope decreased, the effective stress of the soil recovered, and the sliding force diminished, the elastic recovery toward the initial state was more pronounced in the low-stiffness sheet pile. Referring to the allowable mudline horizontal displacement value of 15 mm stipulated in the Technical Code for Plastic-Steel Sheet Pile Retaining Walls of Water Conservancy Projects, none of the three sheet pile groups reached the failure state.
3.5. Numerical Analysis of Bank Slope Seepage Field and Mechanical Deformation Characteristics of Sheet Piles
A three-dimensional numerical model was established based on the dimensions of the physical model and the sensor locations. To verify the accuracy and reliability of the numerical model, the simulated volumetric water content (VWC) of the unsupported bank slope under water level fluctuations was compared with the measured experimental data.
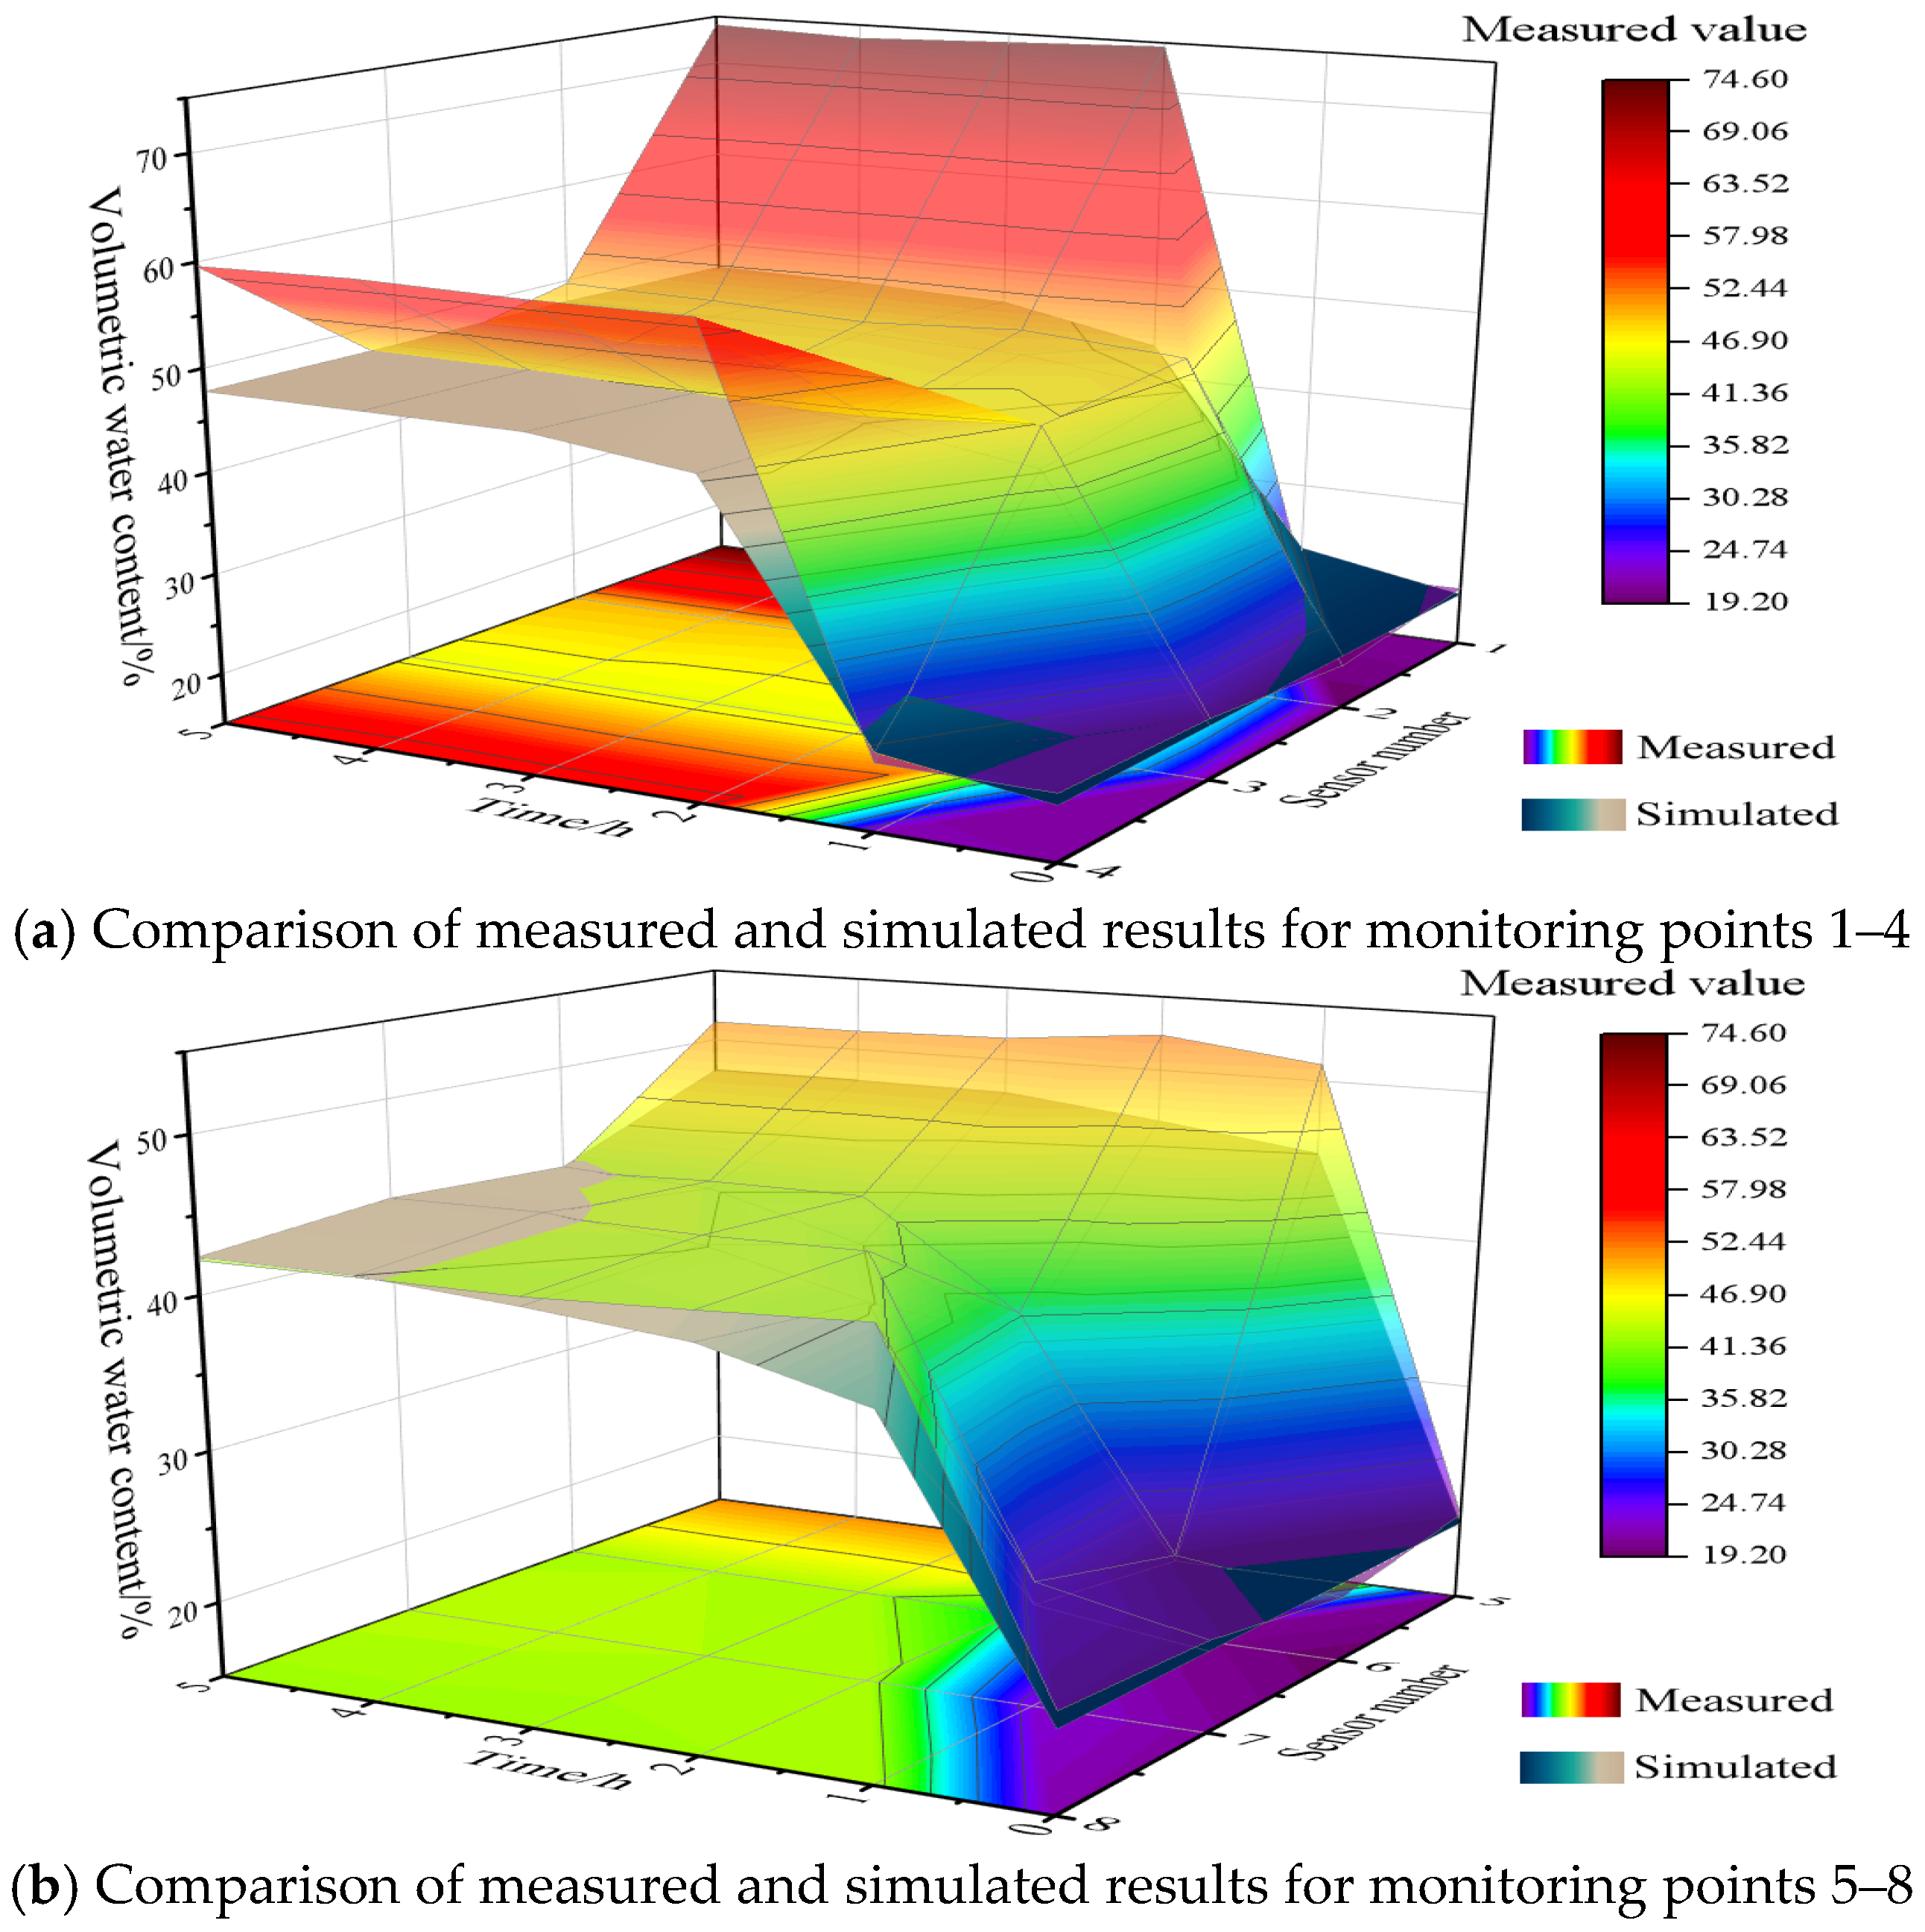
Figure 14 illustrates the comparison between the measured and simulated VWC at monitoring points 1 to 8 for the unsupported group. The overall trends of the two data surfaces are highly consistent. However, notable discrepancies were observed at monitoring points 1 and 4 during the 3–5 h period, with maximum errors reaching 41% and 23%, respectively. This is primarily attributed to a localized landslide at the slope crest during the physical test, which reduced the soil cover over these upper sensors and exposed them to excessive moisture—a physical deformation process that was not accounted for in the numerical simulation. Excluding these specific points, the variations in data at the remaining monitoring points exhibited a high degree of similarity, with errors tightly maintained within 10%. Considering that moisture infiltration in actual bank slopes is also influenced by environmental factors difficult to fully incorporate into the numerical model, such as ambient temperature, humidity, and evaporation, the current discrepancies are deemed entirely acceptable. These results demonstrate that the numerical model is fundamentally reliable and can serve as a robust basis for subsequent extended studies.
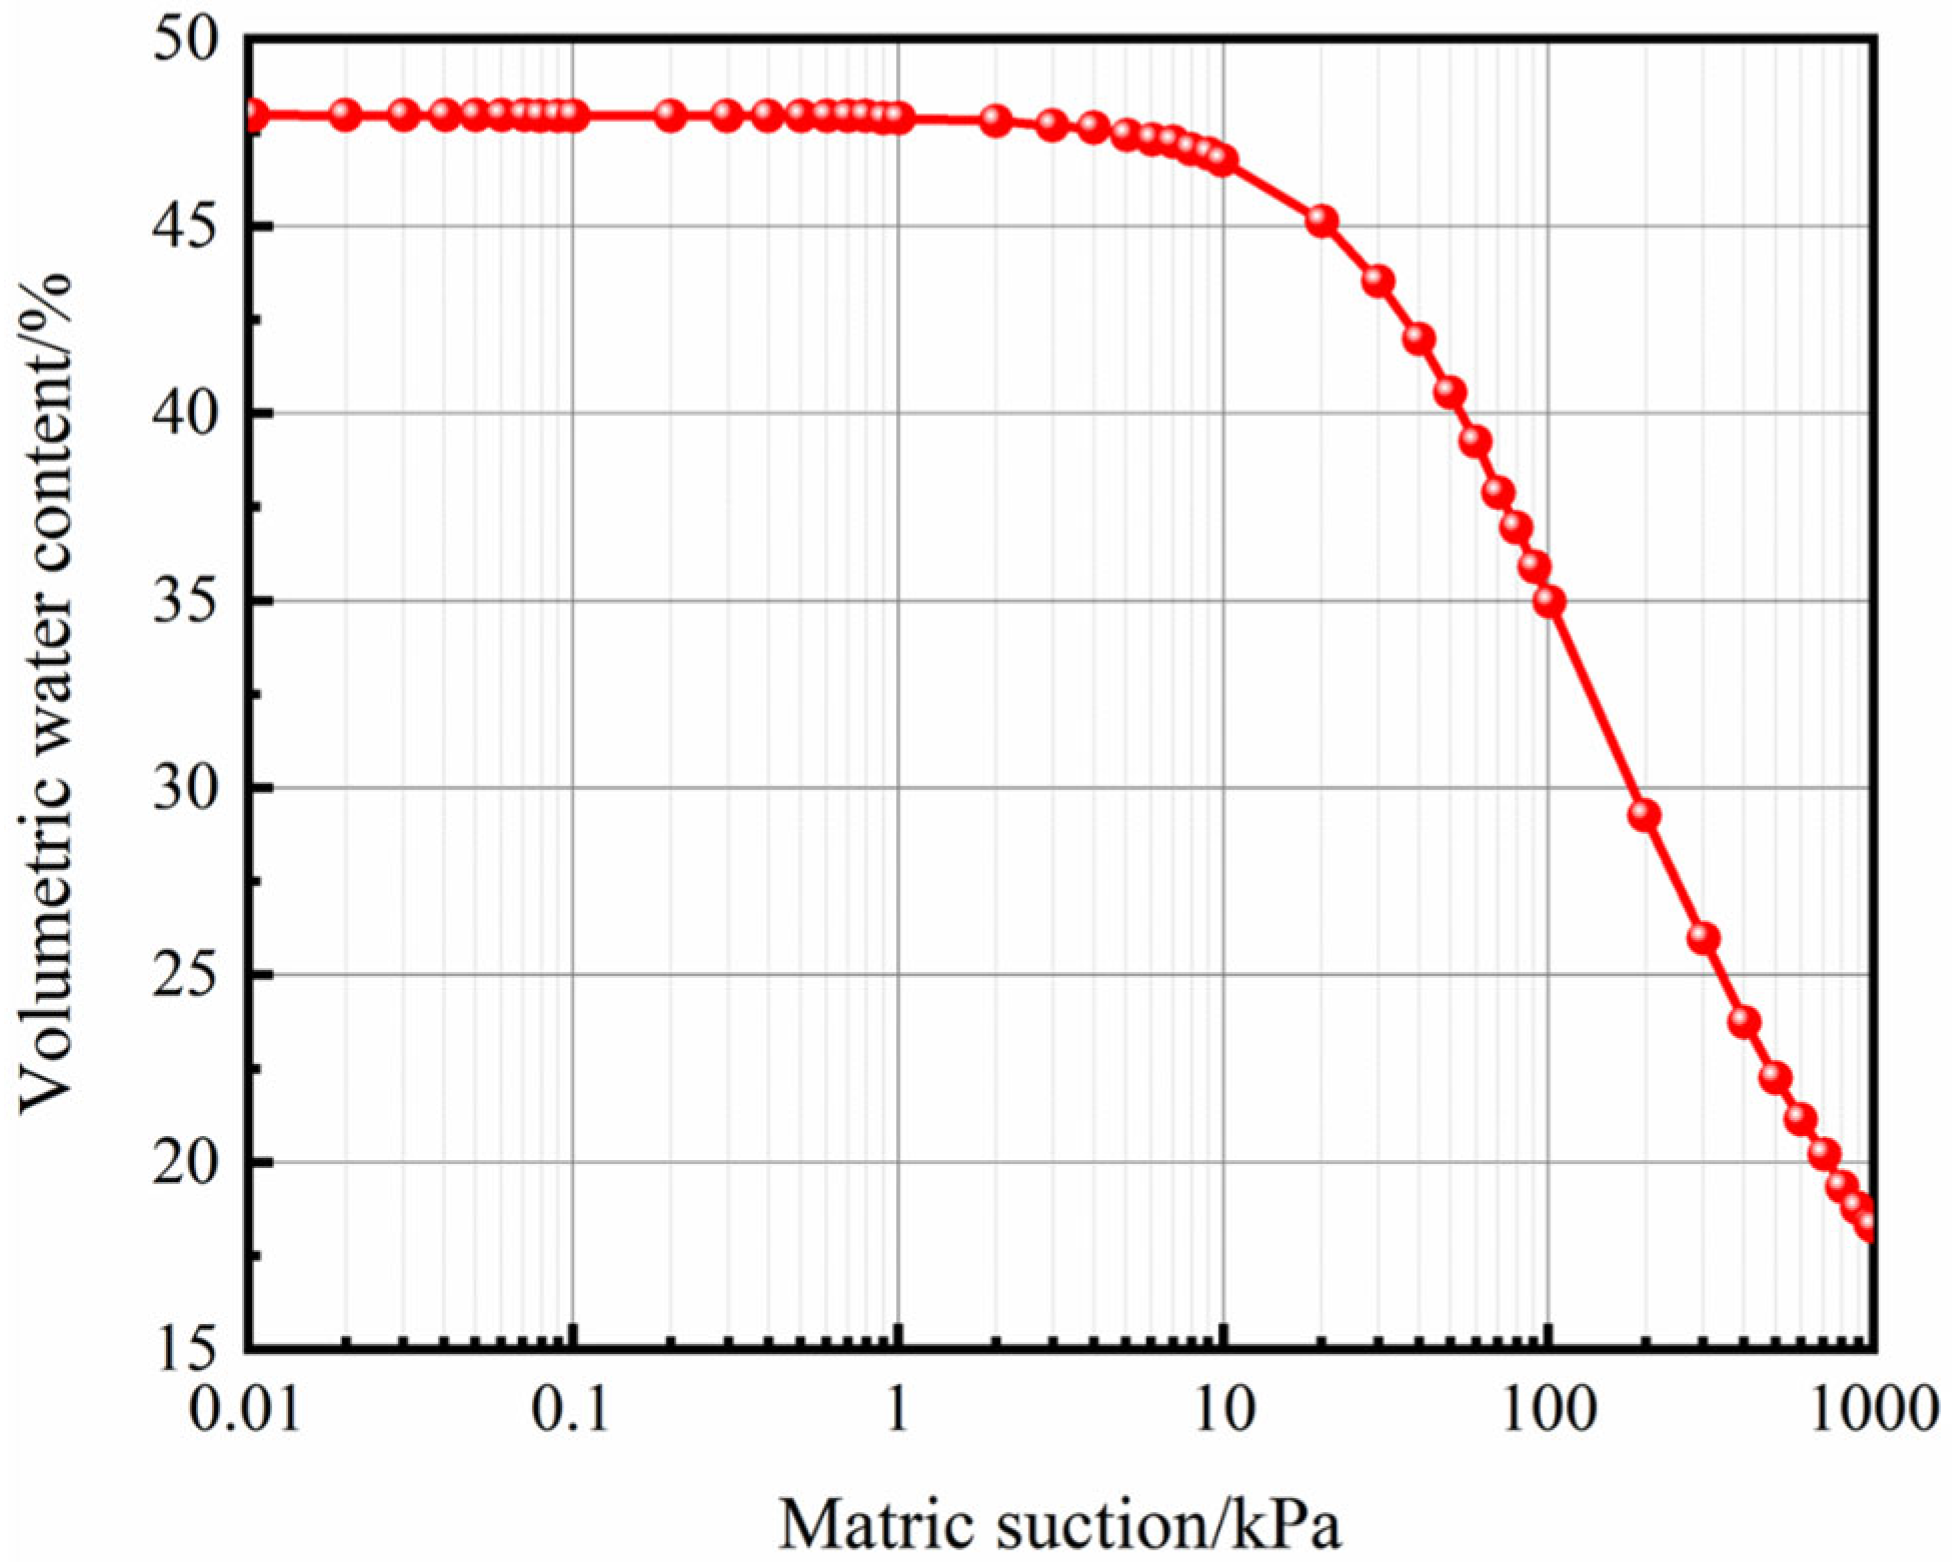
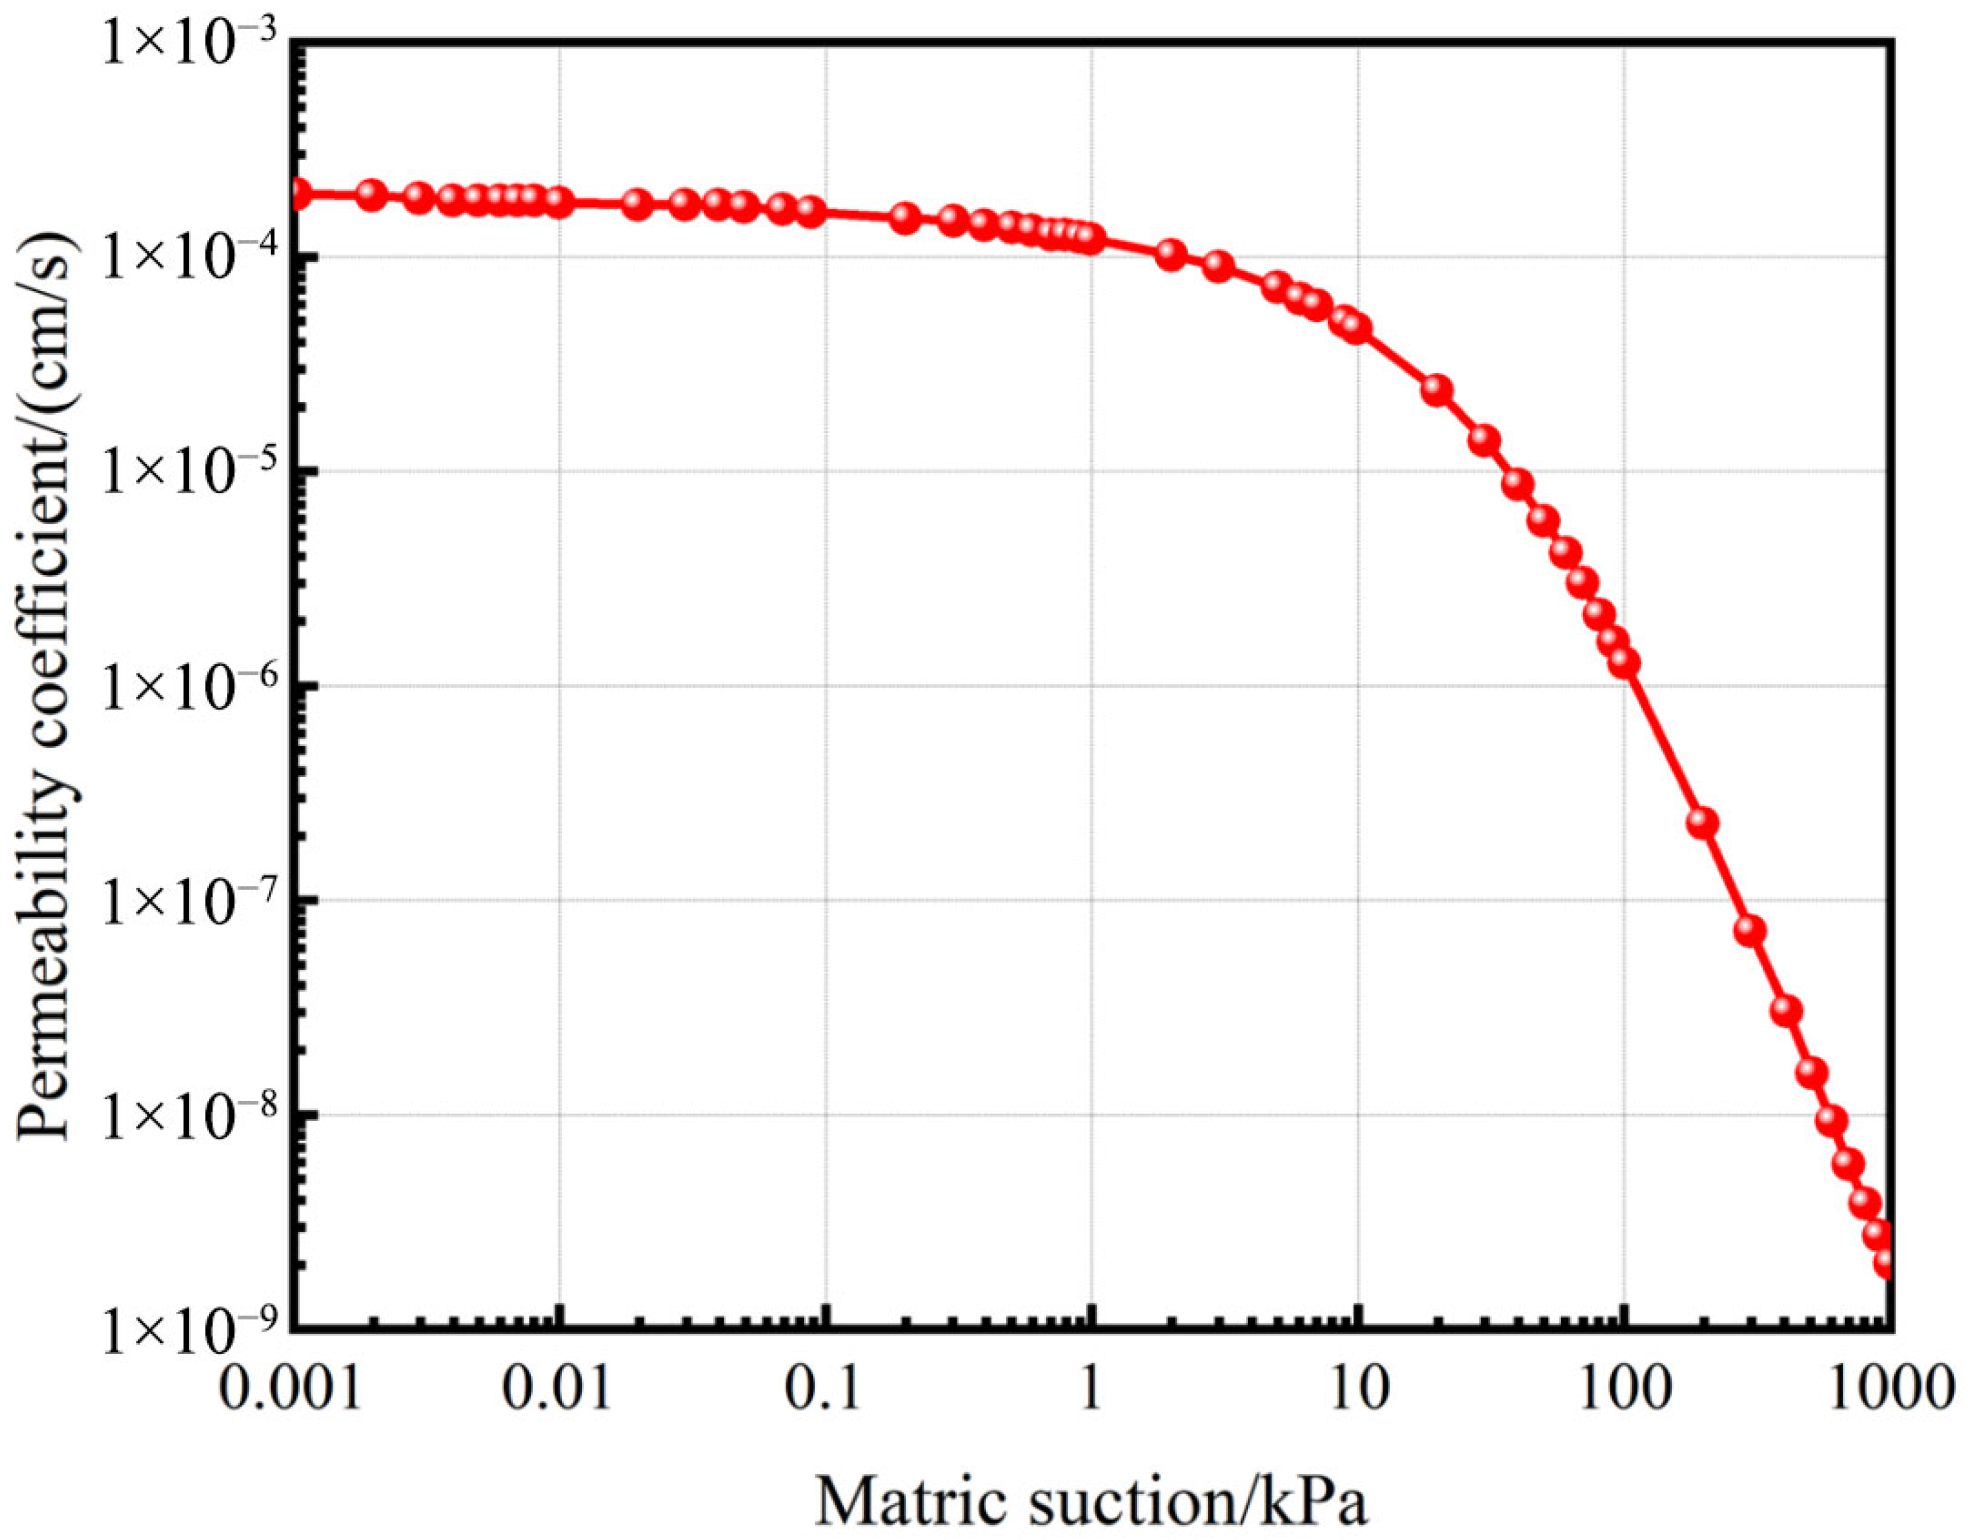
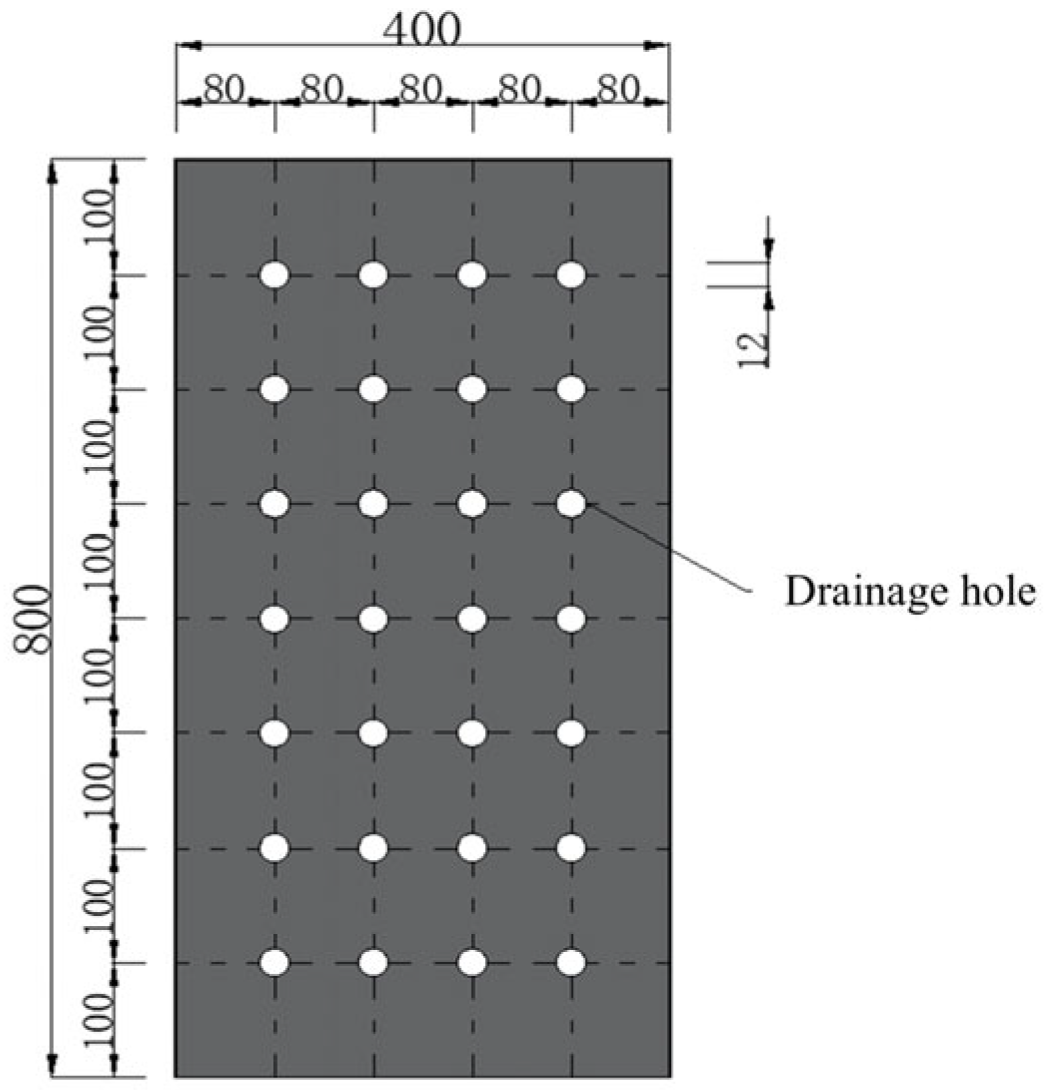
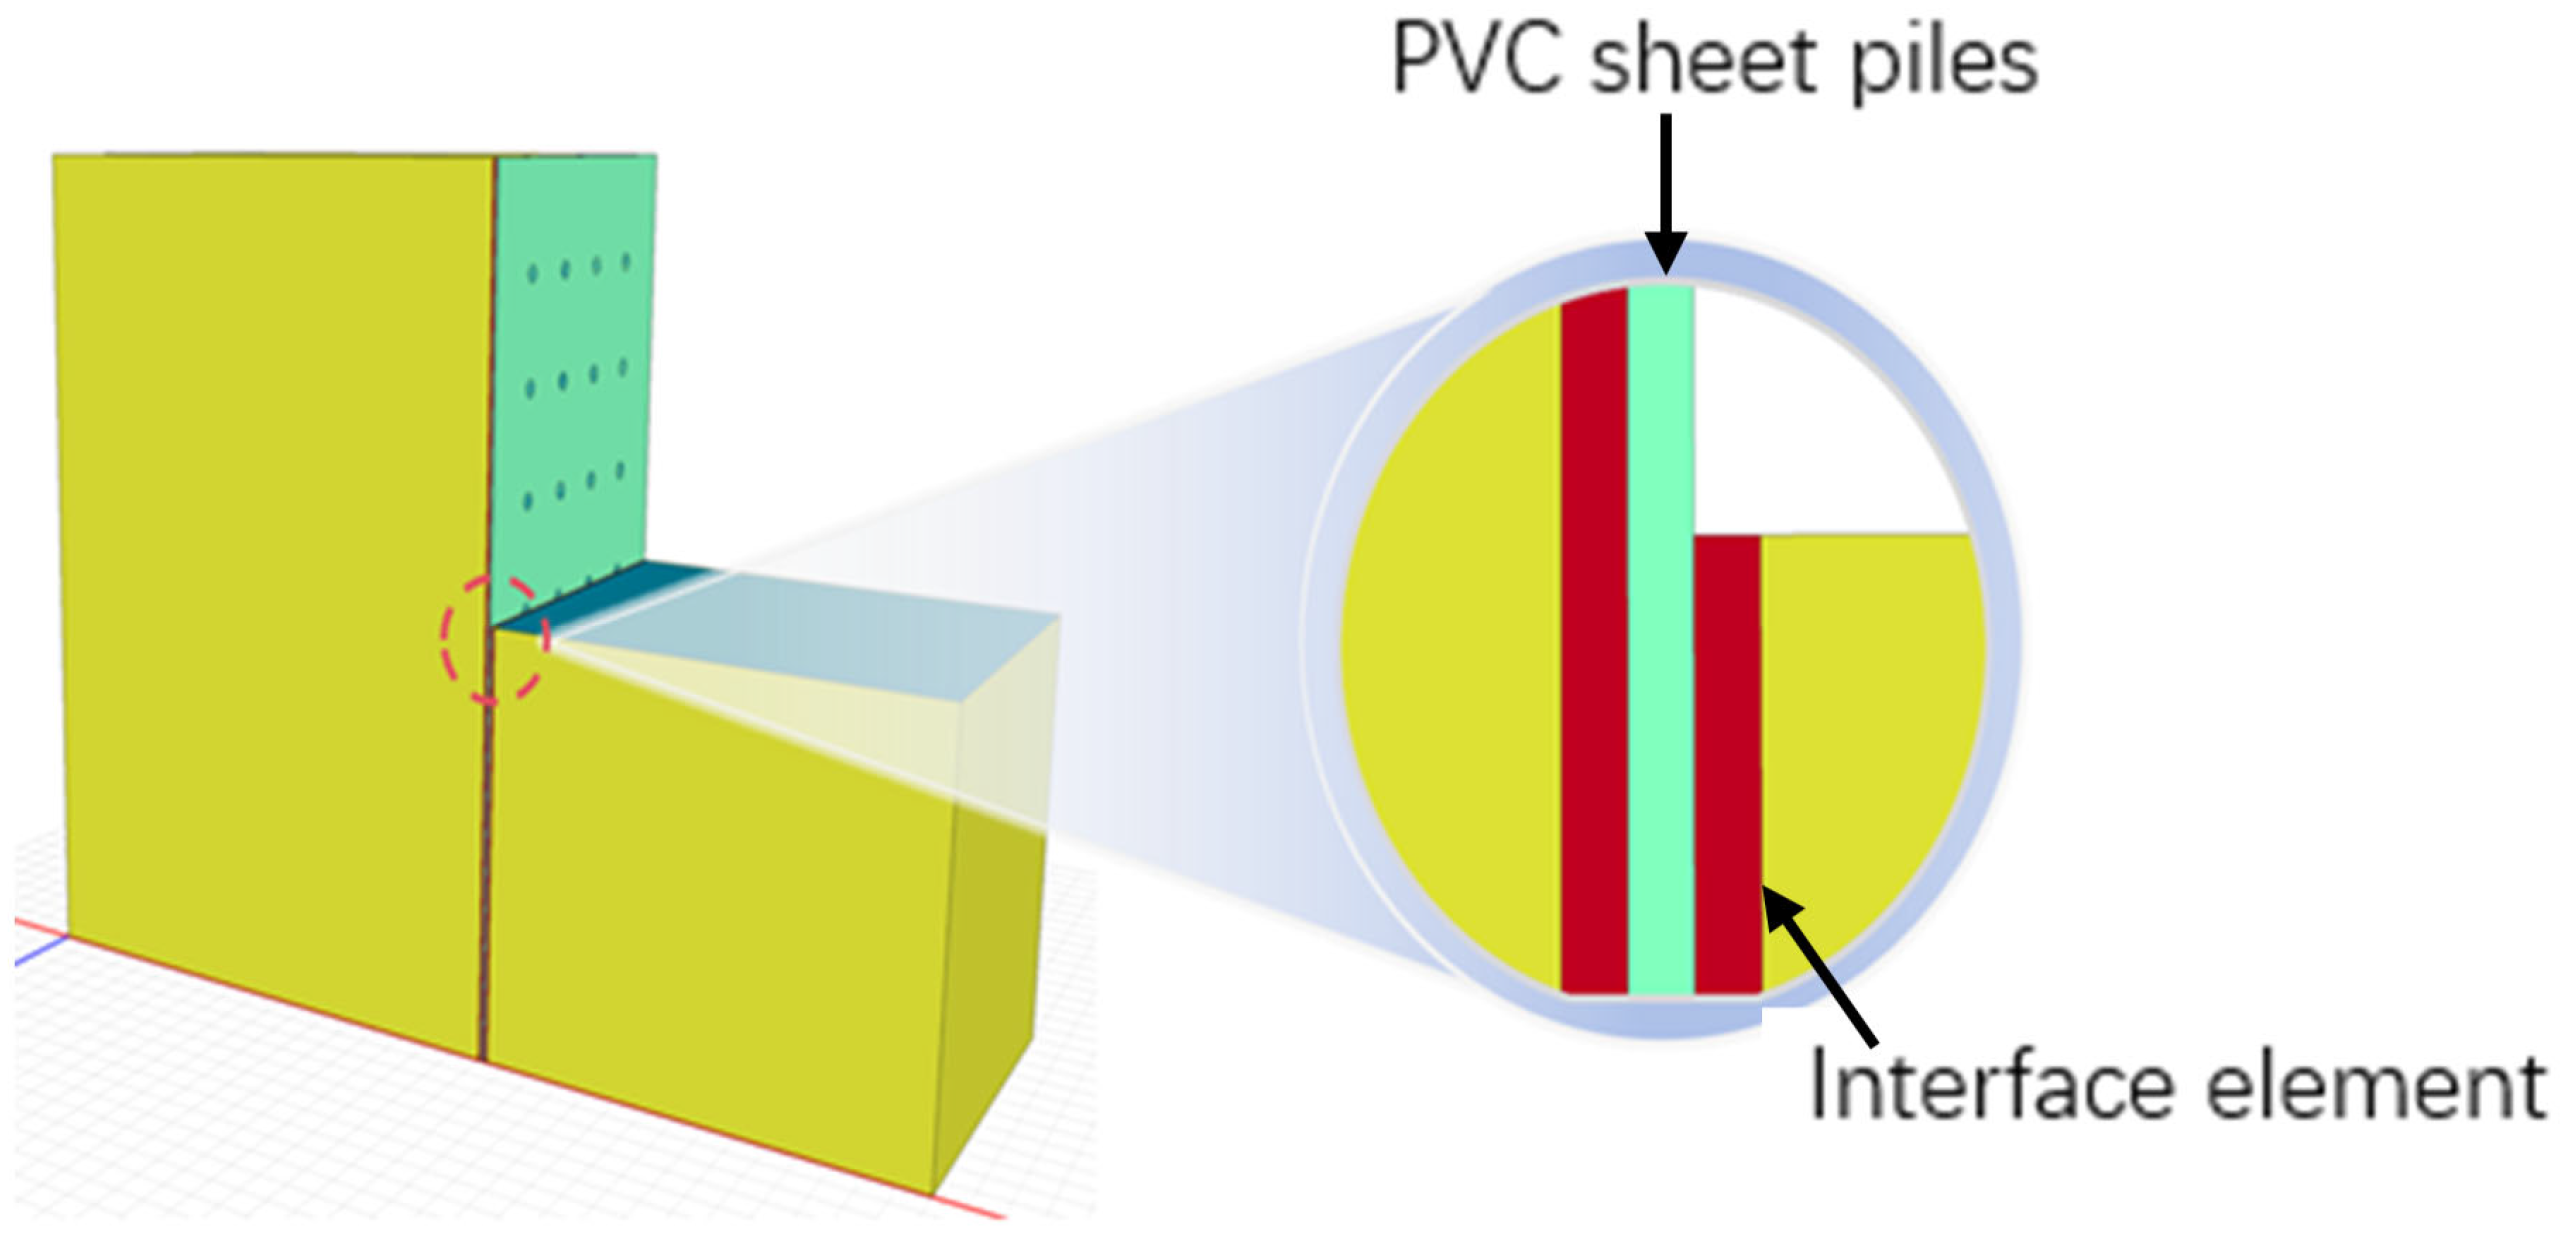
In this study, the Geo-Studio [2022] simulation software was selected to conduct a stability analysis of the bank slope supported by perforated sheet piles under the coupling of transient seepage and stress–strain using a three-dimensional model. The bank slope soil utilized a saturated/unsaturated model, with its hydrological parameters defined by previous VG model fitting and permeability tests. The initial moisture content (18%) was assigned via the corresponding negative pore water pressure. The mechanical properties of the soil all adhered to the Mohr-Coulomb elastoplastic constitutive criterion. The PVC sheet pile was modeled using linear elastic solid elements, with an aquiclude applied to the unperforated areas, while the drainage holes were equivalently modeled as cylindrical elements with high hydraulic conductivity (1 m/s) to simulate local unidirectional seepage. The bottom of the model was fixed and impermeable, and lateral constraints were applied to both sides to eliminate boundary effects. The mechanical parameters of the model are listed in
Table 5, and the 3D model diagram is shown in
Figure 15.
3.5.1. Dynamic Influence Law of Water Level Fluctuation Rate on the Pore Water Pressure Field of the Bank Slope
This section conducted a multi-scenario parametric study. Given that the numerical model was proportionally scaled up, the water level fluctuation condition parameters were matched and adjusted accordingly to ensure the simulation process could fully represent the response laws of the physical model under complex hydrological conditions (detailed in
Table 6). By comparatively analyzing the coupling characteristics of the internal hydraulic response and structural stress–strain of the bank slope under different fluctuation rates, this study aims to reveal the key influence mechanisms of bank slope instability induced by water level fluctuations.
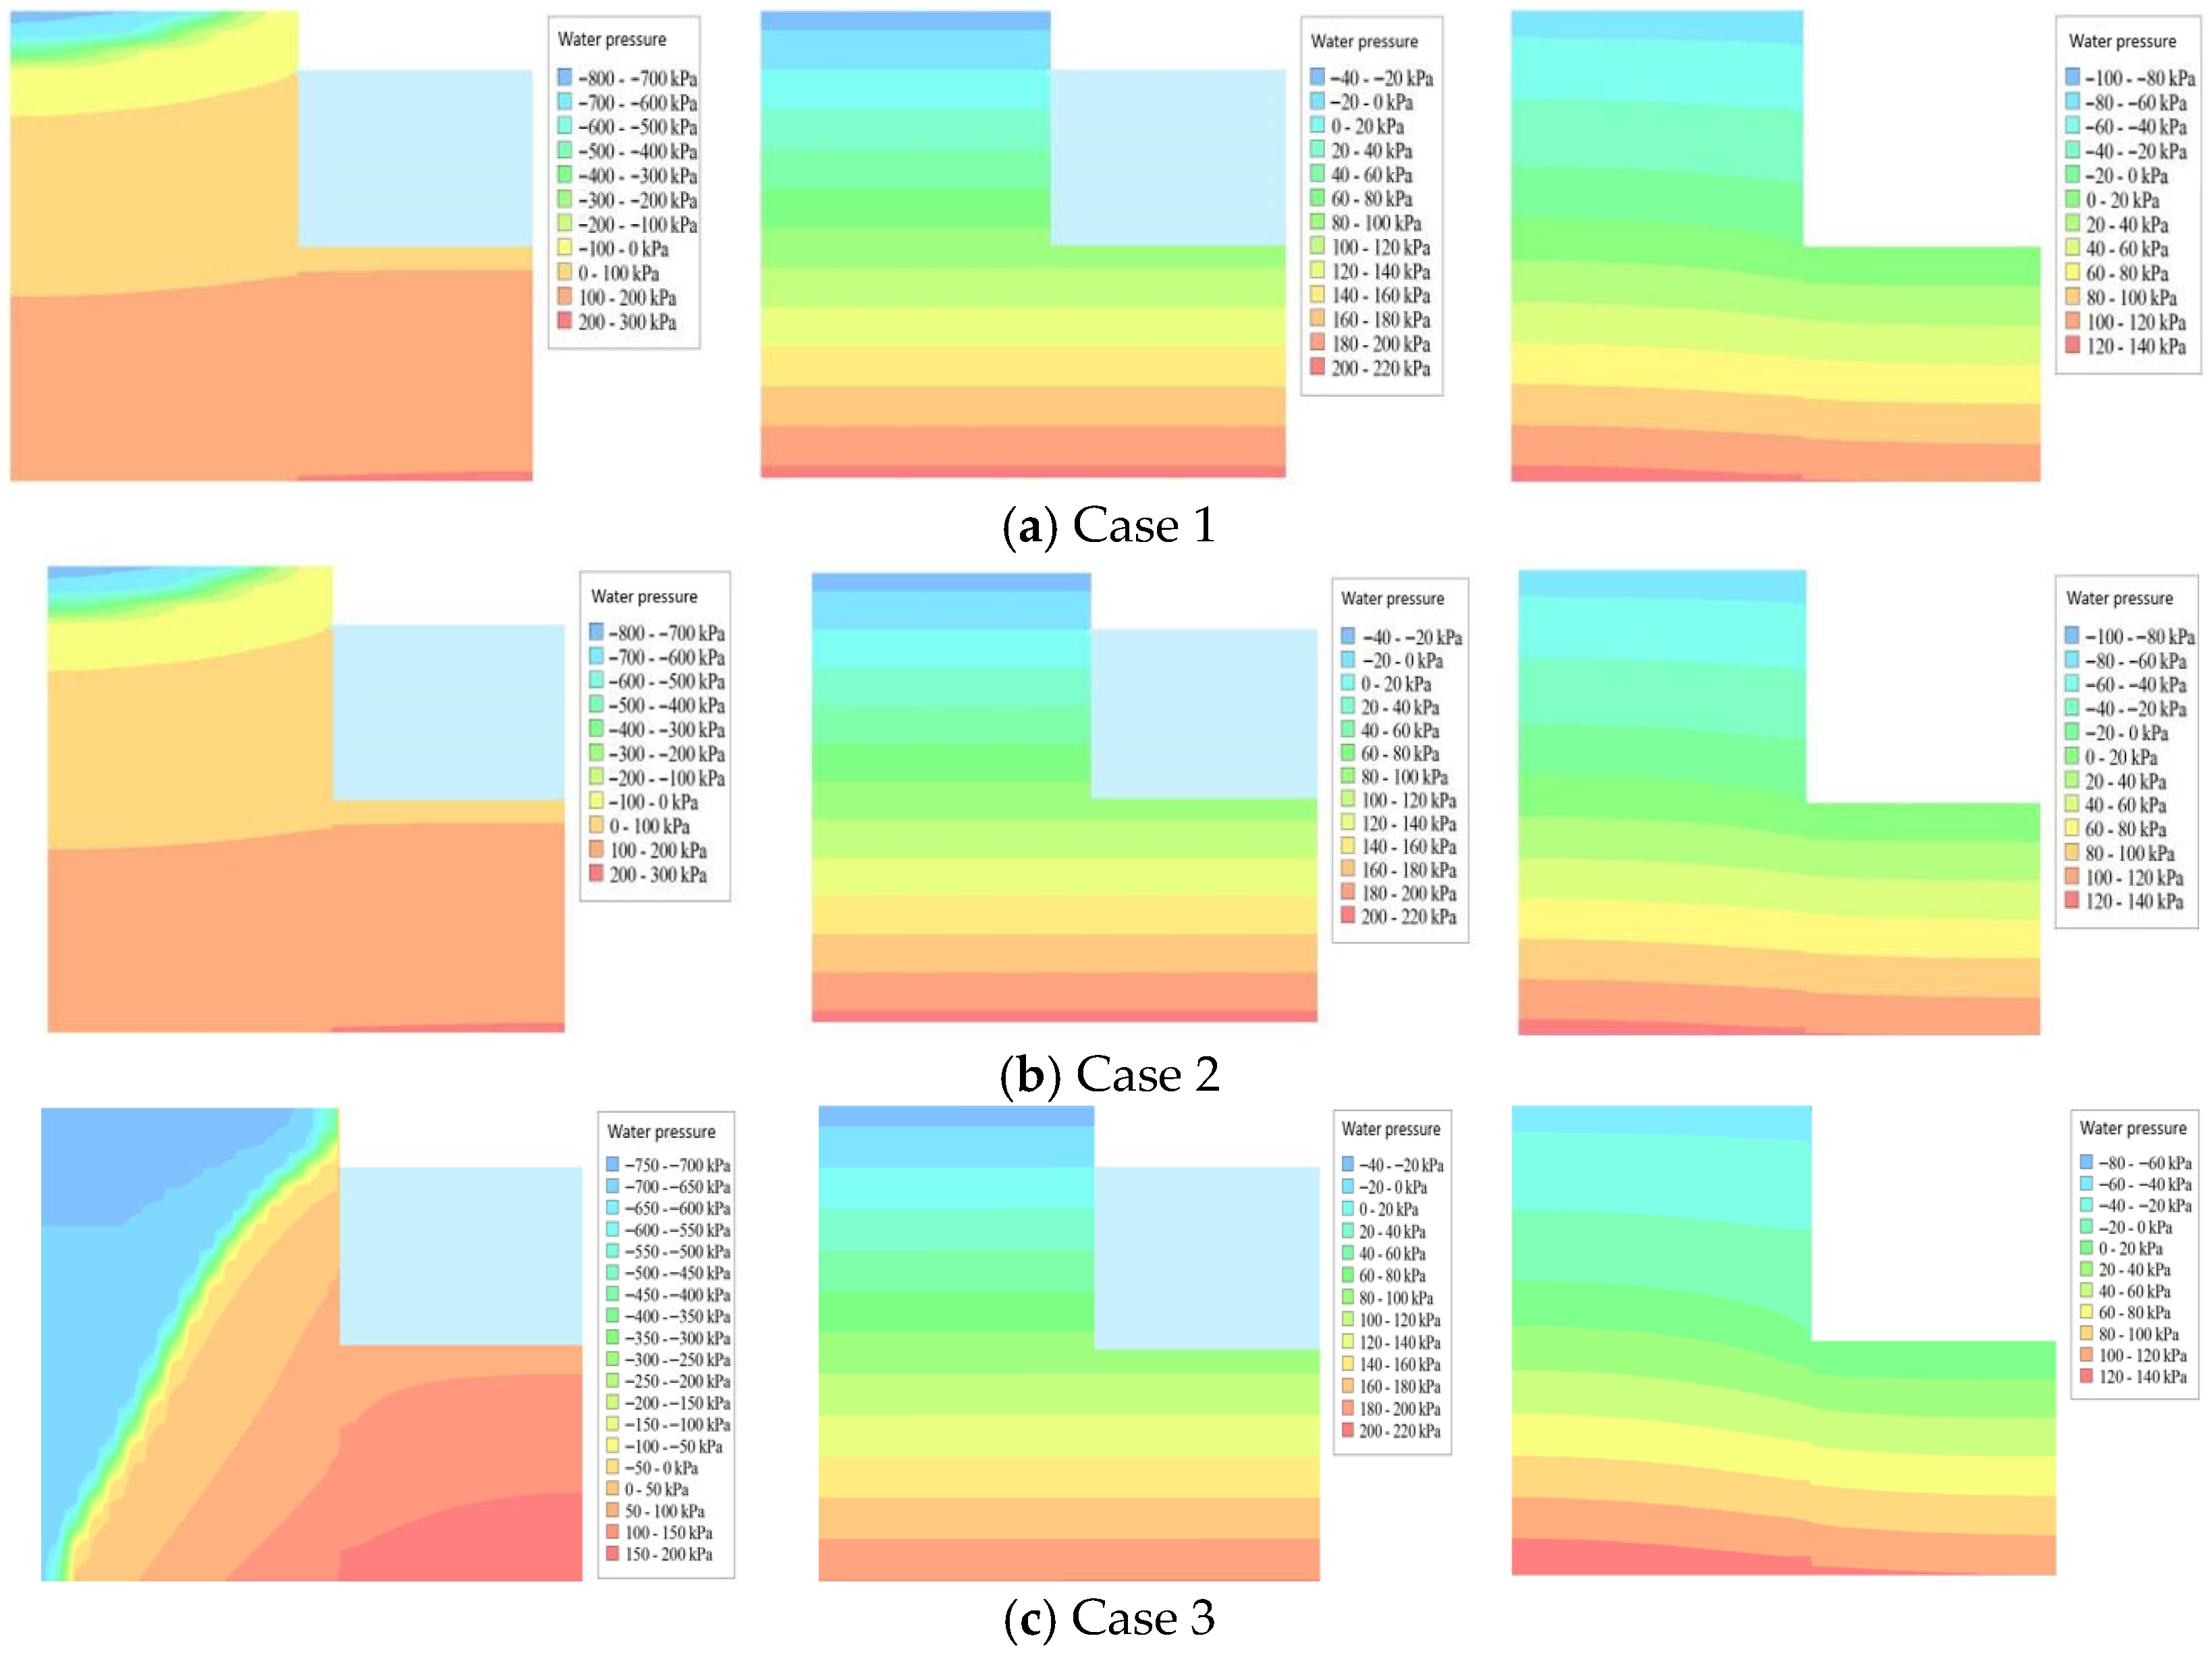
Figure 16 reveals the dynamic influence law of the water level fluctuation rate on the evolution of the bank slope’s pore water pressure field. The study found that the lag effect of the pore pressure response intensified significantly with the accelerated rate of water level change, and it exhibited diametrically opposite control effects on slope stability at different stages of the hydrological cycle. Specifically, during the water level rising stage, rapid elevation led to a severe lag in the internal pore pressure response and steep contour lines. In the short term, this lag effect effectively restricted the inward cumulative diffusion of pore pressure, relatively maintaining a higher effective stress in the soil, which promoted the initial stability of the bank slope. After entering the maximum water level maintaining stage (90 d), with continuous infiltration seepage, the early dynamic lag effect gradually dissipated, and the overall slope mass tended toward saturation. Ultimately, the pore pressure field distribution under various rate conditions trended toward equilibrium and high consistency. However, during the water level drawdown stage, the dissipation of internal pore pressure severely lagged behind the sudden drop in the external water level. More critically, the seepage-blocking effect of the sheet pile itself further deteriorated the drainage conditions of the slope. The sudden change in the soil-water coupling boundary triggered an intense excess pore water pressure within the slope directed toward the water-facing side. The overall law indicates that a faster water level drawdown rate not only results in stronger seepage hysteresis but also induces a higher amplitude of excess pore water pressure. This abnormal pore pressure drastically weakened the effective stress of the soil, significantly increasing the instability risk of outward sliding of the bank slope.
3.5.2. Influence Law of Water Level Fluctuation Rate on the Mechanical Deformation Characteristics of Sheet Piles
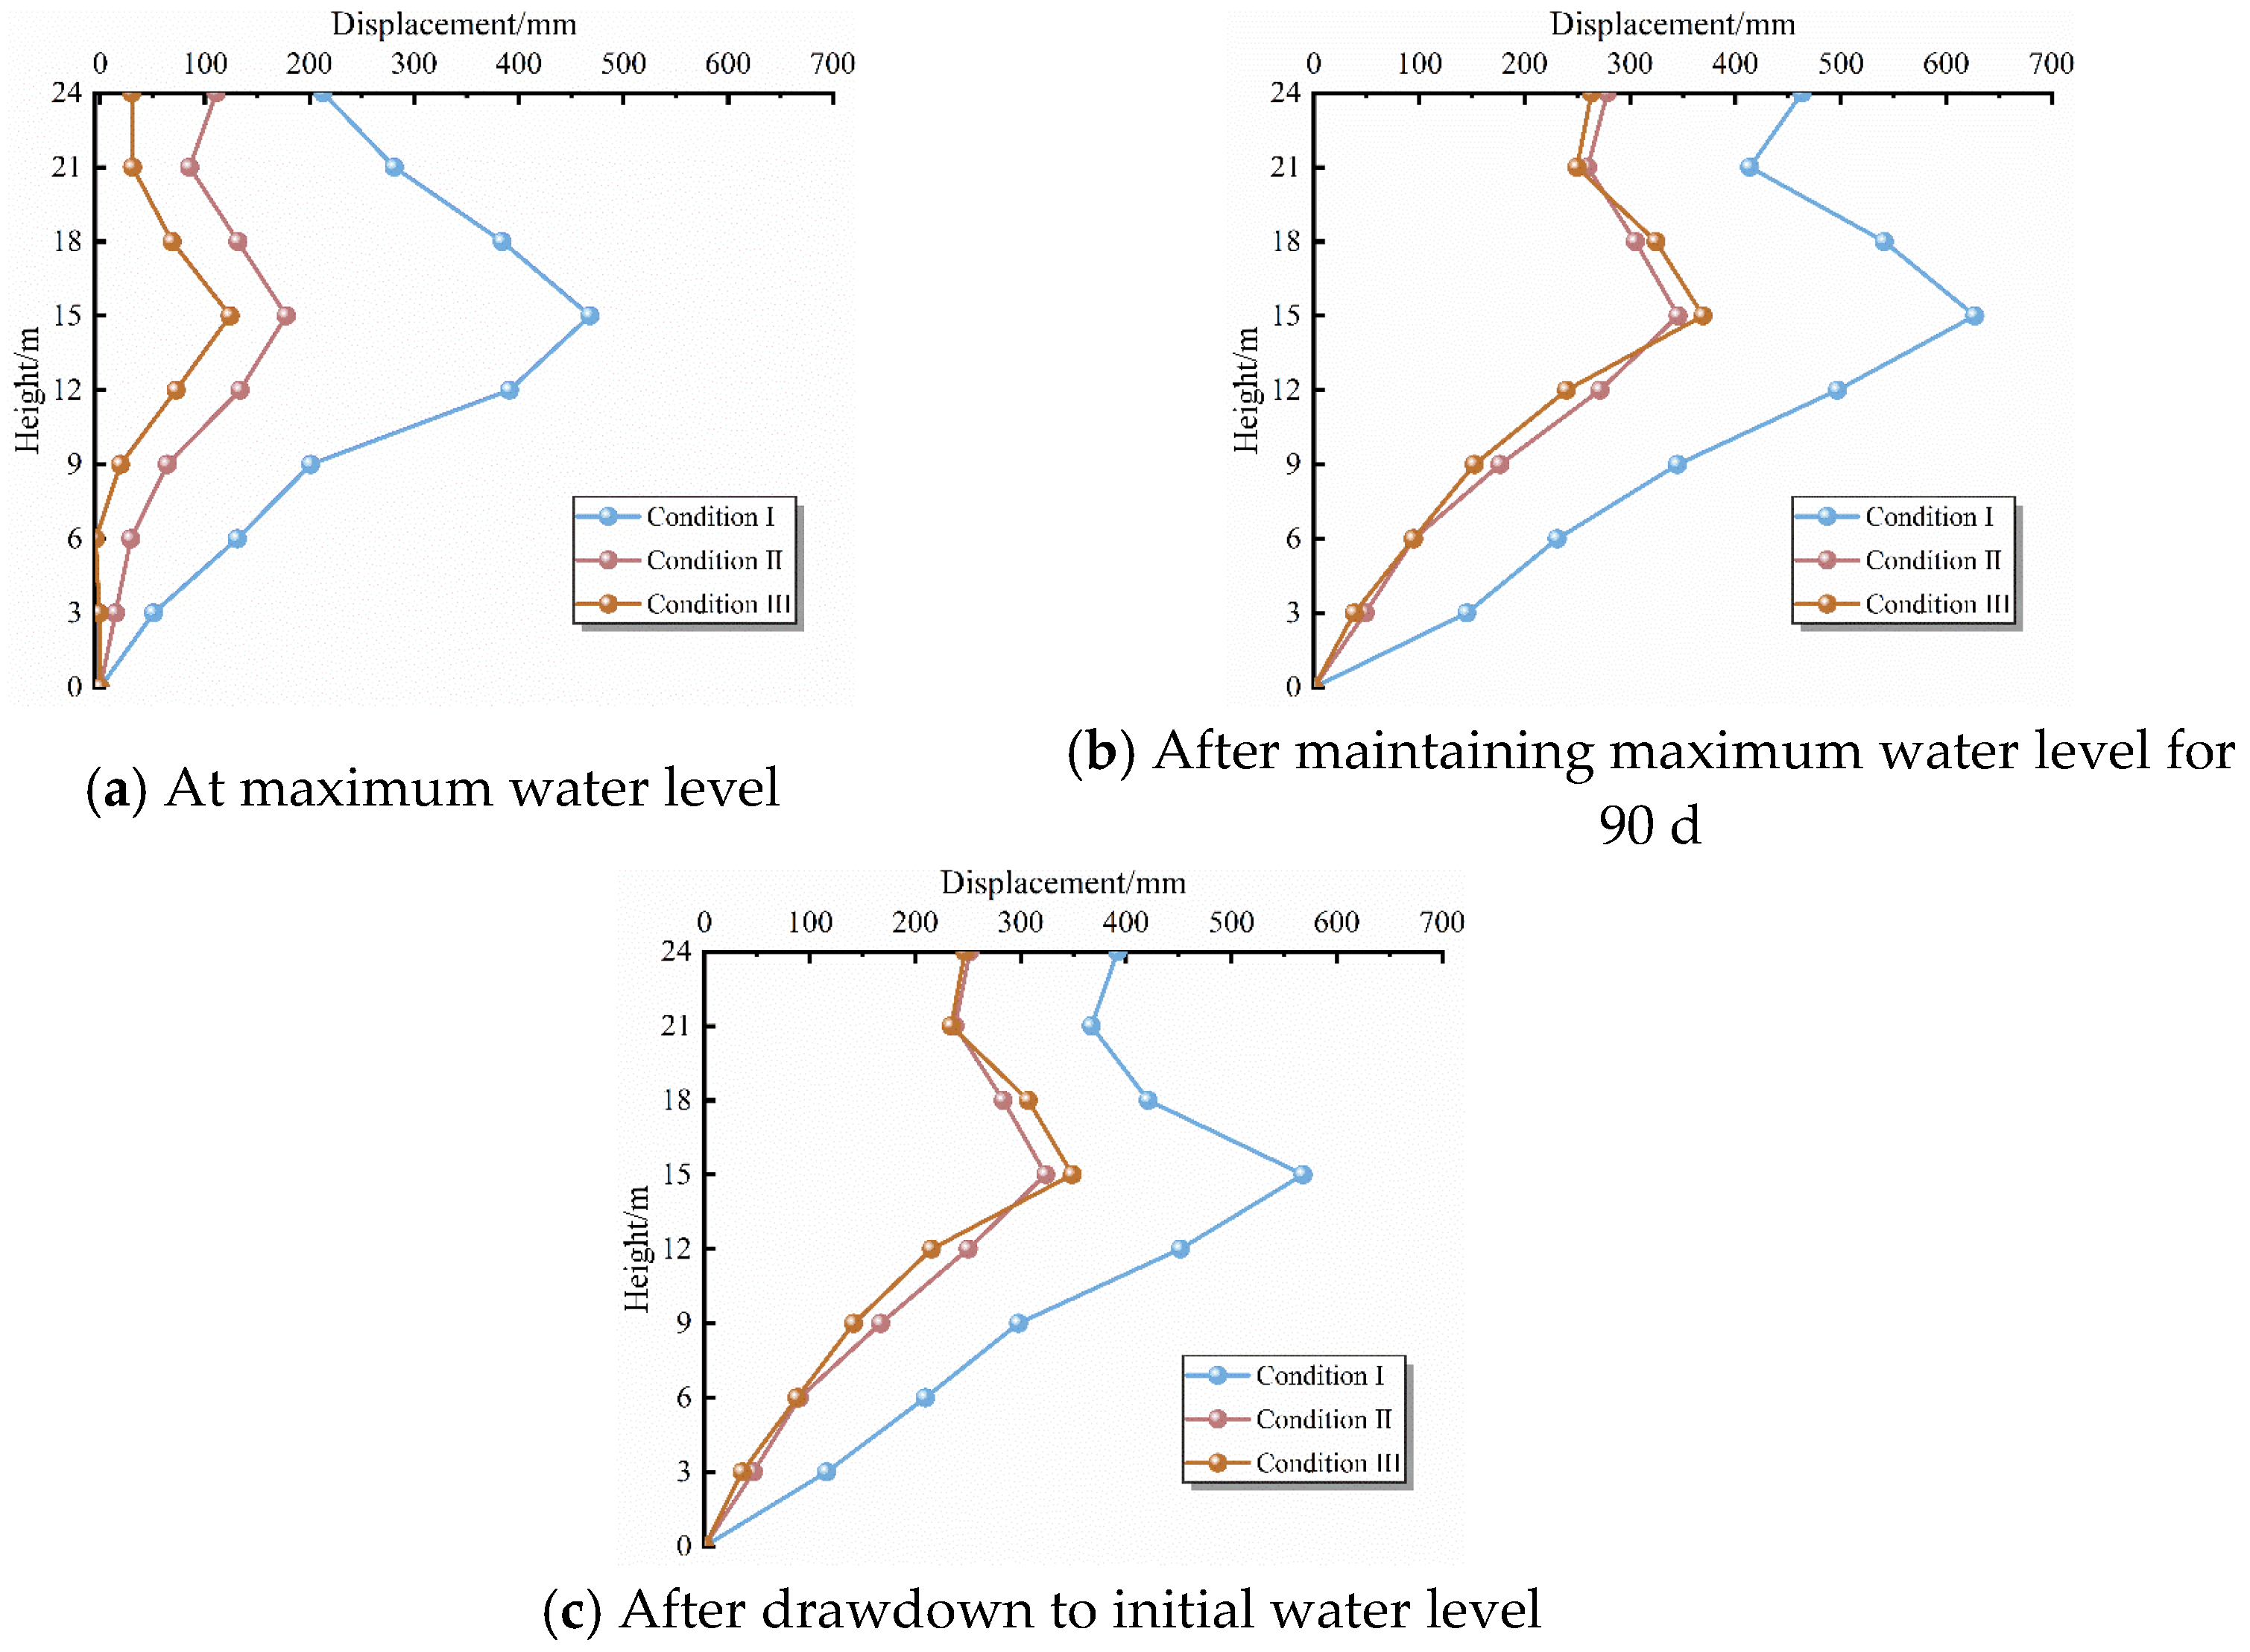
Figure 17 reveals the dynamic driving mechanism of the water level fluctuation rate on the evolution of the horizontal displacement of the PVC sheet pile. Overall, the pile displacement exhibited a “parabolic” distribution along the depth, with the maximum displacement consistently occurring at 15 m (which was taken as the control point for structural failure). Research indicates that the water level fluctuation rate exerted diametrically opposite control effects on pile deformation at different stages: During the water level rising stage, a slower rising rate prolonged the time for moisture infiltration and soil softening. This caused the downward sliding force from the inside of the slope to the outside to far exceed the constraint of the external hydrodynamic pressure, thereby inducing greater positive displacement of the pile. During the maximum water level maintaining stage (90 d), continuous seepage erosion persistently strengthened the downward sliding force, leading to a secondary accumulation of pile displacement under all rate conditions. During the water level drawdown stage, although the dissipation of soil moisture and the sheet pile’s own elasticity prompted an overall reduction in displacement (rebound), the unloading of external hydrodynamic pressure coupled with the superposition of outward excess pore water pressure within the slope significantly weakened the elastic recovery amplitude of the sheet pile. The results indicate that a faster drawdown rate results in a smaller retraction amplitude of the pile displacement.
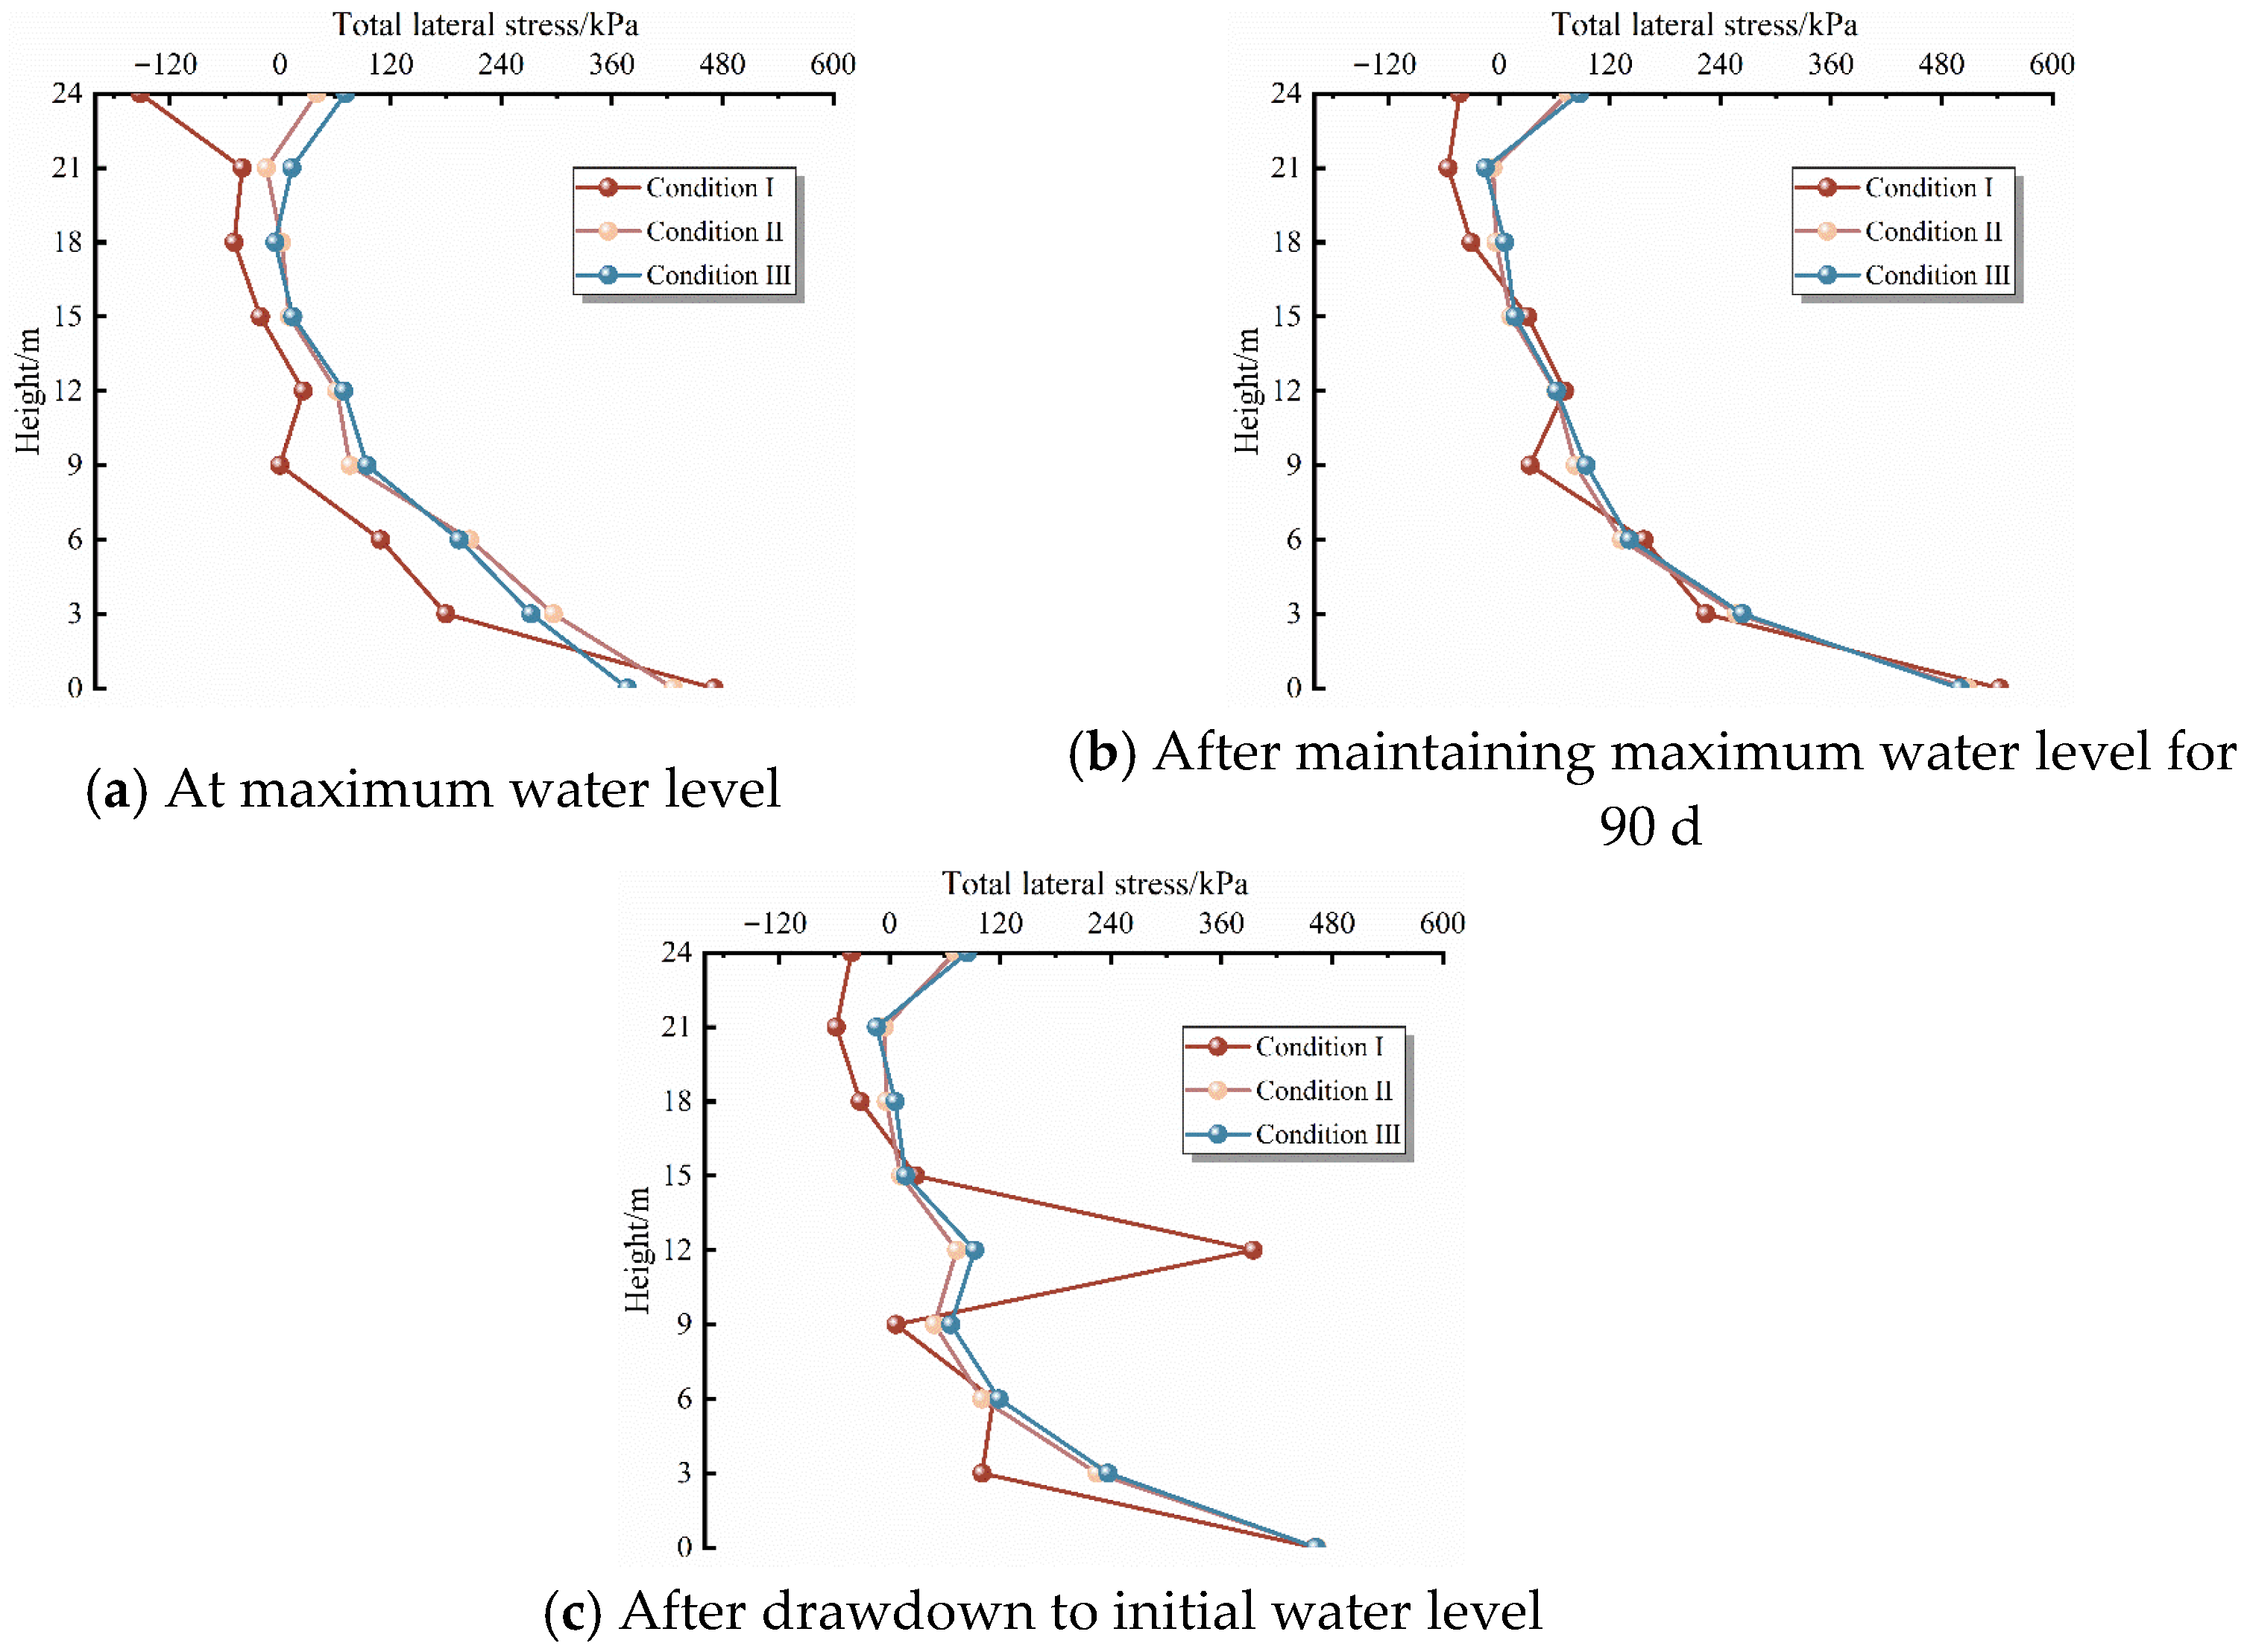
Figure 18 reveals the evolution law of the total horizontal stress on the back-water side of the pile shaft under different water level fluctuation rates. The total horizontal stress of the pile presented a “C”-shaped distribution with increasing buried depth. This stress redistribution is beneficial for reducing the mid-span stress and thereby lowering the bending moment; therefore, the location of maximum horizontal displacement (measuring point at 15 m height) was selected as the representative point for analysis. During the water level rising stage, when the rising rate was relatively fast, the soil was less prone to deform and expand, and the hydrodynamic pressure generated by the water level on the right side increased, resulting in an increase in the stress borne by the pile. During the maximum water level maintaining stage (90 d), moisture continued to infiltrate the bank slope, and the pore water pressure within the slope and the downward sliding force directed toward the water-facing side gradually increased, leading to an increase in the total horizontal stress. During the water level drawdown stage, the unloading of external hydrodynamic pressure caused a decrease in the total horizontal stress of the pile. However, the delayed variation in the groundwater level within the slope generated excess pore water pressure directed from the inside to the outside of the slope. This excess pore water pressure acted to increase the total horizontal stress, and this effect intensified with the accelerated rate of water level drawdown, resulting in a diminished magnitude of decrease in the total horizontal stress compared to the previous stage.
3.6. Numerical Analysis of Overall Stability of Sheet Pile Bank Protection
3.6.1. Effect of Water Level Fluctuation Rate
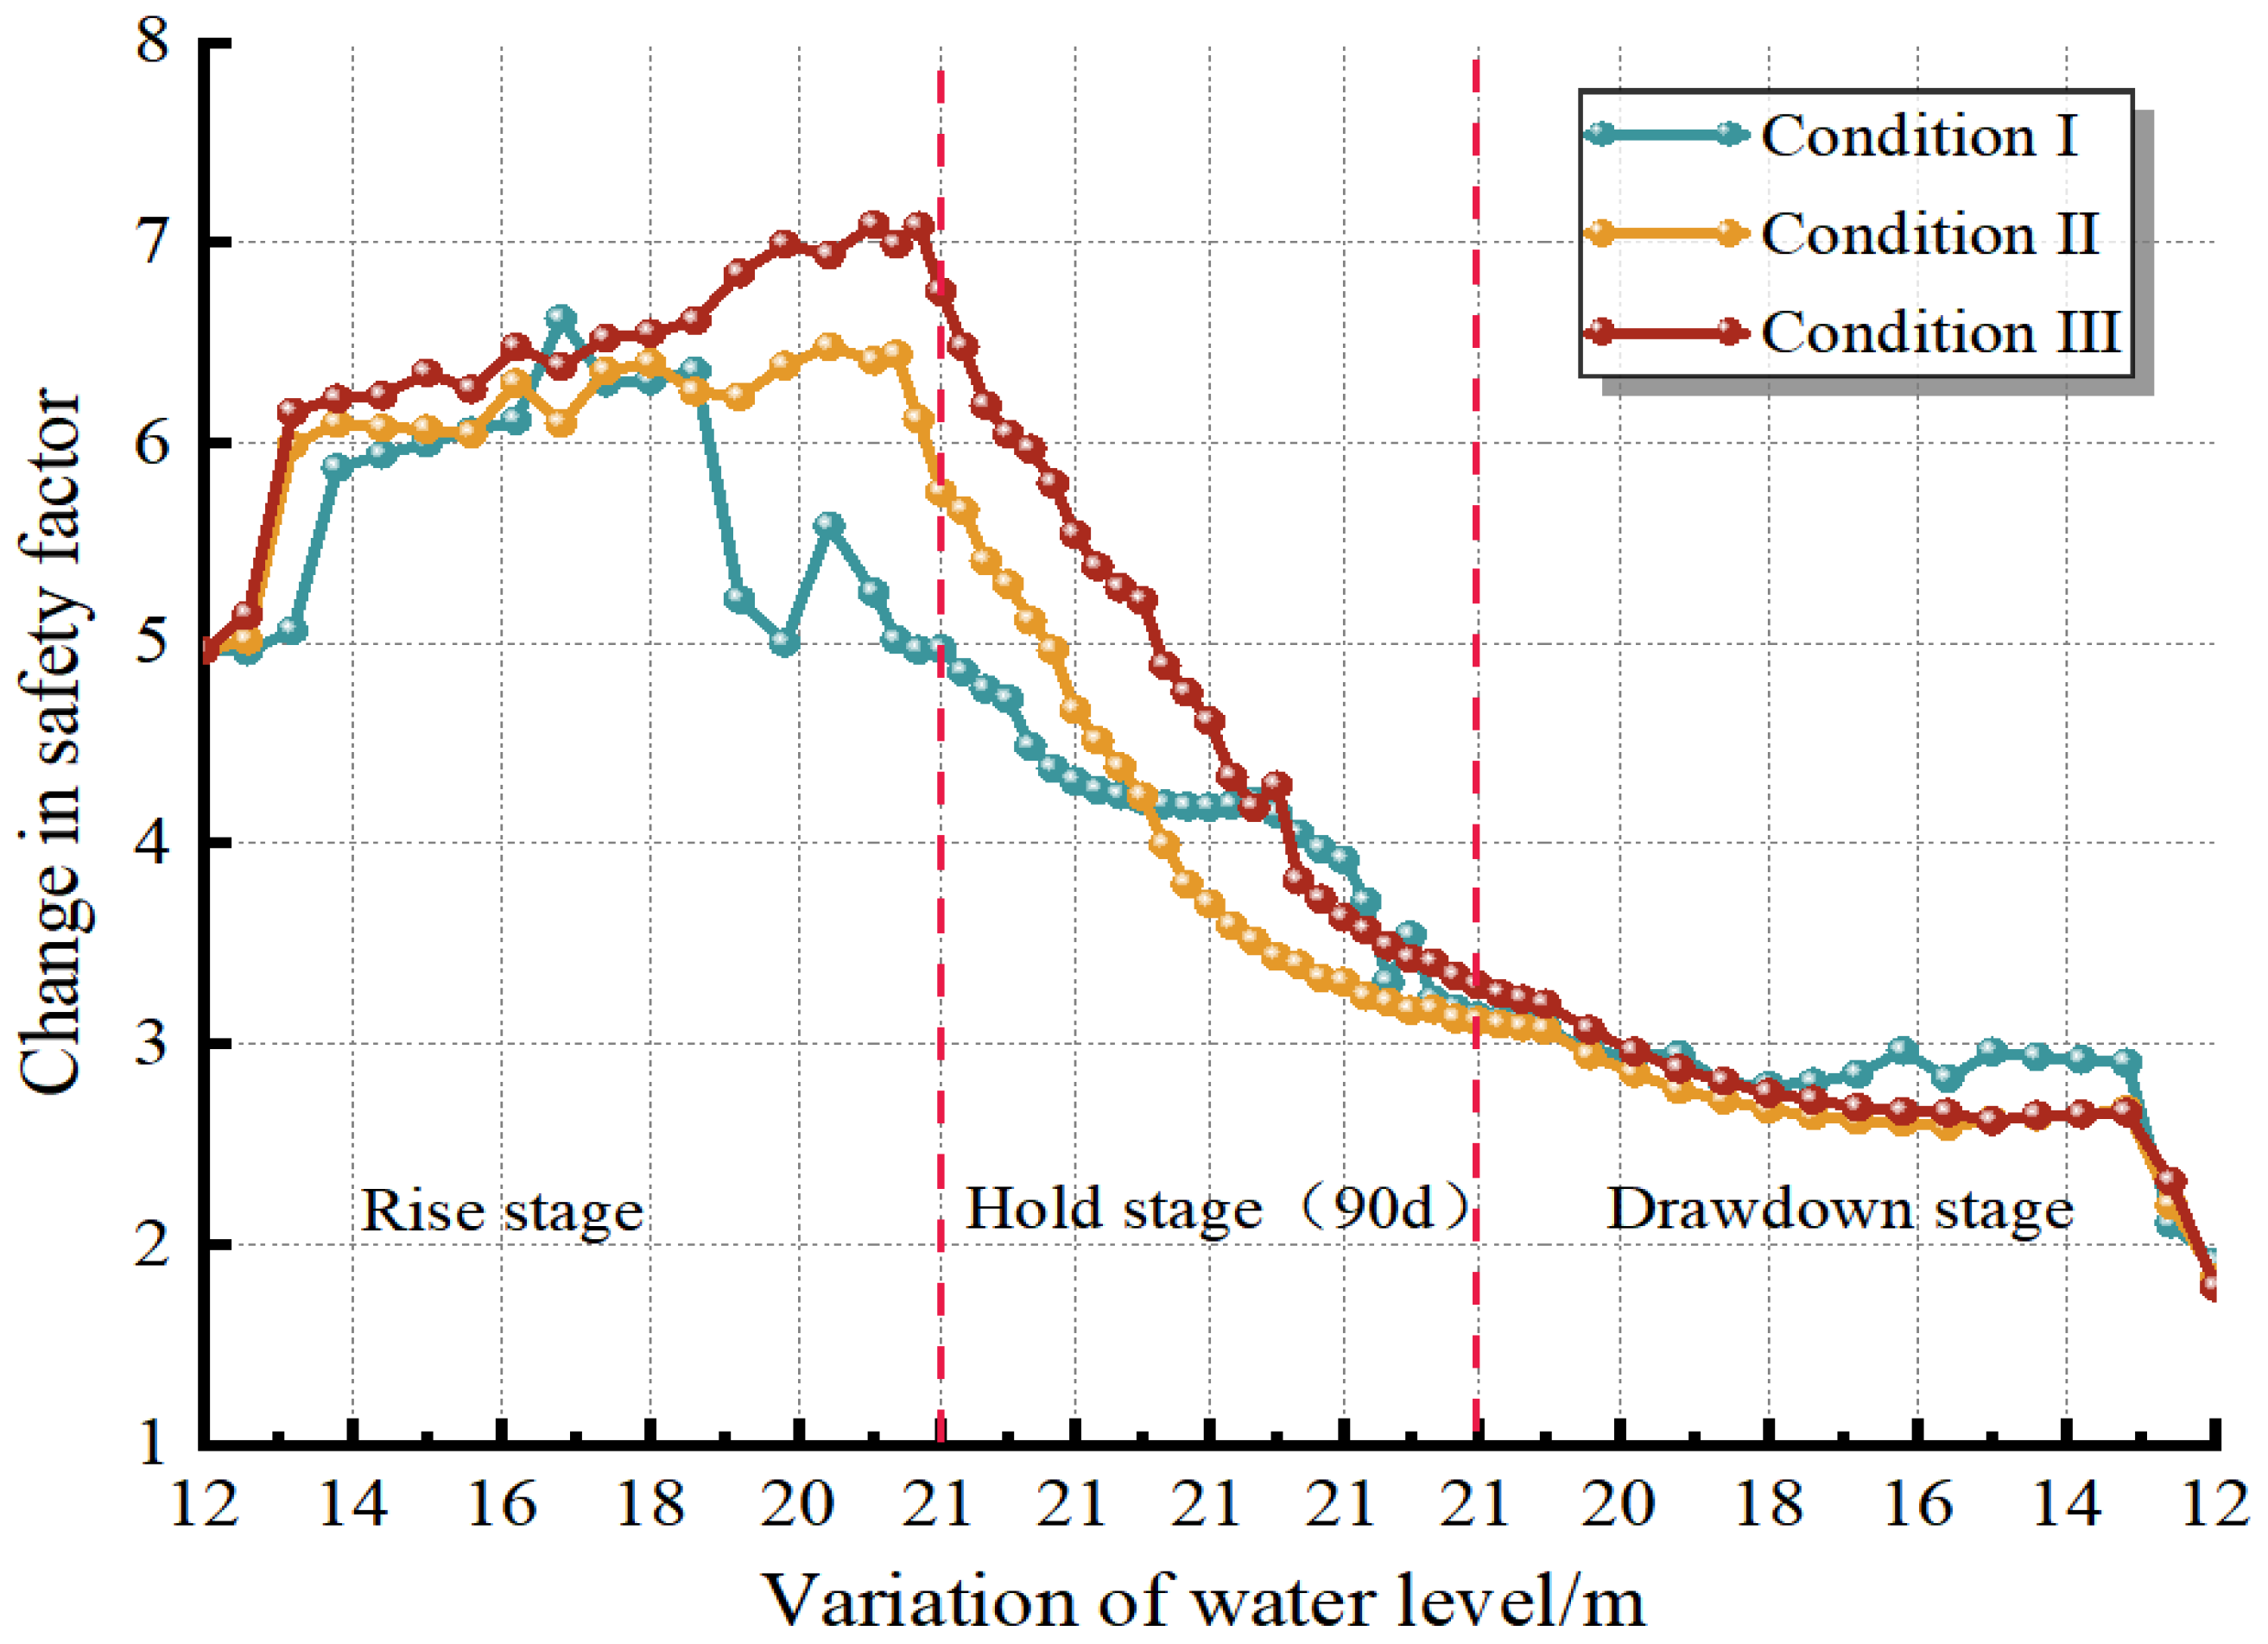
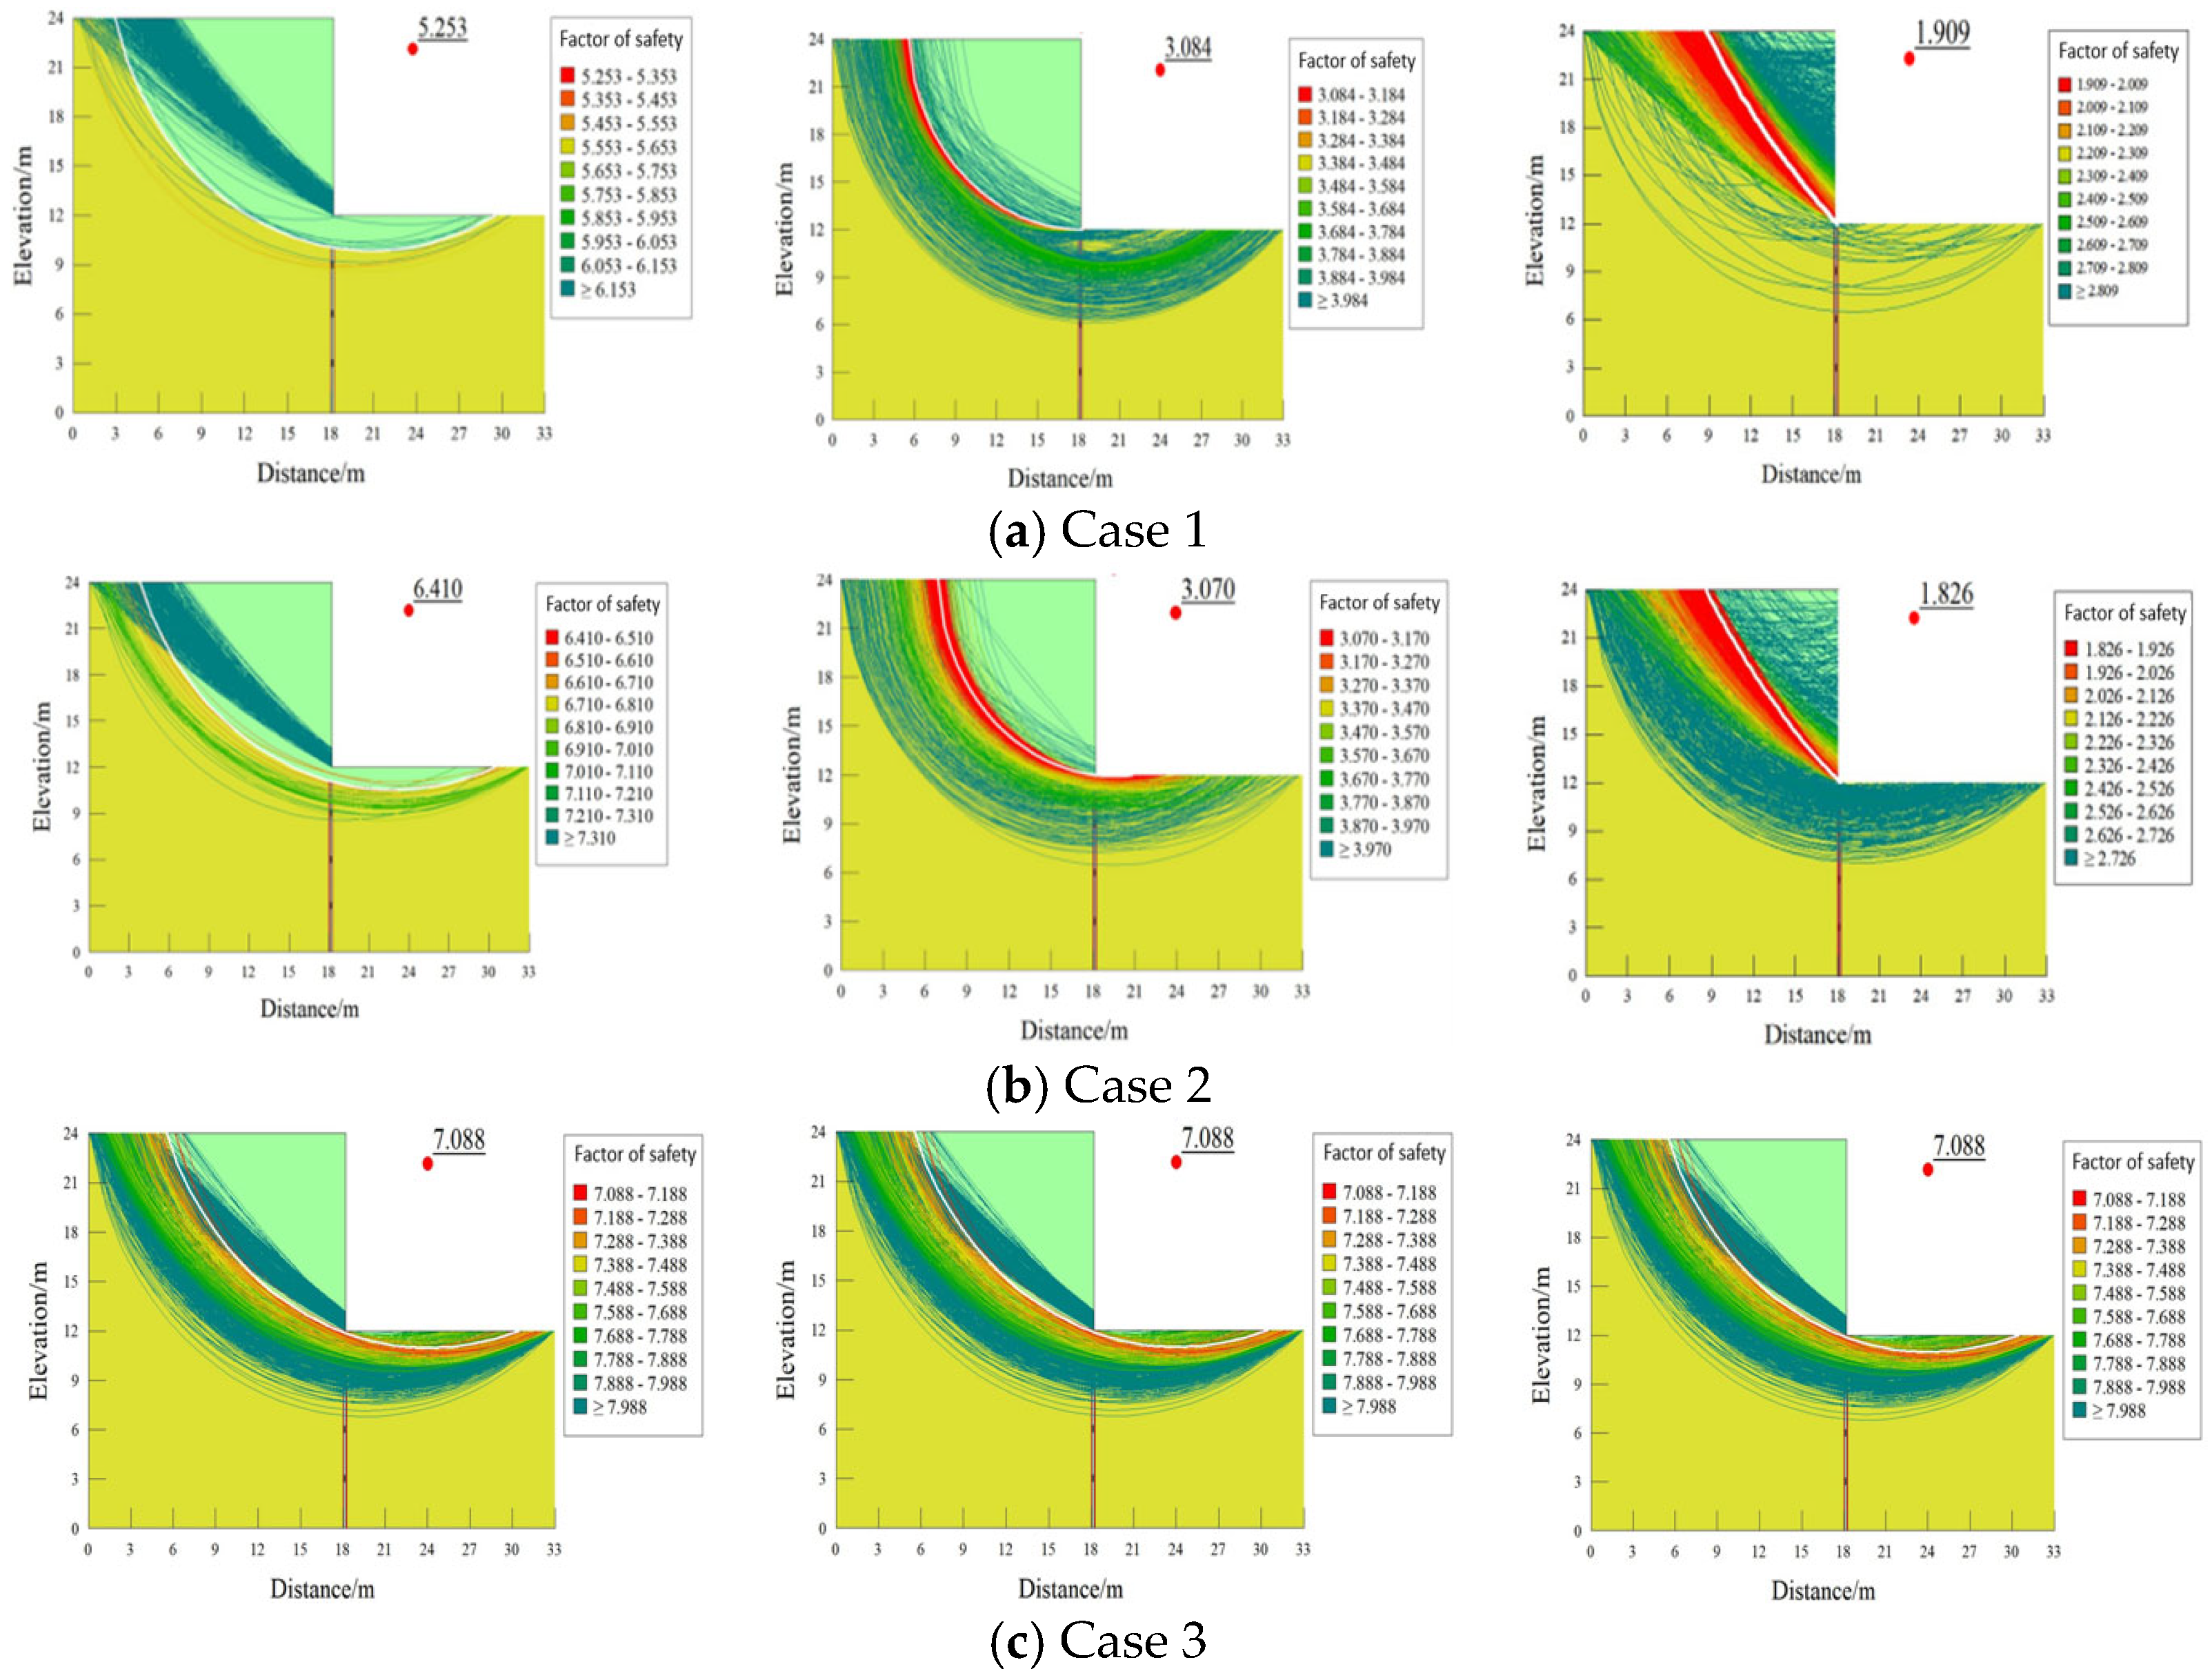
Combining
Figure 19 and
Figure 20, the dynamic variation laws of the bank slope safety factor and the critical slip surface under different water level fluctuation rates were analyzed. During the water level rising stage, the hydrodynamic pressure generated by the water level, which is directed toward the bank side, exerts a restraining effect on the sliding of the slope. Additionally, the effective unit weight of the soil decreases due to the influence of buoyancy, leading to an improvement in bank slope stability under all operating conditions. As the water level rising rate accelerates, the increment in the safety factor exhibits an increasing trend. The primary reasons are the augmented hydrodynamic pressure and the shorter duration required for a faster rising rate. This makes the lag of the groundwater level within the slope relative to the external water level more pronounced, thereby reducing the degree of moisture erosion experienced by the bank slope. During the water level maintaining stage, moisture infiltrates the bank slope and deteriorates the physical properties of the soil. The differences caused by the lag phenomenon in the previous stage gradually recover, resulting in a continuous decrease in slope stability and a narrowing of the gaps between different conditions. During the water level drawdown stage, because the variation in the groundwater level within the slope lags behind the external water level drop, an excess pore water pressure directed from the inside to the outside of the slope is generated. This causes the slope stability to continue decreasing under all conditions. A faster drawdown rate results in a more obvious lag effect, stronger excess pore water pressure, and a decreasing trend in the safety factor. Therefore, during the water level rising stage, a faster rate significantly enhances bank slope stability, which is beneficial; conversely, during the water level drawdown stage, a faster rate more severely weakens bank slope stability, which is detrimental.
3.6.2. Effect of Sheet Pile Stiffness
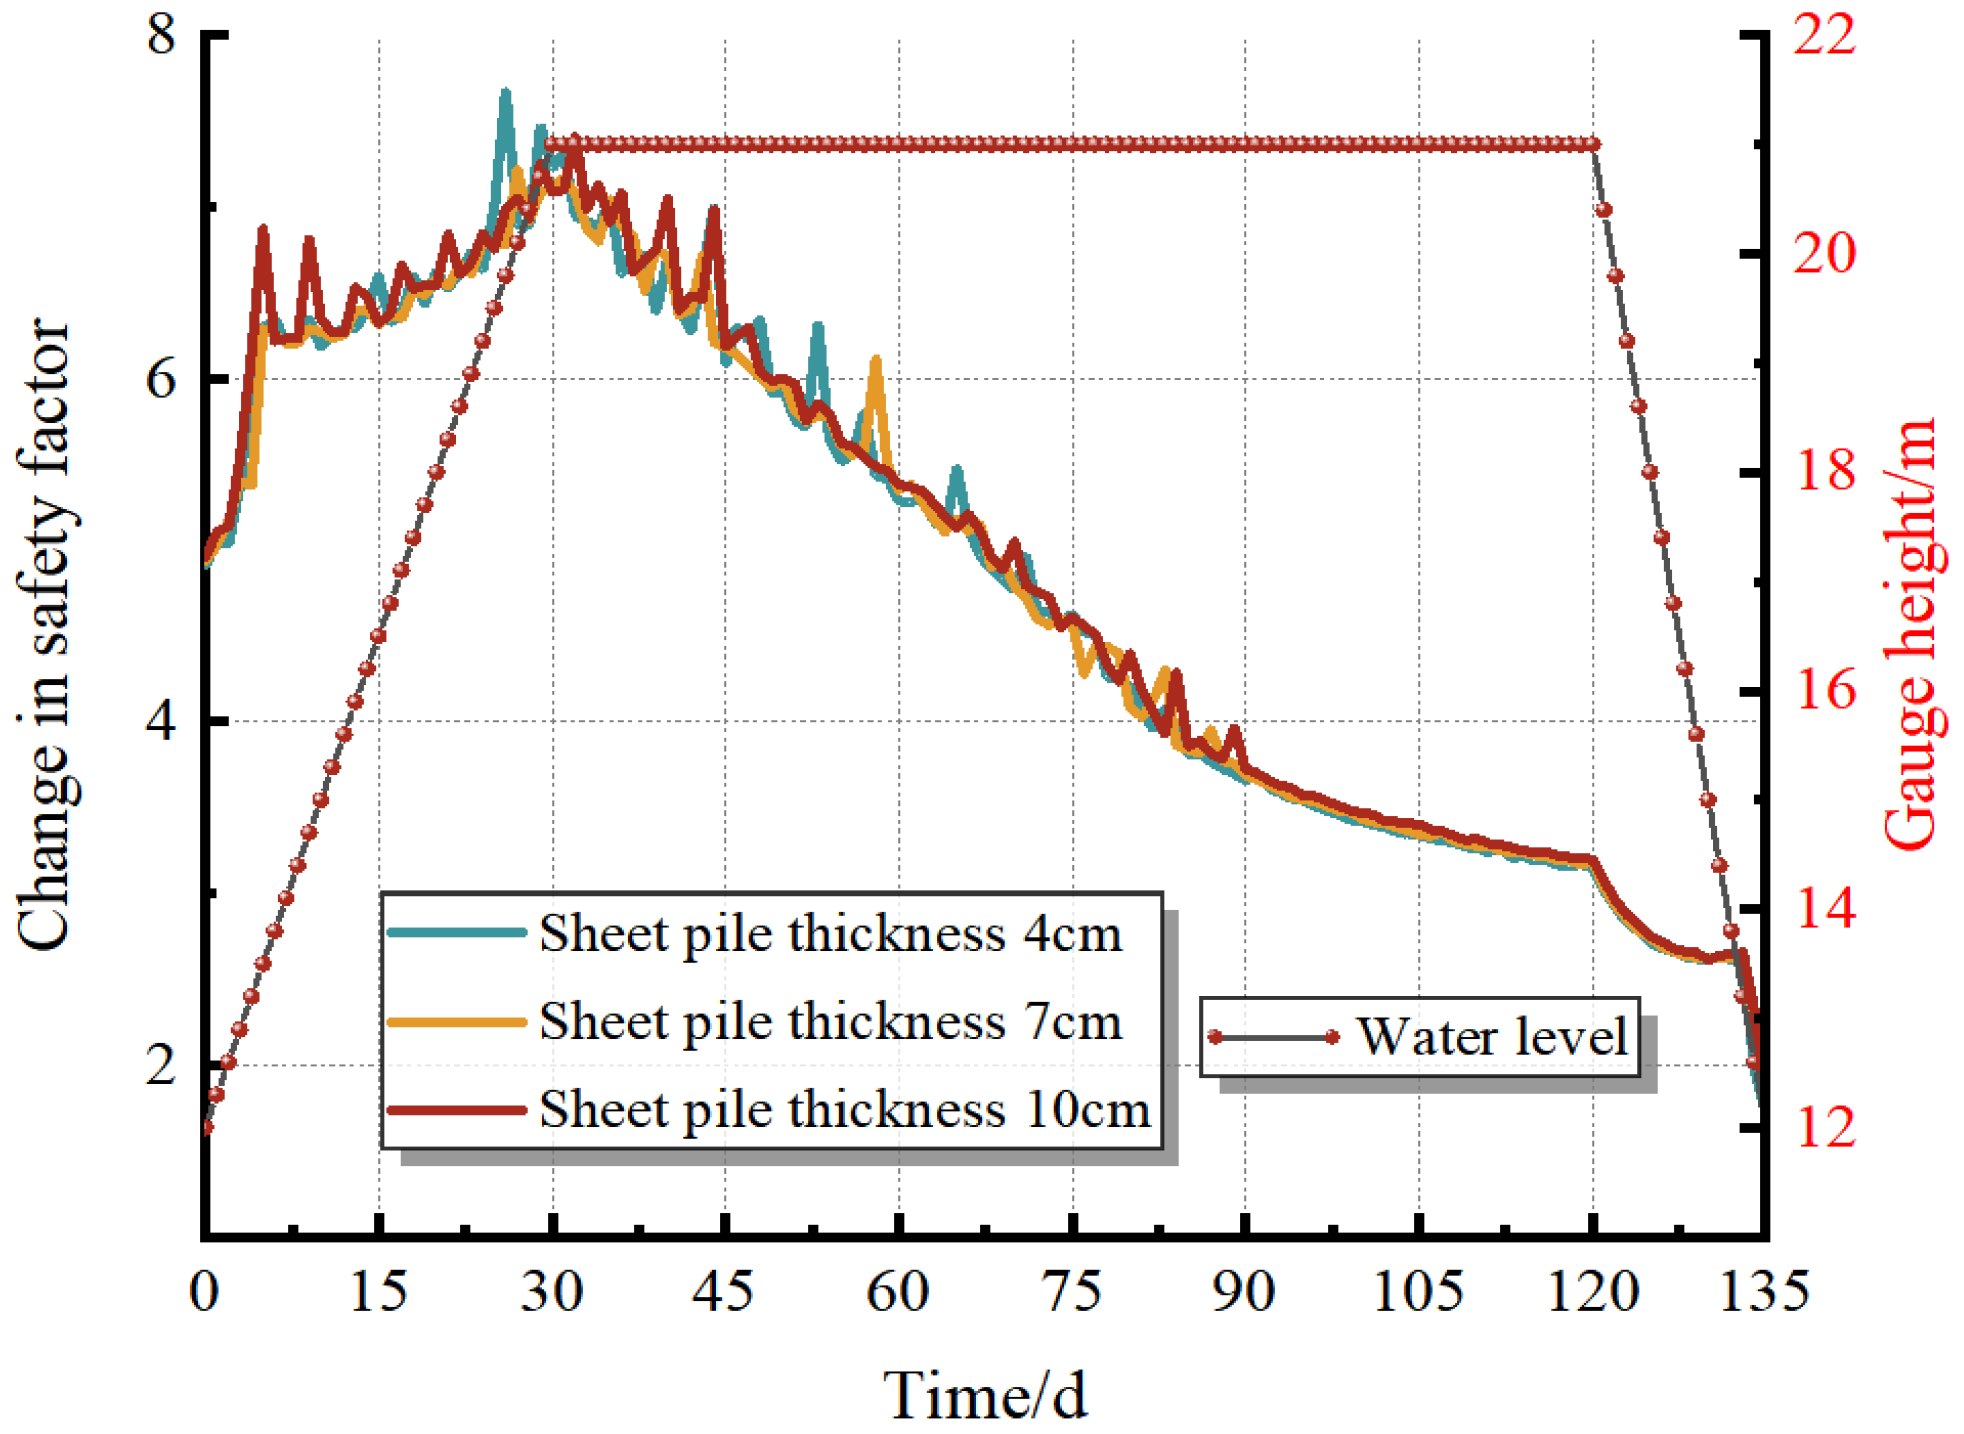
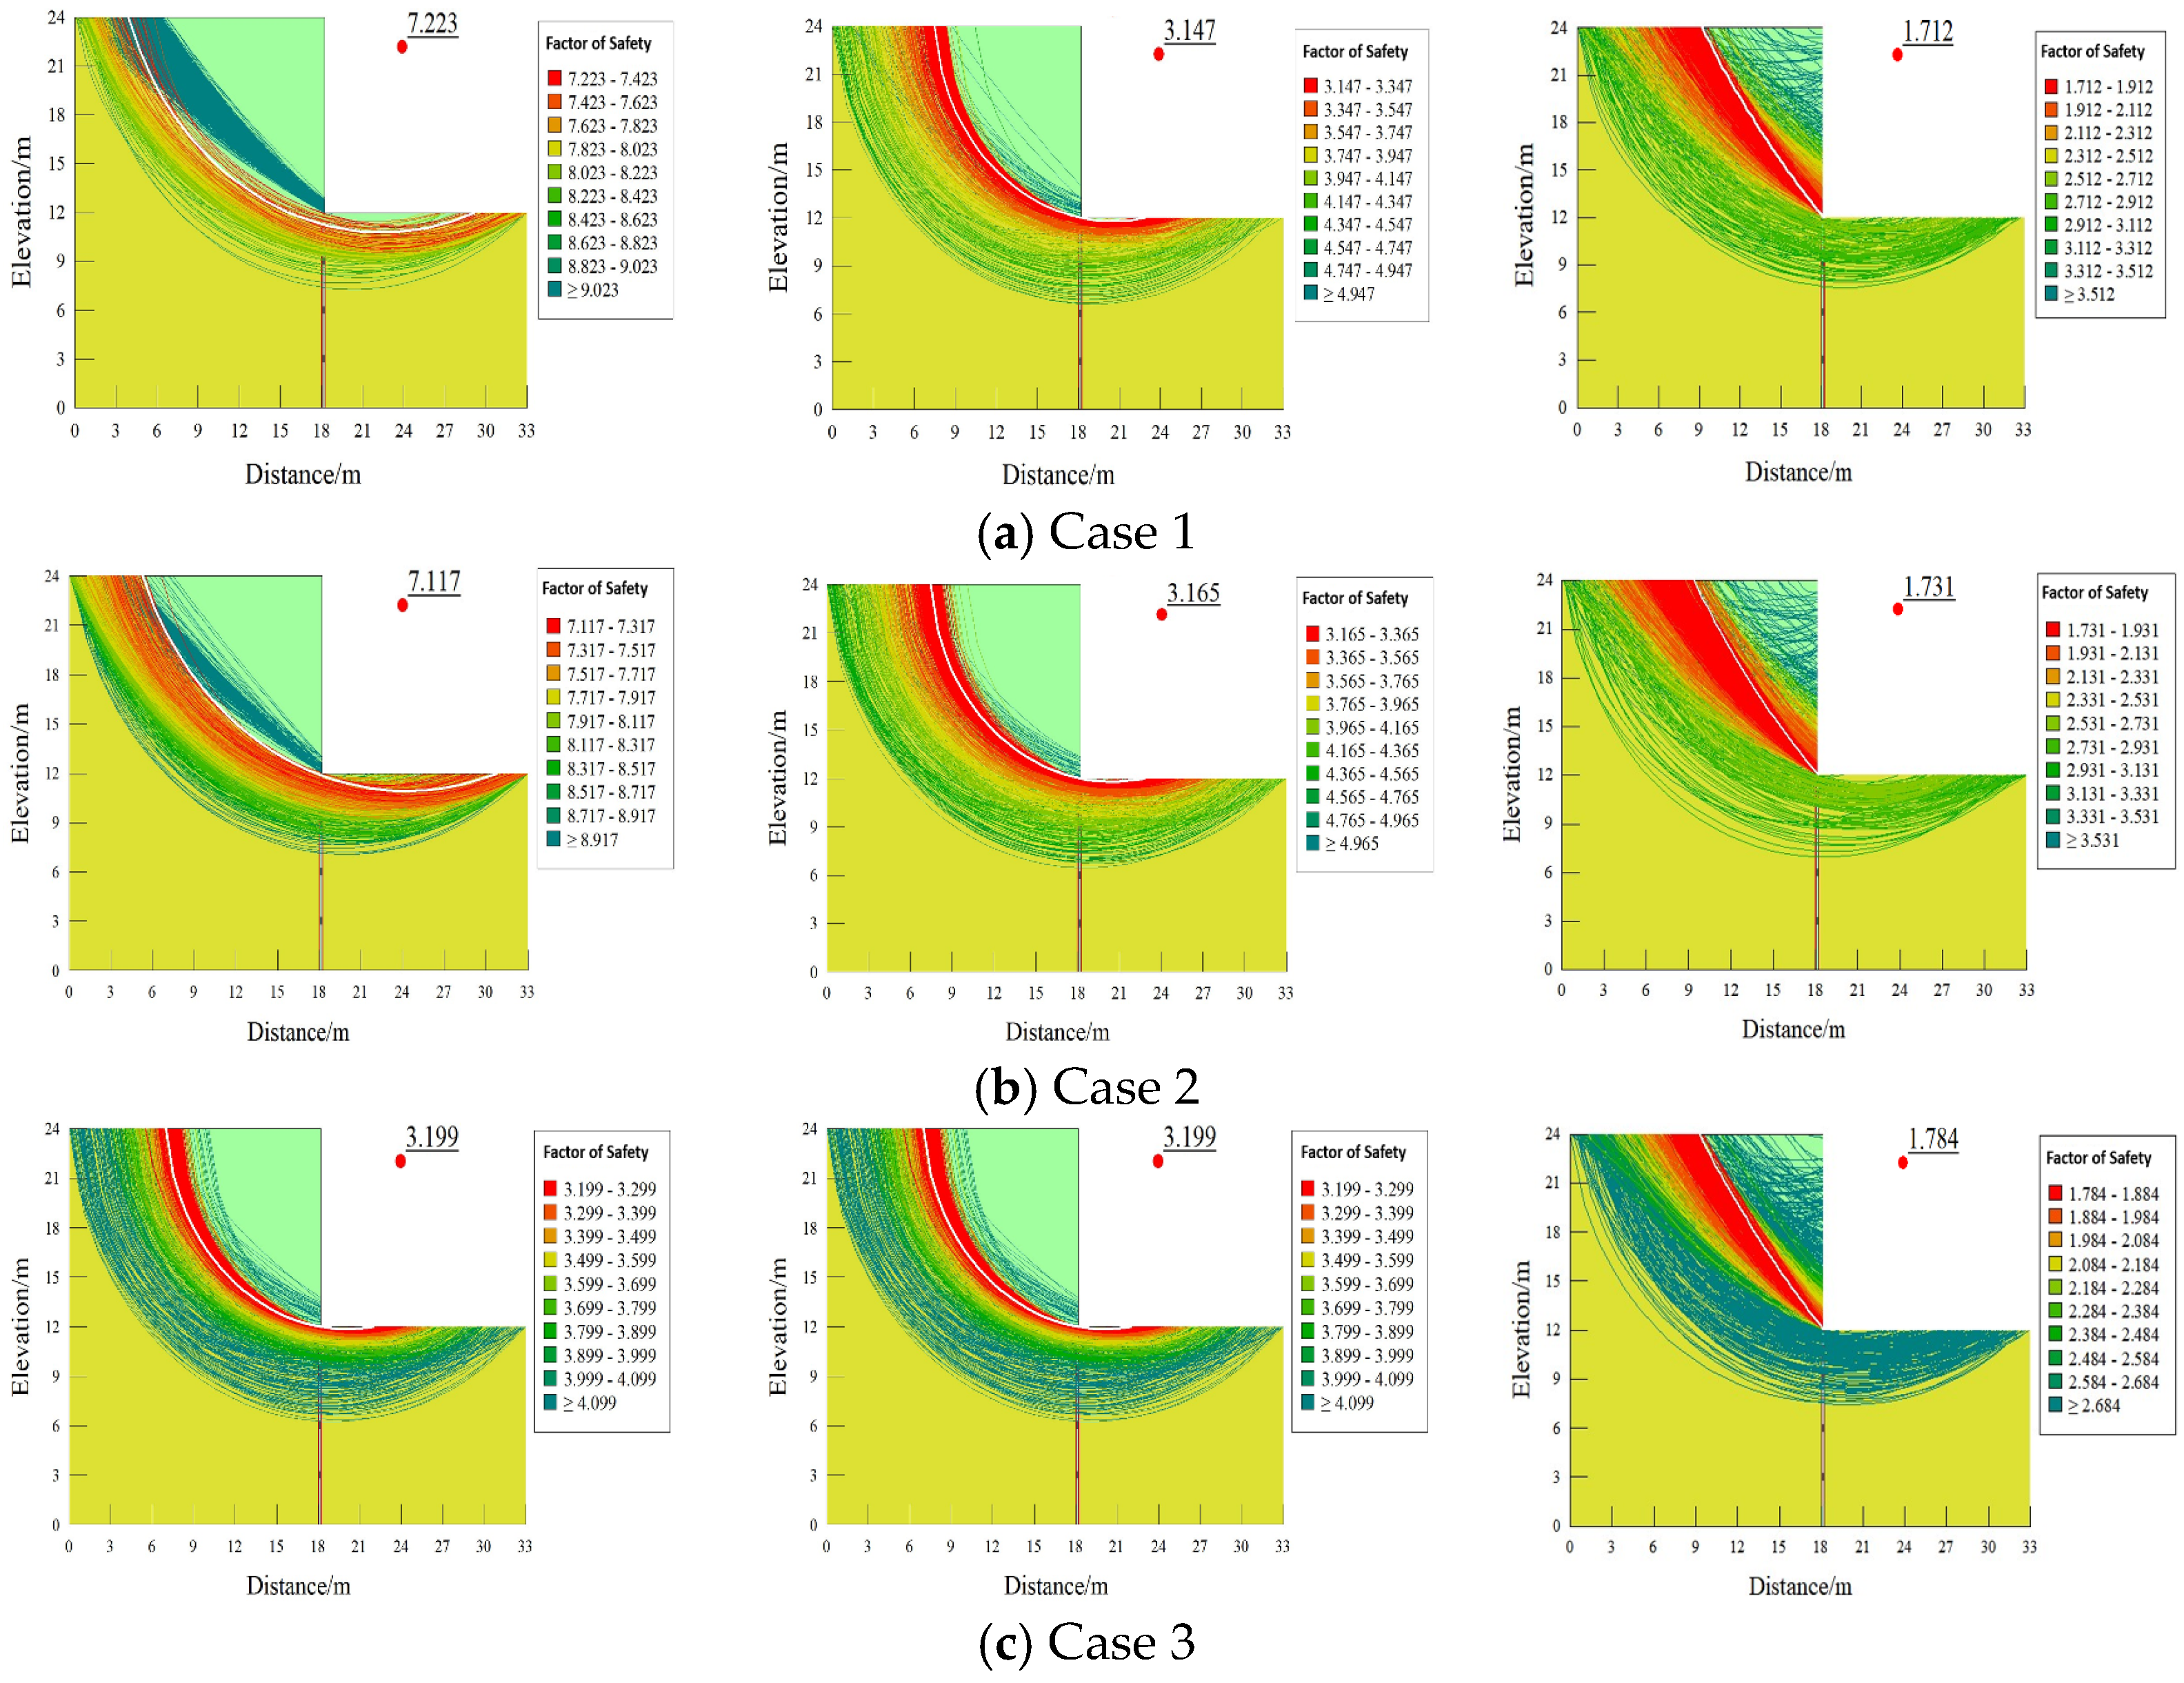
To investigate the influence of PVC sheet piles with different stiffnesses on bank slope stability, the cross-sectional thickness of the sheet pile was set to 4 cm, 7 cm, and 10 cm by altering the moment of inertia. The corresponding moments of inertia were 6400 cm
4, 34,300 cm
4, and 100,000 cm
4, respectively. The sheet pile thickness conditions are shown in
Table 7.
Figure 21 analyzes the dynamic variation laws of the bank slope safety factor and the critical slip surface under different sheet pile stiffnesses.
Figure 22 demonstrates that, with thicknesses of 4 cm, 7 cm, and 10 cm, the initial stability of the bank slope exhibits an increasing trend with the augmentation of sheet pile stiffness. This is because a greater sheet pile stiffness exerts a stronger inhibitory effect on slope deformation and enhances the capacity to resist earth pressure. During the water level rising stage, the slope stability under all conditions improves; however, the safety factor shows a decreasing trend with the increase in the cross-sectional thickness of the sheet pile. The reason is that the sheet pile is subjected to hydrodynamic pressure, which subsequently disturbs the soil layer. A thicker sheet pile possesses a greater self-weight, leading to more severe disturbance to the soil mass. During the 90-day water level maintaining stage and the drawdown stage, the degree of moisture erosion suffered by the bank slope intensifies. The groundwater level generates an outward excess pore water pressure, resulting in a downward sliding force on the slope. At this stage, the safety factor transitions to an increasing trend with the increase in pile thickness, because thicker sheet piles can provide stronger support to constrain the sliding of the bank slope. Therefore, during the water level rise when moisture erosion is relatively low, thicker sheet piles may be unfavorable to slope stability; however, during the maintenance and drawdown stages, where moisture erosion is extremely severe and significant sliding tends to occur, thicker sheet piles can provide stronger supporting effects to better maintain bank slope stability.