


Abstract
During the processes of oil extraction, storage, and transportation, pollution caused by frequent fluctuations in the groundwater level and interface changes is complex, and oil leakage has become a major challenge. To effectively identify the water–oil displacement process and the influence of hydrodynamic conditions on displacement efficiency, this paper presents the results of multiple laboratory experiments, focusing on the effects of hydraulic head, medium particle size, displacement direction, and apparatus dimensions on oil displacement efficiency. Three types of media were used: fine sand, medium sand, and coarse sand, simulating two displacement directions—top-down and bottom-up. Displacement efficiency was evaluated by integrating gravity drainage and hydrodynamic displacement processes. The results show that medium particle size has a significant impact on displacement efficiency: coarse sand achieves the highest displacement efficiency (98.74%), whereas fine sand yields the lowest (61.7%). Increasing the hydraulic head significantly improves oil displacement efficiency. The top-down displacement direction exhibits higher efficiency due to gravitational assistance. In addition, apparatus dimensions and sand sample height also significantly affect displacement efficiency. Increasing the apparatus diameter enhances gravity drainage efficiency, while increasing the sand sample height reduces hydrodynamic displacement efficiency. This study provides a scientific basis for remediating LNAPL-contaminated sites and suggests optimizing hydraulic head and displacement direction in practical applications to improve remediation efficiency.
1. Introduction
The pollution of groundwater by petroleum products is a common problem in many industrialized regions and oil-producing countries. Gasoline, diesel, and crude oil all have the potential to become contaminants of groundwater. They are often referred to as light non-aqueous phase liquids (LNAPLs), and these contaminants have a profound impact on soil and groundwater, not only damaging the soil structure and causing residues to be unable to volatilize effectively, but also weakening the soil’s aeration capacity and hindering the growth of microbial communities. In addition, LNAPL pollution poses a significant threat to industrial fields such as the manufacturing and plastic industries [1,2,3]. The treatment of groundwater at contaminated LNAPL sites is a complex and challenging issue. After LNAPL leakage, due to its basic physical characteristics, it migrates under the combined action of gravity and capillary pressure. Researchers have conducted extensive discussions to investigate the migration and distribution of light non-aqueous phase liquids. Alazaiza M Y D [4] conducted laboratory-scale column experiments to study the influence of water level fluctuations on the migration and redistribution of various LNAPLs in porous media, indicating that doubling the volume of LNAPL while maintaining the same pattern of groundwater level fluctuations does not affect the overall behavior of LNAPL. Shen et al. [5] developed a multiphase numerical flow model by combining laboratory experimental devices with COMSOL software 6.0. This method aims to clarify the migration behavior of LNAPL in filled fractures and adjacent porous media. Experimental results show that the migration speed of LNAPL in fractures is significantly higher than that in porous media, indicating that fractures significantly accelerate the diffusion process of LNAPL.
Zuo et al. [6] conducted a two-dimensional sandbox experiment to simulate the movement of LNAPL in fine sand and silt media. The results showed that the non-aqueous phase liquid (LNAPL) was significantly retained at the capillary edge, and this retention effect intensified over time. Yuan et al. [7] adopted a method combining two-dimensional visualization experiments and T2VOC numerical simulation to investigate the effects of the initial leakage rate, medium particle size, and medium heterogeneity on the migration and distribution of LNAPL. The research results indicated that the migration distance and contaminated area of LNAPL in porous media were significantly influenced by the leakage condition and medium structure. Lu et al. [8] used mathematical statistics and numerical simulation methods to reveal the distribution law and interaction mechanism of the remaining LNAPL in the “fracture-water-LNAPL” system. To deeply study the behavior of underground non-light non-aqueous phase liquids (LNAPL) and test the prediction model, researchers conducted various laboratory tests and field investigations of different scales [9,10,11,12,13,14,15,16,17,18,19,20,21]. These works included the fixity of LNAPL, its influence by water level fluctuations, assessment of recoverability, transient effects, and other aspects. In addition, researchers also carried out multi-dimensional and multi-stage simulations [21,22,23,24,25,26], considering free, residual, and trapped LNAPL to predict the behavior of underground LNAPL. In the field of light non—aqueous phase liquid (LNAPL) monitoring, researchers employ geophysical methods to conduct studies. For instance, Suo K [27] and colleagues carried out a study on monitoring the migration of light non—aqueous phase liquid (LNAPL) using electrical resistivity tomography (ERT), whereas Campbell D L [28] and associates monitored the controlled LNAPL leakage using ground—penetrating radar.
Based on past research findings regarding light non-aqueous phase liquids (LNAPLs), it is evident that—despite a substantial body of relevant studies—the investigation of LNAPL displacement efficiency under hydrodynamic conditions remains relatively scarce. This study adapts established experimental methods to conduct indoor water-flooding experiments, aiming to examine how water head height influences LNAPL displacement efficiency. Under natural conditions, rainfall and groundwater level fluctuations frequently induce water-flooding of LNAPL in the unsaturated and saturated zones of soil. Accordingly, by varying the displacement direction (i.e., vertical upward vs. downward flooding) in the experiments, this natural process is more realistically simulated. To ensure experimental accuracy and representativeness, key parameters—including porous medium particle size, column diameter, and soil column length—are systematically controlled and calibrated to better reflect field-scale conditions. Moving beyond traditional LNAPL migration studies, this work systematically investigates the combined effects of hydrodynamic forcing, displacement direction, and porous medium characteristics on displacement efficiency. Specifically, we propose an integrated conceptual framework that couples gravity-driven drainage with hydrodynamic displacement, enabling more realistic simulation of field scenarios involving groundwater level fluctuations. Furthermore, the study quantitatively identifies critical water head thresholds and characterizes the stabilization behavior of displacement efficiency across different media, thereby offering new mechanistic insights into the dynamic control of LNAPL removal.
2. Materials and Methods
2.1. Test Materials
In the experiment, the sand sample medium was categorized into three groups: fine sand, medium sand, and coarse sand. The preparation procedure is described as follows: Initially, the original sand samples were dried to a constant weight at a controlled temperature of 105 ± 5 °C and then cooled to room temperature. Subsequently, based on the target type (fine sand, medium sand, or coarse sand), the appropriate standard sieve sets were selected for classification and sieving. The particle size ranges for each group were defined as: fine sand (0.125–0.25 mm), medium sand (0.25–0.5 mm), and coarse sand (0.5–1 mm). Thereafter, sand grains meeting the specified particle size criteria were collected, and the sieve mesh was meticulously cleaned to prevent contamination of subsequent samples by residual particles. Finally, the sieved samples were thoroughly mixed to ensure homogeneity, sealed for storage, and labeled with relevant parameters. The detailed particle size distribution of the sand samples is presented in Table 1.
Table 1.
Particle grading of test medium.
According to the data in Table 1, it can be known that the percentages of the particle sizes of the three media are relatively concentrated, and the gradation is good [29]; the LNAPL selected for this experiment is 0# diesel. The physical properties of 0# diesel [30] are shown in Table 2 as follows.
Table 2.
Basic physical characteristics of diesel fuel.
2.2. Test Device and Test Principle
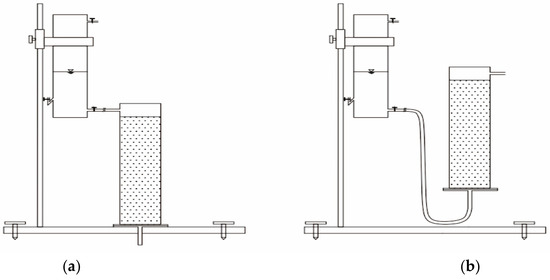
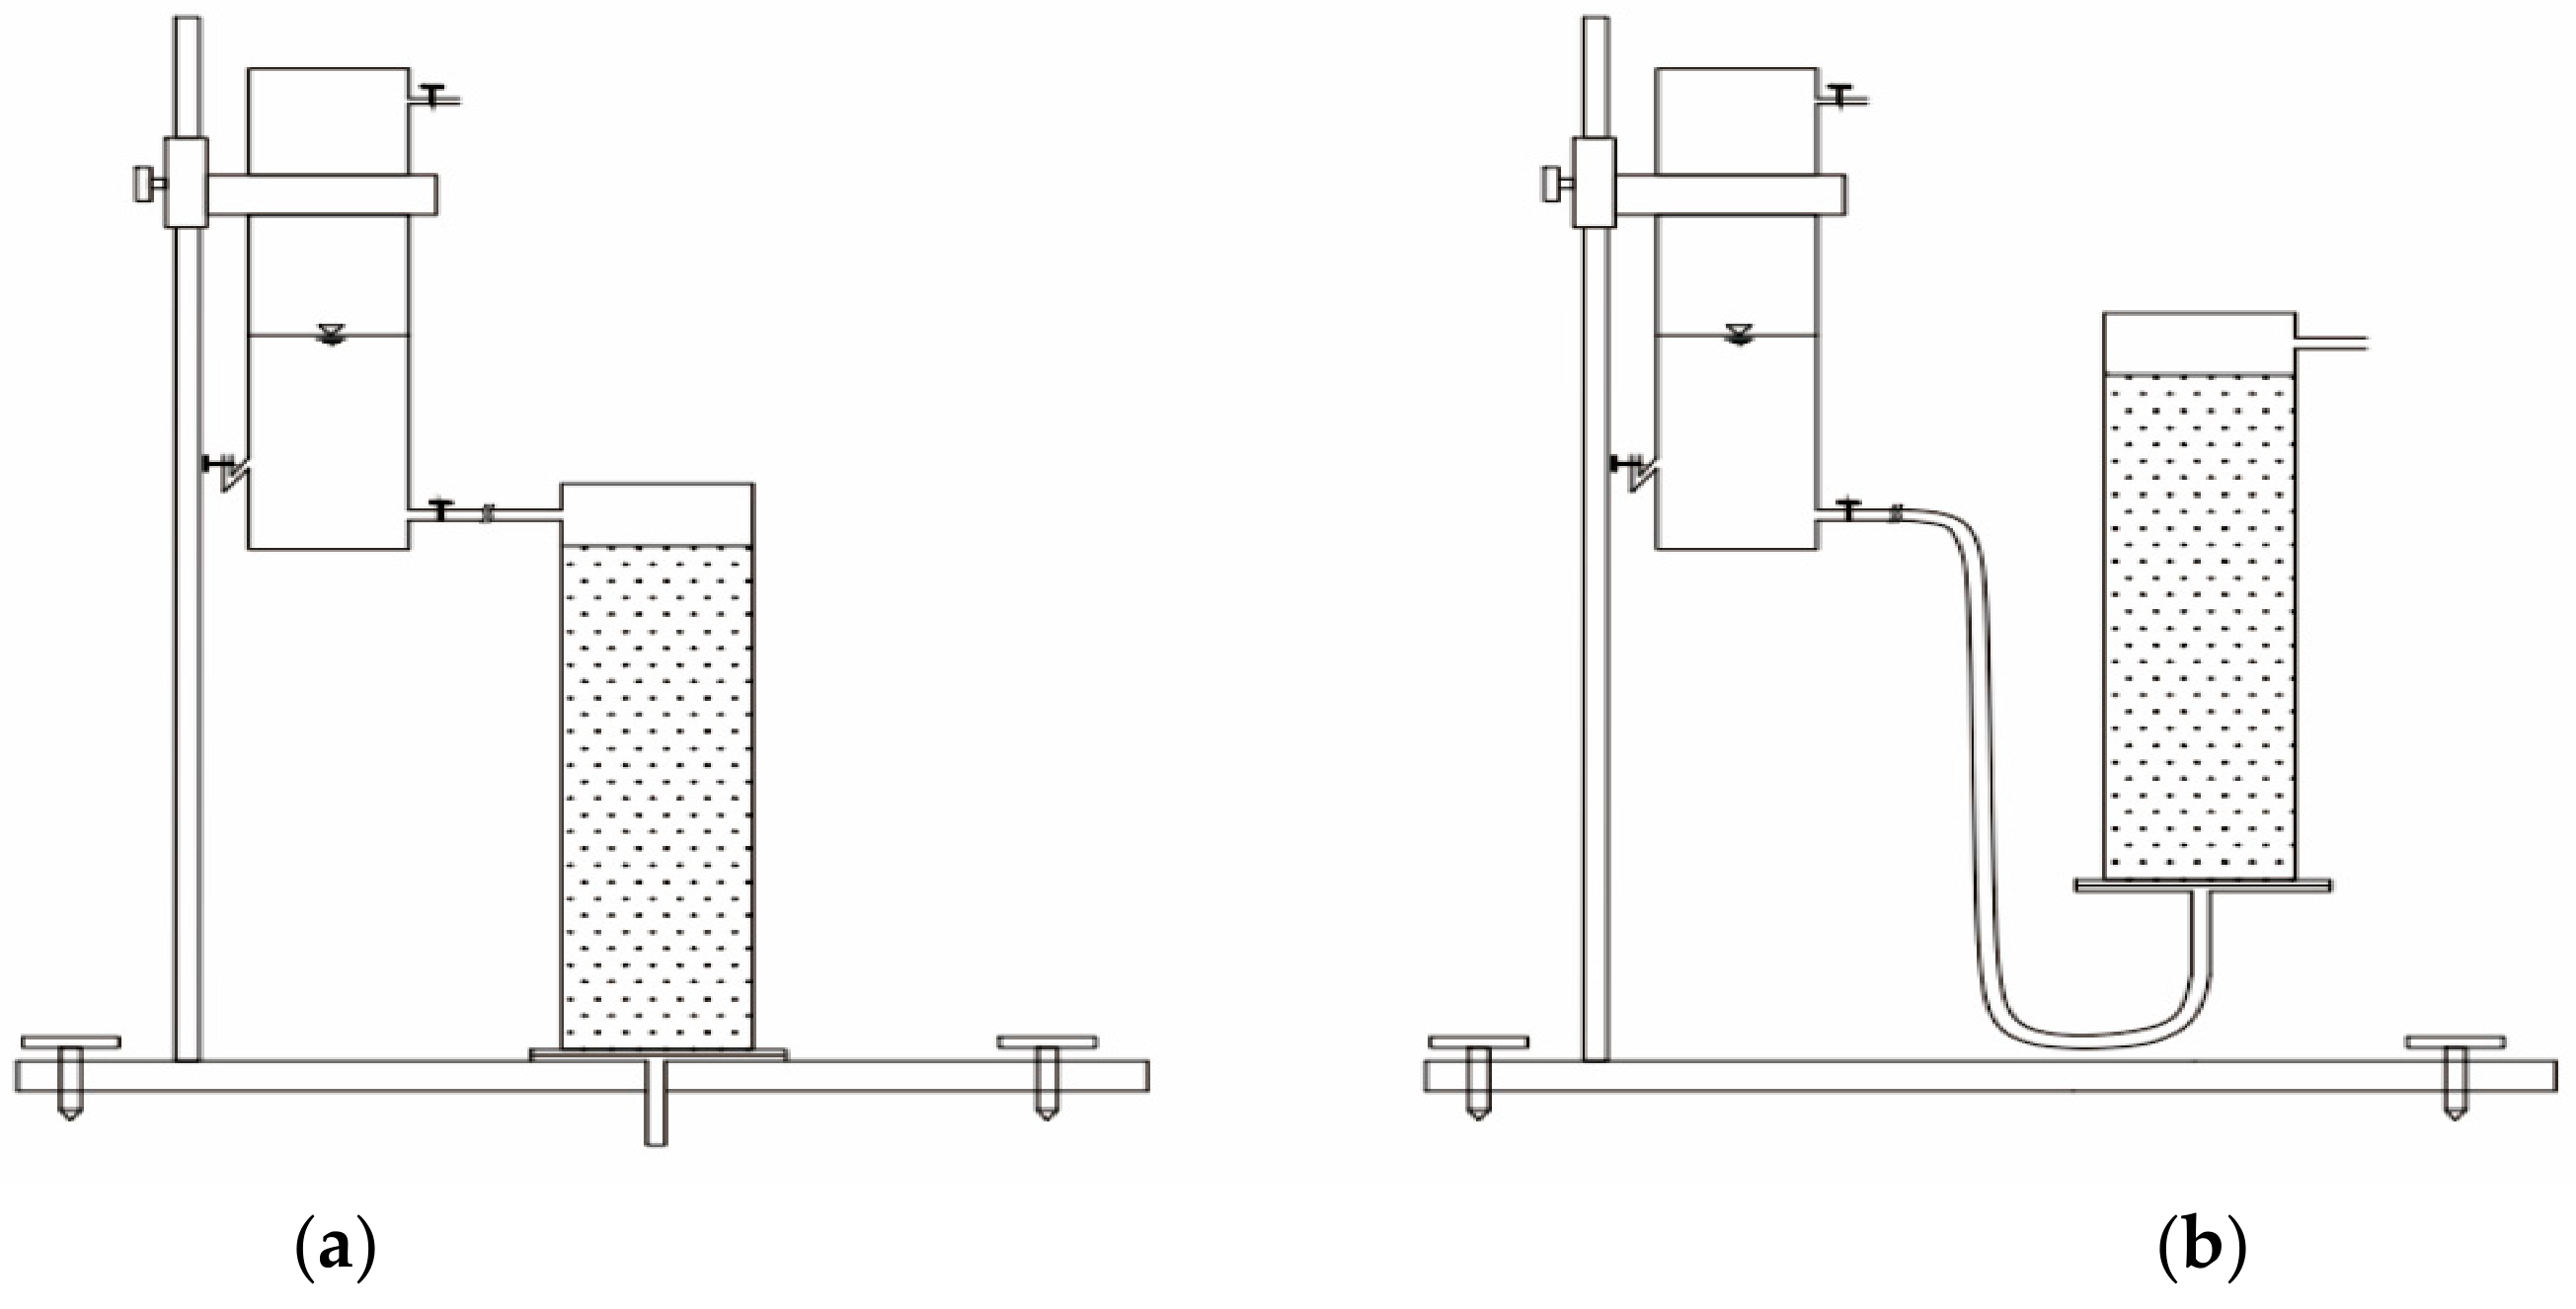
The testing apparatus is illustrated in Figure 1 below.
Figure 1.
Test device diagram: (a) schematic diagram of the device for the top-down displacement process, and (b) schematic diagram of the device for the bottom-up displacement process.
The testing apparatus comprises three main components: a variable water head supply unit, a soil column assembly, and a support structure (as illustrated in Figure 1). The liquid inlet is situated at the base of the soil column assembly, while the liquid outlet is positioned at the top; both are interconnected via silicone tubing. Figure 1 depicts two distinct displacement directions.
2.3. Experimental Design and Procedure
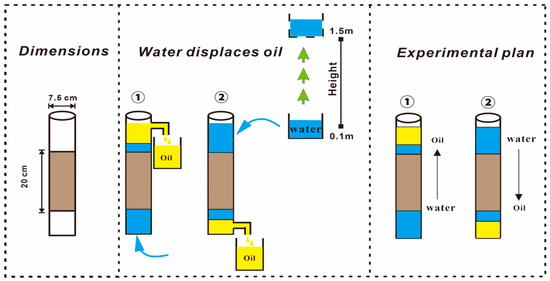
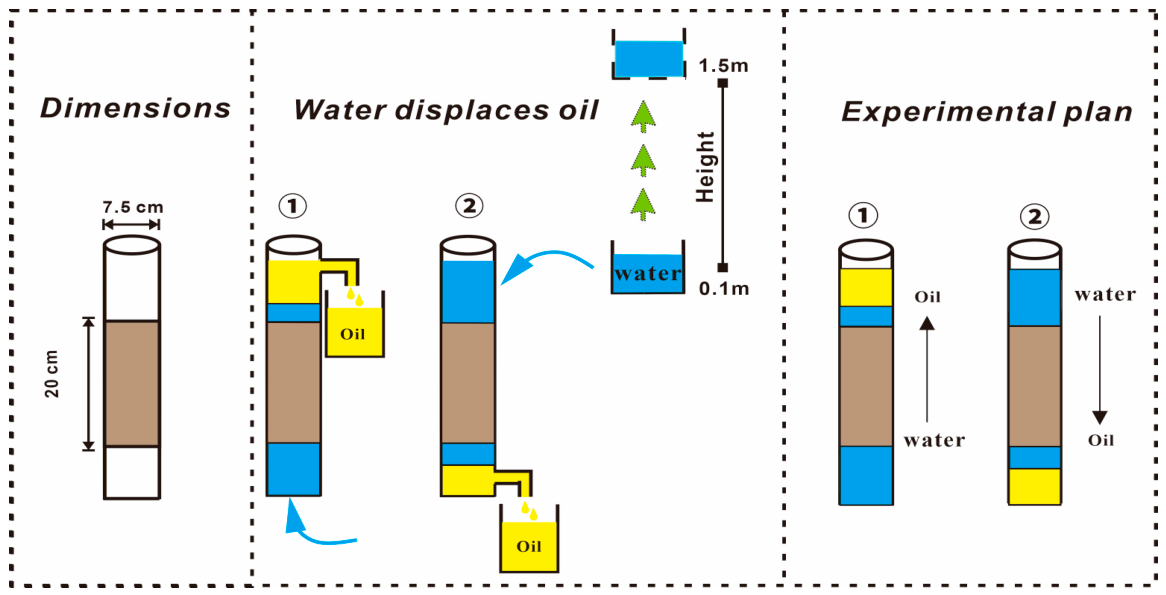
This experiment employed three types of uniformly graded sand samples with distinct particle sizes: fine sand, medium sand, and coarse sand. The cylindrical apparatus used in the experiment was 25 cm in height and 7.5 cm in diameter, while the height of the sand samples within the apparatus was maintained at 20 cm, to investigate the efficiency of hydrodynamic oil displacement by altering the water head height [31]. The detailed experimental procedures are illustrated in Figure 2.
Figure 2.
Test scheme diagram (color note: The blue arrow in the figure indicates the injected water, the brown color represents the sand medium, the yellow color indicates Lnapl, and the green arrow shows the gradually rising water level height).
We conducted multiple sets of independent water-displacing-oil experiments in three media respectively to ensure the accuracy of the experimental results. Each experimental condition was replicated at least three times. The volumes of oil and water were measured using calibrated graduated cylinders. Prior to conducting the experiments, all measurement devices were verified for volumetric accuracy. The “no more oil” condition was defined as the absence of visible oil discharge for a continuous period of 10 min. The overall experimental uncertainty was estimated to be within ±3%. The reported displacement efficiencies represent the mean values of the replicated tests. The variation among replicates was generally within ±3%, indicating a high degree of experimental consistency. Although formal statistical tests were not carried out, the observed trends were consistent across all replicates. Among them, there are two displacement methods, namely top-down and bottom-up, aiming to simulate the efficiency of water displacing oil under the two conditions of precipitation infiltration [32,33] groundwater level rise. All experiments were carried out in a controlled environment with constant temperature and humidity. The specific conditions were as follows: the laboratory temperature was maintained at (20 ± 2) °C, the relative humidity was controlled at (50 ± 5)%, and the light intensity was set within the range of 300 to 500 lux. In addition, the experimental device was placed on an independent shock-proof platform, and the vibration frequency of the platform was less than 0.1 Hz, thereby minimizing the influence of external interference on the experimental results. Additionally, before the formal hydrodynamic water-displacing-oil test, when the medium was in the oil-saturated state, the gravity oil drainage process was first carried out, with the aim of better simulating the contaminants discharged from the intergranular spaces of the medium due to the gravitational effect after LNAPL contaminated the soil [34].
The specific steps of the test scheme are as follows:
- (1)
- Uniformly apply Vaseline on the device wall to reduce the edge effect, and then fill the screened sand samples into the column device [35].
- (2)
- Sand packing: The sand was carefully packed into the column in layers with a thickness of approximately 2–3 cm. Each layer was gently compacted using a standardized tamping method to attain a uniform bulk density. The final bulk density was precisely controlled to be consistent across all tests, with an estimated variation within ±2%.
- (3)
- Diesel saturation: Diesel was injected from the bottom of the column at a constant and low flow rate to prevent air entrapment. The injection continued until the effluent at the top outlet exhibited continuous diesel discharge without air bubbles, indicating full saturation. The saturation process typically took 30–60 min, depending on the medium.
- (4)
- Gravity drainage: After saturation, the system was left undisturbed to enable gravity—driven oil drainage. The drainage process was continuously monitored. The “no more oil” condition was operationally defined as the absence of visible oil droplets at the outlet for a consecutive period of 10 min. The total volume of oil collected during this stage was recorded as gravity drainage.
- (5)
- Hydrodynamic displacement: Water was introduced into the column by adjusting the hydraulic head using a variable head system. The water head was incrementally increased from 0.1 m to 1.5 m. At each head level, the system was allowed to reach a quasi—steady state before advancing to the next level. The quasi—steady state condition was defined as a stable outflow with no significant change in the oil discharge rate over a period of 5–10 min. The duration at each head level was typically 10–20 min, depending on the medium and flow conditions. The displacement process continued until no visible oil discharge was observed under the maximum water head condition.
- (6)
- Data recording: The volumes of oil collected during gravity drainage and hydrodynamic displacement were measured using calibrated graduated cylinders. The residual oil was determined through mass balance.
In this study, displacement efficiency is defined on a volumetric basis as the ratio of the volume of oil recovered to the initial oil saturation volume in the porous medium. Although formal statistical tests were not conducted, the observed trends were consistent across all replicates.
Let Q be the saturated oil usage amount, Q0 be the oil amount discharged under the action of gravity, and Q1 be the oil amount discharged during the water flooding process. The gravity oil drainage efficiency P1 is calculated using Formula (1), and the water flooding oil displacement efficiency P2 is calculated under different water head heights using Formula (2):
3. Results and Analysis
3.1. Oil Drainage Efficiency of Three Media Under the Action of Gravity
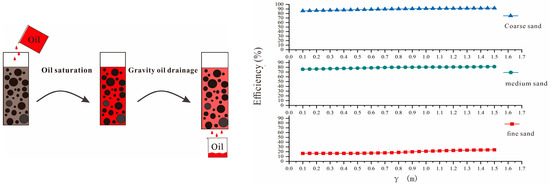
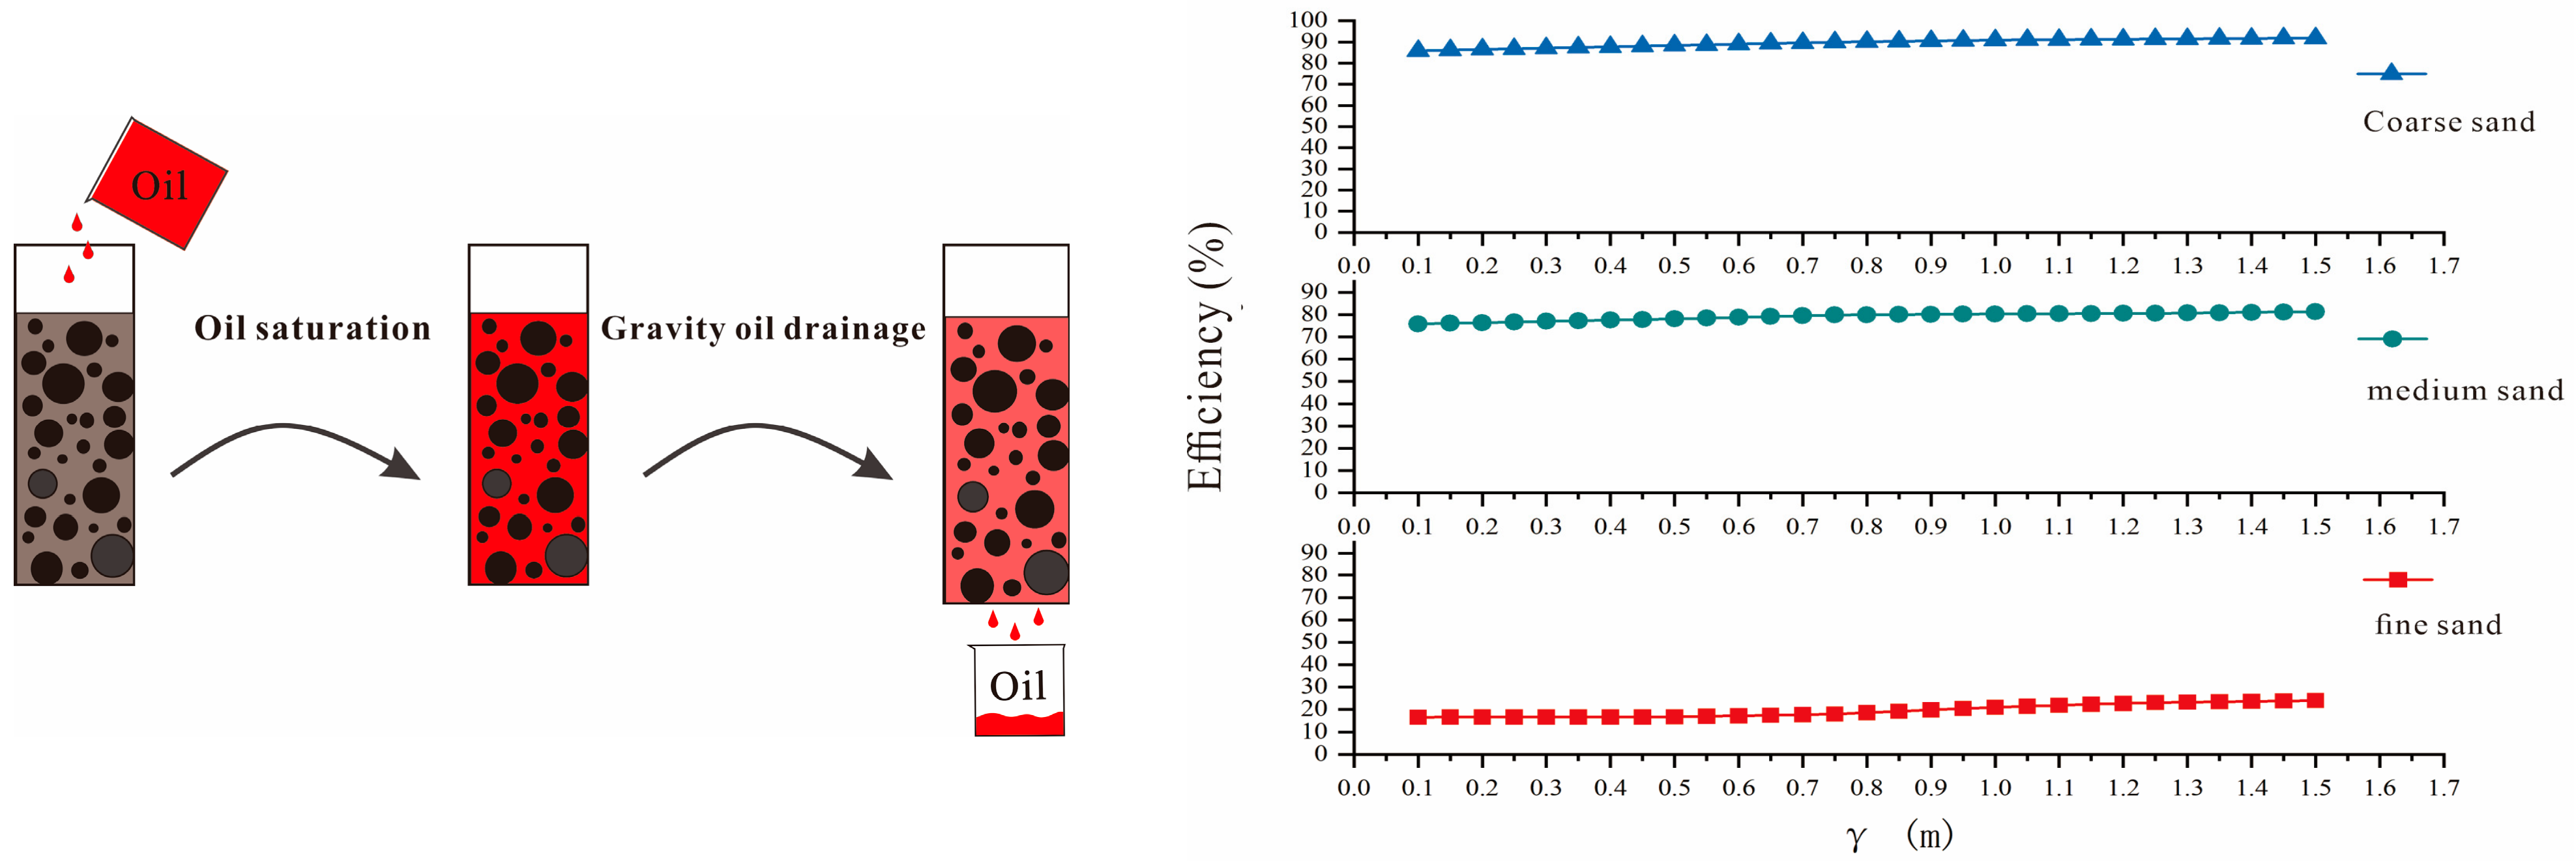
In this experiment, to investigate the impact of varying water head heights on displacement efficiency, a gravity oil drainage process was conducted prior to each trial. This procedure serves two purposes: first, it simulates the migration behavior of light non-aqueous phase liquids (LNAPL) under gravitational forces in real-world conditions; second, it minimizes potential interference from gravitational effects during the subsequent water flooding oil displacement process. Figure 3 illustrates the gravity drainage efficiencies for the three media at different water head heights before the displacement experiments.
Figure 3.
Gravity oil drainage efficiency (color note: the brown color represents the medium pores, the black circles represent the medium particles, the red color indicates the oil, the pink color represents the medium pores after gravity oil separation, and the black arrows indicate the operation process).
As illustrated in Figure 3, during the gravity oil drainage process, there are notable differences in oil drainage efficiency among the three media. Specifically, the oil drainage efficiency for fine sand ranges from 15% to 20%, for medium sand from 75% to 80%, and for coarse sand from 85% to 90%. The primary reasons for these differences can be attributed to the following factors: Firstly, fine sand has smaller pores and a larger specific surface area [36], which increases the contact between sand particles and oil, leading to stronger particle cohesion. Secondly, capillary forces [37] within fine sand are more pronounced. These two factors collectively impede the downward flow of oil under gravity, resulting in lower oil drainage efficiency. In contrast, medium and coarse sand have larger inter-particle spaces that form wider and more stable connected channels during gravity oil drainage, thereby enhancing their oil drainage efficiency.
3.2. The Efficiency of Water Displacing Oil in Three Distinct Media
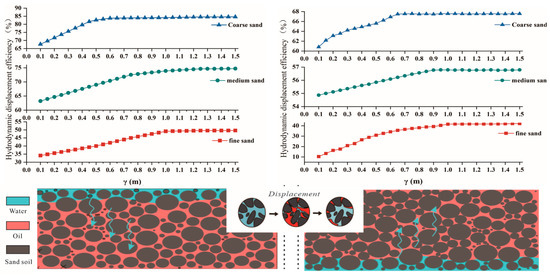
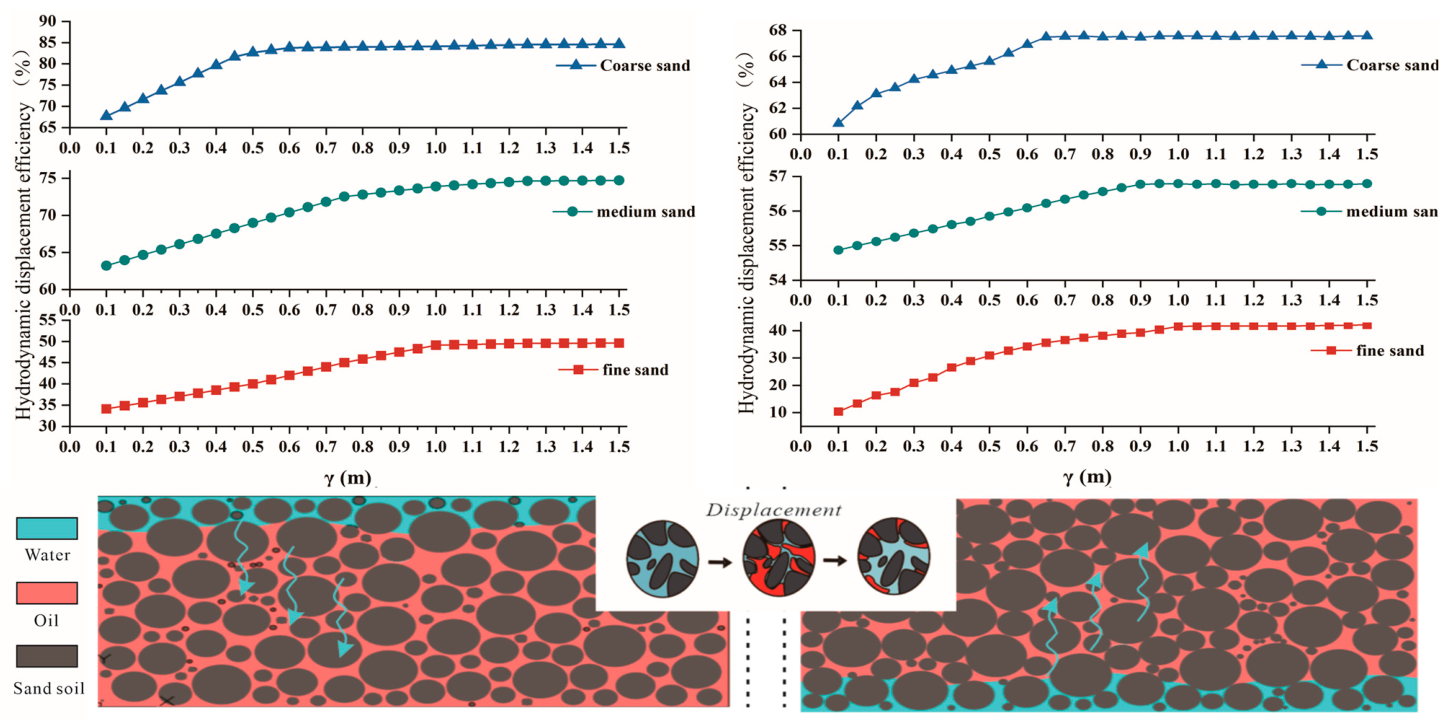
After the gravity oil drainage process was completed, residual oil remained in the sand sample device. To investigate the impact of water flooding on oil displacement efficiency across three media at varying water head heights, this experiment systematically increased the water head height from 0.1 m to 1.5 m in increments of 0.05 m. Multiple replicate groups were established for comparative analysis. Additionally, the experiment examined two different displacement directions. The results are presented in Figure 4.
Figure 4.
The efficiency diagram of water displacing oil (color note: the red square connections represent hydrodynamic oil displacement in fine sand media, the green circle connections represent hydrodynamic oil displacement in medium sand media, and the blue triangle connections represent hydrodynamic oil displacement in coarse sand media; the black circles are medium particles, the pink color represents oil, the light cyan color represents water, and the light cyan arrows indicate the displacement direction).
In the figure, the displacement direction on the left is from top to bottom, while on the right it is from bottom to top. For the water flooding experiment conducted from top to bottom, the oil displacement efficiencies for all three media particle sizes exhibit a gradual increase with the rise in water head height. Specifically, for coarse sand, the maximum oil displacement efficiency reaches 83.5% to 84.6% at a water head height of 0.5 m and remains stable thereafter. For medium sand, the peak efficiency occurs at a water head height of 0.9 m, ranging from 74.18% to 74.7%. For fine sand, the highest efficiency is observed at a water head height of 1.0 m, ranging from 49.12% to 49.61%. In the water flooding experiment conducted from bottom to top, the oil displacement efficiency also increases with the rise in water head height, showing a similar overall trend. At a water head height of 0.65 m, the maximum oil displacement efficiency for coarse sand is 67.47% to 67.56%. At 0.95 m, the maximum efficiency for medium sand is 56.77% to 56.79%. Finally, at 1.05 m, the efficiency for fine sand ranges from 41.72% to 42.08%.
From the experimental results, regardless of the displacement direction, as the water head height increases, the coarse sand medium consistently achieves the highest displacement efficiency first, followed by medium sand and fine sand in that order. The maximum displacement efficiencies exhibit a clear decreasing trend: coarse sand > medium sand > fine sand. This phenomenon can be attributed to the varying particle sizes of the media, which lead to differences in interparticle pore size. During water flooding, coarse sand and medium sand, with their larger pores, tend to form extensive connected channels, facilitating oil expulsion. In contrast, fine sand, characterized by smaller pores and stronger interparticle bonding [38], results in significant residual oil accumulation around the particles. This makes it difficult for injected water to penetrate these obstacles and establish effective flow channels, thereby leading to the lowest oil displacement efficiency for fine sand.
From the perspective of dimensionless analysis, the displacement process can be interpreted by utilizing the capillary number (Ca) and Bond number (Bo), which quantify the relative contributions of viscous, capillary, and gravitational forces.
The capillary number is defined as
where μ is the dynamic viscosity of the displacing fluid, v is the characteristic flow velocity, and is the interfacial tension between water and LNAPL. The capillary number represents the ratio of viscous forces to capillary forces.
The Bond number is defined as
where is the density difference between water and LNAPL, g is gravitational acceleration, and L is a characteristic pore length. The Bond number describes the relative importance of gravitational forces compared to capillary forces.
In this study, an increase in the water head height results in an elevation of the flow velocity, which subsequently causes an increase in the capillary number (Ca). As Ca rises, viscous forces become more predominant relative to capillary forces, thereby facilitating the mobilization and displacement of trapped oil. This accounts for the observed enhancement in displacement efficiency with the increase in the water head.
The influence of particle size can be elucidated through both Ca and the Bond number (Bo). In coarse sand, larger pore sizes give rise to higher permeability and a greater flow velocity under the same hydraulic gradient, leading to a higher effective Ca. Simultaneously, the larger characteristic pore size increases the Bond number, strengthening the role of gravity in overcoming capillary trapping. As a consequence, oil is more readily mobilized and removed, resulting in higher displacement efficiency and a lower residual oil content. Conversely, fine sand is characterized by smaller pore sizes and stronger capillary forces. This leads to a lower effective Ca and a lower Bo, indicating that both viscous and gravitational forces are less effective in overcoming capillary resistance. Consequently, a substantial portion of the oil remains trapped within the pore structure, leading to lower displacement efficiency and a higher residual oil saturation.
Overall, the combined analysis of Ca and Bo offers a mechanistic explanation for the observed relationships between particle size, water head, displacement direction, and displacement efficiency in this study.
Furthermore, the experimental results demonstrate that there are significant differences in oil displacement efficiency for the same medium under two different displacement directions. For instance, with coarse sand, the maximum water flooding efficiency from top to bottom is 16.03% to 17.04% higher than that from bottom to top, and the required water head height to achieve this efficiency is 0.15 m lower. Similar trends are observed in medium sand and fine sand. This discrepancy can primarily be attributed to gravitational effects [39]: during top-to-bottom water flooding, gravity enhances displacement efficiency and reduces the necessary water head height; conversely, bottom-to-top water flooding must overcome gravity, leading to decreased efficiency and increased water head height requirements. In subsequent sections, this paper will provide a detailed analysis of how displacement direction influences displacement efficiency.
To further quantify the displacement process, a critical water head (Hc) is defined as the point where the growth rate of displacement efficiency significantly decreases and the curve approaches stabilization. Based on the experimental data, the Hc values for coarse sand, medium sand, and fine sand are approximately 0.5 m, 0.9 m, and 1.0 m, respectively. Moreover, the stabilization interval is defined as the range of water head within which the variation in displacement efficiency is less than 2%. It is found that coarse sand reaches stabilization rapidly after H ≈ 0.5 m, while medium and fine sand need higher water head values and show a broader stabilization range. This suggests that finer media require greater hydraulic driving forces to overcome capillary resistance. In the initial stage (H < Hc), the displacement efficiency increases approximately linearly with the water head. The slope of the efficiency curve in coarse sand is significantly steeper than that in medium and fine sand, indicating a stronger response to hydraulic forcing. This reflects the lower capillary resistance and better pore connectivity in coarse media.
3.3. Overall Analysis of Oil Displacement Efficiency
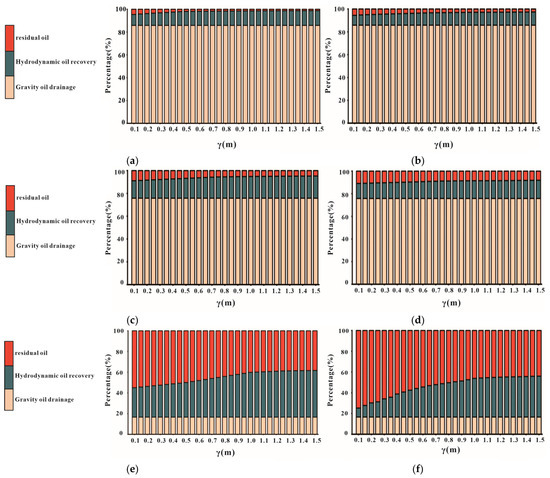
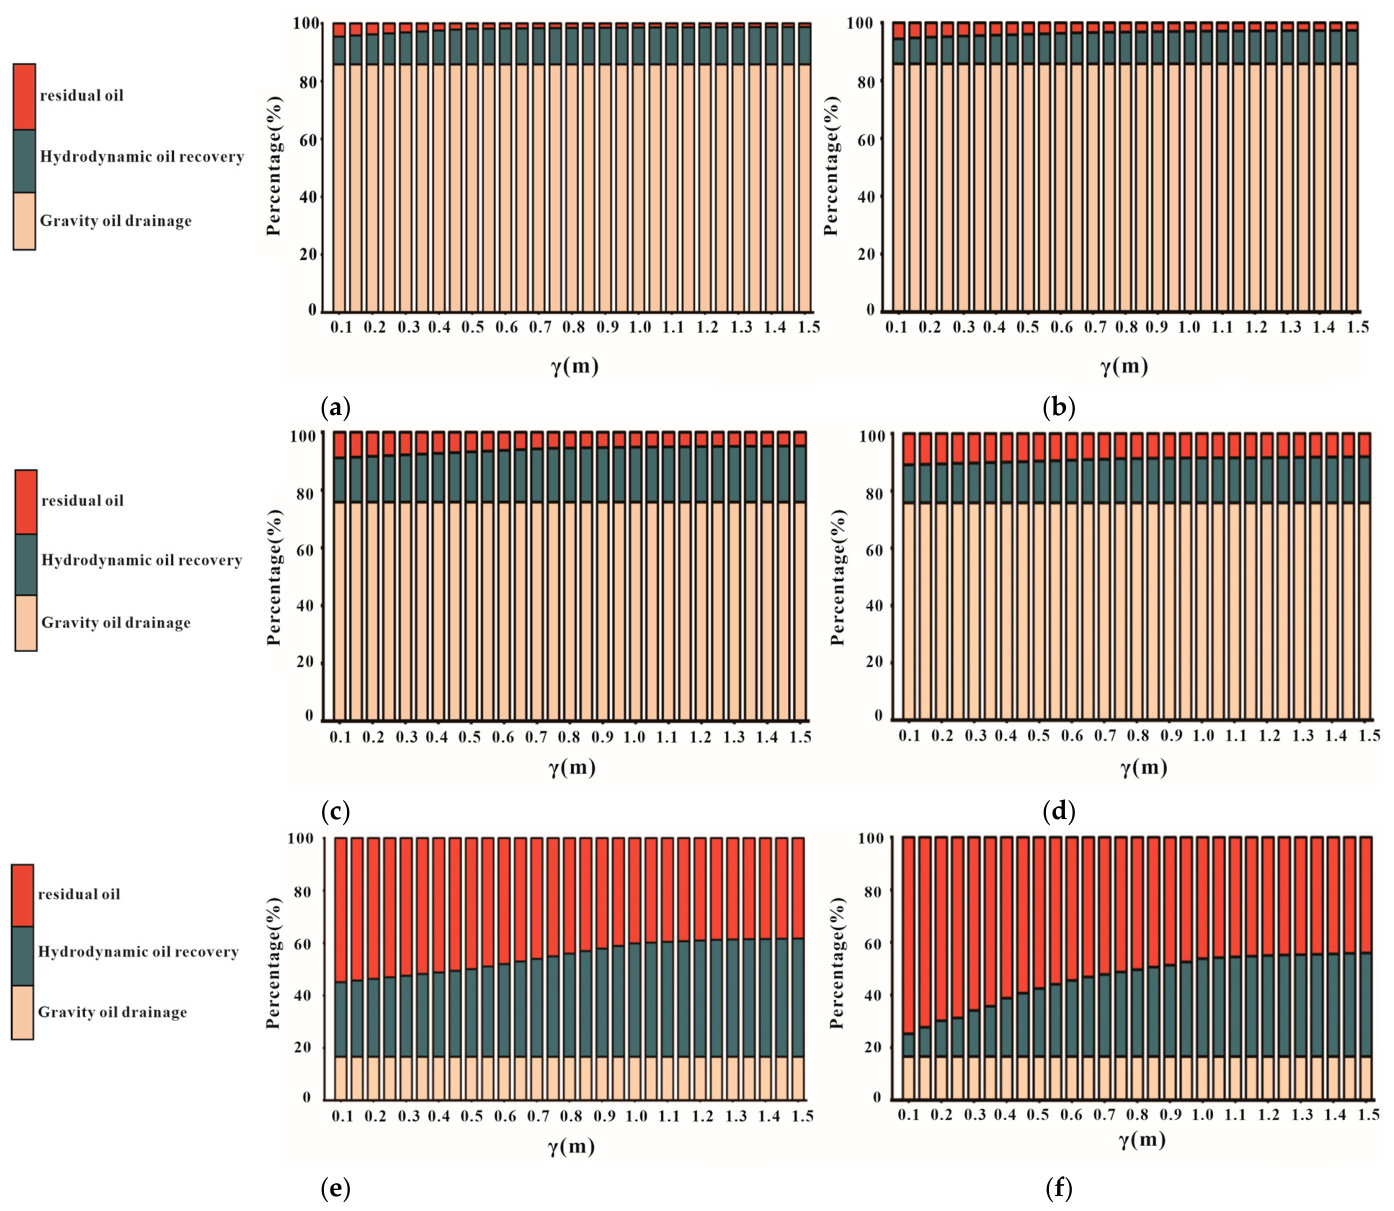
After the oil displacement by gravity and hydrodynamic forces, residual oil remains in the medium, with varying results across different media. To more effectively illustrate the final displacement efficiency, we generated the percentage chart presented in Figure 5.
Figure 5.
Proportion diagram of each item. (a,c,e) represent the coarse sand, medium sand, and fine sand media, respectively, as well as the displacement direction from bottom to top. (b,d,f) respectively represent coarse sand, medium sand, and fine sand media, as well as the displacement direction from top to bottom. (color note: red indicates residual oil, dark green represents hydrodynamic oil recovery, and dark yellow represents gravity oil drainage).
A mass balance approach was utilized, where the initial oil volume was presumed to be equivalent to the sum of gravity drainage, hydrodynamic displacement, and residual oil within the porous medium. This formulation is founded on the principle of mass conservation for a closed multiphase system, in which no chemical reactions take place and mass transfer between phases (e.g., dissolution into water) is negligible for LNAPL under experimental conditions. Accordingly, the total oil volume can be expressed as
Minor discrepancies (within ±3%) are predominantly ascribed to two factors: measurement uncertainty and diesel evaporation. Measurement uncertainty stems from the constraints of volumetric readings, especially when gathering small amounts of discharged oil during the later phase of the experiment. This uncertainty chiefly impacts the partitioning between hydrodynamic displacement and residual oil. For instance, a slight underestimation of the collected oil volume would result in a corresponding overestimation of residual oil, and conversely. However, given that the magnitude of this uncertainty is small and consistent across all experimental conditions, it does not affect the comparative trends of displacement efficiency among different media or displacement directions. Evaporation represents a systematic loss factor that diminishes the measurable oil volume. Under the controlled laboratory conditions (20 ± 2 °C and limited exposure duration), diesel evaporation is relatively low owing to its moderate volatility. Nevertheless, minor evaporation may lead to a slight underestimation of both the recovered oil and residual oil volumes, causing a marginal overestimation of displacement efficiency. Overall, the combined influence of measurement uncertainty and evaporation remains restricted, and the small deviation (within ±3%) validates the mass—balance assumption for the present experimental system. Significantly, these factors do not modify the observed relationships between particle size, water head, displacement direction, and displacement efficiency.
Throughout the experimental process, the sand sample soil column experienced two stages: gravity drainage and hydrodynamic drainage of oil. Figure 5 clearly illustrates the proportions of gravity drainage, hydrodynamic drainage under varying water head heights, and the final residual oil volume for three different particle sizes of sand media. Specifically, Figure 5a,b present the results for coarse sand media, (c) and (d) for medium sand media, and (e) and (f) for fine sand media. Among these, (a), (c), and (e) depict the displacement direction from top to bottom, while (b), (d), and (f) show the displacement direction from bottom to top. To enhance the clarity of the results, the gravity drainage values are averaged across all media throughout the experiment, whereas the hydrodynamic drainage and residual oil volumes are adjusted according to their respective proportions.
As shown in Figure 5, the final displacement efficiency for coarse sand is 98.74%, with a residual oil content of 1.26%; for medium sand, the final displacement efficiency is 95.27%, and the residual oil content is 4.73%; for fine sand, the final displacement efficiency is 61.7%, and the residual oil content is 38.3%. The experimental results indicate that after undergoing two stages of gravity drainage (simulating the effect of gravity on LNAPL in natural sand layers) and hydrodynamic drainage under varying water head heights (simulating fluctuations in groundwater levels), the oil displacement efficiency in coarse and medium sand media is significantly higher than in fine sand media. Specifically, the residual oil content in fine sand reaches as high as 38.3%, while its oil displacement efficiency is only 61.7%. This suggests that particle size not only influences gravity drainage efficiency but also has a substantial impact on hydrodynamic displacement efficiency. Furthermore, by comparing the data from the left and right sides of Figure 5 (representing the two different displacement directions), it is evident that the direction of displacement significantly affects the final oil displacement efficiency in the sand sample media.
The residual oil ratios after the combined action of gravity and hydrodynamic displacement are quantitatively determined to be 1.26% for coarse sand, 4.73% for medium sand, and 38.3% for fine sand. The difference in residual oil ratios between fine sand and coarse sand exceeds 30%, which highlights the dominant role of pore structure in controlling residual trapping.
3.4. The Influence of Size Effect on Hydrodynamic Oil Displacement
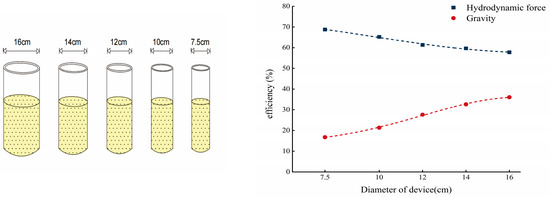
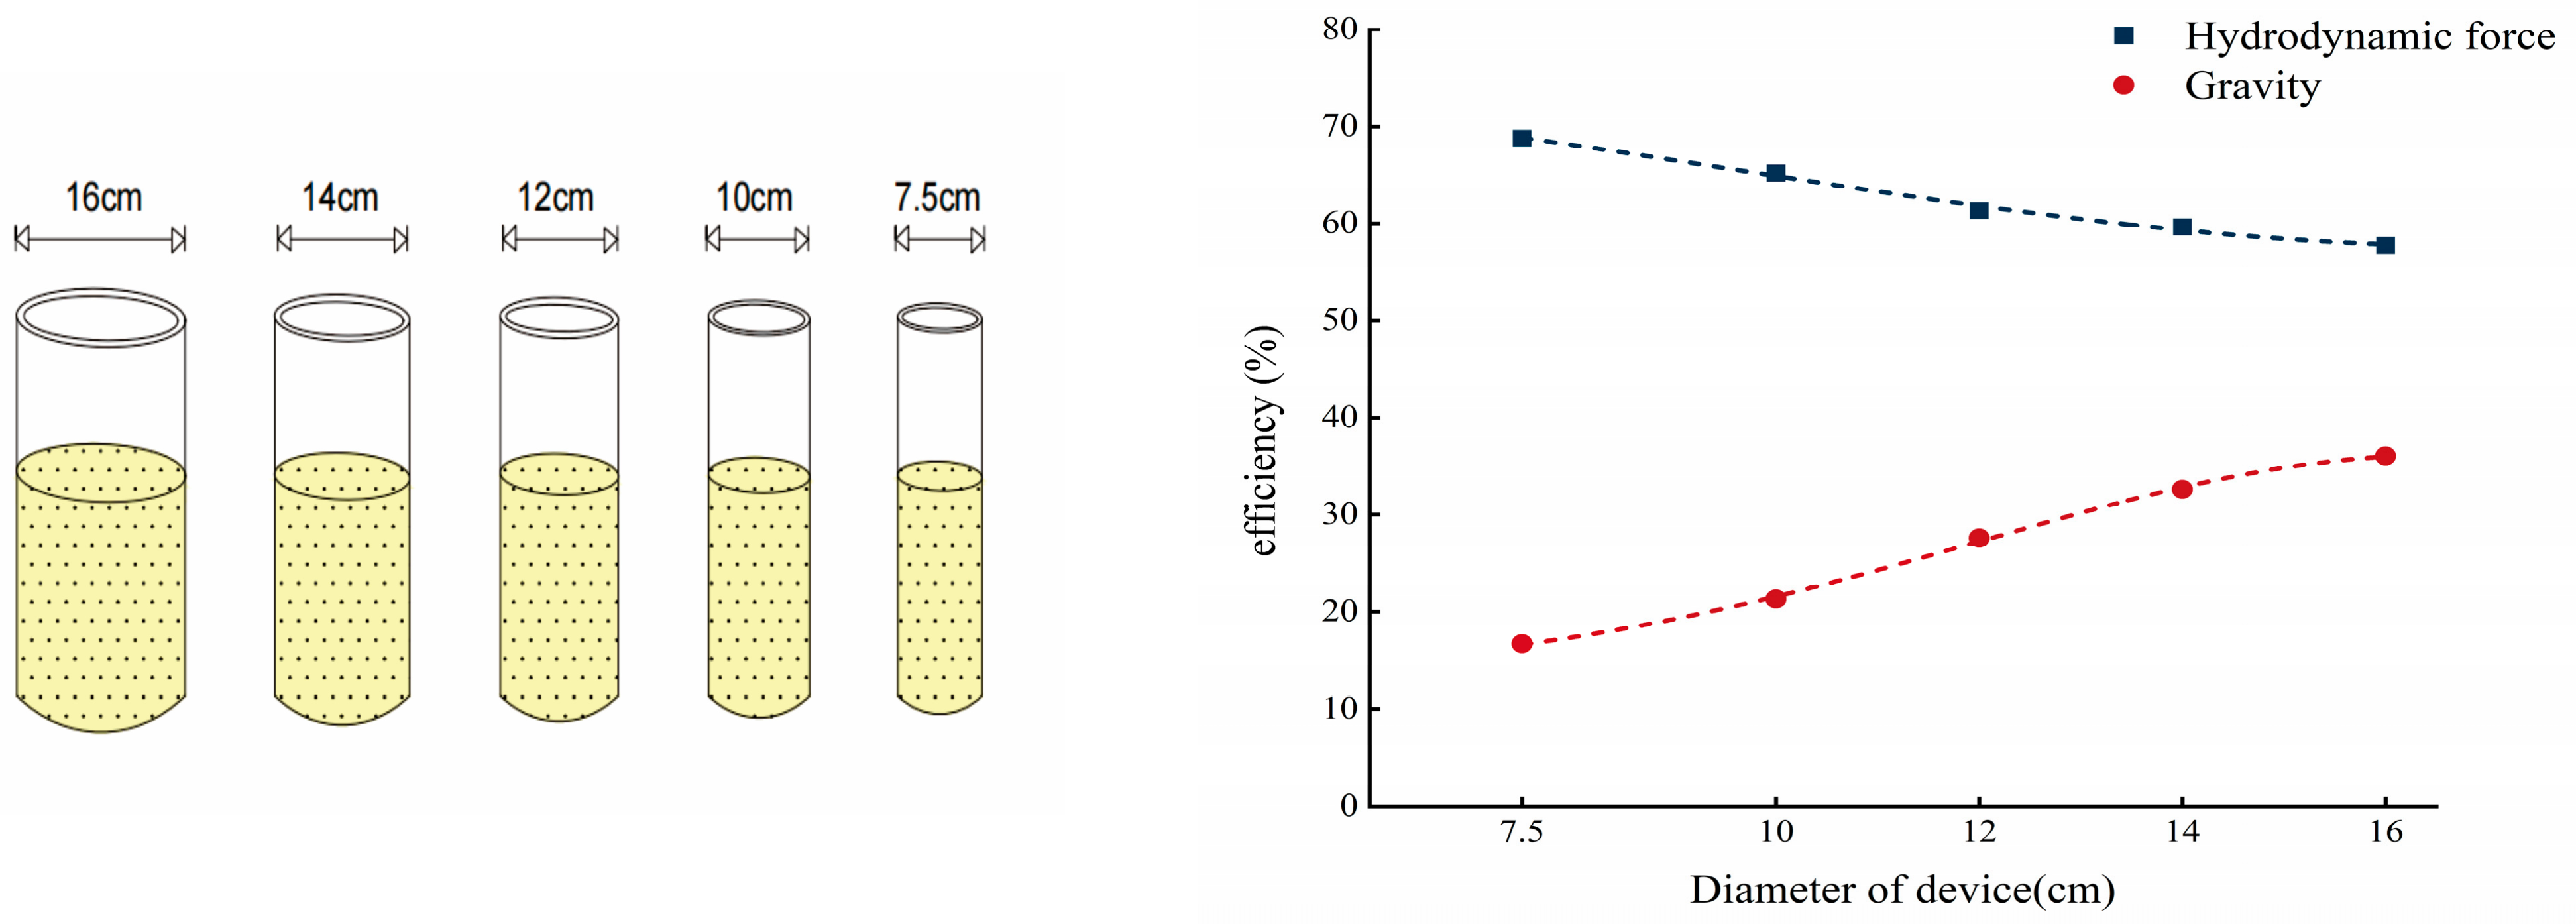
This paper investigates the oil displacement efficiency of three media under varying water head heights, taking into account the influence of medium particle size and displacement direction. Additionally, the impact of device size on experimental outcomes is examined as a significant factor. In the original experiment, a cylindrical device with a diameter of 7.5 cm was used for sand samples. To further analyze the effect of device size, devices with diameters of 10 cm, 12 cm, 14 cm, and 16 cm have been introduced. Using fine sand with a water head height of 0.5 m and a top-to-bottom displacement direction as an example, this study evaluates how different device sizes influence the test results, The test results are shown in Figure 6 below.
Figure 6.
The influence of device diameter.
According to the experimental results, as the device size increases, the efficiency of gravity-driven oil displacement significantly improves from 16.7% in the initial test to 36.05%, representing an increase of nearly 116%. In contrast, the efficiency of hydrodynamic oil displacement gradually decreases from an initial value of 68.79% to 57.77%, a reduction of approximately 11.02 percentage points. These findings indicate that the size effect has a particularly pronounced impact on gravity-driven oil displacement efficiency, nearly doubling it. Conversely, the influence of size changes on hydrodynamic oil displacement efficiency is relatively minor.
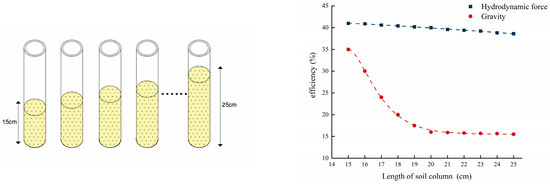
Another critical factor that must be considered in this experiment is the height of the sand sample within the device. To systematically investigate this factor, we designed ten sets of comparative experiments with varying heights (ranging from 15 cm to 25 cm). Using fine sand as an example and maintaining a water head height of 0.5 m with displacement directed from top to bottom, we conducted a detailed analysis. The test results are shown in Figure 7 below.
Figure 7.
The influence of medium height.
It can be observed in Figure 7 that as the height of the sand sample increases, both oil drainage methods exhibit a decreasing trend in oil displacement efficiency. The efficiency of gravity oil drainage decreases gradually from 41% to 38.6%. In contrast, the hydrodynamic oil drainage efficiency shows a more pronounced decline: when the height of the sand sample increases from 15 cm to 20 cm, the displacement efficiency drops sharply from 35% to 16%; however, between 20 cm and 25 cm, the efficiency only marginally decreases to 15.5%. This suggests that the height of the sand sample has a more substantial impact on the hydrodynamic oil displacement efficiency, with a clear negative correlation evident.
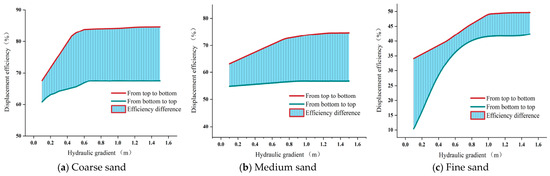
In the previous section, the displacement direction was initially explained. As another key factor influencing the experimental results, to elaborate on the impact of the displacement direction on the water displacement efficiency of oil, this paper has created Figure 8, a comparison chart of displacement direction efficiency, to illustrate the influence of the two displacement directions, from top to bottom and from bottom to top, on the experimental results.
Figure 8.
The difference in displacement efficiency among the three media. (a) represents the difference in efficiency between the two displacement directions in a coarse sand medium. (b) represents the difference in efficiency between the two displacement directions in a medium sand reservoir. (c) represents the difference in efficiency between the two displacement directions in a fine sand medium.(color note: the red line indicates water-driven oil production from top to bottom, the green line indicates water-driven oil production from bottom to top, and the light blue area represents the efficiency difference).
First, from the perspective of the overall change pattern, all three types of media under two displacement directions exhibit a common characteristic: the displacement efficiency gradually increases with the rise of the water head height and tends to stabilize under relatively high water head conditions. The influence of different displacement directions on the displacement efficiency is clearly manifested in all three types of media, especially in the low—to medium—water head stage. Whether it is coarse sand, medium sand, or fine sand, the displacement efficiency under the top—down water displacement is always higher than that under the bottom—up water displacement. The corresponding efficiency difference is the largest in the low—water head range and then gradually stabilizes as the water head increases. This phenomenon indicates that the displacement direction not only affects the ultimate achievable displacement efficiency level but also influences the efficiency improvement rate during the displacement process. The displacement direction effect intensifies as the particle size of the medium decreases.
In coarse sand, the overall efficiency difference between the two displacement directions is relatively small, and it can quickly approach a stable state under a relatively low water head. This shows that under the conditions of large pores and high permeability, the relative influence of gravity and driving force is limited. The water phase can more easily form continuous flow channels, and the expulsion of the oil phase is less restricted by the displacement direction. In medium sand, this difference is magnified. The efficiency difference remains relatively stable throughout the water head change range, indicating that as the pore size decreases, the combined action of the gravity effect and capillary force makes the influence of the displacement direction on the migration path and expulsion efficiency of the oil phase more obvious.
This pattern is most prominent in fine sand. In the low-head stage, the displacement efficiency of bottom-up water flooding is significantly lower, while top-down water flooding can still maintain a relatively high efficiency level, resulting in an increase in the efficiency difference between the two displacement directions. As the water head rises, although the efficiency of bottom-up water flooding is significantly improved, it is still difficult to fully make up for the gap caused by the unfavorable influence of gravity in the initial stage. This indicates that in fine-grained media, small pores and high capillary pressure amplify the effect of the gravity direction. Bottom-up water flooding not only needs to overcome the capillary retention of the oil phase but also needs to additionally overcome the unfavorable term of gravity, thus increasing the difficulty of initiating displacement and the energy requirement. From the comparison results of the three groups of graphs, it can be concluded that the influence of the displacement direction on the oil displacement efficiency is universal, but the degree of influence is closely related to the particle size of the medium. Top-down water flooding shows higher displacement efficiency, a faster efficiency improvement rate, and a lower critical water head height in different media; and the finer the medium, the more obvious this advantage is.
By comprehensively considering the three factors of device size, medium thickness, and displacement direction, it can be clearly determined that these three factors all have different degrees of influence on the displacement efficiency.
4. Discussion
This study systematically investigated the efficiency of water flooding for oil recovery through indoor sand-column experiments, analyzing the effects of particle size and displacement direction on resistivity changes.
In the “Results and Analysis” section, this study comprehensively examined the impact of particle size on displacement efficiency. Future research is recommended to explore the role of secondary minerals and free mineral ions in media with different particle sizes from a microscopic perspective, thereby achieving a more comprehensive understanding of how particle size influences experimental outcomes. This study employed uniform sand samples and diesel as a light non-aqueous phase liquid (LNAPL) contaminant to investigate specific patterns of displacement efficiency variation. Future research should also consider other types of LNAPL pollutants and more complex medium conditions in experimental design, aiming to provide a robust scientific foundation for addressing intricate soil and groundwater contamination problems.
Under the assumption of Darcy flow, the flow rate is proportional to the hydraulic gradient, which is defined by the hydraulic head. In this study, parameters such as flow velocity, porosity, permeability, and the capillary pressure—saturation relationship were not directly measured. Specifically, the relative difference in hydraulic driving force can be reflected by the change in hydraulic head. Porosity and permeability are closely associated with the particle size distribution and packing structure. Coarser media typically exhibit higher permeability and lower capillary resistance, which is in line with the observed high displacement efficiency. The effects of permeability and the capillary pressure—saturation relationship can also be indirectly reflected via changes in particle size and displacement behavior. Future research should directly measure these parameters to enhance quantitative modeling and achieve a more detailed coupling with numerical models. This study employed the method of gradually increasing the hydraulic head to simulate hydrodynamic effects. Although it can reflect the influence of the increasing hydraulic gradient, it fails to fully capture the temporal fluctuations of the groundwater level. Subsequent research should take into account time—varying boundary conditions to more effectively simulate the actual field dynamics.
To extend the applicability of the experimental results, a semi-empirical model is proposed to describe the displacement efficiency of LNAPL under hydrodynamic conditions. The displacement efficiency (E) can be expressed as a function of the water head (H) and the characteristics of the porous medium:
where is the maximum achievable displacement efficiency, k is the efficiency growth coefficient reflecting the combined effect of permeability and capillary resistance, and is the critical water head corresponding to the onset of effective displacement. In this formulation, the parameter k is strongly dependent on particle size and pore connectivity, while represents the minimum hydraulic condition required to overcome capillary forces.
Based on the experimental results in this study, Hc can be directly determined for different media (approximately 0.5 m, 0.9 m, and 1.0 m for coarse, medium, and fine sand, respectively), while corresponds to the plateau value of displacement efficiency. The parameter k can be estimated from the slope of the efficiency curve in the initial stage. This model provides a practical framework for calibrating displacement behavior under similar porous media conditions and can be used to estimate the required hydraulic head and expected recovery efficiency in field applications.
From an engineering application perspective, the results of this study provide several practical implications for the remediation of LNAPL-contaminated sites. First, the critical water head values identified for different media can be used to estimate the minimum hydraulic gradient required to initiate effective LNAPL displacement. In field applications, this information can guide the design of water injection pressure or hydraulic control systems to ensure a sufficient driving force for LNAPL removal. Second, the experimental results demonstrate that displacement direction significantly affects removal efficiency. Top-down displacement—benefiting from gravity—consistently exhibits higher efficiency than bottom-up displacement. This suggests that, in practical remediation strategies, gravity-assisted flow configurations—such as surface infiltration or downward injection—should be prioritized whenever site conditions permit. Third, the residual oil saturation ratios observed in different media provide a quantitative reference for evaluating remediation endpoints. In fine-grained soils, a relatively high residual oil saturation may persist even under strong hydrodynamic forcing, indicating that supplementary remediation techniques (e.g., surfactant flushing or thermal treatment) may be necessary. Overall, these findings provide a quantitative basis for optimizing hydraulic conditions, flow configuration, and integrated remediation strategies at LNAPL-contaminated sites.
It is important to note that although the experimental results offer valuable guidance for enhancing displacement efficiency, the practical implementation under field conditions may be affected by factors such as subsurface heterogeneity, economic limitations, and site accessibility. These factors must be meticulously considered when applying laboratory-derived findings to real-world remediation design.
5. Conclusions
The particle size of the sand medium plays a dominant role in controlling oil-phase discharge efficiency. During the gravity-driven oil drainage stage, differences in oil drainage efficiency among different media are significant, with coarse sand exhibiting the highest efficiency. From the perspective of final displacement efficiency, coarse sand achieves the highest displacement efficiency and the lowest residual oil volume, whereas fine sand yields the lowest displacement efficiency and the highest residual oil volume. After both gravity-driven oil drainage and hydrodynamic oil drainage under varying water heads, the oil drainage efficiencies of coarse sand and medium sand are both higher than that of fine sand. As the water head increases, the hydrodynamic displacement effect is enhanced, leading to improved oil drainage efficiency. In terms of displacement direction, top-to-bottom displacement yields higher efficiency than bottom-to-top displacement. Taking coarse sand as an example, the maximum displacement efficiency achieved under top-down displacement is significantly higher than that under bottom-up displacement, and the required water head is reduced. When the device size increases, gravity-driven oil drainage efficiency improves significantly, whereas hydrodynamic oil drainage efficiency decreases. Conversely, when the height of the sand sample column increases, both gravity-driven and hydrodynamic oil drainage efficiencies decrease—though the decline in gravity-driven efficiency is relatively modest, hydrodynamic efficiency is markedly more sensitive to column height. Specifically, when the column height increases from 15 cm to 20 cm, hydrodynamic oil drainage efficiency drops sharply; it then stabilizes upon further increase to 25 cm.
Author Contributions
Resources, Methodology, Technical validation, P.A.; Data curation, Data analysis, Data processing, Writing—original draft, H.Z.; Funding acquisition and Data collection, W.Q.; Writing—review & editing, Thesis supervision and revision, J.A. All authors have read and agreed to the published version of the manuscript.
Funding
This research was funded by [Key Scientific Research Project of Colleges and Universities in Henan Province] grant number [24A170020].
Institutional Review Board Statement
Not applicable.
Informed Consent Statement
Not applicable.
Data Availability Statement
The original contributions presented in the study are included in the article, further inquiries can be directed to the corresponding author.
Acknowledgments
Throughout the entire process of writing this thesis, I received a great deal of support and assistance. I especially want to thank my team members, Jie An and Huan Zhu, for their excellent cooperation and patient support. I also want to thank Wei Qiao, for the valuable guidance they provided throughout my learning process. You provided me with the necessary tools, enabling me to choose the right direction and successfully complete my thesis.
Conflicts of Interest
Author Huan Zhu was employed by the company Shaanxi Zhongsheng Eco-Enbiironment Consulting Serbices Co., Ltd. Author Peng An was employed by the company Jilin Province Water Resource and Hydropower Consultative Company of P.R.CHINA. The remaining authors declare that the research was conducted in the absence of any commercial or financial relationships that could be construed as a potential conflict of interest.
References
- ASTM. Standard Guide for Development of Conceptual Site Models and Remediation Strategies for Light Non-Aqueous-Phase Liquids Released to the Subsurface; ASTM International: West Conshohocken, PA, USA, 2014. [Google Scholar]
- Rivett, M.O.; Tomlinson, D.W.; Thornton, S.F.; Thomas, A.O.; Leharne, S.A.; Wealthall, G.P. An Illustrated Handbook of LNAPL Transport and Fate in the Subsurface; University of Strathclyde: Glasgow, UK, 2014. [Google Scholar]
- Fetter, C.W.; Thomas, B.; Boving, T.B.; Kreamer, D. Contaminant Hydrogeology, 3rd ed.; Waveland Press: Long Grove, IL, USA, 1997; 647p. [Google Scholar]
- Alazaiza, M.Y.D.; Ramli, M.H.; Copty, N.K.; Sheng, T.J.; Aburas, M.M. LNAPL saturation distribution under the influence of water table fluctuations using simplified image analysis method. Bull. Eng. Geol. Environ. 2020, 79, 1543–1554. [Google Scholar] [CrossRef] [Scilit]
- Shen, H.; Huang, Y.; Illman, W.A.; Su, Y.; Miao, K. Migration behaviour of LNAPL in fractures filled with porous media: Laboratory experiments and numerical simulations. J. Contam. Hydrol. 2023, 253, 104118. [Google Scholar] [CrossRef] [Scilit]
- Zuo, R.; Wu, Z.; Li, J.; Zheng, S.; Liu, J.; Han, K.; Liu, Y.; Wang, J. Retention effect and mode of capillary zone on the migration process of LNAPL pollutants based on experimental exploration. Ecotoxicol. Environ. Saf. 2023, 253, 114669. [Google Scholar] [CrossRef] [Scilit]
- Yuan, C.; Yin, Y.; Hu, X.; Yu, X.; Li, Y. Experimental and numerical simulation study on quantitative assessment of LNAPL migration behavior in porous media. J. Hydrol. 2024, 651, 132619. [Google Scholar] [CrossRef] [Scilit]
- Lu, B.; Wu, S.; Tan, Y.; Yu, S.E.; Xie, X. Characterization of residual LNAPL and effect of LNAPL entrapment configuration on water flow in a single fracture. Adv. Water Sci. 2015, 26, 107–113. [Google Scholar]
- Atteia, O.; Palmier, C.; Schäfer, G. On the influence of groundwater table fluctuations on oil thickness in a well related to an LNAPL contaminated aquifer. J. Contam. Hydrol. 2019, 223, 103476. [Google Scholar] [CrossRef] [Scilit] [PubMed]
- Gatsios, E.; García-Rincón, J.; Rayner, J.L.; McLaughlan, R.G.; Davis, G.B. LNAPL transmissivity as a remediation metric in complex sites under water table fluctuations. J. Environ. Manag. 2018, 215, 40–48. [Google Scholar] [CrossRef] [Scilit] [PubMed]
- Kemblowski, M.W.; Chiang, C.Y. Hydrocarbon Thickness Fluctuations in Monitoring Wells. Ground Water 1990, 28, 244–252. [Google Scholar] [CrossRef] [Scilit]
- Aral, M.M.; Liao, B. Effect of groundwater table fluctuations on LNAPL thickness in monitoring wells. Environ. Geol. 2002, 42, 151–161. [Google Scholar] [CrossRef] [Scilit]
- Deska, I.; Ociepa, E. Impact of the Water Table Fluctuations on the Apparent Thickness of Light Non-Aqueous Phase Liquids. Ecol. Chem. Eng. A 2013, 20, 771–778. [Google Scholar]
- Johnston, C.D.; Adamski, M. Relationship between initial and residual LNAPL saturation for different soil types. In Proceedings of the 2005 Petroleum Hydrocarbons and Organic Chemicals in Groundwater®: Prevention, Assessment, and Remediation Conference, Costa Mesa, CA, USA, 18–19 August 2005; pp. 17–19. [Google Scholar]
- Lenhard, R.J.; Parker, J.C. Measurement and prediction of saturation-pressure relationships in three-phase porous media systems. J. Contam. Hydrol. 1987, 1, 407–424. [Google Scholar] [CrossRef] [Scilit]
- Liao, B.; Aral, M.M. Interpretation of LNAPL thickness measurements under unsteady conditions. J. Hydrol. Eng. 1999, 4, 125–134. [Google Scholar] [CrossRef] [Scilit]
- Marinelli, F.; Durnford, D.S. LNAPL thickness in monitoring wells considering hysteresis and entrapment. Groundwater 1996, 34, 405–414. [Google Scholar] [CrossRef] [Scilit]
- Rayner, J.L.; Johnston, C.D.; Rao, P.S.C. Characterising residual NAPL using partitioning and interfacial tracers, and implications for interphase mass transfer. In Contaminated Site Remediation Conference: From Source Zones to Ecosystems; Centre for Groundwater Studies: Adelaide, Australia, 2000; pp. 613–620. [Google Scholar]
- Steffy, D.A.; Johnston, C.; Barry, D.A. A field study of the vertical immiscible displacement of LNAPL associated with a fluctuating water table. In Groundwater Quality: Remediation and Protection; International Association of Hydrological Sciences: Wallingford, UK, 1995. [Google Scholar]
- Steffy, D.A.; Johnston, C.D.; Barry, D.A. Numerical simulations and long-column tests of LNAPL displacement and trapping by a fluctuating water table. J. Soil Contam. 1998, 7, 325–356. [Google Scholar] [CrossRef] [Scilit]
- Vaezihir, A.; Bayanlou, M.B.; Ahmadnezhad, Z.; Barzegari, G. Remediation of BTEX plume in a continuous flow model using zeolite-PRB. J. Contam. Hydrol. 2020, 230, 103604. [Google Scholar] [CrossRef] [Scilit]
- Charbeneau, R.J. LNAPL distribution and recovery model (LDRM). In Volume 1: Distribution and Recovery of Petroleum Hydrocarbon Liquids in Porous Media; API Publ. No. 4760; American Petroleum Institute: Washington, DC, USA, 2007. [Google Scholar]
- Jeong, J.; Charbeneau, R.J. An analytical model for predicting LNAPL distribution and recovery from multi-layered soils. J. Contam. Hydrol. 2014, 156, 52–61. [Google Scholar] [CrossRef] [Scilit]
- Matos de Souza, M.; Oostrom, M.; White, M.D.; da Silva, G.C., Jr.; Barbosa, M.C. Simulation of subsurface multiphase contaminant extraction using a bioslurping well model. Trans. Porous Media 2016, 114, 649–673. [Google Scholar] [CrossRef] [Scilit]
- Sookhak Lari, K.; Johnston, C.D.; Davis, G.B. Gasoline multi-phase and multicomponent partitioning in the vadose zone: Dynamics and risk longevity. Vadose Zone J. 2016, 15, vzj2015-07. [Google Scholar]
- White, M.D.; Oostrom, M.; Lenhard, R.J. Apractical model for mobile, residual and entrapped NAPL in water-wet porous media. Ground Water 2004, 42, 734–746. [Google Scholar] [CrossRef] [Scilit]
- Suo, K.; Zhao, M.; Liu, Y.; Liu, H.; Jia, M. A study on the monitoring of LNAPL migration using ERT. PLoS ONE 2025, 20, e0315624. [Google Scholar] [CrossRef] [Scilit]
- Campbell, D.L.; Lucius, J.E.; Ellefsen, K.J.; Deszcz-Pan, M. Monitoring of a controlled LNAPL spill using ground-penetrating radar. In 9th EEGS Symposium on the Application of Geophysics to Engineering and Environmental Problems; European Association of Geoscientists & Engineers: Houten, The Netherlands, 1996; p. cp-205-00055. [Google Scholar]
- Wang, J.P.; Hu, N.; François, B.; Lambert, P. Estimating water retention curves and strength properties of unsaturated sandy soils from basic soil gradation parameters. Water Resour. Res. 2017, 53, 6069–6088. [Google Scholar] [CrossRef] [Scilit]
- Torres-Jimenez, E.; Jerman, M.S.; Gregorc, A.; Lisec, I.; Dorado, M.P.; Kegl, B. Physical and chemical properties of ethanol–diesel fuel blends. Fuel 2011, 90, 795–802. [Google Scholar] [CrossRef] [Scilit]
- Atwood, D.F.; Gorelick, S.M. Hydraulic gradient control for groundwater contaminant removal. J. Hydrol. 1985, 76, 85–106. [Google Scholar] [CrossRef] [Scilit]
- Hao, Z.; Zheng, J.; Ge, Q.; Guo, X. Relationship between precipitation and the infiltration depth over the middle and lower reaches of the Yellow River and Yangtze-Huaihe River Valley. Prog. Nat. Sci. 2008, 18, 1123–1128. [Google Scholar] [CrossRef] [Scilit]
- Bob, M.; Rahman, N.; Elamin, A.; Taher, S. Rising groundwater levels problem in urban areas: A case study from the Central Area of Madinah City, Saudi Arabia. Arab. J. Sci. Eng. 2016, 41, 1461–1472. [Google Scholar] [CrossRef] [Scilit]
- Mineo, S. Groundwater and soil contamination by LNAPL: State of the art and future challenges. Sci. Total Environ. 2023, 874, 162394. [Google Scholar] [CrossRef] [Scilit] [PubMed]
- Tylli, N.; Kaiktsis, L.; Ineichen, B. Sidewall effects in flow over a backward-facing step: Experiments and numerical simulations. Phys. Fluids 2002, 14, 3835–3845. [Google Scholar] [CrossRef] [Scilit]
- Petersen, L.W.; Moldrup, P.; Jacobsen, O.H.; Rolston, D.E. Relations between specific surface area and soil physical and chemical properties. Soil Sci. 1996, 161, 9–21. [Google Scholar] [CrossRef] [Scilit]
- Kralchevsky, P.A.; Denkov, N.D. Capillary forces and structuring in layers of colloid particles. Curr. Opin. Colloid Interface Sci. 2001, 6, 383–401. [Google Scholar] [CrossRef] [Scilit]
- Kemper, W.D.; Rosenau, R.C. Soil cohesion as affected by time and water content. Soil Sci. Soc. Am. J. 1984, 48, 1001–1006. [Google Scholar] [CrossRef] [Scilit]
- Shadab, M.A.; Hesse, M.A. Analysis of gravity—Driven infiltration with the development of a saturated region. Water Resour. Res. 2022, 58, e2022WR032963. [Google Scholar] [CrossRef] [Scilit]

Disclaimer/Publisher’s Note: The statements, opinions and data contained in all publications are solely those of the individual author(s) and contributor(s) and not of MDPI and/or the editor(s). MDPI and/or the editor(s) disclaim responsibility for any injury to people or property resulting from any ideas, methods, instructions or products referred to in the content. |
© 2026 by the authors. Licensee MDPI, Basel, Switzerland. This article is an open access article distributed under the terms and conditions of the Creative Commons Attribution (CC BY) license.