


Abstract
Accurate and accessible motor function quantification is important for monitoring the movement disorders’ progression. Manual muscle testing models and wearable sensors can be costly or reduce degrees of freedom. Artificial intelligence, especially human pose estimation (PE), offers promising alternatives. This work aims to compare the accuracy of a 2D PE tool for the Finger Tapping Test (FTT) with a 3D infrared motion capture system (MoCap). PE tracked three anatomical landmarks (wrist, thumb, index finger), while reflective markers were placed at corresponding locations on both tools to measure wrist-centered angles. Different trials of slow and rapid FTT sessions were statistically analyzed by rank correlation analysis, Friedman, Bland–Altman, and Kruskal–Wallis to assess agreement and repeatability. PE and MoCap measurements showed no significant differences (p > 0.05), with high reliability (ICC 0.87–0.91), low variability (CV 6–8.6%), and negligible effect size. Bland–Altman slopes indicated minor amplitude-dependent bias, while RMSE (2.92–4.48°) and MAPE (6.38–8.22%) errors occurred in slow and rapid conditions. These results demonstrate that 2D PE provides a reliable, accessible, and low-cost alternative for quantifying finger movement. The findings suggest that PE can serve as an assistive method for monitoring motor function. Future studies can be population-level studies with patients with neurological disorders.
1. Introduction
Artificial Intelligence (AI) has emerged as a supportive tool in clinical fields and is taking an essential role in physical assessments, diagnostics, and well-being [1]. AI can classify diseases, document and monitor motor functions, analyze data trends, and provide real-time feedback [2]. This can be achieved using tools such as deep learning (DL), which focuses on neural networks with multiple layers, and combining it with computer vision, allowing for the interpretation of video data to assess motor functions [3]. Scaling is the process of quantifying motor performance using standardized measures that would enable comparisons across time, medication effects, and disease stages [4]. Accurate and trustworthy scaling or monitoring through clinical and authorized tests is essential for global clinical settings and research to document patients’ mobility abilities over various periods. Continuous monitoring is crucial for understanding and comparing patients’ results to diagnose disease stages and inform future therapeutic strategies [5]. Indeed, understanding the possible error range is important in the scaling cases [6].
Disorders affecting motor control can originate from different parts of the neuromotor system, including the muscles, peripheral nerves, or the central nervous system [7]. Among these, neurodegenerative diseases such as Parkinson’s disease (PD), multiple sclerosis (MS), and amyotrophic lateral sclerosis (ALS) progressively impair voluntary movement through distinct pathophysiological mechanisms [8]. Nevertheless, the pattern and extent of motor impairment vary considerably among these disorders due to their distinct neurophysiological bases [9].
PD is a neurodegenerative disorder of the central nervous system characterized by the progressive loss of dopaminergic neurons in the substantia nigra. Clinically, it manifests through motor symptoms such as resting tremor, muscle rigidity, bradykinesia, and postural instability, leading to impaired motor control and functional limitations [10,11]. The progression of PD is commonly classified into five stages according to the Hoehn and Yahr scale [12], and continuous monitoring of motor performance enables the development of individualized disease profiles for each patient [13,14].
In clinical practice, the Movement Disorder Society–Unified PD Rating Scale (MDS-UPDRS) is widely adopted as the gold standard for assessing both motor and non-motor symptoms of Parkinson’s disease [15]. Part III of the MDS-UPDRS provides a detailed evaluation of motor function by conducting relative tests such as the Finger Tapping Test (FTT), grip and release, hand rotation, and body balance tests to assess hand dexterity, limb coordination, and postural stability [16,17]. However, despite its clinical reliability, the MDS-UPDRS remains a subjective assessment and both intra-rater and inter-rater variability can influence the results. For this reason, in longitudinal or pre-post intervention studies, it is generally recommended that the same rater performs all evaluations to ensure consistency [18,19].
Objective and quantitative tools—such as digital motion analysis systems—can complement these traditional scales by providing reproducible measurements of specific motor parameters, such as the tap angle in the FTT, which reflects fine motor control and coordination. DL tools are innovative approaches to assessing motor control through human pose estimation (PE) or object tracking by analyzing movement patterns with trained models for any physical activity type [20]. Integrating DL tools with computer vision can facilitate the monitoring and documentation of physical performance. Human PE is a popular AI technique used to analyze and track human movement [21,22,23,24]. MediaPipe, developed by Google, is an open-source tool for human PE to detect human body posture [25] and hand positions (21 key points) in real-time or offline, either remotely or in-person [26]. This PE method can evaluate patients with PD, correlating with clinical assessments, and captures relevant aspects of disease progression [27]. However, determining its reliability is important to ensure it accurately detects differences during the scaling process in clinical or research settings.
This study aims to examine low-cost, real-time feedback and a user-friendly PE tool to assess its accuracy in finger mobility and to quantify the error in detecting hand landmarks using a 2D camera, comparing it against a gold-standard 3D motion capture system (MoCap).
2. Materials and Methods
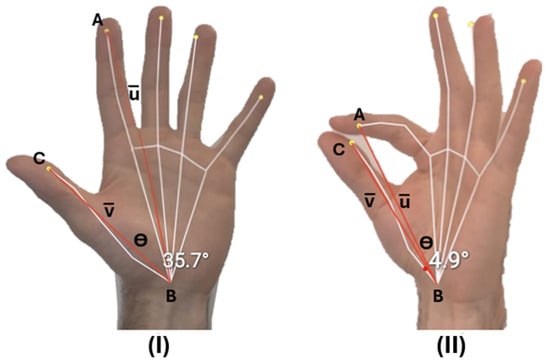
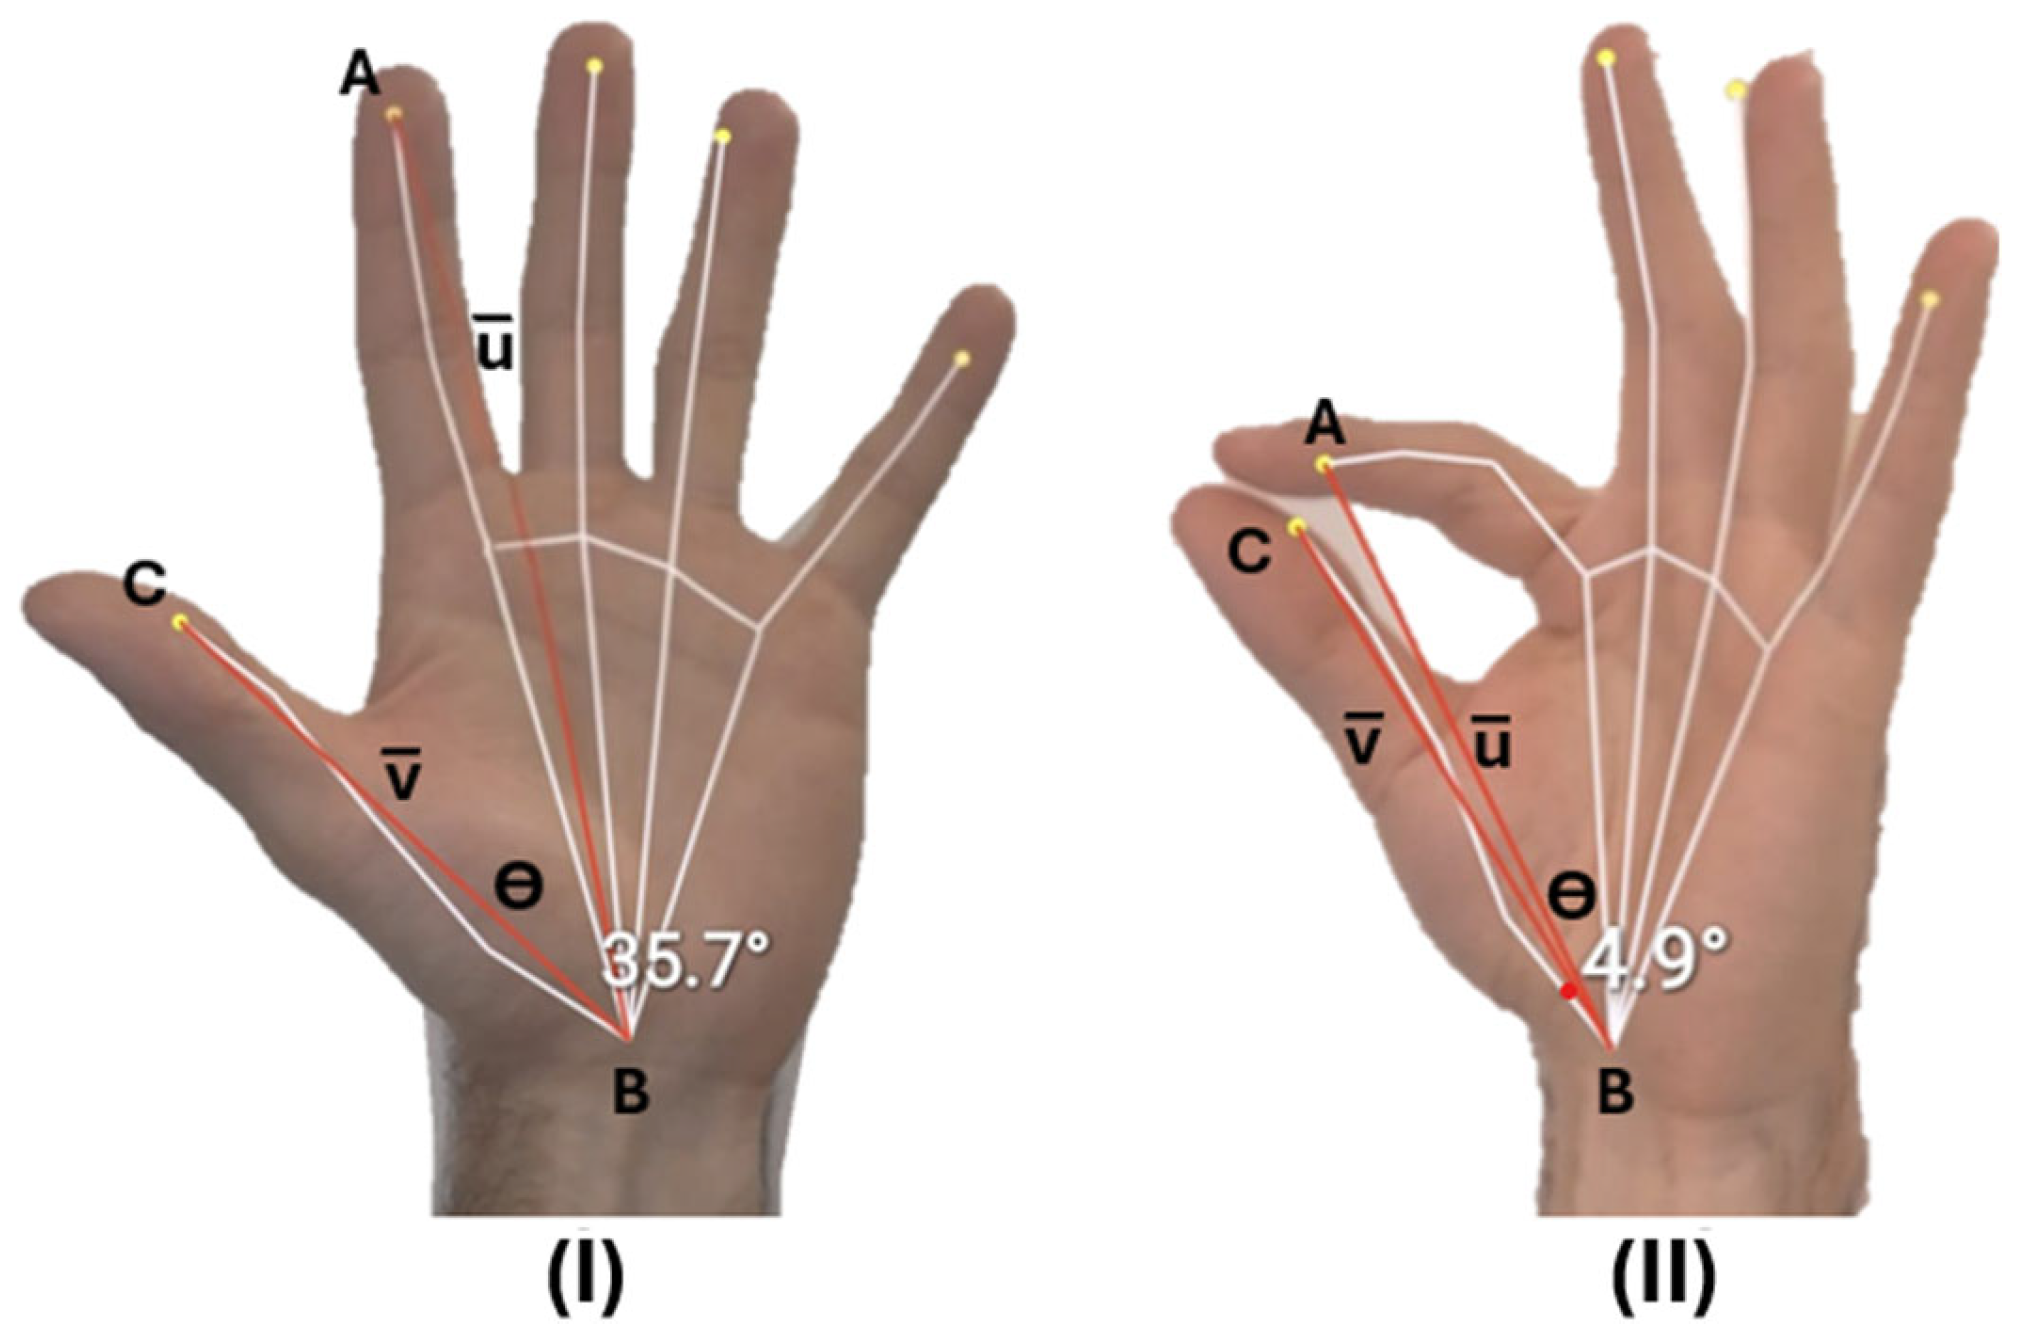
A 20 Hz HD 720p webcam and nine Vicon Vantage V5 IR cameras (500 Hz, 2432 × 2048 px, Vicon Motion Systems, Oxford, UK) were used to track hand motion during FTT. Intraday test–retest assessments were conducted by the same participant without a neurological disorder, ensuring consistency across all sessions with the dominant hand. The experiments were designed to evaluate the FTTs with a specific focus on lateralized coordination and finger movement speed, using two conditions: (1) slow open-and-close hand movements and (2) rapid repetitive tapping. In this study, the frequency for slow FTTs was 0.78 Hz, and for rapid movements it was 2.64 Hz. The rest position is when the hand is open and the close phase is when the fingers touch. The slow movement involves opening the hand widely, then closing the fingers, with a brief pause at the end of the close and rest positions. The rapid movement means closing and opening the fingers as quickly as possible (Figure 1). It is believed that patients with Parkinson’s cannot perform FTT as quickly as people without neurological disorders [28]. Thus, a single participant (male, aged 32 years) without a neurological disorder was chosen to perform the intraday test–retest FTT at speeds beyond the typical range for rapid trials and controlled tapping sequences to ensure consistent movement velocity during slow trials.
Figure 1.
Hand landmark detection reveals estimated tap angles between two imaginary red lines extending from the wrist to the index finger and thumb. Panel (I) shows the rest position (Θ = 35.7°) and Panel (II) shows the finger closing phase (Θ = 4.9°).
The PE tool is set by defining the camera position, frame rate, and hand landmarks model and the Vicon system is calibrated using wand calibration and dynamic volume calibration [29]. The Vicon system can capture with a standard video camera beside the marker-tracking cameras to identify the common start point in both systems by turning on a flashlight, where the mismatch error remains at 0.05 s due to the frame rate difference. Each FTT session consists of three rapid and three slow trials. The Internal Research Board of Rome Tor Vergata University approved the research and all procedures were conducted in accordance with the principles outlined in the Declaration of Helsinki.
Raw video frames were processed using MediaPipe Hands v0.10.13 (Python 3.11). All hand landmarks per frame were extracted, and PE tracked hand motion, calculating relevant angles between the wrist, thumb tip, and index fingertip to quantify hand movements, including the degree of finger opening and closing and angular velocity during FTTs. A representative example of PE overlaid on a video image is shown in Figure 1, where the system computed angular values around the wrist landmark by drawing imaginary lines from each hand’s thumb and index finger to the wrist landmark. The computing tool of the PE used 2D coordination of the three detected key points, aiming to find the angle around the wrist regarding the connection lines to the thumb and index finger, using the following formula, where B is the wrist, A is the index finger, and C is the thumb landmark (Equation (1)).
Additionally, tracking software (Nexus 2.16) was used to compute the angle between the thumb and index fingers from the infrared cameras for the MoCap, using the formula below, where the direction vectors of the index finger (u) and thumb (v) were obtained from the 3D coordinates of the reflective markers, and |u| and |v| are their magnitudes, to calculate the finger extension (Equation (2)).
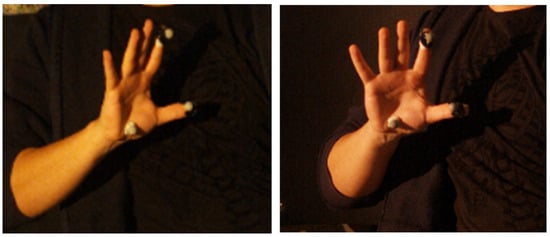
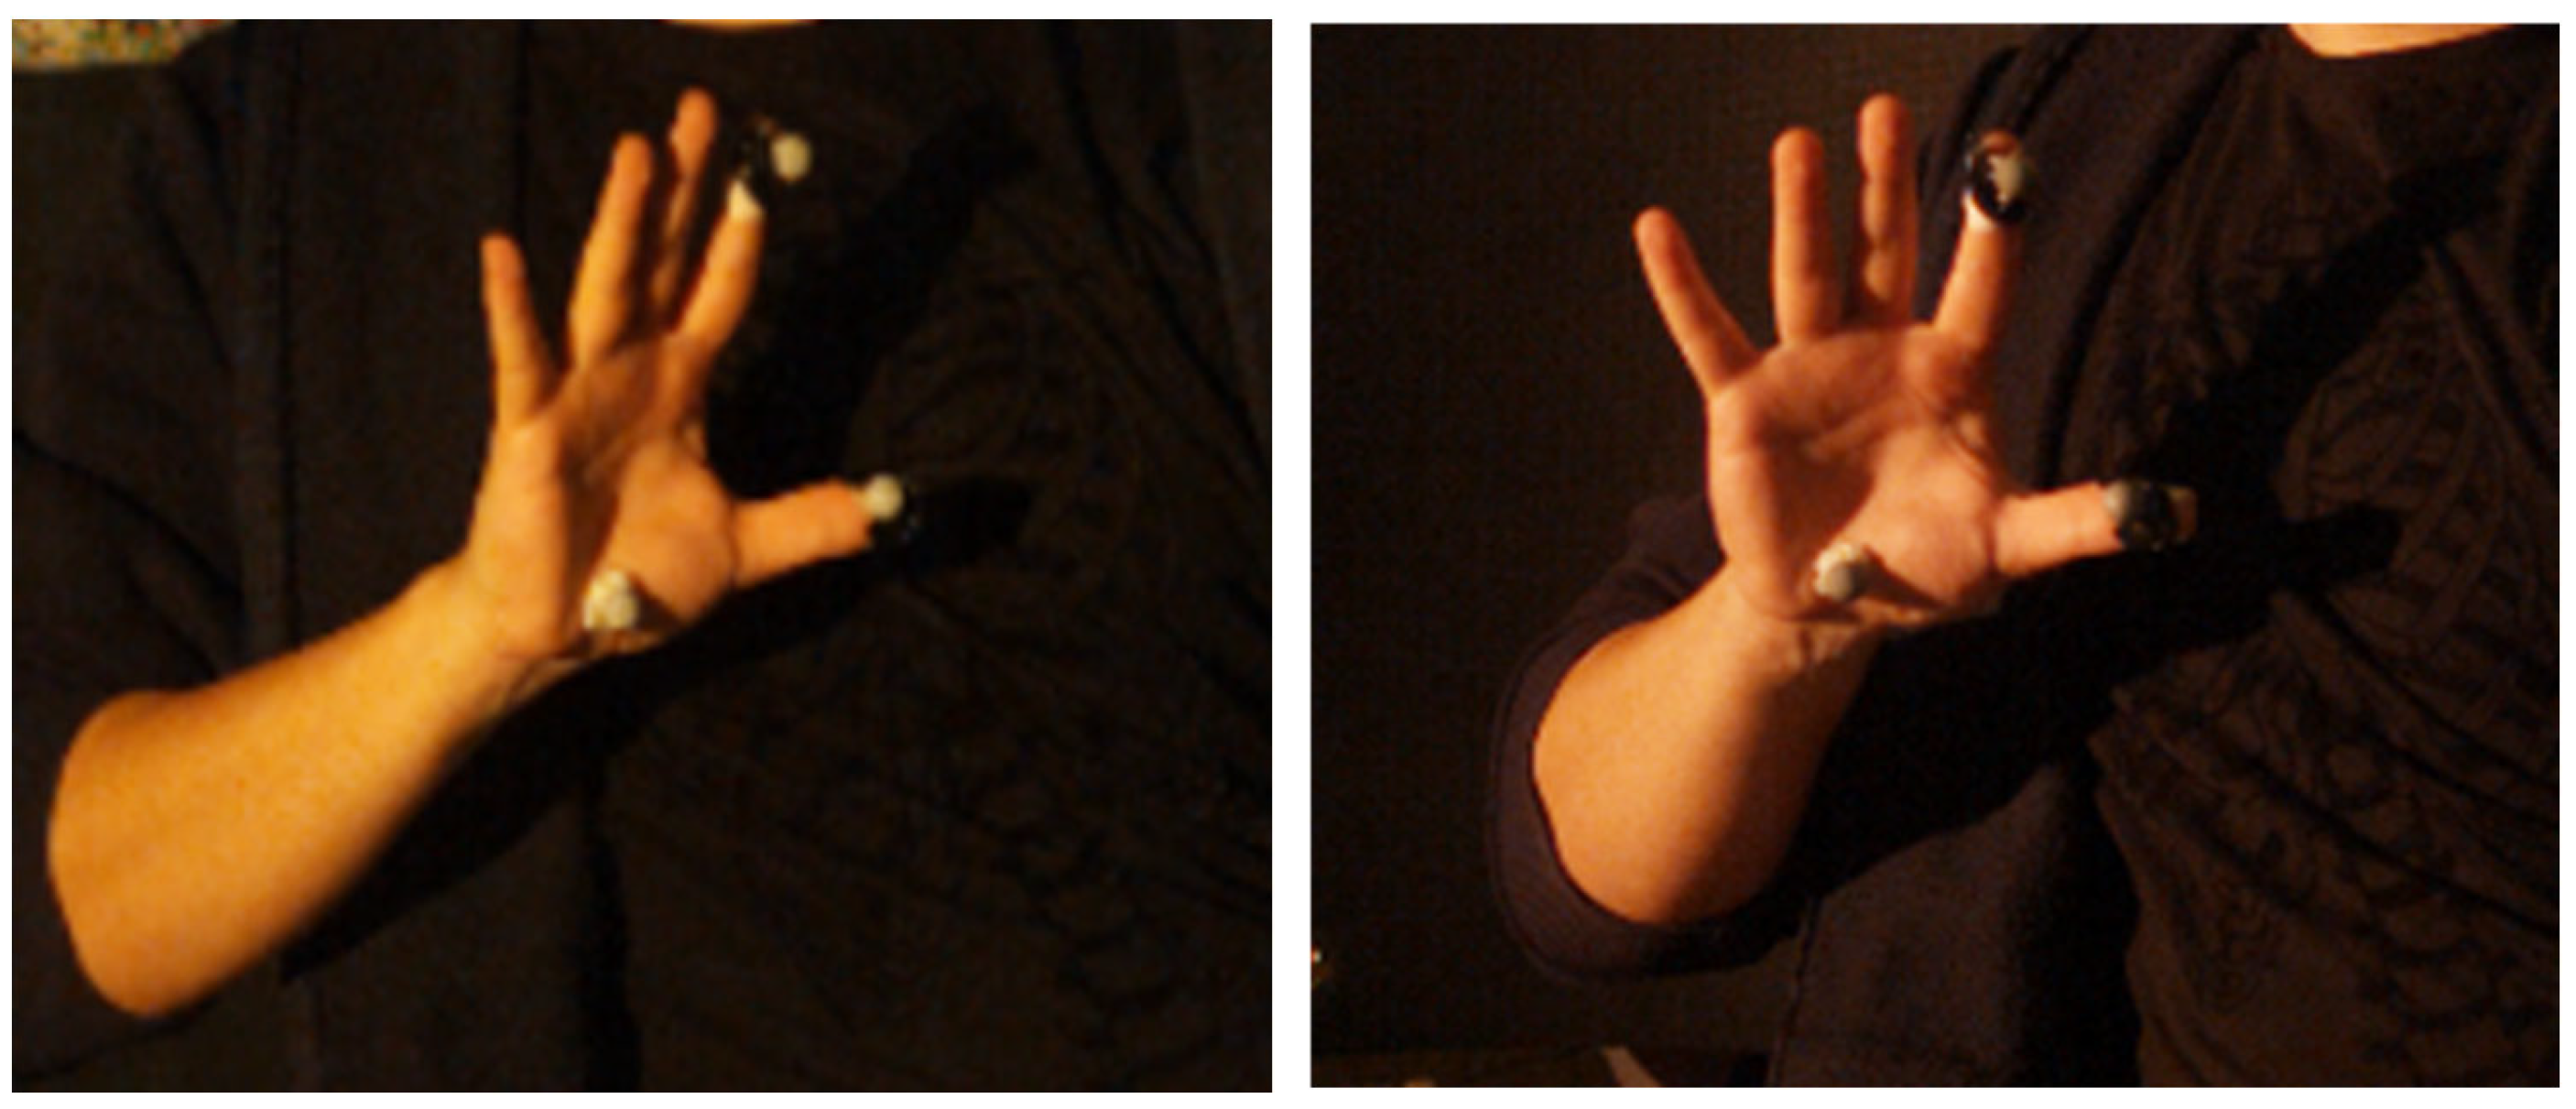
Parallel with the PE, reflective markers were tracked in 3D space using infrared video cameras to evaluate wrist angular motion (Figure 2). Reflective markers were placed at the wrist, thumb, and index finger, on the areas detected by the PE framework.
Figure 2.
The placement of the reflective markers for the infrared tracking system.
Pose Estimation System Accuracy
The MedCalc statistical software (MedCalc Software Ltd., version 23.2.1, Ostend, Belgium) was used in this study to perform all statistical analyses. The Shapiro–Wilk test was used to validate the assumption of normality of the angular measurements data [30]. Given that the data significantly deviate from a normal distribution, the rank correlation, Kruskal–Wallis, and Friedman tests were used for nonparametric statistical analysis in this study. The Bland–Altman, Root Mean Square Error (RMSE), and mean absolute percentage error (MAPE) compare the two tools [31].
The rank correlation analysis measured the strength and direction of the relationship between the relative order of different trials [32]. The Spearman correlation coefficient (rho) ranges from −1 to +1, where closer to 1 and −1 indicates a monotonic relationship and 0 indicates no monotonic association. Rank correlation tests were applied to compare the trials of each session separately for each tool. Additionally, the intraclass correlation coefficient (ICC) was calculated, with a range of 0 to 1; values closer to 1 indicate higher reliability (0–0.5 poor, 0.5–0.75 moderate, 0.75–0.9 good, above 0.9 excellent) [33]. The coefficient of variation (CV) of the within-subject standard deviation was calculated to assess the repeatability and precision of the systems. Reproducibility of the defined parameter was considered excellent when the CV was less than 10%, good when the CV was between 10% and 20%, acceptable when the CV was between 20% and 30%, and poor when the CV exceeded 30% [34]. Lastly, effect size (ES) was computed to assess the strength and practical significance of the relationship between the two system variables, which were classified as small (0.2), medium (0.5), or large (0.8) [35]. The Kruskal–Wallis test was used to assess statistically significant differences between the MoCap (gold standard) and the PE tool.
The Friedman statistical test controlled the repeatability and consistency across repeated measurements and the test assessed whether both systems produced similar results across rapid and slow trials [36].
A Bland–Altman analysis operated on the MoCap, as the first method to rank assess agreement without assuming normality or constant variance, and was conducted to estimate the systematic bias and, if present, the proportional bias between PE and MoCap [37]. For each slow and rapid FTT movement, the frequency and mean difference (bias) were calculated to indicate whether the angles were systematically overestimated or underestimated. In contrast, the limits of agreement (LoA) showed the range within which most differences between the two systems fall, representing the practical error. The slope of the regression line was analyzed to assess proportional bias, indicating whether errors varied with the magnitude of the measured tap angles. Thus, the regression was used alongside the Bland–Altman analysis to examine how measurement differences change with the average measurement value [38,39]. This equation is expressed as
where y is the predicted difference between the two methods (absolute error in degrees), a is the intercept representing fixed bias, b is the slope representing proportional bias, and x is the mean measurement.
ypredicted = a + bx,
The Root Mean Square Error (RMSE) provides a single, aggregated measure of the differences between the MoCap and PE values.
The Mean Absolute Percentage Error (MAPE) is used to express prediction accuracy as a standardized percentage value.
where angle Mocap is the reference angle measured by the MoCap system, angle PE is the corresponding PE angle, and n is the total number of measurements. MRE reflects the average deviation, indicating PE’s overall accuracy.
3. Results
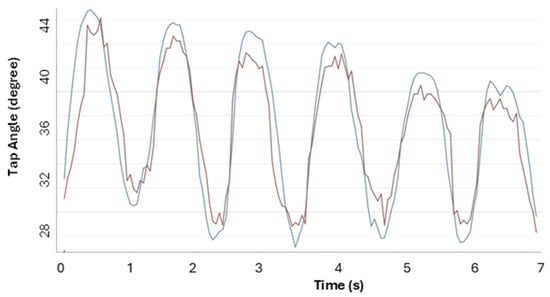
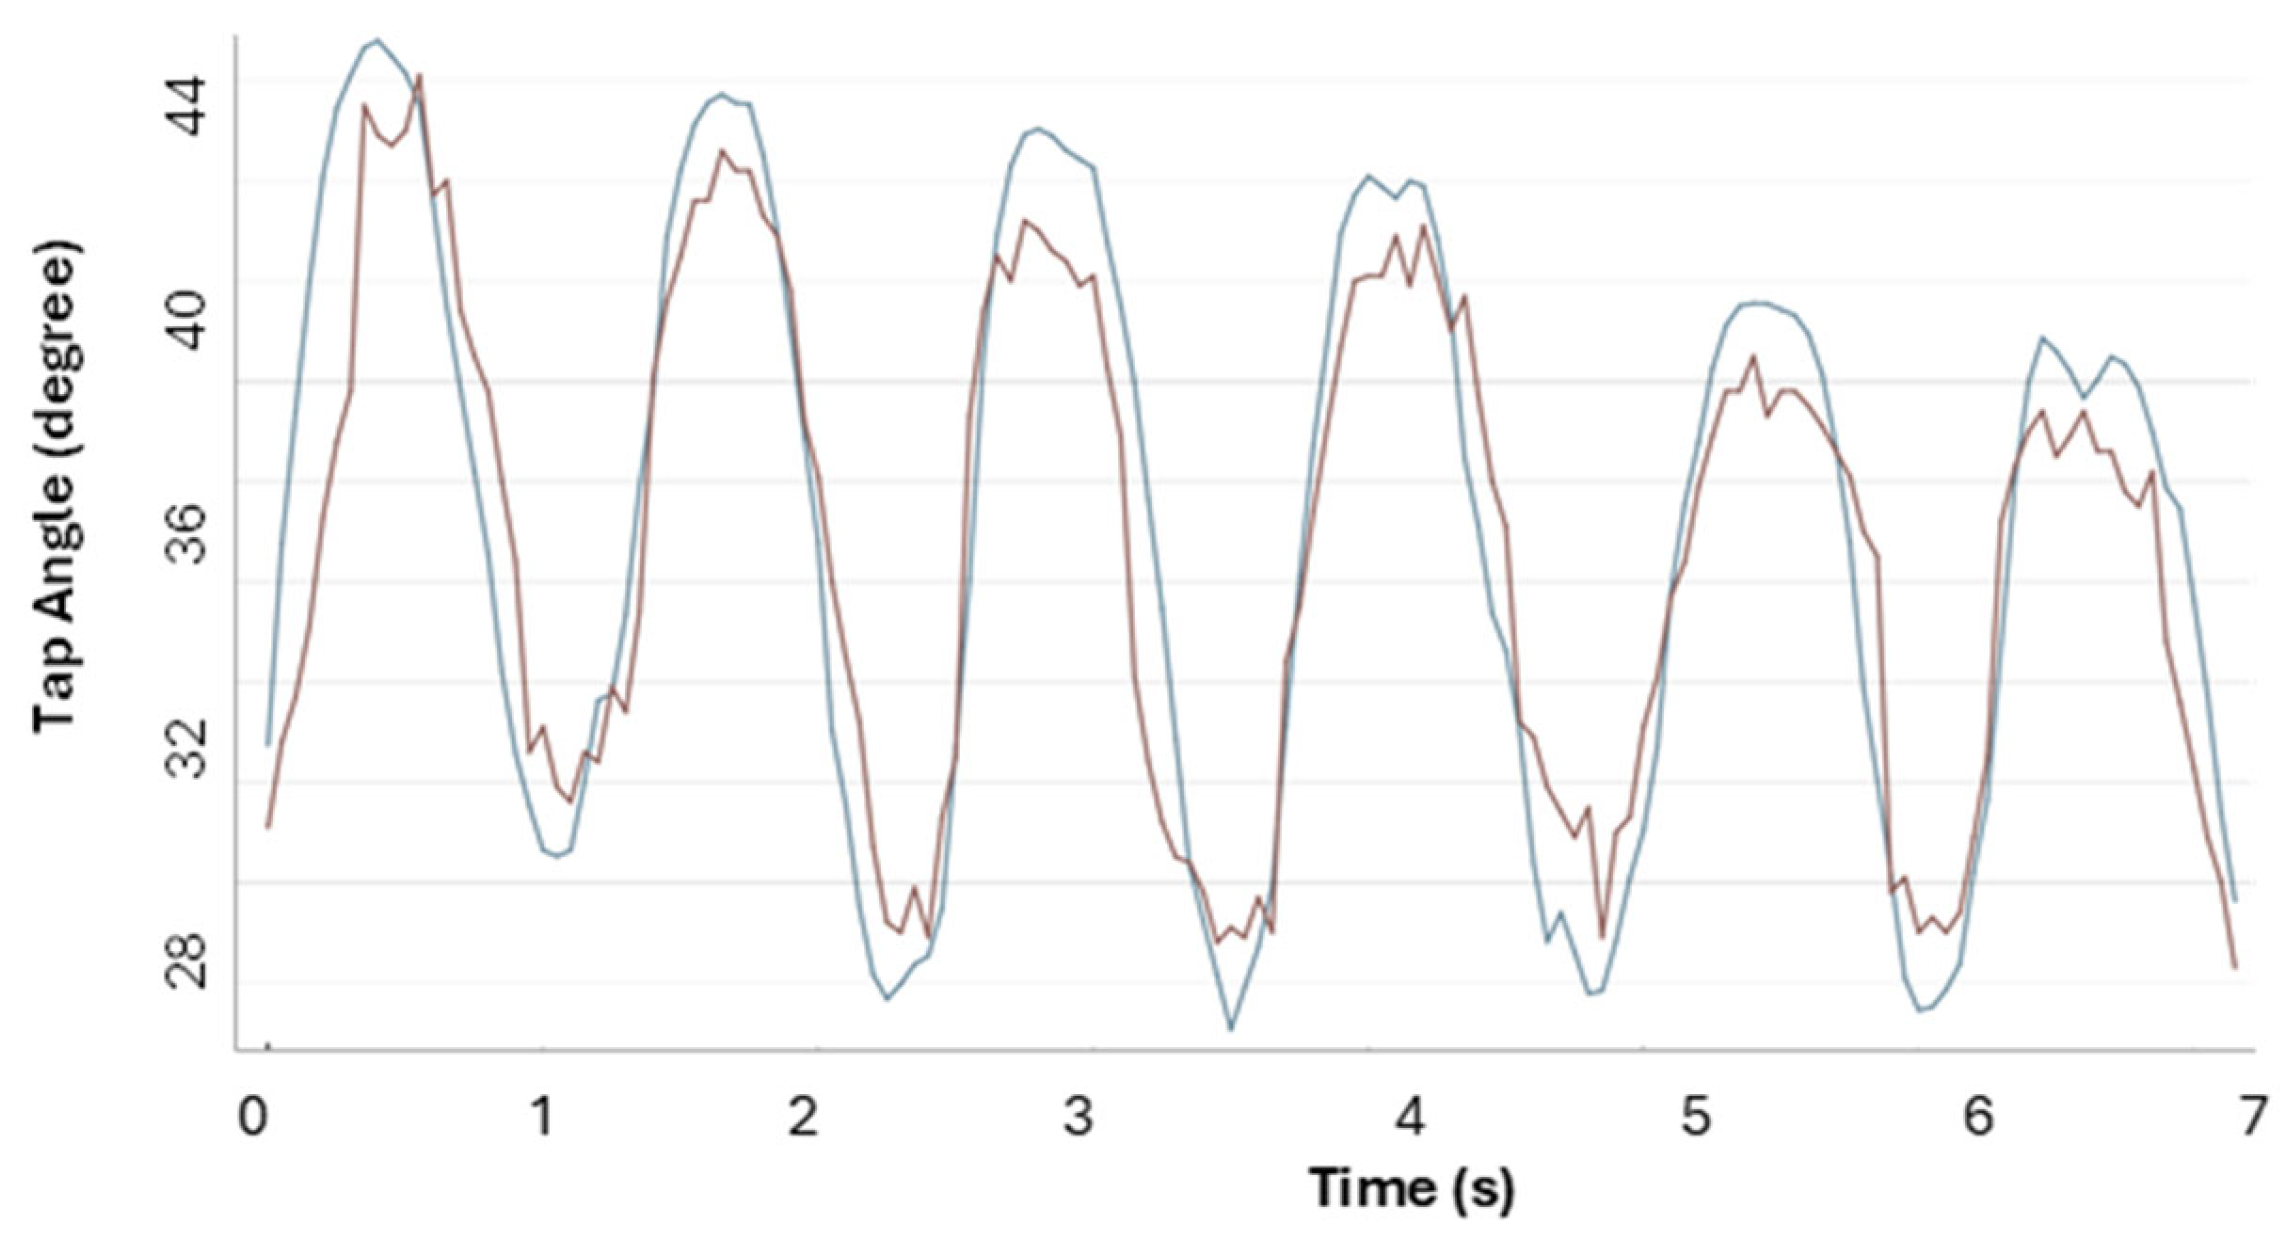
Figure 3 shows the MoCap and PE graphs during one of the slow FTT trials by the operator.
Figure 3.
Results from a slow trial showing angular measurements obtained with a 2D single-camera PE (red) compared with MoCap (blue).
To compare all trials of each tool across slow and rapid FTT sessions, a test–retest reliability analysis was performed using Spearman’s rho, ICC, CV, ES, and their 95% confidence intervals (CIs) (Table 1 and Table 2).
Table 1.
Rank correlation analysis on measured angles by 2D PE and 3D MoCap in slow movements. The PE trials’ mean and standard deviation results are T1: 35.5 ± 7, T2: 36 ± 5.5, T3:36.7 ± 5 and, for MoCap, are T1: 35 ± 8.2, T2: 35.6 ± 6.3, T3: 37.1 ± 6.
Table 2.
Rank correlation analysis on measured angles by 2D PE and 3D MoCap in rapid movements. The PE trials’ mean, and standard deviation results are T1: 41.8 ± 8.4, T2: 41.7 ± 6.7, T3: 43.5 ± 8.3 and, for MoCap, are T1: 42.5 ± 10, T2: 41 ± 8.7, T3: 44.2 ± 10.6.
To determine the statistical significance differences between the medians of the groups, Kruskal–Wallis’ results are presented in Table 3.
Table 3.
Kruskal–Wallis’ result is presented to determine if the two tools are significantly different. The PE mean and standard deviation results are 36.17 ± 5.74 for slow and 42.79 ± 8.06 for rapid, and for MoCap are 36.07 ± 6.74 for slow and 43.16 ± 10.16 for rapid.
To compare repeatability across trials, the Friedman Test was used to assess whether the quick and slow finger tapping motions from the PE and MoCap systems are similar. Table 4 and Table 5 show slow FTT sessions measured by PE and MoCap, with p-values > 0.001 in both tests. Reports on the test matched frame numbers, minimum, 25th percentile, median, 75th percentile, Maximum, the test statistics (F), degrees of freedom (DF1 and DF2), and p-values.
Table 4.
Friedman Test for slow FTT trials, measured by the pose estimation.
Table 5.
Friedman Test for slow FTT trials, measured by motion capture.
The Friedman test for the rapid FTT results is presented in Table 6 and Table 7, showing significant differences across systems in rapid trials.
Table 6.
Friedman Test for rapid FTT trials, measured by the pose estimation.
Table 7.
Friedman Test for rapid FTT trials, measured by motion capture.
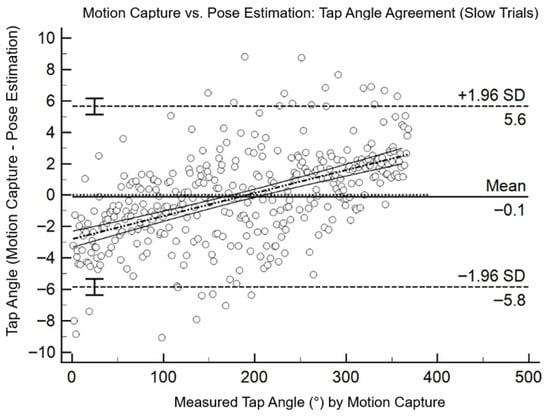
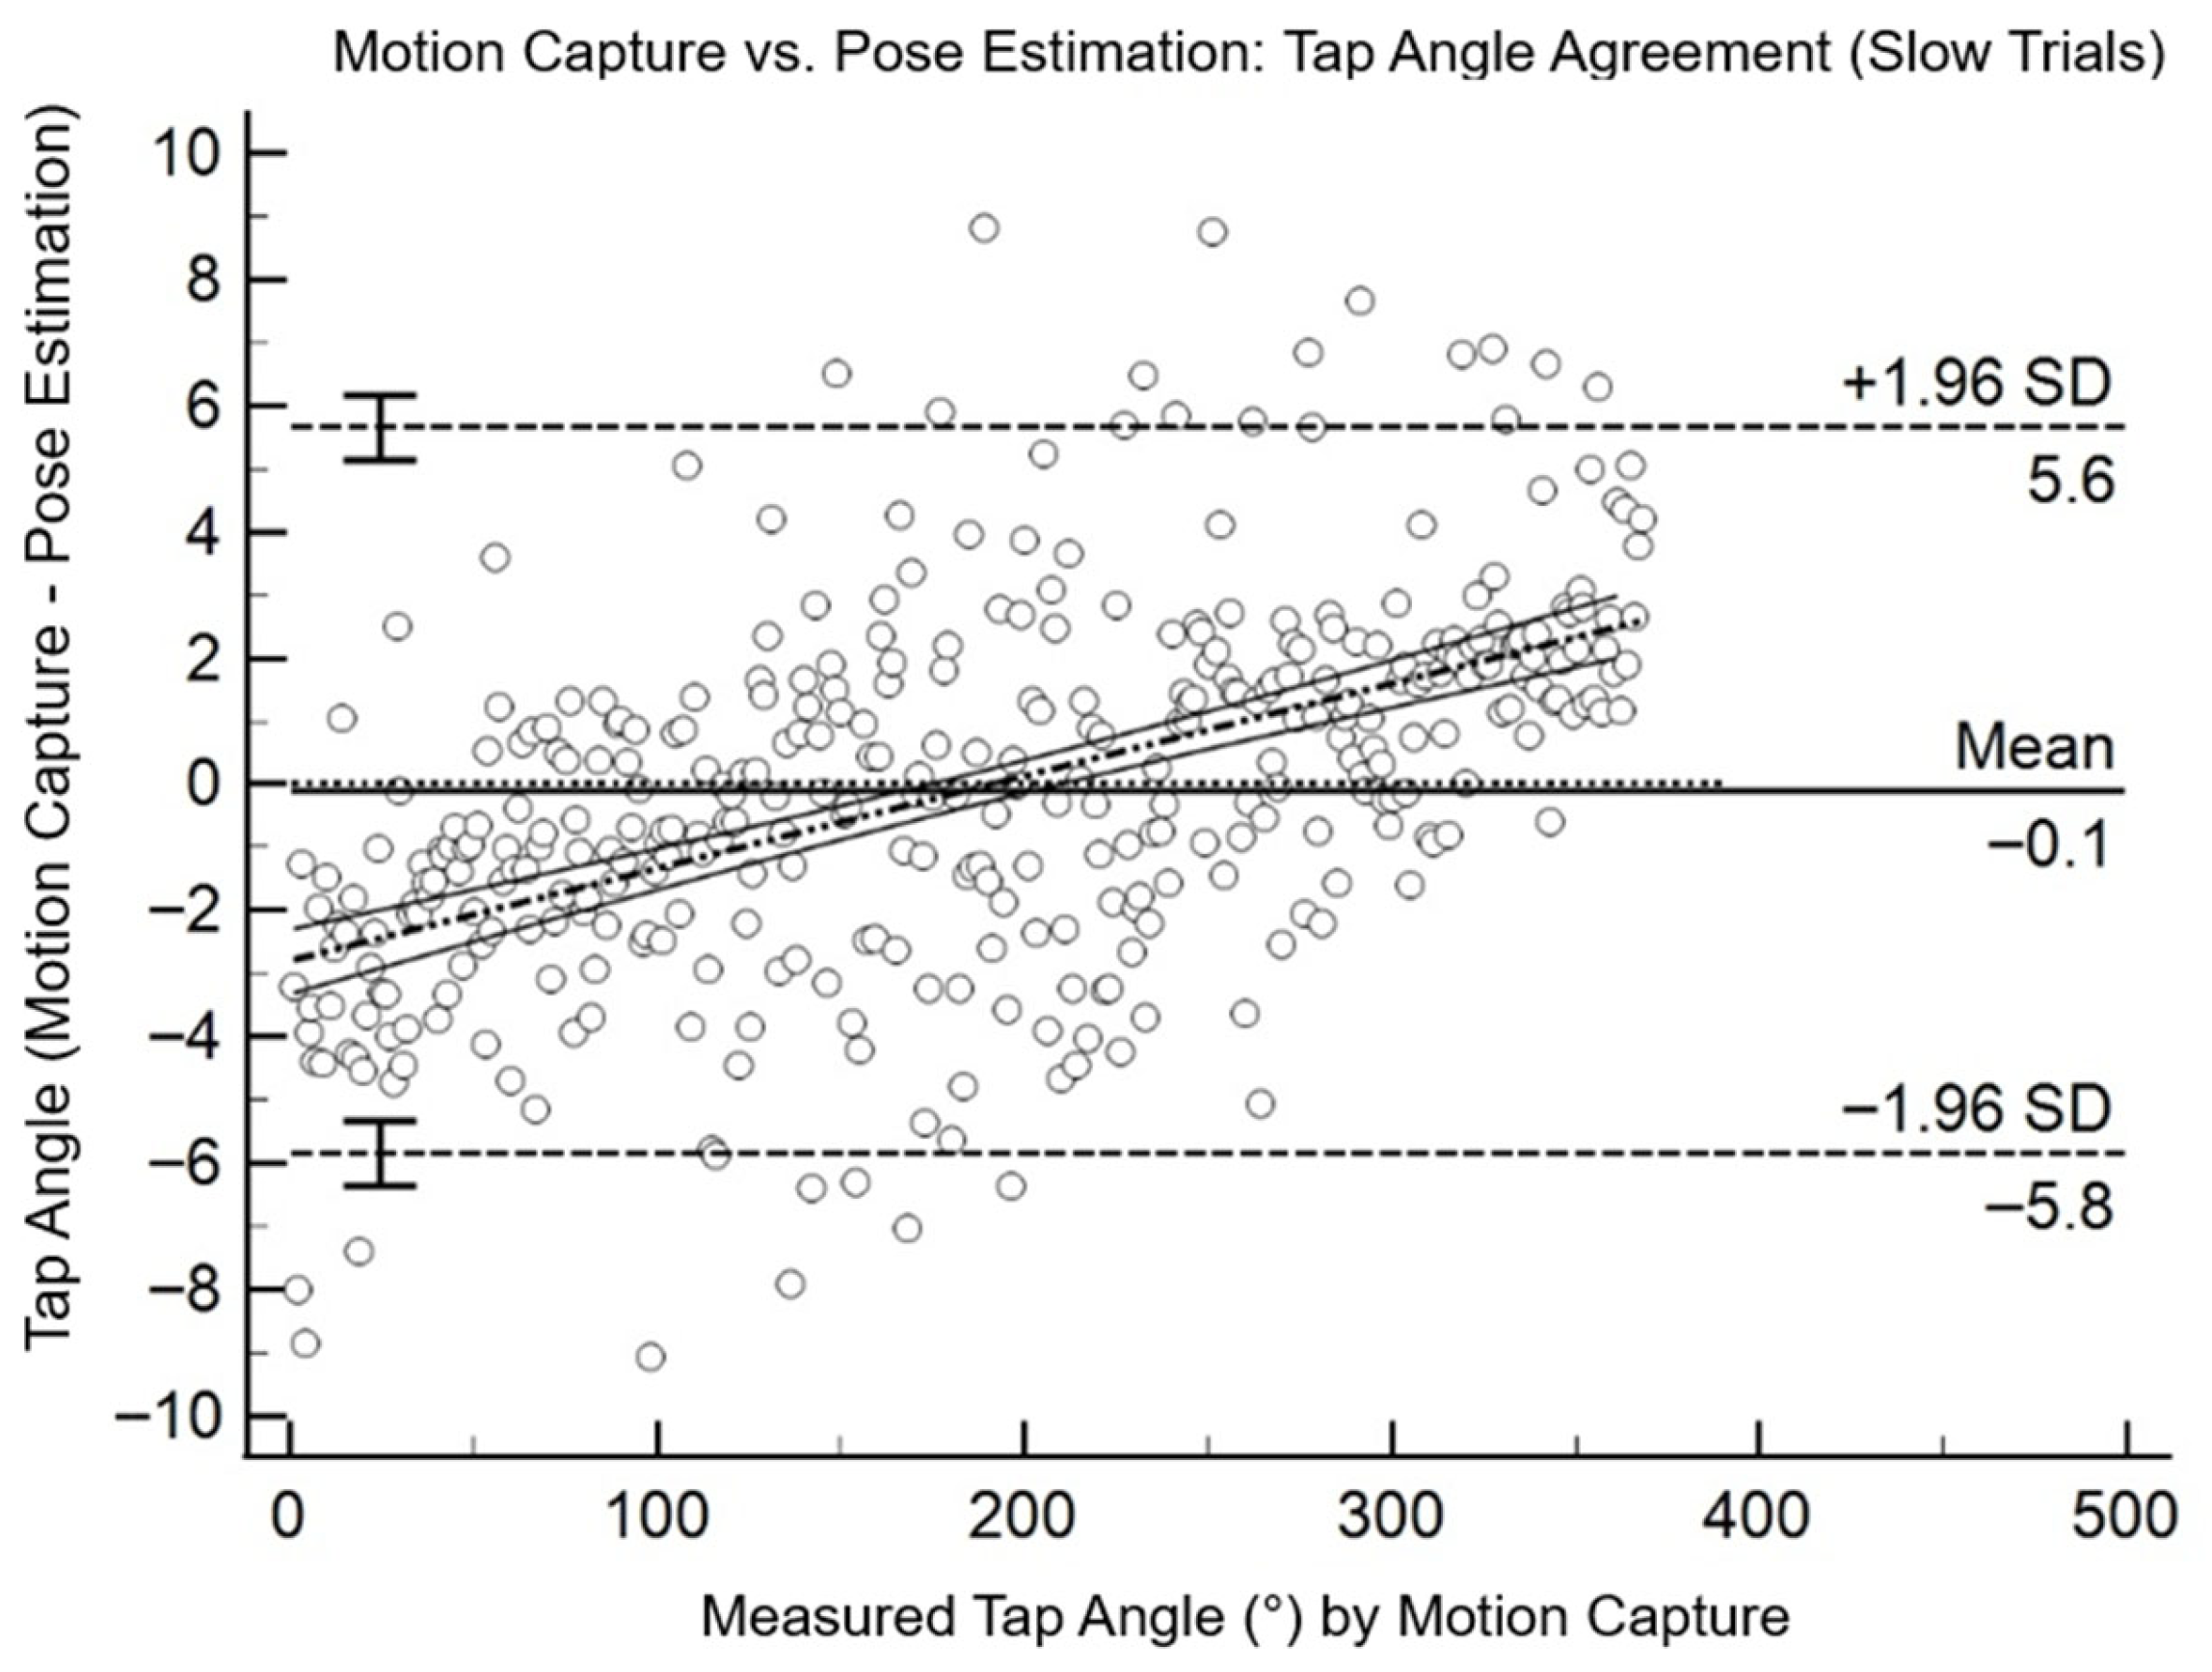
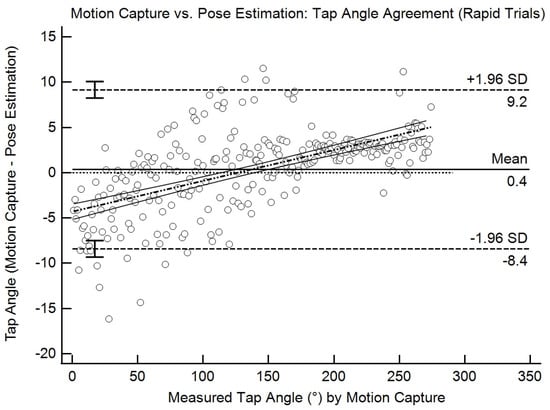
Figure 4 shows the Bland–Altman plot for all slow trials and Figure 5 shows the rapid movement. Table 8 shows the measurement results to present the p-value, the LoA upper and lower limits, the 95% CI, intercept, and Slope values for slow movements, and Table 9 is for rapid movements, where the Slope values direct that, by each degree of actual changes, there is an error of 0.01468° in slow trials and 0.03409° for rapid trials.
Figure 4.
The Bland–Altman plot compares the angle on the PE against the MoCap, serving as the gold standard for slow FTT movements.
Figure 5.
The Bland–Altman plot compares the angle on PE and the MoCap for rapid movements.
Table 8.
Bland–Altman results for pose estimation and MoCap in the slow movement trials. Agreement analysis presents the negligible mean bias, the absolute error, and the error % for slow FTT movements.
Table 9.
Bland–Altman results for pose estimation and MoCap in the rapid movement trials. Agreement analysis presents the negligible mean bias, the absolute error, and the error % for rapid FTT movements.
4. Discussion
This study reports the accuracy of the PE tool compared to a marker-based infrared 3D system. However, some previous studies developed a hand feature PE tool to investigate FTTs, comparing manual physical ground-truth measurements or the UPDRS scores assigned by clinicians [40,41]. Additionally, many studies related to angular joint measurement or gait analysis have compared the full-body PE tool with 3D MoCap systems [42,43].
The rank correlation analysis showed that PE and MoCap produced consistent measurements across trials. In slow movements, correlations were low (rho −0.21 to 0.24) and ICCs weak (−0.23 to 0.25) due to limited angle variability, and CVs remained moderate (15–21%) and ES small (−0.42 to −0.06), indicating low trial-to-trial differences. In rapid movements, PE showed stronger reliability with higher correlations (rho 0.29–0.66), ICCs of 0.25–0.62, and lower CVs (11–21%), and MoCap displayed similar trends with increasing angles (CV 16–29%, ES 0.15–1.14). Overall, both systems captured stable performance patterns, with reliability improving when movements produced larger angular changes.
Under slow conditions, PE and MoCap agreement indices (rho and ICC) between trials are low or negative, with high CVs and small or negative ESs, indicating poor reliability across trials and changes of little practical relevance (Table 1). Under rapid conditions, especially for PE, rho and ICC are higher, CVs are lower, and ESs are larger, suggesting greater repeatability of measurements and greater practical relevance of differences between trials. Instead, MoCap showed similar trends with increasing angles, with the main difference in CVs (Table 2). This difference in CVs is related to the difficulty of replicating similar rest and close movements for each movement, because there is no general standard for how wide or close the fingers should be [44].
Additionally, the Kruskal–Wallis test (Table 3) shows no significant differences in observations between PE and MoCap across all trials for slow (p = 0.96) and rapid movements (p = 0.70). The CVs were low (6.04% for slow, 8.65% for rapid), indicating consistent measurements. ICCs were high (0.87–0.91), indicating strong reliability across repeated measures, and ES was near zero (−0.014 to 0.03), indicating minor practical differences between the two systems. Overall, these results emphasize that PE and MoCap yielded comparable, reproducible measurements.
The Friedman test was used to evaluate the repeatability of PE and MoCap measurements across repeated FTT trials. The slow FTT did not differ significantly across repetitions (PE: F = 1.05, p = 0.349; MoCap: F = 2.01, p = 0.136), demonstrating good repeatability for slower movements (Table 4 and Table 5). In contrast, for rapid FTT, both PE and MoCap showed significant differences between trials (p < 0.001), indicating reduced consistency at higher movement speeds (Table 6 and Table 7). These findings suggest that PE and MoCap systems captured data similarly, enabling the detection of differences across various speed trials.
Bland–Altman analysis (Table 8 and Table 9) supported the conclusion that PE and MoCap captured angular data similarly across both movement speeds. Although the mean bias remained slight in slow (−0.096°) and rapid (0.371°) trials, the relatively broad limits of agreement (approximately −5.84° to 5.65° for slow and −8.40° to 9.15° for rapid movements) indicate notable variability at the individual trial levels. The p-values greater than 0.05 in both conditions confirm that, in terms of mean differences, there is no systematic bias between PE and MoCap measurements (p = 0.528 for slow and p = 0.1705 for rapid trials). Notably, the regression outcomes show that part of this disagreement is due to intra-method variability. In addition, the significant slopes in both speeds demonstrate that PE measurement bias changes proportionally with the magnitude of the movement. In FTT tasks, this proportional bias shows that PE increasingly underestimates MoCap values at lower angles and has overestimation as the angle increases, reflecting the amplitude-dependent behavior observed across slow and rapid movements.
In the PE and MoCap comparisons, Bland–Altman tests were used to assess differences in angular measurements at the three targeted points across FTT Interday tests, separately for each rapid and slow finger movement. For the slow condition, y = −2.8051 + 0.01468 × xv, the slope indicates that for every one-degree increase in the average of the two devices, the value of y is predicted to increase by 0.01468 units. If we substitute in x the average of MoCap 36.07°, we obtain an estimated difference of −2.27° at this specific average considered. In rapid conditions (y = −4.3156 + 0.03409 × xv), the slope of 0.03409 indicates that for every one-degree increase in the average of the two devices, the difference between the MoCap and PE changes by about 0.03409 degrees on average. From the Bland–Altman regression equation, by assuming x = 43.16°, which is the average of MoCap, the estimated difference is equal to −2.84° at that specific average [37]. Thus, from the Bland–Altman results, PE overestimates more at low values and less at high values; beyond a certain point, the overestimation is canceled out and can turn into an underestimation.
Furthermore, in the slow sessions, the RMSE of 2.92°, calculated as the deviation between individual angle measurements, and the MAPE of 6.38% confirms the relative percentage error. For rapid sessions, the RMSE was 4.48° and the relative percentage error (MAPE) was 8.22%.
Overall, an important limitation of the PE system compared to MoCap is that it uses 2D cameras instead of nine high-frequency cameras, which, from a single view, reduces the system’s accuracy. However, the main reasons for PE development are easy setup and low cost [45]. These findings suggest that PE may serve as a capable tool for gross estimations, particularly in contexts prioritizing accessibility and scale patients’ hand mobility [46]. Currently, for clinical or research applications requiring high precision, PE can be considered as an assistive technology [47,48]. Although the reflective markers for 3D tracking were placed precisely at locations recognized by the PE system, in a few frames, PE may have put the hand landmarks slightly offset from the markers’ positions, which represents a limitation of this study. However, an advantage of PE tools compared to marker-based systems is that avoiding marker or sensor placement can help the patients to freely move their hands or body without creating limitations in the degree of freedom [49]. The limitation of bringing the reflective markers closer together in 3D systems leads to unrecognizable results and marker attachment poses a significant limitation for patients in achieving meaningful outcomes.
5. Conclusions
This study demonstrated the potential of AI-based PE tools as accessible and reliable aids for physicians in the quantitative assessment and monitoring of movement disorders. PE produced angular measurements largely consistent with those of MoCap, showing high repeatability and only slight under- or overestimation at the lowest and highest ranges of finger opening and closing, including during FTTs relevant to Parkinson’s diagnosis. Its advantages include low cost, ease of use, and real-time applicability, supporting clinical assessments and telemedicine scenarios, with an RMSE and MAPE of approximately 2.9° and 6.4% for slow movements and 4.5° and 8.2% for rapid movements.
Overall, these results suggest that PE provides reliable and repeatable measurements for quantifying hand motor performance, available for population-level studies, and is capable of being developed for telemedicine applications.
Author Contributions
Conceptualization, S.E.; methodology, G.A.; software, S.E.; validation, C.R.; formal analysis, C.R.; investigation, S.E. and G.A.; resources, L.S.; writing—original draft preparation, S.E. and L.S.; writing—review and editing, R.R., M.F.D.P. and E.P.; visualization, S.E. and C.R.; supervision, G.A. and L.S.; project administration, V.B. All authors have read and agreed to the published version of the manuscript.
Funding
This research received no specific grant from any funding agency in the public, commercial, or not-for-profit sectors.
Institutional Review Board Statement
The study was conducted in accordance with the Declaration of Helsinki and approved by the Ethics Committee of Tor Vergata University (N° 12/2025, July 2025).
Informed Consent Statement
Informed consent was obtained from all subjects involved in the study.
Data Availability Statement
The data presented in this study are available on request from the corresponding author.
Conflicts of Interest
The authors declare no conflicts of interest.
References
- Bohr, A.; Memarzadeh, K. (Eds.) The Rise of Artificial Intelligence in Healthcare Applications. In Artificial Intelligence in Healthcare; Academic Press: Cambridge, MA, USA, 2020; Chapter 2; pp. 25–60. ISBN 978-0-12-818438-7. [Google Scholar]
- Park, K.W.; Mirian, M.S.; McKeown, M.J. Artificial Intelligence-Based Video Monitoring of Movement Disorders in the Elderly: A Review on Current and Future Landscapes. Singap. Med. J. 2024, 65, 141. [Google Scholar] [CrossRef] [Scilit] [PubMed]
- di Biase, L.; Pecoraro, P.M.; Bugamelli, F. AI Video Analysis in Parkinson’s Disease: A Systematic Review of the Most Accurate Computer Vision Tools for Diagnosis, Symptom Monitoring, and Therapy Management. Sensors 2025, 25, 6373. [Google Scholar] [CrossRef] [Scilit] [PubMed]
- Al-Worafi, Y.M. Patient Care Related Issues in the Developing Countries: Monitoring Parameters. In Handbook of Medical and Health Sciences in Developing Countries; Springer: Cham, Switzerland, 2024; pp. 1–23. ISBN 978-3-030-74786-2. [Google Scholar]
- Jafleh, E.A.; Alnaqbi, F.A.; Almaeeni, H.A.; Faqeeh, S.; Alzaabi, M.A.; Al Zaman, K. The Role of Wearable Devices in Chronic Disease Monitoring and Patient Care: A Comprehensive Review. Cureus 2024, 16, e68921. [Google Scholar] [CrossRef] [Scilit] [PubMed]
- Khadka, J.; Gothwal, V.K.; McAlinden, C.; Lamoureux, E.L.; Pesudovs, K. The Importance of Rating Scales in Measuring Patient-Reported Outcomes. Health Qual. Life Outcomes 2012, 10, 80. [Google Scholar] [CrossRef] [Scilit]
- Peeters, L.H.C.; Kingma, I.; van Dieën, J.H.; de Groot, I.J.M. Don’t Forget the Trunk in Duchenne Muscular Dystrophy Patients: More Muscle Weakness and Compensation than Expected. J. Neuroeng. Rehabil. 2019, 16, 44. [Google Scholar] [CrossRef] [Scilit]
- Abdo, W.F.; van de Warrenburg, B.P.C.; Burn, D.J.; Quinn, N.P.; Bloem, B.R. The Clinical Approach to Movement Disorders. Nat. Rev. Neurol. 2010, 6, 29–37. [Google Scholar] [CrossRef] [Scilit]
- Hoang, P.D.; Gandevia, S.C.; Herbert, R.D. Prevalence of Joint Contractures and Muscle Weakness in People with Multiple Sclerosis. Disabil. Rehabil. 2014, 36, 1588–1593. [Google Scholar] [CrossRef] [Scilit]
- Bellucci, A.; Mercuri, N.B.; Venneri, A.; Faustini, G.; Longhena, F.; Pizzi, M.; Missale, C.; Spano, P. Review: Parkinson’s Disease: From Synaptic Loss to Connectome Dysfunction. Neuropathol. Appl. Neurobiol. 2016, 42, 77–94. [Google Scholar] [CrossRef] [Scilit]
- Kumar, S.; Goyal, L.; Singh, S. Tremor and Rigidity in Patients with Parkinson’s Disease: Emphasis on Epidemiology, Pathophysiology and Contributing Factors. CNS Neurol. Disord.—Drug Targets 2022, 21, 596–609. [Google Scholar] [CrossRef] [Scilit]
- Zhao, Y.J.; Wee, H.L.; Chan, Y.-H.; Seah, S.H.; Au, W.L.; Lau, P.N.; Pica, E.C.; Li, S.C.; Luo, N.; Tan, L.C. Progression of Parkinson’s Disease as Evaluated by Hoehn and Yahr Stage Transition Times. Mov. Disord. 2010, 25, 710–716. [Google Scholar] [CrossRef] [Scilit]
- Goetz, C.G.; Poewe, W.; Rascol, O.; Sampaio, C.; Stebbins, G.T.; Counsell, C.; Giladi, N.; Holloway, R.G.; Moore, C.G.; Wenning, G.K.; et al. Movement Disorder Society Task Force Report on the Hoehn and Yahr Staging Scale: Status and Recommendations The Movement Disorder Society Task Force on Rating Scales for Parkinson’s Disease. Mov. Disord. 2004, 19, 1020–1028. [Google Scholar] [CrossRef] [Scilit] [PubMed]
- Pierantozzi, M.; Placidi, F.; Liguori, C.; Albanese, M.; Imbriani, P.; Marciani, M.G.; Mercuri, N.B.; Stanzione, P.; Stefani, A. Rotigotine May Improve Sleep Architecture in Parkinson’s Disease: A Double-Blind, Randomized, Placebo-Controlled Polysomnographic Study. Sleep Med. 2016, 21, 140–144. [Google Scholar] [CrossRef] [Scilit] [PubMed]
- Rizou, V.; Grammalidis, N.; Daras, P.; Dimitropoulos, K. PDualNet: A Deep Learning Framework for Joint Prediction of Parkinson’s Disease Progression Subtype and MDS-UPDRS Scores. Sci Rep 2025, 15, 41931. [Google Scholar] [CrossRef] [Scilit] [PubMed]
- Castro, K. Finger Tapping Test (FTT). In Clinical Integration of Neuropsychological Test Results; CRC Press: Boca Raton, FL, USA, 2024; ISBN 978-1-00-330960-4. [Google Scholar]
- Dunn, J.A.; Wangdell, J.; Bryden, A. Grasp and Release Test for Tetraplegic Hand Assessment: An Update of the Grasp and Release Test. Spinal Cord 2023, 61, 466–468. [Google Scholar] [CrossRef] [Scilit]
- Bohannon, R.W. Reliability of Manual Muscle Testing: A Systematic Review. Isokinet. Exerc. Sci. 2018, 26, 245–252. [Google Scholar] [CrossRef] [Scilit]
- Maggioni, V.; Azevedo-Coste, C.; Durand, S.; Bailly, F. Optimisation and Comparison of Markerless and Marker-Based Motion Capture Methods for Hand and Finger Movement Analysis. Sensors 2025, 25, 1079. [Google Scholar] [CrossRef] [Scilit]
- Roggio, F.; Trovato, B.; Sortino, M.; Musumeci, G. A Comprehensive Analysis of the Machine Learning Pose Estimation Models Used in Human Movement and Posture Analyses: A Narrative Review. Heliyon 2024, 10, e39977. [Google Scholar] [CrossRef] [Scilit]
- Dubey, S.; Dixit, M. A Comprehensive Survey on Human Pose Estimation Approaches. Multimed. Syst. 2023, 29, 167–195. [Google Scholar] [CrossRef] [Scilit]
- Edriss, S.; Caprioli, L.; Campoli, F.; Manzi, V.; Padua, E.; Bonaiuto, V.; Romagnoli, C.; Annino, G. Advancing Artistic Swimming Officiating and Performance Assessment: A Computer Vision Study Using MediaPipe. Int. J. Comput. Sci. Sport 2024, 23, 35–47. [Google Scholar] [CrossRef] [Scilit]
- Mroz, S.; Baddour, N.; McGuirk, C.; Juneau, P.; Tu, A.; Cheung, K.; Lemaire, E. Comparing the Quality of Human Pose Estimation with BlazePose or OpenPose. In Proceedings of the 2021 4th International Conference on Bio-Engineering for Smart Technologies (BioSMART), Paris, France, 8–10 December 2021; pp. 1–4. [Google Scholar]
- Samkari, E.; Arif, M.; Alghamdi, M.; Al Ghamdi, M.A. Human Pose Estimation Using Deep Learning: A Systematic Literature Review. Mach. Learn. Knowl. Extr. 2023, 5, 1612–1659. [Google Scholar] [CrossRef] [Scilit]
- Edriss, S.; Romagnoli, C.; Maurizi, M.; Caprioli, L.; Annino, G. Pose Estimation for Pickleball Players’ Kinematic Analysis through MediaPipe-Based Deep Learning: A pilot study. J. Sports Sci. 2025, 43, 1860–1870. [Google Scholar] [CrossRef] [Scilit] [PubMed]
- Lugaresi, C.; Tang, J.; Nash, H.; McClanahan, C.; Uboweja, E.; Hays, M.; Zhang, F.; Chang, C.-L.; Yong, M.G.; Lee, J.; et al. MediaPipe: A Framework for Building Perception Pipelines. Available online: https://arxiv.org/abs/1906.08172v1 (accessed on 3 October 2024).
- Guarin, D.; Wong, J.; McFarland, N.; Ramirez-Zamora, A. Characterizing Disease Progression in Parkinson’s Disease from Videos of the Finger Tapping Test. IEEE Trans. Neural Syst. Rehabil. Eng. Publ. IEEE Eng. Med. Biol. Soc. 2024, 32, 2293–2301. [Google Scholar] [CrossRef] [Scilit]
- Yahalom, G.; Simon, E.; Thorne, R.; Peretz, C.; Giladi, N. Hand Rhythmic Tapping and Timing in Parkinson’s Disease. Park. Relat. Disord. 2004, 10, 143–148. [Google Scholar] [CrossRef] [Scilit] [PubMed]
- Pribanić, T.; Sturm, P.; Peharec, S. Wand-Based Calibration of 3D Kinematic System. IET Comput. Vis. 2009, 3, 124–129. [Google Scholar] [CrossRef] [Scilit]
- Hanusz, Z.; Tarasinska, J.; Zielinski, W. Shapiro–Wilk Test with Known Mean. REVSTAT-Stat. J. 2016, 14, 89–100. [Google Scholar]
- Ma, Y.; Hou, Y.; Ma, Q.; Wang, X.; Sui, S.; Wang, B. Compressed SENSE Single-Breath-Hold and Free-Breathing Cine Imaging for Accelerated Clinical Evaluation of the Left Ventricle. Clin. Radiol. 2019, 74, 325-e9. [Google Scholar] [CrossRef] [Scilit]
- Armitage, P.; Berry, G.; Matthews, J.N.S. Statistical Methods in Medical Research; John Wiley & Sons: Hoboken, NJ, USA, 2013. [Google Scholar]
- Ionan, A.C.; Polley, M.-Y.C.; McShane, L.M.; Dobbin, K.K. Comparison of Confidence Interval Methods for an Intra-Class Correlation Coefficient (ICC). BMC Med. Res. Methodol. 2014, 14, 121. [Google Scholar] [CrossRef] [Scilit]
- Aronhime, S.; Calcagno, C.; Jajamovich, G.; Dyvorne, H.A.; Robson, P.; Dieterich, D.; Fiel, M.I.; Martel-Laferriere, V.; Chatterji, M.; Rusinek, H.; et al. DCE-MRI of the Liver: Effect of Linear and Non Linear Conversions on Hepatic Perfusion Quantification and Reproducibility. J. Magn. Reson. Imaging 2014, 40, 90–98. [Google Scholar] [CrossRef] [Scilit]
- Bobko, P.; Roth, P.L.; Bobko, C. Correcting the Effect Size of d for Range Restriction and Unreliability. Organ. Res. Methods 2001, 4, 46–61. [Google Scholar] [CrossRef] [Scilit]
- Tilak, A.; Arivazhahan, A. Non-Parametric Tests. In Introduction to Basics of Pharmacology and Toxicology: Volume 3: Experimental Pharmacology: Research Methodology and Biostatistics; Springer: Berlin/Heidelberg, Germany, 2022; pp. 889–896. [Google Scholar]
- Bland, J.M.; Altman, D.G. Measuring Agreement in Method Comparison Studies. Stat. Methods Med. Res. 1999, 8, 135–160. [Google Scholar] [CrossRef] [Scilit]
- Taffé, P. When Can the Bland & Altman Limits of Agreement Method Be Used and When It Should Not Be Used. J. Clin. Epidemiol. 2021, 137, 176–181. [Google Scholar] [PubMed]
- Romagnoli, C.; Ditroilo, M.; Bonaiuto, V.; Annino, G.; Gatta, G. Paddle Propulsive Force and Power Balance: A New Approach to Performance Assessment in Flatwater Kayaking. Sports Biomech. 2025, 24, 247–260. [Google Scholar] [CrossRef] [Scilit] [PubMed]
- Ishizuka, R.; Nagamune, K. Development of a Quantitative Evaluation System for Bradykinesia Using MediaPipe Hands. In Proceedings of the 2023 IEEE International Conference on Systems, Man, and Cybernetics (SMC), Honolulu, HI, USA, 1–4 October 2023; pp. 1635–1640. [Google Scholar]
- Yu, T.; Park, K.W.; McKeown, M.J.; Wang, Z.J. Clinically Informed Automated Assessment of Finger Tapping Videos in Parkinson’s Disease. Sensors 2023, 23, 9149. [Google Scholar] [CrossRef] [Scilit] [PubMed]
- Hamilton, R.I.; Glavcheva-Laleva, Z.; Haque Milon, M.I.; Anil, Y.; Williams, J.; Bishop, P.; Holt, C. Comparison of Computational Pose Estimation Models for Joint Angles with 3D Motion Capture. J. Bodyw. Mov. Ther. 2024, 40, 315–319. [Google Scholar] [CrossRef] [Scilit]
- Dill, S.; Ahmadi, A.; Grimmer, M.; Haufe, D.; Rohr, M.; Zhao, Y.; Sharbafi, M.; Hoog Antink, C. Accuracy Evaluation of 3D Pose Reconstruction Algorithms Through Stereo Camera Information Fusion for Physical Exercises with MediaPipe Pose. Sensors 2024, 24, 7772. [Google Scholar] [CrossRef] [Scilit]
- Djurić-Jovičić, M.; Jovičić, N.; Radovanovic, S.M.; Lukić, M.J.; Belić, M.; Popović, M.; Kostić, V. Finger and Foot Tapping Sensor System for Objective Motor Assessment. Vojnosanit. Pregl. 2018, 75, 68–77. [Google Scholar] [CrossRef] [Scilit]
- Zheng, C.; Wu, W.; Chen, C.; Yang, T.; Zhu, S.; Shen, J.; Kehtarnavaz, N.; Shah, M. Deep Learning-Based Human Pose Estimation: A Survey. ACM Comput. Surv. 2023, 56, 1–37. [Google Scholar] [CrossRef] [Scilit]
- Monje, M.H.; Domínguez, S.; Vera-Olmos, J.; Antonini, A.; Mestre, T.A.; Malpica, N.; Sánchez-Ferro, Á. Remote Evaluation of Parkinson’s Disease Using a Conventional Webcam and Artificial Intelligence. Front. Neurol. 2021, 12, 742654. [Google Scholar] [CrossRef] [Scilit]
- Demby’s, J.; Gao, Y.; Shafiekhani, A.; DeSouza, G.N. Object Detection and Pose Estimation Using CNN in Embedded Hardware for Assistive Technology. In Proceedings of the 2019 IEEE Symposium Series on Computational Intelligence (SSCI), Xiamen, China, 6–9 December 2019; IEEE: New York, NY, USA, 2019; pp. 3165–3171. [Google Scholar]
- Stenum, J.; Cherry-Allen, K.M.; Pyles, C.O.; Reetzke, R.D.; Vignos, M.F.; Roemmich, R.T. Applications of Pose Estimation in Human Health and Performance across the Lifespan. Sensors 2021, 21, 7315. [Google Scholar] [CrossRef] [Scilit]
- Edriss, S.; Romagnoli, C.; Caprioli, L.; Bonaiuto, V.; Padua, E.; Annino, G. Commercial Vision Sensors and AI-Based Pose Estimation Frameworks for Markerless Motion Analysis in Sports and Exercises: A Mini Review. Front. Physiol. 2025, 16, 1649330. [Google Scholar] [CrossRef] [Scilit]

Disclaimer/Publisher’s Note: The statements, opinions and data contained in all publications are solely those of the individual author(s) and contributor(s) and not of MDPI and/or the editor(s). MDPI and/or the editor(s) disclaim responsibility for any injury to people or property resulting from any ideas, methods, instructions or products referred to in the content. |
© 2025 by the authors. Licensee MDPI, Basel, Switzerland. This article is an open access article distributed under the terms and conditions of the Creative Commons Attribution (CC BY) license.