


Featured Application
The presented W-band material attenuation data can be directly applied to indoor propagation modelling and 6G network planning. The results enable more accurate ray-tracing simulations, support the design of radio-transparent construction materials, and improve the deployment of sub-THz access points in smart buildings, industrial environments, and future mixed-reality communication systems.
Abstract
Recent developments in sixth-generation (6G) communication systems have increased interest in using sub-terahertz frequencies, particularly the W-band (75–110 GHz), for high-capacity indoor links. At these frequencies, electromagnetic (EM) wave attenuation introduced by building materials becomes a key factor limiting system performance. The objective of this study is to provide continuous, laboratory-validated attenuation characteristics of commonly used construction and finishing materials across the full W-band. Measurements were conducted in an accredited electromagnetic compatibility laboratory using a calibrated far-field setup with a vector network analyzer, W-band frequency extenders, and standard-gain horn antennas inside an anechoic chamber. For each frequency point, 20 measurements were recorded under controlled environmental conditions. The results show distinct attenuation behaviour depending on material type: wood-based materials exhibit 6–13 dB/cm, construction materials 2–4 dB/cm, and insulation materials below 0.3 dB/cm, while ceramic materials exceed 15–23 dB/cm. A general increase in attenuation with frequency is observed, particularly for materials with higher dielectric losses. The presented dataset enables more accurate indoor propagation modelling, supports ray-tracing and link-budget analyses, and provides practical guidelines for designing radio-transparent building components for future 6G communication systems.
1. Introduction
The rapid development of wireless communication systems has led to an increasing demand for higher-frequency bands. With the emergence of sixth-generation (6G) technology, sub-terahertz frequencies are gaining particular importance, enabling extremely high data rates, low latency, and enhanced communication security. One of the key regions of this spectrum is the W-band (75–110 GHz, λ = 2.7–4 mm), which extends beyond the upper limit of the 5G FR2 band [1,2]. The U.S. Federal Communications Commission (FCC) has already begun issuing experimental licences for spectrum use above 95 GHz [3], and future 6G systems are expected to operate in this range with channel capacities reaching up to 100 Gb/s [4].
However, increasing the operating frequency introduces significant propagation challenges. Construction and finishing materials, as well as indoor furnishings, introduce additional attenuation and distortion of electromagnetic (EM) waves, directly affecting link quality. For this reason, many studies have examined material-dependent attenuation across frequency bands relevant to modern wireless systems [5,6,7,8,9,10,11,12]. Existing investigations cover several distinct ranges: (I) sub 6 GHz and centimetre-wave measurements of brick and concrete walls [7], (II) 20–40 GHz studies of wood-based and composite materials [6], (III) millimetre-wave measurements at isolated frequencies such as 28, 73, and 91 GHz [8], and (IV) initial D-band characterization (110–170 GHz) reported in [9,10]. Additionally, ITU-R P.2040-3 and ITU-R P.2109-2 provide approximate dielectric parameters up to 100 GHz [11,12], but these values are generic and do not represent specific commercial building materials or continuous W-band behaviour.
Several theoretical and modelling works relevant to indoor propagation are discussed in [13,14,15], whereas experimental indoor measurements are typically limited to a few discrete frequencies and conditions. Moreover, attenuation strongly depends on wall thickness, types of binding agents, moisture content, and other construction-specific factors. Additional studies have demonstrated that the composition of cement-based materials, including aggregate type and chemical additives, significantly affects their EM absorption properties [16]. In the W-band, free-space attenuation becomes significant as well, with humidity-dependent atmospheric absorption described by ITU-R P.676-11 [17] and classical models such as Liebe [18]. The fundamental free-space propagation behaviour and radiometric relations relevant to these frequencies are discussed in [19].
Despite extensive prior work, a continuous and comprehensive dataset covering the entire 75–110 GHz range for common construction materials is still lacking. Most previous measurements report only discrete frequencies or narrow sub-bands, limiting their usefulness for modelling and simulation of indoor 6G environments.
The aim of this study is to provide full-band attenuation characteristics of selected structural and finishing building materials across the entire W-band under controlled laboratory conditions using a precision measurement setup inside an anechoic chamber. The resulting dataset supports accurate modelling of EM wave propagation in indoor environments and facilitates the design of efficient short-range links for future 6G networks.
Furthermore, recent research shows that the dielectric properties of building materials exhibit strong frequency-dependent dispersion in the millimetre-wave and sub-THz ranges. Reported real relative permittivity ε′ typically ranges from 2.0 to 3.0 for low-density materials such as mineral wool and gypsum boards [11,12], 3.0 to 4.5 for lightweight ceramic blocks and hollow bricks [20], and 5.0 to 7.0 for dense materials including structural concrete and window glass [10,16]. The dielectric loss tangent tan δ is generally below 0.02 for glass and gypsum composites [11], increases to 0.03–0.07 for ceramics [20], and reaches 0.06–0.12 for concrete depending on aggregate structure, porosity, and moisture content [16]. These parameters directly affect attenuation and penetration depth in the W-band and thus determine achievable coverage and access-point density in indoor sub-THz deployments [21]. Therefore, deeper understanding of the frequency-dependent dielectric behaviour of construction materials is essential for accurate propagation modelling in high-capacity 6G communication scenarios. Recent sub-THz studies further confirm the strong frequency-dependent dielectric behaviour of construction materials, including newly reported THz-FDS characterization and model extensions [22], as well as wideband analyses of concrete across the 30–300 GHz range [16].
2. Materials and Methods
2.1. Theoretical Background of Electromagnetic Wave Propagation
When investigating the attenuation of building materials in the W-band frequency range, it is essential to consider the fundamental phenomena associated with the propagation of electromagnetic (EM) waves in free space and through dielectric materials. These mechanisms determine how the incident wave interacts with the material and directly influence the measured transmission characteristics.
2.1.1. Electromagnetic Wave Propagation in Free Space
The attenuation introduced by the tested materials was evaluated under far-field conditions to ensure stable and predictable propagation. The minimum distance required to satisfy the far-field criterion is given by the Fraunhofer limit.
where
- λ = c/f—electromagnetic wavelength;
- A—antenna aperture, defined as the largest linear dimension of the antenna.
In the far-field region, the relationship between transmitted and received power is described by the Friis equation:
where Gₜ and Gᵣ denote the gain of the TX and RX antennas, respectively. Since the measurement distance used in this study (2.5 m) exceeds across the entire W-band, all attenuation measurements were performed strictly in the far-field region, and near-field effects do not influence the reported results.
2.1.2. Electromagnetic Wave Propagation Through a Dielectric Material
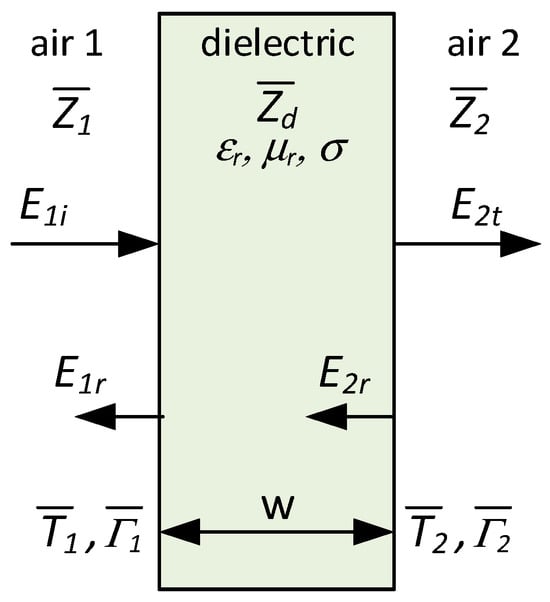
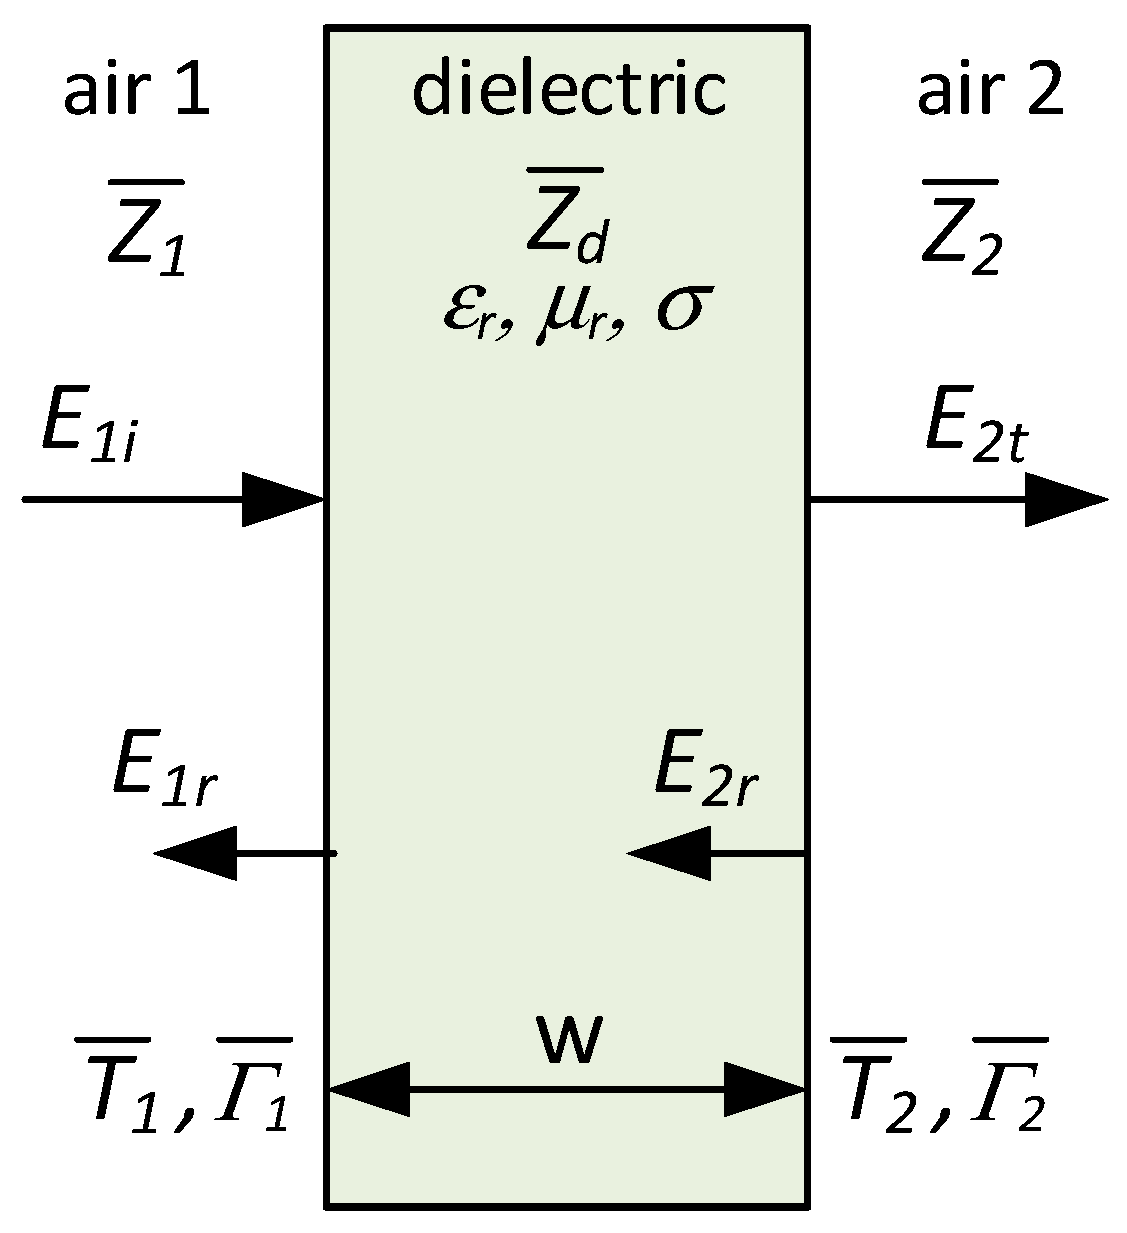
When a wave impinges normally on the surface of a homogeneous material, part of the incident energy is reflected, while the remaining portion penetrates the material and undergoes attenuation depending on its electromagnetic properties (Figure 1).
Figure 1.
Perpendicular incidence of an electromagnetic wave on a medium placed in air: w—dielectric width; E1i—incident field; E1r—reflected field; E2t—transmitted field; Zd—impedance of material (adapted from [14,15,23]).
For a medium characterized by an electric permittivity (where is the permittivity of free space and is the relative permittivity), a magnetic permeability (where is the permeability of free space and is the relative permeability), and an electrical conductivity σ, the complex propagation constant takes the form [14,15,23]
The complex electric permittivity of the material is expressed as
where the real part ε′ corresponds to the ability to store energy in the electric field, while the imaginary part ε″ represents losses associated with displacement currents.
The attenuation of a wave propagating through a material of thickness w can be written as
Assuming that the material under test is surrounded by a homogeneous air medium (), the transmission coefficients are given by
where
- —wave impedance of free space;
- —wave impedance of the material under test;
- —reflection coefficients.
The inherent non-homogeneity of building materials, variations in chemical composition, and the presence of binding agents make the analytical determination of their electromagnetic parameters (μ, ε, σ, γ) highly uncertain. This significantly limits the accuracy of theoretical attenuation estimates. Therefore, in this study, laboratory measurements under controlled conditions were employed, as they provide the most reliable method for determining the actual attenuation of building materials.
2.2. Measurement Setup and Procedure
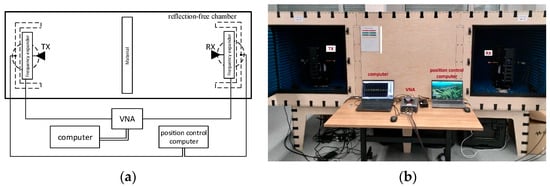
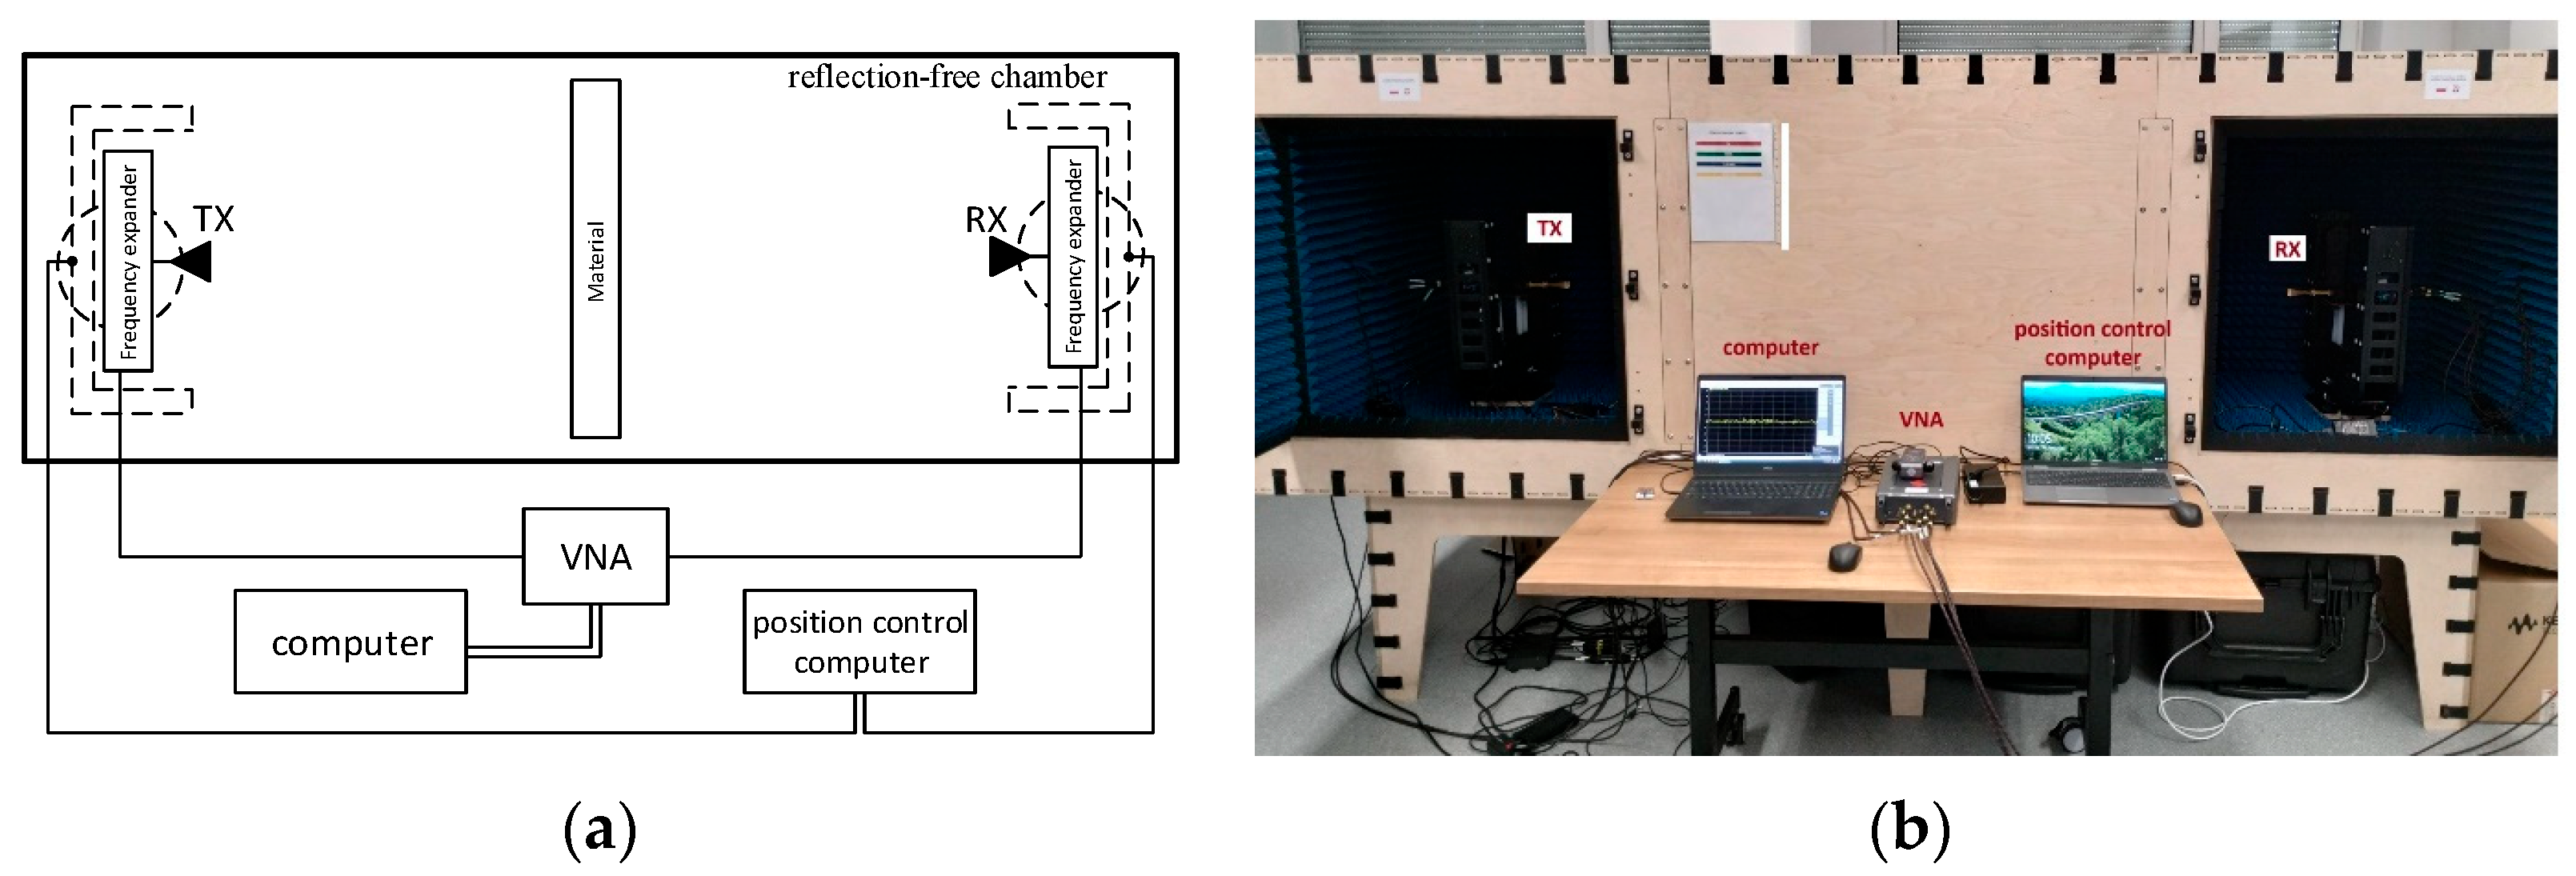
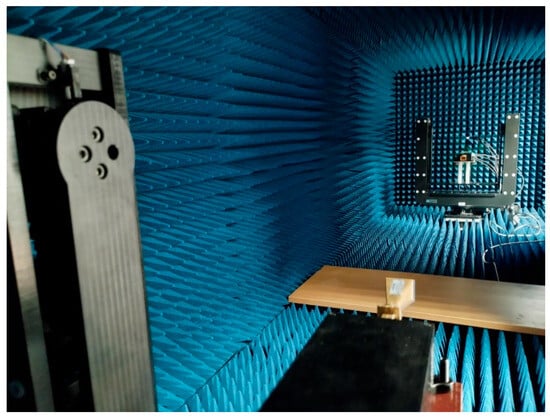
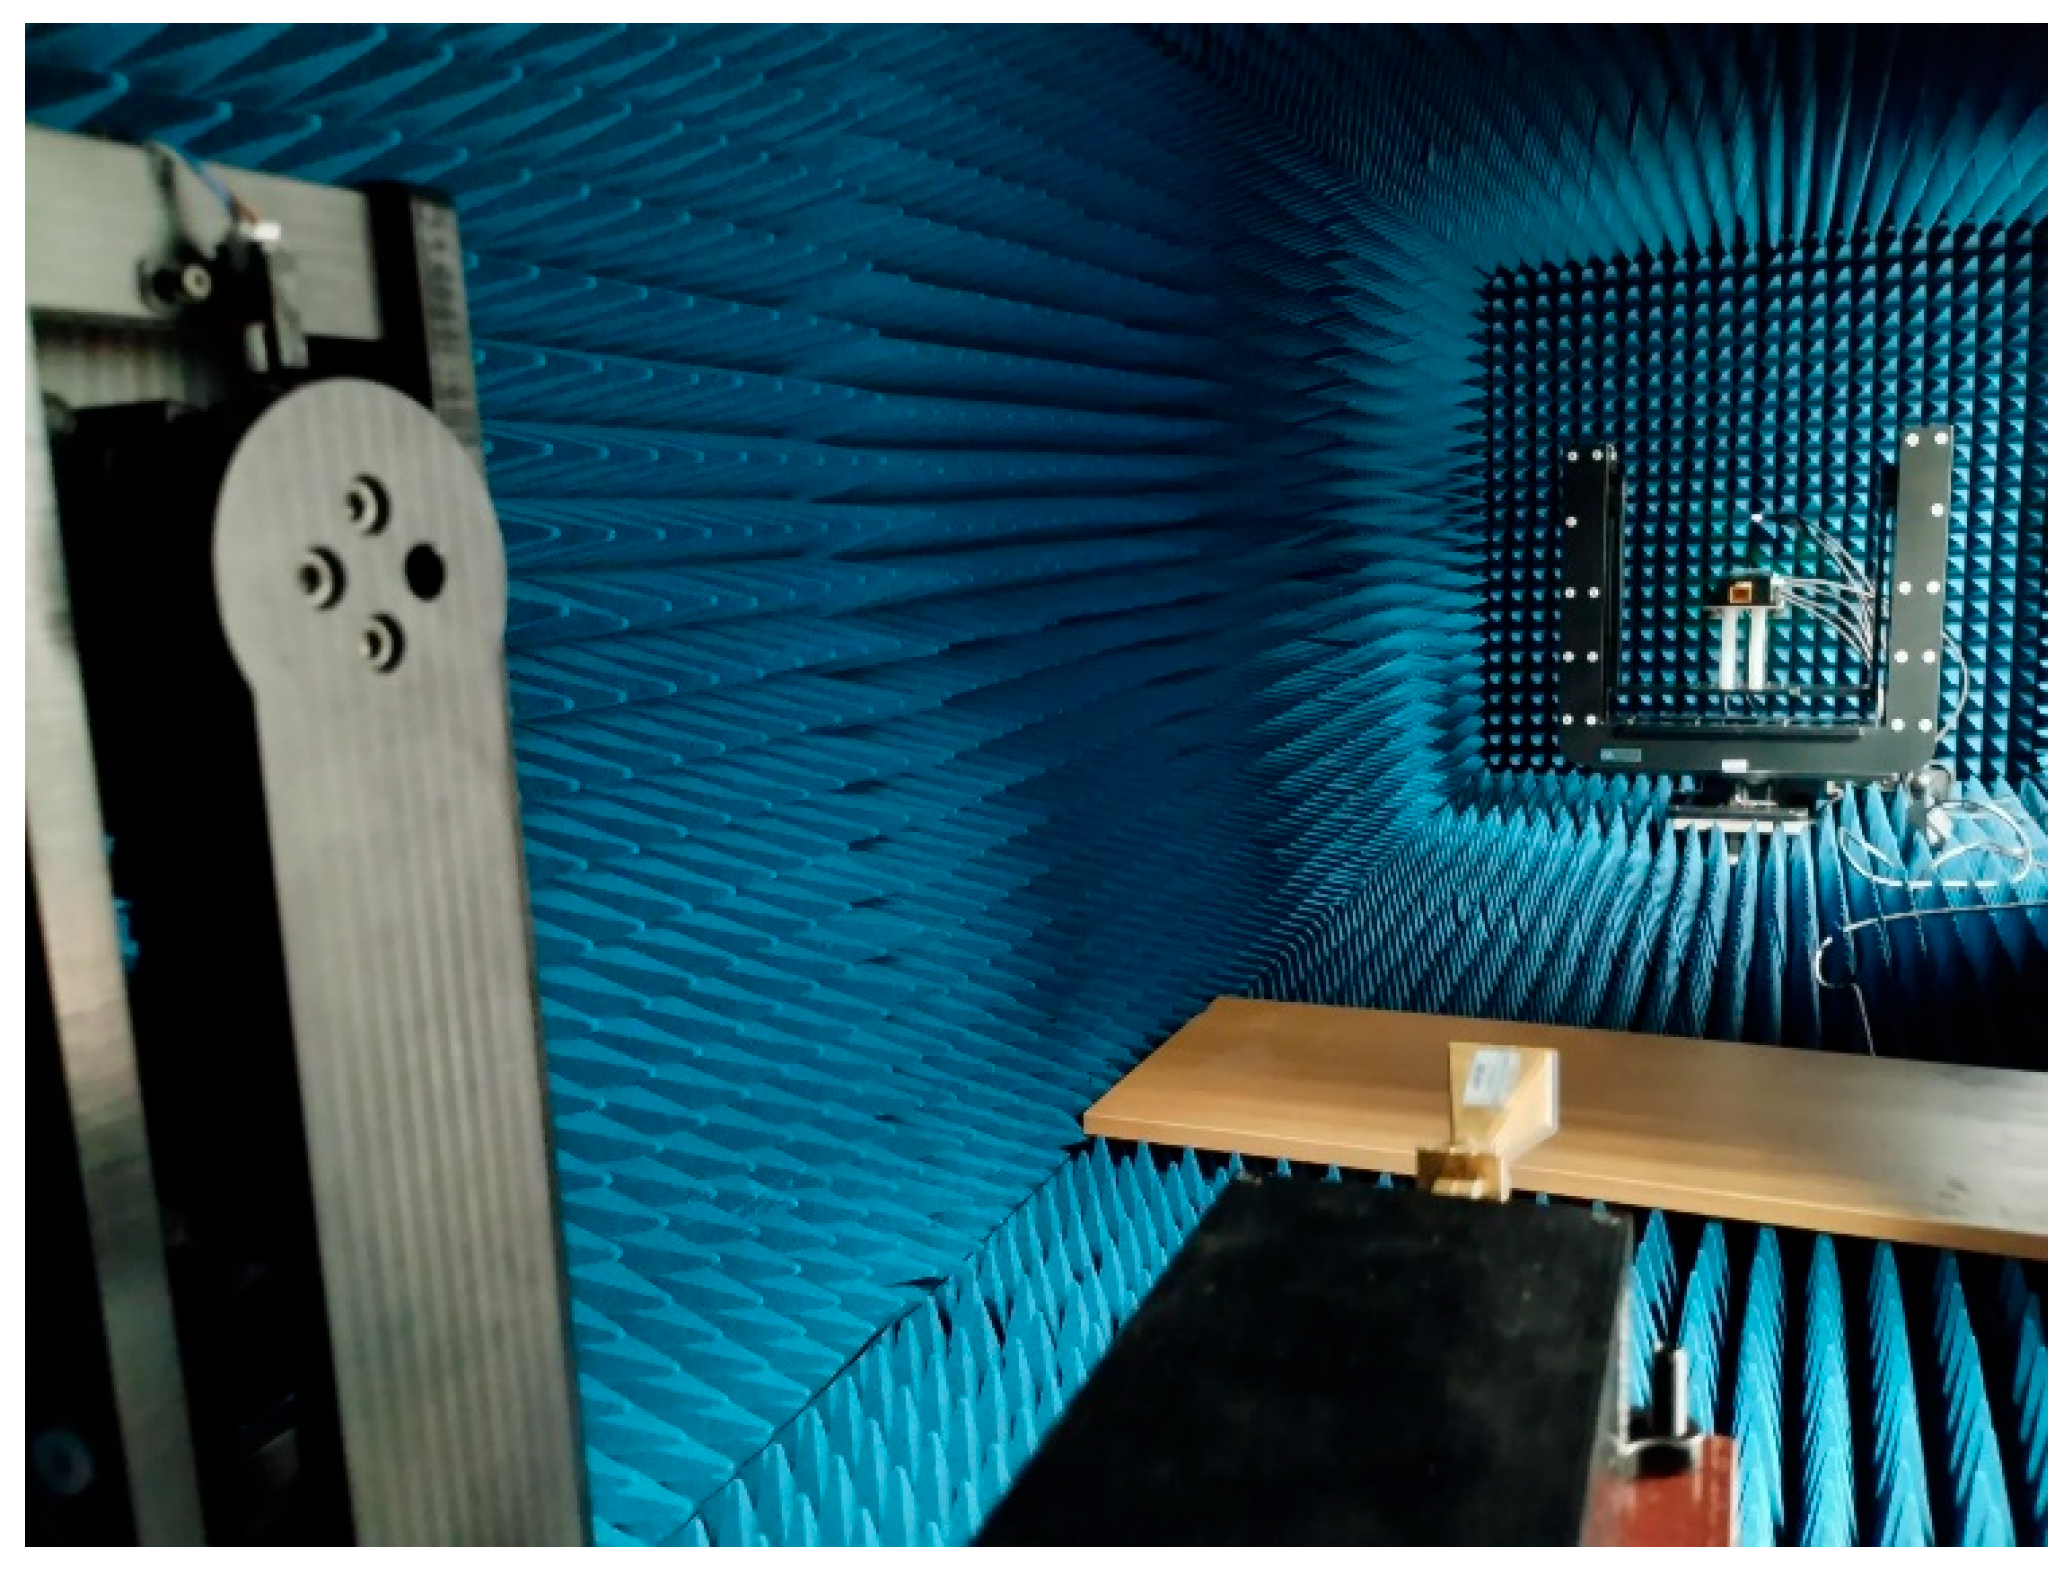
Attenuation measurements were performed at the accredited Electromagnetic Compatibility Laboratory of the National Institute of Telecommunications in Wrocław, Poland. The experiments were conducted inside an anechoic chamber with external dimensions of 3.0 × 1.3 × 1.3 m, whose interior walls were covered with electromagnetic absorbers. A schematic diagram of the measurement setup is shown in Figure 2a, while Figure 2b presents a photograph of the actual measurement configuration.
Figure 2.
Measurement setup for evaluating the attenuation of building materials. (a) Block diagram; (b) laboratory measurement setup.
The chamber is lined with electromagnetic absorbers, providing far-field measurement conditions without the influence of reflections (Figure 3).
Figure 3.
View of the measurement setup inside the anechoic chamber, showing the position of the material samples and the TX/RX antenna arrangement.
2.2.1. Measurement Equipment
The measurement system was based on a Keysight P5024 vector network analyzer (VNA, Keysight Technologies, Santa Rosa, CA, USA), operating in the 9 kHz–20 GHz range and extended to the full W-band (75–110 GHz) using a pair of Virginia Diodes 5252 WR-10 frequency extenders (Virginia Diodes Inc., Charlottesville, VA, USA). The VNA provided an output power of +10 dBm and an intermediate-frequency (IF) bandwidth of 100 Hz, ensuring high measurement sensitivity and repeatability. Before each measurement session, a full two-port calibration of the extender modules was performed using a dedicated WR-10 calibration kit, which compensated for systematic errors associated with cables, connectors, and waveguide interfaces, and ensured correct reference-plane placement at the antenna ports.
Standard-gain horn antennas of type LB-10-25A (A-INFO, A-INFO Inc., Torrance, CA, USA) were used as the transmitting (TX) and receiving (RX) antennas. Their nominal gain ranged from 24.2 dBi at 75 GHz to 26.2 dBi at 110 GHz, and they exhibited a single-lobe, highly directional radiation pattern with 3 dB beamwidths decreasing from 10.45° to 7.55° in the E plane and from 11.43° to 8.93° in the H plane across the frequency range. The antennas operated with linear horizontal polarization, with the electric-field vector aligned parallel to the surface of the material samples. The aperture efficiency exceeded 85%, ensuring stable beam shape and minimal distortion across the band.
The antenna–extender assemblies were mounted on precision motorized positioners that enabled accurate alignment of the TX and RX beams along the measurement axis. This arrangement ensured perpendicular incidence of the electromagnetic wave on the tested materials and minimized misalignment errors. The distance between the antennas was fixed at 2.5 m, guaranteeing far-field conditions for all W-band frequencies, as verified by the Fraunhofer criterion values listed in Table 1.
Table 1.
EM wave propagation path parameters.
2.2.2. Measurement Geometry and Antenna Characteristics
To maintain a uniform measurement field, the antennas were aligned in the horizontal plane so that the electric-field vector was parallel to the surface of the sample. The antenna aperture dimensions were 26.8 × 20.8 mm, and the total horn length was 70 mm.
Based on these parameters, the diameter of the signal beam incident on the material sample was calculated as
where
- D—diameter of the electromagnetic beam footprint on the sample;
- α—half-power beamwidth angle of the antenna (9.37°).
To minimize diffraction effects, a guard region of width g = 10.18 cm was applied [8]. The total diameter of the exposure area for the building material sample was therefore 61.1 cm, which comfortably fit within the full sample surface of 100 × 100 cm.
Due to the beam footprint diameter of 40.7 cm and the applied guard region of 10.18 cm, the radiated beam was fully contained within the 100 × 100 cm sample surfaces, effectively eliminating edge and diffraction effects. Additional estimates based on geometric optics indicate that possible boundary-related diffraction contributes less than 0.1 dB, which is well within the measurement uncertainty. For heterogeneous materials such as OSB or plywood, multiple measurements were performed at different positions across the sample surface, showing no significant variation in attenuation (typically below 0.3 dB). This confirms that structural non-uniformity did not affect the stability or interpretation of the measured results.
The propagation parameters for individual W-band frequencies are summarized in Table 1.
2.2.3. Tested Materials
All samples were commercially manufactured products compliant with the relevant European standards (EN 300 [24] for OSB, EN 312 [25] for chipboard, EN 520 [26] for gypsum boards, EN 771-1 [27] for ceramic blocks, and EN 13163 [28] for expanded polystyrene). These standards specify the normative ranges of physical parameters such as density, moisture content, and porosity, ensuring high reproducibility of the tested materials. All samples were stored and conditioned under laboratory conditions prior to the measurements, and their moisture state corresponded to the dry condition defined in the respective standards. Since attenuation in the W-band is governed primarily by the dielectric response of the material, small normative variations in physical density or residual moisture do not affect the presented results.
Eleven typical construction materials were selected for the study and classified into four groups:
- Wood-based materials:
- A1—chipboard;
- A2—OSB board;
- A3—pine wood;
- A4—plywood;
- A5—floor panel.
- Insulating materials:
- B1—polystyrene foam.
- Construction materials:
- C1—gypsum plasterboard;
- C2—concrete block;
- C3—porotherm block.
- Ceramic materials:
- D1—glazed tile;
- D2—glass.
The samples had a surface area of 100 × 100 cm. The thickness was standardly 1 cm, except for concrete blocks and Porotherm blocks (10 and 20 cm, respectively). For comparison purposes, the results for the blocks were scaled to a unit thickness of 1 cm.
2.2.4. Measurement Procedure and Determination of Attenuation
Each measurement consisted of recording the S21 parameter of the VNA, corresponding to the energy transmission coefficient between the TX and RX antennas. First, attenuation was measured in the free space of the chamber (LF), and then in the presence of the tested material (LM). The specific material attenuation L(dB) was determined using the following relation:
Measurements were performed with a frequency step of 5 GHz over the range of 75–110 GHz. For each frequency, 20 measurements were conducted (four series over five days), and the mean attenuation and standard deviation (STD) were then calculated.
3. Results and Discussion
3.1. Measurement Conditions
All measurements were carried out in an accredited electromagnetic compatibility laboratory in an anechoic chamber, following the procedure described in Section 2.2. For each material, a reference measurement in free space and a measurement with the tested sample were performed, allowing the determination of the specific material attenuation.
3.2. Measurement Results
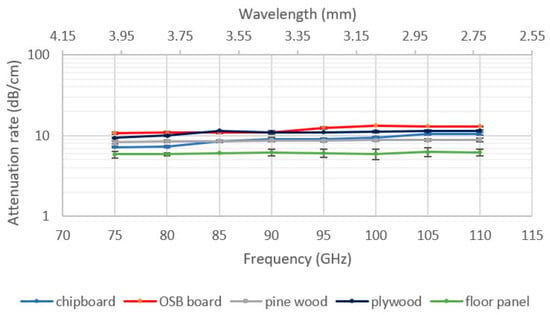
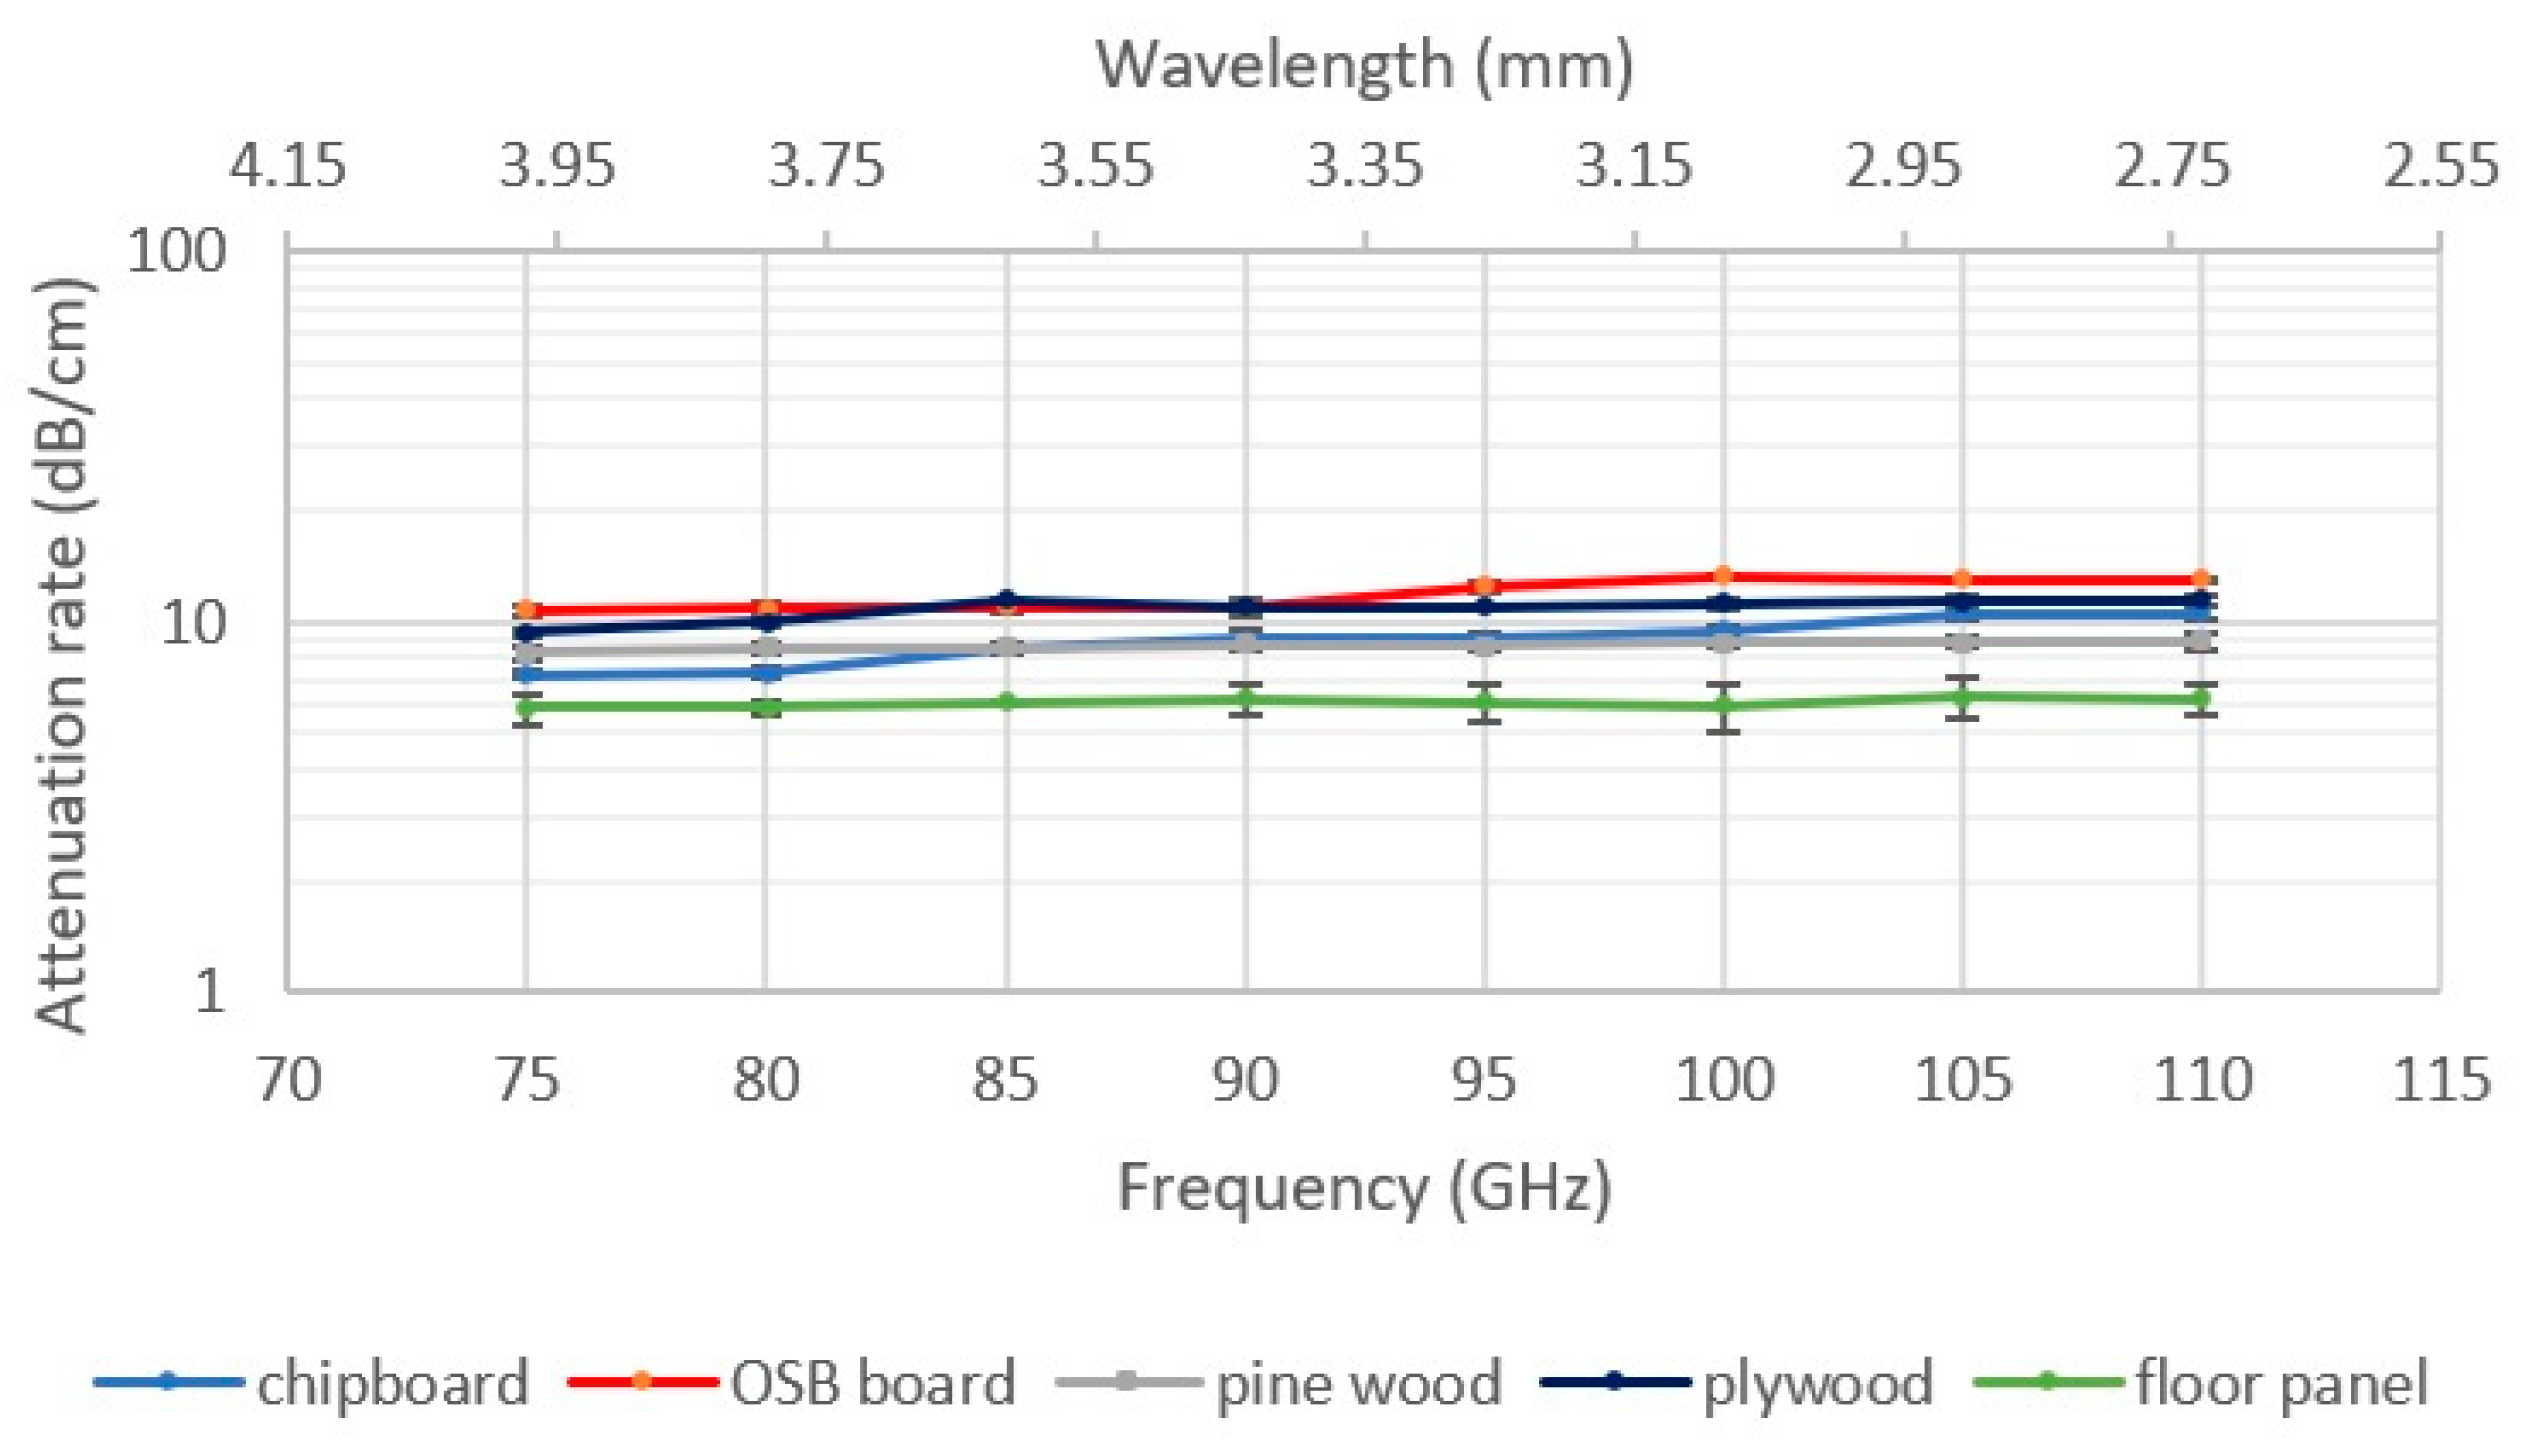
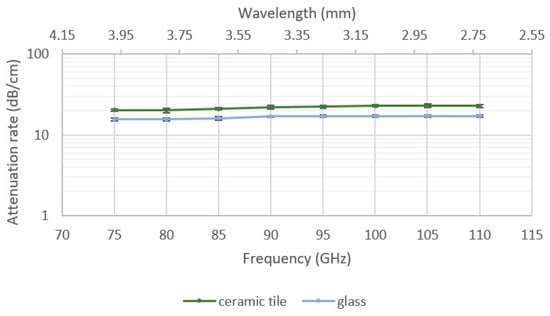
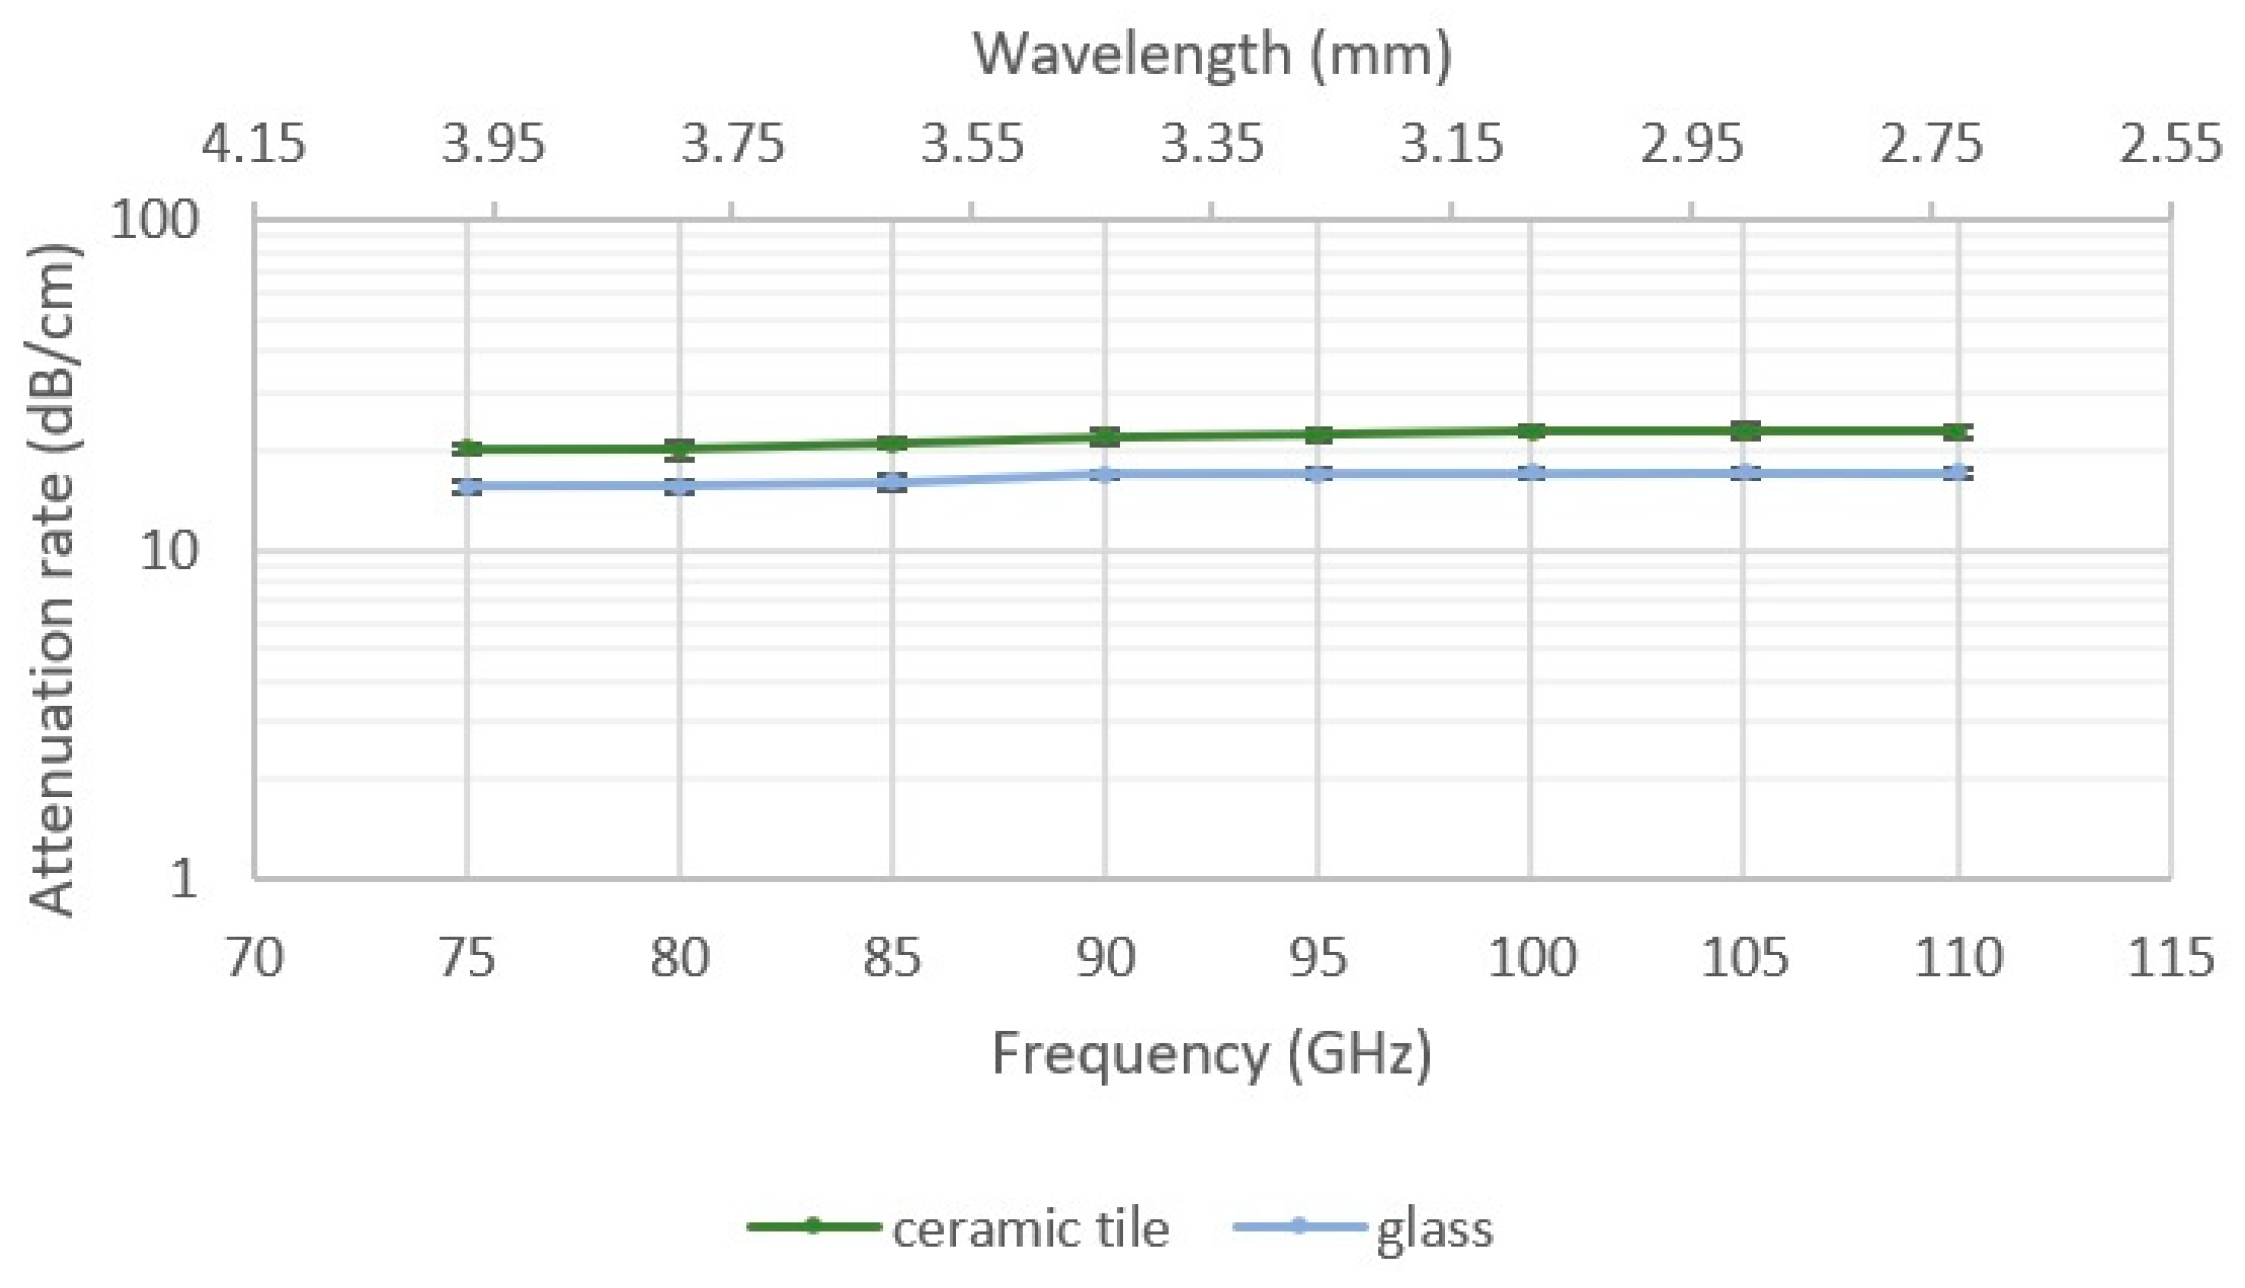
Table 2 presents the mean values of electromagnetic wave attenuation as a function of frequency for all tested construction materials, normalized to a unit thickness of 1 cm. The measurement results for the individual material groups are presented graphically in Figure 4, Figure 5, Figure 6 and Figure 7.
Table 2.
Mean electromagnetic wave attenuation in the 75–110 GHz range for the tested construction materials.
Figure 4.
Frequency-dependent attenuation of wood-based materials (Group A).
Figure 5.
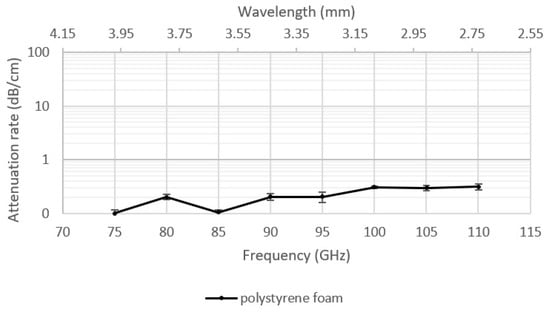
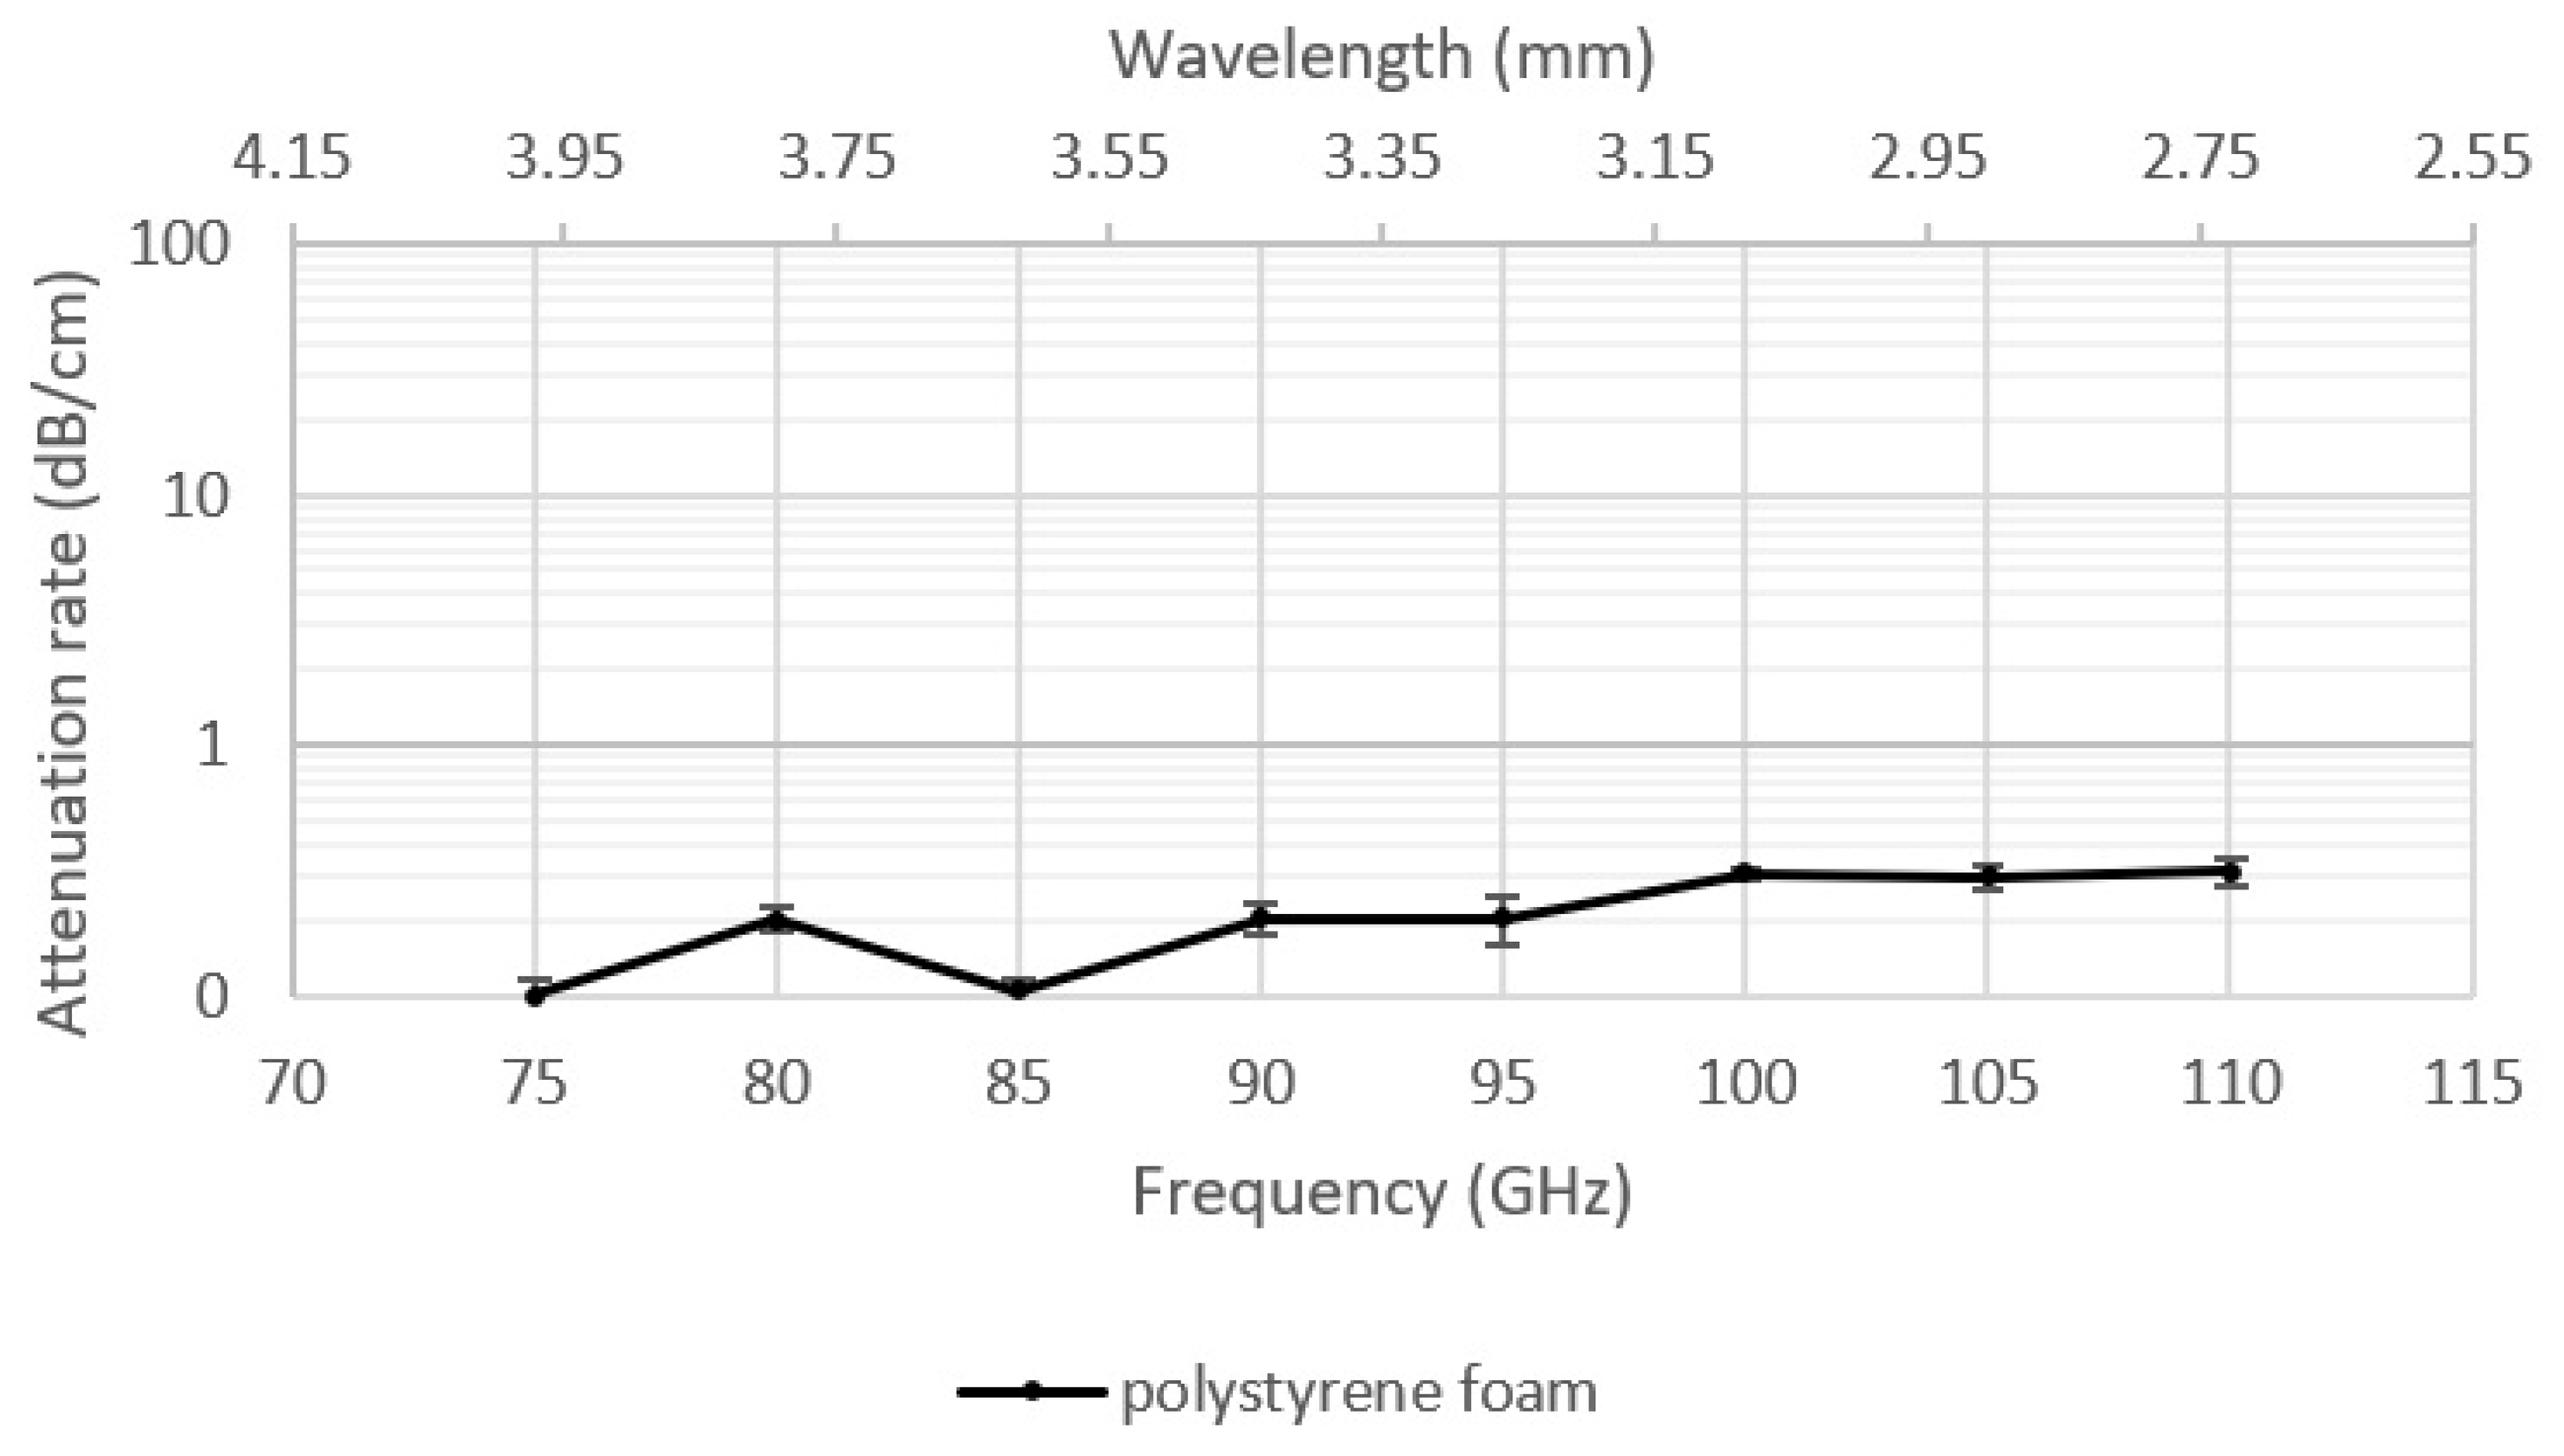
Frequency-dependent attenuation of insulating materials (Group B).
Figure 6.
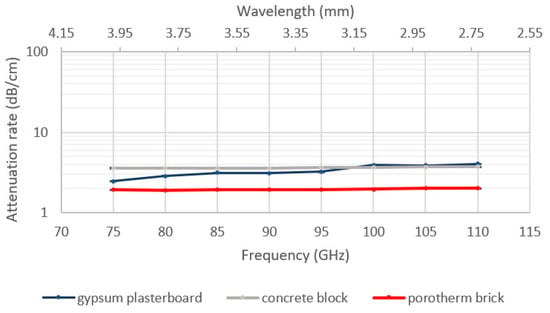
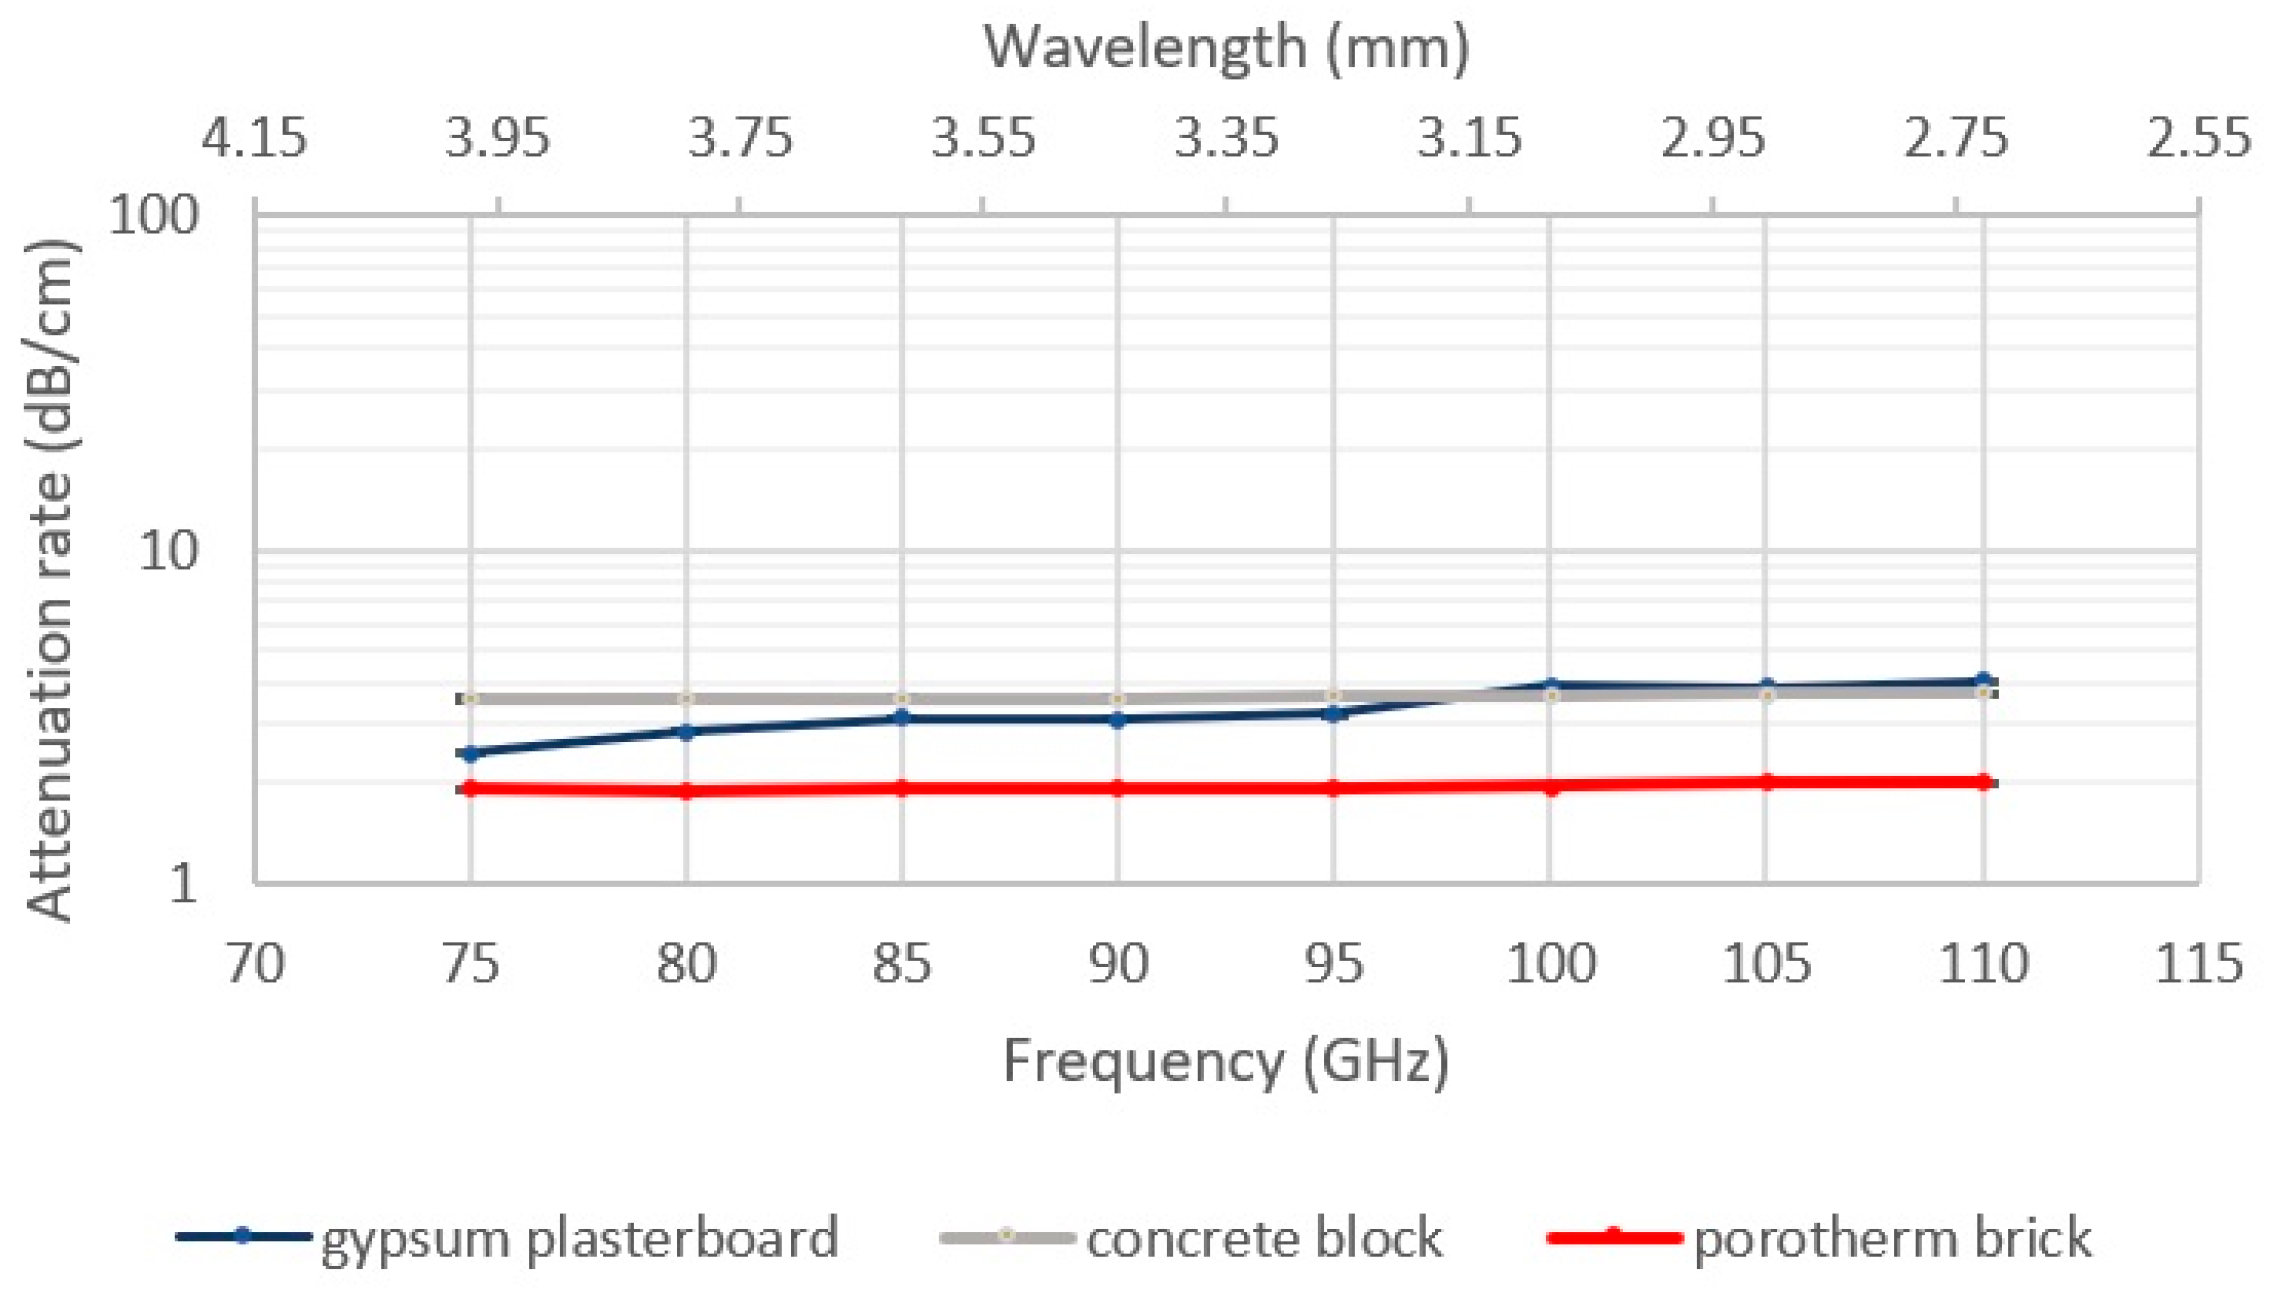
Frequency-dependent attenuation of construction materials (Group C).
Figure 7.
Frequency-dependent attenuation of ceramic materials (Group D).
3.3. Analysis of Results for Individual Material Groups
Wood-based materials (Group A—Figure 4):
Wood-based materials exhibit an average attenuation level in the range of 6–13 dB/cm. Pine wood (A3) and floor panel (A5) show nearly constant attenuation independent of frequency, approximately 8.5 dB/cm and 6 dB/cm, respectively. In contrast, OSB board (A2), particleboard (A1), and plywood (A4) show a noticeable increase in attenuation with increasing frequency. This phenomenon can be attributed to the presence of polymeric adhesives and structural heterogeneity, which cause scattering and absorption of shorter-wavelength waves (2.7–4 mm).
Insulating materials (Group B—Figure 5):
Expanded polystyrene (B1) exhibits the lowest attenuation among all tested samples, not exceeding 0.3 dB/cm across the W-band. Its low attenuation is due to its porous structure and low material density, which limit propagation losses. This material has minimal impact on EM wave propagation, making it advantageous for indoor wireless communication.
Construction materials (Group C—Figure 6):
Construction materials such as gypsum board (C1), concrete (C2), and Porotherm blocks (C3) exhibit attenuation in the range of 2–4 dB/cm. Concrete and Porotherm blocks maintain stable attenuation across the entire frequency range. Gypsum board shows a moderate increase in attenuation at higher frequencies, likely due to increased dielectric losses in gypsum binders. In practical terms, the thickness of these construction elements (several centimetres) results in significant signal attenuation in the W-band, which is important for planning 6G network coverage within buildings.
Ceramic materials (Group D—Figure 7):
The highest attenuation was observed for ceramic materials—glass (D2) and glazed tiles (D1)—in the range of 15–23 dB/cm. These high values result from high density, homogeneous structure, and high dielectric permittivity, which promote absorption of electromagnetic energy. These materials can be considered natural EM shields, relevant for the design of glazing and facades in modern buildings.
3.4. Comparison with Literature Data
The results obtained in this study are consistent with previously published measurements of W-band attenuation. For example, in [8], attenuation values at 73 GHz were reported as follows:
- Plywood—7.14 dB/cm (in this work, 9.37 dB/cm at 75 GHz);
- Gypsum board—1.45 dB/cm (here, 2.47 dB/cm);
- Glass—14.37 dB/cm (here, 15.6 dB/cm).
A similar agreement was observed at 91 GHz (compared with 90 GHz in this work). Differences in values can be attributed to varying environmental conditions (temperature, humidity) and differences in chemical composition and production technology of the materials. Analysis of standard deviations indicates high measurement repeatability, with inter-series variations not exceeding ±15%, confirming the stability and reliability of the obtained data.
3.5. Interpretation and Application Significance
The results allow identification of the main mechanisms of EM wave attenuation in typical construction materials:
- Dielectric absorption—dominant in high-density, low-porosity materials (glass, ceramics).
- Scattering and internal reflections—characteristic of heterogeneous materials (OSB, plywood, particleboard).
- Conductive losses—in materials containing metallic or conductive additives.
- Low absorption—in porous, low-density materials (expanded polystyrene).
In the context of modern building design and 6G systems, these results indicate
- The need to increase the density of access points in buildings with large glass and ceramic components;
- The necessity of beamforming and adaptive beam shaping;
- The possibility of using low-attenuation materials (e.g., wood, gypsum boards) in areas requiring good signal propagation.
It should be noted that attenuation does not increase strictly linearly with material thickness. For thin layers (up to several centimetres), linear scaling provides a good approximation, but for thicker construction elements, internal reflections and dispersion may introduce non-linear growth of penetration loss. Therefore, the 1 cm normalization used in this study is valid for comparative purposes but should not be directly extrapolated to full wall thicknesses without additional modelling.
3.6. Empirical Fitting Model for Material Attenuation
To support the use of the presented results in link-level simulations and indoor coverage planning, an empirical attenuation model was derived for the tested materials. The penetration loss was approximated as a logarithmic function of frequency:
where is the carrier frequency expressed in gigahertz, and and are material-dependent coefficients obtained using least-squares fitting.
The model provides a compact representation suitable for deterministic ray-tracing tools and fast link-budget evaluations in W-band indoor deployments.
Only three representative materials were included in the fitting model because they cover the main dielectric classes: low-loss gypsum, medium-loss ceramic block, and high-loss concrete. Other materials were excluded due to strong heterogeneity or non-monotonic frequency behaviour, which violates the assumptions of logarithmic modelling.
The fitted parameters for the three investigated materials are summarized in Table 3. The resulting RMSE (root mean square error) values indicate a high level of agreement between the empirical model and the measured data, with errors not exceeding 1.3 dB.
Table 3.
Fitted coefficients of the logarithmic attenuation model.
The fitted coefficients clearly reflect the increasing density and dielectric losses of the considered materials. Gypsum, characterized by low permittivity and limited moisture content, exhibits the lowest attenuation gradient, while concrete shows the strongest frequency dependence due to its higher dielectric losses and conductive aggregates. These trends are consistent with previously reported sub–THz propagation studies [8,9,10,16,20,21]. However, it should be noted that this single-layer logarithmic model is not directly applicable to multi-layer wall assemblies or materials containing metallic inclusions, where internal reflections or conductive paths may lead to non-logarithmic attenuation behaviour.
Although four material groups were defined in Section 2.2.3, the empirical model focuses on three representative materials (gypsum, ceramic block, concrete) because only these exhibited monotonic and well-behaved frequency trends suitable for logarithmic fitting.
4. Conclusions
This study presents experimental results on electromagnetic wave attenuation in the 75–110 GHz frequency range (W-band) for selected construction materials. Measurements were conducted in an anechoic chamber using a vector network analyzer and W-band converters, allowing reliable and repeatable attenuation characterization across the full frequency range. The results confirm that the experimental setup provides conditions close to free-space propagation, eliminating reflections and interferences, which is critical for measurement reliability.
Based on the analyses, the following conclusions were drawn:
- Attenuation strongly depends on material type—from below 0.3 dB/cm for porous materials (expanded polystyrene) to over 20 dB/cm for ceramics (glass, glazed tiles).
- Wood-based materials (OSB, plywood, particleboard) show a significant increase in attenuation with frequency, attributed to structural heterogeneity and the presence of resin adhesives.
- Construction materials, such as concrete, gypsum board, and Porotherm, exhibit moderate attenuation (2–4 dB/cm), relatively stable across the W-band, making them predictable for propagation modelling.
- High-density, homogeneous materials, particularly glass and ceramics, show the strongest attenuation, potentially acting as barriers for 6G signal transmission.
- Agreement with literature data confirms the validity of the measurement procedure, with differences of less than 15%, within the uncertainty range, due to material composition and environmental conditions.
- The use of the anechoic chamber and precise measurement equipment allowed for stable results with low inter-series variability, confirming the high reliability and repeatability of the developed method.
- The results provide the first comprehensive dataset of typical construction material attenuation across the entire W-band, directly applicable for EM wave propagation modelling in indoor environments and for 6G infrastructure and short-range radar system design.
- The provided attenuation dataset enables direct integration into deterministic ray-tracing tools and channel simulators for sub-THz indoor scenarios, supporting the design of radio-transparent materials and energy-efficient high-capacity 6G deployments.
Significance and Future Work
The obtained data serve as a basis for developing analytical models of EM wave propagation in the sub-terahertz range. Future studies will extend the measurements to include phase analysis and the modelling of thickness- and moisture-dependent effects on propagation parameters. Moreover, multi-thickness measurements will be performed to quantify the scaling behaviour of penetration loss beyond the thin-sample regime and to better capture non-linear effects in thick construction walls. The present study is limited to normal-incidence transmission. Future extensions will therefore address oblique-incidence measurements (30–60°) to support NLOS propagation modelling and improve compatibility with indoor ray-tracing tools.
Author Contributions
Conceptualization, R.M. and K.M.; methodology, K.M.; software, K.M.; validation, R.M. and K.M.; formal analysis, R.M.; writing—original draft preparation, R.M.; writing—review and editing, R.M. and K.M.; visualization, R.M.; supervision, R.M.; project administration, R.M.; funding acquisition, not applicable. All authors have read and agreed to the published version of the manuscript.
Funding
This research received no external funding.
Institutional Review Board Statement
Not applicable.
Informed Consent Statement
Not applicable.
Data Availability Statement
The data presented in this study are available on request from the corresponding author. The data are not publicly available due to privacy.
Acknowledgments
The authors would like to thank all those who contributed indirectly to this work.
Conflicts of Interest
The authors declare no conflict of interest.
References
- Imam-Fulani, Y.O.; Faruk, N.; Sowande, O.A.; Abdulkarim, A.; Alozie, E.; Usman, A.D.; Adewole, K.S.; Oloyede, A.A.; Chiroma, H.; Garba, S.; et al. 5G Frequency Standardization, Technologies, Channel Models, and Network Deployment: Advances, Challenges, and Future Directions. Sustainability 2023, 15, 5173. [Google Scholar] [CrossRef] [Scilit]
- Dilli, R. Analysis of 5G Wireless Systems in FR1 and FR2 Frequency Bands. In Proceedings of the ICIMIA 2020, Bangalore, India, 5–7 March 2020; IEEE: Piscataway, NJ, USA, 2020. [Google Scholar] [CrossRef] [Scilit]
- Federal Communications Commission. FCC 19–19; Docket No. 18–21, 21 March 2019; Federal Communications Commission: Washington, DC, USA, 2019. [Google Scholar]
- Chen, S.; Liang, Y.-C.; Sun, S.; Kang, S.; Cheng, W.; Peng, M. Vision, Requirements, and Technology Trend of 6G. IEEE Wirel. Commun. 2020, 27, 218–228. [Google Scholar] [CrossRef] [Scilit]
- Xing, Y.; Kanhere, O.; Ju, S.; Rappaport, T.S. Indoor Wireless Channel Properties at Millimeter Wave and Sub-Terahertz Frequencies. In Proceedings of the 2019 IEEE Global Communications Conference (GLOBECOM), Waikoloa, HI, USA, 9–13 December 2019. [Google Scholar]
- Oladunni, J.F.-J. Effects of Building Material on Real Time Application in Radio Wave at Millimetre Wave Spectrum. Int. J. Res. Appl. Sci. Eng. Technol. 2019, 7, 2623–2629. [Google Scholar] [CrossRef] [Scilit]
- Sahu, K.N.; Naidu, C.D.; Sankar, K.J. Study of RF Propagation Losses in Homogeneous Brick and Concrete Walls. IOSR J. Electron. Commun. Eng. 2014, 9, 58–66. [Google Scholar] [CrossRef] [Scilit]
- Hosseini, N.; Khatun, M.; Guo, C.; Du, K.; Ozdemir, O.; Matolak, D.W.; Guvenc, I.; Mehrpouyan, H. Attenuation of Several Common Building Materials: 28, 73 and 91 GHz. IEEE Antennas Propag. Mag. 2021, 63, 40–50. [Google Scholar] [CrossRef] [Scilit]
- Wang, X.; Li, W.; Wang, M.; Bian, C.; Wei, Y.; Zhou, W. Research on Penetration Loss of D-Band Millimeter Wave for Typical Materials. Sensors 2022, 22, 7666. [Google Scholar] [CrossRef] [Scilit] [PubMed]
- Beelde, B.; Plets, D.; Desset, C.; Tanghe, E.; Bourdoux, A.; Joseph, W. Material Characterization and Radio Channel Modeling at D-Band. IEEE Access 2021, 9, 153528–153539. [Google Scholar] [CrossRef] [Scilit]
- ITU-R. Recommendation P.2040-3. Effects of Building Materials and Structures on Radiowave Propagation Above 100 MHz; ITU: Geneva, Switzerland, 2023. [Google Scholar]
- ITU-R. Recommendation P.2109-2. Prediction of Building Entry Loss; ITU: Geneva, Switzerland, 2023. [Google Scholar]
- Friis, H.T. A Note on a Simple Transmission Formula. Proc. IRE 1946, 34, 254–256. [Google Scholar] [CrossRef] [Scilit]
- Choroszucho, A.; Szczegielniak, T.; Kusiak, D. The Influence of Building Materials and Electrical Parameter Variability on Electromagnetic Wave Propagation. Energies 2024, 17, 5934. [Google Scholar] [CrossRef] [Scilit]
- Griffiths, D.J. Introduction to Electrodynamics, 4th ed.; Pearson: London, UK, 2017. [Google Scholar]
- Jiang, W.; Chen, X.; Dou, W.; Liu, T.; Wang, H. Electromagnetic Properties of Concrete in 30–300 GHz. Constr. Build. Mater. 2023, 374, 132306. [Google Scholar] [CrossRef] [Scilit]
- ITU-R. P.676-11. Attenuation by Atmospheric Gases; ITU: Geneva, Switzerland, 2016. [Google Scholar]
- Liebe, H.J. MPM—An Atmospheric Millimeter-Wave Propagation Model. Int. J. Infrared Millim. Waves 1989, 10, 631–650. [Google Scholar] [CrossRef] [Scilit]
- Shaw, J.A. Radiometry and the Friis Transmission Equation. Am. J. Phys. 2013, 81, 33–37. [Google Scholar] [CrossRef] [Scilit]
- Salhi, M.A.; Kleine-Ostmann, T.; Schrader, T. Propagation Channel Measurements in the mm- and Sub-mm Wave Range for Different Indoor Communication Scenarios. J. Infrared Millim. Terahertz Waves 2021, 42, 357–370. [Google Scholar] [CrossRef] [Scilit]
- Wang, C.-X.; Huang, J.; Wang, H.; Gao, X.; You, X.; Hao, Y. 6G Wireless Channel Measurements and Models: Trends and Challenges. IEEE Veh. Technol. Mag. 2020, 15, 22–32. [Google Scholar] [CrossRef] [Scilit]
- Mikhnev, V.A.; But, D.B.; Zugno, T.; Boban, M.; Eichinger, J.; Knap, W. THz-FDS Characterization of Building Materials and Extension of the ITU-R P.2040 Model for Sub-THz Frequencies. IEEE Trans. Terahertz Sci. Technol. 2025, 15, 985–995. [Google Scholar] [CrossRef] [Scilit]
- Collin, R.E. Foundations for Microwave Engineering, 2nd ed.; McGraw-Hill: New York, NY, USA, 1992. [Google Scholar]
- EN 300; Oriented Strand Boards (OSB)—Definitions, Classification and Specifications. European Committee for Standardization (CEN): Brussels, Belgium, 2006.
- EN 312; Particleboards—Specifications. European Committee for Standardization (CEN): Brussels, Belgium, 2010.
- EN 520; Gypsum Plasterboards—Definitions, Requirements and Test Methods. European Committee for Standardization (CEN): Brussels, Belgium, 2004.
- EN 771-1; Specification for Masonry Units—Part 1: Clay Masonry Units. European Committee for Standardization (CEN): Brussels, Belgium, 2011.
- EN 13163; Thermal Insulation Products for Buildings—Factory Made Expanded Polystyrene (EPS) Products—Specification. European Committee for Standardization (CEN): Brussels, Belgium, 2012.

Disclaimer/Publisher’s Note: The statements, opinions and data contained in all publications are solely those of the individual author(s) and contributor(s) and not of MDPI and/or the editor(s). MDPI and/or the editor(s) disclaim responsibility for any injury to people or property resulting from any ideas, methods, instructions or products referred to in the content. |
© 2025 by the authors. Licensee MDPI, Basel, Switzerland. This article is an open access article distributed under the terms and conditions of the Creative Commons Attribution (CC BY) license (https://creativecommons.org/licenses/by/4.0/).