


Abstract
This study examines how residents evaluate local government within Japan’s Liveable Well-Being City Indicator (LWCI) framework, with a focus on public service delivery and the application of machine learning (ML). Using a nationwide survey of 66,085 respondents, two dimensions of local government evaluation (Service Accessibility and Government Responsiveness) were examined using correlation analysis and Random Forest classification models. The findings indicate that differences between the two evaluation dimensions are better understood through patterns of relative predictive importance among shared factors than entirely distinct sets of variables. Service Accessibility was more strongly associated with functional and usability-related service factors, whereas Government Responsiveness was associated with a broader range of service-related and community-level conditions. The Random Forest models further identified differences in the relative importance of predictors across the two outcomes, reinforcing the distinction between their broader predictive patterns. These findings demonstrate that integrating ML with well-being assessments complements conventional statistical analysis by providing additional insight into the comparative predictive structure of policy-related factors.
1. Introduction
In recent years, scholars have increasingly emphasized well-being as a multidimensional framework for understanding societal function, extending beyond traditional economic indicators to incorporate social and experiential dimensions of quality of life (OECD, 2024; Fioramonti et al., 2022). This shift reflects a growing recognition that individual welfare is associated not only with material conditions but also with access to public services, social inclusion, and everyday interactions with institutions (Stiglitz et al., 2009; OECD, 2024). Both academic and policy-oriented research have moved toward integrating subjective perceptions with objective indicators to better understand how citizens experience governance and public service delivery.
Japan represents a prominent case in the application of this approach. Through initiatives like the Liveable Well-Being City Indicator (LWCI), policymakers have developed a comprehensive system for measuring well-being at the municipal level (Digital Agency of Japan, 2025). The LWCI integrates subjective survey data with a wide range of objective indicators, including measures of infrastructure, environmental quality, public service provision, and economic conditions, allowing for a comprehensive assessment of local livability. This approach not only measures well-being outcomes but also supports policy development by helping municipalities identify which factors associated with residents’ quality of life warrant closer policy attention.
Central to this system is a nationwide survey of residents, which captures subjective evaluations across a broad set of domains, including health, employment, education, social relationships, and the built environment. The survey includes indicators of both individual well-being (e.g., happiness, life satisfaction) and contextual factors related to local conditions, such as mobility, public space, and service accessibility. Within this scope, local government occupies a central and multifaceted role and functions not only as a provider of public services, such as transportation systems, public facilities, and social infrastructure, but also as an object of citizen evaluation. Residents form perceptions about whether their local government is accessible, responsive, and attentive to their needs. In the survey, these perceptions are captured through measures such as whether “the local government cares deeply about residents” and whether “public facilities are easily accessible and convenient,” positioning local government performance as both a component of and an evaluative outcome within the well-being system.
Previous research demonstrates that citizens’ evaluations of government are closely linked to their experiences with public service delivery, with trust associated not only with broad political attitudes but also with evaluations of service quality (Berg & Johansson, 2020; Alessandro et al., 2020). At the same time, institutional trust is not uniform across levels of government but varies across contexts, as citizens form distinct evaluations based on their direct interactions with specific institutions (Van de Walle & Migchelbrink, 2020). These collective findings suggest that perceptions of local government are context-dependent and informed by multiple interacting factors rather than single, isolated influences.
Existing analyses within well-being frameworks, including those applied in Japan, have largely relied on correlation and regression-based methods to identify relationships between well-being factors and outcomes. While correlation analysis and regression estimates remain valuable, they may provide less flexibility for examining complex predictive patterns and comparing the relative contribution of multiple correlated factors. In response to these limitations, the recent literature has increasingly explored the application of machine learning (ML) methods in social science and public policy research. These approaches enable researchers to identify complex patterns within high-dimensional data, accommodate interactions among predictors, and evaluate the relative contribution of multiple factors simultaneously, offering new insights into outcomes such as political attitudes and institutional trust (Athey, 2018; Kyriazos & Poga, 2024).
Rather than replacing conventional statistical approaches, ML complements correlation and regression in this analysis by evaluating how predictors contribute jointly to classification within a multivariate model. This study further builds on these developments by shifting the analytical focus from general well-being outcomes to perceptions of local government performance, which is a critical but underexplored dimension within well-being research. By integrating correlation analysis with Random Forest classification, the study further identifies not only the factors associated with local government perceptions but also their relative importance across the distinct dimensions of Government Responsiveness and Service Accessibility, providing a deeper understanding of how policy-related conditions are associated with different dimensions of local government evaluation. Accordingly, this study is guided by the following research questions:
- RQ1: What factors are associated with residents’ perceptions of local government performance?
- RQ2: How are public services associated with residents’ perceptions of local government?
- RQ3: What additional insight can ML provide into patterns of local government perception that are not captured through conventional statistical approaches?
The theoretical contribution of the study lies in treating service accessibility and government responsiveness as distinct evaluative outcomes that may arise from a shared set of local conditions but differ in the relative predictive importance of those conditions. This extends resear ch that has typically examined satisfaction, trust, responsiveness and service quality as separate outcomes. It also further develops the use of well-being frameworks by examining variation within citizen perception rather than treating subjective government evaluation as a single composite construct. ML contributes to this theoretical objective by enabling comparison of the relative predictive structure of shared factors across the two outcomes.
2. Theoretical Framework
2.1. Citizen Perceptions of Local Government
The evaluation of local government has increasingly shifted beyond traditional administrative measures towards citizen-centered assessments of government performance. While objective indicators such as efficiency, financial management and service outputs remain important, growing attention has been given to how residents perceive and experience government through their everyday interactions with public services. This reflects a broader recognition that governments are ultimately evaluated not only by what they deliver, but also by how those outcomes are experienced and interpreted by citizens (Van de Walle & Bouckaert, 2003; Reddick et al., 2022).
Much of this literature identifies public service delivery as the primary mechanism through which citizens evaluate local government. Repeated interactions with public transport, administrative services, digital platforms and other municipal services provide tangible experiences that shape perceptions of service quality, accessibility and administrative competence (Reddick et al., 2022; James & Moseley, 2020). Recent studies similarly demonstrate that service accessibility, ease of use and administrative processes significantly influence citizen satisfaction, highlighting that evaluations are formed through routine experiences rather than objective service outcomes alone (Turesson et al., 2025; Akinboade et al., 2024).
Perceptions of responsiveness, trust and institutional legitimacy are also affected by broader judgements regarding whether governments are attentive to community needs, communicate effectively and demonstrate accountability in decision-making (Goldfinch et al., 2022; OECD, 2023). Studies have shown that contextual factors including government communication, performance information, organizational responsiveness and opportunities for citizen engagement all contribute to broader evaluations of local government beyond immediate service encounters (Sanders & Canel, 2015; Van de Walle & Bouckaert, 2003). As such, citizen evaluation reflects both direct experiences with public services and wider interpretations of government intent, fairness and commitment to public welfare. Despite this growing body of research, existing studies have predominantly examined individual dimensions of citizen evaluation in isolation. Satisfaction with public services, trust, responsiveness, and service quality are typically treated as separate outcomes, making it difficult to determine whether they arise from distinct conditions or different interpretations of a shared policy environment. This separation limits the ability of existing research to determine whether related dimensions of government evaluation reflect different underlying conditions or different patterns of association within a shared local policy environment.
2.2. Well-Being Frameworks and Local Government Evaluation
The assessment of local government performance has evolved considerably over recent decades, reflecting a broader shift from measuring administrative outputs towards evaluating the wider outcomes of public policy. Traditional performance evaluations have primarily focused on objective indicators such as financial management, infrastructure provision, and service efficiency, providing valuable measures of organizational performance but offering only limited insight into how government actions affect residents’ lived experiences (Stiglitz et al., 2009). Increasing recognition of these limitations has encouraged the development of evaluation mechanisms that integrate economic, social, environmental and subjective dimensions of well-being alongside conventional performance measures. Consequently, international assessments have increasingly incorporated subjective well-being and citizen perception measures as complementary indicators of public value, recognizing that residents provide an important perspective on government performance that cannot be inferred from administrative statistics alone (OECD, 2020, 2024).
This perspective has become increasingly evident within urban governance research, with recent studies demonstrating that residents’ evaluations of cities are influenced by a combination of objective urban conditions and subjective interpretations of their surrounding environment. Factors such as neighborhood quality, access to facilities and services, environmental conditions, and opportunities for travel and daily activity are among the urban factors associated with subjective well-being and perceived livability (Mouratidis, 2021). Similarly, research on urban quality of life has emphasized that residents evaluate local areas across multiple interconnected dimensions, supporting the use of integrated assessment systems rather than single measures of performance (Wesz et al., 2023). These developments have influenced how local governments conceptualize and evaluate policy effectiveness and Japan’s LWCI framework represents a notable example of such local government evaluation.
The LWCI integrates objective measures with large-scale resident perception data across multiple domains including public services, mobility, education, environment and community well-being to support evidence-based urban policymaking and more holistic assessments of city performance (General Incorporated Association Smart City Institute Japan, 2024). Although well-being frameworks can provide richer representations of local government performance than traditional administrative indicators, they typically emphasize relationships between individual indicators and overall well-being outcomes. This emphasis may make it more difficult to identify whether closely related dimensions of citizen evaluation are associated with different patterns of policy-related conditions. The present study addresses this gap by using ML to compare the relative importance of shared factors across distinct dimensions of local government evaluation.
2.3. Machine Learning in Public Administration
The growing availability of large-scale administrative and survey data has accelerated the application of ML methods within public administration and public policy research. Early applications focused primarily on improving predictive performance across areas such as revenue forecasting, citizen engagement, service demand, fraud detection and administrative decision support, demonstrating the ability of ML algorithms to identify complex relationships within high-dimensional datasets that are often difficult to detect using conventional statistical techniques (Gerrits, 2021; Chung et al., 2022).
Despite these advances, the application of ML within public administration has increasingly shifted from prediction towards explanation. Conventional statistical approaches such as correlation and regression remain valuable for identifying linear associations and testing predefined theoretical relationships. However, their interpretation generally depends on prespecified model structures, which may limit flexibility for exploring nonlinearities and interactions among multiple predictors (Breiman, 2001). In contrast, ML algorithms can model complex relationships without requiring these assumptions, enabling researchers to explore how multiple factors jointly contribute to policy outcomes rather than considering individual variables in isolation.
Recent research emphasizes the importance of understanding how models generate predictions and how individual variables contribute to decision outcomes, particularly within public sector contexts where transparency, accountability, and public trust remain essential considerations (Shin, 2021; Janssen et al., 2022). Techniques such as impurity-based feature importance and permutation importance can help translate complex machine-learning models into interpretable evidence for policy analysis and decision-making. Within public administration, most ML applications continue to focus on forecasting administrative outcomes, automating processes, or supporting operational decisions. Comparatively less attention has been given to using interpretable ML to examine how citizens evaluate government performance within the scope of well-being policy, and its use for assessing whether shared policy conditions contribute differently to distinct dimensions of citizen evaluation therefore remains underexplored. Accordingly, the theoretical contribution of ML in this study lies in comparing differentiated predictive structures across related dimensions of local government evaluation.
3. Materials and Methods
3.1. Data Source and Survey Framework
While the LWCI incorporates both subjective and objective indicators to assess quality of life across municipalities, the present analysis utilizes only the subjective survey component of the dataset to focus specifically on how residents perceive and evaluate local government performance. The subjective survey component was used because the study examines residents’ evaluations rather than objective levels of municipal performance. Residents’ evaluations are captured through a structured survey instrument that measures multiple domains of well-being using standardized Likert-scale questions, which include both personal assessments of well-being and perceptions of local conditions, such as service accessibility, safety, and community dynamics.
The original survey comprised 86,420 respondents and covered the main LWCI domains of well-being and regional satisfaction, living environment, regional relationships, and staying true to oneself. Complete-case analysis across all study variables excluded 20,335 respondents (23.5%), yielding a common analytical sample of 66,085 respondents. A missing-data audit showed that all excluded respondents were missing only the neighborhood-happiness item and had complete data for the remaining study variables. This item was retained because it served as the primary outcome measure in the original LWCI analysis and provided a reference point for comparison. The primary analyses used the common complete-case sample to maintain an identical analytical base across models. Since neighborhood happiness was not included in either Random Forest model, analysis-specific robustness models were also estimated using all observations with complete data for the relevant outcomes and predictors. As no variables used in the two Random Forest models contained missing values, both analysis-specific models included all 86,420 respondents.
Age and gender were not included as predictors in the primary model because the study focused on policy-related indicators, but they were used to compare the demographic composition of retained and excluded respondents as part of the missing-data assessment. Supplementary demographic-adjusted models were also estimated by adding age and gender to the policy predictors, and these models were evaluated using the same train-test partitions and tuned outcome-specific Random Forest settings as the corresponding policy-only models to allow direct comparison of predictive performance and policy-feature importance. Municipality identifiers were available in the secondary dataset but were not used as predictors or reporting units because the data were provided under restricted-use conditions prohibiting municipality-level comparison or ranking. That said, the identifiers were used internally to evaluate whether individual-level validation produced overly optimistic performance estimates. Five-fold municipality-grouped cross-validation was conducted using stratified group folds, with all respondents from a given municipality assigned to either the training or validation subset within each fold. The grouped results were compared with five-fold stratified individual-level cross-validation using the same tuned model specifications. No municipality-specific estimates, comparisons, or rankings were produced or reported to maintain compliance with the dataset use requirements.
As shown in Table 1, the analysis focuses on two perception-based variables within the broader living environment domain, including perceived accessibility of public facilities and perceived government care for residents. These variables were selected because they formed the composite local government measure used in prior LWCI analyses, where they were aggregated and incorporated into multiple linear regression models. Predictors were selected a priori rather than through automated feature selection, based on their theoretical relevance to residents’ evaluations of local government and their connection to policy domains within the potential influence of municipal government. A full list of the LWCI survey domains, subcategories, and items is provided in Table S1, while the specific inclusion and exclusion criteria used in this study are described in Section 3.2.
Table 1.
Survey Domains & Representative Variables.
3.2. Variable Specification
The analysis focuses on two dependent variables that capture distinct but related dimensions of local government evaluation. The first reflects whether respondents perceive that the local government “cares deeply about residents,” representing a broader evaluative judgment about government responsiveness. The second captures whether respondents perceive that “public facilities in the region are easily accessible and convenient,” reflecting more direct experiences with service delivery. Both variables were measured using five-point Likert response scales ranging from 1 (Strongly disagree) to 5 (Strongly agree). Table 2 presents the distribution of responses for each dependent variable.
Table 2.
Distribution of the dependent variables across response categories (N = 66,085).
Variable selection was guided by the study’s focus on residents’ perceptions of local government performance. The final policy-only specification contained 13 predictors representing public transport, child-rearing support, government digital services, children’s well-being, disaster prevention, the usefulness of digital tools in daily life, sidewalks and traffic signals, learning opportunities, neighborhood atmosphere, safety and crime prevention, school accessibility, school provision, and opportunities for challenge and growth. These variables were selected because they captured policy-relevant perceptions within domains potentially influenced by local government. Neighborhood happiness was not included as a predictor because it was a broad well-being measure outside the study’s policy-focused predictor framework. It was retained only to define the common analytical sample and maintain continuity with the original LWCI analysis. Age and gender were reserved for the demographic-adjusted sensitivity analysis, while municipality identifiers were used only for grouped validation. Respondent identifiers, administrative fields, composite indices, and variables outside the study objectives were excluded before modeling.
Although the response categories are ordinal, they were modeled using Random Forest classification to compare the predictive structure of the two outcomes. To assess the implications of modeling the outcomes as multiclass categories, each tuned Random Forest was compared with an ordered logistic regression model that explicitly preserved the ordering of the five response categories. The ordered-logit models used the same 13 policy predictors and the same training and held-out test observations as the corresponding Random Forest models, and predictors were standardized using parameters estimated from the training data before the ordered-logit models were fitted.
The two dependent variables formed part of the composite score_local_government measure used in previous LWCI analyses. Whereas earlier research combined them into a single index, the present study examines them separately as Service Accessibility and Government Responsiveness. To reduce conceptual overlap and prevent predictor leakage, each model excluded the other dependent variable from its predictor set. Since both the outcomes and predictors are self-reported perceptual information collected through the same survey format, the models may capture shared response tendencies or generalized evaluations of local conditions in addition to domain-specific predictive information. As such, feature importance is interpreted as a predictor’s conditional contribution to classification within this dataset and not as evidence that the corresponding policy domain independently causes changes in government evaluation.
3.3. Analytical Strategy and Modeling Approach
The analytical strategy was designed to examine the associations between policy-related factors and perceptions of local government and assess the complementary value of ML methods relative to conventional analytical approaches. Correlation analysis was first used to examine pairwise associations between variables, providing a baseline consistent with prior applications of the LWCI analysis. The correlation analysis used the full sample of 86,420 respondents because none of the variables included in the matrix contained missing observations, and Spearman rank correlations were calculated among the 13 policy predictors and the two government-evaluation outcomes. The analysis was therefore unaffected by missingness on the neighborhood-happiness item that determined inclusion in the common analytical sample, and given the large sample size, interpretation focused on the magnitude and pattern of the correlation coefficients rather than statistical significance.
Random Forest was selected because it can account for complex relationships among predictors and provide measures of variable importance. It is used here to compare the predictive structure of the two outcomes rather than estimate changes between adjacent response categories. The approach complements the other analyses where correlation shows pairwise associations, Random Forest considers predictors together, and ordered logistic regression preserves the ordering of the outcomes. However, feature importance does not show the direction, magnitude, or exact form of a relationship and is therefore interpreted as a predictor’s contribution to classification performance, not as a regression coefficient, effect size, or estimate of independent policy impact.
There were two Random Forest models estimated, one predicting perceived service accessibility and the other predicting perceptions that local government cares about residents, using the RandomForestClassifier implementation in scikit-learn (version 1.6.1). For each outcome, the common analytical sample was divided into stratified 80/20 training and held-out test subsets using a fixed random seed of 42. Hyperparameter tuning was conducted exclusively within the training data using three-fold stratified cross-validation and grid search, with macro-F1 as the selection criterion. The search varied tree depth, minimum leaf size, the number of predictors considered at each split, and class weighting. The selected specifications were refitted to the full training subsets and evaluated once on the untouched test subsets. The tuned Government Responsiveness model used unrestricted depth, a minimum leaf size of five, and 50% of predictors considered at each split; the tuned Service Accessibility model used a maximum depth of 15, a minimum leaf size of five, and the square root of predictors considered at each split. Both models used 500 trees, bootstrap aggregation, OOB estimation, no class weighting, and a fixed random seed of 42. Tuning increased held-out accuracy by approximately 2–3 percentage points, and the tuned models are reported as the primary specifications.
Model performance was evaluated using overall classification accuracy, balanced accuracy, OOB estimates, macro-precision, macro-recall, macro-F1, weighted F1, mean absolute category error, quadratic weighted kappa, and confusion matrices. The ordinal measures were included to account for the fact that errors between adjacent response categories are less substantial than errors across more distant categories. Held-out test results were used as the main basis for evaluation, while OOB accuracy was treated as an additional internal diagnostic. Predictor importance was assessed using the impurity-based feature importance measure implemented in Random Forest to identify the variables that contributed most strongly to model predictions and to compare patterns across the two outcomes. As a complementary robustness check, permutation importance was calculated by randomly shuffling each predictor in the test data and measuring the resulting decrease in model performance, with five repetitions for each predictor. As there were several correlated predictors, the interpretation focused on variables that remained important across methods rather than on exact rankings. As further sensitivity analyses, the tuned Random Forest models were re-estimated using the full analysis-specific sample and with age and gender added to the policy predictors. Performance was also examined using municipality-grouped cross-validation, and the Random Forest results were compared with ordered logistic regression as a benchmark model.
4. Results
4.1. Overview of LWCI Findings
The LWCI measures local government performance as part of a composite of subjective and objective well-being indicators spanning domains such as the built environment, natural environment, community relationships, and individual perceptions. Local government is operationalized through survey-based measures, including perceived governmental care and accessibility of public facilities, which are embedded within the broader “living environment” category and combined with objective indicators (e.g., infrastructure provision, financial indices, and digital governance measures) to construct composite scores.
Previous LWCI analyses further identified several factors associated with subjective well-being and life satisfaction. For subjective well-being, the highest-ranked factors included health, self-efficacy, and public space, followed by culture and art and community engagement. For life satisfaction, public space and trust in local government rank highest, followed by learning opportunities, accidents and crime, and business creation. Across both outcomes, several variables appear consistently among the top-ranked factors, including public space, trust in local government, learning opportunities, and accidents and crime. These variables span multiple domains within the LWCI structure and are identified through both correlation analysis and regression-based approaches.
4.2. Correlation Analysis
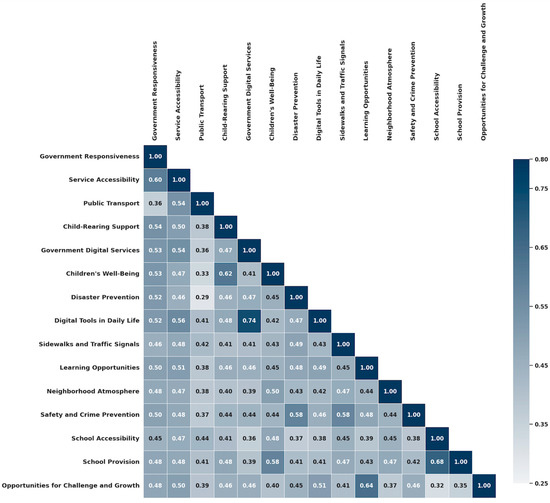
Correlation analysis was conducted to examine the relationships between the study variables and the two dependent measures, Government Responsiveness (item_gov_takes_residents_seriously) and Service Accessibility (item_public_facilities_easy_to_use), with the full correlation matrix presented in Figure 1. The correlations were estimated using the analysis-specific full sample of 86,420 respondents because all variables included in the matrix had complete data. The matrix shows entirely positive associations across variables, with no substantial negative relationships observed. Off-diagonal correlation coefficients ranged from ρ = 0.29 to ρ = 0.74, indicating generally moderate to strong associations, and given the large sample size, the discussion focuses on the magnitude and pattern of the observed associations rather than statistical significance. Excluding the alternate outcome, Government Responsiveness showed its strongest associations with child-rearing support (ρ = 0.54), government digital services and children’s well-being (both ρ = 0.53), and disaster prevention and digital tools in daily life (both ρ = 0.52). Service Accessibility was most strongly associated with digital tool usefulness (ρ = 0.56), public transport convenience and government digital services (both ρ = 0.54), learning opportunities (ρ = 0.51), and child-rearing support and opportunities for challenge and growth (both ρ = 0.50).
Figure 1.
Correlation Matrix.
Other service-related and infrastructure variables exhibited associations within a comparable range, and across the predictors, several variables were moderately to strongly intercorrelated. Government digital services and digital tools in daily life showed the strongest association (ρ = 0.74), followed by school accessibility and school provision (ρ = 0.68), learning opportunities and opportunities for challenge and growth (ρ = 0.64), and child-rearing support and children’s well-being (ρ = 0.62). Disaster prevention, safety and crime prevention, and sidewalk and traffic-signal quality were also interrelated, with correlations ranging from approximately ρ = 0.49 to 0.58.
The correlation analysis identified positive associations between both dimensions of local government evaluation and several LWCIs, including digital government services, child-rearing support, school accessibility, public transportation, disaster prevention, neighborhood atmosphere, and learning opportunities. However, the strength of these bivariate relationships differed across the two outcomes. Public transport, for example, was moderately associated with Service Accessibility (ρ = 0.54) but had a weaker association with Government Responsiveness (ρ = 0.36).
4.3. Random Forest Classification Analysis
4.3.1. Model Performance
Responses for both outcomes were concentrated in the middle categories, particularly Category 3, with fewer observations at the extremes (Table 3). A majority-class classifier would achieve accuracies of 0.515 for Government Responsiveness and 0.446 for Service Accessibility, and the Random Forest models improved on these baselines by 15.9 and 20.6 percentage points, respectively. Government Responsiveness achieved an accuracy of 0.674, a balanced accuracy of 0.541, and a weighted F1 of 0.664, while Service Accessibility achieved corresponding values of 0.652, 0.554, and 0.646. The models also produced mean absolute category errors of 0.353 and 0.384 and quadratic weighted kappa values of 0.649 and 0.686, respectively, indicating substantial agreement while accounting for the ordered nature of the response categories. OOB estimates closely matched test accuracy, providing an additional indication that performance was not driven by the held-out test set.
Table 3.
Model Performance Metrics.
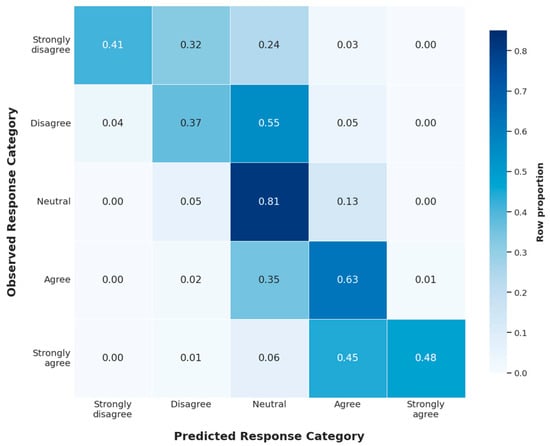
Normalized confusion matrices for both models are presented in Figure 2 and Figure 3. For the Government Responsiveness model (Figure 2), the highest accuracy was observed for Category 3 (“Neutral”), with 81% of observations correctly classified, followed by Category 4 (“Agree”) at 63%. Lower accuracy was observed for Categories 1 (“Strongly disagree”) and 2 (“Disagree”), with correct classification rates of 41% and 37%, respectively, while Category 5 (“Strongly agree”) achieved an accuracy of 48%. Misclassification was concentrated mainly between adjacent categories and toward the center of the response scale. Category 1 was most often misclassified as Category 2, Category 2 was most often misclassified as Category 3, and Category 5 was most often classified as Category 4. Misclassification across non-adjacent categories was limited.
Figure 2.
Confusion Matrix (Government Responsiveness Model).
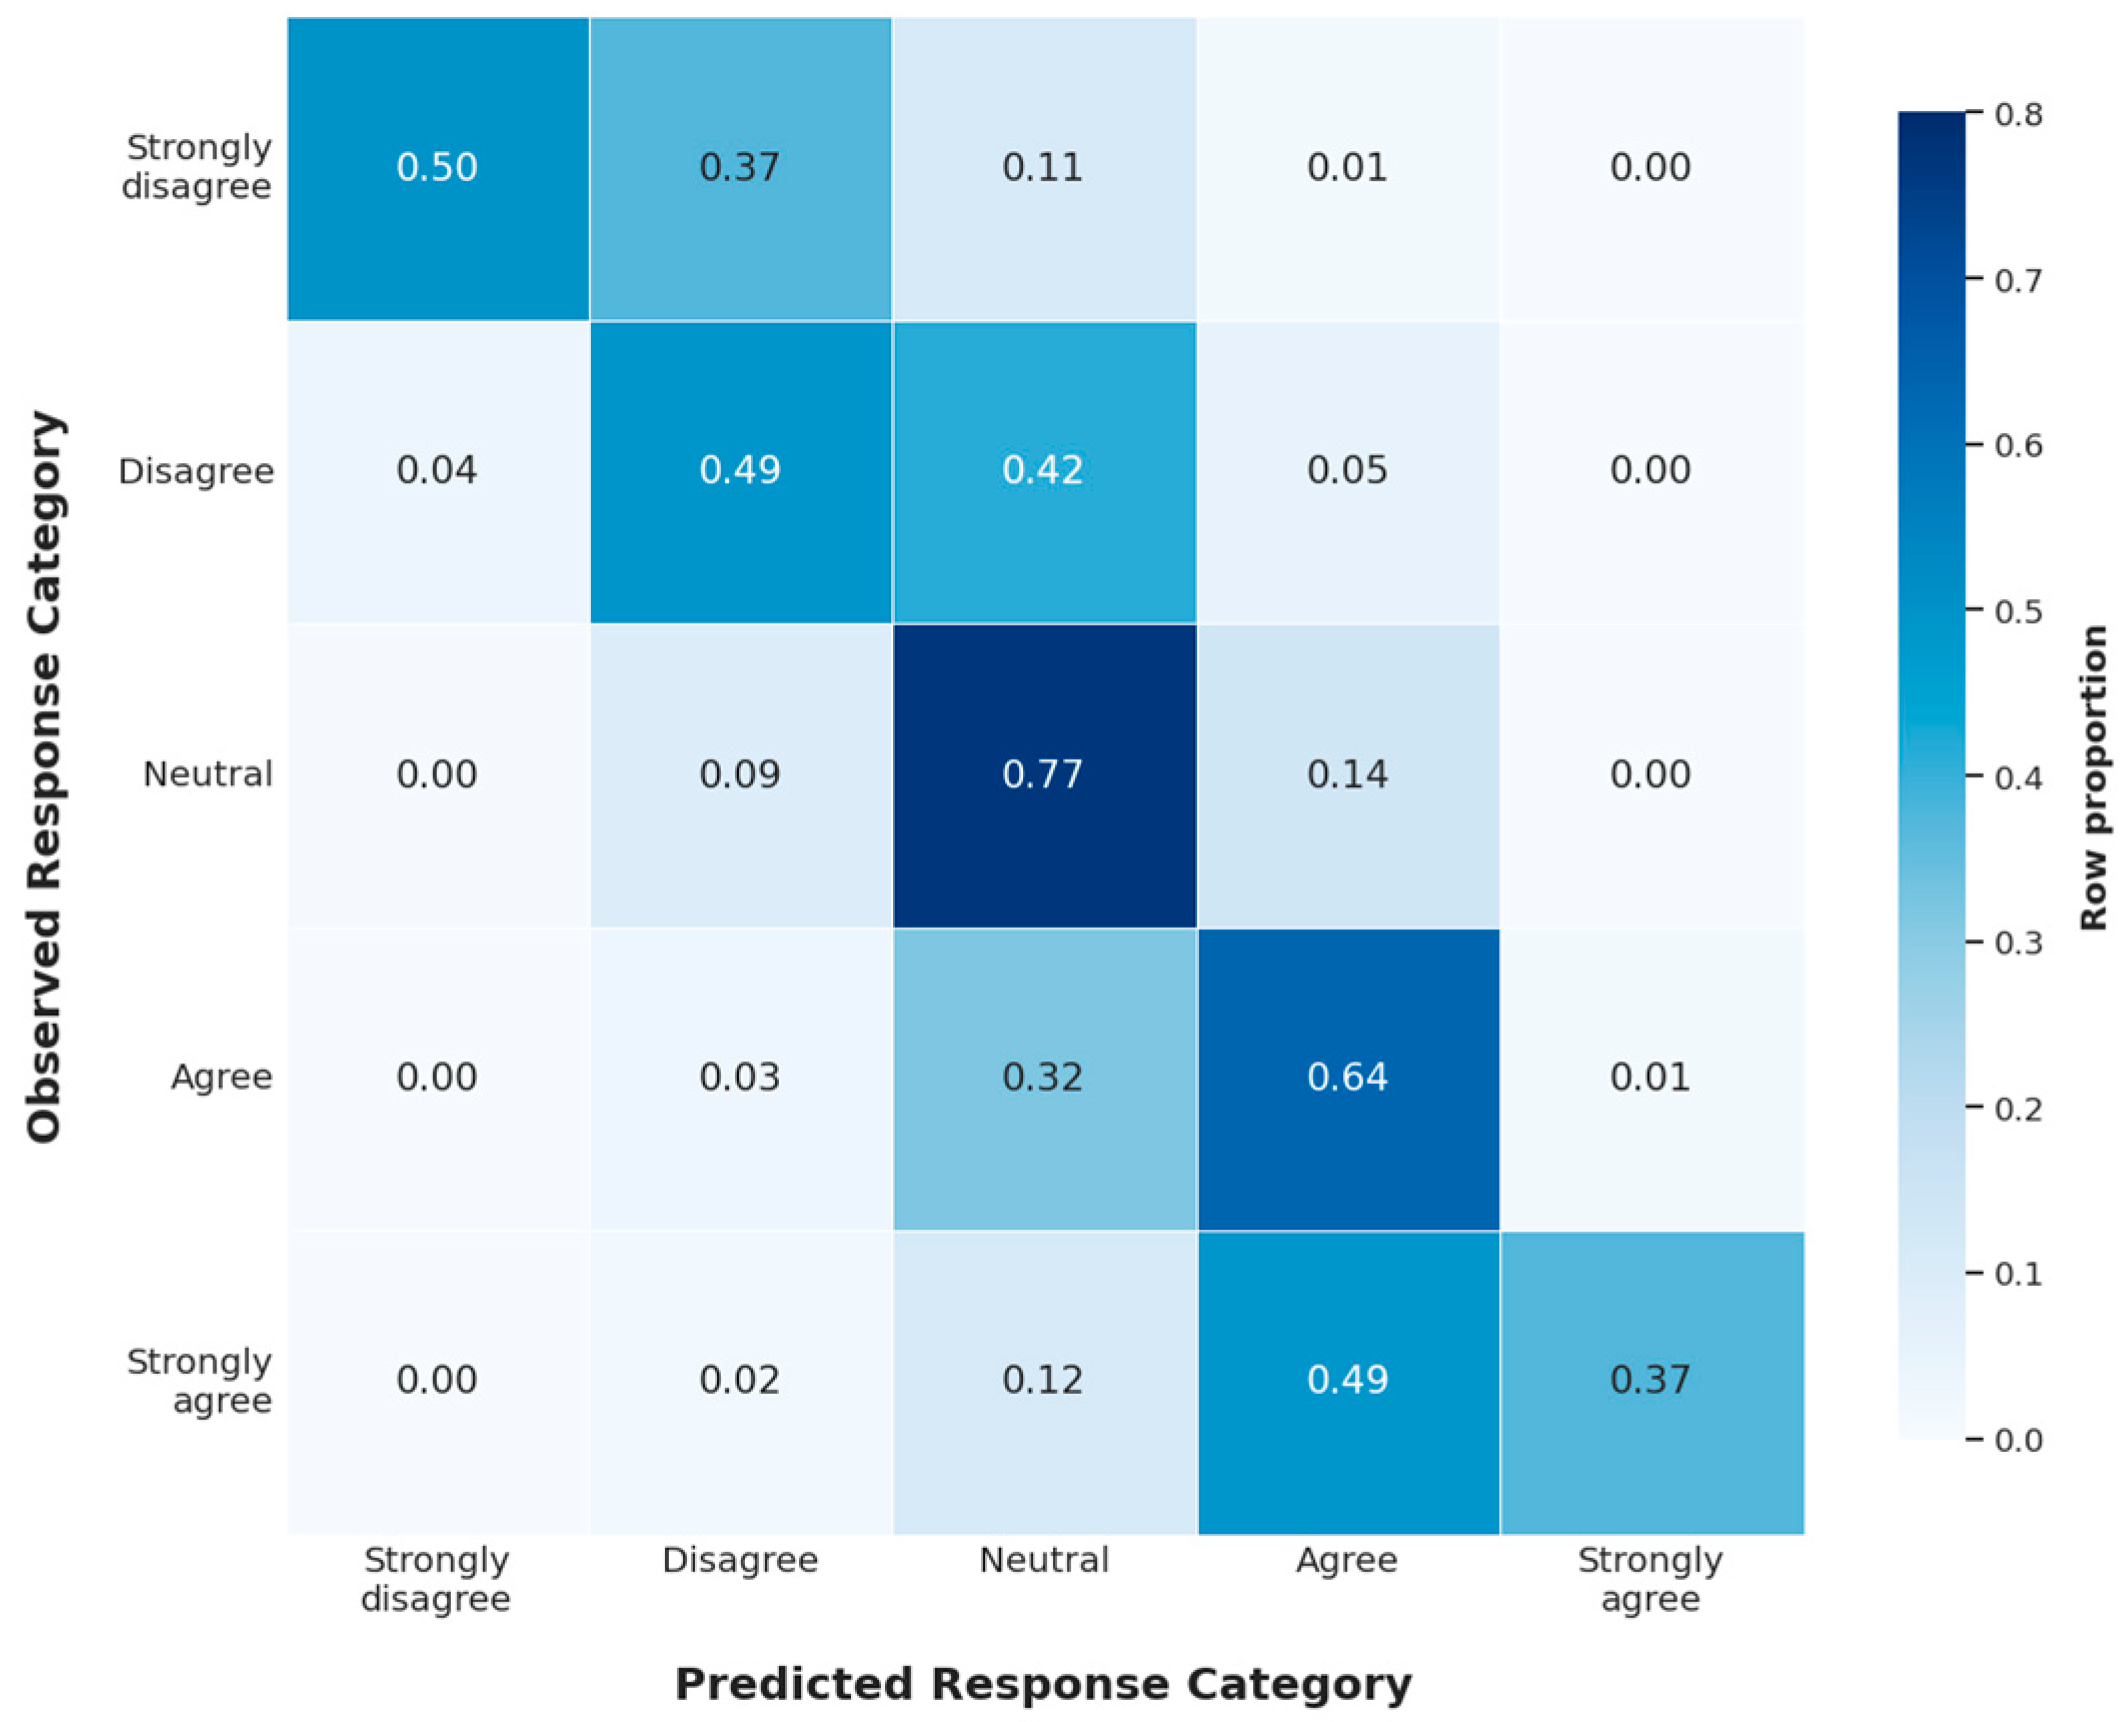
Figure 3.
Confusion Matrix (Service Accessibility Model).
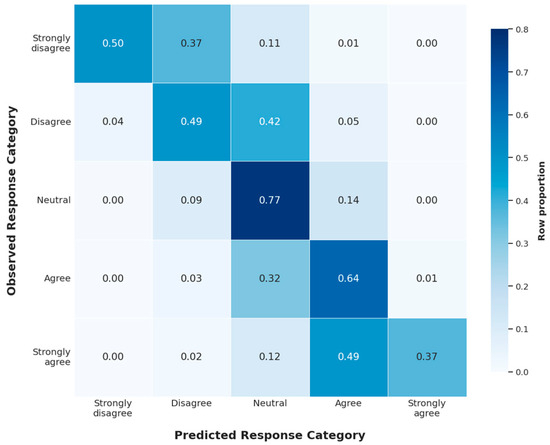
The Service Accessibility model (Figure 3) exhibited a similar pattern where Category 3 again showed the highest classification rate at 77%, followed by Category 4 at 64%. Categories 1 and 2 achieved accuracies of 50% and 49%, respectively, while Category 5 had the lowest accuracy at 37%. Misclassification was similarly concentrated between neighboring categories, with Category 5 most often classified as Category 4 and Category 2 frequently classified as Category 3. Category 1 was also frequently classified as Category 2, while confusion across more distant response categories remained minimal.
4.3.2. Feature Importance
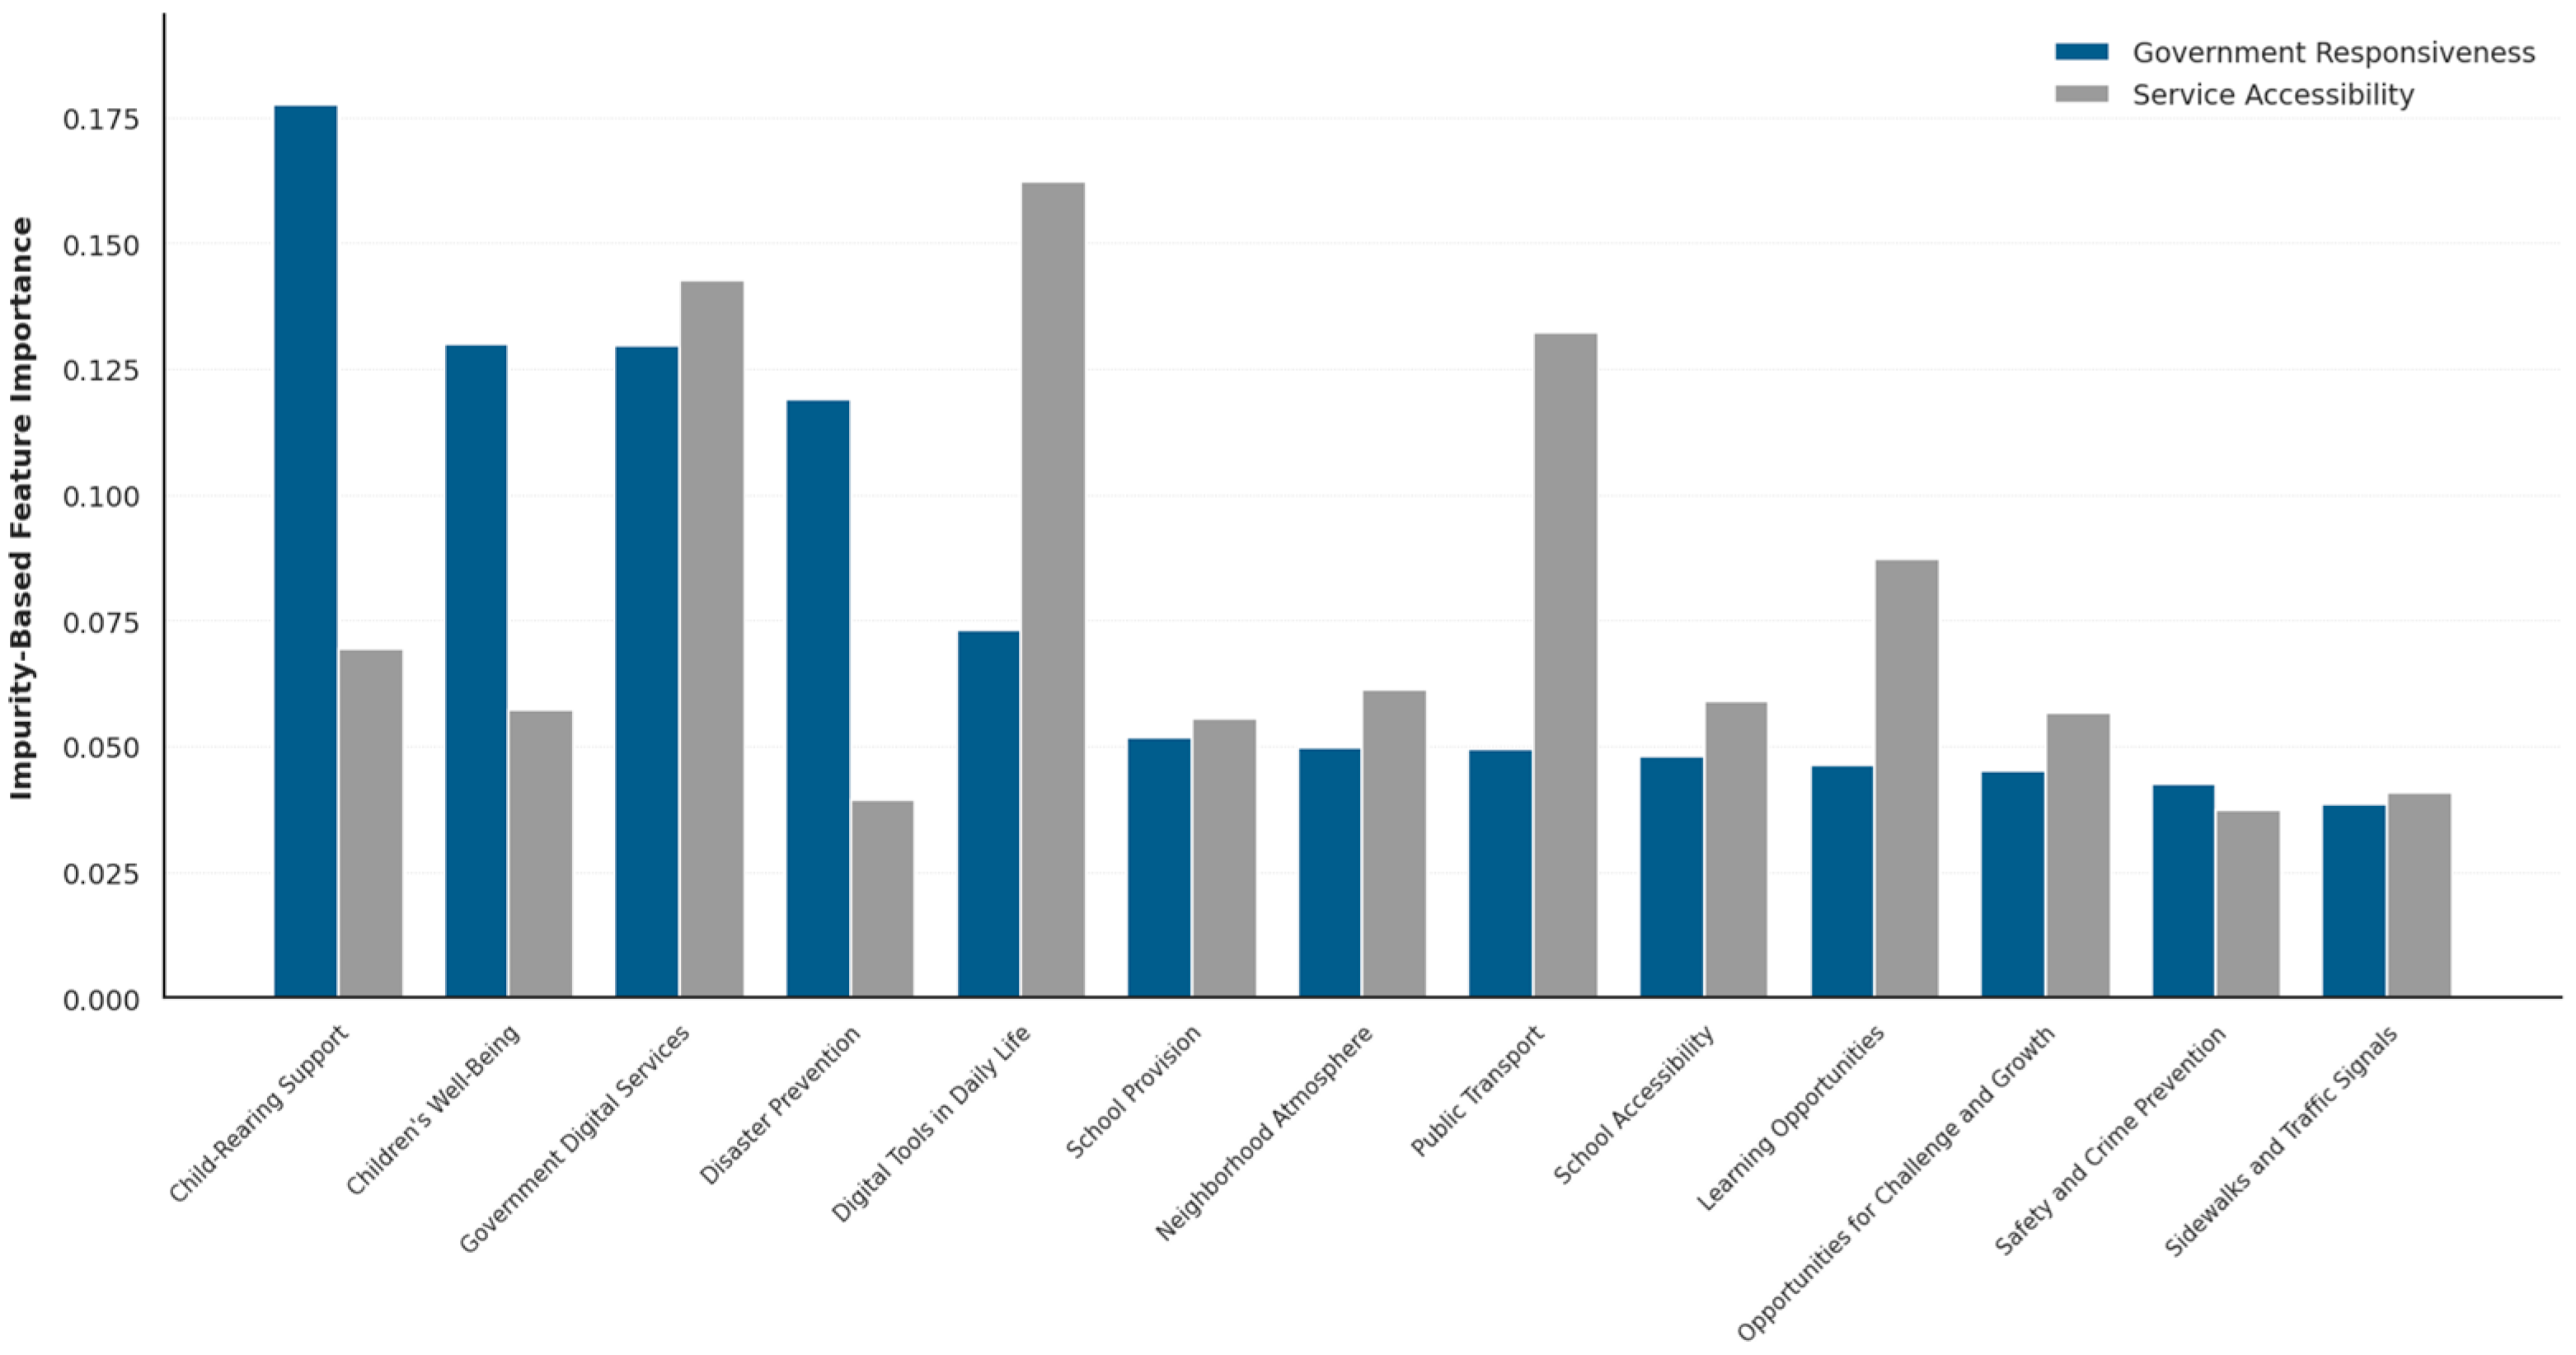
Feature importance was evaluated for both models to assess the relative contribution of predictors to classification performance. Ranked feature-importance values are presented in Table 4, with a direct visual comparison provided in Figure 4. The Random Forest results indicate that child-rearing support was the most influential predictor of Government Responsiveness (0.1775), followed by children’s well-being (0.1299), government digital services (0.1297), and disaster prevention (0.1190). Digital tools in daily life ranked fifth (0.0731). The remaining variables, including school provision, neighborhood atmosphere, public transport, school accessibility, learning opportunities, opportunities for challenge and growth, safety and crime prevention, and sidewalks and traffic signals, had importance values ranging from 0.0383 to 0.0517.
Table 4.
Feature Importance Rankings.
Figure 4.
Comparison of Feature Importance Scores.
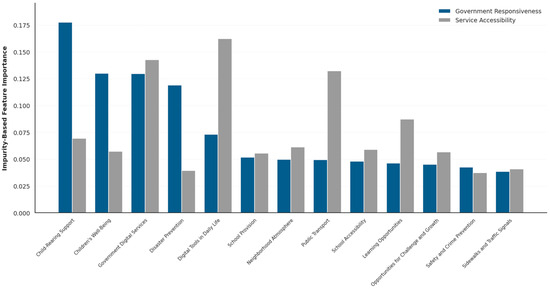
For the Service Accessibility model, the highest-ranked variable was digital tools in daily life (0.1621), followed by government digital services (0.1425) and public transport (0.1321). Learning opportunities ranked fourth (0.0871), followed by child-rearing support (0.0694). Neighborhood atmosphere, school accessibility, children’s well-being, opportunities for challenge and growth, and school provision occupied the middle ranks, with importance values ranging from 0.0554 to 0.0613. Sidewalks and traffic signals (0.0409), disaster prevention (0.0392), and safety and crime prevention (0.0373) were the lowest-ranked predictors. The comparison in Figure 4 shows that child-rearing support, children’s well-being, and disaster prevention were substantially more prominent in the Government Responsiveness model, whereas digital tools in daily life, public transport, and learning opportunities were more prominent in the Service Accessibility model. Government digital services were highly ranked in both models.
Permutation importance provided an additional assessment of predictor importance and showed partial agreement with the impurity-based Random Forest rankings (Table 5). For the Government Responsiveness model, child-rearing support had the highest mean permutation importance (0.0167), followed by disaster prevention (0.0145), government digital services (0.0134), children’s well-being (0.0090), and school accessibility (0.0058). In contrast, public transport, which ranked eighth under impurity-based importance, had a slightly negative mean permutation importance (−0.0015) and ranked last under the permutation measure. This suggests that public transport contributed to tree splitting but did not provide a distinct improvement in held-out predictive accuracy after the other predictors were considered.
Table 5.
Permutation Importance Rankings.
For the Service Accessibility model, the two methods showed closer, although not complete, agreement. Digital tools in daily life remained the highest-ranked predictor under permutation importance (0.0137), followed by public transport (0.0121) and government digital services (0.0121). Learning opportunities ranked fourth (0.0051), followed by school accessibility (0.0047) and child-rearing support (0.0046). Because public transport and government digital services had the same value after rounding, their reported ranks reflect differences in the underlying unrounded estimates. The permutation results reinforce the prominence of digital-service variables in both models while also showing that exact rankings depend on the importance measure used.
Comparison across models shows that government digital services ranked among the highest-importance variables in both models, placing third in the Government Responsiveness model and second in the Service Accessibility model. Child-rearing support and children’s well-being ranked higher in the Government Responsiveness model (first and second) than in the Service Accessibility model (fifth and eighth). Digital tools in daily life ranked first in the Service Accessibility model and fifth in the Government Responsiveness model. Disaster prevention ranked fourth in the Government Responsiveness model and twelfth in the Service Accessibility model.
As shown in Table 6, pairwise correlation strength did not consistently correspond to multivariable feature importance. For Government Responsiveness, child-rearing support had the strongest correlation among the included predictors (ρ = 0.543) and ranked first in impurity-based importance. Public transport had a substantially weaker pairwise association (ρ = 0.358) and ranked eighth in impurity-based importance. Thus, the revised results no longer indicate that public transport was the leading multivariable predictor of Government Responsiveness. Instead, the correlation and impurity results were broadly aligned for child-rearing support, children’s well-being, government digital services, and disaster prevention, although the precise ordering differed.
Table 6.
Comparison of Correlations and Random Forest Feature Importance.
For Service Accessibility, the two approaches were more closely aligned among the leading digital and transportation variables. Digital tools in daily life had both the strongest correlation with the outcome (ρ = 0.563) and the highest impurity-based feature importance. Government digital services and public transport also ranked highly under both approaches. By contrast, opportunities for challenge and growth had a relatively strong correlation with Service Accessibility (ρ = 0.503) but ranked ninth in impurity-based importance.
The comparison between impurity-based and permutation importance (Table 7) provides an additional qualification. Specifically, the two methods identified overlapping groups of influential predictors, but their relative rankings differed, particularly in the Government Responsiveness model. For example, public transport ranked eighth under impurity importance but ranked last under permutation importance, whereas child-rearing support and disaster prevention remained prominent under both measures. In the Service Accessibility model, digital tools in daily life remained first under both measures, while government digital services and public transport also remained among the leading predictors. The variation across measures likely reflects, at least in part, overlapping predictive information among correlated variables, making the broader pattern more informative than the exact ordering of individual predictors.
Table 7.
Comparison of Impurity-Based Random Forest and Permutation Importance.
4.3.3. Sensitivity and Robustness Analyses
Several additional analyses assessed whether the main findings depended on sample definition, demographic composition, validation strategy, or model choice. The alternative Random Forest results are summarized in Table 8, with full ordered-logit estimates reported in Table S2. Re-estimating the models on the full analysis-specific sample of 86,420 respondents produced results close to those from the common analytical sample of 66,085. For Government Responsiveness, accuracy increased from 0.674 to 0.685, while balanced accuracy and macro F1 remained nearly unchanged. For Service Accessibility, accuracy increased from 0.652 to 0.655, with similarly small changes in the other metrics suggesting the common-sample restriction did not materially affect performance.
Table 8.
Sensitivity and Robustness Performance Results.
Adding age and gender also produced only minor changes. Accuracy remained 0.674 for Government Responsiveness and increased from 0.652 to 0.654 for Service Accessibility. The Service Accessibility importance rankings were also highly similar across the primary and demographic-adjusted specifications (Spearman’s ρ = 0.945). Municipality-grouped five-fold validation produced comparable results with accuracy at 0.678 for Government Responsiveness and 0.658 for Service Accessibility, with balanced accuracy, macro F1, and quadratic weighted kappa remaining close to the primary estimates, suggesting that performance was not driven simply by respondents from the same municipality appearing in both training and test data.
The ordered-logit benchmark also supported the broad substantive pattern. For Government Responsiveness, the largest positive coefficients were observed for child-rearing support, government digital services, disaster prevention, and children’s well-being. For Service Accessibility, the largest coefficients were observed for public transport, government digital services, and digital tools in daily life. Public transport was the clearest difference across methods for Government Responsiveness, with a small negative ordered-logit coefficient despite moderate impurity-based Random Forest importance. The main results were broadly stable across alternative samples, demographic adjustment, municipality-grouped validation, and an ordinal benchmark.
5. Discussion
5.1. Structure of Local Government Perceptions
Residents’ perceptions of local government performance are associated with a broad and overlapping set of service-related and social factors, and study findings indicate that differences between the two outcomes are associated less with entirely distinct sets of predictors than with differences in the relative predictive importance of shared conditions. This distinction provides a more precise understanding of how perceptions of local government are structured and extends existing research that emphasizes the multidimensional nature of citizen satisfaction and institutional trust (Van de Walle & Bouckaert, 2003; Van Ryzin, 2007; Berg & Johansson, 2020). Across both Service Accessibility and Government Responsiveness, several of the same policy domains remained relevant, including digital services, transport, education, and neighborhood conditions. This overlap is consistent with research suggesting that citizens’ evaluations of government draw on multiple aspects of their lived experience rather than isolated policy domains (Szabó, 2026; Cazzuffi & Retamal, 2026).
Despite this shared empirical foundation, the analysis highlights meaningful differences in the predictive structure of the two outcomes. Service Accessibility was more strongly characterized by variables reflecting the usability and convenience of service systems, particularly digital tools in daily life, government digital services, public transport, and learning opportunities, a pattern which is consistent with service-quality research emphasizing the importance of functional performance and user experience in evaluations of public services (Almashekhi et al., 2026). By contrast, the Government Responsiveness model placed greater relative importance on child-rearing support, children’s well-being, government digital services, and disaster prevention. This broader combination of service-related, family-community-oriented, and protective policy domains is consistent with the possibility that judgments of responsiveness draw on wider assessments of whether local government recognizes and addresses community needs.
These findings support an interpretive proposition rather than establishing two distinct psychological mechanisms, in that one possible interpretation is that Service Accessibility reflects a more experiential form of evaluation grounded in direct encounters with service systems, whereas Government Responsiveness may draw more heavily on broader contextual cues about government priorities and attentiveness. Similar distinctions appear in research on institutional trust and citizen satisfaction, where evaluations combine performance-based assessments with broader perceptions of fairness and inclusion (Van de Walle & Migchelbrink, 2020; Yasmin & Uddin, 2026). While the present analysis does not directly test how residents translate these experiences into judgments of government, it identifies differentiated predictive structures across two related outcomes. This has implications for analyses such as the LWCI, where composite indices may obscure differences across evaluative outcomes. By examining Service Accessibility and Government Responsiveness separately, the study shows that shared policy-related conditions can contribute differently to distinct dimensions of local government evaluation.
5.2. The Role of Public Services in the Perception of Local Government
The findings indicate that public services are associated with perceptions of local government both as policy outputs and as recurring points of contact through which residents may evaluate government competence and attentiveness. In the case of Service Accessibility, evaluations were associated with more immediate and observable features of service systems, particularly public transport, government digital services, and digital tools in daily life. The prominence of public transport and digital services is consistent with the relevance of highly visible and frequently used services. Prior research similarly links repeated service encounters with satisfaction, particularly when services reduce friction and align with user expectations (Ismael et al., 2023; Heuberger & Schwab, 2021). These patterns suggest that everyday service experiences may contribute to how residents evaluate local government, although the present analysis does not establish that service improvements directly produce more positive evaluations.
Furthermore, the role of public services may extend beyond their functional performance, and the results are consistent with the interpretation that service experiences can also serve as cues for broader evaluations of local government. In evaluations of responsiveness, services may be considered not only in terms of their technical quality but also as possible indicators of government priorities and attentiveness to public needs. This is particularly evident in the importance of child-rearing support, children’s well-being, disaster prevention, and government digital services. These domains are consistent with broader judgments about whether local government is attentive to family needs, community welfare, and collective security and this dual role suggests that service quality may relate differently to the two outcomes. Specifically, accessibility is closely associated with the usability and availability of services, whereas the relationship between service performance and responsiveness may depend on whether services are perceived as aligned with community needs, consistent with research distinguishing services experienced as responsive to citizens’ circumstances from generic administrative outputs (Christensen & Lægreid, 2005).
The results also indicate that individual service domains were not equally informative across the two outcomes. Public transport was consistently important for Service Accessibility, whereas its contribution to Government Responsiveness was less stable across importance measures and the ordered-logit benchmark. Government digital services showed greater consistency across both outcomes. This suggests that some services may be more closely tied to a particular dimension of evaluation, while others may contribute more broadly to residents’ assessments of local government. In the Japanese governance context, repeated interactions with public services may inform both direct assessments of accessibility and wider judgments of responsiveness, although the present cross-sectional analysis cannot establish the effects of particular service encounters or policy changes (Goldfinch et al., 2022; Oyama, 2024; Noda, 2018).
5.3. Machine Learning Insights
The application of ML in this study provides additional insight into citizens’ evaluations of local government by showing how the relative importance of common predictors differs across perception outcomes. Correlation analysis identifies the strength and direction of pairwise relationships between individual variables and each outcome, but it does not show how those variables contribute when considered together. The Random Forest models address this limitation by evaluating the relative contribution of predictors within a multivariable analysis. This makes the approach useful for comparing the predictive structure of Government Responsiveness and Service Accessibility and for identifying whether the same policy-related factors differ in importance across the two models (James et al., 2020).
A key finding is that the two outcomes differ less in the presence of predictors than in the relative importance assigned to those predictors across the models, and the broad patterns identified by the Random Forest models were also generally consistent with the ordered-logit benchmark, despite exact rankings and coefficient directions not being identical across methods. These results suggest that the two outcomes are associated with a broadly shared set of policy-related factors, but that those factors contribute differently to each dimension of local government evaluation. Similar patterns have been reported in recent ML studies of well-being, where feature importance analysis has revealed differences in predictive structure that are not readily apparent from conventional regression-based approaches alone (Qin et al., 2025).
The comparison between impurity-based and permutation importance also qualifies the interpretation of the feature rankings. Although the two measures identified overlapping groups of influential predictors, they did not always assign those predictors the same relative position, particularly in the Government Responsiveness model. Since several predictors were moderately or strongly correlated, these differences may reflect shared or redundant predictive information. More broadly, explainable machine-learning research shows that feature-importance patterns can help reveal differences in predictive structure across models, while still requiring caution in the interpretation of individual rankings (Noh et al., 2025). Exact rankings should therefore be interpreted cautiously, with greater emphasis placed on predictors that remained prominent across methods.
The value of the Random Forest models in this study is interpretive rather than simply predictive. Although the two models achieved similar levels of classification accuracy, their main contribution lies in showing how the relative importance of policy-related variables differs between Government Responsiveness and Service Accessibility. The results suggest that these two dimensions are shaped less by entirely different sets of predictors than by different patterns of importance among many of the same factors. This is consistent with recent work arguing that machine learning can contribute to public policy research not only through prediction, but also by producing interpretable evidence from complex data (Narayanan et al., 2025). In this study, combining correlation analysis, Random Forest classification, and ordered logistic regression provides a fuller account of citizen evaluations than any one method alone. The partial convergence across the analyses strengthens confidence in several recurring predictors, while differences in rankings and coefficient direction, especially for Government Responsiveness, caution against treating any exact ordering as definitive.
5.4. Policy Implications
The findings of this study have several implications for how local governments use multivariate frameworks such as the LWCI to assess policy. Specifically, these frameworks provide a broad basis for identifying associations between local conditions and well-being outcomes, while machine learning adds a way to compare the relative predictive importance of individual factors. Applied together, these approaches can help identify policy domains that merit closer examination and support more differentiated assessment across distinct dimensions of local government evaluation.
Across both outcomes, service-related factors were among the most important predictors, underscoring the relevance of visible and frequently used public services. Government digital services ranked highly in both models, while public transport was especially important for Service Accessibility. While these findings do not show that investment in these areas will directly improve satisfaction or perceptions of government performance, they are able to identify those areas that warrant closer policy attention. The results further suggest that the two outcomes should not be treated as interchangeable in that Service Accessibility was shaped more strongly by factors related to usability, convenience, and access, whereas Government Responsiveness reflected a broader mix of service-related, family-oriented, and protective policy domains, including child-rearing support, children’s well-being, and disaster prevention. Distinguishing between these patterns may help local governments assess which factors are associated with specific service experiences and which are linked to broader perceptions of responsiveness.
While the findings have clear policy relevance, several limitations should be kept in mind. Since the study is cross-sectional, the results identify associations rather than causal relationships, and both the outcomes and predictors are based on self-reported perceptions, some of which capture conceptually related constructs. The primary Random Forest models treat the five response categories as nominal classes, whereas the supplementary ordered-logit models preserve their ordinal structure, and although the broad substantive patterns were similar across the two approaches, the exact rankings and coefficient directions were not always the same. As such, the models are best viewed as complementary rather than as producing directly equivalent estimates. Furthermore, municipality-grouped cross-validation produced performance estimates close to those from the primary individual-level validation, which reduces concern that the results were driven mainly by respondents from the same municipality appearing in both the training and test data. Even so, the analysis remains respondent-level and does not estimate municipality-specific effects or account for municipality-level policy differences.
Models adjusted for age and gender also produced only minor changes in performance and importance structure, although the available demographic controls were limited, and the study includes no objective measures of service quality. The primary analyses used a common complete-case sample that excluded respondents who were missing only the neighborhood-happiness item, which may have introduced some demographic selectivity. However, comparisons between retained and excluded respondents, together with analysis-specific Random Forest models using all 86,420 eligible respondents, indicated that this restriction did not materially change the main predictive results. Finally, the findings are specific to the Japanese LWCI context and should be generalized cautiously. Future research could use longitudinal and objective service data, incorporate municipality-level variation where data-use conditions allow, apply additional explainable machine-learning approaches, and compare results across national contexts.
6. Conclusions
This study demonstrates that residents’ perceptions of local government performance are associated with a complex and multidimensional set of factors spanning service delivery, infrastructure, and broader social conditions. However, the findings indicate that differences between the two perception outcomes are less related to entirely distinct sets of variables than to differences in the relative predictive importance of shared factors. While service-related variables such as Government digital services were prominent across both outcomes, other predictors differed in their relative contribution. Service Accessibility was more strongly associated with evaluations of service usability and convenience, whereas Government Responsiveness was associated with a broader combination of service-related and community-level variables. These results highlight the limitations of treating local government performance as a single composite construct, as doing so may obscure important differences between these two dimensions of local government evaluation.
By integrating ML classification models with conventional analytical approaches, this study provides additional insight into the relative predictive importance of policy-related variables across the two perception outcomes. Rather than identifying entirely new predictors, the ML analysis showed that shared policy-related factors suggested different patterns of relative importance across the two outcomes. Additional analyses supported this broad distinction, although exact predictor rankings varied across methods. From a policy perspective, the differing predictor profiles may justify closer assessment of distinct policy domains associated with Service Accessibility and Government Responsiveness. They also highlight the value of data-driven approaches for identifying areas that warrant further investigation and for informing policy priorities based on the factors most strongly associated with residents’ evaluations.
Supplementary Materials
The following supporting information can be downloaded at: https://www.mdpi.com/article/10.3390/admsci16080400/s1, Table S1. Variable Overview by Domain. Table S2. Ordered-logit predictor estimates.
Author Contributions
Conceptualization, B.B. and H.M.; methodology, B.B.; formal analysis, B.B.; data curation, B.B.; writing—original draft preparation, B.B.; writing—review and editing, B.B. and H.M.; visualization, B.B.; supervision, H.M. All authors have read and agreed to the published version of the manuscript.
Funding
This research received no external funding.
Institutional Review Board Statement
Not applicable.
Informed Consent Statement
Not applicable.
Data Availability Statement
Requests to access the datasets should be directed to the Digital Agency of Japan.
Acknowledgments
We acknowledge support by the Open Access Publication Fund of TU Berlin.
Conflicts of Interest
The authors declare no conflicts of interest.
Abbreviation
The following abbreviation is used in this manuscript:
| LWCI | Liveable Well-Being City Indicator |
References
- Akinboade, O. A., Kinfack, E. C., & Mokwena, M. P. (2024). An analysis of citizen satisfaction with public service delivery in the Sedibeng district municipality of South Africa. International Journal of Social Economics, 39(3), 182–199. [Google Scholar] [CrossRef] [Scilit]
- Alessandro, M., Lagomarsino, B. C., Scartascini, C., Streb, J., & Torrealday, J. (2020). Transparency and trust in government: Evidence from a survey experiment. World Development, 135, 105223. [Google Scholar] [CrossRef] [Scilit]
- Almashekhi, A. S. S., Mohamad, A. D., & Khafidz, H. A. (2026). Digital transformation initiatives and beneficiaries’ satisfaction in public services: The mediating roles of service accessibility and ease of use. International Review of Management and Marketing, 16(3), 386–394. [Google Scholar] [CrossRef] [Scilit]
- Athey, S. (2018). The impact of machine learning on economics. In A. Agrawal, J. Gans, & A. Goldfarb (Eds.), The economics of artificial intelligence: An agenda (pp. 507–547). University of Chicago Press. [Google Scholar] [CrossRef] [Scilit]
- Berg, M., & Johansson, T. (2020). Building institutional trust through service experiences: Private versus public provision matter. Journal of Public Administration Research and Theory, 30(2), 290–306. [Google Scholar] [CrossRef] [Scilit]
- Breiman, L. (2001). Random forests. Machine Learning, 45(1), 5–32. [Google Scholar] [CrossRef] [Scilit]
- Cazzuffi, C., & Retamal, P. (2026). Gendered perceptions of public services: Quality, equality of treatment, and corruption in Chile. Public Administration, 104(1), 128–144. [Google Scholar] [CrossRef] [Scilit]
- Christensen, T., & Lægreid, P. (2005). Trust in government: The relative importance of service satisfaction, political factors, and demography. Public Performance & Management Review, 28(4), 487–511. [Google Scholar]
- Chung, I. H., Williams, D. W., & Do, M. R. (2022). For better or worse? Revenue forecasting with machine learning approaches. Public Performance & Management Review, 45(5), 1133–1154. [Google Scholar] [CrossRef] [Scilit]
- Digital Agency of Japan. (2025). Liveable well-being city indicators (LWCI). Digital Agency of Japan. [Google Scholar]
- Fioramonti, L., Coscieme, L., Costanza, R., Kubiszewski, I., Trebeck, K., Wallis, S., Roberts, D., Mortensen, L. F., Pickett, K. E., Wilkinson, R., Ragnarsdottir, K. V., McGlade, J., Lovins, H., & De Vogli, R. (2022). Wellbeing economy: An effective paradigm to mainstream post-growth policies? Ecological Economics, 192, 107261. [Google Scholar] [CrossRef] [Scilit]
- General Incorporated Association Smart City Institute Japan. (2024). Livable well-being city indicator (LWCI). Smart City Institute Japan. [Google Scholar]
- Gerrits, L. (2021). The soul of a new machine: Self-learning algorithms in public administration. Information Polity, 26(3), 237–250. [Google Scholar] [CrossRef] [Scilit]
- Goldfinch, S., Yamamoto, K., & Aoyagi, S. (2022). Does process matter more for predicting trust in government? Participation, performance, and process, in local government in Japan. International Review of Administrative Sciences, 89(3), 842–863. [Google Scholar] [CrossRef] [Scilit]
- Heuberger, M., & Schwab, C. (2021). Challenges of digital service provision for local governments from the citizens’ view: Comparing citizens’ expectations and their experiences of digital service provision. In T. Bergström, J. Franzke, S. Kuhlmann, & E. Wayenberg (Eds.), The future of local self-government. Palgrave Studies in Sub-National Governance. Palgrave Macmillan. [Google Scholar] [CrossRef] [Scilit]
- Ismael, K., Esztergár-Kiss, D., & Duleba, S. (2023). Evaluating the quality of the public transport service during the COVID-19 pandemic from the perception of two user groups. European Transport Research Review, 15, 5. [Google Scholar] [CrossRef] [Scilit] [PubMed]
- James, O., & Moseley, A. (2020). Does performance information about public services affect citizens’ perceptions, satisfaction, and voice behaviour? Field experiments with absolute and relative performance information. Public Administration, 92(2), 493–511. [Google Scholar] [CrossRef] [Scilit]
- James, O., Olsen, A. L., Moynihan, D. P., & Van Ryzin, G. G. (2020). Behavioral public performance: How people make sense of government metrics. Cambridge University Press. [Google Scholar] [CrossRef] [Scilit]
- Janssen, M., Hartog, M., Matheus, R., Ding, A. Y., & Kuk, G. (2022). Will algorithms blind people? The effect of explainable AI and decision-makers’ experience on AI-supported decision-making in government. Social Science Computer Review, 40(2), 478–493. [Google Scholar] [CrossRef] [Scilit]
- Kyriazos, T., & Poga, M. (2024). Application of machine learning models in social sciences: Managing nonlinear relationships. Encyclopedia, 4, 1790–1805. [Google Scholar] [CrossRef] [Scilit]
- Mouratidis, K. (2021). Urban planning and quality of life: A review of pathways linking the built environment to subjective well-being. Cities, 115, 103229. [Google Scholar] [CrossRef] [Scilit]
- Narayanan, A., Stewart, T., Duncan, S., & Pacheco, G. (2025). Using machine learning to explore the efficacy of administrative variables in prediction of subjective-wellbeing outcomes in New Zealand. Scientific Reports, 15(1), 6831. [Google Scholar] [CrossRef] [Scilit] [PubMed]
- Noda, Y. (2018). Citizen satisfaction with government services in Japan. In A. Farazmand (Ed.), Global encyclopedia of public administration, public policy, and governance. Springer. [Google Scholar] [CrossRef] [Scilit]
- Noh, H., Kim, H., & Kim, H. (2025). Explainable machine learning for predicting computational thinking proficiency in K–12 students using national-level data. IEEE Access, 13, 198716–198733. [Google Scholar] [CrossRef] [Scilit]
- OECD. (2020). How’s life? 2020: Measuring well-being. OECD Publishing. [Google Scholar] [CrossRef] [Scilit]
- OECD. (2023). Drivers of trust in public institutions: Findings from the 2021 OECD survey on drivers of trust in public institutions. OECD Publishing. [Google Scholar]
- OECD. (2024). How’s life? 2024: Measuring well-being. OECD Publishing. [Google Scholar] [CrossRef] [Scilit]
- Oyama, K. (2024). Structure of trust in government and public administration in Japan. In K. Agata, H. Inatsugu, & H. Shiroyama (Eds.), Public administration in Japan. Governance and Public Management. Palgrave Macmillan. [Google Scholar] [CrossRef] [Scilit]
- Qin, T., Fu, R., Yao, P., & Wei, P. (2025). The influence of higher education based on machine learning on subjective well-being. Scientific Reports, 15, 35129. [Google Scholar] [CrossRef] [Scilit] [PubMed]
- Reddick, C. G., Perlman, B. J., & Demir, T. (2022). Citizen satisfaction with public service delivery: A test of alternative theories. Canadian Public Administration, 65(2), 352–371. [Google Scholar] [CrossRef] [Scilit]
- Sanders, K., & Canel, M. J. (2015). Mind the gap: Local government communication strategies and Spanish citizens’ perceptions of their cities. Public Relations Review, 41(5), 777–784. [Google Scholar] [CrossRef] [Scilit]
- Shin, D. (2021). The effects of explainability and causability on perception, trust and acceptance: Implications for explainable AI. International Journal of Human–Computer Studies, 146, 102551. [Google Scholar] [CrossRef] [Scilit]
- Stiglitz, J. E., Sen, A., & Fitoussi, J.-P. (2009). Report by the commission on the measurement of economic performance and social progress. Commission on the Measurement of Economic Performance and Social Progress. [Google Scholar]
- Szabó, T. (2026). Role of public services in maintaining the population of settlements. Regional Statistics, 16(2), 279–300. [Google Scholar] [CrossRef] [Scilit]
- Turesson, K., Andersen, R., Nilson, F., & Henrekson, E. (2025). Exploring the relationship between rescue service response times, citizen satisfaction and ownership of fire safety equipment in Sweden. Fire and Materials, 50(1), 123–131. [Google Scholar] [CrossRef] [Scilit]
- Van de Walle, S., & Bouckaert, G. (2003). Public service performance and trust in government: The problem of causality. International Journal of Public Administration, 26(8–9), 891–913. [Google Scholar] [CrossRef] [Scilit]
- Van de Walle, S., & Migchelbrink, K. (2020). Institutional quality, corruption, and impartiality: The role of process and outcome for citizen trust in public administration in 173 European regions. Journal of Economic Policy Reform, 25(1), 9–27. [Google Scholar] [CrossRef] [Scilit]
- Van Ryzin, G. G. (2007). Pieces of a puzzle: Linking government performance, citizen satisfaction, and trust. Public Performance & Management Review, 30(4), 521–535. [Google Scholar] [CrossRef] [Scilit]
- Wesz, J. G. B., Miron, L. I. G., Delsante, I., & Tzortzopoulos, P. (2023). Urban quality of life: A systematic literature review. Urban Science, 7(2), 56. [Google Scholar] [CrossRef] [Scilit]
- Yasmin, S., & Uddin, M. N. (2026). Effective people’s participation in enhancing citizen trust in Bangladesh’s local government institutions. Multidisciplinary Reviews, 9(9), 2026363. [Google Scholar] [CrossRef] [Scilit]

Disclaimer/Publisher’s Note: The statements, opinions and data contained in all publications are solely those of the individual author(s) and contributor(s) and not of MDPI and/or the editor(s). MDPI and/or the editor(s) disclaim responsibility for any injury to people or property resulting from any ideas, methods, instructions or products referred to in the content. |
© 2026 by the authors. Licensee MDPI, Basel, Switzerland. This article is an open access article distributed under the terms and conditions of the Creative Commons Attribution (CC BY) license.