


Abstract
Uranium is a naturally occurring radioactive heavy metal, and drinking water and food are the primary sources of non-occupational exposure for the general population. The aim of the present study was to evaluate urinary uranium concentrations among cancer patients and healthy residents living in uranium legacy-affected areas and to compare them with those of individuals residing in a region with a more favorable radiological environment, accounting for urinary creatinine levels. An observational human biomonitoring study was conducted among 80 adults divided into four groups (n = 20 each): cancer patients and healthy residents from the exposed area and cancer patients and healthy residents from the comparison area. Twenty-four-hour urine samples were analyzed for uranium using inductively coupled plasma mass spectrometry, and urinary creatinine was measured using the kinetic Jaffe method. Urinary uranium concentrations ranged from 0.01 to 1.30 µg/L, with the highest values observed in cancer patients from the exposed area. After creatinine adjustment, median uranium concentrations were 0.0974 µg/g creatinine in exposed cancer patients, 0.0888 µg/g creatinine in exposed healthy residents, 0.0515 µg/g creatinine in comparison-area cancer patients, and 0.0607 µg/g creatinine in comparison-area healthy residents. Significant differences were observed between exposed and comparison populations among both cancer patients (p = 0.0066) and healthy residents (p = 0.0499). Residence in the exposed area was positively associated with urinary uranium levels (ρ = 0.292, p = 0.012). These findings suggest higher internal uranium exposure among residents of uranium legacy-affected areas and support the use of urinary uranium as a biomarker of environmental exposure. This study contributes to the assessment of internal uranium exposure in residents of uranium legacy-affected areas, including both cancer patients and healthy residents. However, the findings should be interpreted as differences in exposure biomarkers and do not establish a causal relationship between uranium exposure and cancer.
1. Introduction
Uranium is a naturally occurring radioactive heavy metal widely distributed in the Earth’s crust and present in soil, groundwater, surface water, air, plants, and food [1,2]. For the general population, food and drinking water are the principal sources of non-occupational exposure, whereas substantially higher exposure may occur in areas affected by mining, ore processing, combustion of uranium-bearing materials, or legacy waste deposits [3]. Environmental contamination from uranium-bearing sites may therefore lead to chronic low-level human exposure through contaminated water, locally grown food, and inhalation of contaminated dust [4].
Previous environmental assessments conducted in the Stepnogorsk area of Northern Kazakhstan have shown that settlements located near the Stepnogorsk Mining and Chemical Combine tailings area are characterized by several radiological factors relevant to potential chronic exposure. Aqsu, Zavodskoy, and Kvartsitka have been described as settlements located within approximately 5 km of the tailings area. Earlier radiological assessments in these settlements included measurements of ambient gamma dose rate, indoor and outdoor radon, radionuclide activity in water and soil, and scenario-based estimates of ingestion-related exposure through local water and food-chain pathways [5,6]. More recent groundwater investigations in mining-affected settlements also reported measurable radon concentrations in wells and boreholes, supporting the relevance of water-related exposure pathways in this region [7]. However, despite these environmental data, published human biomonitoring studies of non-occupational uranium exposure among residents of uranium legacy-affected settlements remain limited.
Biomonitoring of uranium in human biological media is an important approach for exposure assessment. Among available matrices, urine is considered one of the most informative indicators of recent internal uranium intake because a large proportion of absorbed uranium is excreted through the urinary pathway within the first days after exposure. Urinary uranium has therefore been used both in occupational monitoring and in environmental studies of potentially exposed populations [8].
At the same time, interpretation of urinary uranium depends on the sampling strategy and on urine dilution. Population studies often rely on spot urine because it is easier to collect, but 24 h urine provides a more integrated estimate of daily excretion. In a nationwide Swiss study based on 1393 adults, the median uranium excretion was 15 ng/24 h, and the 95th percentile was 67 ng/24 h, illustrating the usefulness of 24 h urine for estimating background population exposure [9]. For spot urine and creatinine-adjusted measurements, background population values are generally low. ATSDR summarized NHANES data for the general U.S. population and reported geometric mean urinary uranium levels in the range of 0.006–0.009 µg U/g creatinine or 0.005–0.010 µg U/L urine [10]. In a reference study from Warsaw, most values in non-exposed residents remained below the upper range expected for the general population, supporting the role of urinary uranium as a biomarker of background intake [11]. When spot urine is used, adjustment for urinary dilution becomes especially important. Creatinine remains the most widely used correction factor, and its strong association with urine osmolality has been demonstrated in a large human cohort, supporting its use to normalize urinary biomarker concentrations [12,13].
Previous environmental studies have shown that urinary uranium may increase in populations living in geochemically or technologically affected regions [14,15,16]. In a coal-mining area of Yili, Xinjiang, urine uranium concentrations ranged from 8.44 to 761.6 ng/L and were higher than reference values for unexposed populations, suggesting long-term environmental exposure, most likely associated with groundwater. Multimatrix studies from other regions have likewise demonstrated that uranium can be measured in urine, hair, nails, serum, water, soil, and food, although these matrices reflect different exposure windows and may not always correlate closely with each other. Hair may better reflect longer-term intake, whereas urine is generally more responsive to recent exposure [17].
In Kazakhstan, uranium biomonitoring has already been applied in occupational settings. Previous studies of uranium workers at different stages of the nuclear fuel cycle reported measurable urinary uranium concentrations across exposed occupational groups and highlighted the need for continued biomonitoring and improved assessment of radiation-related exposure [18]. However, data on non-occupational uranium exposure among residents of uranium legacy-affected areas remain limited, especially when biological monitoring is combined with comparison groups living outside the affected area.
The present study was conducted as a human biomonitoring component within the broader assessment of potential health risks in uranium legacy-affected areas. Although radiation-related and uranium-associated environmental factors are relevant to cancer risk assessment, the present study was not designed to establish cancer causation or to estimate the risk of malignant neoplasms attributable to uranium exposure. Instead, urinary uranium was used as a biomarker of internal exposure, and cancer status was included to describe and compare biomonitoring profiles among residents with and without a previous cancer diagnosis.
The aim of the present study was to evaluate urinary uranium concentrations among cancer patients and healthy residents living in uranium legacy-affected areas and to compare them with those of individuals residing in a region with a more favorable radiological environment, accounting for urinary creatinine levels. The study was designed as a human biomonitoring study to assess whether residents of uranium legacy-affected areas have a higher internal uranium burden than residents of the comparison area, and whether this pattern is observed in both cancer patients and healthy residents. Cancer status was used as a subgroup characteristic to explore whether urinary uranium levels differed by disease status within the same residential area. The study was not designed to determine whether uranium exposure caused cancer.
2. Materials and Methods
2.1. Study Design, Study Area and Participants
This observational human biomonitoring study included 80 adult participants divided into four equal subgroups: cancer patients and healthy residents from the uranium legacy-affected area, and cancer patients and healthy residents from the comparison area. The sample size was determined by the exploratory nature of the study and the feasibility of recruiting participants who met all inclusion and exclusion criteria. Because this was an initial human biomonitoring study in a non-occupationally exposed population from uranium legacy-affected areas, no formal a priori power calculation was performed. Therefore, the study was intended to provide preliminary biomonitoring evidence and to generate hypotheses for larger future studies rather than to provide definitive risk estimates.
Cancer patients were recruited among residents with previously diagnosed malignant neoplasms. Recruitment was informed by previous regional epidemiological findings indicating that digestive tract cancers, respiratory and intrathoracic cancers, breast cancer, skin cancer, and malignancies of female reproductive organs were among the most frequent cancer localizations in the study area [19,20]. Eligible cancer patients were included if they met the residence criteria and agreed to provide 24 h urine samples. Because the present investigation was an exploratory human biomonitoring study and recruitment of eligible cancer patients was limited by feasibility and consent constraints, the cancer subgroups were not matched by cancer type. All cancer patients included in the study had completed their main anticancer treatment before urine sample collection, and none were receiving active chemotherapy, radiotherapy, or surgical treatment at the time of biological sampling. Patients with kidney or urinary tract tumors were excluded to reduce the potential direct influence of urinary system malignancies on urinary biomarker excretion [20].
The exposed settlements were selected based on their location within the uranium legacy-affected Stepnogorsk area. Previous environmental assessments described Aqsu, Zavodskoy, and Kvartsitka as settlements located within approximately 5 km of the Stepnogorsk Mining and Chemical Combine tailings area [6]. In these settlements, earlier studies evaluated ambient gamma dose rates, indoor radon concentrations, water, soil, and food samples, and scenario-based radiation exposure pathways. These data provided the environmental context for classifying Aqsu and Zavodskoy as uranium legacy-affected settlements in the present biomonitoring study.
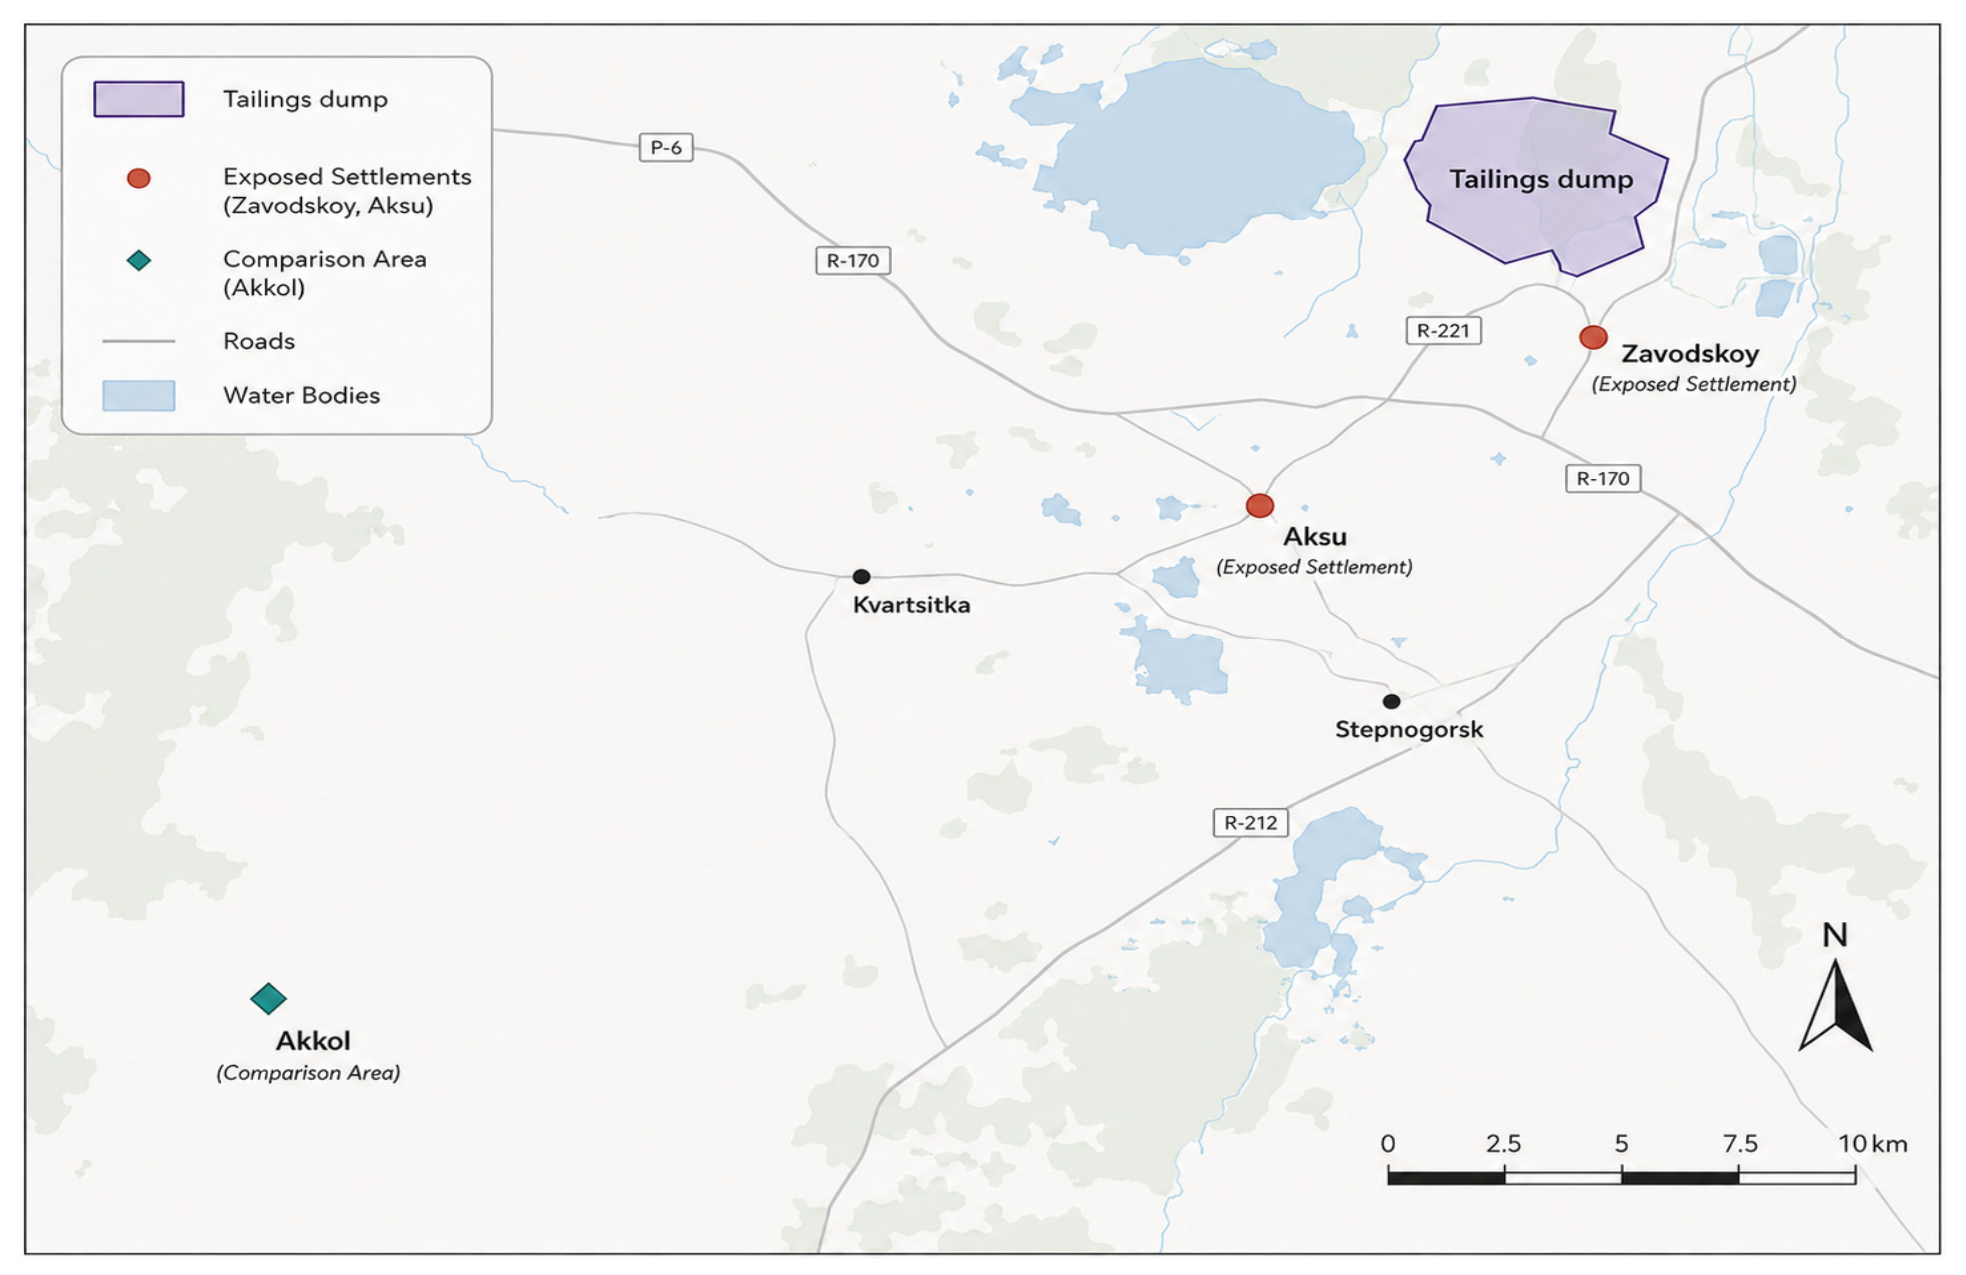
Akkol was selected as the comparison area because it is located outside the immediate uranium legacy-affected zone and has a more favorable radiological setting compared with the settlements located near the Stepnogorsk tailings area. Residence in Aqsu and Zavodskoy was used as a proxy indicator of potential long-term environmental exposure. However, individual-level measurements of uranium in drinking water, soil, dust, food, or air were not performed concurrently with urine sampling in the present study. Therefore, the exposure classification should be interpreted as area-based rather than as a direct quantitative assessment of individual environmental uranium exposure. The exposed population was recruited from Aqsu and Zavodskoy, both located in the uranium legacy-affected Stepnogorsk area. The comparison population was recruited from Akkol, which is located outside the immediate uranium legacy-affected zone and has a more favorable radiological setting. Thus, exposure classification in the present study was area-based. The geographic location of the uranium legacy-affected settlements, the comparison area, and the Stepnogorsk Mining and Chemical Combine tailings dump is shown in Figure 1.
Figure 1.
Map of the study area showing the exposed settlements (Zavodskoy and Aqsu), the comparison area (Akkol), and the location of the tailings dump.
Inclusion criteria were age above 18 years, permanent residence in the study settlement for at least 10 years, and voluntary informed consent to participate. Exclusion criteria were occupational exposure to ionizing radiation sources and acute diseases of the urinary tract. Occupationally exposed individuals were excluded to reduce potential confounding from occupational radiation or uranium-related exposure. Participants with acute urinary tract diseases were excluded because such conditions may affect urine composition, renal and urinary excretion, and the interpretation of urinary biomarkers. The characteristics of the study participants are presented in Table 1.
Table 1.
Characteristics of the study participants by study group.
2.2. Urine Sampling and Transportation
For uranium determination, 24 h urine samples were collected in clean 2 L polyethylene containers. A 20 mL aliquot of each daily urine sample was then transferred into a sterile 30 mL plastic container and acidified with concentrated nitric acid to minimize uranium adsorption to the container walls and prevent sample degradation. All biological samples were coded and transported under cooled conditions to the Radiochemistry and Radiospectrometry Testing Laboratory of the Scientific Institute of Radiobiology and Radiation Protection, Astana Medical University. During transportation, the temperature did not exceed 4 °C. When transportation time exceeded 24 h, samples were stored at −20 °C until delivery [21].
2.3. Uranium Determination by ICP-MS
Urinary uranium analysis was performed according to ASTM C1844-24 using inductively coupled plasma mass spectrometry (ICP-MS) [22]. Before analysis, frozen samples were thawed for 2 h at room temperature (21 ± 4 °C). For sample preparation, 1 mL of urine was transferred into a 15 mL tube and mixed with 9 mL of 2% HNO3. In addition, 100 µL of thorium standard solution was added as an internal standard. Thus, the urine samples were diluted at a ratio of 1:10 before instrumental analysis. Samples were then centrifuged at 6000 rpm (4430 RCF) for 24 min, and the supernatant was transferred into labeled 18 mL vials. Uranium concentrations were measured using a quadrupole ICP-MS system (Agilent 7800, Agilent Technologies, Santa Clara, CA, USA) [14]. Certified standards and calibration solutions were used for quality control, including SRM 3164 material from NIST. The detection limit was 0.1 ng/L. Final uranium concentrations were calculated with the dilution factor taken into account. At least two replicate measurements were performed for each sample, and the final value was based on the mean of replicate measurements.
Although 24 h urine collection provides a more integrated estimate of urinary excretion than spot urine and reduces short-term dilution-related variability, creatinine adjustment was additionally applied to improve comparability between participants. This approach was used to account for residual differences in urine concentration and possible differences in completeness of 24 h urine collection. Urinary creatinine was also considered a quality-control indicator for the comparability of urine samples across study subgroups.
2.4. Determination of Urinary Creatinine
Urinary creatinine was determined in all participants in order to account for urine dilution and to normalize uranium concentrations. Creatinine was measured using the standard kinetic Jaffé method, based on the reaction of creatinine with picric acid in an alkaline medium with photometric detection of the resulting colored complex. Daily urine samples were used for creatinine determination. All biochemical analyses were performed in accredited clinical diagnostic laboratories operating in accordance with ISO 15189 quality standards. Creatinine values were expressed in mmol/L and were subsequently used to calculate creatinine-adjusted urinary uranium concentrations [23,24,25].
2.5. Statistical Analysis
Descriptive statistics were presented as mean ± standard deviation and as median with interquartile range (Q1–Q3), where appropriate. Both mean and median values were reported because urinary uranium concentrations showed skewed distributions and individual high values. The mean was retained to allow comparison with previous studies, whereas the median and interquartile range were used to provide a more robust description of central tendency and variability in non-normally distributed data. Because of the relatively small subgroup size and the non-normal distribution of several variables, between-group comparisons were performed using the two-sided Mann–Whitney U test. For the main pairwise comparisons of creatinine-adjusted urinary uranium concentrations, median differences with 95% confidence intervals and rank-biserial correlation coefficients were additionally calculated to provide measures of precision and effect size. Because the analyses were exploratory and hypothesis-generating, p-values were not adjusted for multiple comparisons and were interpreted cautiously. Correlations between creatinine-adjusted urinary uranium and demographic or clinical variables were assessed using Spearman’s rank correlation coefficient. The correlation analysis was limited to variables available for all participants, including age, sex, cancer status, and area of residence. Sex, cancer status, and area of residence were coded as binary variables for exploratory non-parametric association analysis. Because these variables are nominal rather than ordinal, the resulting correlation coefficients were interpreted only as exploratory measures of association and not as evidence of an ordered dose–response relationship. Detailed data on smoking status, non-radiation occupational history, source of drinking water, dietary habits, kidney function parameters, socioeconomic status, and medication use were not systematically available for all participants. Therefore, these variables could not be included in the statistical analysis. Because of the small sample size and limited covariate availability, a fully adjusted multivariable regression model was not performed. A p-value below 0.05 was considered statistically significant.
2.6. Ethics
The study was conducted in accordance with bioethical principles, including protection of personal data, voluntary participation, and minimization of potential risks to participants. The study protocol was approved by the Local Bioethics Committee of NJSC Astana Medical University (Protocol No. 41, dated 5 November 2025). Written informed consent was obtained from all participants before inclusion in the study.
3. Results
3.1. Cancer Diagnosis/Localization and Treatment Status
The cancer subgroups included several broad cancer localization categories rather than a single targeted cancer type, reflecting previously reported regional cancer patterns and the feasibility of recruiting eligible patients who agreed to provide 24 h urine samples (Table 2).
Table 2.
Cancer diagnosis/localization categories and treatment status among cancer patients included in the study.
3.2. Urinary Creatinine Concentrations
Urinary creatinine concentrations were measured in all 80 participants to assess the comparability of urine samples and to account for the potential influence of urine dilution. Median creatinine concentrations were 14.55 mmol/L in cancer patients from the exposed area, 12.40 mmol/L in cancer patients from the comparison area, 12.30 mmol/L in healthy residents from the exposed area, and 12.35 mmol/L in healthy residents from the comparison area. Mean creatinine concentrations ranged from 11.95 ± 4.93 mmol/L in healthy residents from the comparison area to 14.60 ± 7.26 mmol/L in cancer patients from the exposed area.
No statistically significant differences were observed between exposed and comparison groups among cancer patients (p = 0.405) or among healthy residents (p = 0.472). Additional within-area comparisons between cancer patients and healthy individuals were also not statistically significant. The absence of statistically significant differences in urinary creatinine concentrations between the study subgroups supported the comparability of urine samples and allowed creatinine-adjusted uranium concentrations to be used as a complementary biomonitoring metric. Urinary creatinine and absolute urinary uranium concentrations across the study groups are summarized in Table 3.
Table 3.
Urinary creatinine and absolute urinary uranium concentrations across study groups.
3.3. Absolute Urinary Uranium Concentrations
Urinary uranium concentrations ranged from 0.01 to 1.30 µg/L across the study population. The highest values were observed in cancer patients living in the exposed area, with a mean concentration of 0.18 ± 0.28 µg/L, a median of 0.05 µg/L, and a maximum of 1.30 µg/L. In the comparison area, cancer patients had a mean uranium concentration of 0.03 ± 0.02 µg/L and a median of 0.02 µg/L. Among healthy participants, the mean concentration was 0.05 ± 0.03 µg/L in the exposed area and 0.04 ± 0.03 µg/L in the comparison area. Thus, in both cancer patients and healthy residents, uranium concentrations tended to be higher in the exposed settlements than in the comparison population. Median values remained low across all groups, whereas individual elevated concentrations were observed in the exposed area, particularly among cancer patients.
3.4. Creatinine-Adjusted Urinary Uranium Concentrations
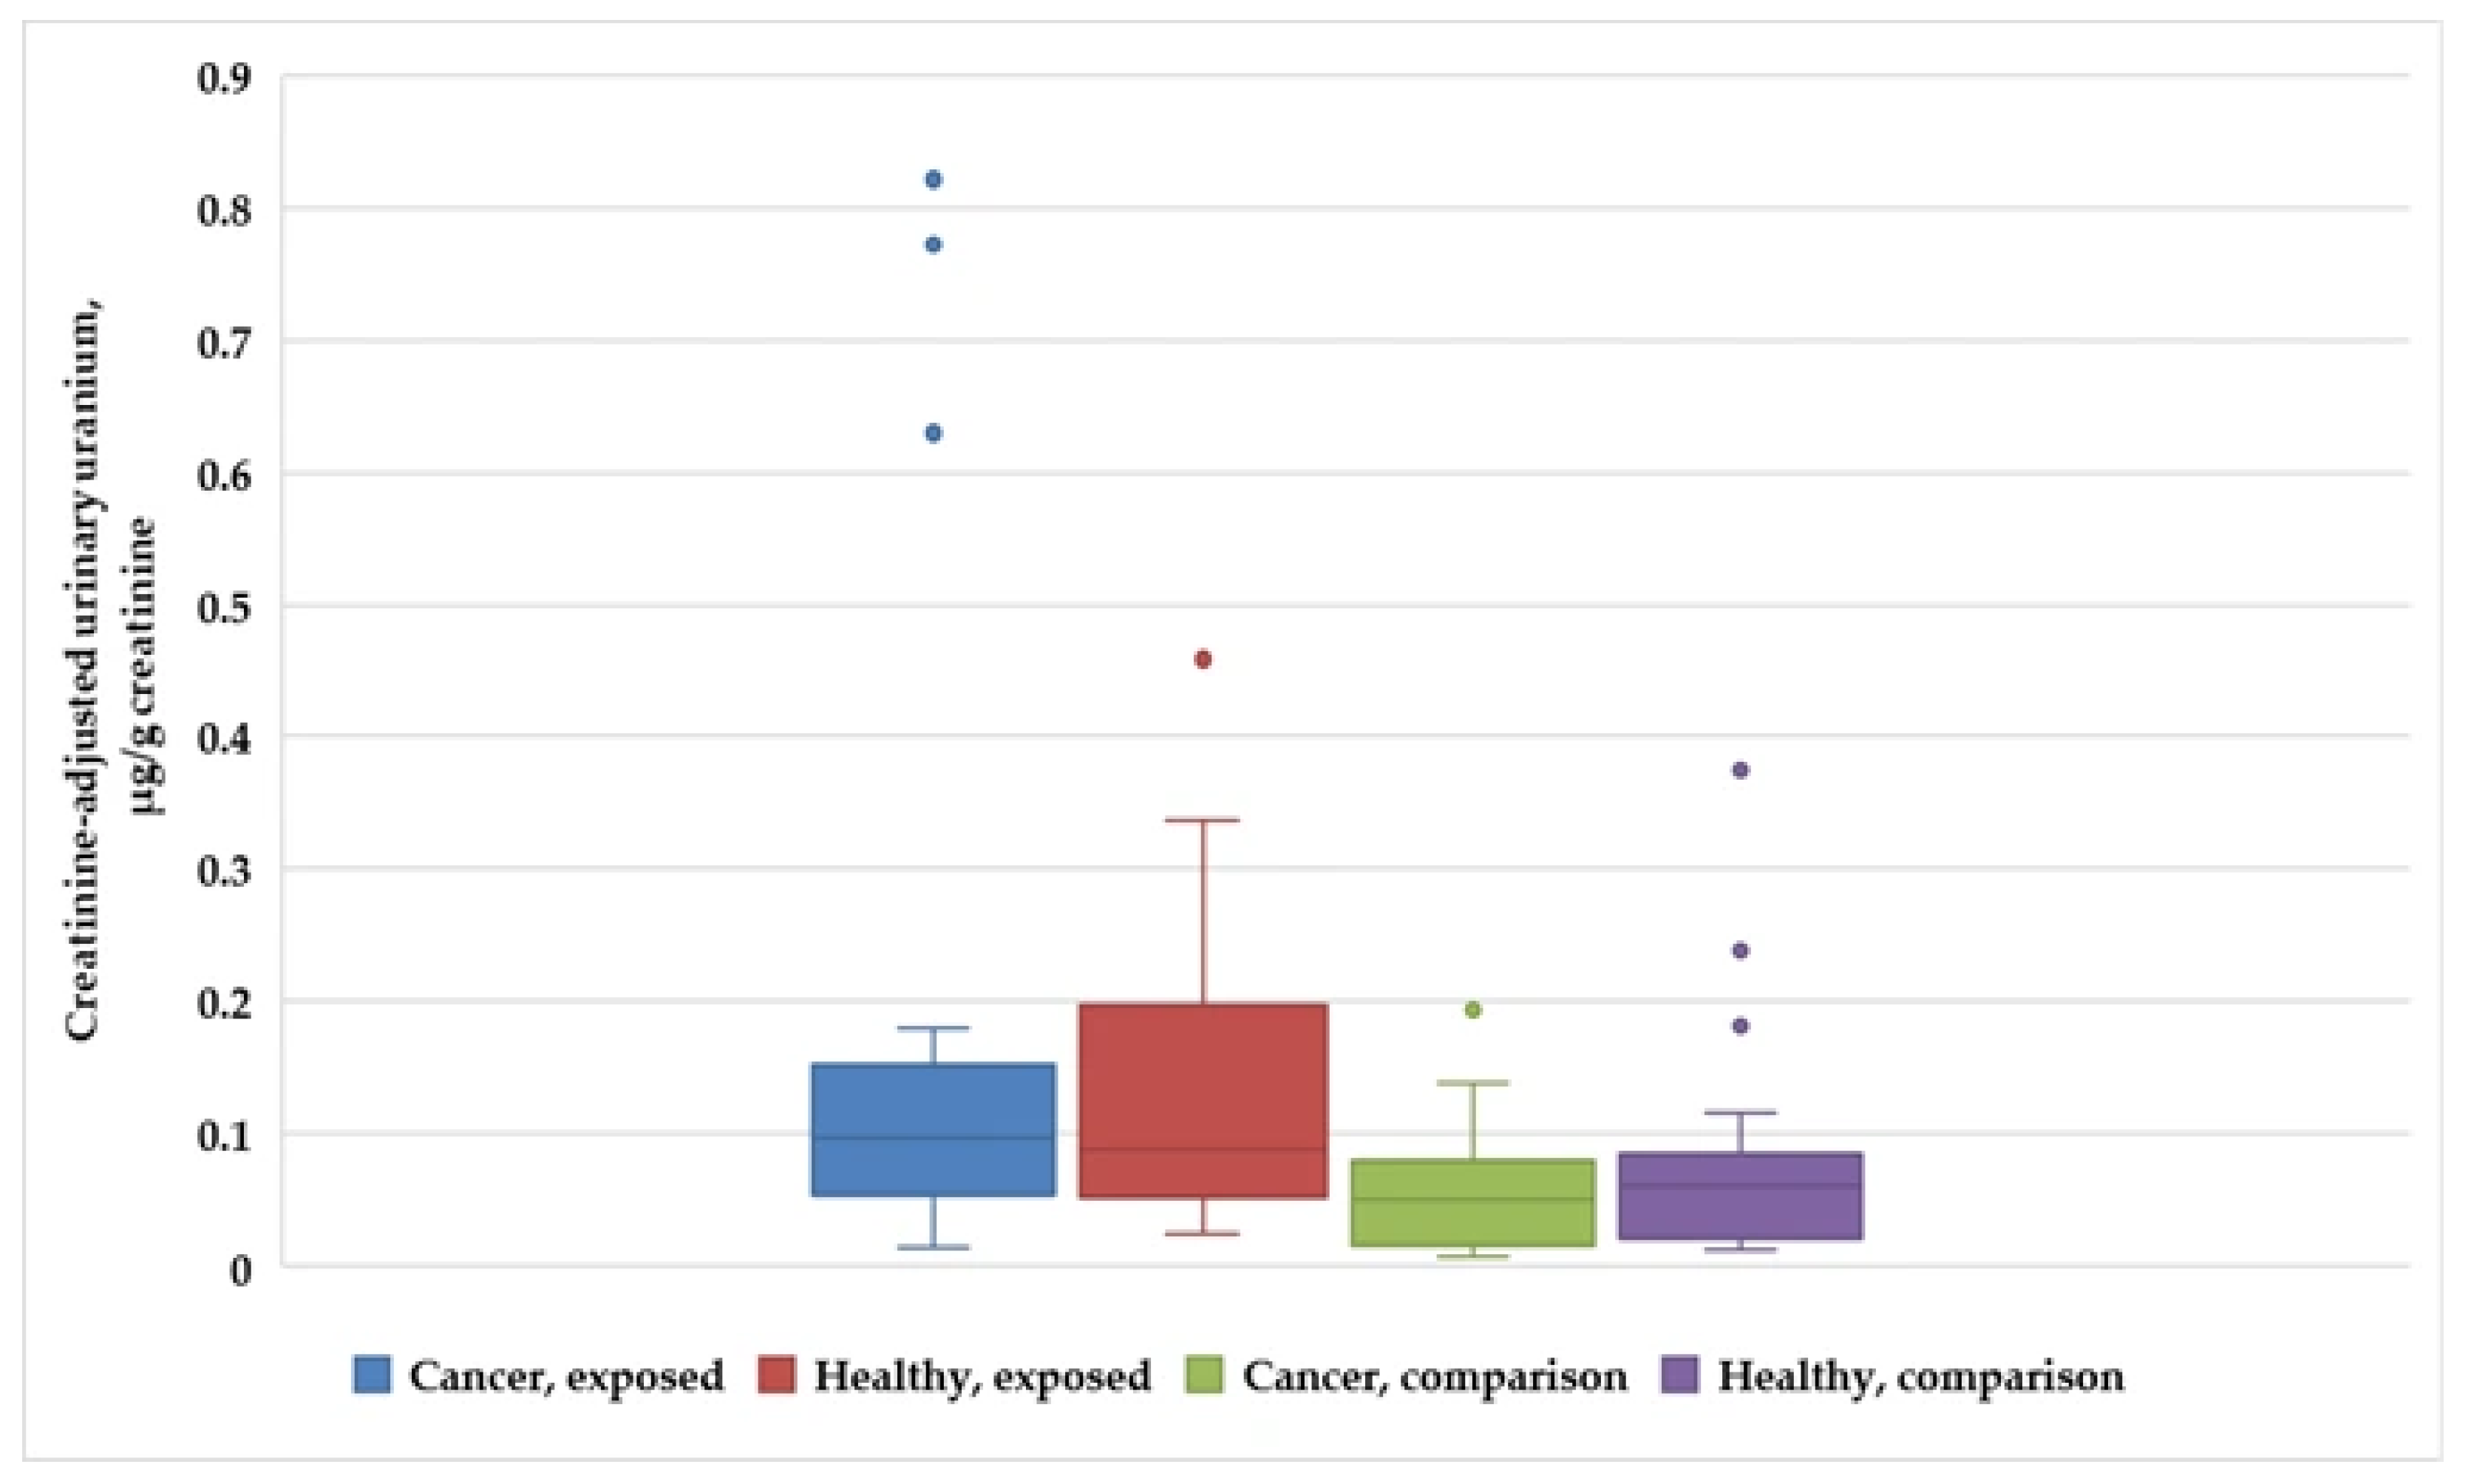
After normalization to urinary creatinine, between-area differences in urinary uranium concentrations remained evident. Median creatinine-adjusted uranium concentrations were 0.0974 µg/g creatinine in exposed cancer patients, 0.0515 µg/g creatinine in comparison-area cancer patients, 0.0888 µg/g creatinine in exposed healthy residents, and 0.0607 µg/g creatinine in comparison-area healthy residents. The highest individual value was detected in cancer patients from the exposed area (0.8206 µg/g creatinine), followed by healthy residents from the exposed area (0.4588 µg/g creatinine). Mann–Whitney analysis showed statistically significant differences between exposed and comparison groups both among cancer patients (U = 301, p = 0.0066) and among healthy residents (U = 273, p = 0.0499). In contrast, Table 4B showed no significant difference between cancer patients and healthy residents within the exposed area (U = 193, p = 0.8604) or within the comparison area (U = 161, p = 0.2977). Median differences, 95% confidence intervals, and rank-biserial correlation coefficients for the main pairwise comparisons are presented in Table 4. These results suggest that the area of residence was more strongly associated with increased urinary uranium levels than cancer status in this cohort.
Table 4.
Creatinine-adjusted urinary uranium concentrations and pairwise comparisons.
The distribution of creatinine-adjusted urinary uranium concentrations across the four study groups is shown in Figure 2. The box-and-whisker plot demonstrates variability within each subgroup and allows visualization of skewness and potential outliers.
Figure 2.
Box-and-whisker plot of creatinine-adjusted urinary uranium concentrations across the study groups. Boxes represent the interquartile range, horizontal lines indicate median values, whiskers show the range of non-outlier values, and individual points represent outliers.
3.5. Correlation Analysis
Spearman correlation analysis showed no statistically significant association between creatinine-adjusted urinary uranium and age (ρ = 0.142, p = 0.223), sex (ρ = 0.092, p = 0.416), or cancer status (ρ = 0.081, p = 0.476). However, a significant positive correlation was observed between urinary uranium and residence in the exposed area (ρ = 0.292, p = 0.012). This finding indicates an unadjusted association between area of residence and urinary uranium concentrations in the study population; however, the potential influence of unmeasured individual-level factors cannot be excluded.
4. Discussion
The present study demonstrated that urinary uranium concentrations were higher among residents of uranium legacy-affected areas than among the comparison population. After adjustment for urinary creatinine, significant between-area differences remained evident in both cancer patients and healthy residents, whereas no significant differences were observed between cancer patients and healthy individuals living within the same residential area. Furthermore, urinary uranium was positively correlated with residence in the exposed area but showed no association with age, sex, or cancer status. These findings suggest an association between area of residence and urinary uranium concentrations in this study population. However, this association should be interpreted as unadjusted because potentially relevant individual-level covariates were not included in the analysis.
Urinary uranium is widely accepted as a biomarker of internal uranium exposure because soluble uranium is predominantly eliminated through the kidneys. Nevertheless, interpretation of urinary uranium requires consideration of uranium toxicokinetics. Although urinary excretion mainly reflects recent internal exposure, a proportion of absorbed uranium is retained in mineralized tissues, particularly bone, where it may remain for prolonged periods and be gradually released during physiological bone remodeling. Consequently, urinary uranium reflects current internal exposure together with a limited contribution from previously retained uranium but should not be interpreted as a direct measure of cumulative body burden or lifetime exposure [27,28]. To reduce exposure misclassification, only individuals who had resided in the study area for at least 10 years were included, thereby increasing the likelihood that urinary uranium reflected long-term environmental residence rather than recent migration.
Our findings are consistent with previous human biomonitoring studies demonstrating elevated urinary uranium concentrations in populations living in environmentally affected areas. Similar observations have been reported in regions with uranium-rich groundwater, mining activities, or elevated natural background radiation, where urinary uranium has been shown to distinguish environmentally exposed populations from background populations [3,4,29]. Studies comparing different biological matrices have further demonstrated that urine primarily reflects recent internal exposure, whereas hair and nails may better represent longer-term accumulation [30,31,32,33,34]. These differences emphasize that urinary uranium should be interpreted as an indicator of current internal exposure rather than a surrogate measure of chronic body accumulation.
Several limitations should be considered when interpreting the present findings. Previous environmental investigations conducted in the same settlements documented elevated uranium concentrations in groundwater, increased radon activity, and enhanced radiation exposure among residents [6,7], providing relevant environmental context for the present study. However, individual-level measurements of uranium in drinking water, soil, dust, food, or air were not performed concurrently with urine sampling. In addition, detailed information on smoking, drinking-water source, occupational history, kidney function, diet, socioeconomic status, and medication use was unavailable and could not be incorporated into the analysis. Consequently, the observed association between residential area and urinary uranium concentrations should be interpreted as an unadjusted association, and residual confounding cannot be excluded. The observed differences therefore cannot be independently attributed to residential location or to any specific environmental exposure pathway. Moreover, because the analyses were exploratory and hypothesis-generating, the reported p-values should be interpreted cautiously and should not be regarded as confirmatory evidence. The present study should therefore be regarded as an exploratory human biomonitoring investigation rather than an assessment of cancer risk.
5. Conclusions
Residents of uranium legacy-affected settlements exhibited higher urinary uranium concentrations than the comparison population. After creatinine normalization, median urinary uranium concentrations were 0.0974 µg/g creatinine in exposed cancer patients and 0.0888 µg/g creatinine in exposed healthy residents, compared with 0.0515 and 0.0607 µg/g creatinine, respectively, in the comparison area. Significant between-area differences were observed for both cancer patients (p = 0.0066) and healthy residents (p = 0.0499), whereas no significant differences were found between cancer patients and healthy individuals within the same residential area. Residence in the exposed area was the only variable significantly correlated with urinary uranium concentrations (ρ = 0.292, p = 0.012). These findings suggest that environmental conditions associated with uranium legacy-affected areas were more strongly associated with internal uranium exposure than with cancer status in this cohort. Although this study does not identify specific exposure pathways or establish causal relationships, it provides baseline human biomonitoring data for Kazakhstan and supports the application of urinary uranium, combined with creatinine adjustment, as a useful biomarker for assessing internal uranium exposure in populations residing near uranium legacy sites.
Author Contributions
Conceptualization, K.I., D.I. and M.B.; methodology, K.I., D.I. and M.B.; formal analysis, K.I., Y.D. and M.K.; data curation, K.I.; investigation, K.I. and D.I.; visualization, K.I.; writing—original draft preparation, K.I.; writing—review and editing, D.I., P.K., Y.D. and M.B.; supervision, D.I., M.K. and K.I. All authors have read and agreed to the published version of the manuscript.
Funding
This research received no external funding.
Institutional Review Board Statement
The study was conducted in accordance with the principles of the Declaration of Helsinki and was approved by the Local Bioethics Committee of NJSC Astana Medical University (Protocol No. 41, dated 5 November 2025).
Informed Consent Statement
Written informed consent was obtained from all subjects involved in the study before participation and urine sample collection.
Data Availability Statement
The data presented in this study are not publicly available due to ethical and privacy restrictions related to individual-level biological and clinical information but may be available from the corresponding author upon reasonable request and with approval from the relevant institutional ethics committee.
Conflicts of Interest
The authors declare no conflicts of interest.
Abbreviations
| ICP-MS | Inductively coupled plasma mass spectrometry |
| SD | Standard deviation |
| Q1 | First quartile |
| Q3 | Third quartile |
| NIST | National Institute of Standards and Technology |
| ISO | International Organization for Standardization |
References
- UNSCEAR. UNSCEAR Sources and Effects of Ionizing Radiation, ANNEX B, Exposures from Natural Radiation Sources; UNSCEAR 2000 REPORT. N. Y.; UNSCEAR: Vienna, Austria, 2000; Volume 1, pp. 97–99. [Google Scholar]
- Kairullova, M.; Bakhtin, M.; Ilbekova, K.; Ibrayeva, D. Migration and Accumulation of Uranium-Associated Heavy Metals in Mining-Affected Ecosystems (Water, Soil, and Plants). Biology 2026, 15, 502. [Google Scholar] [CrossRef] [Scilit] [PubMed]
- Shahbazi-Gahrouei, D.; Gholami, M.; Setayandeh, S. A review on natural background radiation. Adv. BioMed Res. 2013, 2, 65. [Google Scholar] [CrossRef] [Scilit] [PubMed]
- Faqir, Y.; Li, Z.; Gul, T.; Zahoor; Jiang, Z.; Yu, L.; Tan, C.; Chen, X.; Ma, J.; Feng, J. Uranium’s Hazardous Effects on Humans and Recent Developments in Treatment. Ecotoxicol. Environ. Saf. 2025, 293, 118043. [Google Scholar] [CrossRef] [Scilit] [PubMed]
- Ibrayeva, D.; Kairullova, M.; Hosoda, M.; Omori, Y.; Kashkinbayev, Y.; Ilbekova, K.; Bagramova, A.; Shokabayeva, A.; Bakhtin, M. Groundwater Radionuclide Contamination in the Saumalkol Settlement Located near Decommissioned Uranium Mining Sites. Environments 2026, 13, 161. [Google Scholar] [CrossRef] [Scilit]
- Janavayev, D.J.; Kashkinbayev, Y.T.; Ilbekova, K.B.; Saifulina, Y.A.; Bakhtin, M.M.; Sharipov, M.K.; Kazymbet, P.K. Health status of the population living in the zone of influence of radioactive waste repositories. Electron. J. Gen. Med. 2019, 16, em176. [Google Scholar] [CrossRef] [Scilit]
- Ibrayeva, D.; Bakhtin, M.; Aumalikova, M.; Kashkinbayev, Y.; Kazymbet, P.; Hoshi, M.; Sakaguchi, A. Preliminary studies of the water contamination in settlements located near the uranium mining territory in Northern Kazakhstan. Environ. Sci. Pollut. Res. 2025, 32, 11242–11250. [Google Scholar] [CrossRef] [Scilit]
- Yusuf, I.; Hansson, E.; Eriksson, M.; Lindahl, P.; Pettersson, H.B.L. Uranium Body Clearance Kinetics: A Long-term Follow-up Study of Retired Nuclear Fuel Workers. Health Phys. 2024, 127, 520–535. [Google Scholar] [CrossRef] [Scilit] [PubMed]
- Jenny-Burri, J.; Blanc, A.; Aubert, R.; Haldimann, M.; Zürcher, U.; Burnier, M.; Paccaud, F.; Bochud, M.; Dudler, V. Uranium exposure of the Swiss population based on 24-hour urinary excretion. Swiss Med. Wkly. 2020, 150, w20207. [Google Scholar] [CrossRef] [Scilit] [PubMed]
- Agency for Toxic Substances and Disease Registry (ATSDR). Toxicological Profile for Uranium; U.S. Department of Health and Human Services, Public Health Service: Atlanta, GA, USA, 2013.
- Starościak, E.; Rosiak, L. Determination of uranium reference levels in the urine of Warsaw residents (Poland). J. Radioanal. Nucl. Chem. 2015, 304, 75–79. [Google Scholar] [PubMed]
- Israelsson, A.; Pettersson, H. Measurements of 234U and 238U in hair, urine, and drinking water among drilled bedrock well water users for the evaluation of hair as a biomonitor of uranium intake. Health Phys. 2014, 107, 143–149. [Google Scholar] [CrossRef] [Scilit] [PubMed]
- Venus, M.; Puntarić, D.; Gvozdić, V.; Vidosavljević, D.; Bijelić, L.; Puntarić, A.; Puntarić, E.; Vidosavljević, M.; Matijana, J.; Jasenka, Š. Determinations of uranium concentrations in soil, water, vegetables and biological samples from inhabitants of war affected areas in eastern Croatia (ICP-MS method). J. Environ. Radioact. 2019, 203, 147–153. [Google Scholar] [CrossRef] [Scilit] [PubMed]
- Aumalikova, M.N.; Ibrayeva, D.S.; Ilbekova, K.; Kazymbet, P.K.; Bakhtin, M.M.; Janabaev, D.D.; Altaeva, N.Z. Assessment of the dose burden and health status of the uranium processing workers of the Republic of Kazakhstan. Eurasian J. Phys. Funct. Mater. 2020, 4, 336–343. [Google Scholar] [CrossRef] [Scilit]
- Aumalikova, M.; Ibrayeva, D.; Bizhanova, D.; Kusherbayev, N.; Kairullova, M.; Kazhiyakhmetova, B.; Shokabayeva, A.; Ilbekova, K.; Bakhtin, M. Radon exposure in residential premises and basements in settlement of Northern Kazakhstan: A case study near a dormant uranium mine. J. Radioanal. Nucl. Chem. 2025, 334, 7719–7726. [Google Scholar] [CrossRef] [Scilit]
- Kirillova , T.G.; Dyusembayeva, M.T.; Mukhamediyarov , N.Z. DETERMINING CONCENTRATION OF URANIUM USING INDUCTIVELY COUPLED PLASMA MASS-SPECTROMETRY. NNC RK Bulletin. 2019, 1, 85-90. (In Russian) [Google Scholar] [CrossRef] [Scilit]
- Wufuer, R.; Abuduwaili, J.; Mu, S.; Liu, W.; Jiang, F.; Tian, L. A survey of uranium levels in urine and hair of people living in a chronic uranium exposure area in Xinjiang, China. Environ. Geochem. Health 2018, 40, 1465–1476. [Google Scholar] [CrossRef] [Scilit] [PubMed]
- Rahman, Z.Q.; Al-Hamzawi, A.A. Experimental investigation of uranium content in urine samples of cancer patients in Al-Diwaniyah Governorate, Iraq. J. Phys. Conf. Ser. 2020, 1591, 012015. [Google Scholar] [CrossRef] [Scilit]
- Ilbekova, K.; Ibrayeva, D.; Kazymbet, P.; Bakhtin, M.; Dogalbayev, Y. Cancer Incidence in a Population Living Near Radioactive Waste Storage of Uranium Mining in Stepnogorsk Area, Northern Kazakhstan. Asian Pac. J. Cancer Prev. 2024, 25, 253–261. [Google Scholar] [CrossRef]
- Kazymbet, P.; Ilbekova, K.; Saifulina, E.; Yelshenbek, M.; Kashkinbayev, Y.; Ibrayeva, D.; Aumalikova, M.; Bizhanova, D.; Dogalbayev, Y.; Bakhtin, M. Health Impacts of Chronic Radiation Exposure in Northern Kazakhstan: A Comprehensive Epidemiological Review. Cancers 2026, 18, 1404. [Google Scholar] [CrossRef] [Scilit] [PubMed]
- Arnold, S.M.; Angerer, J.; Boogaard, P.J.; Hughes, M.F.; O’Lone, R.B.; Robison, S.H.; Schnatter, A.R. The use of biomonitoring data in exposure and human health risk assessment: Benzene case study. Crit. Rev. Toxicol. 2013, 43, 119–153. [Google Scholar] [CrossRef] [Scilit] [PubMed]
- ASTM C1844-24; Standard Test Method for Determination of Uranium in Urine by Inductively Coupled Plasma Mass Spectrometer Following Nitric Acid Dilution. ASTM International: West Conshohocken, PA, USA, 2024. Available online: https://store.astm.org/c1844-24.html (accessed on 5 July 2026).
- Franz, S.; Skopp, G.; Musshoff, F. The effect of creatine ingestion on urinary creatinine concentration: Does supplementation mask a heavy dilution? Drug Test. Anal. 2022, 14, 162–168. [Google Scholar] [PubMed]
- Medical Laboratories—Requirements for Quality and Competence; International Organization for Standardization. ISO 15189:2022. 2022. Available online: https://www.iso.org/standard/76677.html (accessed on 15 July 2026).
- Sallsten, G.; Barregard, L. Variability of urinary creatinine in healthy individuals. Int. J. Env. Res. Public Health 2021, 18, 3166. [Google Scholar] [CrossRef] [Scilit]
- Aydoğdu, M.; Oral, S.; Akgür, S.A. The impact of creatinine reference value: Normalization of urinary drug concentrations. J. Forensic Sci. 2021, 66, 1855–1861. [Google Scholar] [CrossRef] [Scilit] [PubMed]
- Hashtarkhani, S.; Rashid, R.; Brett, C.L.; Chinthala, L.; Kumsa, F.A.; Zink, J.A.; Davis, R.L.; Schwartz, D.L.; Shaban-Nejad, A. Cancer Diagnosis Categorization in Electronic Health Records Using Large Language Models and BioBERT: Model Performance Evaluation Study. JMIR Cancer 2025, 11, e72005. [Google Scholar] [CrossRef] [Scilit] [PubMed]
- Gueguen, Y.; Frerejacques, M. Review of knowledge of uranium-induced kidney toxicity for the development of an adverse outcome pathway to renal impairment. Int. J. Mol. Sci. 2022, 23, 4397. [Google Scholar] [CrossRef] [Scilit] [PubMed]
- Ran, Y.; Wang, S.; Zhao, Y.; Li, J.; Ran, X.; Hao, Y. A review of biological effects and treatments of inhaled depleted uranium aerosol. J. Environ. Radioact. 2020, 222, 106357. [Google Scholar] [CrossRef] [Scilit] [PubMed]
- Žunić, Z.S.; Benedik, L.; Kritsananuwat, R.; Veselinovic, N.; Tokonami, S.; Arae, H.; Stojanovska, Z.; Sahoo, S.K. Measurement of uranium in urine, hair and nails in subjects of Niška Banja Town, a high natural background radiation area of Serbia. Radiat. Prot. Dosim. 2019. [Google Scholar] [CrossRef] [Scilit]
- Bagatti, D.; Cantone, M.C.; Giussani, A.; Veronese, I.; Roth, P.; Werner, E.; Höllriegl, V.; Schramel, P.; Oeh, U. Regional dependence of urinary uranium baseline levels in non-exposed subjects with particular reference to volunteers from Northern Italy. J. Environ. Radioact. 2003, 65, 357–364. [Google Scholar] [CrossRef] [Scilit] [PubMed]
- Kehagia, K.; Bratakos, S.; Kolovou, M.; Potiriadis, C. Hair analysis as an indicator of exposure to uranium. Radiat. Prot. Dosim. 2011, 144, 423–426. [Google Scholar] [CrossRef] [Scilit] [PubMed]
- Muikku, M.; Heikkinen, T. Exogenous contamination of uranium in human scalp hair. Health Phys. 2012, 102, 699–703. [Google Scholar] [CrossRef] [Scilit] [PubMed]
- Zamora, M.L.L.; Zielinski, J.M.; Moodie, G.B.; Falcomer, R.A.F.; Hunt, W.C.; Capello, K. Uranium in drinking water: Renal effects of long-term ingestion by an aboriginal community. Arch. Environ. Occup. Health 2009, 64, 228–241. [Google Scholar] [CrossRef] [Scilit] [PubMed]

Disclaimer/Publisher’s Note: The statements, opinions and data contained in all publications are solely those of the individual author(s) and contributor(s) and not of MDPI and/or the editor(s). MDPI and/or the editor(s) disclaim responsibility for any injury to people or property resulting from any ideas, methods, instructions or products referred to in the content. |
© 2026 by the authors. Licensee MDPI, Basel, Switzerland. This article is an open access article distributed under the terms and conditions of the Creative Commons Attribution (CC BY) license.