Article

Mycotoxin Contamination of Wild Plants in Agricultural Landscapes: Seasonal Dynamics and the Underestimated Role of Woody Species


1
Faculty of Sciences, Institute of Biology, University of Pécs, Ifjúság Str. 6., 7624 Pécs, Hungary
2
Institute of Genetics and Biotechnology, Department of Animal Biotechnology, Hungarian University of Agriculture and Life Sciences, Szent-Györgyi A. Str. 4, 2100 Gödöllő, Hungary
*
Author to whom correspondence should be addressed.
These authors contributed equally to this work.
Environments 2026, 13(7), 405; https://doi.org/10.3390/environments13070405
Submission received: 2 June 2026 / Revised: 6 July 2026 / Accepted: 15 July 2026 / Published: 18 July 2026
(This article belongs to the Special Issue Biomonitoring of Environmental Pollutants)

Abstract

Mycotoxin research has traditionally focused on cultivated crops, whereas wild plants growing in semi-natural vegetation remain largely unexplored despite their possible ecological importance. This study presents a comprehensive assessment of the occurrence, seasonal dynamics, organ-specific distribution, and growth-form differences of aflatoxin B1 (AFB1), deoxynivalenol (DON), and zearalenone (ZEN) in wild plant species from agricultural areas of the Hungarian Plain. A total of 134 samples collected in July, August, and October were analyzed for mycotoxin contamination. All three mycotoxins were frequently detected, and only 13% of samples were free of the investigated toxins. Mycotoxin profiles changed seasonally, with multi-toxin co-occurrence predominating in July, ZEN in August, and DON in October, whereas AFB1 declined toward the end of the growing season. Growth form explained contamination patterns more strongly than plant organ: woody species showed higher AFB1 and DON contamination, whereas grasses showed higher ZEN concentrations. Although most concentrations were low, occasional extreme values approached or exceeded European Union reference values for animal feed. Our findings identify semi-natural vegetation, particularly woody species, as a previously underestimated reservoir of mycotoxins and demonstrate that seasonal dynamics and plant growth form should be considered when assessing environmental mycotoxin exposure in agricultural landscapes.

1. Introduction

Among the most relevant mycotoxins are aflatoxin B1 (AFB1), deoxynivalenol (DON), and zearalenone (ZEN). These toxins, produced mainly by Aspergillus and Fusarium species, are widely detected in cereals and other agricultural products and constitute significant toxic risks, including carcinogenic, immunotoxic, and endocrine-disrupting effects [1,2,3,4,5,6]. Yet, these plants may serve as dietary components for wildlife and livestock and may act as reservoirs for toxigenic fungi. Nichea et al. [7] reported detectable levels of ZEN, T-2, and HT-2 toxins in wild grasses from Argentine peatlands. Kolackova et al. [8] showed that species-rich grassland communities display greater fungal colonization and a higher risk of mycotoxin contamination than monocultures. Compared to cultivated crops, quantitative data on mycotoxin occurrence in wild and semi-natural plant species remain limited, particularly for vegetative organs and seasonal dynamics. Nevertheless, increasing evidence indicates that non-crop vegetation can serve as an important reservoir of toxigenic fungi. Wild plants and weeds may serve as alternative hosts for Fusarium species that produce DON and ZEN, providing inoculum sources for adjacent crops through dispersal by wind, rain splash, soil, insects, or vertebrates [9,10,11,12]. Although mycotoxin concentrations in wild plants are often lower than those reported for cultivated hosts, Fusarium isolates from non-crop vegetation can produce substantial amounts of DON and ZEN under favorable conditions [9,10,11]. Consequently, semi-natural vegetation may contribute to both fungal persistence in agricultural landscapes and environmental mycotoxin exposure beyond cultivated crops. Semi-natural vegetation at field margins also supports diverse plant, fungal, and animal communities. Many of these plant species are consumed by herbivorous wildlife, including roe deer (Capreolus capreolus), fallow deer (Dama dama), voles (Microtus spp.), and field mice (Apodemus spp.), creating potential exposure pathways for mycotoxins. Small mammals inhabiting field margins further represent prey for avian and mammalian predators, suggesting that mycotoxins may be transferred through terrestrial food webs [13,14,15,16,17,18,19,20].
Climate change further increases the relevance of studying mycotoxins in natural vegetation. Rising temperatures and altered precipitation regimes can modify fungal community composition, promote toxigenic species, and alter mycotoxin production [21,22,23,24,25,26,27]. These effects are expected to be particularly pronounced in the Carpathian Basin, where warming and drought exceed the European average. Despite growing knowledge on climate-driven changes in crops, little is known about how mycotoxins are distributed among wild plant species, plant organs, and seasons in semi-natural vegetation. To address this knowledge gap, we investigated the occurrence and distribution of aflatoxin B1 (AFB1), deoxynivalenol (DON), and zearalenone (ZEN) in wild plant species growing adjacent to agricultural fields. Specifically, we examined seasonal variation in contamination, assessed the co-occurrence of multiple mycotoxins, and compared organ-specific (vegetative versus reproductive) accumulation and growth form differences, focusing on woody, monocotyledonous, and dicotyledonous herbaceous species.
We hypothesized that
(i) A given plant species or plant organ can be contaminated by more than one type of mycotoxin simultaneously.
(ii) Mycotoxin contamination shows seasonal variation in wild plants growing adjacent to agricultural fields;
(iii) Mycotoxin contamination differs among plant organs, with reproductive and vegetative tissues manifesting distinct contamination profiles;
(iv) Mycotoxin contamination varies among plant growth forms, with woody and herbaceous species showing contrasting contamination profiles.

2. Materials and Methods

2.1. Field Sampling

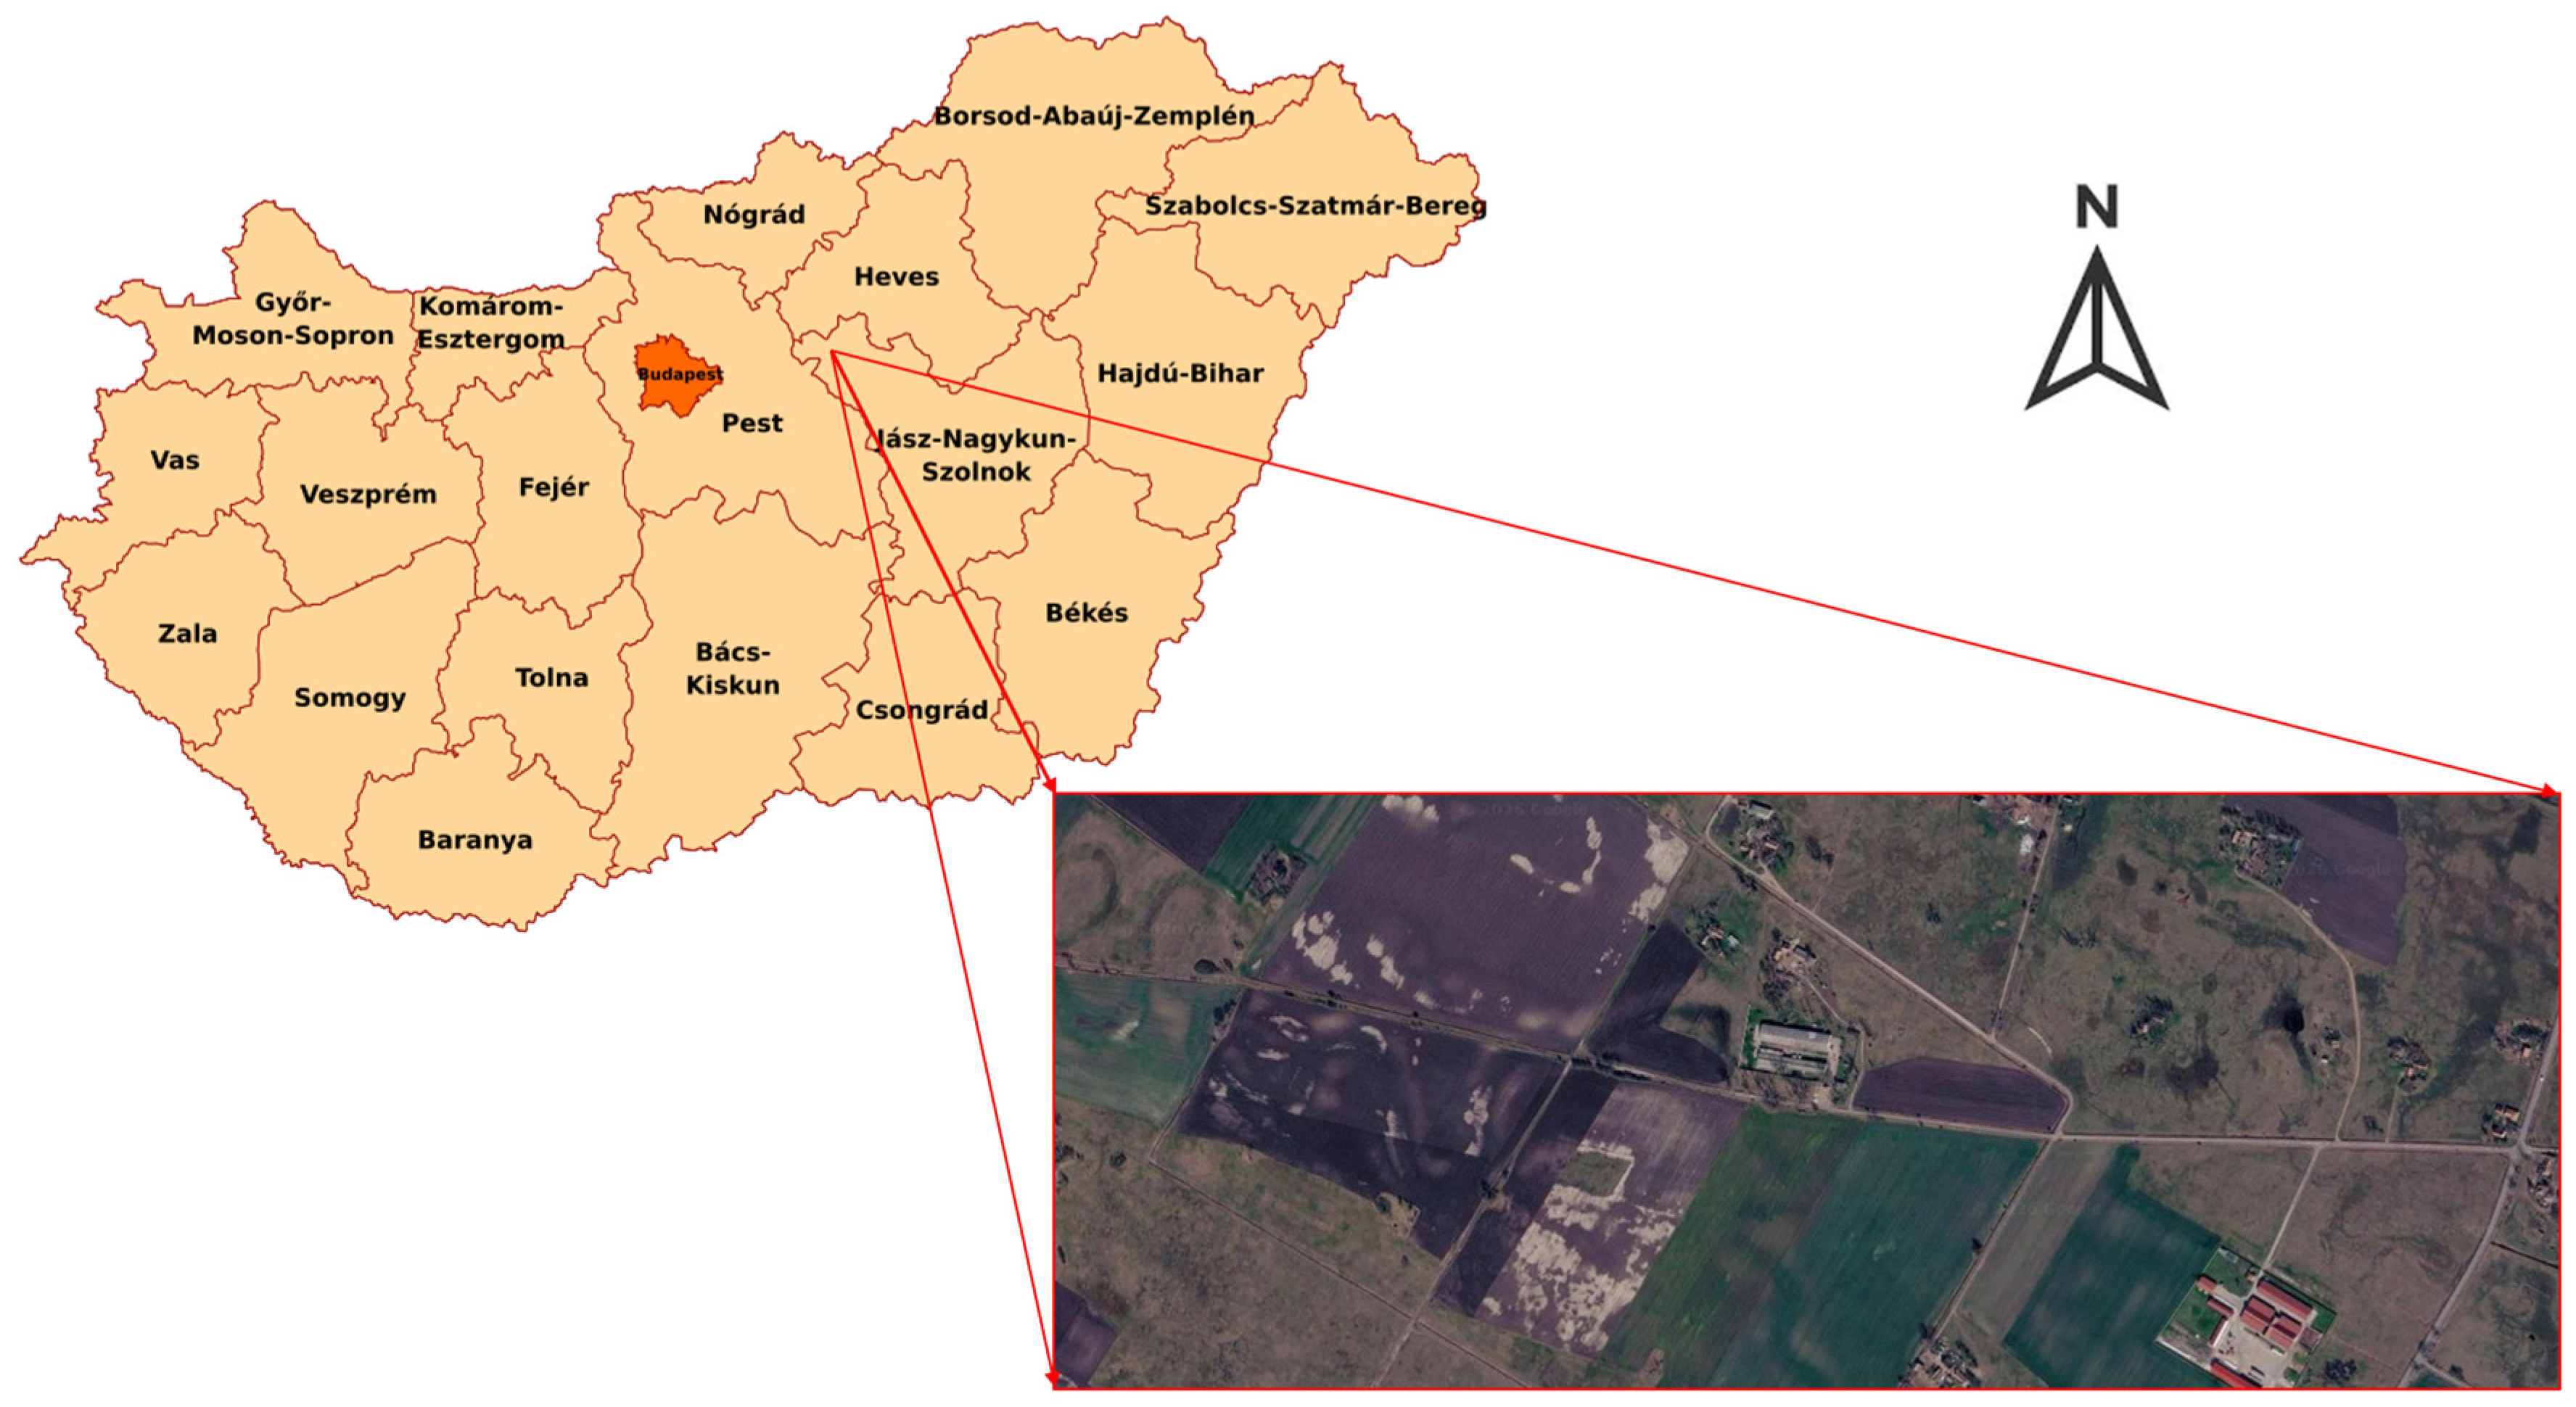
The field survey aimed to collect plant samples representing wild forage species commonly consumed by herbivorous wildlife, particularly European roe deer (Capreolus capreolus) and brown hare (Lepus europaeus), in agricultural landscapes. Sampling was conducted in an agricultural area on the Hungarian Plain in the Jászság region (Figure 1). The sampling transect was selected to represent a characteristic semi-natural vegetation corridor adjacent to intensively cultivated fields in the Hungarian Plain. The sampling transect was selected a priori to maximize the diversity of naturally occurring forage species while remaining within a single, environmentally homogeneous landscape unit. The site combines diverse wild plant communities with proximity to agricultural production and is representative of the landscape mosaics commonly occurring in the region. In addition, the area is regularly used by wild herbivorous mammals, rendering it suitable for evaluating the ecological relevance of mycotoxin contamination in naturally occurring forage plants. The selected transect is subject to only limited direct anthropogenic disturbance, allowing the vegetation to develop under relatively natural conditions despite its agricultural surroundings. The site is a Natura 2000 nature conservation area characterized by saline soil. The study area is characterized by a continental climate, with annual precipitation of 500–650 mm and mean annual temperatures ranging between 9.5 and 11.5 °C. Summer droughts are frequent, and temperatures are often high during the growing season. The vegetation is typical of the region and consists of a mosaic of arable land, grasslands with scattered shrubs, and small plantations of poplar (Populus spp.) and black locust (Robinia pseudoacacia). The sampling was carried out three times in the vegetation period on 16–18 July, 27–28 August, and 28–29 October 2024 along a 1.7 km-long transect (coordinates 47.559967° N, 19.933996° E and 47.561963° N, 19.911739° E). Samples of both vegetative (stems and leaves) and reproductive (flowers and fruits) organs were collected from several individuals of each plant species across different patches. The samples were desiccated at 95 °C for 24 h, ground, and stored at −18 °C until laboratory analysis. Therefore, all reported concentrations are based on dry weight (DW). Supplementary Tables S1–S3 provide an overview of all sampled taxa, sampled organs, growth form categories, sampling dates, and sample numbers included in the study.
To characterize the environmental conditions preceding each sampling campaign, meteorological data were obtained from the Budapest Liszt Ferenc International Airport meteorological station (WMO 12839), the nearest long-term meteorological station to the study area. Daily observations were used to calculate 14-day summary statistics preceding each sampling campaign, including mean air temperature, mean daily maximum and minimum temperatures, cumulative precipitation, and mean relative humidity. In addition, vapor pressure deficit (VPD) was calculated as an indicator of atmospheric moisture demand using air temperature and relative humidity.
Saturation vapor pressure (es) was calculated according to the equation:
e s = 0.6108 · e x p 17.27 · T T + 237.3
Vapor pressure deficit was then calculated as
V P D = e s · 1 R H 100
where es is saturation vapor pressure (kPa); VPD is vapor pressure deficit (kPa); T is air temperature (°C); and RH is relative humidity (%). A summary of the meteorological variables and calculated VPD values for each sampling period is provided in Supplementary Table S4.

2.2. Mycotoxin Analysis

The plant samples were desiccated prior to laboratory analysis; thus, all reported mycotoxin concentrations are expressed on a dry weight (DW) basis. Absorbance measurements for all assays were conducted using a Thermo MultiskanTM FC microplate reader (Waltham, MA, USA) equipped with SkanIt RE software (version 6.1.1.7), at a wavelength of 450 nm with a reference wavelength of 630 nm.
The concentration of zearalenone (ZEN) was determined via a competitive enzyme immunoassay utilizing the Europroxima Zearalenone ELISA kit (R-Biopharm Nederland B.V., Arnhem, The Netherlands; catalog number: 5121ZON). Sample preparation employed the solid-phase extraction (SPE) method. Specifically, 1 g of finely ground plant sample was combined with 4 mL of 84% aqueous acetonitrile and homogenized head-over-head for 60 min. Following settling, 1 mL of the supernatant was evaporated to dryness under a gentle stream of nitrogen at 50 °C. The residue was then dissolved in a mixture of 400 µL of 100% methanol and 1600 µL of distilled water. To mitigate severe matrix effects—particularly prevalent in leaf samples due to pigments and secondary metabolites—a C18 solid-phase extraction (SPE) column was utilized as a clean-up step. The dissolved sample (2 mL) was applied to the column, washed with 3 mL of 20% aqueous acetone and 3 mL of 30% aqueous methanol, and ZEN was eluted with 2 × 1 mL of methanol. The eluate was evaporated under nitrogen at 50 °C and reconstituted in 500 µL of dilution buffer. ELISA measurements and data analysis were conducted in strict accordance with the manufacturer’s instructions.
Aflatoxin B1 (AFB1) quantification was performed using the Europroxima Aflatoxin B1 ELISA kit (R-Biopharm Nederland B.V., Arnhem, The Netherlands;catalog number: 5121 AFB). Approximately 1 g of the finely ground sample was weighed and mixed with 9 mL of 80% methanol, followed by thorough shaking for 10 min at 20–25 °C. The sample was then centrifuged for 10 min at 2000× g. An aliquot of 50 µL of the resulting supernatant was diluted with 150 µL of dilution buffer. The subsequent ELISA procedure and data evaluation were executed according to the manufacturer’s instructions.
The concentration of deoxynivalenol (DON) was quantified using a competitive ELISA kit (Catalog No: E-TO-E003, Elabscience Biotechnology Co., Ltd., Wuhan, China). For sample preparation, 1 g of the homogenized plant sample was placed in a 50 mL centrifuge tube and mixed with 10 mL of deionized water. The mixture was vortexed for 5 min and centrifuged at 4000 rpm for 10 min at room temperature. After centrifugation, 0.1 mL of the supernatant was transferred to a new tube and thoroughly mixed with 0.9 mL of reconstitution buffer. The ELISA assay was then performed following the manufacturer’s protocol.
The analytical limits of detection (LOD) were established at 6 ppb for zearalenone (ZEN), 0.5 ppb for aflatoxin B1 (AFB1), and 150 ppb for deoxynivalenol (DON).
To verify the reliability of the applied ELISA kits for our specific plant matrices, accuracy (recovery) and precision (intra-assay coefficient of variation, CV%) were evaluated by spiking representative homogenized plant samples (leaves and stems) with known quantities of mycotoxins. Our verification showed satisfactory recovery rates ranging from approximately 70% to 124%. The precision (CV%) consistently remained well below the widely accepted 15% threshold for complex biological samples (ranging predominantly between 7.5% and 13.7%), with only a single exception in a highly complex leaf matrix remaining under 17% (for detailed precision and recovery parameters, see Supplementary Table S5).

2.3. Statistical Analyses

The collected plant samples were classified according to three categorical variables: month of sampling (July, August, or October), growth form (woody, grasses, and herbs), and plant part (leaf, stem, fruit, seeds, and flowers). We examined whether there were significant differences in the concentrations of the measured mycotoxins (ZEN, AFB1, DON) between months, taxa, and plant parts. In our measurement results, the zero values reported for mycotoxin concentrations do not represent actual zeros but technical zeros, corresponding to concentrations below the limit of detection (LOD). We determined the co-occurrence frequencies of different toxins in plant species, growth form, organs, and months. In total, eight combinations (cases) were identified, depending on whether the mycotoxins were present (+) or absent (–) in each sample. We counted the frequency of all possible occurrence combinations. Concentrations below the LOD were interpreted as the absence of mycotoxin.
All analyses were performed using IBM SPSS Statistics 30.0.0.0 running on Windows 11. We calculated descriptive statistics. The data series for mycotoxin concentrations did not meet the assumptions of normality or homogeneity of variance, and the available sample sizes were too small to reliably apply multivariate statistical models capable of controlling for confounding among the three independent variables (growth form, plant organ, and month of sampling). Due to these methodological limitations, we conducted a non-parametric test (Mann–Whitney test) to evaluate the effects of each independent variable separately. We examined the individual group pairs using the Mann–Whitney U test, with 3 (month, growth form) and 6 (plant part) group pairs per category variable [28,29].

2.4. Data Visualization and Distribution Analysis

Violin plots were used to visualize the distribution of toxin concentrations across groups. The violin plot combines the features of a box plot and a density function, allowing the simultaneous interpretation of the distribution shape of measured values within groups as well as robust measures of central tendency and dispersion.
Each group (e.g., sampling month or taxonomic category) is represented by a separate violin. The shape of each violin is based on kernel density estimation calculated from the observed values; the width of the violin at a given position on the y-axis is proportional to the relative frequency expected within that concentration range. Accordingly, wider sections of the violin indicate higher data density (i.e., a greater number of observations), whereas narrower sections reflect lower density. The vertical extent of the violin represents the observed range of concentrations and allows visualization of distributional properties such as asymmetry (skewness), peakedness (kurtosis), and potential multimodality. A narrow box plot was overlaid on each violin plot. The lower and upper edges of the box correspond to the first (Q1) and third (Q3) quartiles, respectively, with the box height representing the interquartile range (IQR = Q3 − Q1). The horizontal line within the box indicates the median. This combined visualization enables direct comparison of robust descriptive statistics of central tendency and dispersion alongside the overall distribution shape across groups.
To improve visual interpretability, only extreme outliers were excluded from the violin and box plot rendering. Extreme outliers were identified separately for each group using Tukey’s rule, with observations falling outside the range [Q1 − 3 × IQR, Q3 + 3 × IQR] considered extreme. Importantly, this filtering was applied exclusively for graphical display purposes; all statistical analyses were conducted on the complete dataset, with outliers retained, ensuring that statistical inferences were not influenced by visual trimming. Statistically significant comparisons are indicated on the figures, with significance levels denoted by asterisks (* p < 0.05; ** p < 0.01; *** p < 0.001). The violin plots were created using the R environment (v. 4.3.3, R Core Team 2024) with the following packages: ‘dplyr’ [30], ‘ggplot2’ [31], ‘RColorBrewer’ [32], ‘ggsignif’ [33], ‘purrr’ [34].
To provide an ecological, toxicological, and regulatory context, measured mycotoxin concentrations were compared with the relevant European Union maximum and guidance values established for feed materials and complete feed, with particular emphasis on values applicable to young ruminants. The reference values used were 10 µg/kg for AFB1 in complete feed for calves, lambs and kids (20 µg/kg for feed materials), 2000 µg/kg for DON in complete feed for calves, lambs and kids, and 500 µg/kg for ZEN in complete feed for calves, dairy cattle, sheep and goats, according to the relevant EU legislation [35,36]. Where appropriate, the potential relevance for human food was considered in the Discussion. The comparison with EU regulatory values is intended solely to provide regulatory context, as the analytical results are expressed on a dry weight (DW) basis, whereas the corresponding EU regulatory values are established on an as-fed product basis.

3. Results

3.1. Overall Co-Occurrence Patterns

Only 13% of the 134 samples contained no investigated mycotoxins (Table S6). The most frequent contamination pattern was the simultaneous occurrence of all three mycotoxins (20%), whereas ZEN was the most common single toxin (16%). Among pairwise combinations, ZEN and DON co-occurred most frequently (15%).
Seasonal patterns differed markedly. In July, the simultaneous occurrence of all three mycotoxins predominated (25%; Table S7). In August, samples containing only ZEN became the most frequent (26%; Table S7). By October, AFB1 was no longer detected, whereas DON became dominant, either alone or together with ZEN (both 29%; Table S7), showing a seasonal shift from multi-toxin contamination toward DON-dominated contamination.

3.2. Organ-Specific Co-Occurrence

Organ-specific co-occurrence trends differed considerably (Table S8). Stems showed the highest proportion of mycotoxin-free samples (24%), whereas leaves were the most frequently contaminated, with the simultaneous occurrence of all three mycotoxins representing the dominant pattern (28%). In contrast, ZEN alone predominated in stems (32%) and flowers (31%), whereas fruits were characterized most frequently by the combined occurrence of ZEN and AFB1 (22%). Some combinations were absent from specific organs, including AFB1 alone in stems and the joint occurrence of AFB1 and ZEN in flowers.

3.3. Growth-Form Differences in Co-Occurrence

Patterns of co-occurrence also differed among growth forms (Table S9). Simultaneous occurrence of all three mycotoxins was most frequent in woody species (28%), whereas grasses were characterized primarily by the occurrence of ZEN alone (46%). Herbaceous species most commonly contained both ZEN and AFB1 (24%). Woody species displayed the most even distribution of contamination patterns, while several AFB1- and DON-containing combinations were completely absent from grasses.

3.4. Temporal Variation in Mycotoxin Concentration of Plant Species
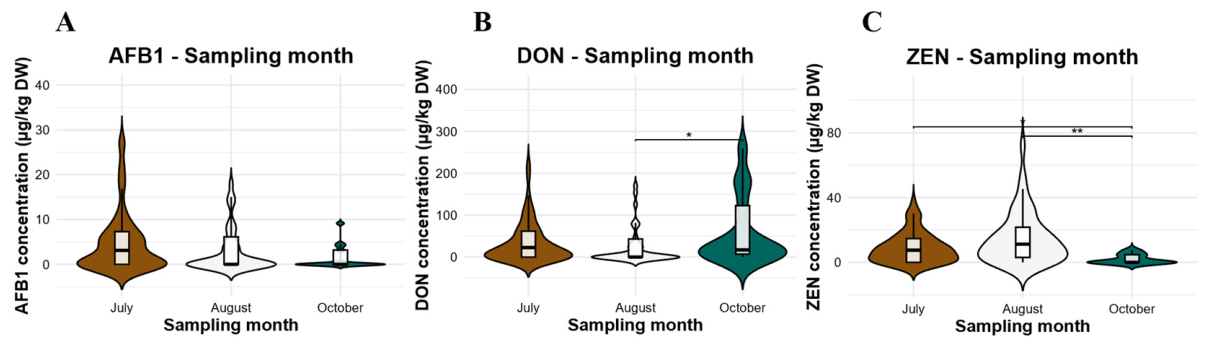
AFB1 concentration distributions did not differ significantly across sampling months according to pairwise Mann–Whitney U tests (Figure 2A; Table S10). Nevertheless, the concentration range gradually decreased from July to October, with several high-concentration observations occurring in August. These extreme values were detected mainly in woody species, including Rosa canina and Rosa rubiginosa, where AFB1 concentrations exceeded the European Union guidance value and reached 55.00 µg/kg DW in leaves and 71.96 µg/kg DW in fruits (Tables S15–S20).
Figure 2. Temporal variation in mycotoxin concentrations in wild plant species near agricultural fields. (A) AFB1 concentrations did not show significant seasonal differences; however, both median values and distribution ranges gradually decreased from July to October. (B) DON concentrations differed significantly between August and October, reflecting a shift toward higher values in October and the presence of an extreme August observation. (C) ZEN concentrations did not differ significantly between July and August, whereas October samples showed significantly lower values and a more compact distribution. Violin plots represent kernel density distributions with embedded boxplots (median and interquartile range). * p < 0.05; ** p < 0.01.
Environments 13 00405 g002
DON concentrations also exhibited a distinct seasonal pattern. A significant difference was found between August and October, whereas July did not differ significantly from either month (Table S11). Although an exceptionally high DON concentration of 1541.72 µg/kg DW was recorded in vegetative tissues of Salix cinerea in August, the violin plots indicated a general shift toward higher DON concentrations in October (Figure 2B). This maximum value approached the European Union guidance value established for complete feed intended for young ruminants (Tables S15–S20).
Seasonal differences were detected for both ZEN and DON (Figure 2B,C). ZEN concentrations differed significantly between the summer and autumn sampling periods, whereas July and August did not differ significantly (Table S11). October samples showed significantly lower concentrations than those collected during summer. The highest ZEN concentration (89.78 µg/kg DW) was recorded in August in leaves of Verbascum phlomoides (Tables S15–S20).

3.5. Mycotoxin Contamination of Plant Organs

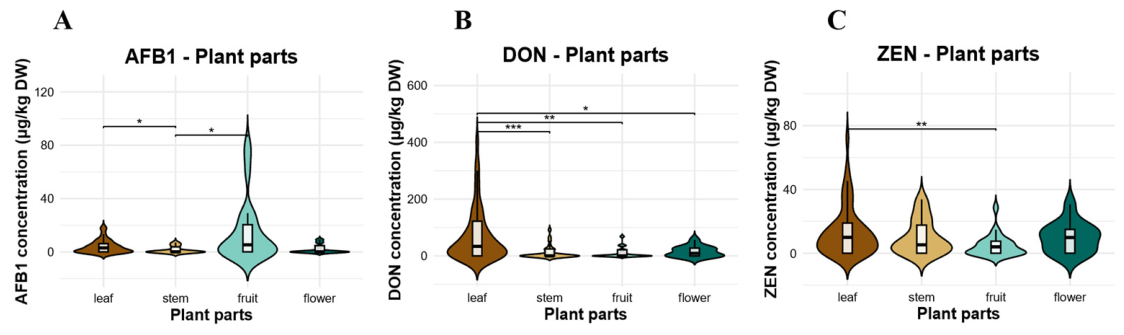
Mycotoxin concentrations differed among plant organs, although considerable within-group variation was observed (Figure 3A–C; Tables S12 and S13). AFB1 concentrations were significantly higher in leaves than in stems and fruits, whereas no significant differences were detected among the remaining pairwise comparisons (Table S13). The highest AFB1 concentration (81.08 µg/kg DW) was detected in fruits. Concentrations exceeding the European Union guidance value were recorded in leaves of Populus alba and Rosa rubiginosa, stems of Salix alba and Prunus spinosa, fruits of Rosa canina, Gleditsia triacanthos, Rosa rubiginosa, Lathyrus tuberosus, and Epilobium parviflorum, as well as flowers of Chenopodium album (Tables S15–S20).
Figure 3. Organ-level variation in mycotoxin concentrations in wild plants near agricultural fields. Violin plots represent kernel distribution densities with embedded boxplots (median and interquartile range). (A) AFB1 concentrations were higher in fruits and leaves than in stems. (B) DON showed the widest distribution in leaves. (C) ZEN had relatively similar distributions throughout organs, with slightly greater variation in leaves. * p < 0.05; ** p < 0.01; *** p < 0.001.
Environments 13 00405 g003
DON exhibited the clearest organ-specific differences. Leaves contained significantly higher DON concentrations than stems, fruits, and flowers, whereas the latter three organs did not differ significantly from one another (Table S13). The highest DON concentration (1541.72 µg/kg DW) was measured in leaves of Salix cinerea, indicating that a limited number of highly contaminated leaf samples contributed substantially to the observed differences (Tables S19 and S20).
ZEN showed comparatively weak organ-specific variation. A significant difference was detected only between leaves and fruits, whereas the remaining comparisons were not significant (Table S13). The highest ZEN concentrations remained below the European Union guidance value. Overall, organ-specific differences were most pronounced for DON, intermediate for AFB1, and weakest for ZEN.

3.6. Mycotoxin Contamination of Major Plant Growth Forms

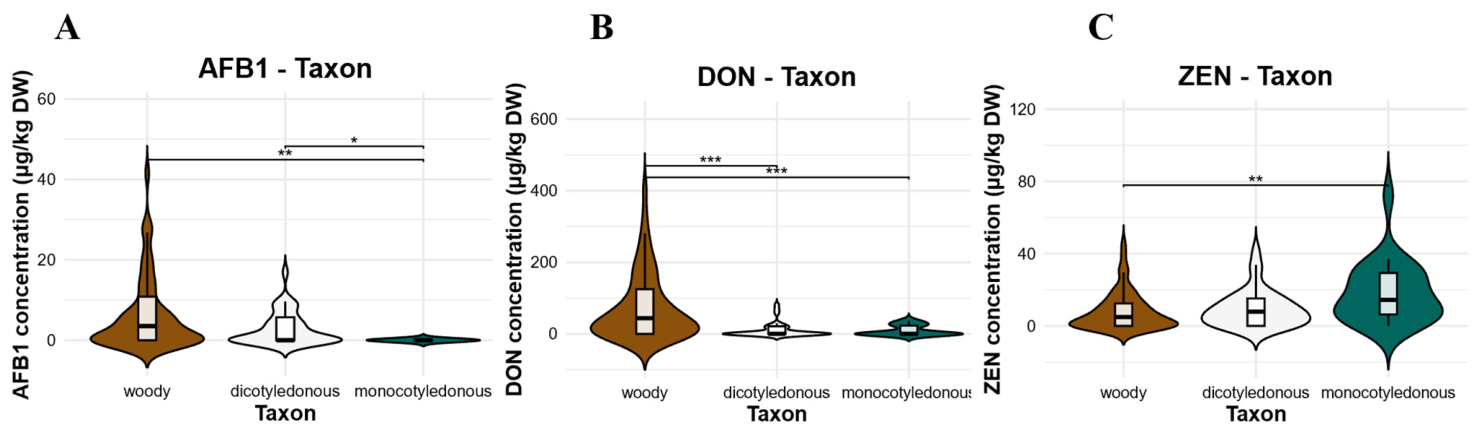
Mycotoxin concentrations differed among woody species, monocotyledonous grasses, and dicotyledonous herbaceous species, although the magnitude of these differences varied among the investigated mycotoxins (Figure 4A–C; Tables S14 and S15). AFB1 concentrations were significantly lower in grasses than in woody species and herbaceous species, whereas woody and herbaceous species did not differ significantly (Table S15). The highest AFB1 concentrations exceeding the European Union guidance value occurred primarily in woody species and, to a lesser extent, in herbaceous species (Tables S15–S20). Consistent with the co-occurrence analysis, AFB1-containing combinations were uncommon in grasses.
Figure 4. Growth form–specific variation in mycotoxin concentrations in wild plants near agricultural fields. Violin plots represent kernel density distributions with embedded boxplots (median and interquartile range). (A) AFB1 was highest in woody species. (B) DON showed markedly higher and more variable concentrations in woody species. (C) ZEN concentration differed among groups, with broader distributions in woody species and grasses (monocotyledons), but it was highest in grasses. * p < 0.05; ** p < 0.01; *** p < 0.001.
Environments 13 00405 g004
DON exhibited the greatest form-specific growth differences. Woody species contained significantly higher DON concentrations than both grasses and herbaceous species, whereas the latter two groups did not differ significantly (Table S15). The highest DON concentration (1541.72 µg/kg DW) was detected in Salix cinerea, and only this sample approached the European Union guidance value. Co-occurrence analysis similarly showed that DON-containing combinations were most frequent in woody species, identifying them as the principal contributors to elevated DON contamination in semi-natural vegetation adjacent to agricultural fields.
ZEN showed comparatively weak differentiation among growth forms. Concentrations were significantly higher in grasses than in woody species, whereas the remaining pairwise comparisons were not significant (Table S15). Although grasses exhibited the highest ZEN concentrations, none exceeded the European Union guidance value (Tables S15–S20). Overall, growth form effects were strongest for DON, intermediate for AFB1, and weakest for ZEN, with woody species representing the principal source of elevated AFB1 and DON concentrations in the investigated semi-natural vegetation.

4. Discussion

4.1. Conceptual Synthesis of the Main Findings

The present study demonstrates that mycotoxin contamination in wild plants is primarily determined by seasonal dynamics and plant growth form, whereas plant organ exerts a comparatively weaker and less consistent influence. Seasonal variation affected not only contamination levels but also the composition of mycotoxin profiles, shifting from frequent multi-toxin co-occurrence in midsummer to more toxin-specific patterns later in the growing season. Growth form proved to be a major determinant of contamination, while unexpectedly high mycotoxin concentrations in vegetative organs, particularly leaves, indicate that contamination is not restricted to reproductive tissues.
The recorded patterns most likely reflect the combined effects of fungal community dynamics, plant phenology, and environmental conditions operating within semi-natural habitats, rather than isolated ecological processes. At the same time, considerable variability among plant species indicates that host characteristics additionally contribute to mycotoxin accumulation. Although woody species showed the highest contamination overall, these patterns were driven primarily by a limited number of species. In particular, Rosa rubiginosa and Rosa canina consistently accumulated multiple mycotoxins, Prunus spinosa exhibited the highest AFB1 concentrations, and Salix cinerea contained the highest DON concentration recorded in the present study.
Together, these findings question the traditional crop-centered perspective in mycotoxin research by demonstrating that semi-natural vegetation can serve as an ecologically relevant reservoir of multiple mycotoxins. They further highlight the relevance of considering seasonal dynamics, plant growth form, and species composition when assessing environmental mycotoxin exposure. The results are especially pertinent to herbivorous wildlife and may also have implications regarding human exposure through the consumption of certain wild edible plant species, such as rose hips.

4.2. Seasonal Variability

The pronounced seasonal changes observed in mycotoxin occurrence indicate that contamination of wild vegetation is a dynamic process affected by multiple interacting ecological factors. Rather than a gradual increase or decrease in contamination, mycotoxin profiles changed substantially during the growing season, with multi-toxin co-occurrence predominating in July, ZEN becoming the dominant toxin in August, and DON prevailing in October. These time-related changes suggest that different fungal communities or metabolic pathways may become dominant as environmental conditions and host plants change throughout the vegetation period.
The seasonal differences observed in mycotoxin occurrence and concentration were probably influenced, at least in part, by the contrasting meteorological conditions preceding each sampling period, as reflected by vapor pressure deficit (VPD), which integrates temperature- and humidity-driven atmospheric moisture demand. The hot and dry weather before the July sampling was defined by the highest VPD (≈2.35 kPa), signifying strong atmospheric water demand and potential plant water stress, conditions generally considered less favorable for active fungal development [21]. Nevertheless, the frequent co-occurrence of DON, ZEN, and AFB1 suggests that multiple fungal taxa had already colonized plant tissues earlier in the season, with toxins potentially persisting under drought conditions. The August period showed intermediate VPD values (≈1.80 kPa) together with intermittent rainfall, conditions that may have favored fungal activity and could partly explain the wider concentration ranges and extreme DON and ZEN values observed during this period [8,21]. In contrast, the lowest VPD (≈0.28 kPa) occurred before the October sampling, reflecting cool and humid conditions; however, DON concentrations remained relatively high, suggesting that toxin accumulation may reflect cumulative seasonal fungal activity and persistence in senescing tissues rather than only recent weather conditions. The absence of detectable AFB1 in October is consistent with the cooler, more humid environmental conditions during this period, although no direct causal relationship can be inferred from the present data. Overall, VPD provides a useful integrative descriptor of weather conditions that may complement the interpretation of seasonal mycotoxin dynamics. However, the recorded patterns should be interpreted as the combined outcome of weather conditions, plant phenology, host traits, tissue type, and fungal community composition rather than as evidence of direct climatic control [21,37,38].
Previous studies have shown that temperature, moisture availability, and host phenology strongly influence fungal community composition and mycotoxin production [10,21,24,27]. Recent distribution modeling further suggests that climate change may substantially expand the potential range of mycotoxigenic Fusarium species, increasing contamination risks in regions that have historically been less affected [37]. However, most available evidence originates from cultivated crops, whereas comparable information for semi-natural vegetation remains scarce. Our results show that wild plant communities adjacent to agricultural fields also exhibit clear temporal shifts in mycotoxin contamination, suggesting that these habitats dynamically adjust to evolving environmental conditions throughout the growing season. The predominance of ZEN in late summer, followed by increased DON in autumn, is broadly consistent with previous observations that different Fusarium metabolites exhibit distinct seasonal dynamics under field conditions [39]. Nevertheless, the marked seasonal succession observed in the present study shows that contamination patterns in wild vegetation cannot be inferred from a single sampling period. Instead, repeated sampling throughout the vegetation season is required to characterize both overall contamination levels and seasonal shifts in mycotoxin composition. This temporal variability is consistent with recent European surveys showing that the occurrence and co-occurrence of mycotoxins are strongly influenced by climatic region and sampling period [38].
Although seasonal environmental conditions likely represent one of the principal drivers of the noted patterns, the present study was not designed to identify causal relationships between individual climatic variables and mycotoxin production. Consequently, the observed seasonal variation should be interpreted as the combined outcome of weather conditions, fungal community dynamics, plant phenology, and host–microorganism interactions, all of which are expected to become increasingly important under ongoing climate change [21]. Multi-year studies that merge detailed meteorological observations with fungal community analyses would provide more mechanistic insight into these time-based dynamics.

4.3. Growth Form Differences

Plant growth form emerged as one of the strongest determinants of mycotoxin contamination in the present study. Woody species consistently presented higher AFB1 and DON concentrations than herbaceous growth forms, whereas grasses were distinguished by higher ZEN concentrations. These results show that growth form represents an important ecological factor influencing mycotoxin occurrence in semi-natural vegetation. The observed differences are likely to reflect a combination of plant longevity, species-specific traits, and differences in fungal community composition associated with contrasting growth forms [10,27]. In contrast, grasses have repeatedly been reported as important hosts of Fusarium species, which may explain their comparatively higher ZEN concentrations [10,27]. Our results further demonstrate that the elevated contamination observed in the woody growth form was not uniformly distributed among all woody species but was largely driven by a limited number of taxa. In particular, Rosa rubiginosa and Rosa canina consistently accumulated multiple mycotoxins, Prunus spinosa exhibited particularly high AFB1 concentrations, and Salix cinerea contained the highest DON concentration detected in this study. These data suggest that species-specific characteristics, in addition to growth form itself, may substantially influence mycotoxin accumulation. At the same time, these patterns should be interpreted with appropriate caution. The number of sampled species and the distribution of samples among growth-form categories were not fully balanced, and the available dataset did not permit analyses that simultaneously controlled for species identity, growth form, plant organ, and sampling date. Consequently, part of the observed variation may reflect differences in sample composition rather than real biological differences. Future studies based on more balanced sampling designs and larger datasets will help to distinguish the relative contributions of growth form, species identity, and environmental conditions to mycotoxin contamination in wild vegetation.

4.4. Organ-Specific Patterns and Monitoring

Compared with seasonal variation and growth form, plant organs had a relatively limited influence on mycotoxin contamination. Significant differences among plant organs were detected only for DON, primarily between leaves and stems and between leaves and fruits. Nevertheless, leaves consistently exhibited the highest contamination frequencies and, in several cases, higher toxin concentrations than reproductive organs. These findings indicate that mycotoxin accumulation in wild plants is not restricted to seeds or fruits but frequently occurs in vegetative tissues as well. The pronounced contamination of leaves agrees with previous reports demonstrating that DON and ZEN may accumulate in vegetative plant tissues under field conditions [38,40]. In addition, plant metabolism may modify the distribution of mycotoxins because several compounds occur in conjugated (“masked”) forms within vegetative tissues, influencing both their accumulation and analytical detectability [41]. Together, these findings suggest that monitoring programs focusing exclusively on reproductive organs may underestimate the overall occurrence of mycotoxins in semi-natural vegetation.
However, the observed organ-specific patterns should be interpreted with appropriate caution. Plant organs were not represented equally across all sampled species and growth forms, making it difficult to separate intrinsic organ-specific differences from species-related variation. Consequently, part of the observed variability may reflect differences in sample composition rather than true biological differences among plant organs. Future studies employing balanced within-species sampling across multiple plant organs will be required to resolve these effects more conclusively.

4.5. Ecological and Food Safety Implications

The present study suggests that semi-natural vegetation adjacent to agricultural fields may serve as an ecologically relevant source of mycotoxin exposure rather than simply a passive component of agricultural landscapes. The frequent occurrence of multiple mycotoxins, together with the pronounced seasonal variation observed in contamination profiles, indicates that herbivorous wildlife may be exposed to dynamically changing mixtures of mycotoxins throughout the vegetation period. This observation supports previous suggestions that non-crop vegetation can contribute to the environmental persistence of toxigenic fungi and associated mycotoxins [10,27]. Exposure to naturally occurring mixtures of mycotoxins may be more ecologically relevant than exposure to individual compounds because the combined toxic effects cannot always be predicted from the toxicity of single mycotoxins. This agrees with recent broad surveys demonstrating that co-occurrence of multiple mycotoxins is the prevailing pattern in European feed materials and agricultural environments [39]. Importantly, many of the plant species included in the present study represent natural food resources for free-ranging herbivorous mammals inhabiting Central European agricultural landscapes. European roe deer and red deer are known to consume several of the investigated grasses, herbaceous species, and woody plants, including Agropyron repens, Prunus spinosa, Robinia pseudoacacia, Rubus spp., Salix spp., and Sambucus nigra [13,42]. Brown hares also regularly consume Rosa spp. and Prunus spp. [43]. Consequently, the contaminated plants identified in the present study are not mere potential reservoirs of toxigenic fungi but constitute realistic dietary pathways through which mycotoxins may enter terrestrial food webs. Although the present study did not investigate mycotoxin transfer or bioaccumulation in animals, the occurrence of mycotoxins in plant species consumed by wild herbivores suggests a potential route of entry into terrestrial food webs. Whether this results in measurable transfer to higher trophic levels remains unknown and demands targeted investigations under natural conditions.
From a regulatory perspective, comparison with European Union guidance and maximum values indicates that most measured concentrations remained low, whereas only a limited number of samples approached or exceeded values established for animal feed [35,36]. Nevertheless, the presence of elevated concentrations alone does not necessarily indicate a significant toxicological risk, as risk assessment should also consider exposure patterns and the overall context of contamination [44]. These comparisons are intended solely to provide a regulatory context, as the analytical results are expressed on a dry weight (DW) basis, whereas the corresponding EU regulatory values are established for feed or food commodities on their respective regulatory bases. Moreover, wild plant species are not directly covered by existing regulatory systems. Accordingly, the observed exceedances should not be interpreted as evidence of direct toxicological risk to wildlife or humans, but rather as indicators that certain wild plant species may occasionally contain mycotoxin concentrations that warrant further attention. Nevertheless, the occurrence of elevated mycotoxin concentrations in a few widely distributed edible taxa, particularly Rosa canina, suggests that occasional exposure through consumption of wild plant products cannot be ruled out and warrants further investigation.
Overall, our findings broaden the current understanding of environmental mycotoxin contamination by demonstrating that semi-natural vegetation contributes to mycotoxin dynamics beyond cultivated crops. Incorporating wild plant communities into future environmental monitoring programs may therefore improve the assessment of exposure pathways and help provide a more complete understanding of mycotoxin ecology in agricultural landscapes [40].

4.6. Strengths, Limitations, and Future Perspectives

The present study provides a comprehensive ecological assessment of mycotoxin contamination in wild vegetation across seasons, plant organs, and growth forms. It was designed as an ecological screening study to identify contamination patterns and environmental drivers in semi-natural vegetation, rather than as an analytical-method validation or regulatory compliance study. As with any field-based ecological investigation, the findings should therefore be interpreted in light of several methodological considerations.
First, mycotoxin concentrations were determined using commercially available ELISA assays. These immunoassays were selected because they offer a practical, high-throughput approach for screening a large number of ecologically diverse field samples from numerous plant species and organs. Although ELISA methods are well established for first-tier mycotoxin screening, immunoanalytical techniques may be affected by matrix effects and cross-reactivity. Consequently, the measured concentrations should be interpreted primarily as indicators of contamination patterns rather than definitive analytical values for individual samples. Future studies using chromatographic techniques such as LC-MS/MS would provide additional analytical confirmation, particularly for samples with the highest mycotoxin concentrations and for quantitative validation of the observed contamination patterns [45,46].
Second, the sampling design was intended to maximize plant diversity across the study area rather than to achieve even representation of species, growth forms, plant organs, and sampling dates. Consequently, some observed differences may partly reflect variation in sample composition as well as genuine biological differences. Upcoming investigations using larger, more balanced datasets will enable a more in-depth evaluation of the relative contributions of these factors.
Finally, the present study is a one-year survey of mycotoxin contamination in wild vegetation. Although seasonal trends were clearly detected, longer-term monitoring that integrates detailed meteorological observations, fungal community analyses, and chromatographic confirmation of selected samples would provide a more comprehensive understanding of the ecological drivers and consequences of mycotoxin contamination in semi-natural vegetation.
Despite these limitations, the present study is among the first large-scale ecological screening surveys to investigate AFB1, DON, and ZEN contamination across a taxonomically and functionally diverse assemblage of wild plant species in agricultural landscapes. The outcomes provide an important baseline for future ecological and analytical studies and show that semi-natural vegetation deserves greater consideration in environmental mycotoxin monitoring.

5. Conclusions

This study demonstrates that wild plant species growing in semi-natural vegetation adjacent to agricultural areas can harbor detectable concentrations of multiple mycotoxins, including ZEN, AFB1, and DON. The results indicate that mycotoxin occurrence in vegetation is primarily shaped by seasonal conditions and growth form affiliation, while plant organ plays a comparatively minor role. Notably, woody species exhibited unexpectedly high DON concentrations, and contamination in vegetative organs, especially leaves, was higher than in reproductive organs, suggesting that field margins and shelter belts may function as underestimated reservoirs for mycotoxin-producing fungi.
Seasonal differences, particularly the elevated ZEN concentrations observed in late summer, highlight the strong influence of temperature and moisture conditions on mycotoxin dynamics, underscoring the potential sensitivity of these processes to ongoing climate change. The limited organ-specific patterns further suggest that focusing monitoring efforts exclusively on generative plant parts may underestimate overall mycotoxin presence in natural vegetation.
Taken together, these findings challenge traditional crop-centered perspectives on mycotoxin contamination and emphasize the ecological relevance of wild plants in agricultural landscapes. While the study is constrained by uneven sampling and the absence of fungal community data, it provides a basis for future integrative research combining mycotoxin analysis with fungal ecology to better assess environmental reservoirs and exposure pathways under changing environmental conditions. Beyond their environmental importance, these outcomes also carry practical implications for mycotoxin monitoring and risk management. Semi-natural vegetation surrounding agricultural fields should not be neglected in surveillance programs, as it may increase environmental exposure for wildlife and, in certain cases, indirect human exposure through the consumption of edible wild plants. Incorporating wild vegetation into future monitoring strategies may improve our knowledge of environmental mycotoxin reservoirs and support more extensive risk assessment and management approaches in agricultural landscapes.

Supplementary Materials

The following supporting information can be downloaded at: https://www.mdpi.com/article/10.3390/environments13070405/s1. Table S1: Summary of plant species collected in July, and the mycotoxin concentrations detected in them (µg/kg DW). Cases where the collected sample ran out were labeled N.s (No sample left) in the table; Table S2: Summary of plant species collected in August, and the mycotoxin concentrations detected in them (µg/kg DW). Cases where the collected sample ran out were labeled N.s (No sample left) in the table; Table S3: Summary of plant species collected in October, and the mycotoxin concentrations detected in them (µg/kg DW); Table S4: Meteorological conditions during the 14 days preceding each sampling period; Table S5: Immunoassay verification parameters (recovery and precision) for representative plant matrices (Rosa canina leaf and Elymus repens stem).; Table S6: Frequency of co-occurrence of mycotoxins in all examined plant species during the whole period of the study; Table S7: Co-occurrence of mycotoxins in all examined plant species in the different months; Table S8: Co-occurrence of mycotoxins in plant organs during the whole period of the study; Table S9: Co-occurrence of mycotoxins in different taxa during the whole period of the study; Table S10: Descriptive statistics of temporal variation in mycotoxin contamination (µg/kg DW) of plant species; Table S11: Results of Mann–Whitney U tests with pairwise comparison of temporal change in mycotoxin concentrations of wild plant species. Statistically significant values are indicated in bold. (U = Mann–Whitney test statistic; W = Wilcoxon rank-sum statistic; Z = standardized test statistic; p = two-tailed significance level, *: p < 0.05, **: p < 0.01.); Table S12: Descriptive statistics in mycotoxin contamination of plant organs (µg/kg DW); Table S13: Results of Mann–Whitney tests with pairwise comparison in the case of plant organs. Statistically significant values are indicated in bold. (U = Mann–Whitney test statistic; W = Wilcoxon rank-sum statistic; Z = standardized test statistic; p = two-tailed significance level, *: p < 0.05, **: p < 0.01, ***: p < 0.001.); Table S14: Descriptive statistics in mycotoxin contamination (µg/kg DW) of growth forms: woody, monocotyledonous (grasses), and dicotyledonous (herbs) herbaceous species; Table S15: Results of Mann–Whitney U tests with pairwise comparison in the case of growth forms. Statistically significant values are indicated in bold. (U = Mann–Whitney test statistic; W = Wilcoxon rank-sum statistic; Z = standardized test statistic; p = two-tailed significance level, *: p < 0.05, **: p < 0.01, ***: p < 0.001.); Table S16: Main descriptive statistical data on the temporal change in mycotoxin concentrations in leaves of different growth forms (µg/kg DW). (An asterisk and bold formatting indicate mycotoxin concentrations exceeding or approaching the relevant European Union guidance value for feed materials relevant to young ruminants.); Table S17: Main descriptive statistical data on the temporal change in mycotoxin concentrations in stems of different growth forms (µg/kg DW). (An asterisk and bold formatting indicate mycotoxin concentrations exceeding or approaching the relevant European Union guidance value for feed materials relevant to young ruminants.); Table S18: Main descriptive statistical data on the temporal change in mycotoxin concentrations in fruits of different growth forms (µg/kg DW). (An asterisk and bold formatting indicate mycotoxin concentrations exceeding or approaching the relevant European Union guidance value for feed materials relevant to young ruminants.); Table S19: Main descriptive statistical data on the temporal change in mycotoxin concentrations in flowers of different growth forms (µg/kg DW). (An asterisk and bold formatting indicate mycotoxin concentrations exceeding or approaching the relevant European Union guidance value for feed materials relevant to young ruminants.); Table S20: Summary of mycotoxin concentrations exceeding or close to the European Union guidance value for feed materials relevant to young ruminants (µg/kg DW).

Author Contributions

Conceptualization, L.S., M.M., Z.S., and S.S.; methodology, M.M., L.S., D.S., and A.A.; formal analysis, A.A., D.S., M.M., and P.P., investigation, Z.S., M.M., A.A., and P.P.; resources, Z.S., L.S., and S.S.; data curation, M.M., A.A., D.S., and P.P.; writing—original draft preparation, M.M., D.S., S.S., Z.S., and L.S.; writing—review and editing, M.M., S.S., L.S., and Z.S.; visualization, A.A., M.M., D.S., and S.S.; supervision, L.S.; project administration, S.S.; funding acquisition, L.S. All authors have read and agreed to the published version of the manuscript.

Funding

This research was funded by the Hungarian Hunters’ National Chamber (2020–2024), the Rector’s Research Grant Program (RTP) of the University of Pécs, grant number 011_2025_PTE_RK/3, and Flagship Research Groups 2026, EcoHealth Research Group within the Flagship Research Groups Program of the Hungarian University of Agriculture and Life Science.

Data Availability Statement

The data presented in this study are available on request from the corresponding author.

Acknowledgments

During the preparation of this manuscript, the authors used ChatGPT (OpenAI, GPT-5.5) for language editing and improvement of readability and style. The authors reviewed and edited all generated content and take full responsibility for the content of this publication.

Conflicts of Interest

The authors declare no conflicts of interest. The funders had no role in the design of the study, in the collection, analyses, or interpretation of data, in the writing of the manuscript, or in the decision to publish the results.

References

  1. Krska, R.; De Nijs, M.; McNerney, O.; Pichler, M.; Gilbert, J.; Edwards, S.; Suman, M.; Magan, N.; Rossi, V.; Van der Fels, I.; et al. Safe food and feed through an integrated toolbox for mycotoxin management: The MyToolBox approach. World Mycotoxin J. 2016, 9, 487–495. [Google Scholar] [CrossRef] [Scilit]
  2. Eskola, M.; Kos, G.; Elliott, C.T.; Hajšlová, J.; Mayar, S.; Krska, R. Worldwide contamination of food-crops with mycotoxins: Validity of the widely cited ‘FAO estimate’ of 25%. Crit. Rev. Food Sci. Nutr. 2020, 60, 2773–2789. [Google Scholar] [CrossRef] [Scilit] [PubMed]
  3. Malir, F.; Pickova, D.; Toman, J.; Grosse, Y.; Ostry, V. Hazard characterisation for significant mycotoxins in food. Mycotoxin Res. 2023, 39, 81–93. [Google Scholar] [CrossRef] [Scilit] [PubMed]
  4. Miller, J.D. Epidemiology of Fusarium ear diseases of cereals. In Mycotoxins in Grain: Compounds Other Than Aflatoxin; Miller, J.D., Trenholm, H.L., Eds.; Eagan Press: St. Paul, MN, USA, 1994; pp. 19–36. [Google Scholar]
  5. Zinedine, A.; Durand, N.; Meile, J.-C.; Abbès, S.; Ben Salah-Abbès, J.; Brabet, C. Determination of 22 mycotoxins in wheat grains cultivated in two climatic areas by UHPLC-MS/MS. Food Chem. 2025, 495, 146356. [Google Scholar] [CrossRef] [Scilit] [PubMed]
  6. Fung, F.; Clark, R.F. Health effects of mycotoxins: A toxicological overview. J. Toxicol. Clin. Toxicol. 2004, 42, 217–234. [Google Scholar] [CrossRef] [Scilit] [PubMed]
  7. Nichea, M.J.; Palacios, S.A.; Chiacchiera, S.M.; Sulyok, M.; Krska, R.; Chulze, S.N.; Torres, A.M.; Ramirez, M.L. Presence of Multiple Mycotoxins and Other Fungal Metabolites in Native Grasses from a Wetland Ecosystem in Argentina Intended for Grazing Cattle. Toxins 2015, 7, 3309–3329. [Google Scholar] [CrossRef] [Scilit] [PubMed]
  8. Kolackova, I.; Smolkova, B.; Skladanka, J.; Kouril, P.; Hrudova, E. Epiphytic microflora and mycotoxin content in meadows—Is plant biodiversity affecting fungal contamination? PLoS ONE 2023, 18, e0288397. [Google Scholar] [CrossRef] [Scilit] [PubMed]
  9. Postic, J.; Cosic, J.; Vrandecic, K.; Jurkovic, D.; Saleh, A.A.; Leslie, J.F. Diversity of Fusarium species isolated from weeds and plant debris in Croatia. J. Phytopathol. 2012, 160, 76–81. [Google Scholar] [CrossRef] [Scilit]
  10. Gerling, M.; Petry, L.; Barkusky, D.; Butter, C.; Müller, M.E.H. Infected grasses as inoculum for Fusarium infestation and mycotoxin accumulation in wheat with and without irrigation. Mycotoxin Res. 2023, 39, 19–31. [Google Scholar] [CrossRef] [Scilit] [PubMed]
  11. Janavičienė, S.; Venslovas, E.; Kadziene, G.; Matelioniene, N.; Berzina, Z.; Bartkevics, V.; Suproniene, S. Diversity of mycotoxins produced by Fusarium strains infecting weeds. Toxins 2023, 15, 420. [Google Scholar] [CrossRef] [Scilit] [PubMed]
  12. Savary, S.; Willocquet, L.; Pethybridge, S.J.; Esker, P.; McRoberts, N.; Nelson, A. The global burden of pathogens and pests on major food crops. Nat. Ecol. Evol. 2019, 3, 430–439. [Google Scholar] [CrossRef] [Scilit] [PubMed]
  13. Szemethy, L.; Mátrai, K.; Bíró, Z.; Katona, K. Seasonal home range shift of red deer in a forest-agriculture area in southern Hungary. Acta Theriol. 2003, 48, 547–556. [Google Scholar] [CrossRef] [Scilit]
  14. Storms, D.; Aubry, P.; Hamann, J.L.; Saïd, S.; Fritz, H.; Saint-Andrieux, C.; Klein, F. Seasonal variation in diet composition and similarity of sympatric red deer Cervus elaphus and roe deer Capreolus capreolus. Wildl. Biol. 2008, 14, 237–250. [Google Scholar] [CrossRef] [Scilit]
  15. Minder, I. Local and seasonal variations of roe deer diet in relation to food resource availability in a Mediterranean environment. Eur. J. Wildl. Res. 2012, 58, 215–225. [Google Scholar] [CrossRef] [Scilit]
  16. Fischer, C.; Thies, C.; Tscharntke, T. Small mammals in agricultural landscapes: Opposing responses to farming practices and landscape complexity. Biol. Conserv. 2011, 144, 1130–1136. [Google Scholar] [CrossRef] [Scilit]
  17. Rattner, B.A.; Lazarus, R.S.; Elliott, J.E.; Shore, R.F.; van den Brink, N. Adverse outcome pathway and risks of anticoagulant rodenticides to predatory wildlife. Env. Sci. Technol. 2014, 48, 8433–8445. [Google Scholar] [CrossRef] [Scilit] [PubMed]
  18. Elliott, J.E.; Hindmarch, S.; Albert, C.A.; Emery, J.; Mineau, P.; Maisonneuve, F. Exposure pathways of anticoagulant rodenticides to nontarget wildlife. Environ. Monit. Assess. 2014, 186, 895–906. [Google Scholar] [CrossRef] [Scilit] [PubMed]
  19. Lakatos, I.; Babarczi, B.; Molnár, Z.; Tóth, A.; Skoda, G.; Horváth, G.F.; Horváth, A.; Tóth, D.; Sükösd, F.; Szemethy, L.; et al. First Results on the Presence of Mycotoxins in the Liver of Pregnant Fallow Deer (Dama dama) Hinds and Fetuses. Animals 2024, 14, 1039. [Google Scholar] [CrossRef] [Scilit] [PubMed]
  20. Fehér, P.; Molnár, Z.; Pálfi, M.P.; Pálfiné Lábadi, A.; Plank, P.; Lakatos, I.; Heltai, M.; Szemethy, L.; Stéger, V.; Szőke, Z. The initial detection of mycotoxins released and accumulated in the golden jackal (Canis aureus): Investigating the potential of carnivores as environmental bioindicators. Int. J. Mol. Sci. 2025, 26, 3755. [Google Scholar] [CrossRef] [Scilit] [PubMed]
  21. Casu, A.; Camardo, L.M.; Toscano, P.; Battilani, P. Changing climate, shifting mycotoxins: A comprehensive review of climate change impact on mycotoxin contamination. Compr. Rev. Food Sci. Food Saf. 2024, 23, e13323. [Google Scholar] [CrossRef] [Scilit] [PubMed]
  22. Magan, N.; Aldred, D.; Hope, R.; Mitchell, D. Environmental factors and interactions with mycobiota of grain and grapes: Effects on growth, deoxynivalenol and ochratoxin production by Fusarium culmorum and Aspergillus carbonarius. Toxins 2010, 2, 353–366. [Google Scholar] [CrossRef] [Scilit] [PubMed]
  23. Paterson, R.R.M.; Lima, N. How will climate change affect mycotoxins in food? Food Res. Int. 2010, 43, 1902–1914. [Google Scholar] [CrossRef] [Scilit]
  24. Medina, A.; Rodríguez, A.; Magan, N. Effect of climate change on Aspergillus flavus and aflatoxin B1 production. Front. Microbiol. 2014, 5, 348. [Google Scholar] [CrossRef] [Scilit] [PubMed]
  25. Spinoni, J.; Vogt, J.; Naumann, G.; Barbosa, P.; Dosio, A. Will drought events become more frequent and severe in Europe? Int. J. Climatol. 2018, 38, 1718–1736. [Google Scholar] [CrossRef] [Scilit]
  26. IPCC. Climate Change 2021: The Physical Science Basis. Contribution of Working Group I to the Sixth Assessment Report of the Intergovernmental Panel on Climate Change; Masson-Delmotte, V., Zhai, P., Pirani, A., Connors, S.L., Péan, C., Berger, S., Caud, N., Chen, Y., Goldfarb, L., Gomis, M.I., et al., Eds.; Cambridge University Press: Cambridge, UK; New York, NY, USA, 2021. [Google Scholar] [CrossRef] [Scilit]
  27. Parikka, P.; Hakala, K.; Tiilikkala, K. Expected shifts in Fusarium species’ composition on cereal grain in Northern Europe due to climate change. Food Addit. Contam. Part A 2012, 29, 1543–1555. [Google Scholar] [CrossRef] [Scilit] [PubMed]
  28. Mann, H.B.; Whitney, D.R. On a test of whether one of two random variables is stochastically larger than the other. Ann. Math. Stat. 1947, 18, 50–60. Available online: http://www.jstor.org/stable/2236101 (accessed on 14 July 2026). [CrossRef] [Scilit]
  29. Fay, M.P.; Proschan, M.A. Wilcoxon–Mann–Whitney or t-test? On assumptions for hypothesis tests and multiple interpretations of decision rules. Stat. Surv. 2010, 4, 1–39. [Google Scholar] [CrossRef] [Scilit] [PubMed]
  30. Wickham, H.; François, R.; Henry, L.; Müller, K.; Vaughan, D. dplyr: A Grammar of Data Manipulation. R Package Version 1.1.4. 2023. Available online: https://CRAN.R-project.org/package=dplyr (accessed on 14 July 2026).
  31. Wickham, H. ggplot2: Elegant Graphics for Data Analysis; Springer: Cham, Switzerland, 2016. [Google Scholar] [CrossRef] [Scilit]
  32. Neuwirth, E. RColorBrewer: ColorBrewer Palettes, R Package Version 1.1-3; 2022. Available online: https://cran.r-project.org/package=RColorBrewer (accessed on 15 May 2026).
  33. Ahlmann-Eltze, C.; Patil, I. Ggsignif: R package for displaying significance brackets for ‘ggplot2’. PsyArxiv 2021, 1–3. [Google Scholar] [CrossRef] [Scilit]
  34. Wickham, H.; Henry, L. purrr: Functional Programming Tools, R Package Version 1.0.4; 2025. Available online: https://CRAN.R-project.org/package=purr (accessed on 14 July 2026).
  35. European Commission. Commission Recommendation 2006/576/EC of 17 August 2006 on the presence of deoxynivalenol, zearalenone, ochratoxin A, T-2 and HT-2 and fumonisins in products intended for animal feeding. Off. J. Eur. Union 2006, L229, 7–9. [Google Scholar]
  36. European Commission. Directive 2002/32/EC of the European Parliament and of the Council of 7 May 2002 on undesirable substances in animal feed—Council statement. Off. J. Eur. Communities 2002, L140, 10–21. [Google Scholar]
  37. Tagyan, A.I.; Ashaal, S.; Alkhalifah, D.H.M.; Abdelghany, W.R.; Hozzein, W.N. Estimating the climate change-driven global distribution of Fusarium proliferatum and mycotoxin risk assessment under future warming scenarios. Front. For. Glob. Change 2025, 8, 1673494. [Google Scholar] [CrossRef] [Scilit]
  38. Weaver, A.C.; Weaver, D.M.; de Carvalho, L.V.F.M.; Yiannikouris, A. Influence of Climatic Region and Feedstuff Type on the Co-Occurrence and Contamination Profiles of 54 Mycotoxins in European Grains and Forages: A Seven-Year Survey. Toxins 2026, 18, 5. [Google Scholar] [CrossRef] [Scilit] [PubMed]
  39. Häggblom, P.; Nordkvist, E. Deoxynivalenol, zearalenone, and Fusarium graminearum contamination of cereal straw: Field distribution and sampling of big bales. Mycotoxin Res. 2015, 31, 101–107. [Google Scholar] [CrossRef] [Scilit] [PubMed]
  40. Gozzi, M.; Blandino, M.; Bruni, R.; Capo, L.; Righetti, L.; Dall’Asta, C. Mycotoxin occurrence in kernels and straws of wheat, barley, and tritordeum. Mycotoxin Res. 2024, 40, 203–210. [Google Scholar] [CrossRef] [Scilit] [PubMed]
  41. Zhang, Z.; Nie, D.; Fan, K.; Yang, J.; Guo, W.; Meng, J.; Zhao, Z.; Han, Z. A systematic review of plant-conjugated masked mycotoxins: Occurrence, toxicology, and metabolism. Crit. Rev. Food Sci. Nutr. 2020, 60, 1523–1537. [Google Scholar] [CrossRef] [Scilit] [PubMed]
  42. Barta, T.; Pinnyey, S.; Beier, L.I. The feed preference of roe deer in different habitats. Rev. Agric. Rural Dev. 2023, 12, 121–126. [Google Scholar] [CrossRef] [Scilit]
  43. Benda, R.; Zsolt, B. Autumn diet of European hare (Lepus europaeus) in the Naszály hills. Rev. Agric. Rural Dev. 2022, 11, 54–59. [Google Scholar] [CrossRef] [Scilit]
  44. Suman, M.; Oboeuf, M.; Abdallah, M.F.; Hazel, C.; Varga, E.; Mally, A.; Medina, A.; Molero, M.; Sansom, A.; Korzeniowski, K.J. Framework on risk prioritisation of mycotoxins in food: A case study in two wheat-based products. World Mycotoxin J. 2025, 18, 249–259. [Google Scholar] [CrossRef] [Scilit]
  45. Khan, R.; Anwar, F.; Ghazali, F.M. A comprehensive review of mycotoxins: Toxicology, detection, and effective mitigation approaches. Heliyon 2024, 10, e28361. [Google Scholar] [CrossRef] [Scilit] [PubMed]
  46. Wang, C.; Huang, Y.; Wang, Y.; Zhang, J.; Guo, M.; Chen, C.; Zhang, H.; Yue, B.; Kong, D.; Luo, J.; et al. Developments and trends in mycotoxin analysis: A review with bibliometric research. Microchem. J. 2024, 207, 111774. [Google Scholar] [CrossRef] [Scilit]
Figure 1. Location of the sampling field in Jász-Nagykun-Szolnok County, Hungary. Counties are shown in light beige and Budapest in orange. The red connector lines indicate the enlarged sampling area presented in the satellite image inset. Background imagery from Google Earth (© Google).
Environments 13 00405 g001
Disclaimer/Publisher’s Note: The statements, opinions and data contained in all publications are solely those of the individual author(s) and contributor(s) and not of MDPI and/or the editor(s). MDPI and/or the editor(s) disclaim responsibility for any injury to people or property resulting from any ideas, methods, instructions or products referred to in the content.