


Abstract
Antibiotic resistance genes (ARGs) are increasingly recognized as a concern in drinking water, yet the factors influencing their persistence from raw to finished water in drinking water treatment plants remain poorly understood. This study investigated the occurrence, removal, and potential factors associated with the persistence of ARGs (sul1, sul2, and tetG) in a full-scale rapid sand filtration drinking water treatment system with intermediate and post-chlorination. ARGs were detected in raw water at a median total concentration of 106 copies/L and remained detectable in finished water at 104 copies/L. Relative ARG abundance increased after treatment despite substantial absolute reductions (2.1–3.6 log). Intermediate chlorination achieved the greatest ARG log reduction value (0.53–2.4 log), likely due to higher chlorine dose and lower pH favoring HOCl formation. By contrast, post-chlorination at higher pH provided limited additional removal, possibly due to predominance of less reactive OCl− and survival of chlorine-tolerant bacteria. Multivariate analyses showed a shift from particle-bound ARGs in raw water to dissolved organic matter (DOM) and fine-particle-associated fractions along the treatment train. These findings suggest that reducing fine particles and DOM, together with optimized disinfection, may help lower ARG-associated risk in finished water.
1. Introduction
Antibiotic resistance genes (ARGs) are increasingly recognized as emerging environmental contaminants with significant public health implications [1]. ARGs are particularly concerning because they can spread via horizontal gene transfer (HGT) mediated by mobile genetic elements (MGEs), such as class 1 integrons, plasmids, and transposons. This mobility enables their transfer into opportunistic pathogens and persistence even in the absence of direct antibiotic selective pressure [2]. The occurrence of ARGs in the environment is strongly linked to anthropogenic activities, including the intensive use of antibiotics in human medicine, veterinary practice, and agriculture. These practices lead to contamination of water bodies through wastewater effluents and agricultural runoff [3]. As a result, ARGs have been widely detected in rivers, lakes, and reservoirs [4,5,6], many of which serve as primary drinking water sources. The presence of ARGs in source water can introduce contamination into drinking water treatment plants (DWTPs) and pose potential human exposure risks through tap water [7].
DWTPs widely employ rapid sand filtration systems that include sequential processes such as coagulation–sedimentation, rapid sand filtration, and chlorine disinfection to improve water quality before distribution. Numerous studies report substantial reductions in ARGs across these processes. Coagulation–sedimentation removes particle-associated ARGs through aggregation and settling [8], while rapid sand filtration provides additional removal through physical retention [9]. Chlorination effectively inactivates microorganisms but exhibits variable effects on ARG abundance, with both reductions and enrichments reported [7,10]. This variability has been attributed to the selective survival of chlorine-tolerant ARG-carrying bacteria and differences in the susceptibility of ARG sequences to oxidative damage [11]. As a result, even when absolute ARG abundance decreases, relative abundance may increase because ARG-carrying bacteria can preferentially survive chlorination [12,13]. However, most studies have focused on DWTPs employing a single post-chlorination step, leaving the effects of intermediate chlorination, a configuration used in many DWTPs, insufficiently characterized.
While the effects of individual treatment processes on ARG removal have been documented [10], most studies focus on quantifying log reductions without systematically examining the factors driving these patterns. Previous studies have reported variations in ARG abundance across treatment processes [8,9], yet the underlying mechanisms are typically inferred rather than directly evaluated. As a result, quantitative relationships between ARG abundance and concurrent changes in water quality parameters remain largely unexplored. Understanding how ARG abundance differs between influent and effluent at each treatment process, and how it is associated with treatment conditions, is essential for identifying factors that influence ARG behavior during drinking water treatment.
Despite substantial reductions during treatment, ARGs persist in finished drinking water across multiple countries [14]. In addition to treatment processes, water quality parameters may also influence ARG persistence. In aquatic environments, suspended particles can act as hotspots for ARGs by hosting ARG-carrying microorganisms and adsorbing extracellular DNA. This association facilitates ARG accumulation and protects them from degradation [15]. Dissolved organic matter and fine particles may further enhance ARG persistence by shielding extracellular DNA from nuclease activity and prolonging its stability [16]. In addition, parameters such as pH and dissolved oxygen have been associated with ARG persistence, potentially through their influence on microbial community structure and bacterial activity [17]. However, while these associations have been widely reported in natural waters, their relevance within DWTP treatment processes remains unclear. In particular, how ARGs are associated with water quality parameters at each treatment process has not been systematically evaluated. Moreover, although ARG abundances in raw and finished water have been reported, it remains unclear whether ARG levels in finished water are associated with those in raw water. Therefore, stage-specific analysis integrating ARG abundance with water quality parameters is needed to evaluate factors associated with ARG persistence during drinking water treatment.
To address these gaps, water samples from different treatment processes in a full-scale DWTP employing a rapid sand filtration system with both intermediate and post-chlorination were analyzed. Three specific objectives were pursued: (1) to evaluate ARG abundance changes and the removal efficiency across each treatment stage, with particular emphasis on intermediate chlorination; (2) to examine stage-specific associations between ARG abundance and intI1, total bacteria, and general water quality parameters; and (3) to explore factors associated with ARG persistence in finished water in relation to raw water quality and treatment conditions. To achieve this, the abundances of three ARGs (sul1, sul2, and tetG), an MGE (intI1), and total bacteria (assessed by 16S rDNA) were quantified, along with general water quality parameters, to identify their potential associations. These target ARGs were selected because (1) they confer resistance to sulfonamides and tetracyclines, antibiotic classes widely used in veterinary practice in Japan [18], and globally remain among the most consumed antibiotic classes in human medicine, sustaining selective pressure that may drive ARG persistence in water systems [19]; (2) these genes have been consistently detected in aquatic environments and drinking water systems worldwide [7,10]; and (3) their behavior across drinking water treatment processes, including associations with water quality parameters, remain insufficiently characterized. intI1 was selected as the MGE because it encodes the class 1 integron integrase, which facilitates the capture and dissemination of ARGs via HGT, and has been widely detected in aquatic environments, including drinking water systems worldwide [10,20]. Stage-specific correlations and multivariate analyses were conducted to examine potential factors associated with changes in ARG abundance and its persistence across treatment processes. This study provides insight into the fate of ARGs in DWTPs and may support improved strategies for controlling ARGs in drinking water.
2. Materials and Methods
2.1. Sample Collection
Water samples were collected from a representative DWTP in Japan that uses river water with relatively good quality (low turbidity, low color, and low dissolved organic matter content) as the source water. The treatment plant has a treatment capacity of 76,500 m3/day and consists of coagulation–sedimentation, intermediate chlorination, rapid sand filtration, and post-chlorination. Polyaluminium chloride (PAC) and aluminum sulfate (Al2(SO4)3) were used as the coagulants during the coagulation–sedimentation process. Sodium hypochlorite (NaOCl) was dosed at an average of 1.3 mg Cl2/L during intermediate chlorination and 0.23 mg Cl2/L during post-chlorination.
Samples from raw water and water at each treatment process were collected biweekly from August to December 2020, yielding 10 samples per sampling point. Samples were collected in sterilized bottles, immediately stored on ice, and transported to the laboratory for analysis. The overall treatment scheme and the locations of the sampling points are shown in Figure 1.
Figure 1.
Schematic diagram of the drinking water treatment process and sampling points.
2.2. General Water Quality Analysis
Physicochemical parameters, including pH, electrical conductivity (EC), free chlorine residual, turbidity, and particle number, were measured in unfiltered samples. pH and EC were measured using a multi-water-quality meter (MM-60R, TOA DKK, Tokyo, Japan). Free chlorine was quantified by the N,N-diethyl-p-phenylenediamine (DPD) method with a residual chlorine checker (CRP-1000-000Q, Suido Kiko, Tokyo, Japan). Turbidity was measured using a turbidimeter (2100AN, HACH, Loveland, CO, USA). Particle number (0.5–100 µm) was analyzed using a particle counter (ZMV, Fuji Electric, Tokyo, Japan) and classified into four fractions: P0.5–1 (0.5–1.0 µm), P1–3 (1.0–3.0 µm), P3–10 (3.0–10 µm), and P10–100 (10–100 µm).
Samples were subsequently filtered through 0.2 µm polytetrafluoroethylene (PTFE) membrane filters (Millipore, Carrigtwohill, Ireland). The filtrates were analyzed for dissolved organic carbon (DOC), ultraviolet absorbance at 260 nm (UV260), and fluorescence excitation–emission matrix (EEM) spectra. At the same time, the membrane filters were stored at −20 °C for subsequent DNA extraction. DOC was determined using a total organic carbon (TOC) analyzer (TOC-L, Shimadzu, Kyoto, Japan) by the catalytic combustion oxidation method. UV260, an indicator of humic substances and aromatic organic matter, was measured with a UV-Vis spectrometer (UV-2600, Shimadzu, Kyoto, Japan) using a 5 cm quartz cuvette.
EEM spectra were obtained with a spectrofluorometer (RF-5300, Shimadzu, Kyoto, Japan). The inner-filter effect was corrected according to the manufacturer’s protocol. Excitation (Ex) and emission (Em) wavelengths were scanned from 220 to 550 nm at 5 nm intervals. Fluorescence intensities were normalized to quinine sulfate units (QSU) using a 10-ppb quinine sulfate solution in 0.05 M H2SO4, measured at Ex/Em = 350/450 nm. Fluorescence peaks were identified using the peak-picking method and categorized as described by Rosadi et al. [21] into protein-like peaks: Peak 1 (tyrosine-like, Ex/Em = 225/295 nm), Peak 2 (tryptophan-like, Ex/Em = 230/345 nm), and Peak 4 (tryptophan-like, Ex/Em = 270/350 nm); and humic-like peaks: Peak 3 (Ex/Em = 225/425 nm) and Peak 5 (Ex/Em = 330/430 nm).
2.3. DNA Extraction
Membrane filters obtained from Section 2.2 were used for DNA extraction. Each water sample was filtered in duplicate through two separate 0.2 µm PTFE membranes, and the corresponding filtered volumes were recorded. DNA was extracted separately from each membrane using the PowerSoil DNA Isolation Kit (Qiagen, Hilden, Germany) according to the manufacturer’s protocol, following the extraction procedure reported by Sarkar et al. [22]. The extracted DNA was stored at −25 °C until quantitative PCR (qPCR) analysis.
2.4. Gene Quantification
Gene quantification was performed using a TP800 qPCR instrument (Takara, Kusatsu, Japan) with TB Green dye chemistry. A total of five genes were quantified: three ARGs (sul1, sul2, and tetG), one MGE (intI1), and 16S rDNA. Primer sequences and qPCR conditions are summarized in Table S1. The standard curve for 16S rDNA was prepared using 10-fold serial dilutions of DNA extracted from Escherichia coli (NBRC 13965). Standard curves for sul1, sul2, tetG, and intI1 were generated from plasmid DNA prepared by TA cloning, following previously described protocols [23].
Each qPCR reaction was prepared in a final volume of 25 µL containing 2.5 µL TB Green Premix Ex Taq (Tli RNaseH Plus), 0.5 µL of each primer (10 µM forward and reverse), 9.5 µL sterile Milli-Q water, and 2 µL template DNA. Thermal cycling conditions are detailed in Table S1. A melt-curve analysis was performed after each run to confirm amplification specificity. No-template controls were prepared by replacing the 2 µL of template DNA with sterile Milli-Q water in each run to ensure the absence of contamination.
DNA extracts from the two filters for each water sample were analyzed once by qPCR (two qPCR reactions per water sample), and the average of the two measurements was used for subsequent analysis. The correlation coefficient (R2) values exceeded 0.99 for all standard curves, and amplification efficiencies ranged from 90% to 110%. Absolute abundances were calculated as described by Luo et al. [24], and relative abundances of ARGs and intI1 were determined by normalizing their copy numbers to those of the 16S rDNA gene.
2.5. Statistical Analysis
Statistical analyses were performed using R version 4.5.3 (R Foundation for Statistical Computing, Vienna, Austria). The Shapiro–Wilk test confirmed non-normality, and nonparametric tests were applied throughout. Treatment efficiency was quantified as log reduction values (LRV = log10(C0/C)), where C0 and C represent the influent and effluent ARG concentrations (gene copies/L), respectively; samples with no detectable amplification were assigned a value of 1.0 × 10² copies/L for LRV calculations. The Wilcoxon rank-sum test was used to compare raw and finished water, and sequential pairwise comparisons were performed between adjacent treatment processes with Bonferroni correction for multiple testing. Principal component analysis (PCA) with varimax rotation was conducted to visualize multivariate relationships, and Spearman’s rank correlation analysis was performed to examine associations among variables. For all treatment stages, the first three principal components collectively explained 71.3–77.4% of the total variance, meeting the commonly recommended threshold of 70%. Analyses were considered statistically significant at p < 0.05.
3. Results and Discussion
3.1. Abundance and Persistence of ARGs in Raw and Finished Water
The abundance of ARGs in raw and finished water (i.e., post-chlorination water) at the DWTP was analyzed to evaluate treatment performance and ARG persistence. All target genes were detected in raw water, with detection frequencies ranging from 90% to 100% (Table 1). Among the ARGs, sul1 showed the highest absolute abundance (2.6 × 10⁶ copies/L), followed by tetG (8.0 × 10⁵ copies/L) and sul2 (7.7 × 10⁵ copies/L), yielding a total ARG abundance of 4.4 × 10⁶ copies/L. The MGE intI1 was also abundant, at 5.8 × 10⁵ copies/L. The dominance of sul1 is consistent with previous studies reporting a high prevalence of sulfonamide resistance genes in drinking water sources in Eastern China [25]. However, the ARG abundances observed in this study were lower than those reported for several Chinese DWTPs [9], possibly reflecting differences in antibiotic usage and other anthropogenic pressures at the respective study sites.
Table 1.
Abundances, detection frequencies, and log reduction values (LRVs) of antibiotic resistance genes (ARGs), intI1, and 16S rDNA in raw water and finished water (n = 10).
Following treatment, total bacterial abundance, assessed by 16S rDNA, decreased significantly (p < 0.05) by 4.2 log units. Absolute abundances of all target genes also decreased, with LRVs of 2.1–3.6 for ARGs and 3.0 for intI1 (Table 1), indicating substantial removal of bacteria, ARGs, and the MGE. These reductions are broadly consistent with those reported for other DWTPs employing similar treatment configurations, where overall ARG reductions ranged from 1.89 to 2.46 log [26] and 0.03 to 2.4 log [8]. Despite this reduction, ARGs persisted in finished water at a total concentration of 1.1 × 10⁴ copies/L, with detection frequencies of 50–70%. Comparable persistence has been reported at other DWTPs [27], suggesting that complete ARG removal remains difficult during drinking water treatment.
Although absolute abundances decreased substantially, relative abundances of all ARGs increased in finished water (Table 1). Specifically, tetG increased from 3.2 × 10⁻⁵ to 2.6 × 10⁻³, sul2 from 3.0 × 10⁻⁵ to 5.0 × 10⁻⁴, and sul1 from 1.2 × 10⁻⁴ to 1.8 × 10⁻⁴. Similarly, the relative abundance of intI1 increased from 2.1 × 10⁻⁵ to 2.5 × 10⁻⁴. These increases are consistent with enrichment patterns reported in other full-scale DWTPs [28]. The concurrent increase in ARG and intI1 relative abundances may suggest that bacteria harboring ARGs survived treatment more effectively than susceptible bacteria. HGT may have contributed to further dissemination of ARGs within the surviving bacterial community [8]. Moreover, the persistence of ARGs and intI1 in finished water indicates that treatment at this DWTP did not fully eliminate these genes, which is concerning as persistent ARGs and intI1 retain the potential to enable HGT to opportunistic pathogens [29].
Spearman correlation analysis was conducted to further examine whether raw water ARG abundances were associated with finished water ARG abundances. No significant associations were found for any target genes (rs = −0.46 to 0.50, all p > 0.05), suggesting that finished-water ARG levels were not directly determined by raw-water ARG abundance and that treatment processes and concurrent water quality changes may be more important determinants of ARG persistence. This is consistent with Yang et al. [30], who reported that drinking water treatment was the dominant factor shaping ARG profiles distinctly separated from source water, regardless of initial source water concentrations. The influence of treatment processes and concurrent water quality changes on ARG abundances is examined further in the following sections.
3.2. Changes in ARG Abundance Across Individual Drinking Water Treatment Processes
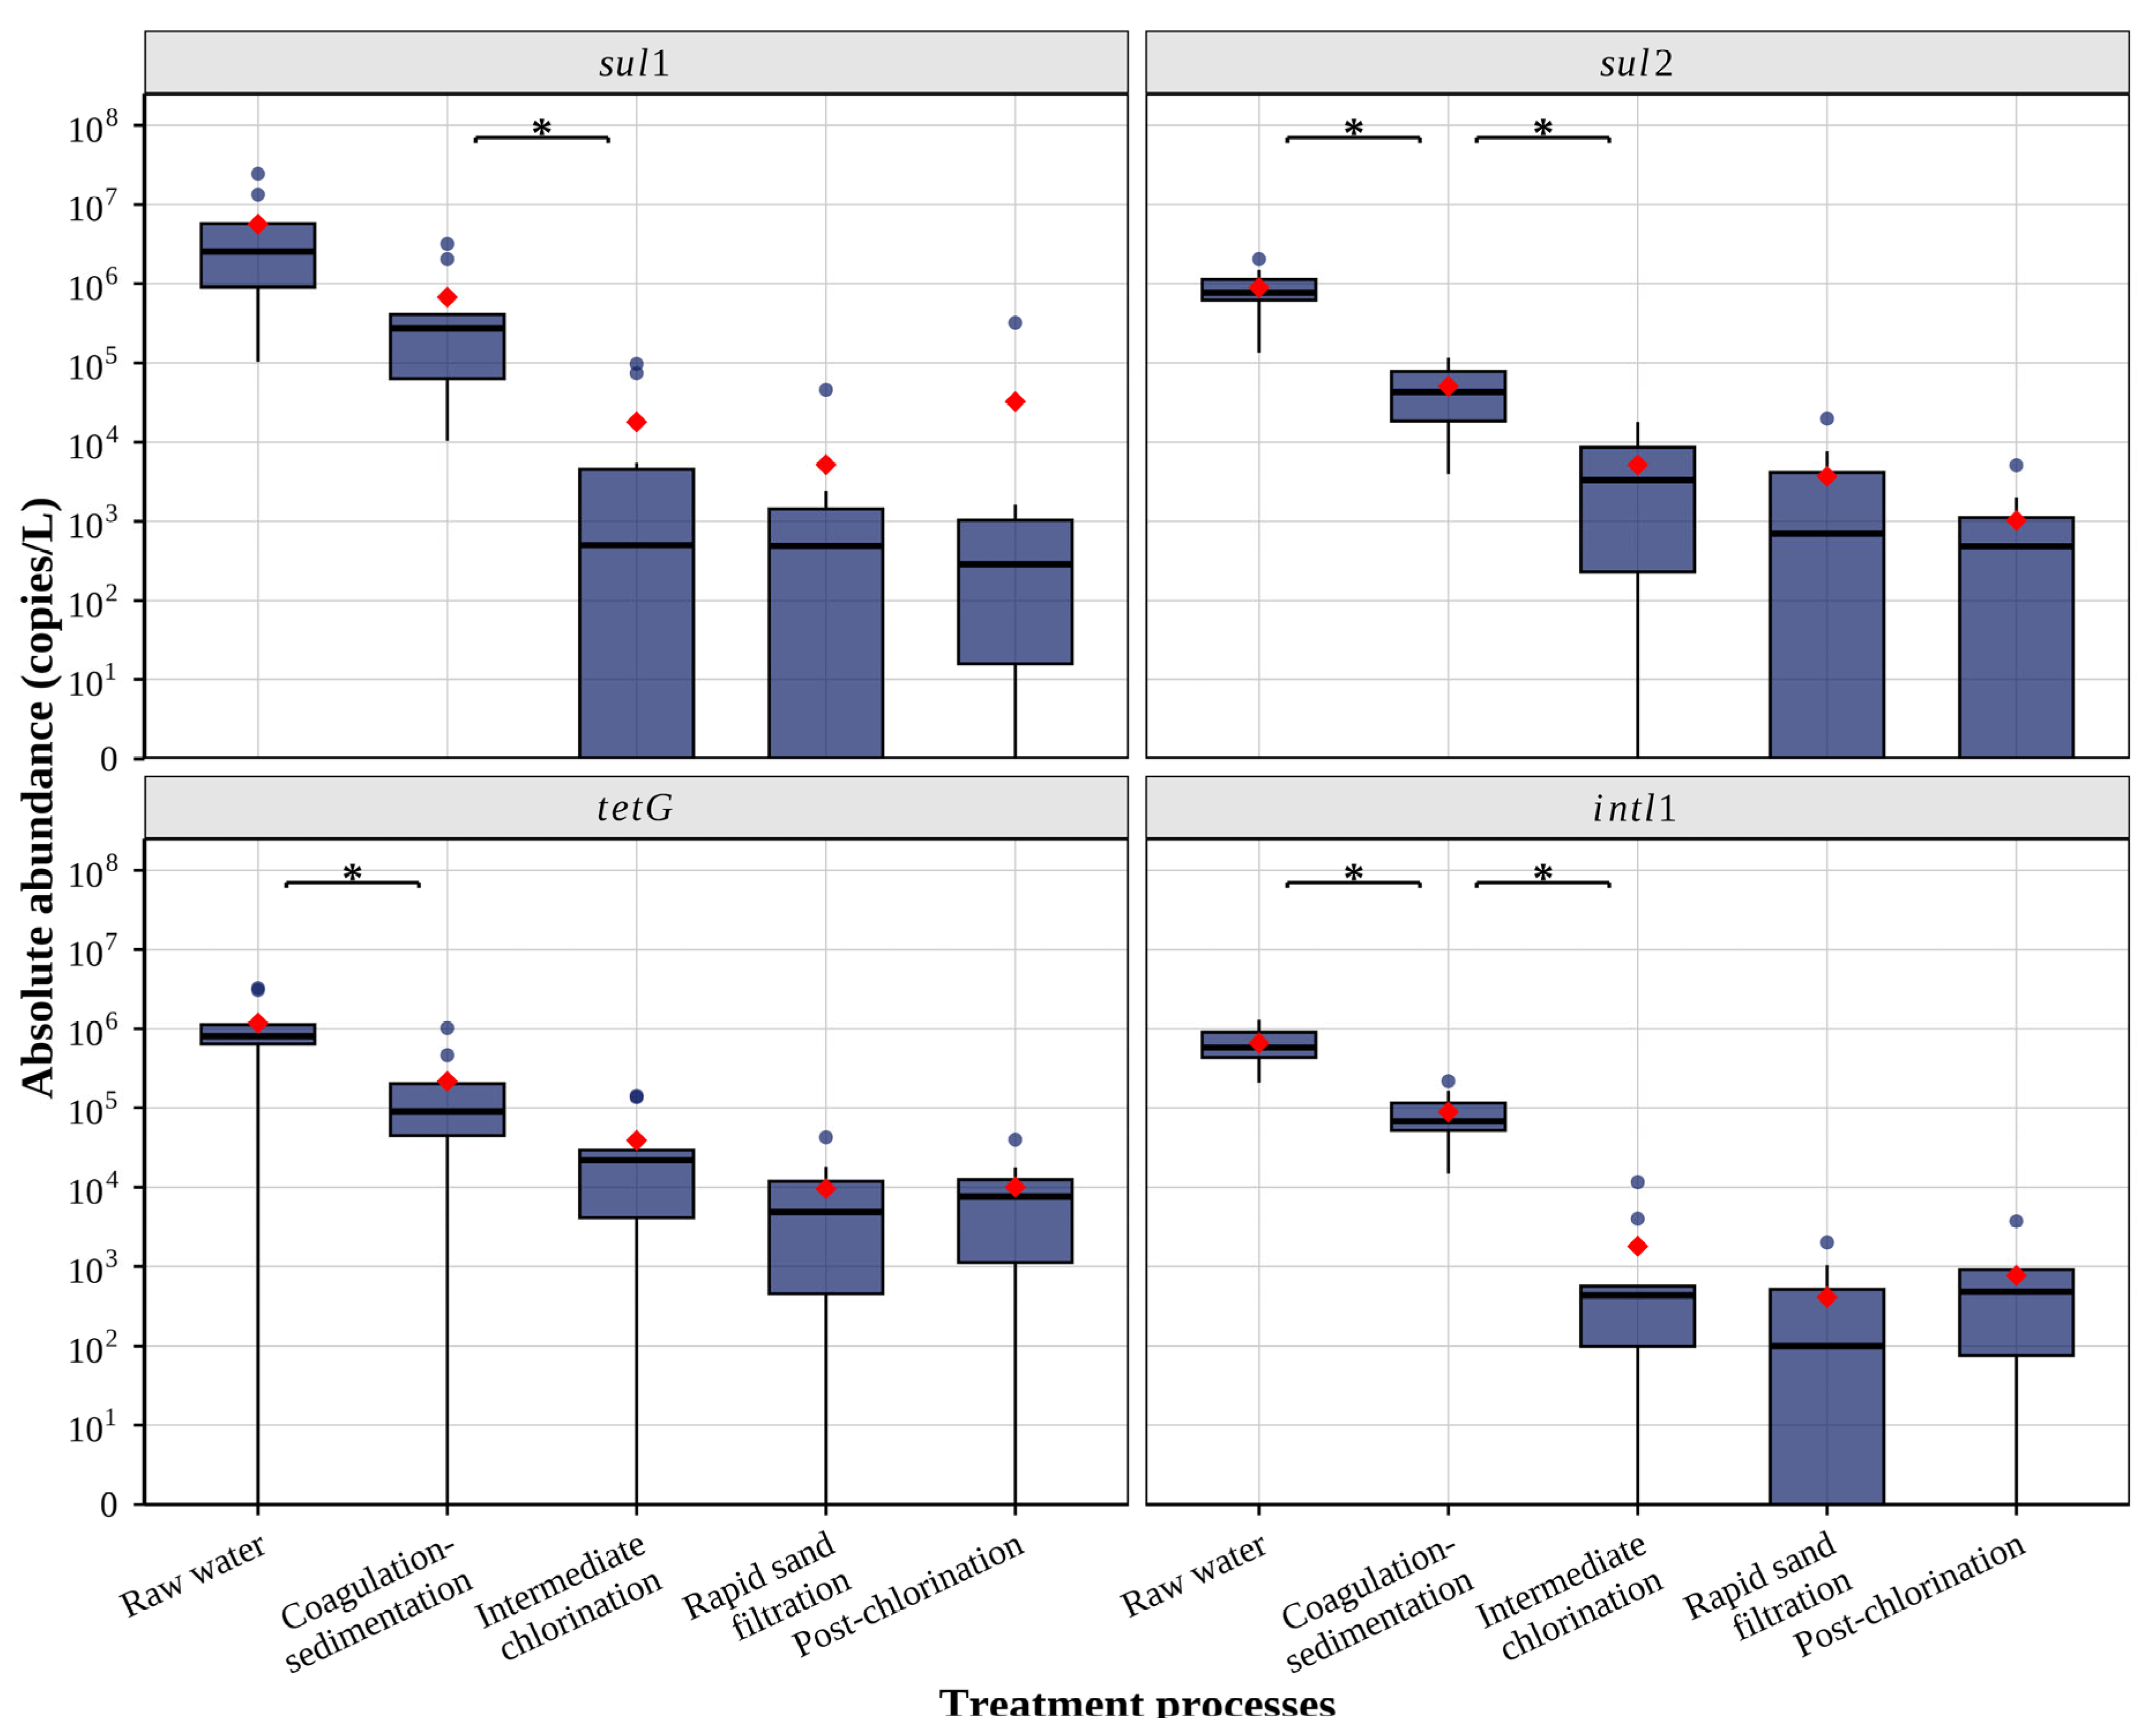
This section examines influent-to-effluent changes in ARG abundance across individual treatment processes and their associations with concurrent water quality changes to elucidate the factors influencing ARG reduction or enrichment during treatment. After coagulation–sedimentation, the absolute abundances of all target genes decreased, with significant reductions observed for sul2, tetG, and intI1 (Figure 2), corresponding to LRVs of 0.81–1.4 for individual ARGs and 0.88 for intI1 (Table 2). These reductions are comparable to those reported in other DWTPs, where ARG LRVs following coagulation–sedimentation ranged from 0.1 to 1.7 [8].
Figure 2.
Absolute abundance of ARGs and intI1 across water treatment processes (n = 10). Box plots show median, quartiles, and outliers. Red diamonds indicate average values. Brackets with asterisks (*) indicate significant differences between adjacent treatment stages (Wilcoxon rank-sum test with Bonferroni correction, p < 0.05).
Table 2.
Log reduction values of ARGs, intI1, and 16S rDNA for each treatment process (n = 10).
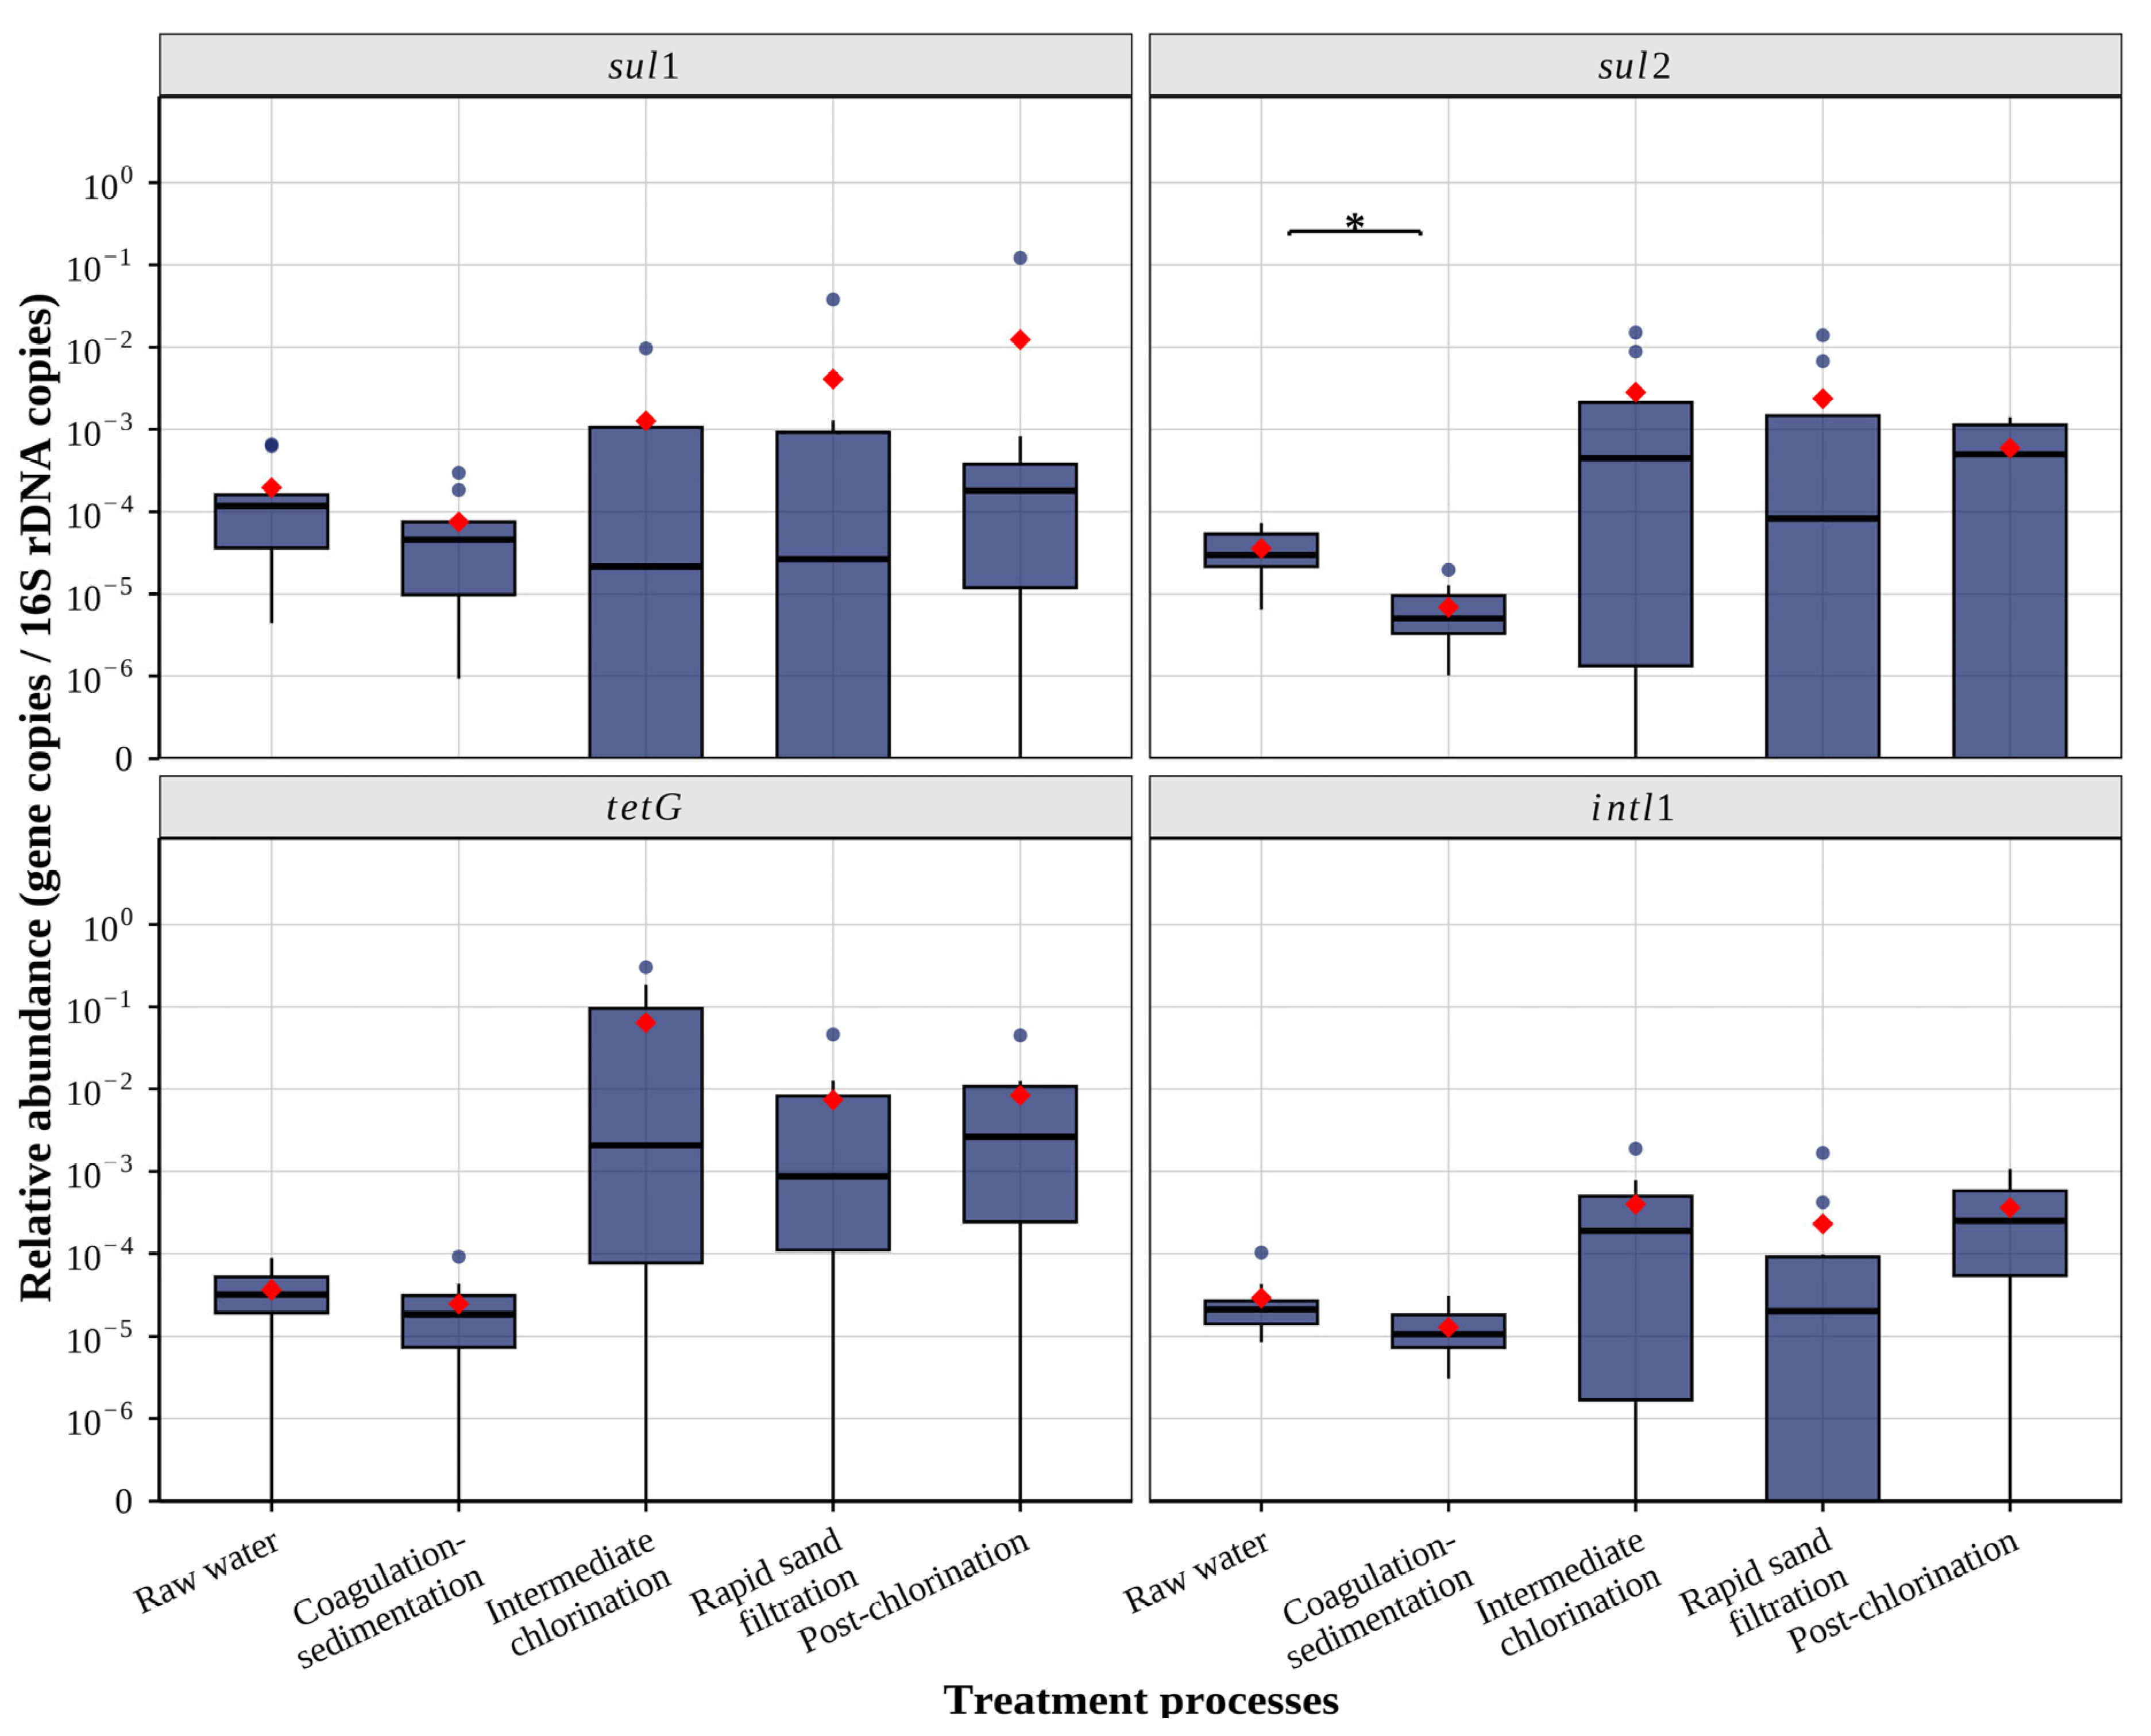
The concurrent decline in relative abundances, particularly for sul2 (Figure 3), suggests that ARGs were removed in proportion to the bacterial community rather than selectively enriched. This pattern coincided with decreases in total bacterial abundance, turbidity, large particles (10–100 µm), and dissolved organic matter (DOM) indices (Table 3), consistent with the physical removal of bacteria, suspended particles, and organic matter via floc formation and settling [31]. Among the operational parameters examined, coagulant dose (PACl + Al2(SO4)3: 24.0–47.0 mg/L) was associated with changes in turbidity (rs = −0.72, p = 0.019), tryptophan-like substance (Peak 2 and Peak 4: rs = −0.89 and −0.72, respectively, p < 0.05), and humic-like substance (Peak 3: rs = −0.66, p = 0.037), and showed directional associations with changes in bacterial abundance (16S rDNA LRV: rs = 0.37) and intI1 (intI1 LRV: rs = 0.58), suggesting that higher coagulant doses may have contributed to greater removal of suspended particles, DOM, bacteria, and MGEs. However, no clear association was observed between coagulant dose and ARG removal, suggesting that ARG reduction during coagulation–sedimentation was not directly governed by dose intensity.
Figure 3.
Relative abundance of ARGs and intI1 across water treatment processes. Box plots show median, quartiles, and outliers. Red diamonds indicate average values. Brackets with asterisks (*) indicate significant differences between adjacent treatment stages (Wilcoxon rank-sum test with Bonferroni correction, p < 0.05).
Table 3.
Total ARG, 16S rDNA, and water quality parameters concentrations in DWTP treatment processes (n = 10).
In contrast, ARG removal showed a closer association with changes in pH during coagulation–sedimentation. Effluent pH ranged from 6.34 to 7.04, generally lower than the influent pH of 6.26–7.22, possibly reflecting aluminum-based coagulant hydrolysis [32]. Changes in pH showed directional associations with sul1 and tetG LRVs (rs = −0.53 and −0.34, respectively), suggesting that slightly acidic conditions may have contributed to greater ARG removal at this stage. Changes in pH also showed directional positive associations with changes in 10–100 µm particles (rs = 0.43), DOC (rs = 0.28), tyrosine-like substance (Peak 1: rs = 0.51), and humic-like substance (Peak 5: rs = 0.24), suggesting that lower pH conditions may have coincided with greater reductions in particles and DOM, possibly through enhanced floc formation, which may have facilitated co-removal of particle- and DOM-associated ARGs. This interpretation is further supported by directional negative associations between changes in turbidity and the LRVs of tetG, sul2, and intI1 (rs = −0.46, −0.29, −0.29, respectively), consistent with the broader understanding that pH depression from aluminum-based coagulant hydrolysis may improve floc formation and settling of suspended particles and organic matter [32], which may enhance ARG co-removal.
Intermediate chlorination, with an average NaOCl dose of 1.3 mg/L (range: 1.02–1.57 mg/L), achieved the highest LRVs for ARGs and MGE across all treatment processes. The absolute abundances of sul1, sul2, and intI1 decreased significantly (Figure 2), with LRVs of 2.4, 1.2, and 2.1, respectively (Table 2). A concurrent sharp decline in total bacterial abundance was also observed (16S rDNA LRV: 3.7). In contrast, tetG was not significantly reduced (LRV = 0.53, p = 0.064), indicating variable removal across sampling events. These reductions likely reflect the consistent effectiveness of chlorination across all sampling events, with no clear dose-dependent variations in ARG removal. However, a higher chlorine dose was associated with greater intI1 removal (rs = −0.74, p = 0.013), suggesting that MGE reduction may be more sensitive to dose intensity than ARGs at this stage. Nevertheless, variability in ARG removal across sampling events was associated with concurrent changes in water quality (Table 3).
Changes in pH were associated with sul1 and intI1 LRVs (rs = −0.81 and −0.64, respectively, p < 0.05) and showed a directional association with 16S rDNA LRV (rs = −0.33), suggesting that lower pH may have enhanced inactivation of sul1, intI1, and their bacterial hosts. This pattern may be explained by the pH-dependent speciation of chlorine, in which lower pH favors a higher proportion of hypochlorous acid (HOCl, pKa = 7.54 [33]), the more reactive and bactericidal form of free chlorine [34].
Changes in free chlorine residual were positively associated with tetG LRV (rs = 0.69, p = 0.029), suggesting that tetG reduction may be more dependent on free chlorine availability than the other target genes. Changes in particle numbers showed directional negative associations with sul2 LRV across 0.5–1, 1–3, and 3–10 µm particle fractions (rs = −0.30 to −0.35) and with tetG LRV across 1–3, 3–10, and 10–100 µm particle fractions (rs = −0.27 to −0.33), suggesting that a portion of these genes may have been particle-associated, with particle removal contributing to their reduction during intermediate chlorination. The differential removal among ARG types, with sul1 showing greater removal than sul2 and tetG, may partly reflect differences in the intrinsic susceptibility of their respective gene sequences to chlorine-mediated oxidative damage [35]. In support of this, Liu et al. [11] reported that sul2 was selectively enriched following chlorination, while sul1 was less consistently enriched, suggesting greater intrinsic tolerance of sul2 to chlorine oxidation.
Despite substantial reductions in absolute abundance, the relative abundances of sul2, tetG, and intI1 increased following chlorination (Figure 3), reflecting the substantially greater removal of total bacteria compared to individual ARGs (16S rDNA LRV = 3.7 vs. ARGs LRV = 0.53–2.4; Table 2). This selective retention of ARGs relative to the total bacterial community is consistent with ARG enrichment reported in other full-scale DWTPs following chlorination [26]. It may reflect preferential survival of chlorine-tolerant ARG-carrying bacteria within the residual microbial community [12], or physical protection conferred by suspended particles and organic matter, either shielding ARG-carrying bacteria from chlorine inactivation [36] or facilitating the persistence of extracellular ARGs through adsorption to particles and organic matter [16,37]. In contrast, sul1 decreased in relative abundance across most sampling events, suggesting it was predominantly associated with bacterial hosts more susceptible to chlorine inactivation, or with genetic elements that were less protected by particles or organic matter.
Following rapid sand filtration, none of the target genes showed statistically significant changes (Figure 2), with median LRVs ranging from 0.00 to 0.17 for individual ARGs and 0.09 for intI1 (Table 2). The 16S rDNA LRV of −0.04 indicates a slight increase in bacterial abundance at this stage, suggesting that bacterial release may have partially offset the effects of physical removal during filtration. Despite minimal overall changes, several associations between ARG LRVs and water quality changes were observed, suggesting that competing processes of physical removal and bacterial release operated simultaneously during filtration.
Changes in particle numbers were negatively associated with sul2 LRV in the 1–3 µm and 3–10 µm fractions (rs = −0.71 and −0.83, respectively, p < 0.05), with directional negative associations across the remaining fractions (rs = −0.44 to −0.50). Directional negative associations were also observed with tetG and intI1 LRV in the 1–3 and 3–10 µm fractions (rs = −0.35 to −0.53), and with sul1 LRV in the 3–10 µm fraction (rs = −0.20). These patterns suggest that particle reductions during rapid sand filtration may have contributed to the partial removal of particle-associated ARGs and MGEs. This interpretation is further supported by directional negative associations between changes in turbidity and the sul1, sul2, and intI1 LRVs (rs = −0.55, −0.51, and −0.41, respectively), consistent with physical retention as a contributing removal mechanism at this stage.
In contrast, strong positive associations between 16S rDNA LRV and both sul1 and sul2 LRVs (rs = 0.68 and 0.73, respectively, p < 0.05) suggest that the fates of these sulfonamide resistance genes were closely linked to bacterial abundance during rapid sand filtration. The slight increase in bacterial abundance likely reflects the release of bacteria from biofilms on filter media or bacterial regrowth during the filtration process [38], which may have offset physical removal and contributed to the persistence of sul1 in the filtrate. This is consistent with variable trends in relative abundance: sul1 increased slightly, while sul2, tetG, and intI1 decreased (Figure 3), which contrasts with studies reporting concurrent ARG removal alongside declines in bacterial abundance following rapid sand filtration [9,39].
Post-chlorination, with an average NaOCl dose of 0.23 mg/L (range: 0.13–0.39 mg/L), resulted in no significant changes in ARG, MGE, or bacterial abundance compared with the preceding filtration process (Figure 2, Table 2), in contrast to the substantial reductions observed during intermediate chlorination. This pattern suggests that ARG reduction was not achieved despite the presence of free chlorine residual throughout this stage (median: 0.57 mg/L). The limited effectiveness of post-chlorination observed in this study is consistent with findings from other DWTPs, where low-dose chlorination (0.05–0.2 mg Cl2/L) provided minimal additional ARG reduction and in some cases promoted enrichment of certain ARG subtypes [8]. The effluent pH range at this stage (6.7–7.3) was generally higher than at intermediate chlorination (6.3–7.1), corresponding to a lower proportion of HOCl relative to the hypochlorite ion (OCl−; pKa = 7.54 [33]), which may have reduced the effectiveness of chlorination. Beyond pH-driven speciation, the limited changes in target gene abundances may also reflect the selection of chlorine-tolerant bacterial populations through repeated chlorine exposure during treatment [12].
Furthermore, the negative associations between changes in particle number and 16S rDNA LRV were observed in the 0.5–1 µm and 1–3 µm particle fractions (rs = −0.71 and −0.92, respectively, all p < 0.05), with directional negative associations in the 3–10 µm and 10–100 µm fractions (rs = −0.61 and −0.37, respectively), suggesting that higher particle concentrations during post-chlorination were associated with greater bacterial survival, possibly through particle-associated protection that limited effective chlorine contact. Additionally, a higher chlorine dose was associated with greater intI1 removal (rs = −0.85, p = 0.002), suggesting that MGE reduction at this stage may be more sensitive to dose intensity than ARG reduction, consistent with the patterns observed during intermediate chlorination.
The fates of sul1 and sul2 showed directional positive associations with 16S rDNA LRV (rs = 0.32 and 0.33, respectively), suggesting that these genes tended to persist alongside the surviving bacterial community rather than being selectively enriched. In contrast, tetG and intI1 LRVs showed directional negative association with 16S rDNA LRV (rs = −0.49 and −0.31, respectively), indicating that these genes tended to increase in abundance even as bacterial abundance declined. Trends in relative abundance further supported this pattern (Figure 3). The increases in the relative abundances of sul1 and sul2 were consistent with their co-occurrence with surviving bacteria, whereas the increases in the relative abundances of tetG and intI1 occurred without corresponding increases in bacterial abundance, suggesting genuine enrichment of these genes independent of bacterial changes. The observed increase in intI1 is particularly noteworthy, given its role in facilitating ARG dissemination in finished water via HGT [40]. Overall, post-chlorination at the applied chlorine dose was largely ineffective in further reducing ARG abundances.
3.3. Potential Drivers of ARG Persistence Across Treatment Processes
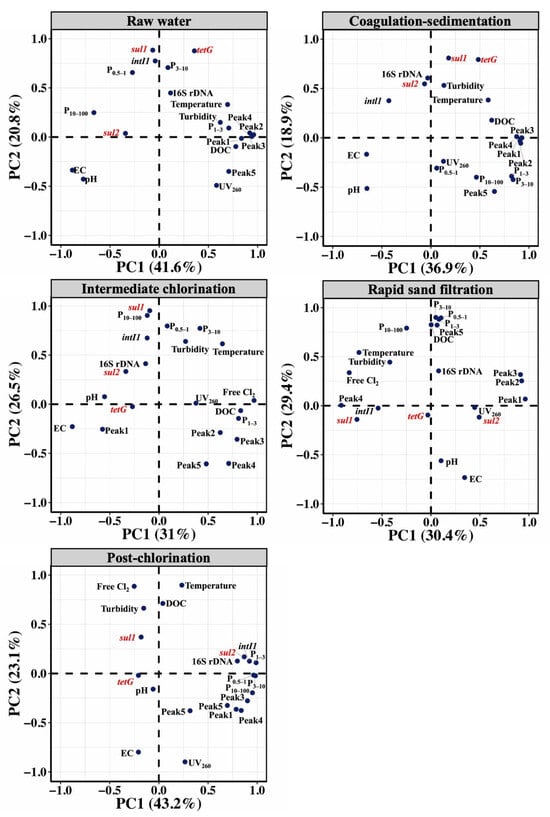
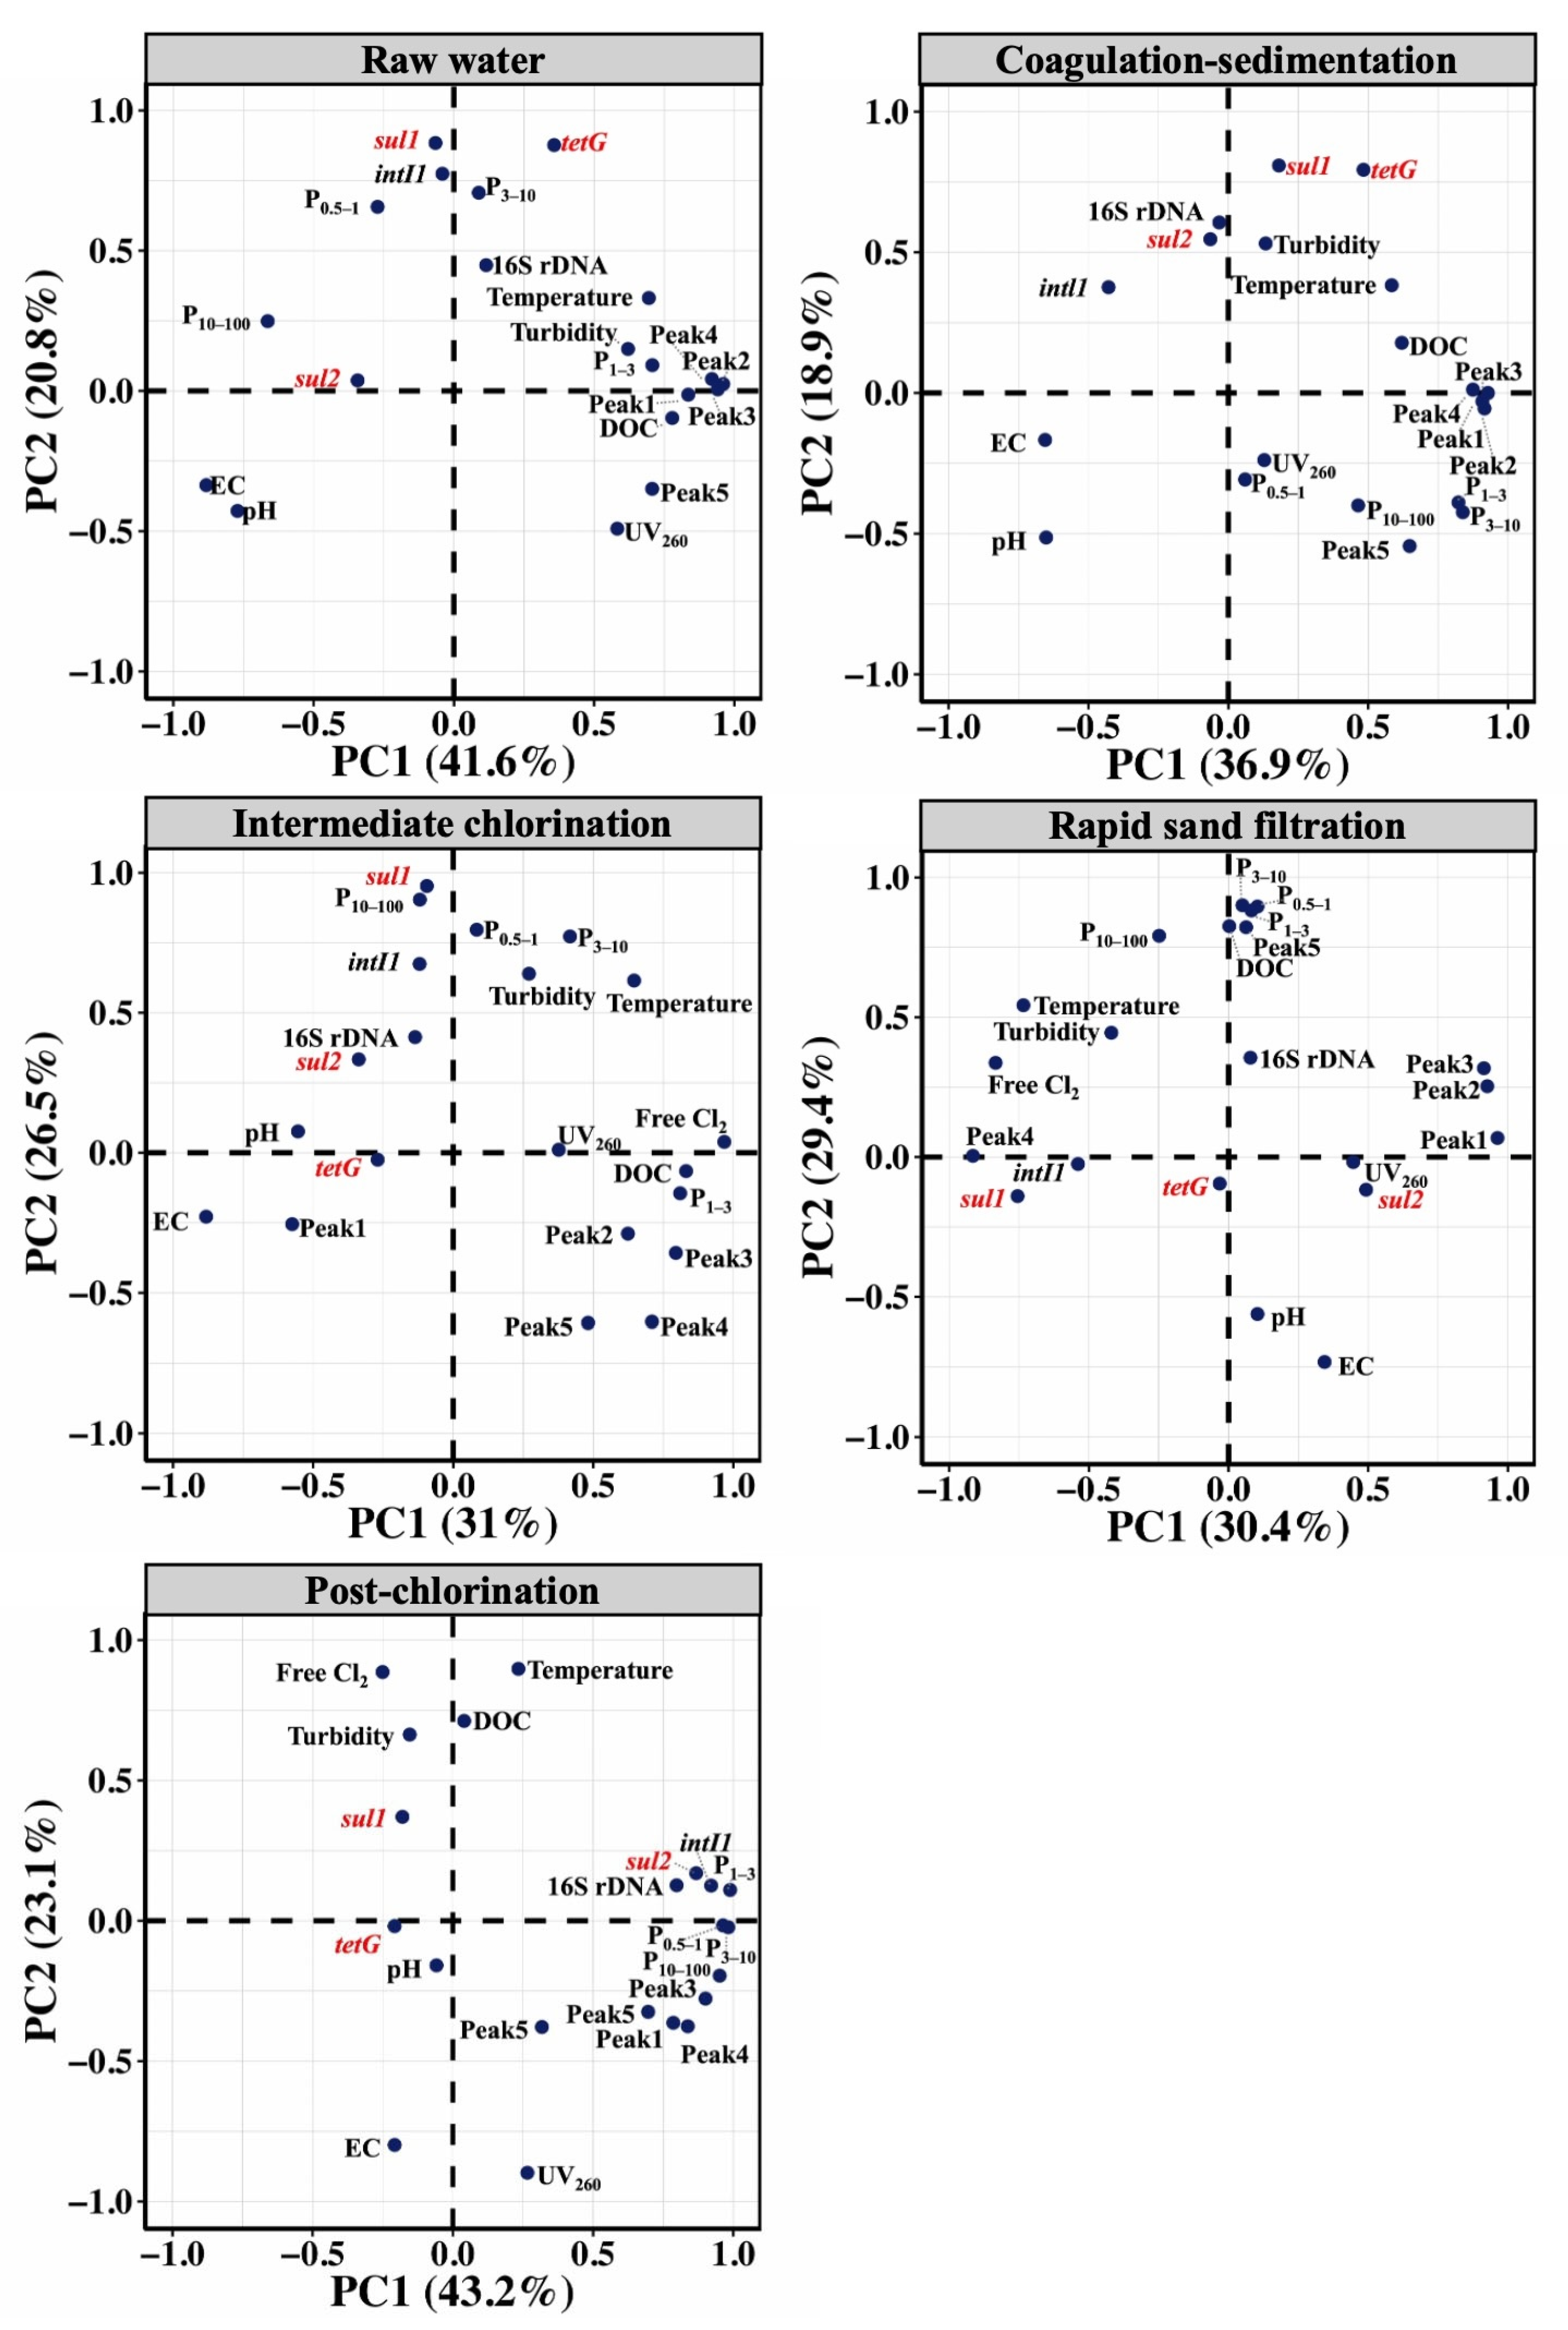
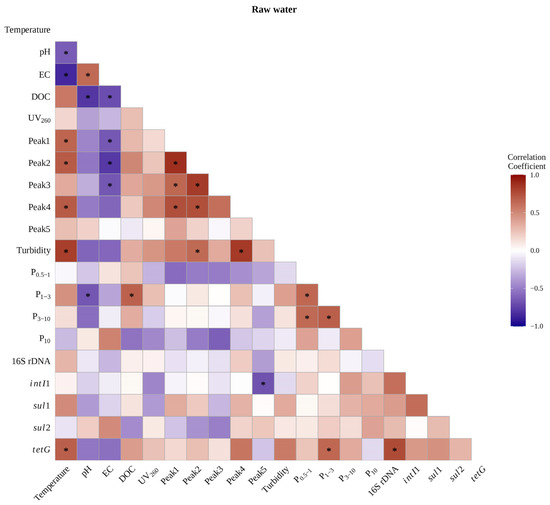
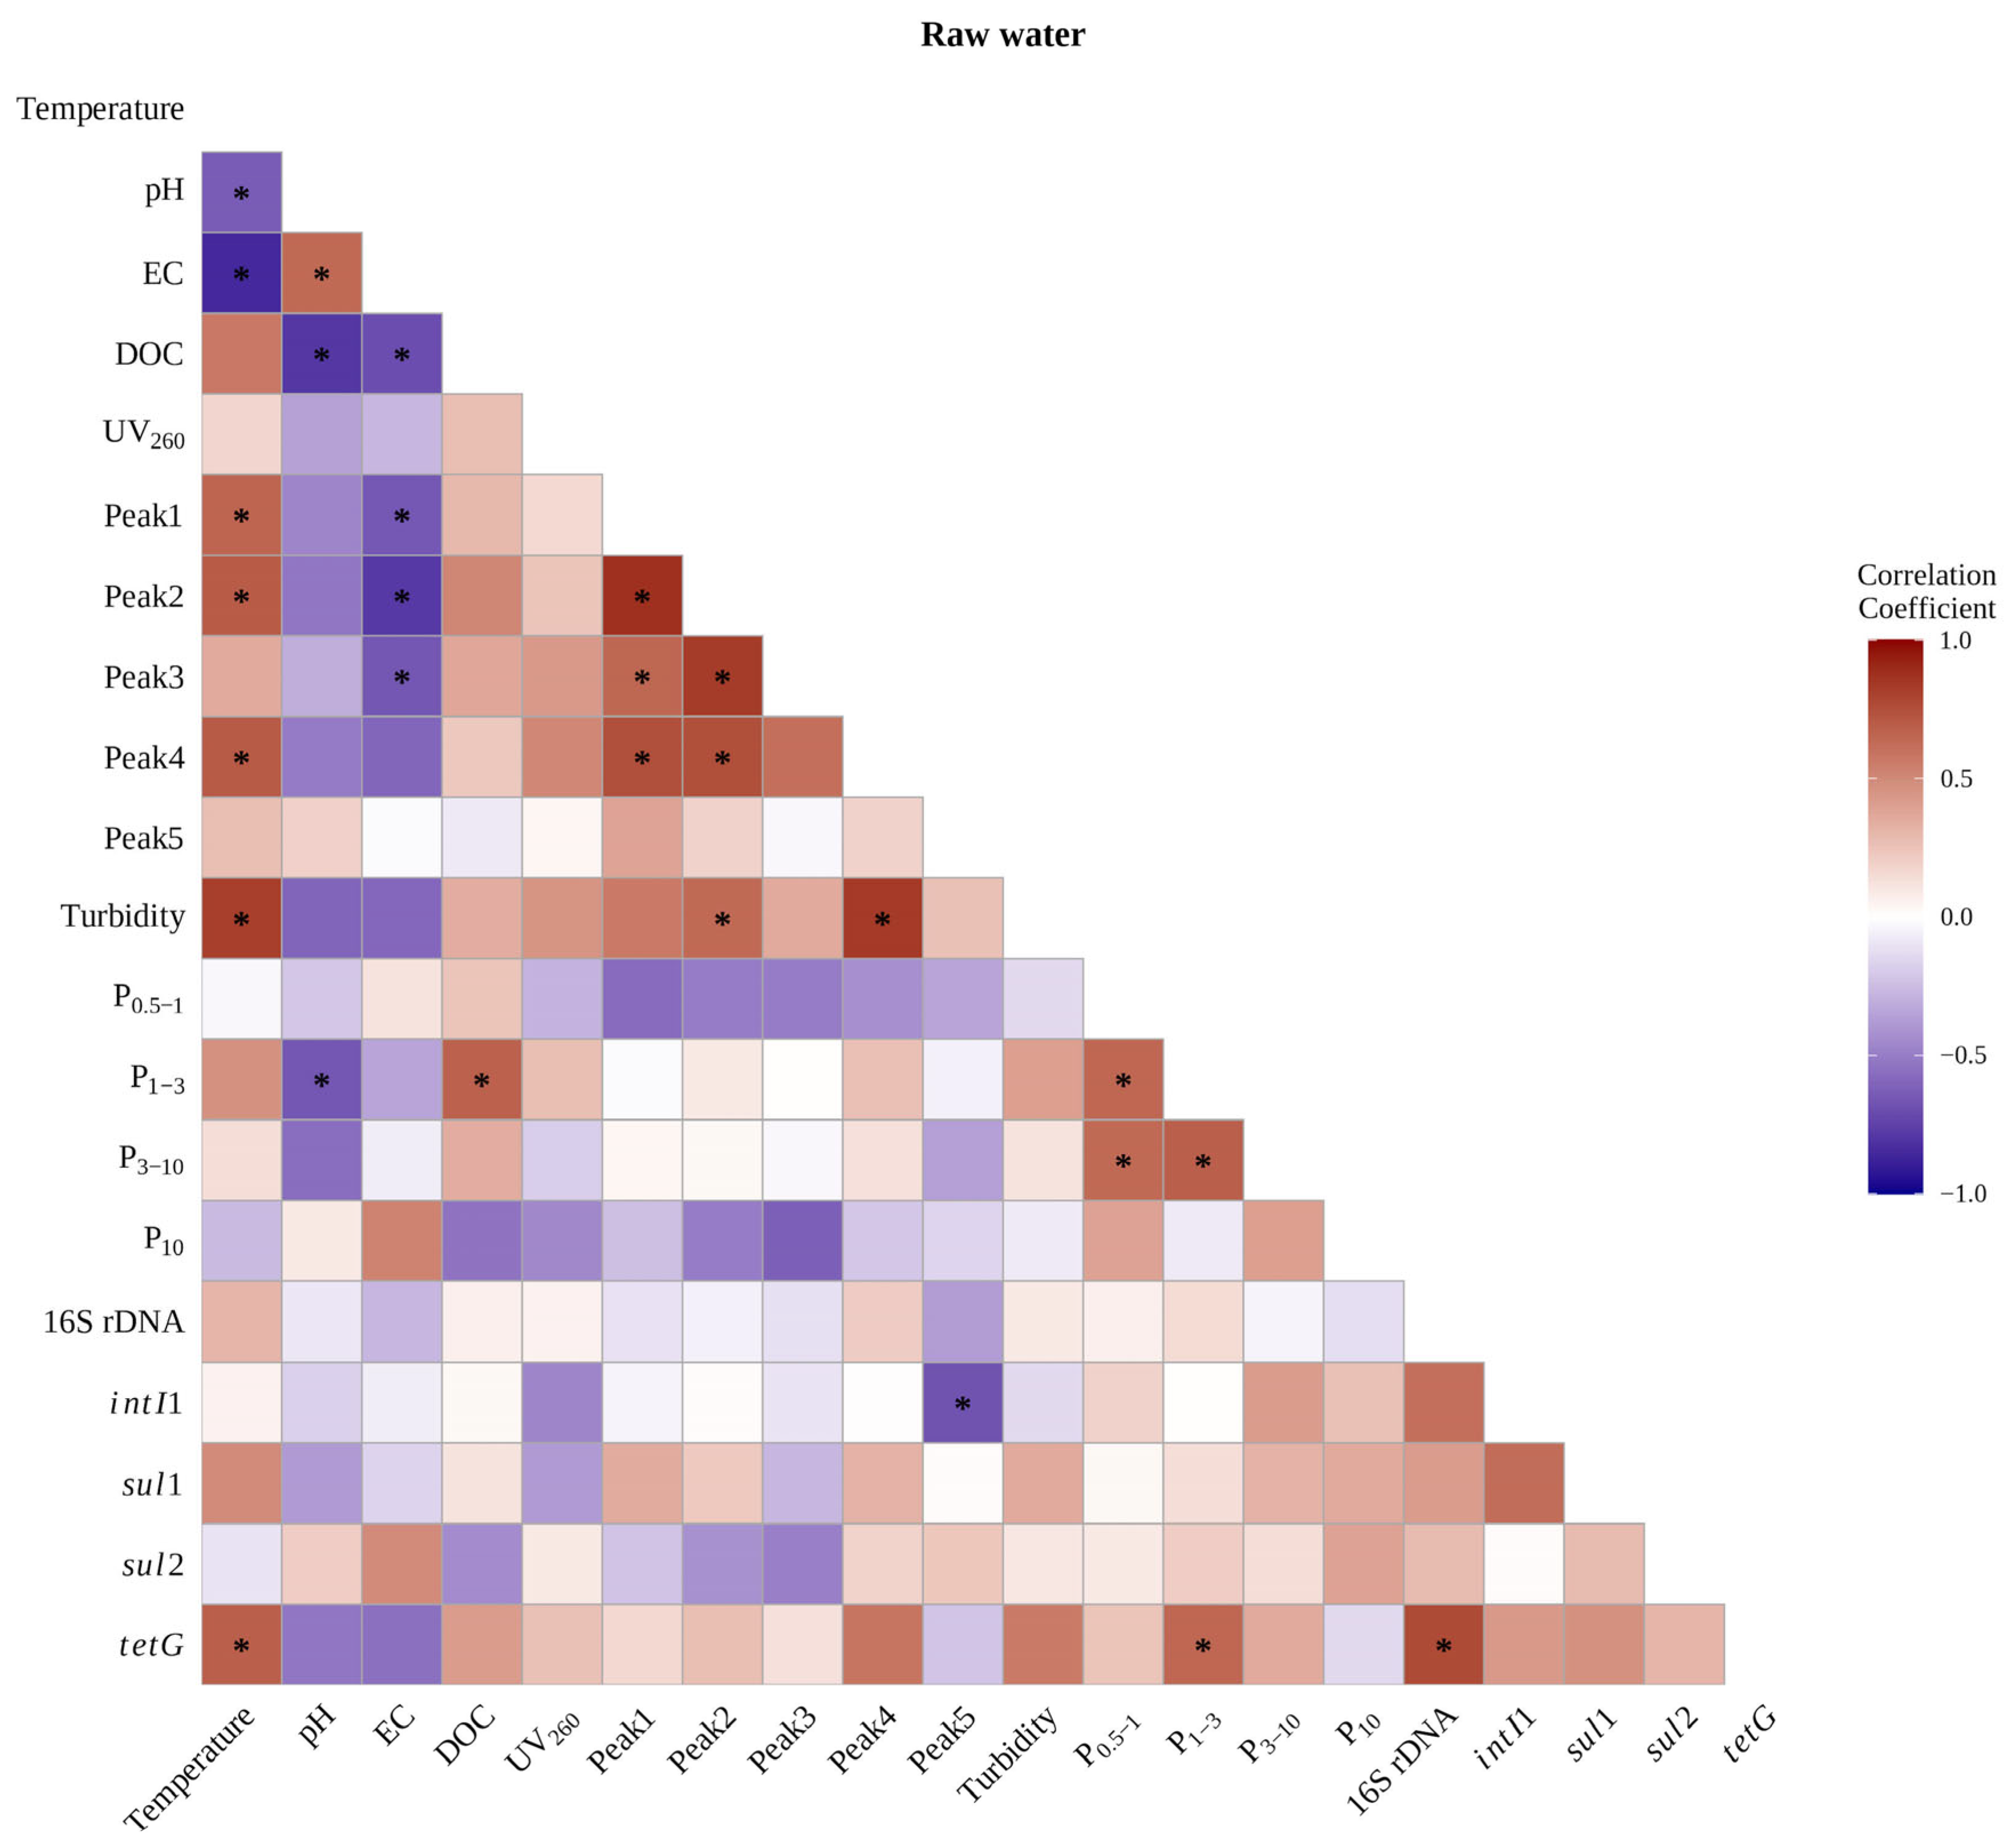
To identify potential drivers of ARG persistence, PCA and Spearman correlation analyses were conducted on effluent samples from each treatment process to characterize water quality parameters associated with residual ARG abundance along the treatment train. In raw water, PCA provided an initial overview of variable associations, showing sul1 and tetG clustering with intI1, total bacteria (16S rDNA), and fine particle fractions (0.5–1 µm and 3–10 µm) on PC2, whereas DOM indices, EC, and pH loaded predominantly on PC1 (PC1: 41.6%, PC2: 20.8%; Figure 4). sul2 showed weak loadings on both components, suggesting a less distinct association pattern. Spearman correlation analysis further showed moderate co-occurrence among ARGs, particularly between sul1 and tetG (rs = 0.47; Figure 5), and both genes showed directional positive associations with intI1 (sul1: rs = 0.62, p = 0.054; tetG: rs = 0.43), suggesting a potential role of integron-mediated HGT in ARG persistence. All ARGs and intI1 were positively associated with bacterial abundance, with tetG showing the strongest association (rs = 0.77, p = 0.009).
Figure 4.
Principal component analysis (PCA) of associations between ARGs and water quality parameters across treatment processes in the DWTP.
Figure 5.
Spearman correlation heatmap between antibiotic resistance genes and general water quality parameters in raw water (n = 10). Color intensity indicates the strength of the correlation, with red and blue representing positive and negative correlations, respectively. Correlation coefficients range from −1.0 to 1.0. Asterisks (*) indicate significant correlations (p < 0.05).
Associations with particles were gene-specific: tetG showed a significant relationship with the 1–3 µm particle fraction (rs = 0.65, p = 0.043) and a directional association with turbidity (rs = 0.56) and the 3–10 µm fraction (rs = 0.36). In contrast, sul1 showed weaker directional associations with turbidity and larger particles. These patterns suggest that particle attachment contributed to ARG persistence, consistent with studies identifying fine particles as hotspots for ARG persistence [41]. Temperature effects were also gene-dependent, with tetG showing a significant positive association (rs = 0.69, p = 0.029). However, no significant seasonal differences in ARG abundance were detected in raw water (Figure S1), suggesting that temperature may be one of several concurrent factors associated with tetG occurrence rather than a dominant seasonal driver. Overall, these patterns indicate that bacterial abundance and suspended particles were the primary parameters associated with ARG occurrence in raw water.
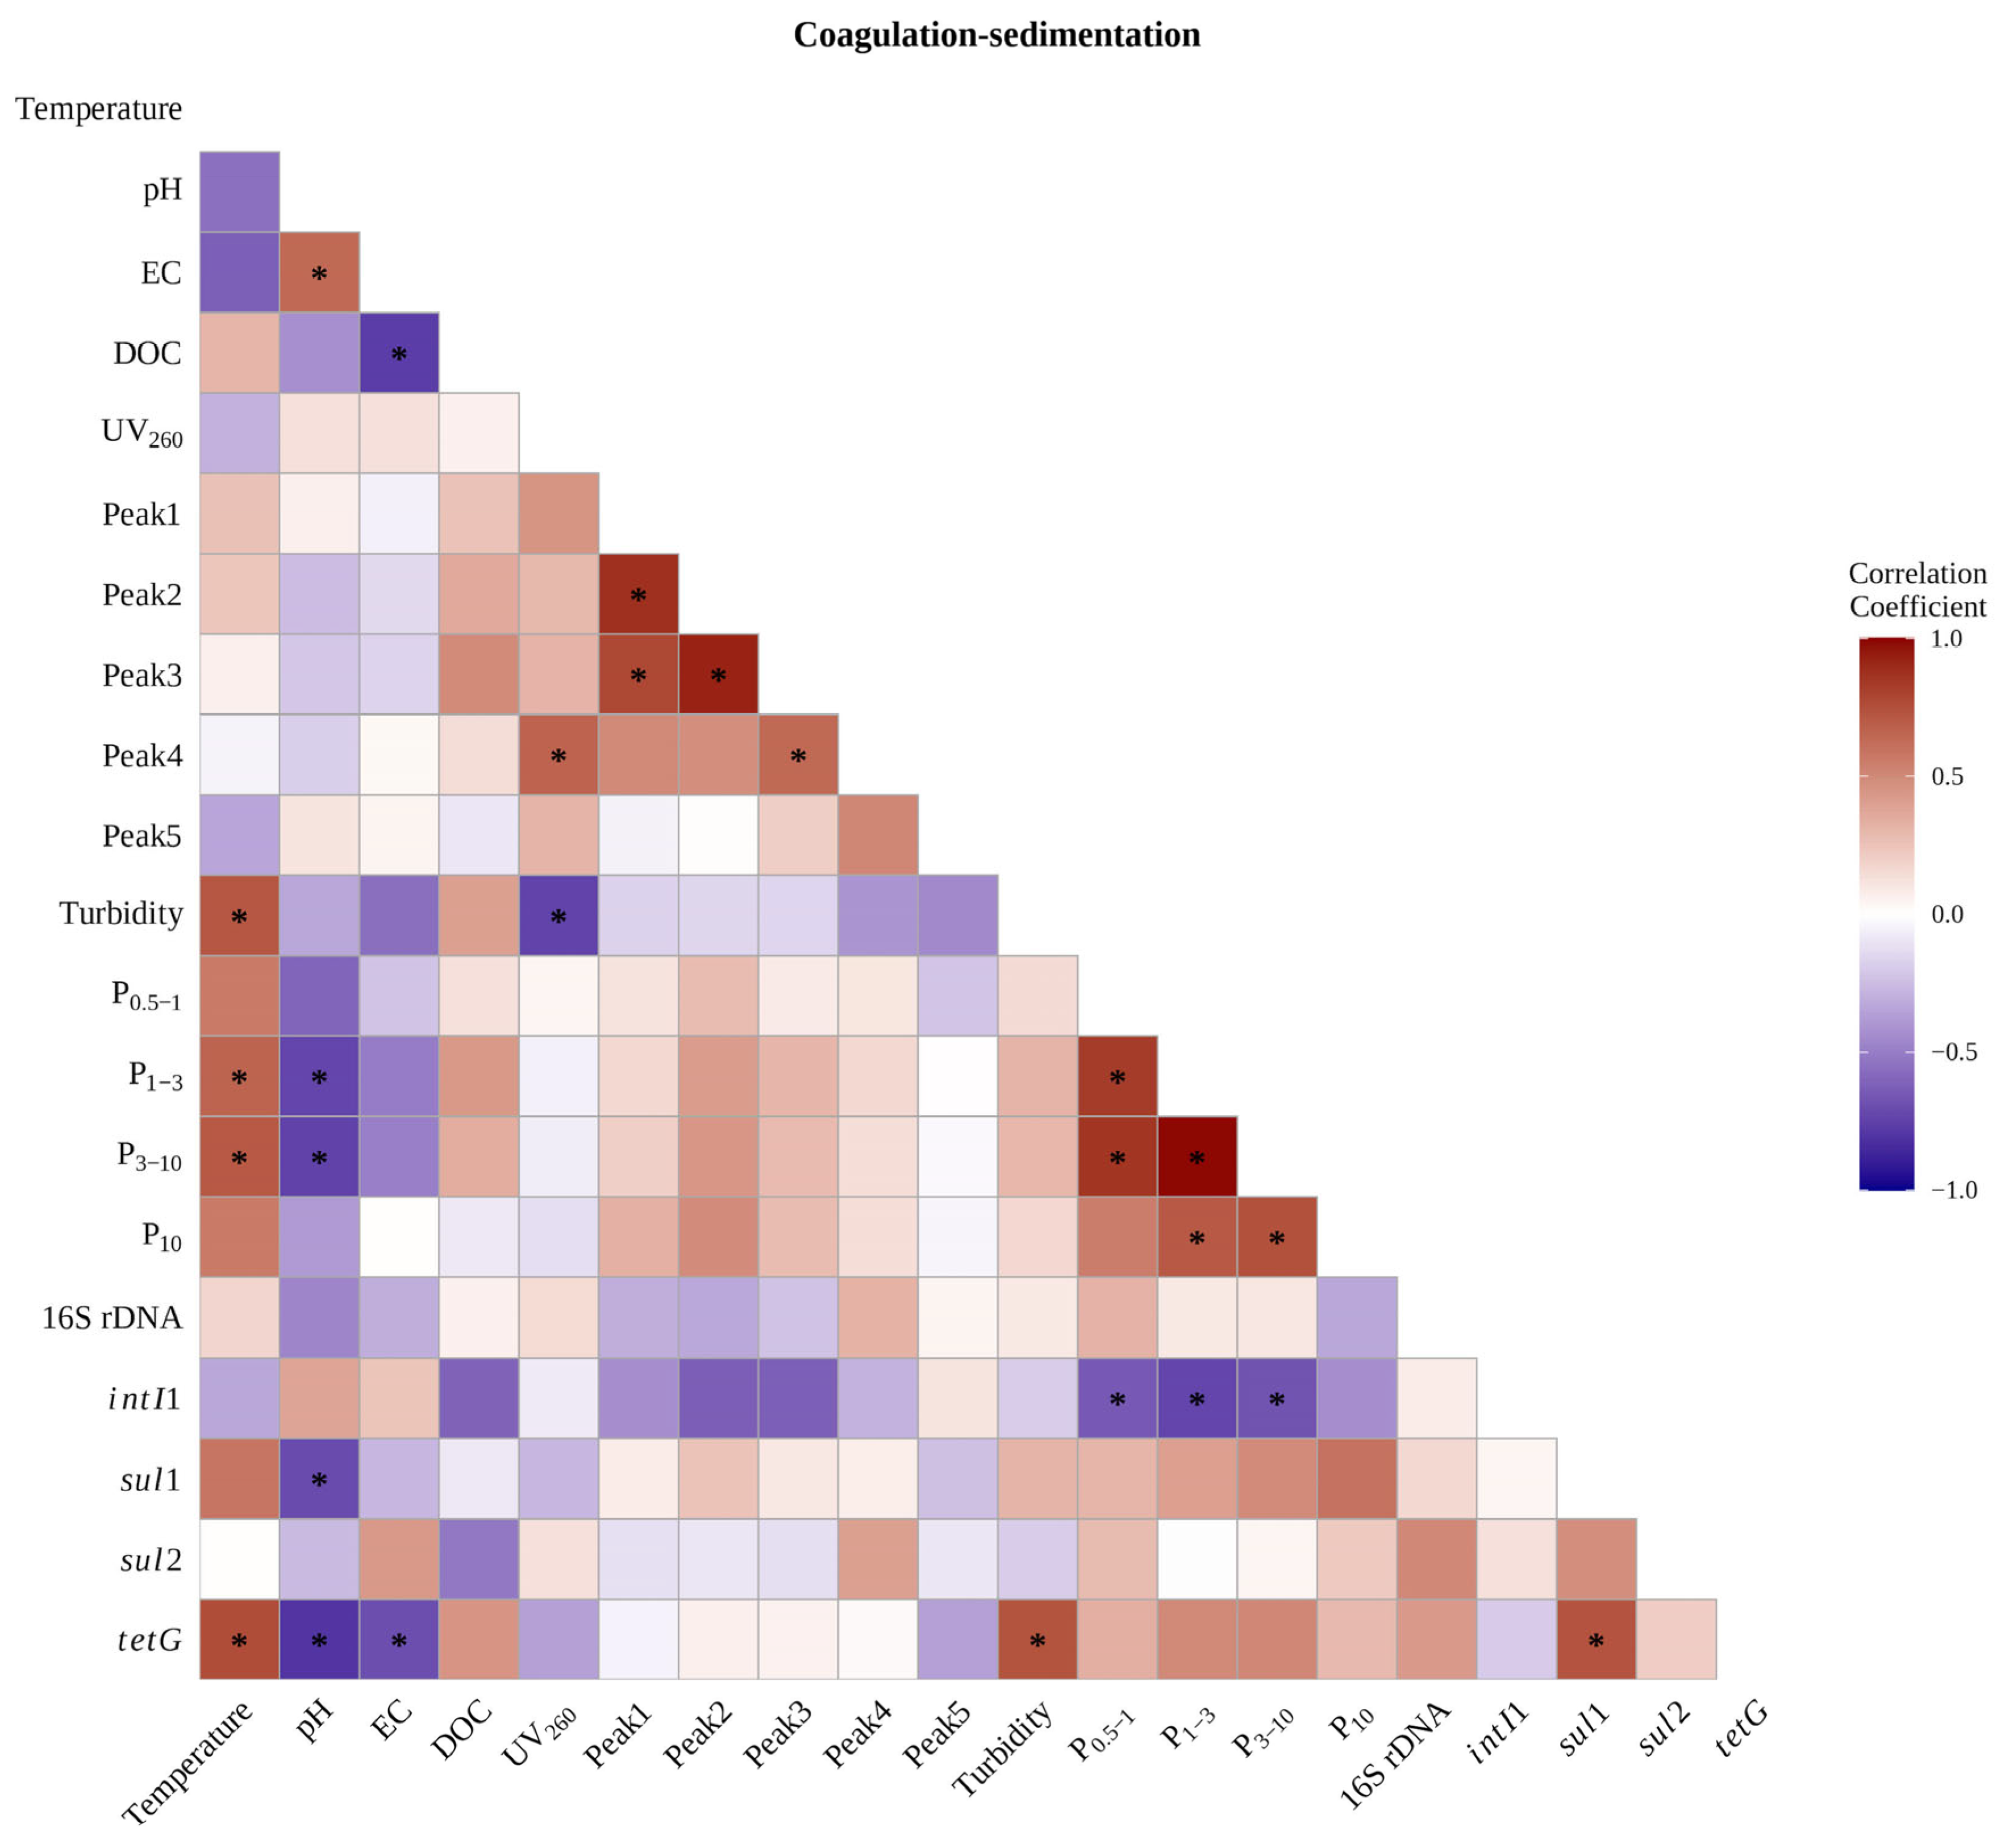
Following coagulation–sedimentation, PCA showed a shift from the raw water pattern, with sul1, sul2, and tetG clustering with total bacteria (16S rDNA) and turbidity on PC2, possibly reflecting the aggregation of bacteria and associated ARGs into floc particles, while intI1 loaded in the opposite direction to the particle fractions (PC1: 36.9%, PC2: 18.9%; Figure 4). Spearman correlation analysis showed that sul1 and tetG remained strongly co-occurring (rs = 0.73, p = 0.017; Figure 6), and residual sul1 showed directional positive associations with turbidity and particle fractions across all size ranges (rs = 0.31–0.60), indicating persistence in particle-associated fractions. tetG also remained strongly associated with turbidity (rs = 0.72, p = 0.016) and showed directional positive associations with the 1–3 µm and 3–10 µm fractions (rs = 0.50 and 0.51, respectively). Additionally, tetG showed significant associations with temperature (rs = 0.76, p = 0.011), pH (rs = −0.80, p = 0.005), and EC (rs = −0.69, p = 0.026), and sul1 showed a significant negative association with pH (rs = −0.71, p = 0.022), suggesting that water chemistry conditions at this stage may have influenced ARG persistence alongside physical particle associations. In contrast, sul2 and tetG showed directional positive associations with bacterial abundance (rs = 0.50 and 0.43, respectively), whereas sul1 and intI1 showed weak associations with bacteria (rs < 0.2), suggesting more effective removal of their bacterial carriers. intI1 showed significant negative associations with the 0.5–1, 1–3, and 3–10 µm particle fractions (rs = −0.65 to −0.73, p < 0.05), while its association with the 10–100 µm fraction was directional (rs = −0.43), indicating that its particle-associated fraction was preferentially removed. These results suggest that coagulation–sedimentation may have promoted aggregation and partial removal of particle-associated bacteria and ARGs, while residual ARGs remained associated with the remaining particles.
Figure 6.
Spearman correlation heatmap between antibiotic resistance genes and general water quality parameters after coagulation–sedimentation (n = 10). Color intensity indicates the strength of the correlation, with red and blue representing positive and negative correlations, respectively. Correlation coefficients range from −1.0 to 1.0. Asterisks (*) indicate significant correlations (p < 0.05).
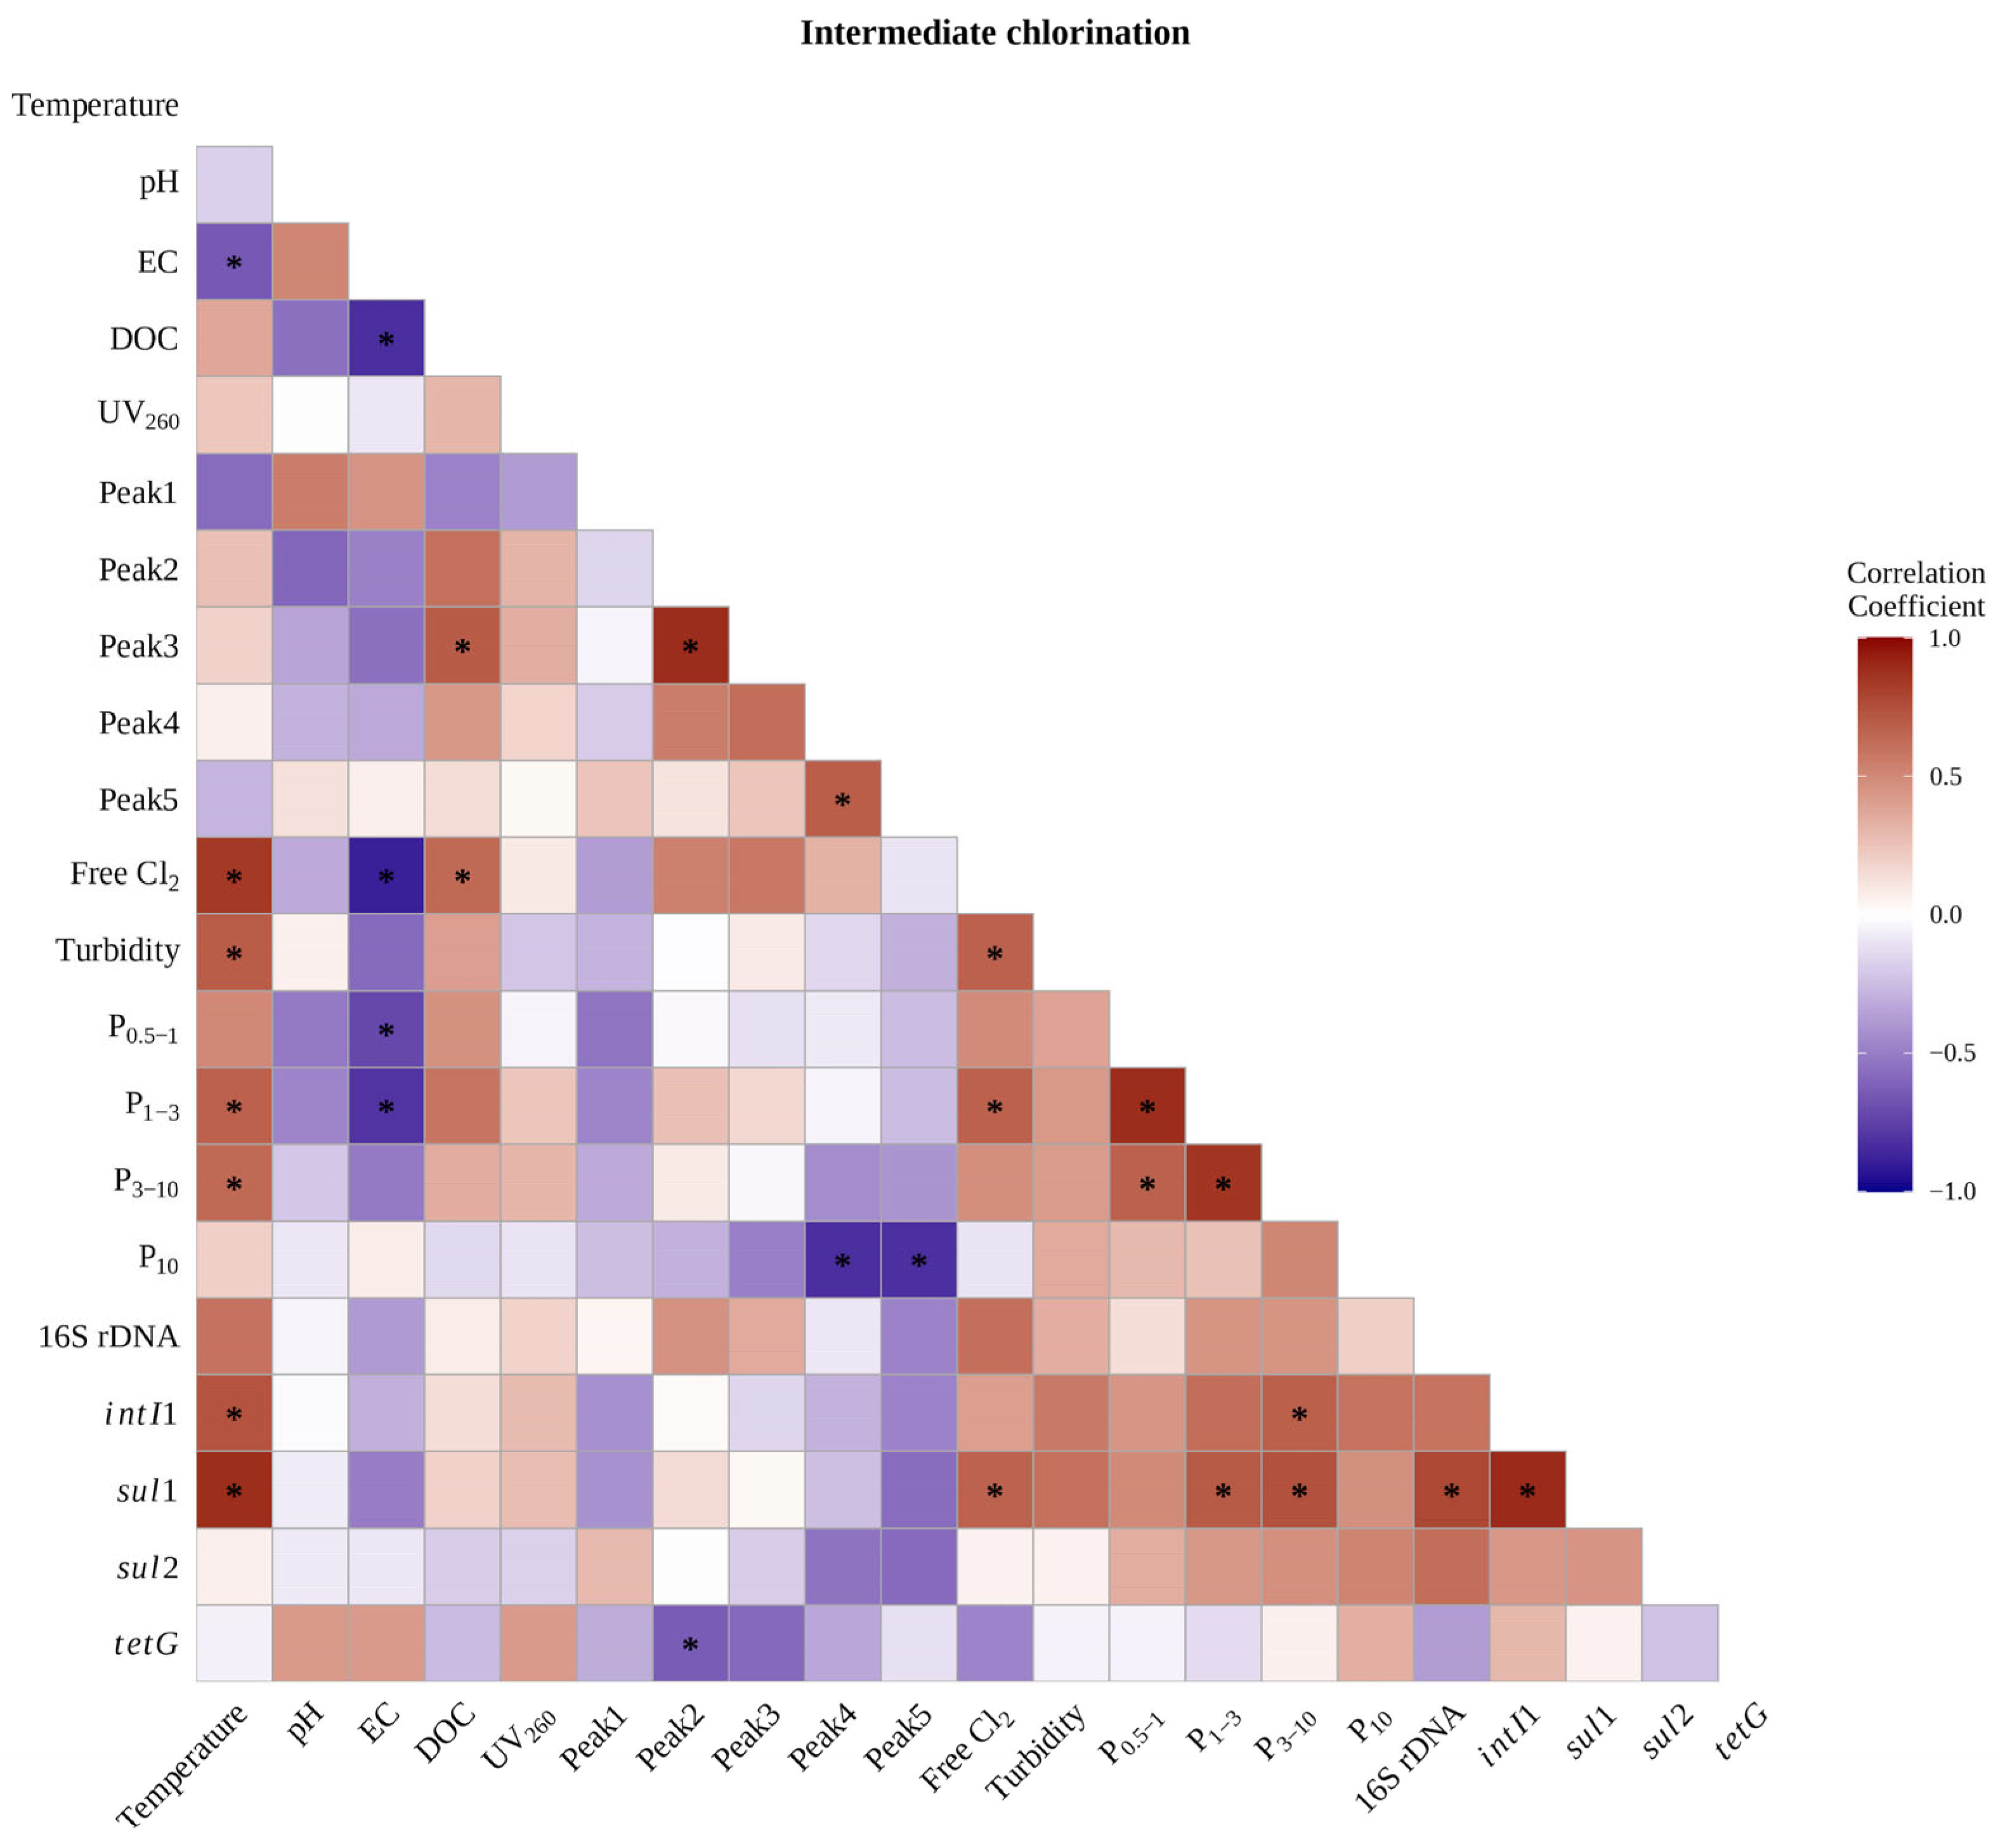
After intermediate chlorination, PCA showed clear divergence among ARGs (PC1: 31%, PC2: 26.5%; Figure 4). sul1 and intI1 clustered on the positive PC2 axis alongside particle fractions (0.5–1, 3–10, and 10–100 µm), turbidity, and 16S rDNA; sul2 showed moderate loadings without a clearly dominant component, while tetG separated along PC1, suggesting different persistence patterns after chlorination. Spearman correlation analysis showed that sul1 retained positive associations with particle fractions (1–3 µm and 3–10 µm: rs = 0.71 and 0.74, both p < 0.05; Figure 7), indicating continued persistence in particle-associated fractions. sul2 also showed directional positive associations with particle fractions (rs = 0.35–0.52), suggesting partial persistence in particle-associated fractions. In contrast to the previous stage, sul1 developed a strong association with intI1 (rs = 0.90, p < 0.001) and total bacteria (16S rDNA; rs = 0.78, p = 0.007), and both sul1 and intI1 showed significant positive associations with temperature (sul1: rs = 0.89, p = 0.001; intI1: rs = 0.73, p = 0.017) and particle fractions (intI1 in 3–10 µm: rs = 0.68, p = 0.030). Furthermore, sul1 showed a significant positive association with free chlorine residual (rs = 0.67, p = 0.036), while 16S rDNA (rs = 0.61) and intI1 (rs = 0.41) showed directional positive associations with free chlorine residual, suggesting that sul1-carrying bacteria may have persisted even under higher chlorine conditions, possibly reflecting reduced chlorine exposure through particle association [36] or selection of chlorine-tolerant populations. tetG showed a markedly different pattern from all other genes, with directional negative associations with bacterial abundance (rs = −0.38) and free chlorine (rs = −0.47), while maintaining directional positive associations with large particles (10–100 µm; rs = 0.33) and UV260 (rs = 0.43), suggesting that residual tetG may persist in particle- and DOM-associated forms rather than in bacterial hosts. This pattern may reflect enhanced persistence of extracellular tetG through particle shielding [16] and DOM association [42], which may limit its exposure to oxidative degradation during chlorination. These results, together with the relative abundance increases observed following intermediate chlorination (Figure 3), suggest that intermediate chlorination may have preferentially reduced susceptible bacteria while allowing particle-associated and potentially chlorine-tolerant ARG-carrying bacteria to persist, with extracellular ARGs potentially persisting in particle- and DOM-associated forms independent of bacterial hosts.
Figure 7.
Spearman correlation heatmap between antibiotic resistance genes and general water quality parameters after intermediate chlorination (n = 10). Color intensity indicates the strength of the correlation, with red and blue representing positive and negative correlations, respectively. Correlation coefficients range from −1.0 to 1.0. Asterisks (*) indicate significant correlations (p < 0.05).
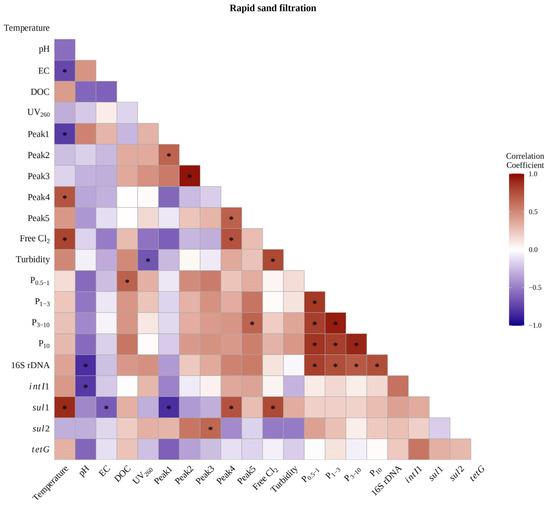
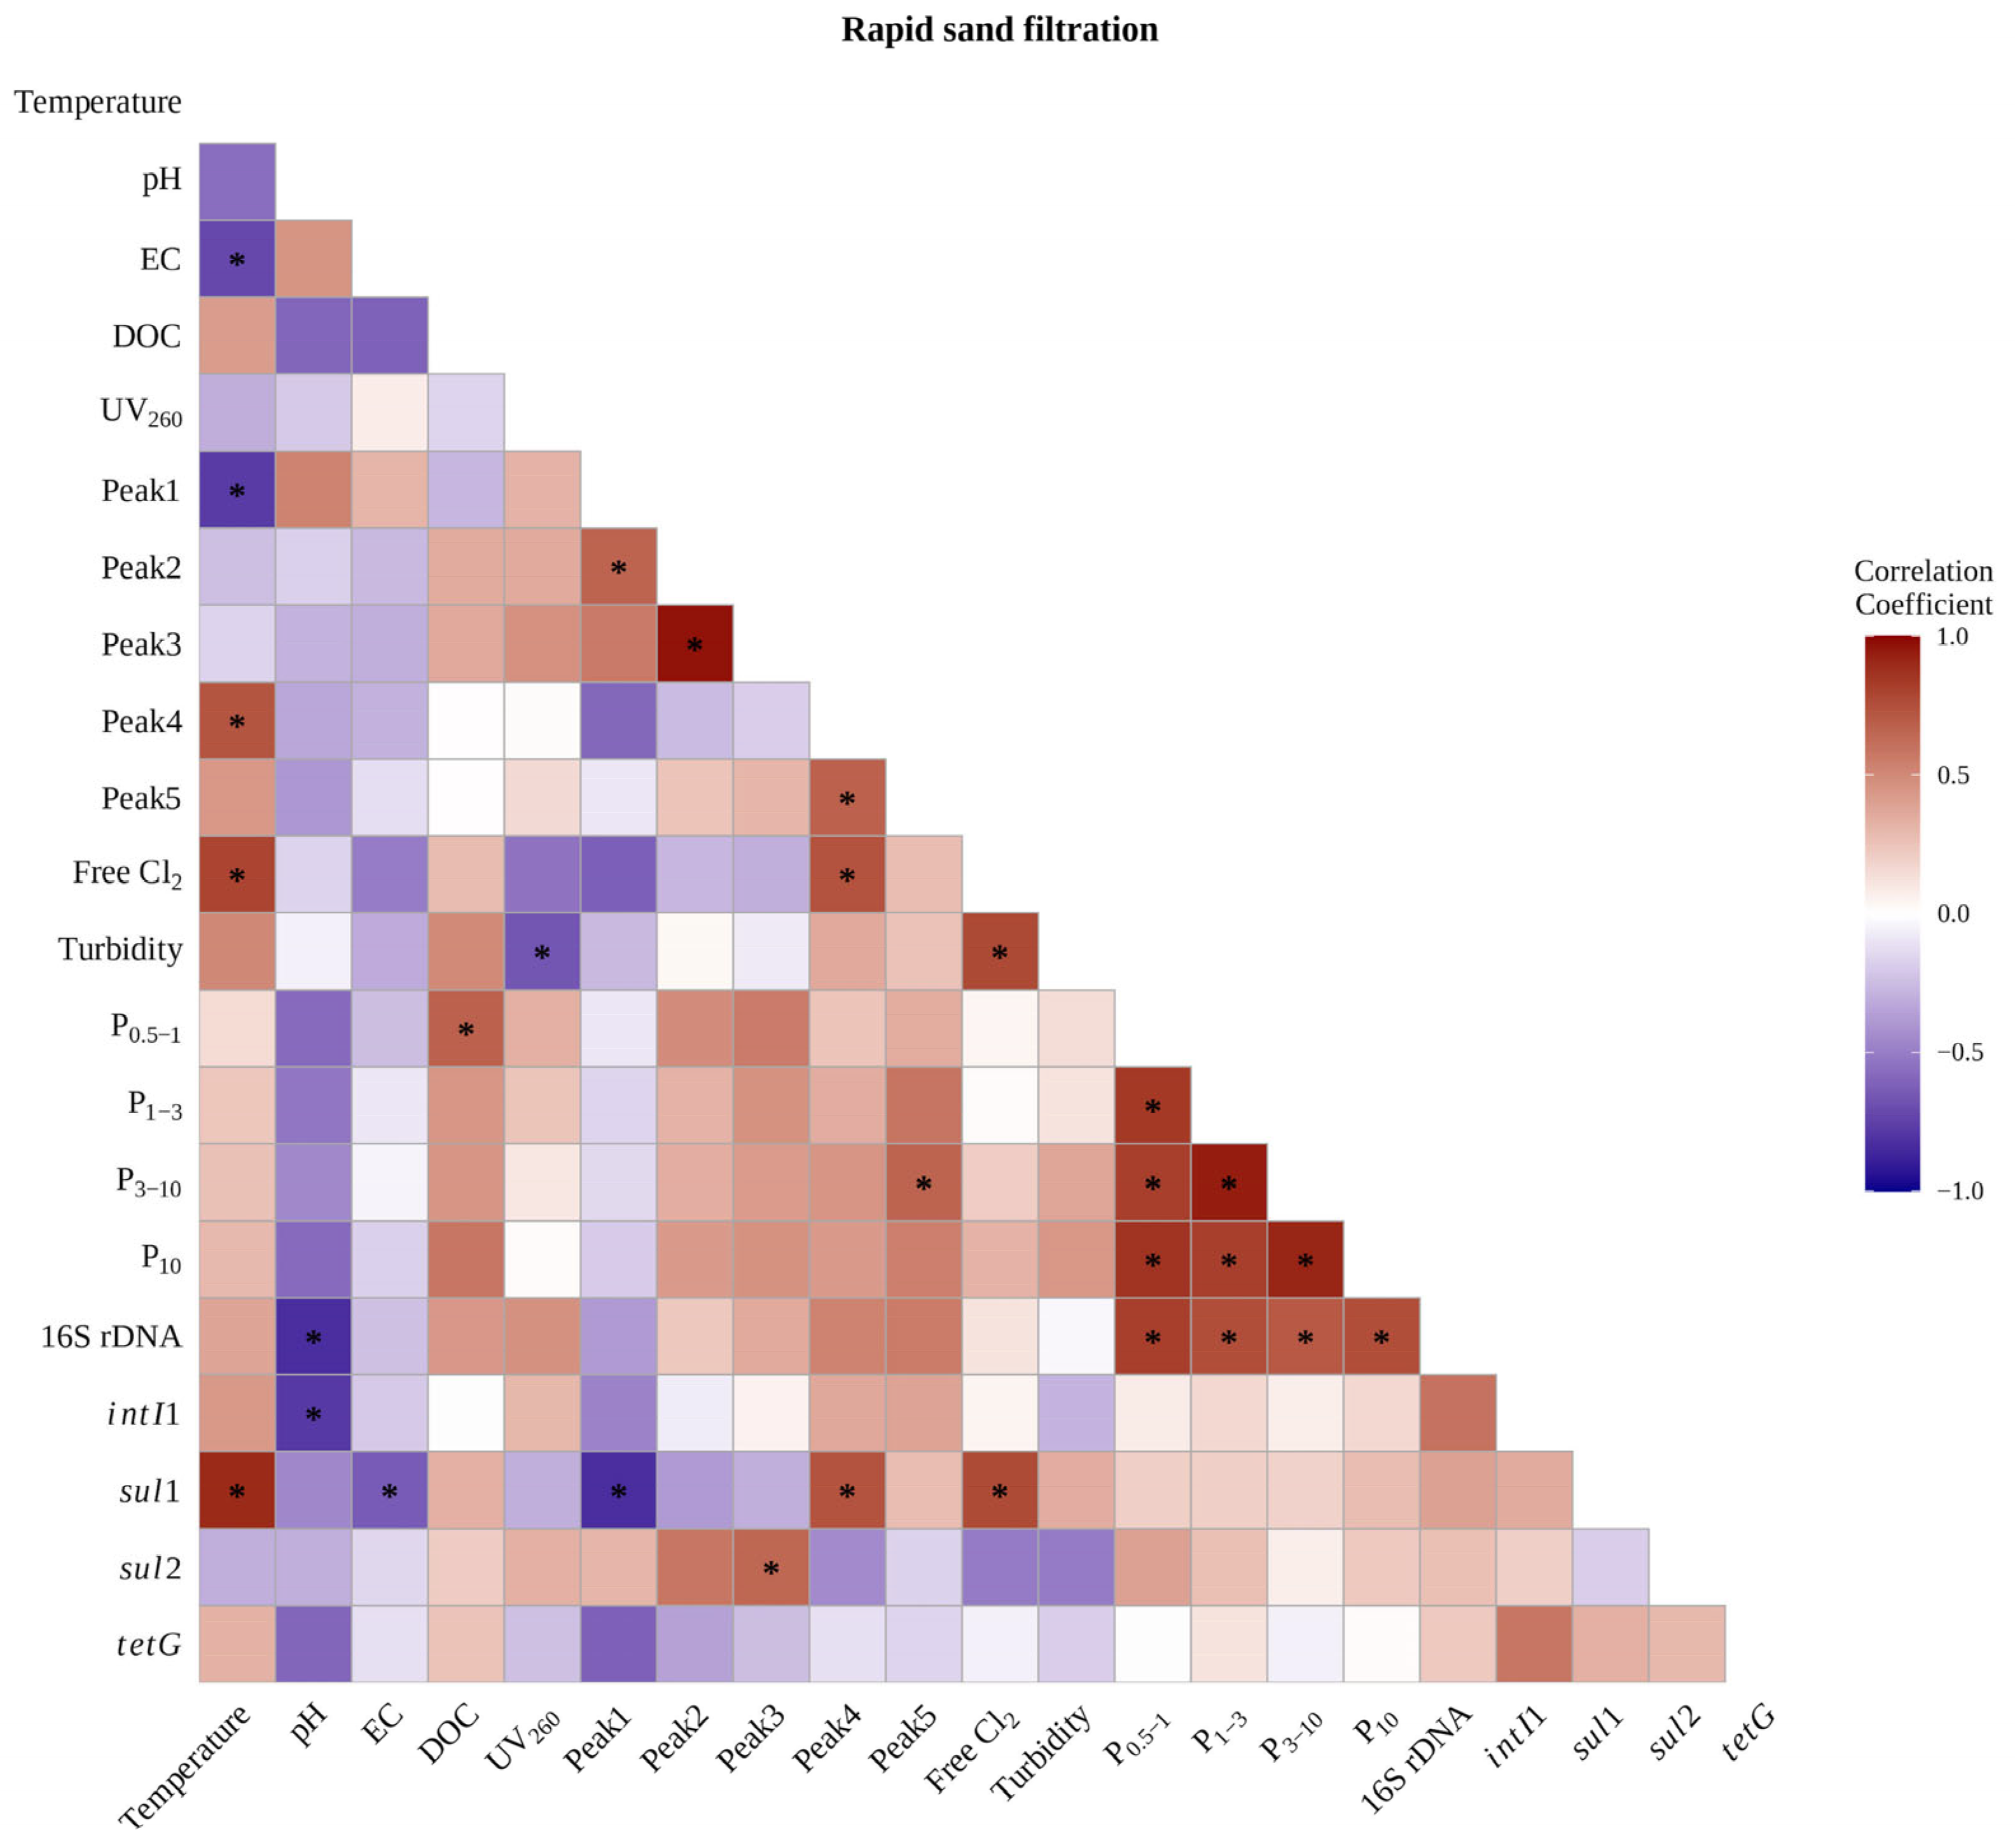
After rapid sand filtration, PCA revealed distinct loading patterns among variables (PC1: 30.4%, PC2: 29.4%; Figure 4). In contrast to the previous stage, sul1 and intI1 shifted toward the negative PC1 axis alongside free chlorine residual and temperature, while particle fractions and total bacteria (16S rDNA) clustered on the positive PC2 axis, suggesting a weaker association between ARG and particle-associated bacteria than in the previous stage. sul2 loaded on the positive PC1 axis alongside DOM indices, while tetG showed near-zero loadings on both components, indicating no clear dominant association pattern. Spearman correlation analysis showed that ARGs and intI1 had weaker particle associations than at the previous stage, with sul1 and sul2 showing directional positive associations only with the 0.5–1 µm fraction (rs = 0.20 and 0.39, respectively; Figure 8) and tetG and intI1 showing near-zero associations with all particle fractions (rs < 0.2). By contrast, bacterial abundance remained strongly associated with all particle fractions (rs = 0.71–0.82, p < 0.05), further supporting the separation between ARG and particle-associated bacterial patterns. Associations between ARGs and bacterial abundance were also weaker, with sul1 and intI1 showing directional positive associations with bacteria (rs = 0.39 and 0.60), suggesting these genes were more strongly associated with planktonic bacteria than with particle-associated bacteria in the filter effluent. DOM associations became more prominent at this stage, with sul1 showing a significant positive association with tryptophan-like substances (Peak 4; rs = 0.74, p = 0.015) and sul2 with humic-like substances (Peak 3; rs = 0.65, p = 0.042). tetG showed weak, inconsistent associations with all measured parameters, suggesting no clear dominant driver at this stage. These results suggest a shift from particle-associated persistence toward DOM-associated and planktonic bacterial pathways after filtration, possibly reflecting preferential removal of particle-associated bacteria during filtration, while planktonic bacteria, which pass more readily through rapid sand filters [43], contribute more to the residual ARG abundance.
Figure 8.
Spearman correlation heatmap between antibiotic resistance genes and general water quality parameters after rapid sand filtration (n = 10). Color intensity indicates the strength of the correlation, with red and blue representing positive and negative correlations, respectively. Correlation coefficients range from −1.0 to 1.0. Asterisks (*) indicate significant correlations (p < 0.05).
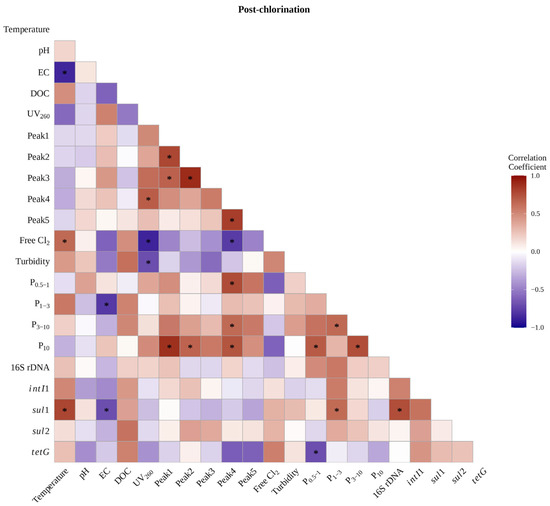
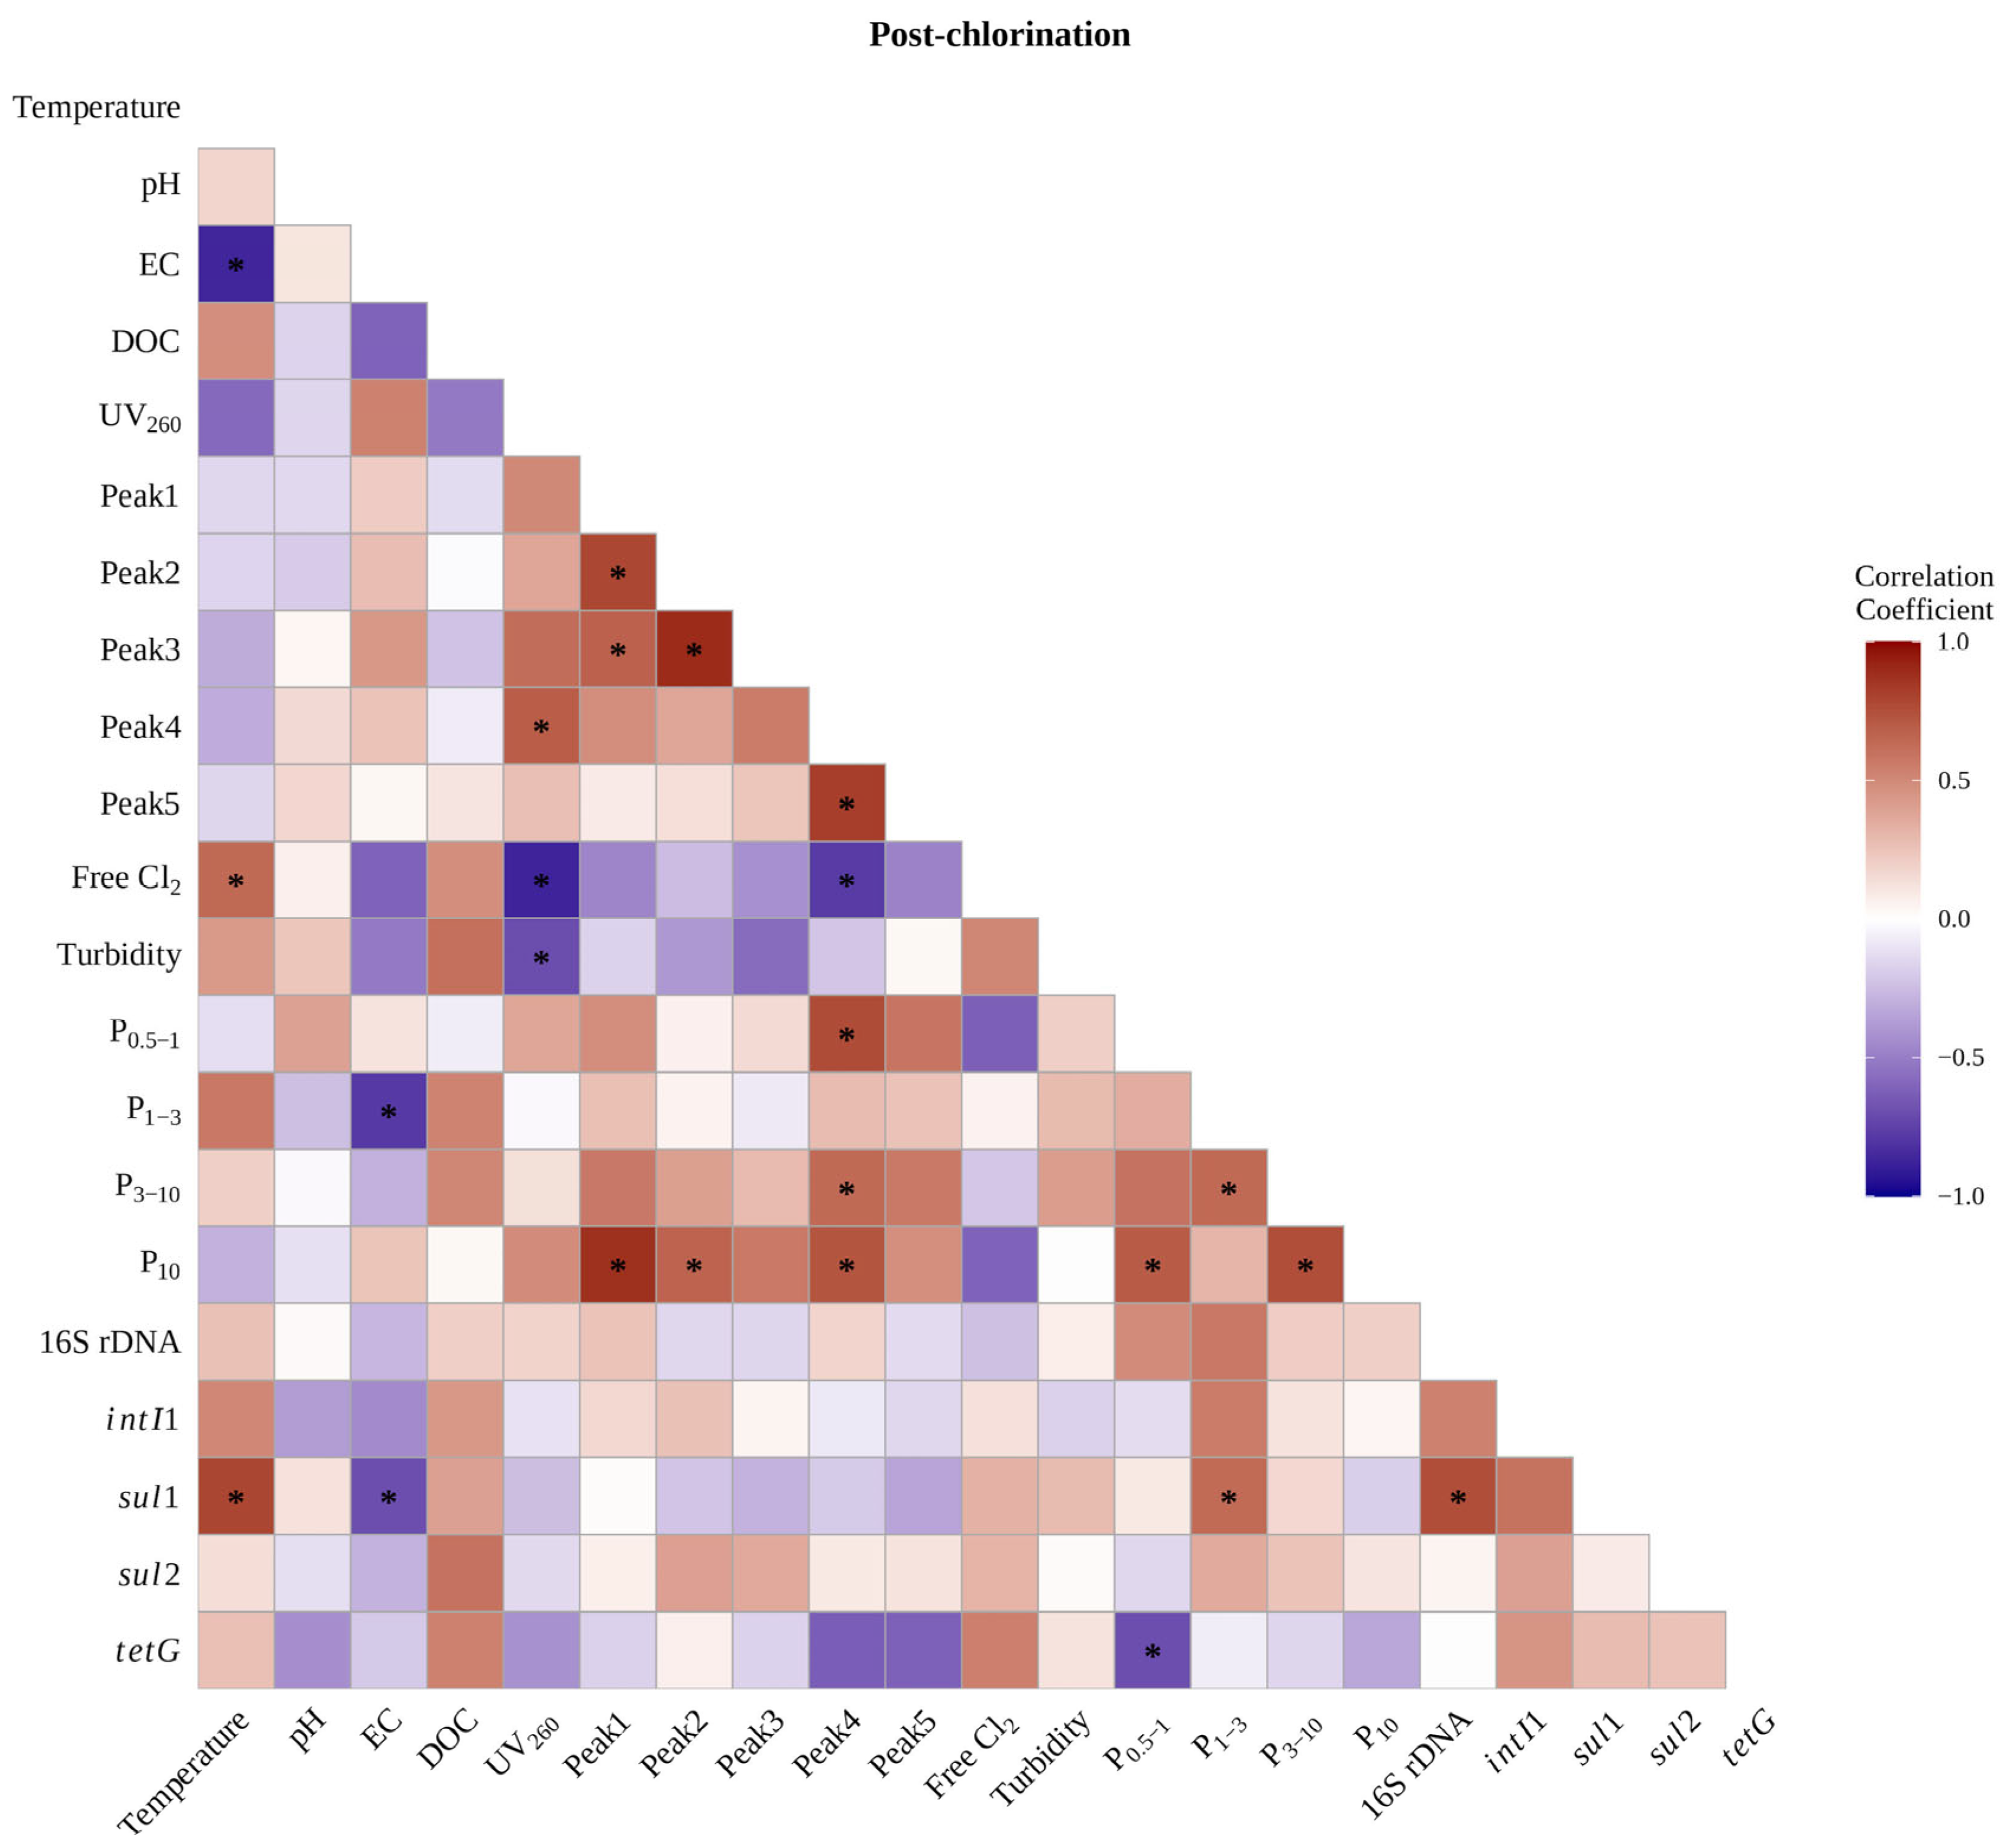
In post-chlorination effluent, PCA showed that sul2 and intI1 loaded on PC1 alongside particles, 16S rDNA, and humic- and protein-like fluorescence peaks (PC1: 43.2%, PC2: 23.1%; Figure 4). In contrast, sul1 showed moderate loading on both components, suggesting that its persistence at this stage may be associated with multiple concurrent factors rather than a single dominant parameter, whereas tetG showed weak negative loading on PC1 and near-zero loading on PC2, indicating no clear dominant driver. Spearman correlation analysis showed that sul1 remained significantly associated with bacterial abundance (rs = 0.76, p = 0.012; Figure 9) and with 1–3 µm particle fraction (rs = 0.63, p = 0.05) and showed a directional positive association with free chlorine residual (rs = 0.33), indicating a continued linkage to bacterial- and particle-associated fractions. Despite a directional negative association between 16S rDNA and free chlorine residual (rs = −0.24), sul1 remained positively associated with 16S rDNA, possibly suggesting that sul1-carrying bacteria may possess greater chlorine tolerance than the general bacterial community [12]. In contrast, sul2 and tetG showed near-zero associations with 16S rDNA and particle fractions, but directional positive associations with DOC (rs = 0.60 and 0.53, respectively), suggesting a greater contribution of DOM-associated and non-cell-associated forms. These results suggest selective survival of more chlorine-tolerant bacteria or physical protection by particles and organic matter. Notably, tetG showed a significant negative association with the 0.5–1 µm particle fraction (rs = −0.69, p = 0.026) and directional negative associations with other particle fractions, suggesting that residual tetG at this stage was not associated with particle fractions, contrasting with sul1, which showed continued particle association.
Figure 9.
Spearman correlation heatmap between antibiotic resistance genes and general water quality parameters after post-chlorination (n = 10). Color intensity indicates the strength of the correlation, with red and blue representing positive and negative correlations, respectively. Correlation coefficients range from −1.0 to 1.0. Asterisks (*) indicate significant correlations (p < 0.05).
Across the treatment train, sul1 and intI1 showed progressively weaker associations with particle-associated bacteria, while sul2 and tetG showed increasing association with DOM, with the dominant persistence pathway differing by gene. Fine-particle-associated bacteria, particularly in the 1–3 µm fractions, and DOM, including tryptophan-like substances (Peak 2 and Peak 4) and humic-like substances (Peak 3 and Peak 5), may represent potential drivers of ARG persistence in finished water. sul1 appears to persist mainly in 1–3 µm particle-associated chlorine-tolerant bacterial populations, often co-occurring with intI1, possibly reflecting the frequent location of sul1 within the conserved segment of class 1 integrons [40], which may structurally link their co-occurrence and shared persistence in particle-associated bacterial hosts. In contrast, sul2 and tetG showed no clear association with intI1 and were more strongly linked to DOM-associated and non-cell-associated forms, suggesting a different persistence pathway. To better control ARGs in finished water, drinking water treatment should aim to enhance the removal of fine particles, especially in the 1–3 µm and 3–10 µm fractions, and optimize backwash frequency and intensity to reduce biofilm development and bacterial release. Additionally, supplementing post-chlorination with advanced oxidation processes may help reduce the selection of chlorine-tolerant ARG-carrying bacteria and the persistence of DOM-associated extracellular ARGs.
4. Conclusions
This study investigated the occurrence, removal, and persistence of ARGs across a full-scale DWTP employing a rapid sand filtration system with intermediate and post-chlorination. All target ARGs (sul1, sul2, and tetG) were detected in raw water at concentrations up to 106 copies/L, indicating source water as the primary ARG input to the treatment system. However, no significant associations were found between raw and finished water ARG levels, suggesting that treatment processes and concurrent water quality changes were more important determinants of ARG persistence than ARG concentrations in source water. Although overall treatment achieved substantial reductions (LRVs: 2.1–3.6), ARGs persisted in finished water at 104 copies/L, with relative abundance increasing after treatment, suggesting selective survival of ARG-carrying bacteria or persistence of non-bacterial ARG fractions.
Among the treatment processes, coagulation–sedimentation removed more than 90% of the total ARG copies, possibly through the physical co-removal of particle-associated bacteria and organic matter. Intermediate chlorination was the most effective stage for ARG removal (LRVs: 0.53–2.4), with higher chlorine doses and lower pH favoring the formation of reactive HOCl, which likely enhanced oxidative damage to ARG-carrying bacteria and extracellular DNA. In contrast, post-chlorination was performed at a higher pH, possibly favoring the less reactive OCl−, which may have contributed to the limited additional ARG removal. Selective survival of chlorine-tolerant bacteria may have further contributed to this limited effectiveness. Notably, the relative abundance of intI1 increased after post-chlorination, suggesting continued potential for HGT in finished water.
Multivariate and correlation analyses revealed gene-specific shifts in the mechanism of ARG persistence across the treatment processes. In raw water, ARGs were mainly associated with bacterial abundance and suspended particles. With progressive treatment, sul1 and intI1 showed progressively weaker associations with particle-associated bacteria, while retaining their co-occurrence, possibly reflecting structural linkage within class 1 integrons. In contrast, sul2 and tetG showed increasing associations with DOM, suggesting a transition toward DOM-associated and potentially extracellular persistence forms. Fine-particle-associated bacteria, particularly in the 1–3 µm fractions, and DOM may represent potential drivers of ARG persistence in finished water. To better control ARGs in finished water, treatment could consider enhancing the removal of fine particles, optimizing backwash frequency and intensity to reduce biofilm development and bacterial release, and supplementing post-chlorination with advanced oxidation processes to limit the abundance of chlorine-tolerant ARG-carrying bacteria and the persistence of DOM-associated extracellular ARGs.
5. Recommendations for Future Research
The findings of this study were obtained from a single DWTP treating source water of relatively good quality, with a specific treatment configuration employing coagulation–sedimentation, intermediate chlorination, rapid sand filtration, and post-chlorination. ARG removal efficiencies may vary across DWTPs employing different treatment regimes, including coagulant types or disinfection strategies, as these factors may influence ARG fate and persistence. Therefore, field-based studies involving DWTPs with varying source water characteristics, treatment configurations, and disinfection regimes are needed to determine whether the patterns observed in this study are specific to this treatment configuration or represent broader trends. Since the findings are based on field observations and statistical analyses, controlled laboratory experiments are also needed to validate the possible effects of fine particles, DOM, pH, and chlorine dose on ARG abundance and persistence under well-defined conditions. Future research should further examine whether ARGs persist predominantly in cell-associated or extracellular forms after each treatment, as this distinction has important implications for the effectiveness of treatment strategies.
Supplementary Materials
The following supporting information can be downloaded at: https://www.mdpi.com/article/10.3390/environments13060323/s1. Table S1: Primer information and qPCR conditions [9,44]; Figure S1: Seasonal variation in absolute abundance of ARGs and intI1 across drinking water treatment processes (n = 10).
Author Contributions
Conceptualization, F.L.; methodology, N.D.S. and F.L.; validation, Y.W. and F.L.; formal analysis, N.D.S.; investigation, N.D.S., M.Y.R., W.L., and L.N.H.; writing—original draft preparation, N.D.S.; writing—review and editing, Y.W. and F.L.; visualization, N.D.S. and L.N.H.; supervision, F.L. All authors have read and agreed to the published version of the manuscript.
Funding
This research did not receive any specific grant from funding agencies in the public, commercial, or not-for-profit sectors.
Data Availability Statement
The datasets generated during this study are available from the corresponding author on reasonable request.
Conflicts of Interest
The authors declare no conflicts of interest.
Abbreviations
The following abbreviations are used in this manuscript:
| ARG | Antibiotic resistance gene |
| LRV | Log reduction value |
| HOCl | Hypochlorous acid |
| OCl− | Hypochlorite ion |
| DOM | Dissolved organic matter |
| HGT | Horizontal gene transfer |
| MGE | Mobile genetic element |
| DWTP | Drinking water treatment plant |
| PAC | Polyaluminium chloride |
| NaOCl | Sodium hypochlorite |
| EC | Electrical conductivity |
| DPD | N,N-diethyl-p-phenylenediamine |
| PTFE | Polytetrafluoroethylene |
| DOC | Dissolved organic carbon |
| UV260 | Ultraviolet absorbance at 260 nm |
| EEM | Excitation–emission matrix |
| TOC | Total organic carbon |
| Ex | Excitation |
| Em | Emission |
| QSU | Quinine sulfate units |
| qPCR | Quantitative PCR |
| PCA | Principal component analysis |
References
- Zhang, Z.; Zhang, Q.; Wang, T.; Xu, N.; Lu, T.; Hong, W.; Penuelas, J.; Gillings, M.; Wang, M.; Gao, W.; et al. Assessment of Global Health Risk of Antibiotic Resistance Genes. Nat. Commun. 2022, 13, 1553. [Google Scholar] [CrossRef] [Scilit]
- Kumavath, R.; Gupta, P.; Tatta, E.R.; Mohan, M.S.; Salim, S.A.; Busi, S. Unraveling the Role of Mobile Genetic Elements in Antibiotic Resistance Transmission and Defense Strategies in Bacteria. Front. Syst. Biol. 2025, 5, 1557413. [Google Scholar] [CrossRef] [Scilit] [PubMed]
- Pazda, M.; Kumirska, J.; Stepnowski, P.; Mulkiewicz, E. Antibiotic Resistance Genes Identified in Wastewater Treatment Plant Systems—A Review. Sci. Total Environ. 2019, 697, 134023. [Google Scholar] [CrossRef] [Scilit]
- Singh, R.; Singh, A.P.; Kumar, S.; Giri, B.S.; Kim, K.H. Antibiotic Resistance in Major Rivers in the World: A Systematic Review on Occurrence, Emergence, and Management Strategies. J. Clean. Prod. 2019, 234, 1484–1505. [Google Scholar] [CrossRef] [Scilit]
- Yang, Y.; Song, W.; Lin, H.; Wang, W.; Du, L.; Xing, W. Antibiotics and Antibiotic Resistance Genes in Global Lakes: A Review and Meta-Analysis. Environ. Int. 2018, 116, 60–73. [Google Scholar] [CrossRef] [Scilit] [PubMed]
- Guo, Z.F.; Boeing, W.J.; Xu, Y.Y.; Borgomeo, E.; Liu, D.; Zhu, Y.G. Data-Driven Discoveries on Widespread Contamination of Freshwater Reservoirs by Dominant Antibiotic Resistance Genes. Water Res. 2023, 229, 119466. [Google Scholar] [CrossRef] [Scilit]
- Sanganyado, E.; Gwenzi, W. Antibiotic Resistance in Drinking Water Systems: Occurrence, Removal, and Human Health Risks. Sci. Total Environ. 2019, 669, 785–797. [Google Scholar] [CrossRef] [Scilit] [PubMed]
- Hu, Y.; Zhang, T.; Jiang, L.; Luo, Y.; Yao, S.; Zhang, D.; Lin, K.; Cui, C. Occurrence and Reduction of Antibiotic Resistance Genes in Conventional and Advanced Drinking Water Treatment Processes. Sci. Total Environ. 2019, 669, 777–784. [Google Scholar] [CrossRef] [Scilit] [PubMed]
- Su, H.C.; Liu, Y.S.; Pan, C.G.; Chen, J.; He, L.Y.; Ying, G.G. Persistence of Antibiotic Resistance Genes and Bacterial Community Changes in Drinking Water Treatment System: From Drinking Water Source to Tap Water. Sci. Total Environ. 2018, 616–617, 453–461. [Google Scholar] [CrossRef] [Scilit] [PubMed]
- Duarte, A.C.; Rodrigues, S.; Afonso, A.; Nogueira, A.; Coutinho, P. Antibiotic Resistance in the Drinking Water: Old and New Strategies to Remove Antibiotics, Resistant Bacteria, and Resistance Genes. Pharmaceuticals 2022, 15, 393. [Google Scholar] [CrossRef] [Scilit]
- Liu, S.; Qu, H.; Yang, D.; Hu, H.; Liu, W.; Qiu, Z.; Hou, A.; Guo, J.; Li, J.; Shen, Z.; et al. Chlorine Disinfection Increases Both Intracellular and Extracellular Antibiotic Resistance Genes in a Full-Scale Wastewater Treatment Plant. Water Res. 2018, 136, 131–136. [Google Scholar] [CrossRef] [Scilit] [PubMed]
- Khan, S.; Beattie, T.K.; Knapp, C.W. Relationship between Antibiotic- and Disinfectant-Resistance Profiles in Bacteria Harvested from Tap Water. Chemosphere 2016, 152, 132–141. [Google Scholar] [CrossRef] [Scilit] [PubMed]
- Jia, S.; Shi, P.; Hu, Q.; Li, B.; Zhang, T.; Zhang, X.X. Bacterial Community Shift Drives Antibiotic Resistance Promotion during Drinking Water Chlorination. Environ. Sci. Technol. 2015, 49, 12271–12279. [Google Scholar] [CrossRef] [Scilit] [PubMed]
- Ma, L.; Li, B.; Jiang, X.T.; Wang, Y.L.; Xia, Y.; Li, A.D.; Zhang, T. Catalogue of Antibiotic Resistome and Host-Tracking in Drinking Water Deciphered by a Large Scale Survey. Microbiome 2017, 5, 154. [Google Scholar] [CrossRef] [Scilit] [PubMed]
- Chen, Y.; Guo, X.; Niu, Z.; Lu, D.; Sun, X.; Zhao, S.; Hou, L.; Liu, M.; Yang, Y. Antibiotic Resistance Genes (ARGs) and Their Associated Environmental Factors in the Yangtze Estuary, China: From Inlet to Outlet. Mar. Pollut. Bull. 2020, 158, 111360. [Google Scholar] [CrossRef] [Scilit]
- Mao, D.; Luo, Y.; Mathieu, J.; Wang, Q.; Feng, L.; Mu, Q.; Feng, C.; Alvarez, P.J.J. Persistence of Extracellular DNA in River Sediment Facilitates Antibiotic Resistance Gene Propagation. Environ. Sci. Technol. 2014, 48, 71–78. [Google Scholar] [CrossRef] [Scilit]
- Tong, L.; Qin, L.; Guan, C.; Wilson, M.E.; Li, X.; Cheng, D.; Ma, J.; Liu, H.; Gong, F. Antibiotic Resistance Gene Profiling in Response to Antibiotic Usage and Environmental Factors in the Surface Water and Groundwater of Honghu Lake, China. Environ. Sci. Pollut. Res. 2020, 27, 31995–32005. [Google Scholar] [CrossRef] [Scilit]
- The AMR One Health Surveillance Committee. Nippon AMR One Health Report (NAOR) 2024; Ministry of Health, Labour and Welfare: Tokyo, Japan, 2024. [Google Scholar]
- WHO. Global Antimicrobial Resistance and Use Surveillance System (GLASS) Report: Antibiotic Use Data for 2022; WHO: Geneva, Switzerland, 2025. [Google Scholar]
- Berendonk, T.U.; Manaia, C.M.; Merlin, C.; Fatta-Kassinos, D.; Cytryn, E.; Walsh, F.; Bürgmann, H.; Sørum, H.; Norström, M.; Pons, M.N.; et al. Tackling Antibiotic Resistance: The Environmental Framework. Nat. Rev. Microbiol. 2015, 13, 310–317. [Google Scholar] [CrossRef] [Scilit]
- Rosadi, M.Y.; Maysaroh, S.; Sagita, N.D.; Anggreini, S.; Desmiarti, R.; Deng, Z.; Li, F. Fluorescence-Based Indicators Predict the Performance of Conventional Drinking Water Treatment Processes: Evaluation Based on the Changes in the Compositions of Dissolved Organic Matter. Chemosphere 2023, 337, 139410. [Google Scholar] [CrossRef] [Scilit]
- Sarkar, K.; Yandi, R.; Sagita, N.D.; Li, F. Spatiotemporal Variation of Fishy Smell-Causing Algae (Uroglena Americana) and Its Correlation with Water Quality Factors in the Source Water of Drinking Water Treatment Plant. Water Air Soil Pollut. 2023, 234, 507. [Google Scholar] [CrossRef] [Scilit]
- Cui, G.; Li, F.; Li, S.; Bhat, S.A.; Ishiguro, Y.; Wei, Y.; Yamada, T.; Fu, X.; Huang, K. Changes of Quinolone Resistance Genes and Their Relations with Microbial Profiles during Vermicomposting of Municipal Excess Sludge. Sci. Total Environ. 2018, 644, 494–502. [Google Scholar] [CrossRef] [Scilit]
- Luo, L.; Wang, Z.; Huang, X.; Gu, J.D.; Yu, C.; Deng, O. The Fate of Antibiotic Resistance Genes in Wastewater Containing Microalgae Treated by Chlorination, Ultra-Violet, and Fenton Reaction. Water Res. 2024, 254, 121392. [Google Scholar] [CrossRef] [Scilit] [PubMed]
- Hu, Y.; Jiang, L.; Zhang, T.; Jin, L.; Han, Q.; Zhang, D.; Lin, K. Occurrence and Removal of Sulfonamide Antibiotics and Antibiotic Resistance Genes in Conventional and Advanced Drinking Water Treatment Processes. J. Hazard. Mater. 2018, 360, 364–372. [Google Scholar] [CrossRef] [Scilit]
- Xu, L.; Ouyang, W.; Qian, Y.; Su, C.; Su, J.; Chen, H. High-Throughput Profiling of Antibiotic Resistance Genes in Drinking Water Treatment Plants and Distribution Systems. Environ. Pollut. 2016, 213, 119–126. [Google Scholar] [CrossRef] [Scilit]
- Yang, J.; Zhang, X.; Xu, Z.; Wang, X. Prevalence of Antibiotic Resistance Genes in Different Drinking Water Treatment Processes in a Northwest Chinese City. Environ. Geochem. Health 2024, 46, 436. [Google Scholar] [CrossRef] [Scilit] [PubMed]
- Chen, J.; Guo, Y.; Lin, Y.; Zhang, Y.; Qian, Q.; Zhang, X.; Lin, P.; Chen, C.; Xie, S. Fate, Mobility and Pathogenicity of Antibiotic Resistome in a Full-Scale Drinking Water Treatment Plant: Highlighting the Chlorination Risks. J. Environ. Manag. 2025, 390, 126425. [Google Scholar] [CrossRef] [Scilit]
- Hu, Y.; Jiang, L.; Sun, X.; Wu, J.; Ma, L.; Zhou, Y.; Lin, K.; Luo, Y.; Cui, C. Risk Assessment of Antibiotic Resistance Genes in the Drinking Water System. Sci. Total Environ. 2021, 800, 149650. [Google Scholar] [CrossRef] [Scilit]
- Yang, J.; Wang, H.; James, D.; Du, H.; Yu, X. Persistence of Antibiotic Resistance Genes from River Water to Tap Water in the Yangtze River Delta. Sci. Total Environ. 2020, 742, 140592. [Google Scholar] [CrossRef] [Scilit] [PubMed]
- Burke, M.; Wells, E.; Larison, C.; Rao, G.; Bentley, M.J.; Linden, Y.S.; Smeets, P.; DeFrance, J.; Brown, J.; Linden, K.G. Systematic Review of Microorganism Removal Performance by Physiochemical Water Treatment Technologies. Environ. Sci. Technol. 2025, 59, 21763–21775. [Google Scholar] [CrossRef] [Scilit] [PubMed]
- Tahraoui, H.; Toumi, S.; Boudoukhani, M.; Touzout, N.; Sid, A.N.E.H.; Amrane, A.; Belhadj, A.E.; Hadjadj, M.; Laichi, Y.; Aboumustapha, M.; et al. Evaluating the Effectiveness of Coagulation–Flocculation Treatment Using Aluminum Sulfate on a Polluted Surface Water Source: A Year-Long Study. Water 2024, 16, 400. [Google Scholar] [CrossRef] [Scilit]
- Deborde, M.; von Gunten, U. Reactions of Chlorine with Inorganic and Organic Compounds during Water Treatment-Kinetics and Mechanisms: A Critical Review. Water Res. 2008, 42, 13–51. [Google Scholar] [CrossRef] [Scilit] [PubMed]
- da Cruz Nizer, W.S.; Inkovskiy, V.; Overhage, J. Surviving Reactive Chlorine Stress: Responses of Gram-Negative Bacteria to Hypochlorous Acid. Microorganisms 2020, 8, 1220. [Google Scholar] [CrossRef] [Scilit]
- Shi, P.; Jia, S.; Zhang, X.X.; Zhang, T.; Cheng, S.; Li, A. Metagenomic Insights into Chlorination Effects on Microbial Antibiotic Resistance in Drinking Water. Water Res. 2013, 47, 111–120. [Google Scholar] [CrossRef] [Scilit]
- Ridgway, H.F.; Olson, B.H. Chlorine Resistance Patterns of Bacteria from Two Drinking Water Distribution Systems. Appl. Environ. Microbiol. 1982, 44, 972–987. [Google Scholar] [CrossRef] [Scilit]
- He, Y.; Bai, M.; He, Y.; Wang, S.; Zhang, J.; Jiang, S.; Wang, G. Suspended Particles Are Hotspots for Pathogen-Related Bacteria and ARGs in Coastal Beach Waters of Northern China. Sci. Total Environ. 2022, 817, 153004. [Google Scholar] [CrossRef] [Scilit]
- Zhang, T.; Lv, K.; Lu, Q.; Wang, L.; Liu, X. Removal of Antibiotic-Resistant Genes during Drinking Water Treatment: A Review. J. Environ. Sci. 2021, 104, 415–429. [Google Scholar] [CrossRef] [Scilit]
- Calderón-Franco, D.; Corbera-Rubio, F.; Cuesta-Sanz, M.; Pieterse, B.; de Ridder, D.; van Loosdrecht, M.C.M.; van Halem, D.; Laureni, M.; Weissbrodt, D.G. Microbiome, Resistome and Mobilome of Chlorine-Free Drinking Water Treatment Systems. Water Res. 2023, 235, 119905. [Google Scholar] [CrossRef] [Scilit] [PubMed]
- Chen, B.; Liang, X.; Nie, X.; Huang, X.; Zou, S.; Li, X. The Role of Class I Integrons in the Dissemination of Sulfonamide Resistance Genes in the Pearl River and Pearl River Estuary, South China. J. Hazard. Mater. 2015, 282, 61–67. [Google Scholar] [CrossRef] [Scilit] [PubMed]
- Yu, K.; Li, P.; Qiang, Z.; Chen, P.; He, Y. Particulate Matter Continuum as Distinct Colonization Niches for Antibiotic Resistome, Mobilome and Virulence Factor Genes in Wastewater: Insights from Full Size-Fractionated Partitioning. J. Hazard. Mater. 2025, 494, 138503. [Google Scholar] [CrossRef] [Scilit] [PubMed]
- Chatterjee, A.; Zhang, K.; Parker, K.M. Binding of Dissolved Organic Matter to RNA and Protection from Nuclease-Mediated Degradation. Environ. Sci. Technol. 2023, 57, 16086–16096. [Google Scholar] [CrossRef] [Scilit] [PubMed]
- O’connor, J.T.; O’connor, T.L. Removal of Microorganisms by Rapid Sand Filtration; H2O’C Engineering: Columbia, MO, USA, 2001. [Google Scholar]
- Cui, G.; Bhat, S.A.; Li, W.; Wei, Y.; Kui, H.; Fu, X.; Gui, H.; Wei, C.; Li, F. Gut Digestion of Earthworms Significantly Attenuates Cell-Free and -Associated Antibiotic Resistance Genes in Excess Activated Sludge by Affecting Bacterial Profiles. Sci. Total Environ. 2019, 691, 644–653. [Google Scholar] [CrossRef] [Scilit] [PubMed]



Disclaimer/Publisher’s Note: The statements, opinions and data contained in all publications are solely those of the individual author(s) and contributor(s) and not of MDPI and/or the editor(s). MDPI and/or the editor(s) disclaim responsibility for any injury to people or property resulting from any ideas, methods, instructions or products referred to in the content. |
© 2026 by the authors. Licensee MDPI, Basel, Switzerland. This article is an open access article distributed under the terms and conditions of the Creative Commons Attribution (CC BY) license.