


Abstract
The need for reliable biological indicators to support soil biomonitoring is increasing, particularly in agricultural systems where management practices and environmental pressures interact to influence soil ecological integrity. Among soil fauna-based indicators that measure soil health, the Soil Biological Quality indices based on microarthropods (QBS-ar) and earthworms (QBS-e) provide functional measures of soil condition, however their combined application remains largely unexplored. In this study, for the first time both indices were applied simultaneously to assess soil biological quality in the same agroecosystem. The context was that of contrasting agricultural systems (strip cropping vs. pure stands) in a real-farm experimental set-up. Additional biological variables and soil physico-chemical parameters were also considered. Statistical analyses included Spearman correlations, linear mixed-effect models (LMMs), and redundancy analysis (RDA). QBS-ar and QBS-e showed contrasting responses to management systems, with higher QBS-ar values under strip cropping and higher QBS-e values in pure stands. No significant relationship was observed between the two indices. Multivariate analyses indicated that both indices were significantly influenced by management and environmental variables, although with different patterns of association. QBS-ar appeared more responsive to variation in topsoil conditions, whereas QBS-e was associated with broader soil properties and seasonal community dynamics. These results indicate that QBS-ar and QBS-e capture complementary aspects of soil biological quality and should not be used interchangeably. Their combined use improves the interpretation of soil biological responses to agricultural management and associated environmental pressures. Overall, this study highlights the potential of soil fauna-based indices as practical tools for biomonitoring in agroecosystems and supports further exploration on the comparative responses of biological indexes.
1. Introduction
Around half of the European Union’s total surface is devoted to agriculture, making soil health intrinsically dependent on farming practices. As a result, European soils are currently facing numerous challenges, largely driven by intensive agricultural systems and the increasing demand for food production [1].
These pressures have a significant impact on soil biodiversity and contribute to various forms of soil degradation, including pollution from chemical inputs, such as inorganic fertilizers [2,3], and pesticides [4,5]. Rather than acting as isolated stressors, these inputs are part of a broader set of environmental pressures associated with agricultural intensification, which can alter soil biological communities and ecosystem functioning [6]. Improper use of inorganic fertilizers can lead to soil acidification, reduced organic carbon content, and decreased biological activity in the rhizosphere, and increased environmental impacts associated with their production [7,8,9]. Pesticide residues further threaten soil biota by altering physiological processes, including enzyme activity, growth and reproduction [5]. In European soils, pesticides are widespread, with fungicide being the most prevalent across a range of ecosystems, followed by herbicide and insecticide [6]. Overall, these pressures can contribute to shifts in soil biological communities and may ultimately affect soil health and fertility.
Despite the critical role of soil organisms in ecosystem functioning, their integration into monitoring and assessment frameworks remains limited, particularly in relation to agricultural pressures [6,10]. To address this gap, systematic monitoring approaches are increasingly required. Such approaches should not only consider chemical measurements but should also assess biological responses across multiple levels of organization, including non-target soil organisms, such as protists [11,12] microarthropods [13,14,15], earthworms [16,17], arbuscular mycorrhizal fungi (AMF) [18,19], and bacteria [20]. Because these organisms respond sensitively to environmental change, they can provide early and integrative signals of ecosystem-level stress.
Given the fundamental role of soil biodiversity, this component has historically been insufficiently integrated into regulatory frameworks and conservation policies [6,21]. Recent efforts have emphasized the need for coordinated and harmonized approaches to soil biodiversity monitoring at global and national scales [22]. A significant step forward at the European level was achieved with the adoption of the European Directive on Soil Monitoring and Resilience (Soil Monitoring Law [1]). This directive aims to promote healthy soils across the EU by 2050 through the establishment of a harmonised framework for soil health monitoring and the introduction of a shared definition of “healthy soil”. Importantly, the directive includes both soil contamination and biodiversity among the key dimensions of soil health, and allows Member States to implement flexible, context-dependent monitoring approaches.
Within this framework, biological indicators are particularly valuable because they integrate the effects of multiple environmental pressures and provide ecologically meaningful information beyond chemical and physical descriptors alone. The directive introduces a set of selectable biological descriptors for assessing soil biodiversity and biological soil health, which may be optionally used by Member States. These include microarthropods, with particular attention to the abundance and diversity of springtails, as well as the arthropod-based Soil Biological Quality Index (QBS-ar) [23]. Earthworm abundance and diversity are also included among the proposed descriptors, whereas the earthworm-based Soil Biological Quality Index (QBS-e) [24] is not currently considered.
Although earthworms are known to be sensitive to soil management practices, including fertilization and pesticide use [25], the QBS-e index has so far been applied in only a limited number of studies, which may explain its absence from current soil monitoring frameworks. Nevertheless, the index shows considerable potential as a valuable indicator in agricultural systems, where it has been primarily applied [24], as well as in reclaimed landfill sites [26]. In contrast, the QBS-ar index has been widely used [27] and has demonstrated high sensitivity to fertilization [28,29] and pesticide use [14,30].
Both QBS indices (Qualità Biologica del Suolo, i.e., Biological Soil Quality) are based on the same functional approach, assuming that the degree of morphological adaptation of soil fauna to the soil habitat reflects soil quality [31]. An Eco-Morphological Index (EMI) is assigned to organisms according to their adaptation to soil life, with higher scores indicating greater adaptation. Both QBS-e and QBS-ar are characterized by ease of application and communication, as sampling is relatively simple, equipment is inexpensive, and results are expressed as a single integer that can be compared between sites or linked to a soil quality class. A key difference between QBS-e and QBS-ar lies in the calculation of the final index: QBS-e integrates both abundance and ecological categories, whereas QBS-ar is based on the presence of biological forms and considers only their highest EMI scores.
To date, no study has reported the simultaneous application and comparison of the QBS-ar and QBS-e indices within the same case study. Therefore, investigating how identical agricultural management practices and environmental variables influence these fauna-based soil bioindicators is of particular interest. Such an approach can provide valuable insights into the capacity of these indices to assess soil biological quality and contribute to expanding current knowledge on their applicability in specific agroecological contexts.
In the present study, for the first time both indices were applied simultaneously to assess the effects of agroecological diversification practices, particularly strip cropping. This practice involves the spatial arrangement of different crops in adjacent narrow strips, with the aim of increasing field heterogeneity and enhancing ecological processes such as habitat provision, nutrient cycling, biological interactions, and pest control [32,33,34,35]. Compared to monoculture, strip cropping systems may reduce reliance on external inputs by promoting biological pest control and improving nutrient cycling. Greater plant diversity can support natural enemies of pests and limit their spread [36,37], while the inclusion of functionally complementary species, such as legumes, can enhance biological nitrogen fixation [38]. In this study, strip cropping was compared with a conventional pure stand system (monocropping), characterized by lower spatial complexity and more homogeneous disturbance regimes. Within this framework, differences in spatial structure, management intensity, and field operations, provide an opportunity to assess how such variations influence soil biological quality and associated ecological processes.
Accordingly, the main aim of the study was to assess the responses of both QBS-ar and QBS-e indices to these contrasting systems (strip cropping vs. monocropping) and to evaluate their potential application in biomonitoring agroecosystem pressures within evolving soil monitoring frameworks. We hypothesised that strip cropping would enhance soil biological quality compared to pure stands, while also expecting that QBS-ar and QBS-e might respond differently due to their distinct ecological and methodological characteristics. To support interpretation, additional biological variables (microarthropod abundance, earthworm species richness, Acari/Collembola ratio, and proportion of adult earthworms) and soil physico-chemical parameters were analysed.
The study was conducted in a real-farm experimental context, providing a field-based evaluation of the applicability of faunal bioindicators for assessing soil biological quality and their potential role in biomonitoring environmental pressures in agroecosystems.
2. Materials and Methods
2.1. Study Areas
The experimental areas are located on two organic farms in the Marche region (Central Italy). One site is a cropland of about 2.5 ha belonging to the “Lubachi” farm located in Fratte Rosa (PU) (245 m a.s.l.) (43°37′28.68″ N, 12°53′46.13″ E). The other site covers 0.5 ha and belongs to the “Malavolta” farm in Campofilone (FM) (140 m a.s.l.) (43°3′54.46″ N, 13°48′15.42″ E). The two farms are located approximately 97 km apart. Each study area was divided into plots. The test plots (hereafter “strip stands”) are characterized by the arrangement of cash crops in 10 m wide strips and by the presence of contouring pluriannual flower strips (2.5 m wide) acting as non-productive landscape elements. Strips length differed between farms (100 m in Lubachi and 30 m in Malavolta). Control plots (hereafter “pure stands”) consist of traditional organic monocropping cultivation without these structural elements (Figure 1). Three crop types were present in each farm: wheat, beans (faba) and clover in the Lubachi farm; and wheat, beans (either faba beans or peas) and zucchini in the Malavolta farm. Due to crop rotation in Malavolta (zucchini following beans used as green manure), only wheat and beans were present at the time of sampling. The shapes of pure stands were irregular in both farms, but the area allocated to each crop in pure stands was equivalent to the total area allocated to that crop in strip stands (∼3000 m2 in Lubachi and ∼1200 m2 in Malavolta). Crop allocation within plots was as follows: in Lubachi farm, one strip cropping stand was divided into three blocks of repeated strips parallel to contour lines, along with three control pure stands per crop; in the Malavolta farm, a strip system was divided into four blocks of repeated strips perpendicular to contour line, along with two control pure stands, one for wheat and one for the beans/zucchini rotation (Figure 1).
Figure 1.
Schematic representation of the experimental layout and approximate distribution of sampling points (black crosses) in the Lubachi (a), and the Malavolta farm (b). Sampling points were distributed across strip and pure stands according to crop type and plot arrangement in each farm. Crop colours: green = clover, yellow = wheat, red = faba, blue = flower strip. Single-headed arrows indicate the slope direction. Plots dimensions were as follows: in Lubachi, the strip plot covered 1.2 ha, and each pure plot 0.4 ha; in Malavolta, the strip plot covered 0.25 ha and each pure plot 0.12 ha.
All plots were south-facing, with an average slope of 14% (±3) (Google Earth Pro, Mountain View, CA, USA). The mean annual temperature was 16 °C (±0.5), and the annual rainfall was 640 (±202 mm), with Lubachi being the wetter (Sub-Mediterranean climate) and Malavolta the driest (Mediterranean climate). Total annual precipitation (mm) and average temperature (°C) for the year 2022 were provided by the “Agenzia per l’Innovazione nel Settore Agroalimentare e della Pesca delle Marche” (AMAP) (Jesi, Italy) (Table S1). Although rainfall differed between sites, irrigation practices at Malavolta partially compensated for the lower precipitation. Information on the land use history of the experimental plots was collected. The land has historically been used for agricultural purposes, and both farms have a long-established farming tradition in the area. Furthermore, during the year preceding the start of the project, the plots on both farms were managed using the same agricultural practices. Specifically, both farms carried out ploughing to a depth of 30 cm, followed by harrowing, fertilisation, and the planting of a herbaceous crop.
2.2. Sampling Design and Collection
A structured sampling approach was adopted to distribute sampling points across management systems (strip vs. pure) and crop types within each farm, providing a balanced representation of experimental conditions at the farm level. Sampling points were spatially arranged within plots according to the strip configuration and block structure of each farm (Figure 1). Sampling was designed to achieve a comparable number of observations across management systems and crop types, while ensuring an appropriate spatial distribution of sampling points within plots to minimize edge effects and account for field layout. Each sampling point (Figure 1) represents the experimental unit for subsequent analyses.
During the first season of the project, (late April 2023), sampling was carried out at designated points in both farms (Figure 1). In the Lubachi farm, n = 18 sampling points were identified, and n = 16 in the Malavolta farm, for a total of n = 34 sampling points across both study sites. At each sampling point, two independent soil samples were collected on consecutive days, one for QBS-ar and one for QBS-e. Since beans were planted in rows, QBS-ar soil cores were taken beneath individual plants, while QBS-e samples always included at least one plant. This approach was adopted to minimize variability associated with differences in vegetation cover among crop types, thereby ensuring comparability across sampling units.
2.3. Biological Indices
Soil biological quality was assessed using two indices: QBS-ar (Soil Biological Quality index based on microarthropods) and QBS-e (Soil Biological Quality index based on earthworms).
2.3.1. QBS-ar Index (Microarthropods)
The QBS-ar index was determined following the protocol described by Parisi et al. [23] with slight modifications. According to the standard procedure, multiple soil subsamples (commonly three) are typically collected within a sampling location, generally spaced a few meters apart, to account for the heterogeneous spatial distribution of soil microarthropods. At each sampling point, soil samples were collected using a cylindrical soil corer (⌀ = 8 cm) to a depth of 10 cm point after cutting the vegetation with scissors and removing litter, with a sampling volume of 500 cm3. Three soil subsamples were collected from each pure stand in the Lubachi farm and four from each pure stand in the Malavolta farm. An equivalent number of subsamples was collected from the corresponding crop strips. The collected soil was sealed in plastic bags and transported to the laboratory (within 24 h) where microarthropods were extracted using a Berlese-Tullgren apparatus equipped with 25 W light bulbs (210 lm) and a 2 mm sieve mesh. The extraction process lasted 7 days, after which the specimens were preserved in a solution of 75% ethanol and 25% glycerol (v/v) until counting and taxonomy identification to order or class level under a stereomicroscope (Olympus SZ30, Olympus Corporation, Tokyo, Japan) at magnifications ranging 20 × and 40×. After assigning of QBS-ar values to individual subsamples and calculating final QBS-ar values for the set of 3 (in Lubachi) and 4 (in Malavolta) subsamples according to the original methodology [23], additional soil biological variables were derived, including microarthropods density (ind/m2), biological forms (BF), and the Acari/Collembola ratio (A/C) [39].
2.3.2. QBS-e Index (Earthworms)
To determine the QBS-e index, the protocol described by Paoletti et al. [25] was followed. A 30 × 30 × 20 cm soil monolith was excavated with a spade fork using a frame to define its dimensions. Once removed, the monolith was placed on a white cloth on site and hand-sorted for earthworms for approximately 15 min [24]. Three soil monoliths were collected from each pure stand in Lubachi and four from each pure stand in Malavolta. An equivalent number of monoliths was collected from the corresponding crop strips. Retrieved individuals were rinsed with water and preserved in 70% ethanol until arrival to the laboratory. They were counted and examined under a stereoscopic Olympus SZ30 microscope (Olympus Corporation, Tokyo, Japan). For QBS-e determination, both adult and juvenile individuals were classified into ecological categories (epigeic, endogeic, anecic, hydrophilic and coprophagic) based on morphological and ethological characteristics, following Paoletti et al. [25] and Fusaro et al. [24]. Then, for each soil monolith, QBS-e values were calculated based on abundance and ecological categories, and mean values were then computed for each site. Furthermore, adult earthworms (with a well-developed clitellum) were identified at species level following Christian & Zicsi [40], as well as the “Erik” [41], and “LOMBRI” [24,42] tools. Additional soil biological variables were derived, including earthworm density (ind/m2), species richness, and the percentage of adult individuals out of the total number of earthworms.
2.4. Soil Physico-Chemical Parameters and Field Variables
Soil physico-chemical parameters were considered to account for intrinsic soil differences and uneven fertilizer distribution across the plots. Soil texture and nutrient concentrations were estimated from composite samples consisting of five subsamples collected at a depth of 0–20 cm using an Edelman auger (Ejkelkamp, Giesbeek, The Netherlands). The analyses were carried out at the laboratories of Agenzia per l’Innovazione nel Settore Agroalimentare e della Pesca delle Marche” (AMAP, Jesi, Italy), according to national guidelines [43]. The following soil parameters were determined through the indicated methodologies: soil texture fractions obtained by wet sieving and sedimentation (sand, silt, and clay; g/kg); pH in H2O using a potentiometer; available limestone (g/kg) determined by reaction with ammonium oxalate followed by titration with potassium permanganate; available phosphorus (mg/kg) determined using the Olsen method; exchangeable potassium (mg/kg) measured by emission spectrophotometry after extraction with barium chloride and triethanolamine; organic matter (g/kg) estimated by oxidative combustion; total nitrogen (g/kg) determined using an elemental analyzer based on the Dumas method and the C/N ratio. To account for daily fluctuations in soil temperature and humidity, these parameters were measured in situ in triplicates at each sampling site, near the invertebrate sampling pits, at a depth of 10 cm, using portable probes: HI-98501 (Hanna Instruments, Milan, Italy) for temperature and PMS-714 (Lutron, Taipei, TW) for humidity (Table S2). Additional information on fertilization is provided in Table S2.
2.5. Statistical Analysis
All statistical analyses were performed using the R statistical software (v 4.5.3) [44,45]. The study design involved two hierarchical levels: plots (n = 10), representing the experimental units to which management treatments were applied, and subsamples collected within plots (n = 34), representing spatially distinct sampling points. Each subsample (soil core) was treated as an observational unit for statistical analyses. Biological indicators were first tested for normality using Shapiro–Wilk test and for homogeneity of variance using the Bartlett test. The QBS-e values showed a right-skewed distribution and were therefore square-root transformed to improve normality and homoscedasticity of residuals in parametric analyses.
Due to the nested structure of the data, Linear Mixed-effect Models (LMMs) computed by maximum likelihood algorithm, through the “lme” function of the “nlme” package (v 3.1-169) [46,47] were applied. To determine the most appropriate random effect structure for our analyses, Likelihood Ratio Tests (LRTs) were performed on three models including “plot”, “site”, and “plot nested within site” as random effects, “management system type” as a fixed effect, and QBS indices as response variables (Table S4). Model comparison based on Akaike’s Information Criterion (AIC) indicated that models including “plot” as the sole random effect were the most parsimonious. The relatively similar conditions in the study areas, including management practices (e.g., machinery use and crop rotations), environmental factors, soil characteristics and land use, may have reduced variability among farms. Therefore, “plot” was retained as the only random effect in all subsequent analyses. The relationship between QBS-ar and QBS-e was investigated using LMMs, by testing several regression forms and comparing them through LRTs (Table S5). The model with the lowest AIC was selected as the best-fitting model and graphically represented using the “ggplot2” package (v. 3.5.1) [48].
To investigate the combined influence of environmental predictors on QBS indices, multiple regression models were evaluated using an “all-possible-best-subsets” approach implemented in the R package “leaps” (v 3.2) [49]. Candidate models were compared based on the highest coefficient of determination (R2) and the lowest residual sum of squares (RSS) (Table S6). Preliminary variable selection was performed to reduce collinearity among explanatory variables prior to multivariate analysis. The predictive significance of the variables included in the selected models was then assessed, and variables with p-values < 0.05 were considered statistically significant (Table S7). These full models were subsequently compared with reduced models, including iterative combinations of the selected variables, using LRTs (Table S8). The final selected models, one for QBS-ar and one for QBS-e, are reported with both raw and adjusted p-values. Contrasts among levels of categorical variables were assessed using the least square means test, followed by Tukey’s Honestly Significant Difference (HSD) test, estimated with the “emmeans” package (v 2.0.3) [50], while p-values for continuous variables were adjusted with Bonferroni correction.
All soil biological indices were tested using Spearman’s rank correlation to assess the degree of association among variables and identify potential redundancy among predictors. Correlation patterns were then graphically represented using the “corrplot” package (v 0.95) [51]. In addition, excluding microarthropod BFs and earthworm density (which are intrinsic components of their respective QBS indices) the ability of the biological indices to differentiate between treatments (management system and fertilization) was evaluated using LMMs. This step supported the selection of meaningful variables for evaluating the sustainability of soil management practices. Only significant values were reported.
Lastly, to explore the joint relationships between all biological indices and the environmental variables, a Redundancy Analysis (RDA) model was constructed and graphically represented using the “vegan” package (v2.6-10) [52,53]. Model assumptions, including linearity, normality, homoscedasticity and the absence of multicollinearity were evaluated. Based on these diagnostics, biological indicators were scaled and Hellinger-transformed, and collinear predictors were removed from the analysis. To account for the nested structure of the sampling design, both response variables (biological indicators) and continuous explanatory variables (physicochemical variables) were residualized with respect to plot. The RDA was then performed on these residuals, while categorical predictors were included without prior residualization. The significance of predictors was assessed using a permutation test with 999 iterations. Unless otherwise stated, statistical significance was set as α = 0.05.
3. Results
3.1. Microarthropod Communities and QBS-ar Index
A total of 7821 microarthropods were extracted, counted, and assigned to biological forms (BF). Microarthropod densities, expressed as individuals m−2, showed wide variability across plots, ranging from approximately 20,000 to 140,000 individuals m−2 (Table 1). QBS-ar values ranged from 144 to 244 (overall average = 183), reflecting differences in soil biological quality among plots (Table 1). Taxonomically, 17 and 13 biological forms (BF) of microarthropods were recorded at the Lubachi and Malavolta sites, respectively. Pauropoda and Symphyla accounted for more than 50% of the retrieved adult microarthropods in each site, excluding mites and collembolans due to their ubiquitous dominance in soil communities (Figure 2). Myriapoda (Pauropoda, Symphyla, Diplopoda and Chilopoda) were among the most represented taxa. The relative abundance patterns of microarthropod groups were broadly consistent between the two farms, indicating a comparable community structure. However, some groups, including Araneae, Palpigradi, Opiliones and Psocoptera, were only recorded at the Lubachi site, suggesting a slightly higher taxonomic diversity at this farm (Figure 2). In addition, a relatively high A/C ratio was observed in LCS as compared to the other plots.
Table 1.
Summary of microarthropod (QBS-ar) and earthworm (QBS-e) data for each sampled plot. Microarthropod data include QBS-ar values, total number of biological forms, density (expressed as thousands of individuals m−2, K ind/m2), and Acari/Collembola ratio (A/C). Earthworm data include QBS-e values, total number of species, density (ind/m2), and percentage of adult individuals. Values are reported as means ± standard error where applicable. Plot ID codes: L = Lubachi, M = Malavolta, W = wheat, B = beans, C = clover, S = strip, P = pure.
Figure 2.
Relative abundance of earthworm species (top panels, (A,B)) and microarthropod groups (bottom panels, (C,D)) in the Lubachi (left, (A,C)) and Malavolta (right, (B,D)) farms. For microarthropods, mites and collembolans were excluded from the representation due to their dominant and ubiquitous presence in soil communities. Reported values represent the relative contribution of each taxonomic group to the total community. Logarithmic regression lines and corresponding p-values are presented to illustrate distribution patterns. Abbreviations: All. = Allolobophora, Ap. = Aporrectodea.
3.2. Earthworm Communities and QBS-e Index
A total of 184 earthworms were collected and identified, with species-level identification possible only for adult individuals bearing well-developed sexual morphological characters, representing 28.3% of the sampled population (52 individuals). Earthworm densities ranged from approximately 15 to 200 individuals m−2, as reported in Table 1, showing considerable variability among plots. QBS-e values ranged from 54 to 487 (overall average = 162), indicating a wide range of soil biological conditions across the study sites. Overall, 6 species belonging to 3 ecological categories (endogeic, hydrophilic and coprophagous) were identified (Figure 2). Species composition was largely comparable between the two sites, except for Microscolex phosphoreus, which was found only at the Malavolta site. In terms of dominance, Aporrectodea rosea was the most abundant species in Malavolta, whereas Allolobophora chlorotica dominated in Lubachi. Eisenia fetida was classified as coprophagous, and Eiseniella tetraedra as hydrophilic. The proportion of adult individuals ranged from 0% to approximately 50% across plots, indicating a high variability in population structure (Table 1). Similarly, species richness varied across plots, with up to five species recorded in some cases (Table 1).
3.3. Soil Chemical and Physical Properties
Soil pH was consistently alkaline across all plots, ranging from 7.87 to 8.06 (Table S3). Soil texture varied among plots; however, all soils were characterized by relatively high silt and clay contents, generally corresponding to fine-textured soils (Table S3). Soil chemical properties showed some heterogeneity at the plot-level. In particular, the LWP had the highest values of soil organic matter (21.0 g/kg), total nitrogen (1.4 g/kg) and exchangeable potassium (382 mg/kg). In contrast, MBP plot showed the highest available phosphorus concentration (33.7 mg/kg) and relatively high organic matter content (16.3 g/kg) (Table S3). By contrast, available phosphorus was notably lower in the Lubachi plots (4.4–5.1 mg/kg) in strip, faba pure and clover pure plots). Total and active limestone concentrations were high in all plots, reflecting the calcareous nature of the parent material (Table S3).
3.4. Relationship Between QBS-ar and QBS-e Indices
The relationship between the two QBS indices was explored using both regression models and correlation analyses. Neither linear nor curvilinear regressions identified a significant relationship between QBS-ar and QBS-e, although all tested models showed a weak negative trend (linear regression: estimate = −0.042, std. err. = 0.027, p = 0.129; Figure 3; Table S5). By contrast, correlation analyses indicated a weak inverse association between the two indices (Spearman’s rho = −0.23; Figure 4), suggesting that the relationship between QBS-ar and QBS-e may not be strictly linear and could be sensitive to sample size and model specification. However, by using a different approach, QBS indices are significantly correlated (correlation = −23%, Figure 4). As shown in Figure 3, QBS-ar values tended to be higher under strip cropping, whereas QBS-e values were generally higher in pure stands, reflecting contrasting responses of the two indices to management type. According to the LMMs, QBS-ar was significantly higher under strip cropping (estimate = 36.235, std. err. = 10.691, p = 0.0069), whereas QBS-e showed the opposite pattern, with higher values in pure stands, although this effect was weaker and not statistically significant within the mixed-effects modelling framework (estimate = −5.002, std. err. = 2.697, p = 0.093) (Table S4).
Figure 3.
Scatter plot of QBS-ar and QBS-e values for individual sampling points, differentiated by site (shade) management type (symbol shape), crop type (color). QBS-e values are square-root transformed. The dashed grey line represents the fitted logarithmic curve, and the shaded area its standard error, illustrating the overall weakly inverse trend in the data (p = 0.129).
Figure 4.
Correlation plot of the soil biological indicators considered in this study, with measurements repeated per plot. Numbers represent the correlation expressed as percentage; colors are indicative of the type of relationship (blue = positive, red = negative) while their shape is proportional to the correlation amplitude. Yellow circles indicate non-significant correlations, while significant ones for α = 0.05 are not marked.
Moreover, arthropod density (estimate = 27.52, std. err. = 14.668, p = 0.090) and earthworm species richness (estimate = −0.765, std. err. = 0.363, p = 0.061) showed moderate responses to management type, although these effects did not reach statistical significance within the LMM framework. Similarly, arthropod density and earthworm species richness showed only weak associations with QBS-ar and QBS-e, respectively (Spearman’s rho = 0.40 and 0.05; Figure 4). These patterns suggest that such variables may provide complementary and potentially non-redundant information when interpreted alongside QBS indices in the assessment of soil biological quality. The A/C ratio was significantly higher in unfertilized plots (estimate = −8.62, std. err. = 2.845, p = 0.006), particularly in clover and bean plots at the Lubachi site. Conversely, the proportion of adult earthworms was significantly associated with amended fields (estimate = 0.313, std. err. = 0.104, p = 0.006).
3.5. Effects of Management and Environmental Variables on QBS Indices
The Redundancy Analysis (RDA) (Figure 5) illustrates the relationships among the biological indices and environmental variables. The model was not significant (p = 0.417), indicating that the variables included in the model, considering the nested structure of data, are not properly explaining the observed variation in the biological response variables. QBS-e and earthworm density show moderate negative scoring on the first axis of the model, opposed to the positive scoring of earthworm species, QBS-ar and arthropod biological forms. Adult earthworms and A/C are better explained by the second RDA axis. As from the results of the permutation test, the only significant variables in the model were nitrogen (p = 0.004), potassium (p = 0.04) and humidity (p = 0.035). Management type and site showed the weakest association with the main ordination axes, being positioned close to the origin (excluded from the figure for visual clarity), as also indicated by the overlap between the ellipses representing strip and pure stand management types.
Figure 5.
RDA biplot based on scaled Hellinger-transformed data (p = 0.617; n = 34). Response variables (bioindicators) are shown in red, whereas explanatory variables (soil physico-chemical and field variables) are shown in blue. Ellipses represent management system types: cyan = strip, pink = pure. Abbreviations: Art_Dens = microarthropod density; Ew_Dens = earthworm density; Art_BF = microarthropods biological forms; Ew_Sp = earthworm species; A/C = Acari/Collembola ratio; Adu_Ew = adult earthworm percentage; Humidity = soil moisture (%); Temperature = soil temperature (°C). The biplot illustrates the main gradients of variation in the biological response variables, while the axes represent the proportion of variance explained by the explanatory variables. The percentage of constrained variance explained by the first two axes of the model is reported in the graph.
The relationship between QBS indices and the best explanatory variables was selectively assessed using LMMs and compared by LRTs (Tables S6–S8). Best candidate models were chosen using AIC. According to this criterion, the most parsimonious models for both QBS-ar and QBS-e included management type as explanatory variable, but in combination with soil humidity for QBS-ar, and with crop type and carbon in QBS-e (Table 2). Lower p-values of the QBS-ar (p = 0.002) suggest that this index may be more responsive to management-related variation than QBS-e (p = 0.03) under the tested conditions. Notably, agricultural management had positive association with QBS-ar and a negative one with QBS-e, as confirmed by the estimates. In this study, crop type had a significant effect on QBS-e, with bean plots showing lower values than clover (p = 0.037) and wheat plots (p = 0.045), according to the Tukey post-hoc test (Table 2). Humidity and carbon were selected as meaningful variables improving the fitness of the models, highlighting the importance of considering metadata along with main response indicators when assessing soil quality. However, their relevance diminished after adjusting for the sample size, underscoring the importance of adequate statistical power in complex modelling frameworks.
Table 2.
Analysis of deviance for the linear mixed-effect models (LMMs; n = 34) assessing the effect of the most significant variables on QBSs values, with ‘plot’ as random effect. Post-hoc comparisons were performed using Tukey’s HSD test and Bonferroni correction (α = 0.05). Abbreviations: denDF = denominator degrees of freedom, Std. err. = standard error. Significant values indicated with an asterisk *.
4. Discussion
4.1. Microarthropod and Earthworm Communities as Indicators of Soil Agroecosystem Functioning
Average QBS-ar values and microarthropod densities observed in the present study were slightly lower than those reported by Coletta et al. [54] for protected organic cropland in the Marche region. Similarly, QBS-e and earthworm densities were comparable to those reported in vineyards and woodlands systems of northeastern Italy [55,56]. Overall, these values indicate that the studied systems support soil faunal communities within the range reported for biologically active managed agroecosystems. From a functional perspective, the dominance of Pauropoda and Symphyla among microarthropods (excluding mites and collembolans) is consistent with assemblages associated with detritus-based trophic pathways, where these groups contribute to the fragmentation of organic matter and to early decomposition processes [57,58]. Their prevalence is therefore compatible with soils in which organic residues are available and actively processed, and may also reflect enhanced nutrient availability, as suggested for similar systems [59]. In addition, Myriapoda are strongly influenced by soil pore structure and aeration, and are commonly associated with well-developed soil porosity [60]. Their relative abundance in the present study is a hint of an active microbial– faunal interaction and organic matter turnover. On the other hand, predators such as Araneae, Opiliones and Pseudoscopiones were underrepresented, suggesting either a recently established community or a limited availability of prey species. Notably, these predators were mostly found in the Lubachi farm, which also exclusively included the relatively rare taxon Palpigradi. Only two specimens of this taxon were retrieved, one in the LBP and one in the LCS plots. Regarding the high A/C value observed in LCS, the proximity to the fertilized wheat strip and consequent harrowing a few weeks before sampling, may have contributed to the creation of a recently disturbed niche characterized by high organic matter content. This condition may have favoured disturbance-tolerant generalist taxa, such as mites.
For earthworms, the prevalence of synanthropic taxa such as Allolobophora chlorotica and Aporrectodea rosea is consistent with a disturbed agricultural context, where generalist and resilient species often dominate. At the same time, these taxa remain functionally important because they contribute to soil aggregation, bioturbation and nutrient redistribution [61]. By contrast, the absence of epigeic and anecic species indicates a relative scarcity of stable litter-rich surface habitats, likely due to recurrent disturbance and periods of exposed soil between crop phases. Functionally, this implies a reduced contribution of surface-feeding and deep-burrowing ecological groups to litter incorporation and vertical transport of organic matter [62]. The occurrence of Eisenia fetida and Eiseniella tetraedra provides additional ecological insight. The former is commonly associated with organic amendments and decomposing substrates, whereas the latter is linked to moist or periodically waterlogged conditions [62,63]. In fact, at the sites where E. tetraedra was found, soil moisture was consistently high, likely due to the proximity of water bodies, namely a water reservoir at Lubachi Farm and a small creek at Malavolta farm. Conversely, E. fetida was collected in areas likely influenced by localized organic matter inputs, particularly animal manure (Table S2). The occurrence of these species is therefore consistent with localized variations in organic matter availability and soil moisture conditions, as expected in managed agricultural fields [62,63,64]. Overall, the combined analysis of microarthropod and earthworm communities suggests that soil biological functioning in the studied agroecosystems is driven by detritus-based energy channels and modulated by management-induced variation in habitat structure, resource availability and disturbance regimes. This interpretation is consistent with the broader role of soil biodiversity in regulating ecosystem functioning [65].
4.2. Contrasting Responses of QBS-ar and QBS-e to Management Practices
The initial hypothesis that strip cropping would improve soil biological quality compared to pure stands was only partially supported. While QBS-ar values were higher under strip cropping, QBS-e showed the opposite pattern. This divergence is clearly visible in the inverse distribution of QBS values in the scatter plot (Figure 3) and correlation plot (Figure 4) and is further explicitly expressed by the LMMs results (Table 2). However, the full set of biological indicators were not unequivocally affected by management practices and soil parameters, as evidenced by the weak or absent correlation among several indicators (Figure 4) and by the homogeneous distribution of variables in the RDA ordination (Figure 5). Although the observed patterns provide useful ecological insights, the limited number of experimental units (n = 10 plots) may have reduced the statistical power to detect subtle relationships, particularly between QBS-ar and QBS-e. Accordingly, the non-significant relationship observed between the QBS indices in the linear regression (Figure 3) and RDA analysis (Figure 5) should be interpreted with caution, as the possibility of Type II errors cannot be excluded. Notably, the significant, albeit weak, correlation (Figure 4, Spearman rho = −0.23) suggests that the relationship between the two QBS indices may not be strictly linear. The variability in results across different statistical approaches further indicates that the detected relationship may be sensitive to both sample size and model specification and could become clearer with a larger dataset and the inclusion of additional relevant covariates.
A first explanation for this divergence concerns the ecological and methodological differences between the two indices. QBS-ar is based on microarthropods collected from the uppermost soil layer, where habitat heterogeneity, organic residues and microclimatic buffering are expressed more clearly. By contrast, QBS-e integrates the response of earthworms sampled down to 20 cm depth and reflects a broader combination of topsoil and subsurface conditions, including compaction, pore continuity, soil moisture dynamics and disturbance history. In this sense, QBS-ar may be more responsive to recent changes in surface habitat complexity, whereas QBS-e may be more strongly constrained by more persistent edaphic conditions [66,67,68,69]. In the case of strip cropping, diversified systems increase horizontal heterogeneity at field scale and modify the distribution of plant residues, root systems and microhabitats. These effects may favour small-bodied soil organisms, such as microarthropods. This expectation is consistent with previous studies showing that more diversified agroecological systems can enhance soil faunal quality, although responses are not always consistent across taxa and environments [38,70,71,72,73,74,75,76]. More specifically, recent evidence shows that perennial flower strips can promote earthworm populations and influence belowground community structure, although these effects remain strongly dependent on vegetation continuity, soil conditions and local management [77,78]. Likewise, in the RDA (Figure 5) QBS-ar, QBS-e, but also the other indicators are separated throughout the graph and not strictly correlated to soil properties. This pattern is consistent with recent evidence showing that earthworm responses to agricultural land use are highly heterogeneous and strongly modulated by environmental context [10], and that earthworms and microarthropods show weak or uncoupled responses to the same drivers [79].
A second explanation is that the contrasting responses may reflect different temporal scales of ecological adjustment. Microarthropods, owing to their small body size, rapid turnover and dependence on the upper soil matrix, may react quickly to newly created habitat heterogeneity. Earthworms require longer periods to respond positively to spatial diversification, especially where the benefits of strip cropping are partly offset by soil mechanical disturbance, crop-specific effects or short-term resource discontinuity. Under this interpretation, the contrasting responses of QBS-ar and QBS-e do not necessarily indicate inconsistency between the indices, but rather that they detect different components and time scales of biological response. Indeed, several studies have shown that earthworm bioturbation can have variable effects on soil microarthropods [80]. For example, decline in microarthropod abundance following earthworm addition has been documented [81,82], whereas synergistic effects during early decomposition stages have also been reported [83]. Overall, these findings support the use of QBS-ar and QBS-e as complementary, rather than interchangeable, indicators. As indicated by the LMMs (Table 2), the two indices are mainly influenced by field management and respond differently to environmental gradients.
4.3. Biological Factors Affecting the Interpretation of QBS Indices
The lower scoring of QBS-e relative to QBS-ar observed in this study (Table 1) can be partly explained by the timing of sampling, which was carried out in early spring. During this period, earthworm activity and reproduction are typically reduced compared to autumn, and smaller differences between management systems have been reported [24]. This seasonal constraint may have limited the ability of QBS-e to capture a fully representative earthworm community, particularly in terms of adult individuals and species composition. Earthworm life cycles are influenced by temperature and soil moisture conditions. For example, the hatching of A. chlorotica cocoons is inhibited at low temperatures and under dry soil conditions, while development may take several weeks even under favourable conditions [62]. As a consequence, juvenile individuals typically emerge in late spring and require several months to reach the clitellate adult stage, which is necessary for reliable species identification. These constraints are consistent with the high variability, and, in some cases, low proportion of adult individuals observed across plots (Table 1), suggesting that QBS-e values may have been influenced by seasonal population structure. In contrast, microarthropods, owing to their shorter life cycles and rapid population turnover, may provide a more immediate and representative signal of soil conditions even during early-season sampling [84].
More generally, these results indicate that the two indices differ not only in taxonomic focus but also in their temporal and ecological sensitivity. Microarthropod-based indices tend to respond more rapidly to short-term changes in topsoil conditions and resource availability [85,86], whereas QBS-e may require more suitable sampling periods to fully express their potential. From a methodological perspective, autumn sampling could increase the probability of detecting active and mature individuals and reduce bias associated with seasonal variability, thereby improving the reliability of QBS-e.
In addition to temporal factors, earthworm species richness, arthropod density and A/C varied across plots (Table 1), indicating heterogeneity in community structure that is only partially reflected by QBS values. This suggests that abundance-based or morphospecies-based indices alone may not fully capture the structural complexity of earthworm and microarthropod communities. Therefore, QBS-e may benefit from being interpreted alongside species richness, which can provide additional insight on community structure and improve the detection of management-related differences [87,88,89], while QBS-ar variants (QBS-ab, QBS-c) [90,91] and related complementary descriptors may provide deeper understanding of soil microarthropods dynamics and soil health.
4.4. Abiotic Factors Influencing QBS Index Responses
Among the explanatory variables included in the RDA (Figure 5), total nitrogen, potassium and soil humidity emerged as the most relevant soil properties affecting biological indicators. This finding is consistent with the major role of nutrient and water availability in structuring soil biological communities [58,92] and may also reflect the indirect effects of agricultural management, including fertilization and organic matter inputs (Table S3). In this context, recent trait-based evidence indicates that fertilization can differentially influence soil mesofauna, affecting functional diversity and assembly processes, particularly in collembolan communities [86]. Low humidity also demonstrated a good driver of QBS-ar in the LMM (Table 2), which is ecologically plausible given the sensitivity of soil mesofauna to microclimatic conditions and sampling period at the end of a rainy season (Table S1). Interestingly, QBS-ar appeared less strongly associated with soil nutrient concentration than QBS-e, with higher p-values in (Table S7), suggesting that microarthropod-based indices are more responsive to habitat structure and short-term environmental variability, whereas earthworm-based indices integrate a broader set of soil conditions over longer temporal scales. This interpretation is supported by recent large-scale analyses showing that earthworm communities are shaped by a combination of land cover, climatic variability and soil properties, including pH, moisture regime and bulk density [93]. Although management type was positioned close to the centre of the RDA ordination space (Figure 5), suggesting a limited contribution to the main multivariate patterns, it was identified as a significant predictor in the LMMs (Table 2). This difference reflects the complementary nature of the two approaches: while RDA highlights overall patterns of shared variation across biological indicators, LMMs assess the effect of predictors on individual response variables and can therefore detect more specific or subtle effects not captured by the ordination.
Site characteristics, such as slope, may influence the distribution of micro-, meso- and, especially macrofauna. On steeper sites, the effective habitat available for earthworms may be reduced due to shallower soil horizons and an increased risk of erosion, as the structure and stability of the soil are closely linked to earthworm activity and distribution [61,94]. Under such conditions, the sampling design should explicitly account for topographic variability. For example, sampling points could be aligned along contour lines and the number of replicates increased. Other relevant factors that may contribute to shaping soil faunal communities include differences among farms in plot dimensions and land use prior to the start of the experiment. These potentially can act as confounding effects for biological responses but we did not observe significant improvements by considering farm identity as random error.
Soil biodiversity is widely recognized as an integrative indicator of ecosystem functioning and environmental stress [58,95], and soil fauna-based indices can therefore provide valuable information on soil condition beyond what is captured by chemical measurements alone. These environmental pressures may include not only physical disturbance and nutrient inputs, but also contamination from agrochemicals such as pesticides, as well as emerging pollutants such as microplastics [96]. Such stressors are known to affect soil biodiversity and ecosystem processes, including earthworm populations and soil microarthropods [17,97]. In this context, faunal indices can act as integrative bioindicators reflecting both direct and indirect effects of environmental stressors. This interpretation is consistent with current approaches to soil monitoring and environmental assessment. The recently adopted European Soil Monitoring Law explicitly includes both soil contamination and biodiversity among the dimensions of soil health to be monitored and allows Member States to implement flexible and context-dependent approaches, including the optional use of biological indicators [1]. In line with this, the QBS-ar method has already been applied in several regional soil monitoring frameworks in Italian regions, including Emilia-Romagna [98] and Veneto [99] to assess the biological quality of agricultural soils. However, the QBS-e has not yet been implemented in routine monitoring programmes, despite its potential value as a component of future soil assessment frameworks. Notably, earthworms were included in the soil health assessment of contaminated sites [100]. Within this policy framework, soil fauna-based indices such as QBS-ar, and potentially QBS-e, may help bridge the gap between structural soil measurements and biologically meaningful indicators of environmental pressure. Overall, the results indicate that the combined use of QBS-ar and QBS-e may therefore improve the interpretation of soil monitoring data and support the development of more integrated and ecologically meaningful assessment frameworks for agroecosystems.
4.5. Scale Dependence and Methodological Considerations for QBS Application
The interpretation of soil biological indices is inherently scale-dependent, as soil fauna communities are structured by processes operating at different spatial and temporal scales. Previous studies have shown that earthworm distributions may be influenced by biological processes such as reproduction and migration at local scales, while at broader scales they are more strongly driven by climatic and soil conditions [101,102]. Similar patterns have also been reported for microarthropods, highlighting the importance of considering pedoclimatic context when analysing soil fauna communities [103]. These aspects are particularly relevant for the application of QBS indices, which aim to provide simplified yet ecologically meaningful assessments of soil biological quality. For QBS-ar, methodological guidelines are relatively well- established, including recommendations on soil moisture conditions, number of replicates and spatial distribution of sampling points [23,27,104]. In contrast, comparable standardization for QBS-e is still limited, which may affect its reproducibility and comparability across studies. At broader scales, attempts to define soil quality thresholds based on QBS-ar have been proposed for both agroecosystems and natural environments [27,31,105], while for QBS-e soil quality class ranges have been suggested for agroecosystems and semi-natural systems [25].
Our results provide a field-based assessment of soil biological responses under specific management conditions, contributing to the ongoing evaluation of QBS indices in agroecosystems. More broadly, these considerations reflect the need to balance ecological detail and operational feasibility when applying soil biological indicators. Increasing ecological resolution often requires greater sampling effort and taxonomic expertise, whereas methodological harmonization remains essential for integrating faunal indices into monitoring frameworks [106,107]. In this context, QBS indices represent a promising compromise between ecological relevance and practical applicability, particularly when used in combination with complementary biological and environmental descriptors.
4.6. Limitations of the Study
The present study was conducted within a real-farm experimental context, providing a field-based evaluation of soil biological quality indicators under realistic agroecosystem conditions. While this enhances ecological relevance, it also entails reduced experimental control compared with fully controlled experimental designs. Although the hierarchical structure of the data (subsamples nested within plots and plots nested within farms) was accounted for in the statistical analyses, some degree of site-related variability may still have influenced part of the observed responses. Indeed, although efforts were made to ensure comparability between the selected farms, including similar soil physico-chemical properties, land-use type, environmental conditions, agronomic practices applied and machinery use, the two sites differed in several structural characteristics (e.g., plot configuration, dimension and slope). These factors may have contributed to part of the observed variability in soil biological responses. Nevertheless, the consistency of the main response patterns across different statistical approaches supports the interpretation that management-related differences likely contributed to the observed trends.
Another important limitation relates to the temporal scale of the study. Biological data were collected during a single campaign in early spring 2023, corresponding to the first season of project implementation. This period may not fully capture the seasonal dynamics of soil faunal communities, particularly those of earthworms, whose activity and population structure are strongly influenced by environmental conditions. In particular, the relatively low proportion of adult individuals may have affected the robustness of QBS-e estimates in some plots and limited the taxonomic resolution of the earthworm community analysis, thereby reducing the strength of species-level ecological interpretation. For this reason, patterns related to earthworm community composition and species distribution should be interpreted with caution. Plots with zero adult individuals were nevertheless retained in the analysis, as they still provided valid QBS-e values and reflected actual field conditions during the sampling period; excluding these plots could have introduced additional bias in the assessment of soil biological quality. In addition, the agroecosystem context limited the possibility of directly comparable multi-season sampling within the same year, as several cash crops had completed their cycle by autumn and were no longer present in the field. Given the single time-point assessment, differences between strip cropping and pure stand systems may also reflect pre-existing plot conditions, thereby limiting causal attribution to management effects alone. Further multi-season and multi-year studies are needed to ensure broader temporal replication and to validate these findings. Therefore, the present conclusions should be regarded as preliminary and evaluating a wider range of agroecosystems contexts could further refine the interpretation and operational applicability of QBS-based biomonitoring approaches.
5. Conclusions
This study is the first to directly compare QBS-ar and QBS-e within the same agroecological context. It shows that the two indices respond differently to contrasting management systems and capture complementary components of soil biological quality. QBS-ar was higher under strip cropping, whereas QBS-e showed higher values in pure stands, confirming that the two indices should not be interpreted interchangeably. These contrasting responses reflect the ecological and methodological characteristics of the target faunal groups. QBS-ar exhibits more sensitivity to short-term variation in topsoil conditions, whereas QBS-e is likely influenced by a broader set of soil properties and is more influenced by the seasonal structure of earthworm populations. Their combined use therefore provides a more comprehensive assessment of soil biological responses to agricultural management and environmental pressures.
From an applied perspective, our results confirm the robustness of QBS-ar as a well-established and operational soil biological indicator, with relatively well-defined sampling criteria and interpretative thresholds. In contrast, QBS-e, more recently developed [24], represents a promising approach that would benefit from further methodological standardization. In line with the original QBS-e framework, our results highlight the importance of sampling season, field conditions (soil moisture and temperature), and sampling design, including topographic context. Further improvements in QBS-e application may derive from refining replication strategies, integrating complementary descriptors such as species richness, and strengthening the definition of interpretative thresholds, to improve comparability across studies and environmental contexts.
Supplementary Materials
The following supporting information can be downloaded at: https://www.mdpi.com/article/10.3390/environments13060316/s1, Table S1: Data were recorded from the nearest weather stations: San Lorenzo in Campo for Lubachi and Montefiore dell’Aso for Malavolta. Data for 2022 was kindly provided by the “Agenzia per l’Innovazione nel Settore Agroalimentare e della Pesca delle Marche” (AMAP) (Jesi, Italy). Table S2: The average soil humidity and temperature were measured using portable probes during samplings. Information on the application of amendments is provided. In Lubachi, Grena Biostar (SOM 41%, total N 8%) was applied at a rate of 880 kg/ha in February 2023, after wheat sowing. In Malavolta, Superstallatico Conchimer (SOM 49.5%, total N 3%) was used at a rate of 844 kg/ha in December 2022, prior to crop sowing. In addition, animal manure was occasionally added on both farms. Table S3: Soil chemical and physical properties of the studied plots, grouped by site, crop type and management system (strip vs. pure). Reported variables include soil pH, particle size distribution (sand, silt and clay; g/kg), available and total limestone (g/kg), available phosphorus (mg/kg), exchangeable potassium (mg/kg), C/N ratio, soil organic matter (g/kg) and total nitrogen (g/kg). Values represent composite samples collected at 0–20 cm depth. Table S4: Results of the Likelihood Ratio Tests (LRTs) and the corresponding AIC values used to select the random effects for downstream analyses. “Management” was chosen as a fixed effect. Selected models are reported in bold; “Plot” was retained as the random effect for all models reported in this study. Table S5: Likelihood Ratio Test (LRT) results for regression models assessing the relationship among QBS-ar and QBS-e indices. The model with the lowest AIC was selected (bold). For quadratic and 2nd order polynomial regressions, estimates, standard errors, and p-values are reported separately for each term of the model. Table S6: Candidate models identified using ‘all-possible-best-subsets’ algorithm for QBS-ar and QBS-e. Abbreviations: Preds = Number of predictors; S_ = site; F_ = fertilization; C_ = crop; M_ = management system type; Temp = soil temperature; Humi = soil humidity; R2 = coefficient of determination; RSS= residual sum of squares. Selected models are reported in bold. Table S7: Effect of individual terms in the best-fitting Linear Mixed Models (LMMs) for QBS-ar (left) and QBS-e (right), selected from Table S6. Variables retained in the final models are reported in bold. Table S8: Likelihood Ratio Test (LRT) results comparing full LMMs obtained from the ‘all-possible-best-subsets’ algorithm with reduced models derived by iterative combinations of the best predictors from Table S7 (manual backward selection). Selected models are shown in bold.
Author Contributions
M.M. (Marco Monticelli): data curation, formal analysis, investigation, methodology, validation, visualization, writing—original draft. M.C.: data curation, investigation, validation, visualization, writing—review and editing A.M.: investigation. L.S.: investigation. A.T.: investigation. M.M. (Mario Marconi): investigation. A.L.T.: conceptualization, data curation, investigation, methodology, resources, validation, visualization, supervision, funding acquisition, project administration, writing—review and editing. Microarthropod identification was primarily carried out by M.M. (Marco Monticelli) and A.M., while earthworm identification was primarily performed by M.M. (Marco Monticelli), with support from M.C., A.T. and A.L.T. for both microarthropod and earthworm identification, as well as supervision. All authors have read and agreed to the published version of the manuscript.
Funding
The OrtoBioStrip project (ID 59666) was funded by the Marche Region (Italy), Rural Development Program 2014/22- sub-measure 16.1 A.2 Funding Operational Groups, to ALT.
Institutional Review Board Statement
Ethical review and approval were not required for this study, as it involved soil invertebrates (microarthropods and earthworms), which are not subject to animal welfare regulations or institutional review board (IRB) requirements. Sampling was conducted following standard soil ecological protocols, minimizing disturbance to the environment.
Data Availability Statement
Data will be made available by the authors on request.
Acknowledgments
The authors thank the farms “I Lubachi” and Malavolta Enzo & Ivano’s farm for their collaboration and field support, and in particular Nicola and Rodolfo Rosatelli and Enzo Malavolta. We also acknowledge the contribution of project partners, including Gabriele Campanelli and Fabrizio Leteo (CREA-OF, Italy), Stefano Canali and Ileana Iocola (CREA-AA, Italy), and Luca Colombo and Marcello Maggioli (Italian Foundation for Research in Organic and Biodynamic Agriculture, Italy), for sharing data and expertise. We thank ARCA Srl Benefit (Italy), especially Valentina Piselli and the team, for project coordination and dissemination of the OrtoBioStrip project (https://www.arca.bio/en/ortobiostrip/, accessed on 25 May 2026). We sincerely thank the reviewers for their constructive comments, which contributed to improving the quality of the manuscript, particularly the statistical analyses.
Conflicts of Interest
The authors declare that they have no competing financial interests or personal relationships that could have appeared to influence the work reported in this paper.
References
- Directive (EU) 2025/2360 of the European Parliament and of the Council of 12 November 2025 on Soil Monitoring and Resilience (Soil Monitoring Law). Available online: https://eur-lex.europa.eu/eli/dir/2025/2360/oj/eng (accessed on 15 January 2026).
- Omer, E.; Szlatenyi, D.; Csenki, S.; Alrwashdeh, J.; Czako, I.; Láng, V. Farming Practice Variability and Its Implications for Soil Health in Agriculture: A Review. Agriculture 2024, 14, 2114. [Google Scholar] [CrossRef] [Scilit]
- Rashmi, I.; Roy, T.; Kartika, K.S.; Pal, R.; Coumar, V.; Kala, S.; Shinoji, K.C. Organic and Inorganic Fertilizer Contaminants in Agriculture: Impact on Soil and Water Resources. In Contaminants in Agriculture: Sources, Impacts and Management; Springer: Cham, Switzerland, 2020; pp. 3–41. [Google Scholar]
- Kalia, A.; Gosal, S.K. Effect of Pesticide Application on Soil Microorganisms. Arch. Agron. Soil Sci. 2011, 57, 569–596. [Google Scholar] [CrossRef] [Scilit]
- Mu, H.; Yang, X.; Wang, K.; Tang, D.; Xu, W.; Liu, X.; Ritsema, C.J.; Geissen, V. Ecological Risk Assessment of Pesticides on Soil Biota: An Integrated Field-Modelling Approach. Chemosphere 2023, 326, 138428. [Google Scholar] [CrossRef] [Scilit]
- Köninger, J.; Panagos, P.; Jones, A.; Briones, M.; Orgiazzi, A. In Defence of Soil Biodiversity: Towards an Inclusive Protection in the European Union. Biol. Conserv. 2022, 268, 109475. [Google Scholar] [CrossRef] [Scilit]
- Latini, A.; Giagnacovo, G.; Campiotti, C.A.; Bibbiani, C.; Mariani, S. A Narrative Review of the Facts and Perspectives on Agricultural Fertilization in Europe, with a Focus on Italy. Horticulturae 2021, 7, 158. [Google Scholar] [CrossRef] [Scilit]
- Krasilnikov, P.; Taboada, M.A.; Amanullah. Fertilizer Use, Soil Health and Agricultural Sustainability. Agriculture 2022, 12, 462. [Google Scholar] [CrossRef] [Scilit]
- Jinshan, L.; Wang, H.; Deng, Y.; Xu, M.; Liu, S.; Zhou, B.; Jangid, K.; Duan, Y. Impact of Long-Term Application of Manure and Inorganic Fertilizers on Common Soil Bacteria in Different Soil Types. Agric. Ecosyst. Environ. 2022, 337, 108044. [Google Scholar] [CrossRef] [Scilit]
- Betancur-Corredor, B.; Lang, B.; Russell, D.J. Organic Nitrogen Fertilization Benefits Selected Soil Fauna in Global Agroecosystems. Biol. Fertil. Soils 2023, 59, 1–16. [Google Scholar] [CrossRef] [Scilit]
- Varatharajan, G.R.; Calisi, A.; Kumar, S.; Bharti, D.; Ghosh, A.; Singh, S.; Kharkwal, A.C.; Coletta, M.; Dondero, F.; Terza, A.L. Heavy Metals Affect the Antioxidant Defences in the Soil Ciliate Rigidohymena Tetracirrata. J. Xenobiotics 2025, 15, 169. [Google Scholar] [CrossRef] [Scilit] [PubMed]
- Bharti, D.; Kumar, S.; Basuri, C.K.; La Terza, A. Ciliated Protist Communities in Soil: Contrasting Patterns in Natural Sites and Arable Lands across Italy. Soil Syst. 2024, 8, 64. [Google Scholar] [CrossRef] [Scilit]
- Perinelli, D.R.; Coletta, M.; Sabbatini, B.; D’Alessandro, A.; Fabiani, F.; Passacantando, A.; Bonacucina, G.; Terza, A.L. A.A.A. Good Wines WANTED: Blockchain, Non-Destructive Ultrasonic Techniques and Soil Health Assessment for Wine Traceability. Sensors 2025, 25, 3567. [Google Scholar] [CrossRef] [Scilit] [PubMed]
- D’Alessandro, A.; Coletta, M.; Torresi, A.; Dell’Ambrogio, G.; Renaud, M.; Ferrari, B.; La Terza, A. Evaluation of the Impact of Plant Protection Products (PPPs) on Non-Target Soil Organisms in the Olive Orchard: Drone (Aerial) Spraying vs. Tractor (Ground) Spraying. Sustainability 2024, 16, 11302. [Google Scholar] [CrossRef] [Scilit]
- Fiera, C.; Ulrich, W.; Popescu, D.; Buchholz, J.; Querner, P.; Bunea, C.I.; Strauss, P.; Bauer, T.; Kratschmer, S.; Winter, S.; et al. Tillage intensity and herbicide application influence surface-active springtail (Collembola) communities in Romanian vineyards. Agric. Ecosyst. Environ. 2020, 300, 107006. [Google Scholar] [CrossRef] [Scilit]
- Piola, L.; Fuchs, J.; Oneto, M.; Basack, S.; Gimenez, R.; Massaro, R.; Papa, J.; Kesten, E.; Casabé, N. Biomarkers for the Assessment of Chlorpyrifos Effects on Earthworms and on Soil Functional Parameters. Pesqui. Agropecuária Bras. 2009, 44, 874–880. [Google Scholar] [CrossRef] [Scilit]
- Pelosi, C.; Barot, S.; Capowiez, Y.; Hedde, M.; Vandenbulcke, F. Pesticides and Earthworms. A Review. Agron. Sustain. Dev. 2014, 34, 199–228. [Google Scholar] [CrossRef] [Scilit]
- Riedo, J.; Wettstein, F.; Rösch, A.; Herzog, C.; Banerjee, S.; Büchi, L.; Charles, R.; Wächter, D.; Martin-Laurent, F.; Bucheli, T.; et al. Widespread Occurrence of Pesticides in Organically Managed Agricultural Soils—The Ghost of a Conventional Agricultural Past? Environ. Sci. Technol. 2021, 55, 2919–2928. [Google Scholar] [CrossRef] [Scilit]
- Rivera-Becerril, F.; van Tuinen, D.; Chatagnier, O.; Rouard, N.; Béguet, J.; Kuszala, C.; Soulas, G.; Gianinazzi-Pearson, V.; Martin-Laurent, F. Impact of a Pesticide Cocktail (Fenhexamid, Folpel, Deltamethrin) on the Abundance of Glomeromycota in Two Agricultural Soils. Sci. Total Environ. 2016, 577, 84–93. [Google Scholar] [CrossRef] [Scilit]
- D’Alessandro, A.; Coletta, M.; Ricci, M.; Petrini, A.; Sagratini, G.; La Terza, A. From Full-Scale Composting of Organic Fraction of Municipal Solid Waste (OFMSW) with Compostable Plastic Packaging to Field Application: Effects on Wheat Growth and Rhizosphere Microbiome Structure. J. Hazard. Mater. 2026, 501, 140895. [Google Scholar] [CrossRef] [Scilit] [PubMed]
- Zeiss, R.; Eisenhauer, N.; Orgiazzi, A.; Rillig, M.; Buscot, F.; Jones, A.; Lehmann, A.; Reitz, T.; Smith, L.; Guerra, C. Challenges of and Opportunities for Protecting European Soil Biodiversity. Conserv. Biol. 2022, 36, e13930. [Google Scholar] [CrossRef] [Scilit]
- Marín, C.; Barreto, C.; Singh, B.K.; de Ruiter, P.C.; Brown, G.G.; Battigelli, J.; Bagnara, G.L.; González, R.; Guerra, C.; Sun, X.; et al. Open Letter: A Global Call to Strengthen National Soil Biodiversity Action through Coordination and Harmonization. Plants People Planet 2026, 8, 8–13. [Google Scholar] [CrossRef] [Scilit]
- Parisi, V.; Menta, C.; Gardi, C.; Jacomini, C.; Mozzanica, E. Microarthropod Communities as a Tool to Assess Soil Quality and Biodiversity: A New Approach in Italy. Agric. Ecosyst. Environ. 2005, 105, 323–333. [Google Scholar] [CrossRef] [Scilit]
- Fusaro, S.; Gavinelli, F.; Lazzarini, F.; Paoletti, M.G. Soil Biological Quality Index Based on Earthworms (QBS-e). A New Way to Use Earthworms as Bioindicators in Agroecosystems. Ecol. Indic. 2018, 93, 1276–1292. [Google Scholar] [CrossRef] [Scilit]
- Paoletti, M.G.; Sommaggio, D.; Fusaro, S. Proposta di Indice di Qualità Biologica del Suolo (QBS-e) basato sui Lombrichi e applicato agli Agroecosistemi. Biol. Ambient. 2013, 27, 25–43. [Google Scholar]
- Ashwood, F.; Barreto, C.; Butt, K.R.; Lampert, M.; Doick, K.; Vanguelova, E.I. Earthworms and Soil Mesofauna as Early Bioindicators for Landfill Restoration. Soil Res. 2022, 61, 311–328. [Google Scholar] [CrossRef] [Scilit]
- Menta, C.; Conti, F.D.; Pinto, S.; Bodini, A. Soil Biological Quality Index (QBS-Ar): 15 Years of Application at Global Scale. Ecol. Indic. 2018, 85, 773–780. [Google Scholar] [CrossRef] [Scilit]
- Menta, C.; Leoni, A.; Tarasconi, K.; Affanni, P. Does Compost Use Affect Microarthropod Soil Communities? Fresenius Environ. Bull. 2010, 19, 2303–2311. [Google Scholar]
- Tabaglio, V.; Gavazzi, C.; Menta, C. Physico-Chemical Indicators and Microarthropod Communities as Influenced by No-till, Conventional Tillage and Nitrogen Fertilisation after Four Years of Continuous Maize. Soil Tillage Res. 2009, 105, 135–142. [Google Scholar] [CrossRef] [Scilit]
- Naglič, V.; Šibanc, N.; Grebenc, T.; Bertoncelj, I. Soil Mesofauna Diversity in Agricultural Systems of Slovenia Using the QBS Index and Its Modifications. Acta Biol. Slov. 2025, 68, 104–117. [Google Scholar] [CrossRef] [Scilit]
- Parisi, V. La Qualità Biologica Del Suolo. Un Metodo Basato Sui Microartropodi. Acta Nat. L’Ateneo Parm. 2001, 37, 105–114. [Google Scholar]
- Riggi, L.G.A.; Pérès, G.; Aponte, C.; Bispo, A.; Bragato, G.; Cluzeau, D.; D’Avino, L.; Edlinger, A.; Gronchi, N.; Guegan, G.; et al. Establishing Assessment Criteria for Soil Bioindicators: Insights from Case Studies in Europe. Ecol. Indic. 2025, 178, 114063. [Google Scholar] [CrossRef] [Scilit]
- Nasri, R.; Kashani, A.; Barary, M.; Farzad, P.; Vazan, S. Nitrogen Uptake and Utilization Efficiency and the Productivity of Wheat in Double Cropping System under Different Rates of Nitrogen. Int. J. Biosci. 2014, 4, 184–193. [Google Scholar]
- Labrie, G.; Estevez, B.; Lucas, E. Impact of Large Strip Cropping System (24 and 48 Rows) on Soybean Aphid during Four Years in Organic Soybean. Agric. Ecosyst. Environ. 2016, 222, 249–257. [Google Scholar] [CrossRef] [Scilit]
- Manna, M.; Ghosh, P.; Acharya, C. Sustainable Crop Production Through Management of Soil Organic Carbon in Semiarid and Tropical India. J. Sustain. Agric. 2003, 21, 85–114. [Google Scholar] [CrossRef] [Scilit]
- Frøhling, C.; Sigsgaard, L.; Kramer Jacobsen, S. Plant Diversification Impact on the Oviposition Response of a Predatory Bug in a Laboratory Set-up. Agric. For. Entomol. 2025, 28, 128–134. [Google Scholar] [CrossRef] [Scilit]
- Juventia, S.; Rossing, W.; Ditzler, L.; Van Apeldoorn, D. Spatial and Genetic Crop Diversity Support Ecosystem Service Delivery: A Case of Yield and Biocontrol in Dutch Organic Cabbage Production. Field Crops Res. 2021, 261, 108015. [Google Scholar] [CrossRef] [Scilit]
- Liu, Y.; Wang, B.; Wang, Y.; Gao, Q.; Yao, F.; Wu, H.; Sun, X. Intercropping Outweighs Straw Incorporation Driving Community and Functional Diversity of Microarthropods after 5 Years of Tillage Practices. Agric. Ecosyst. Environ. 2025, 377, 109251. [Google Scholar] [CrossRef] [Scilit]
- Bachelier, G. La Vie Animale Dans Les Sols; Office De La Recherche Scientifique Et Technique Outre-Mer: Paris, France, 1963. [Google Scholar]
- Christian, E.; Zicsi, A. Ein synoptischer BestimmungsscWüssel der Regenwürmer Österreichs (Oligochaeta: Lumbricidae). Die Bodenkult. 1999, 50, 121–131. [Google Scholar]
- Hackenberger, D.K.; Hackenberger, D.K.; Đerđ, T.; Hackenberger, B.K. ErIK—A Software-Based Identification Key for Earthworm Species of Croatia. Zootaxa 2019, 4613, 594–595. [Google Scholar] [CrossRef] [Scilit] [PubMed]
- Paoletti, M.G.; Gradenigo, C. Lombri CD-ROM, An Easy Identification Key for Italian Earthworms; Padova University: Lapis, Padova, 1996. [Google Scholar]
- Ministro Per Le Politiche Agricole E Forestali. Decreto Ministeriale del 13/09/1999. Available online: http://www.ecochimicasas.it/web/data/uploads/files/d.m.-13_set_99-metodi-di-analisi-chimica-del-suolo.pdf (accessed on 30 June 2025).
- R Core Team. R: A Language and Environment for Statistical Computing; R Foundation for Statistical Computing: Vienna, Austria, 2025. [Google Scholar]
- Posit Team. RStudio: Integrated Development Environment for R; Posit Software, PBC: Boston, MA, USA, 2026; Available online: https://posit.co/ (accessed on 25 May 2026).
- Pinheiro, J.; Bates, D.; R Core Team. Nlme: Linear and Nonlinear Mixed Effects Models. 2026. Available online: https://cran.r-project.org/web/packages/nlme/index.html (accessed on 1 April 2026).
- Pinheiro, J.C.; Bates, D.M. Mixed-Effects Models in S and S-PLUS; Springer: New York, NY, USA, 2000. [Google Scholar]
- Wickham, H. ggplot2: Elegant Graphics for Data Analysis; Springer: New York, NY, USA, 2016. [Google Scholar]
- Miller, T.L. Based on F. Code by A. Leaps: Regression Subset Selection. 2024. Available online: https://cran.r-project.org/web/packages/leaps/leaps.pdf (accessed on 1 April 2026).
- Lenth, R.V.; Piaskowski, J. Emmeans: Estimated Marginal Means, Aka Least-Squares Means. 2026. Available online: https://cran.r-project.org/web/packages/emmeans/index.html (accessed on 1 April 2026).
- Wei, T.; Simko, V. R Package “Corrplot”: Visualization of a Correlation Matrix. 2024. Available online: https://cran.r-project.org/web/packages/corrplot/index.html (accessed on 1 April 2026).
- Leps, J.; Smilauer, P. Multivariate Analysis of Ecological Data Using CANOCO; Cambridge University Press: Cambridge, UK, 2003. [Google Scholar]
- Oksanen, J.; Simpson, G.L.; Blanchet, F.G.; Kindt, R.; Legendre, P.; Minchin, P.R.; O’Hara, R.B.; Solymos, P.; Stevens, M.H.H.; Szoecs, E.; et al. Vegan: Community Ecology Package. 2025. Available online: https://mirror.ibcp.fr/pub/CRAN/web/packages/vegan/vegan.pdf (accessed on 1 April 2026).
- Coletta, M.; Monticelli, M.; D’Alessandro, A.; Gentili, C.; Torresi, A.; Waris, N.; La Terza, A. Managing Soil to Support Soil Biodiversity in Protected Areas Agroecosystems: A Comparison between Arable Lands, Olive Groves, and Vineyards in the Conero Park (Italy). Environ. Monit. Assess. 2025, 197, 200. [Google Scholar] [CrossRef] [Scilit] [PubMed]
- Gavinelli, F.; Barcaro, T.; Csuzdi, C.; Blakemore, R.J.; Marchan, D.F.; De Sosa, I.; Dorigo, L.; Lazzarini, F.; Nicolussi, G.; Dreon, A.L.; et al. Importance of Large, Deep-Burrowing and Anecic Earthworms in Forested and Cultivated Areas (Vineyards) of Northeastern Italy. Appl. Soil Ecol. 2018, 123, 751–774. [Google Scholar] [CrossRef] [Scilit]
- Rüdisser, J.; Tasser, E.; Peham, T.; Meyer, E.; Tappeiner, U. Hidden Engineers and Service Providers: Earthworms in Agricultural Land-Use Types of South Tyrol, Italy. Sustainability 2020, 13, 312. [Google Scholar] [CrossRef] [Scilit]
- Coleman, D.; Callaham, M.A., Jr.; Crossley, D.A., Jr. Fundamentals of Soil Ecology, 3rd ed.; Academic Press: Cambridge, MA, USA, 2017. [Google Scholar]
- Bardgett, R.D.; van der Putten, W.H. Belowground Biodiversity and Ecosystem Functioning. Nature 2014, 515, 505–511. [Google Scholar] [CrossRef] [Scilit]
- Ochoa-Hueso, R.; Rocha, I.; Stevens, C.J.; Manrique, E.; Luciañez, M.J. Simulated Nitrogen Deposition Affects Soil Fauna from a Semiarid Mediterranean Ecosystem in Central Spain. Biol. Fertil. Soils 2014, 50, 191–196. [Google Scholar] [CrossRef] [Scilit]
- Gonçalves, F.; Carlos, C.; Crespo, L.; Zina, V.; Oliveira, A.; Salvação, J.; Pereira, J.A.; Torres, L. Soil Arthropods in the Douro Demarcated Region Vineyards: General Characteristics and Ecosystem Services Provided. Sustainability 2021, 13, 7837. [Google Scholar] [CrossRef] [Scilit]
- Edwards, C.A.; Arancon, N.Q. Biology and Ecology of Earthworms; Springer: New York, NY, USA, 2022. [Google Scholar]
- Sims, R.W.; Gerard, B.M. Earthworms: Keys and Notes for the Identification of the Species; Backhuys Publishers: Kerkwerve, The Netherlands, 1985. [Google Scholar]
- Gunadi, B.; Blount, C.; Edwards, C.A. The Growth and Fecundity of Eisenia fetida (Savigny) in Cattle Solids Pre-Composted for Different Periods. Pedobiologia 2002, 46, 15–23. [Google Scholar] [CrossRef] [Scilit]
- Omodeo, P.; Rota, E. Earthworms of Turkey. II.∗. Boll. Zool. 1991, 58, 171–181. [Google Scholar] [CrossRef] [Scilit]
- Eisenhauer, N.; Sünnemann, M.; Pollierer, M.M.; Sun, X.; Bardgett, R.D.; Bartkowski, B.; Delgado-Baquerizo, M.; Dirilgen, T.; Guerra, C.A.; Mathieu, J.; et al. Soil Biodiversity Effects on Ecosystems. Nat. Rev. Biodivers. 2026, 2, 76–91. [Google Scholar] [CrossRef] [Scilit]
- Rossi, J.-P. The Spatiotemporal Pattern of a Tropical Earthworm Species Assemblage and Its Relationship with Soil Structure. Pedobiologia 2003, 47, 497–503. [Google Scholar] [CrossRef] [Scilit]
- Meurer, K.; Barron, J.; Chenu, C.; Coucheney, E.; Fielding, M.; Hallett, P.; Herrmann, A.M.; Keller, T.; Koestel, J.; Larsbo, M.; et al. A Framework for Modelling Soil Structure Dynamics Induced by Biological Activity. Glob. Change Biol. 2020, 26, 5382–5403. [Google Scholar] [CrossRef] [Scilit] [PubMed]
- Capowiez, Y.; Gilbert, F.; Vallat, A.; Poggiale, J.-C.; Bonzom, J.-M. Depth Distribution of Soil Organic Matter and Burrowing Activity of Earthworms—Mesocosm Study Using X-Ray Tomography and Luminophores. Biol. Fertil. Soils 2021, 57, 337–346. [Google Scholar] [CrossRef] [Scilit]
- Aldaco-Gómez, D.; Cadena-Zapata, M.; Zermeño-González, A.; López-López, J.A.; Cerna-Chávez, E. Efecto de sistemas de labranza en la población de lombrices de tierra en maíz forrajero. Ecosist. Recur. Agropec. 2023, 10, e3544. [Google Scholar] [CrossRef] [Scilit]
- Lagerlöf, J.; Goffre, B.; Vincent, C. The Importance of Field Boundaries for Earthworms (Lumbricidae) in the Swedish Agricultural Landscape. Agric. Ecosyst. Environ. 2002, 89, 91–103. [Google Scholar] [CrossRef] [Scilit]
- Crittenden, S.J.; Huerta, E.; De Goede, R.G.M.; Pulleman, M.M. Earthworm Assemblages as Affected by Field Margin Strips and Tillage Intensity: An on-Farm Approach. Eur. J. Soil Biol. 2015, 66, 49–56. [Google Scholar] [CrossRef] [Scilit]
- D’Hervilly, C.; Marsden, C.; Capowiez, Y.; Béral, C.; Delapré-Cosset, L.; Bertrand, I. Trees and Herbaceous Vegetation Strips Both Contribute to Changes in Soil Fertility and Soil Organism Communities in an Agroforestry System. Plant Soil 2021, 463, 537–553. [Google Scholar] [CrossRef] [Scilit]
- Pelosi, C.; Bertrand, M.; Gardarin, A. Wildflower Strips of 2.5-Year-Old Promote Earthworms and Enchytraeids (Annelida, Oligochaeta) in Arable Fields. Eur. J. Soil Biol. 2024, 122, 103644. [Google Scholar] [CrossRef] [Scilit]
- Pardon, P.; Mertens, J.; Reubens, B.; Reheul, D.; Coussement, T.; Elsen, A.; Nelissen, V.; Verheyen, K. Juglans regia (Walnut) in Temperate Arable Agroforestry Systems: Effects on Soil Characteristics, Arthropod Diversity and Crop Yield. Renew. Agric. Food Syst. 2020, 35, 533–549. [Google Scholar] [CrossRef] [Scilit]
- Elmquist, D.C.; Kahl, K.B.; Johnson-Maynard, J.L.; Eigenbrode, S.D. Linking Agricultural Diversification Practices, Soil Arthropod Communities and Soil Health. J. Appl. Ecol. 2023, 60, 1952–1963. [Google Scholar] [CrossRef] [Scilit]
- Mamabolo, E.; Pryke, J.S.; Gaigher, R. Soil Fauna Diversity Is Enhanced by Vegetation Complexity and No-till Planting in Regenerative Agroecosystems. Agric. Ecosyst. Environ. 2024, 367, 108973. [Google Scholar] [CrossRef] [Scilit]
- Bednar, Z.; Vaupel, A.; Blümel, S.; Herwig, N.; Hommel, B.; Haberlah-Korr, V.; Beule, L. Earthworm and Soil Microbial Communities in Flower Strip Mixtures. Plant Soil 2023, 492, 209–227. [Google Scholar] [CrossRef] [Scilit]
- Vaupel, A.; Bednar, Z.; Herwig, N.; Hommel, B.; Moran-Rodas, V.E.; Beule, L. Tree-Distance and Tree-Species Effects on Soil Biota in a Temperate Agroforestry System. Plant Soil 2023, 487, 355–372. [Google Scholar] [CrossRef] [Scilit]
- Mittmannsgruber, M.; Monoshyn, D.; Slawiczek, C.; Taheri, K.A.; Wollenweber, F.; Meißner, B.; Pascher, K.; Gruber, E.; Wiedenegger, E.; Inselsbacher, E.; et al. Earthworm and Soil Microarthropod Abundances Affected by Agricultural Land Use and Soil Properties. Pedobiologia 2025, 112, 151073. [Google Scholar] [CrossRef] [Scilit]
- Ferlian, O.; Eisenhauer, N.; Aguirrebengoa, M.; Camara, M.; Ramirez-Rojas, I.; Santos, F.; Tanalgo, K.; Thakur, M.P. Invasive Earthworms Erode Soil Biodiversity: A Meta-Analysis. J. Anim. Ecol. 2018, 87, 162–172. [Google Scholar] [CrossRef] [Scilit]
- McLean, M.A.; Parkinson, D. Impacts of the Epigeic Earthworm Dendrobaena Octaedra on Oribatid Mite Community Diversity and Microarthropod Abundances in Pine Forest Floor: A Mesocosm Study. Appl. Soil Ecol. 1998, 7, 125–136. [Google Scholar] [CrossRef] [Scilit]
- Cameron, E.K.; Knysh, K.M.; Proctor, H.C.; Bayne, E.M. Influence of Two Exotic Earthworm Species with Different Foraging Strategies on Abundance and Composition of Boreal Microarthropods. Soil Biol. Biochem. 2013, 57, 334–340. [Google Scholar] [CrossRef] [Scilit]
- Monroy, F.; Aira, M.; Domínguez, J. Epigeic Earthworms Increase Soil Arthropod Populations during First Steps of Decomposition of Organic Matter. Pedobiologia 2011, 54, 93–99. [Google Scholar] [CrossRef] [Scilit]
- Lu, J.-Z.; Pfingstl, T.; Junker, R.R.; Maraun, M.; Erktan, A.; Scheu, S. Life History Traits in Microarthropods: Evidence for a Soil Animal Economics Spectrum. Geoderma 2025, 455, 117206. [Google Scholar] [CrossRef] [Scilit]
- Joimel, S.; Schwartz, C.; Bonfanti, J.; Hedde, M.; Krogh, P.H.; Pérès, G.; Pernin, C.; Rakoto, A.; Salmon, S.; Santorufo, L.; et al. Functional and Taxonomic Diversity of Collembola as Complementary Tools to Assess Land Use Effects on Soils Biodiversity. Front. Ecol. Evol. 2021, 9, 630919. [Google Scholar] [CrossRef] [Scilit]
- Baulechner, D.; John, K.; Zaitsev, A.; Saifutdinov, R.; Wolters, V. The Impact of Grazing and Fertilization Intensity on Functional Trait Diversity and Assembly Processes of Soil Mesofauna in Grasslands. Geoderma 2026, 467, 117715. [Google Scholar] [CrossRef] [Scilit]
- Hoeffner, K.; Beylich, A.; Chabbi, A.; Cluzeau, D.; Dascalu, D.; Graefe, U.; Guzmán, G.; Hallaire, V.; Hanisch, J.; Landa, B.B.; et al. Legacy Effects of Temporary Grassland in Annual Crop Rotation on Soil Ecosystem Services. Sci. Total Environ. 2021, 780, 146140. [Google Scholar] [CrossRef] [Scilit]
- Förster, A.; David, C.; Dumont, B.; Dimitrova Mårtensson, L.-M.; Rasche, F.; Emmerling, C. Earthworm Populations and Diversity under Annual and Perennial Wheat in a North to South Gradient in Western Europe. Eur. J. Soil Biol. 2023, 119, 103561. [Google Scholar] [CrossRef] [Scilit]
- Bartz, M.L.C.; Dudas, R.T.; Demetrio, W.C.; Brown, G.G. Earthworms as Soil Health Indicators in No-Tillage Agroecosystems. Eur. J. Soil Biol. 2024, 121, 103605. [Google Scholar] [CrossRef] [Scilit]
- Mantoni, C.; Pellegrini, M.; Dapporto, L.; Del Gallo, M.M.; Pace, L.; Silveri, D.; Fattorini, S. Comparison of Soil Biology Quality in Organically and Conventionally Managed Agro-Ecosystems Using Microarthropods. Agriculture 2021, 11, 1022. [Google Scholar] [CrossRef] [Scilit]
- Parisi, V.; Menta, C. Microarthropods of the Soil: Convergence Phenomena and Evaluation of Soil Quality Using QBS-Ar and QBS-C. Fresenius Environ. Bull. 2008, 17, 1170–1174. [Google Scholar]
- Lavelle, P.; Decaëns, T.; Aubert, M.; Barot, S.; Blouin, M.; Bureau, F.; Margerie, P.; Mora, P.; Rossi, J.-P. Soil Invertebrates and Ecosystem Services. Eur. J. Soil Biol. 2006, 42, S3–S15. [Google Scholar] [CrossRef] [Scilit]
- Sara, S.; Wilfried, T.; Esther, G.; Thibaud, D.; Sylvain, G.; Daniel, F.M.; Claire, M.; Yvan, C.; Mickaël, H. Digging Deeper: Deep Joint Species Distribution Modeling Reveals Environmental Drivers of Earthworm Communities. Soil Biol. Biochem. 2026, 212, 110021. [Google Scholar] [CrossRef] [Scilit]
- Orgiazzi, A.; Panagos, P. Soil Biodiversity and Soil Erosion: It Is Time to Get Married. Glob. Ecol. Biogeogr. 2018, 27, 1155–1167. [Google Scholar] [CrossRef] [Scilit]
- Wall, D.H.; Nielsen, U.N.; Six, J. Soil Biodiversity and Human Health. Nature 2015, 528, 69–76. [Google Scholar] [CrossRef] [Scilit]
- Sharma, T.; Kour, S.; Sharma, V.; Arya, V.; Thakur, N. Microplastics as Emerging Contaminants: Unraveling Their Impact on Soil Health. Commun. Soil Sci. Plant Anal. 2025, 56, 3212–3227. [Google Scholar] [CrossRef] [Scilit]
- Rillig, M.C.; Lehmann, A.; Lehmann, J.; Camenzind, T.; Rauh, C. Soil Biodiversity Effects from Field to Fork. Trends Plant Sci. 2018, 23, 17–24. [Google Scholar] [CrossRef] [Scilit]
- Staffilani, F.; Menta, C.; Conti, D.F.D.; Fondon, C.L.; Scappini, S. Qualità Biologica Dei Suoli Emiliano-Romagnoli; Rapporti tecnici del servizio geologico sismico e dei suoli; University of Parma: Parma, Italy, 2018. [Google Scholar]
- Pocaterra, F.; Ragazzi, F. Monitoring Soil Biological Quality in the Veneto Region; FAO: Roma, Italy, 2020. [Google Scholar]
- European Commission, Joint Research Centre, Institute for Environment and Sustainability. Progetto di Monitoraggio Ambientale su tutto il Territorio della Regione Lombardia (Progetto Soil): Indagine Conoscitiva della Qualità e dello Stato di Salute dei Suoli Lombardi; Publications Office of the European Union: Luxembourg, 2015. [Google Scholar]
- Hodson, M.E.; Corstanjeb, R.; Jones, D.T.; Witton, J.; Burton, V.J.; Sloan, T.; Eggleton, P. Earthworm Distributions Are Not Driven by Measurable Soil Properties. Do They Really Indicate Soil Quality? PLoS ONE 2021, 16, e0241945. [Google Scholar] [CrossRef] [Scilit]
- Nuutinen, V.; Briones, M.J.I.; Schrader, S.; Dekemati, I.; Grujić, N.; Hyvönen, J.; Ivask, M.; Lassen, S.B.; Lloret, E.; Ollio, I.; et al. Wheat Field Earthworms under Divergent Farming Systems across a European Climate Gradient. Ecol. Appl. 2025, 35, e3066. [Google Scholar] [CrossRef] [Scilit]
- Gallese, F.; Gismero-Rodriguez, L.; Govednik, A.; Giagnoni, L.; Lumini, E.; Suhadolc, M.; Vaccari, F.P.; Maienza, A. Soil Microarthropods as Tools for Monitoring Soil Quality: The QBS-Ar Index in Three European Agroecosystems. Agriculture 2025, 15, 89. [Google Scholar] [CrossRef] [Scilit]
- D’Avino, L.; Gambelli, M.A.; Bigiotti, G.; Vitali, F.; Tondini, E.; L’Abate, G.; Jacomini, C.; Cassi, F.; Menta, C.; QBS-ar SISS working group. QBS-Ar and QBS-ar_BF Index Toolbox for Biodiversity Assessment of Microarthropods Community in Soil; Zenodo: Geneva, Switzerland, 2024. [Google Scholar] [CrossRef]
- Menta, C.; Leoni, A.; Gardi, C.; Conti, F.D. Are Grasslands Important Habitats for Soil Microarthropod Conservation? Biodivers. Conserv. 2011, 20, 1073–1087. [Google Scholar] [CrossRef] [Scilit]
- Rutgers, M.; Orgiazzi, A.; Gardi, C.; Römbke, J.; Jänsch, S.; Keith, A.M.; Neilson, R.; Boag, B.; Schmidt, O.; Murchie, A.K.; et al. Mapping Earthworm Communities in Europe. Appl. Soil Ecol. 2016, 97, 98–111. [Google Scholar] [CrossRef] [Scilit]
- Guerra, C.A.; Bardgett, R.D.; Caon, L.; Crowther, T.W.; Delgado-Baquerizo, M.; Montanarella, L.; Navarro, L.M.; Orgiazzi, A.; Singh, B.K.; Tedersoo, L.; et al. Tracking, Targeting, and Conserving Soil Biodiversity. Science 2021, 371, 239–241. [Google Scholar] [CrossRef] [Scilit]
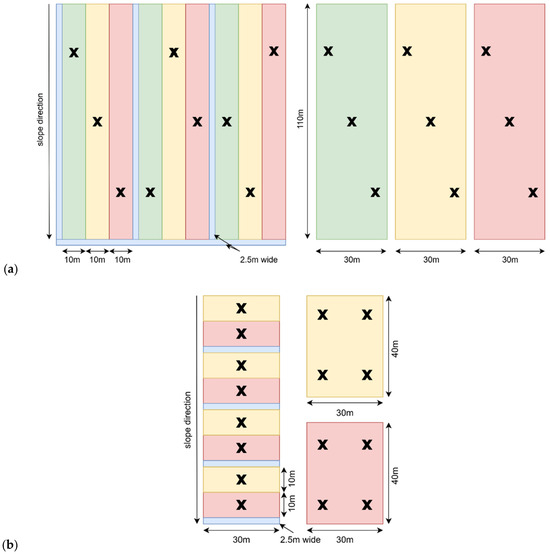
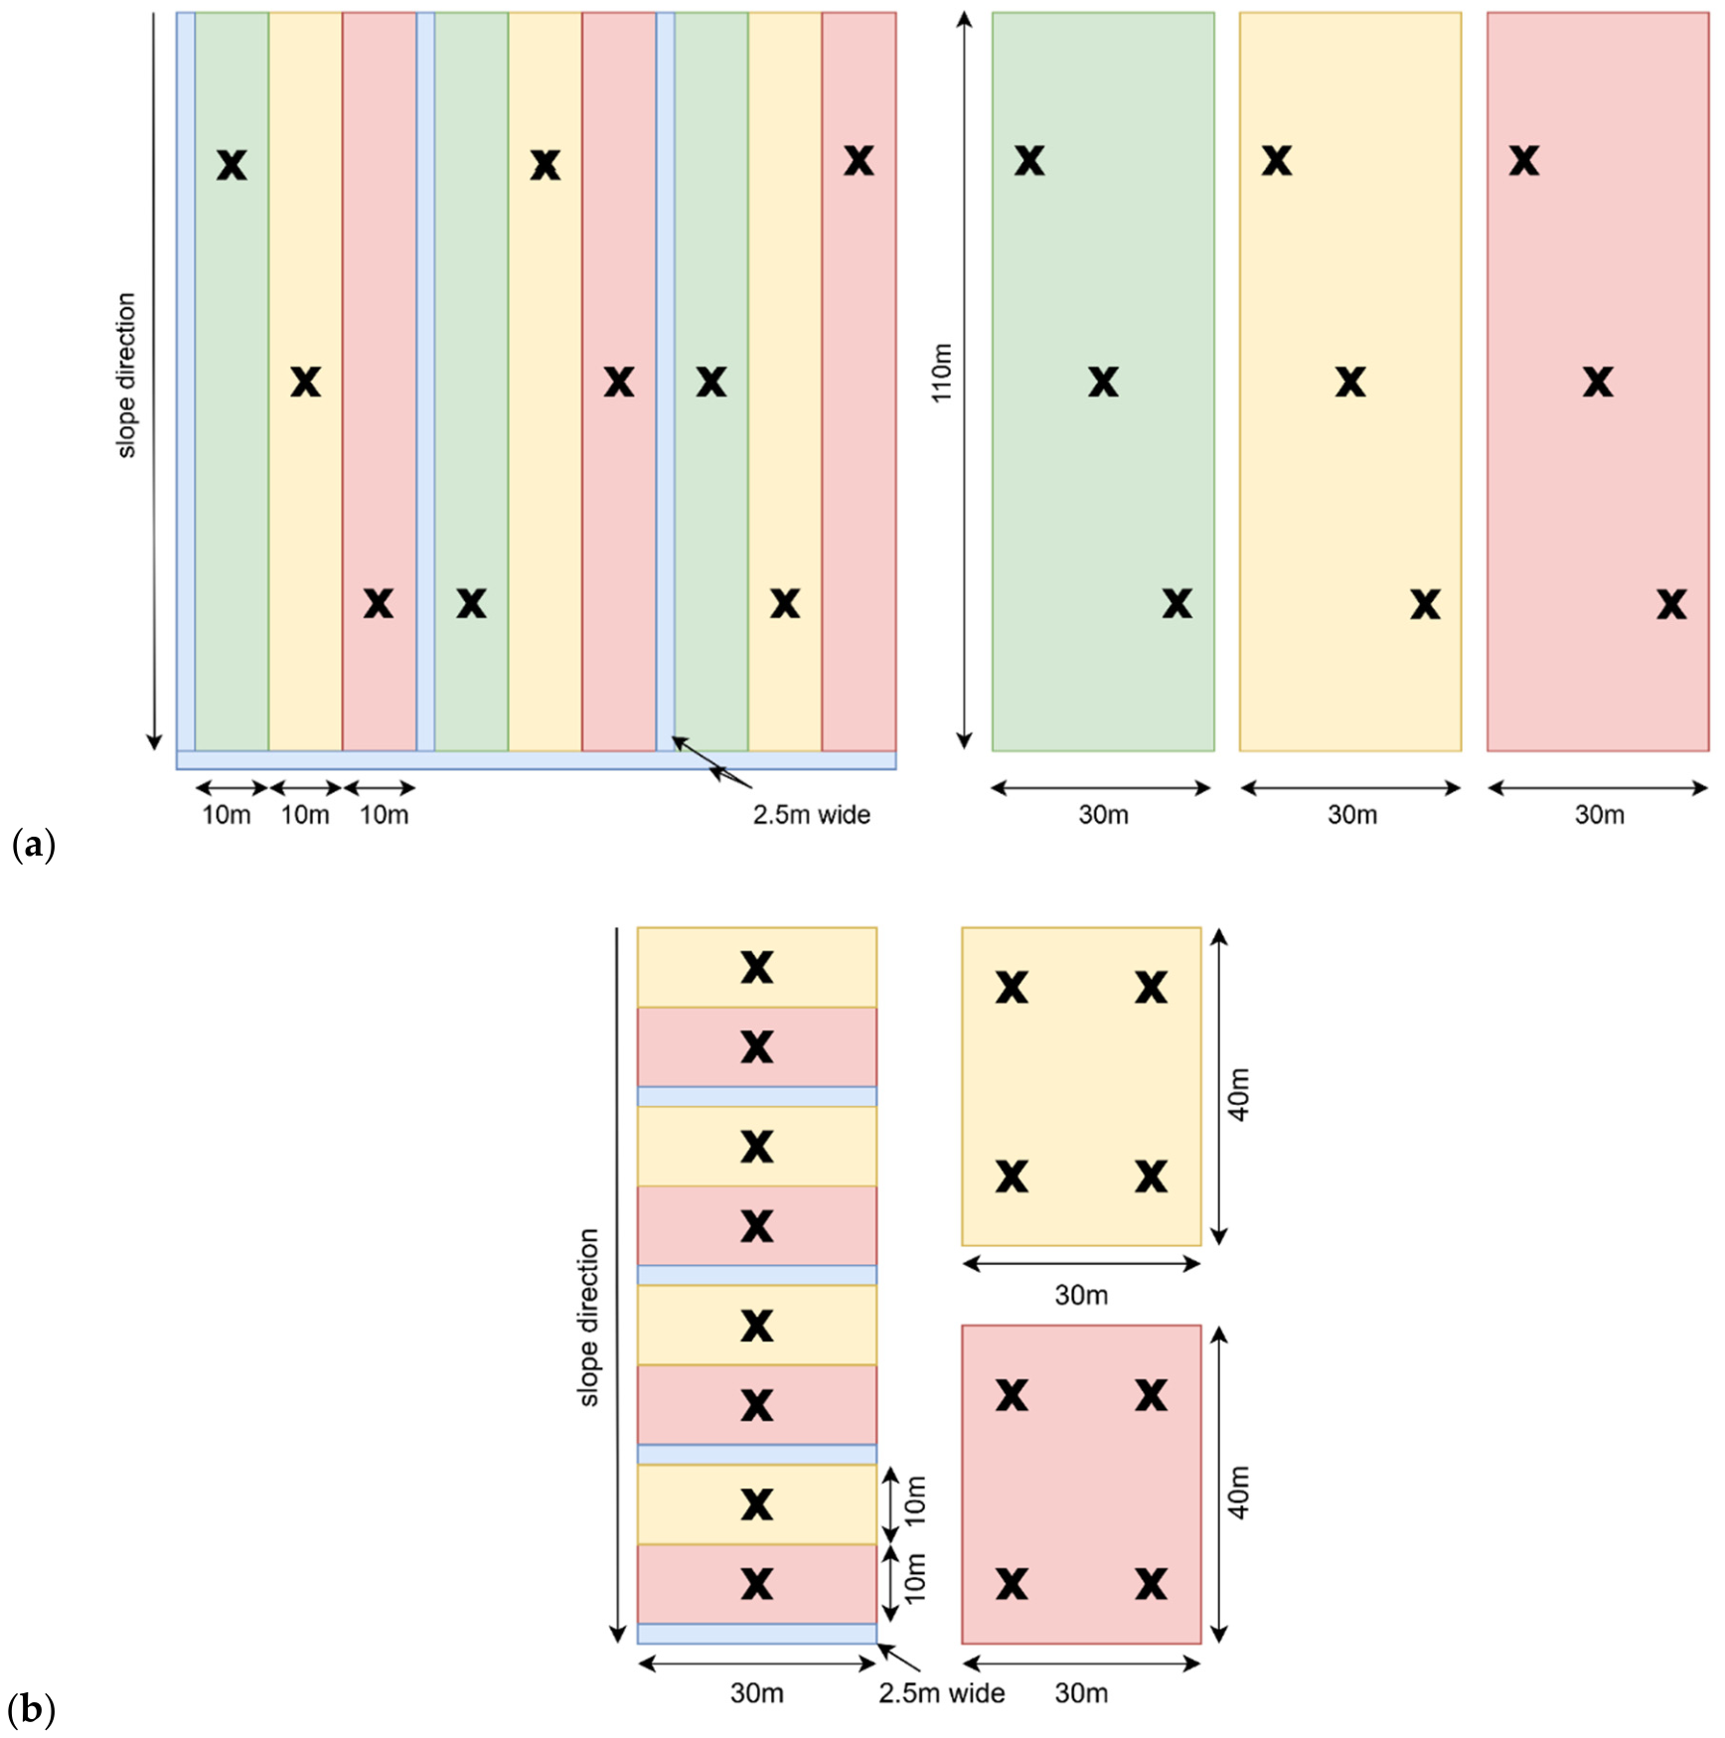
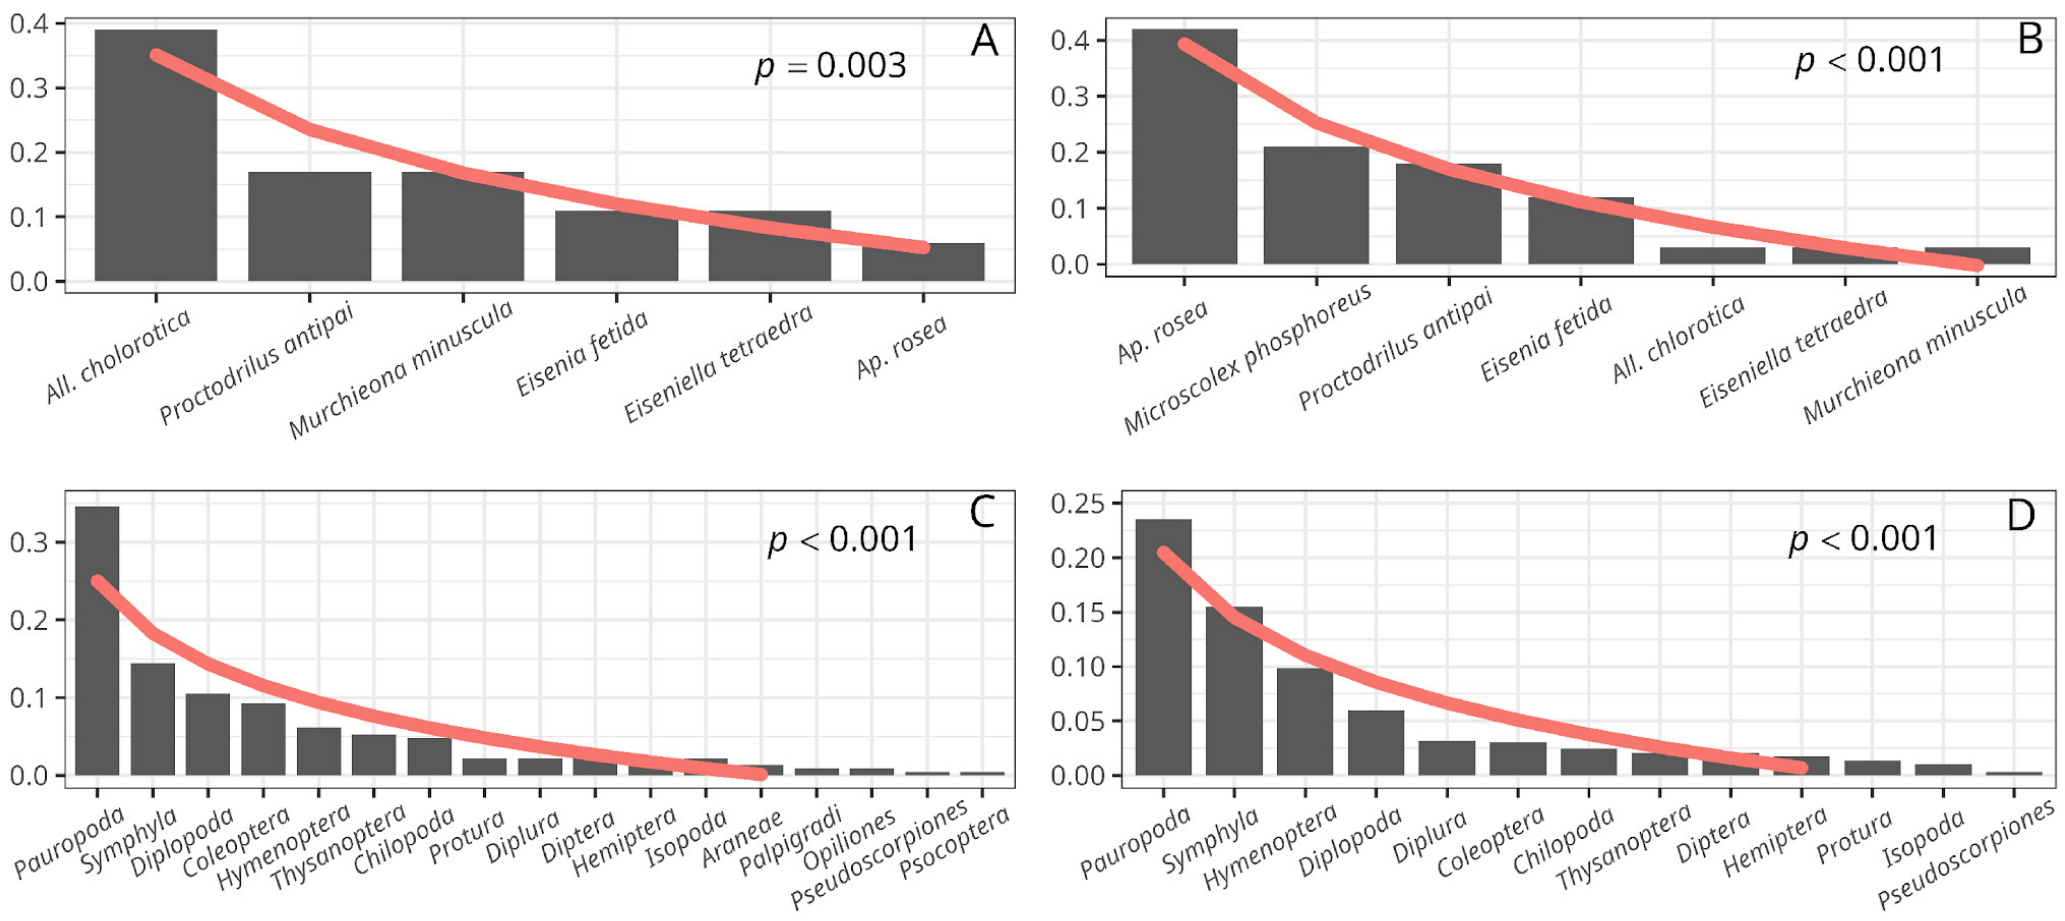
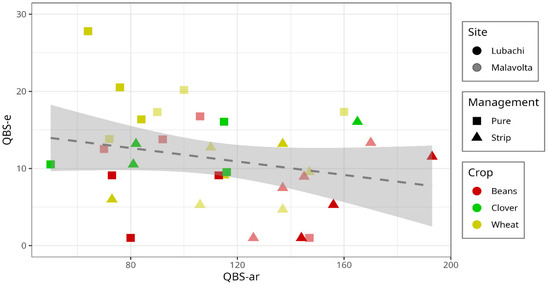
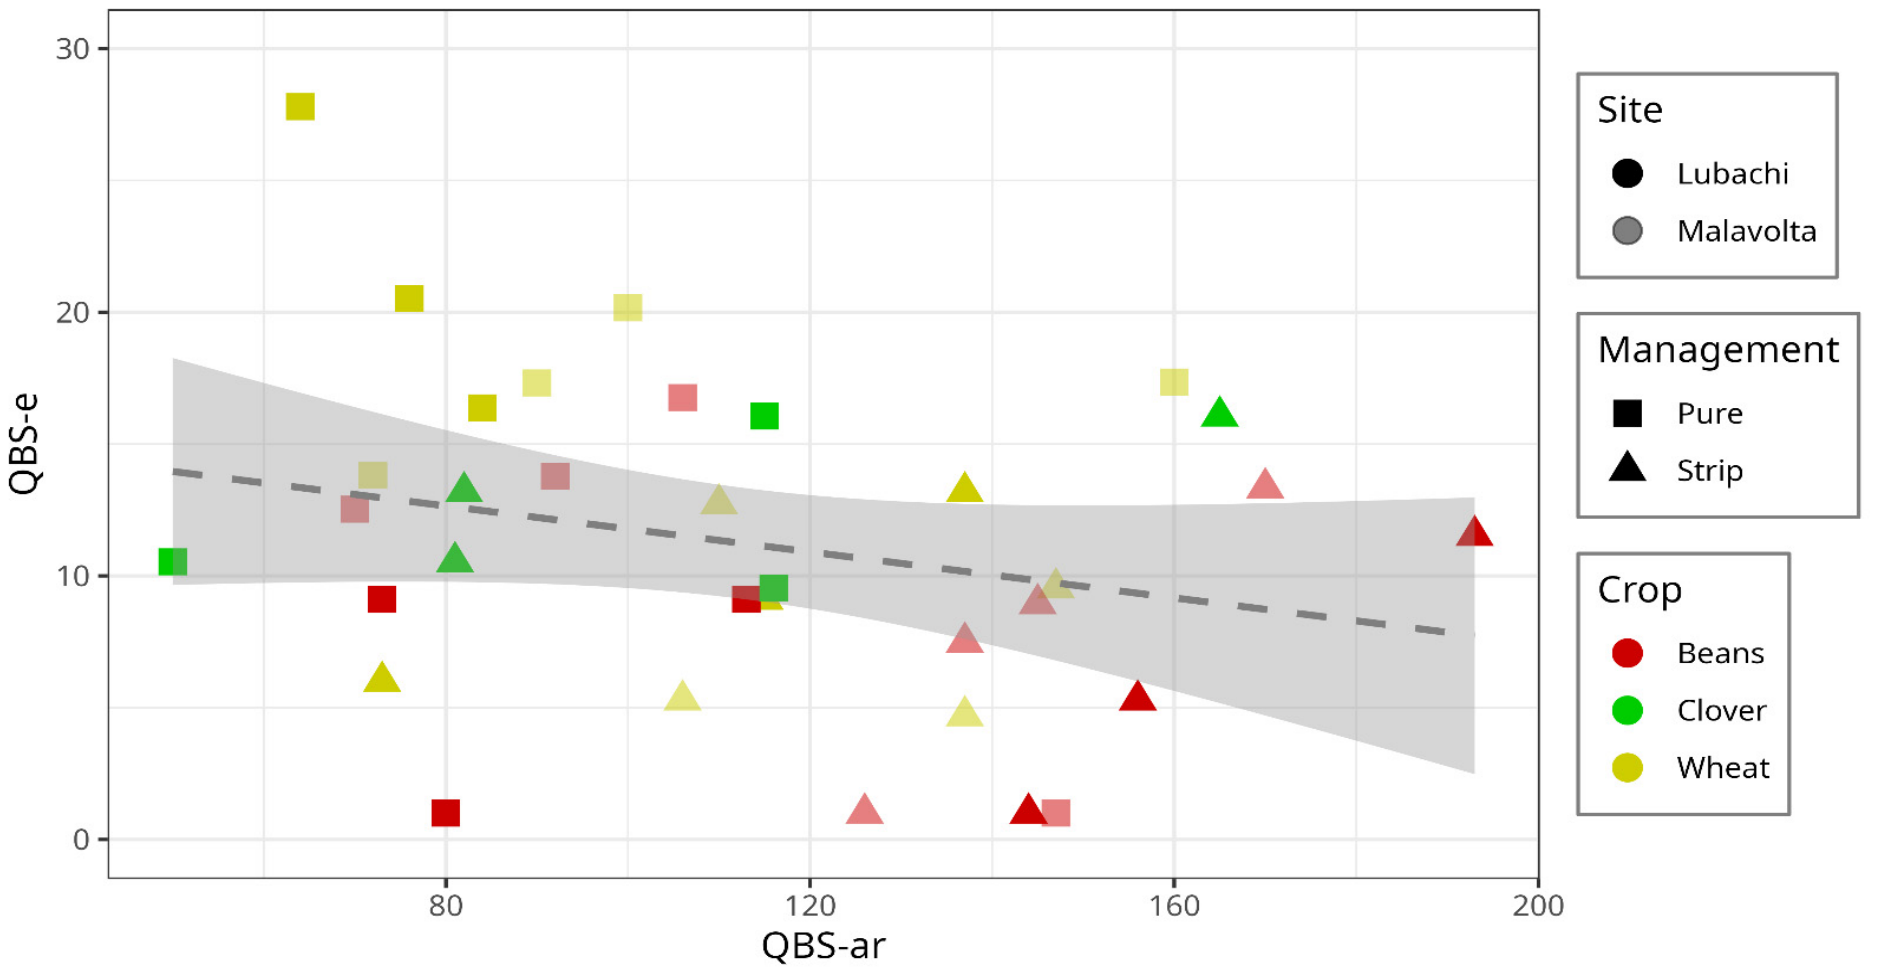
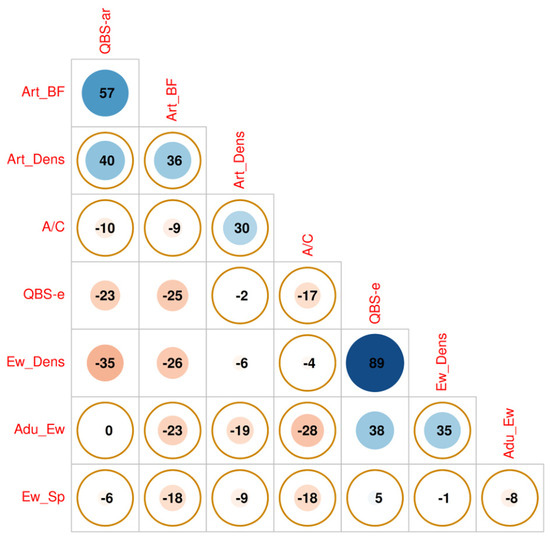
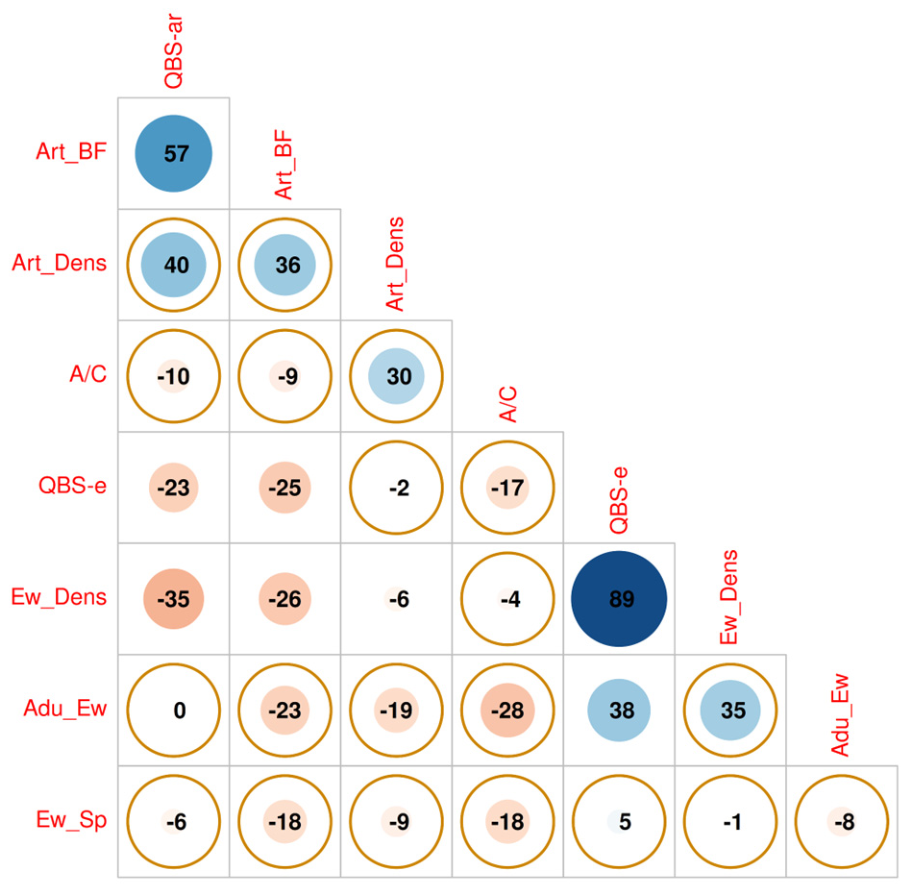
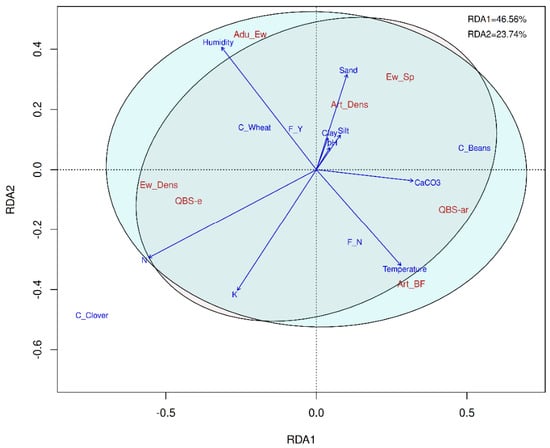
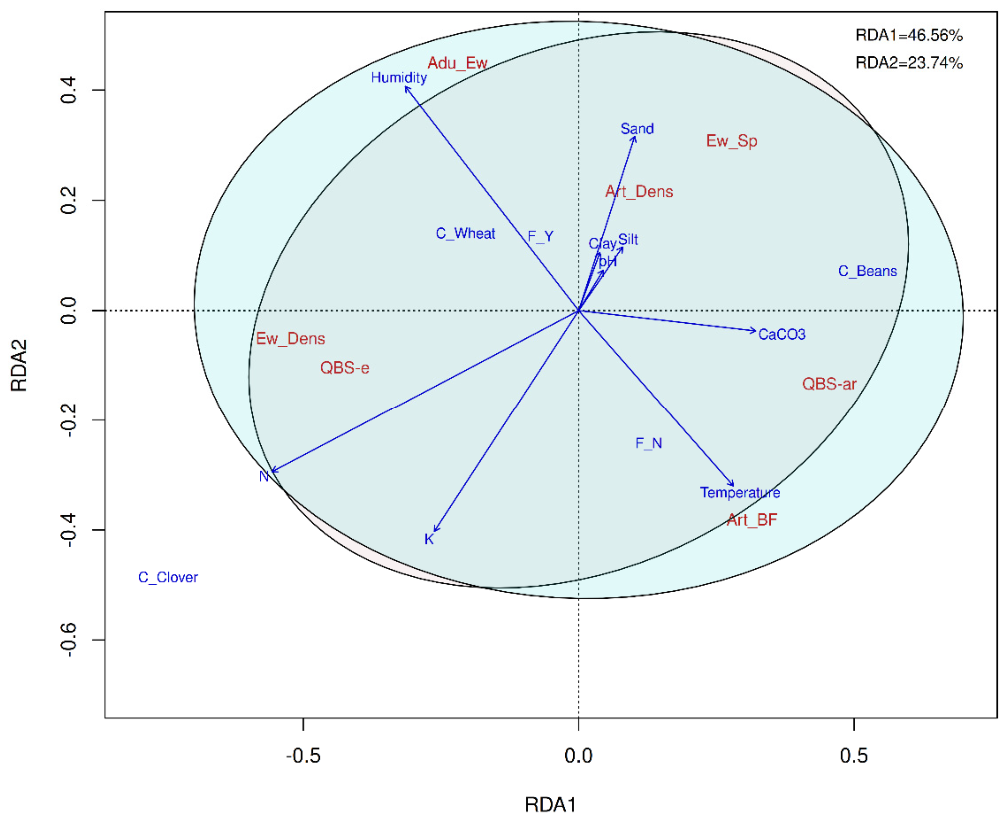

Disclaimer/Publisher’s Note: The statements, opinions and data contained in all publications are solely those of the individual author(s) and contributor(s) and not of MDPI and/or the editor(s). MDPI and/or the editor(s) disclaim responsibility for any injury to people or property resulting from any ideas, methods, instructions or products referred to in the content. |
© 2026 by the authors. Licensee MDPI, Basel, Switzerland. This article is an open access article distributed under the terms and conditions of the Creative Commons Attribution (CC BY) license.