


Abstract
Background: Human lead exposure is a multi-pathway phenomenon that integrates internal biological burden with persistent residential environmental reservoirs. Although individual lead metrics have been linked to cardiometabolic dysfunction, current research often fails to capture the ‘exposome’ reality of joint, nonlinear, and interaction-dependent effects on metabolic outcomes like BMI. Objectives: To evaluate associations between biological (blood and urinary) and residential dust (window and floor) lead measures and BMI, and to characterize nonlinear and interaction-dependent mixture effects using Bayesian Kernel Machine Regression (BKMR). Methods: We analyzed data from NHANES 2001–2002, a nationally representative survey of the U.S. noninstitutionalized civilian population. Window and floor dust lead (µg/ft2) were obtained from the NHANES household dust component, and blood lead (µg/dL) and urinary lead (µg/L) were measured using standardized NHANES laboratory protocols. BMI was calculated from measured height and weight. Missing data were addressed using multivariate imputation by chained equations. Descriptive statistics and multivariable linear regression were used to estimate adjusted associations between individual lead metrics and BMI, controlling for age, gender, income, race/ethnicity, and education. BKMR was then applied to evaluate joint mixture effects, estimate univariate and bivariate exposure–response functions, and quantify relative exposure importance using posterior inclusion probabilities (PIPs). Results: In covariate-adjusted linear regression, blood lead (β = −0.485; 95% CI: −0.566, −0.405; p < 0.001) and window dust lead (β = −0.00047; 95% CI: −0.00067, −0.00026; p < 0.001) were inversely associated with BMI, whereas floor dust lead was positively associated (β = 0.258; 95% CI: 0.209, 0.306; p < 0.001). Urinary lead was inversely but not significantly associated with BMI (β = −0.111; 95% CI: −0.235, 0.013; p = 0.079). In BKMR, blood lead was the dominant contributor, with a posterior inclusion probability (PIP; proportion of iterations in which an exposure is selected) of 1.00. Window dust lead showed modest inclusion (PIP = 0.26), whereas urinary and floor dust lead were not selected (PIP = 0.00). Exposure–response functions indicated modest nonlinearity for blood lead and greater divergence for the blood lead–window dust lead pairing at higher exposure levels. The overall mixture effect declined across increasing joint exposure quantiles, crossing the null near the median and becoming increasingly negative at higher mixture levels. Conclusions: In our study, lead metrics showed heterogeneous associations with BMI, and BKMR indicated that internal lead burden (blood lead) primarily drove mixture-related BMI patterns, with evidence that window dust lead may modify mixture effects at higher co-exposure levels. These findings support evaluating multiple lead exposure pathways jointly and using flexible mixture models to capture nonlinear and interaction-dependent relationships with BMI.
1. Introduction
Lead has long been recognized as a pervasive environmental toxicant with well documented adverse effects on human health [1]. Its malleability, resistance to corrosion, and relative chemical stability contributed to its widespread historical use in construction materials, plumbing, paints, batteries, and gasoline [2]. Lead use remained widespread in industrial and residential applications until regulatory actions, including the Residential Lead-Based Paint Hazard Reduction Act of 1992, were implemented to reduce population exposure [3]. Foundational work by geochemist Clair Patterson played a critical role in establishing accurate measures of human lead exposure and informing subsequent regulatory standards [4]. Lead is primarily stored in bone but can be mobilized into the bloodstream, where it distributes to soft tissues throughout the body [5]. In adults, sustained circulating lead can adversely affect multiple organ systems through cumulative internal exposure. Children are particularly vulnerable due to ongoing growth and development and greater relative distribution of lead to soft tissues. As a result, lead exposure poses disproportionate health risks for children. The primary pathways of non-occupational lead exposure include ingestion and inhalation of lead-contaminated dust particles [6]. Outside of occupational settings, residential lead exposure among adults primarily arises from deteriorating lead-based paint, contaminated soil, and indoor household surfaces, particularly in homes built before 1978 [7,8]. Both adults and children can be exposed to lead via ingestion and inhalation. Ingestion is typically the dominant pathway, but inhalation from aerosolized particles (e.g., humidifiers) can contribute substantially and, under certain conditions, reach health-relevant threshold [9]. Young children frequently engage in hand-to-mouth behaviors and spend substantial time near floor surfaces where lead-containing dust accumulates. Lead-contaminated dust can readily transfer to toys, play areas, and hands, increasing ingestion risk. Previous studies have demonstrated associations between residential floor dust lead levels and blood lead concentrations in children, whereas relationships with urinary lead have been less extensively examined [10].
Lead can be measured in multiple biological matrices, including blood, bone, urine, hair, nails, and saliva [11]. In epidemiologic and clinical settings, whole blood and urinary lead are the most commonly used biomarkers of lead exposure [12]. Whole blood lead levels primarily reflect recent exposure, generally within the preceding month [13]. Understanding the biological pathways and health outcomes associated with lead exposure remains an active area of investigation. Among potential outcomes, body mass index (BMI) has received increasing attention. Previous studies have reported mixed associations between blood lead concentrations and BMI and have identified lead as a potential contributor to BMI variation [14,15]. However, many of these studies have relied on relatively homogeneous populations, limiting generalizability and translational relevance. Consequently, important gaps remain in understanding the relationship between lead exposure and BMI outcomes across diverse populations. This study examines associations between household dust lead and biological lead biomarkers with BMI in a U.S. sample with the aim of clarifying pathway-specific cardiometabolic effects of lead exposure.
2. Materials and Methods
2.1. Study Population
Data were obtained from the 2001–2002 National Health and Nutrition Examination Survey (NHANES), a nationally representative survey of the U.S. noninstitutionalized civilian population. The NHANES 1999–2004 protocol (Protocol #98-12) was approved by the National Center for Health Statistics (NCHS) Research Ethics Review Board, and written informed consent was obtained from all participants or their proxies prior to data collection.
A total of 11,039 (1–84 years of age) participants were involved in this study. Demographic information was collected from participants using the NHANES computer-assisted personal interview (CAPI) software. Participants (>16 years of age) and emancipated minors were interviewed directly using this method. A proxy respondent provided information for survey participants (<16 years of age) and for participants who could not answer the questions themselves.
2.2. Exposure Assessment
2.2.1. Biological Specimen Collection
NHANES staff facilitated biological specimen collection at NHANES mobile examination centers where the participants were given a short phlebotomy examination. Participants also responded to inquiries about fasting, pesticide use and volatile toxicants in a series of questionnaires. A venipuncture interview was then given before the venipuncture as performed by licensed phlebotomists.
Urine collection was also facilitated by NHANES personnel at NHANES mobile examination centers. Participants were instructed to wash their hands and urinate directly into the cup without any of the inside of the cup or cap coming into contact with any external surfaces, clothing or any part of their body. Once finished, the samples were labeled with the following information: Collection attempt, volume in mL, date and time at collection, status of the urine, comment code, verification check box and total collected amount (sum in mL of all urine collections). For more information on the protocols and procedures for blood and urine collection, please refer to the CDC NHANES Laboratory Manual [16].
2.2.2. Urinary and Blood Lead Quantification and Analytical Procedures
Blood lead (µg/dL) was measured in eligible NHANES participants using graphite furnace atomic absorption spectrophotometry with Zeeman background correction (PerkinElmer SIMAA 6000; PerkinElmer, Waltham, MA, USA), following the standardized NHANES whole blood trace metal protocol [16].
Urinary lead (µg/L) was quantified using inductively coupled plasma–mass spectrometry (ICP–MS) on a PerkinElmer ELAN 6100 system (PerkinElmer, Waltham, MA, USA) according to standardized NHANES laboratory procedures [16].
2.2.3. Dust Collection
Window dust lead (µg/ft2) and floor dust lead (µg/ft2) were obtained from the NHANES Environmental Health Household Dust Lead component. Dust-wipe samples were collected during household visits from one room in homes with children aged 1–5 years, typically the room where the child spent most of their time, following standardized NHANES household environmental sampling procedures (National Center for Health Statistics [NCHS], NHANES 2001–2002 Household Interview Procedures Manual; NHANES Lead–Dust Laboratory Documentation [17]. Sampling included use of a 1 square foot floor template for floor wipes and direct wipe sampling of windowsills in accordance with federal housing lead assessment guidance. All participants (or their proxies) provided written informed consent prior to environmental sample collection under the approved NHANES protocol.
2.2.4. Dust-Wipe Lead Quantification and Analytical Procedures
Dust-wipe samples from both windowsills and floors were quantitatively transferred to digestion vessels and subjected to nitric acid and hydrochloric acid leaching with hot-plate heating, following procedures described in the Appendix of the U.S. Department of Housing and Urban Development (HUD) Guidelines for the Evaluation and Control of Lead-Based Paint Hazards in Housing (HUD, 1995) [17]. This procedure involves acid leaching of lead from the collected dust matrix rather than complete mineral digestion. Following digestion, lead concentrations in the resulting digestate were determined using atomic absorption spectrometry.
Windowsill dust lead concentrations were quantified using a PerkinElmer Flame Atomic Absorption Spectrometer (FAAS; Model 5000 or 5100; PerkinElmer, Norwalk, CT, USA). Floor dust lead concentrations were initially analyzed using a PerkinElmer Graphite Furnace Atomic Absorption Spectrometer (GFAAS; Model 5100; PerkinElmer, Norwalk, CT, USA), which provides greater analytical sensitivity for low-concentration samples. Floor dust samples with concentrations ≥5 μg/ft2 measured by GFAAS were subsequently reanalyzed using FAAS, and the FAAS value was reported as the final concentration in accordance with NHANES laboratory protocol documentation. Both analytical methods operated at a wavelength of 283.3 nm for lead determination and utilized standard calibration procedures with certified lead standards.
Laboratory quality assurance and quality control procedures included the analysis of reagent blanks, method blanks consisting of unused wipes from the same lot as those used in field sampling, and calibration verification standards. In addition, matrix-spiked National Institute of Standards and Technology (NIST; Gaithersburg, MD, USA) wipe standards were used to evaluate analytical recovery. Analytical duplicates and recovery checks were performed periodically during sample runs to verify instrument performance and analytical precision. Field blanks and duplicate samples were collected in approximately 5% of households to assess potential contamination and sampling variability. For the NHANES 2001–2002 cycle, recovery rates averaged approximately 96.9% for both floor and window dust samples, consistent with NHANES quality control reports.
Samples with concentrations exceeding the upper calibration range were diluted and reanalyzed to ensure accurate quantification. Values below the analytical limit of detection (LOD) were handled by substituting LOD/√2.
Household dust lead represents an environmental reservoir measure rather than an acute physiological biomarker and is not expected to exhibit substantial intra-day biological fluctuation. Although minor variability in surface loading may occur due to cleaning, resuspension, or household activity, standardized wipe-sampling protocols were used to capture surface lead loading at the time of collection, reflecting cumulative deposition rather than momentary airborne concentrations.
All laboratory and environmental measurements adhered to NHANES quality control and quality assurance procedures as detailed in the NHANES Laboratory Procedure Manuals [16].
2.3. Outcome Assessment
Primary Outcome
Body mass index (BMI) was calculated from measured weight and height obtained during the NHANES 2001–2002 Mobile Examination Center (MEC) visit. Body weight (kg) was measured using a calibrated digital scale for participants of all ages, and standing height (cm) was measured using a fixed stadiometer for participants, following standardized protocols described in the NHANES Anthropometry Procedures Manual [16]. Measurements were collected by trained health technicians using calibrated equipment with automated data capture and built-in range checks to ensure quality control. BMI was computed as weight in kilograms divided by height in meters squared (kg/m2).
2.4. Covariates
Covariates were selected based on established determinants of BMI and their availability in the NHANES 2001–2002 dataset. Demographic covariates included age, gender, and race or ethnicity. Gender was coded as 1 for male and 0 for female. Race or ethnicity followed NHANES categories: 1 Mexican American, 2 Other Hispanic, 3 Non-Hispanic White, 4 Non-Hispanic Black, and 5 Other Race. Socioeconomic status was represented by household income. Educational attainment was included as an indicator of social and behavioral factors linked to cardiometabolic outcomes. All covariates were included in regression and BKMR models to control for their potential confounding influence on BMI.
2.5. Statistical Analysis
2.5.1. Missing Data
Multivariate Imputation by Chained Equations (MICE) was used to impute missing values for exposure variables (window dust lead, floor dust lead, blood lead, and urinary lead), outcome variables (BMI), and covariates (demographic, anthropometric, and socioeconomic characteristics).
2.5.2. Descriptive Analyses
Descriptive statistics were generated for all study variables. Continuous variables, including blood lead, urinary lead, window dust lead, and floor dust lead, were summarized using means and corresponding 95 percent confidence intervals. Categorical variables, such as gender and race or ethnicity, were summarized using weighted proportions to reflect their distribution in the U.S. population.
2.5.3. Correlation Analyses
Spearman correlation analysis was conducted to evaluate the associations among window dust lead, floor dust lead, and the lead biomarkers (blood lead and urinary lead), as well as the correlations between these exposure indicators and BMI.
2.5.4. Regression Analyses
Linear regression was used to examine the associations of BMI with floor dust lead, window dust lead, blood lead, and urinary lead. All models were adjusted for age, gender, income, ethnicity, and education to account for established determinants of BMI and to isolate the contribution of each exposure. Age, sex, race/ethnicity, income, and education were included as covariates because these factors are established determinants of both lead exposure and BMI. Demographic and socioeconomic characteristics influence residential environmental conditions, occupational and behavioral exposure pathways, and biological lead biomarkers, including blood, urinary, and dust-based lead measures. Similarly, BMI varies systematically across demographic and socioeconomic groups due to metabolic, behavioral, and structural determinants. Adjustment for these variables was therefore necessary to reduce potential confounding in the estimated associations between multiple lead exposure pathways and BMI. This adjustment strategy ensures that the observed associations reflect the independent relationships between each lead pathway and the BMI outcomes.
2.5.5. Mixture Modeling
BMI implications of the combined effect of multiple lead exposure pathways, including floor dust, window dust, urinary lead, and blood lead, were evaluated using Bayesian Kernel Machine Regression (BKMR). BKMR allows flexible estimation of nonlinear and nonadditive relationships within chemical mixtures by modeling the joint exposure surface while simultaneously assessing each exposure’s marginal and interaction effects.
All models were fitted using the BKMR package in R with 5000 iterations after a burn-in period. Continuous exposures were standardized to facilitate model convergence and comparability. The outcome was modeled as a function of the exposure mixture and covariates, with age, gender, income, ethnicity, and education included as adjustment variables. Posterior inclusion probabilities (PIPs) were used to quantify the relative importance of each exposure within the mixture. Univariate, bivariate, and overall mixture-response functions were generated to characterize nonlinear dose–response patterns, potential effect modification by co-exposures, and the cumulative influence of increasing mixture levels.
This approach enabled a comprehensive assessment of how individual and joint lead exposure pathways contribute to BMI, providing insight into both marginal and interaction effects within the lead mixture.
Because lead exposure metrics reflect overlapping biological and environmental processes and are moderately correlated, extreme PIP values may arise when the model assigns explanatory weight to one exposure metric over another within correlated exposure groups. Accordingly, PIPs were evaluated in conjunction with univariate exposure–response functions, single-variable risk summaries, and overall mixture effects, rather than interpreted in isolation. Sensitivity analyses with alternative kernel specifications and iteration lengths yielded consistent qualitative patterns, supporting the robustness of the observed mixture structure. Finally, convergence diagnostics including visual inspection of trace plots and stability of posterior summaries across iteration segments indicated adequate chain mixing and stationarity.
Sensitivity analyses excluding blood lead from the mixture were conducted to evaluate whether environmental dust indicators independently demonstrated consistent patterns; qualitative results were unchanged.
3. Results
Table 1 presents the weighted characteristics of participants included in the analysis. The study population reflected the demographic composition of the U.S. population, with a balanced distribution of males and females, and a predominance of non-Hispanic White adults. The mean age was approximately 35 years, consistent with the broad age structure.
Table 1.
Characteristics of NHANES 2001–2002 Participants.
Mean blood lead concentrations were below two micrograms per deciliter, while urinary lead levels were similarly low. Household environmental lead indicators showed substantial variability, particularly for window dust lead, which had a wide confidence interval reflecting the limited environmental subsample and the distribution’s high skewness. Floor dust lead concentrations were lower and more stable than those in window dust.
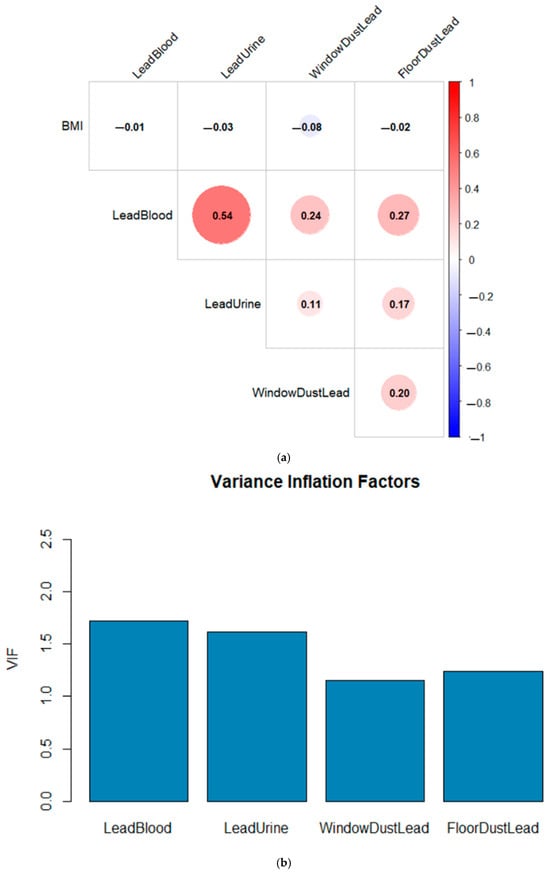
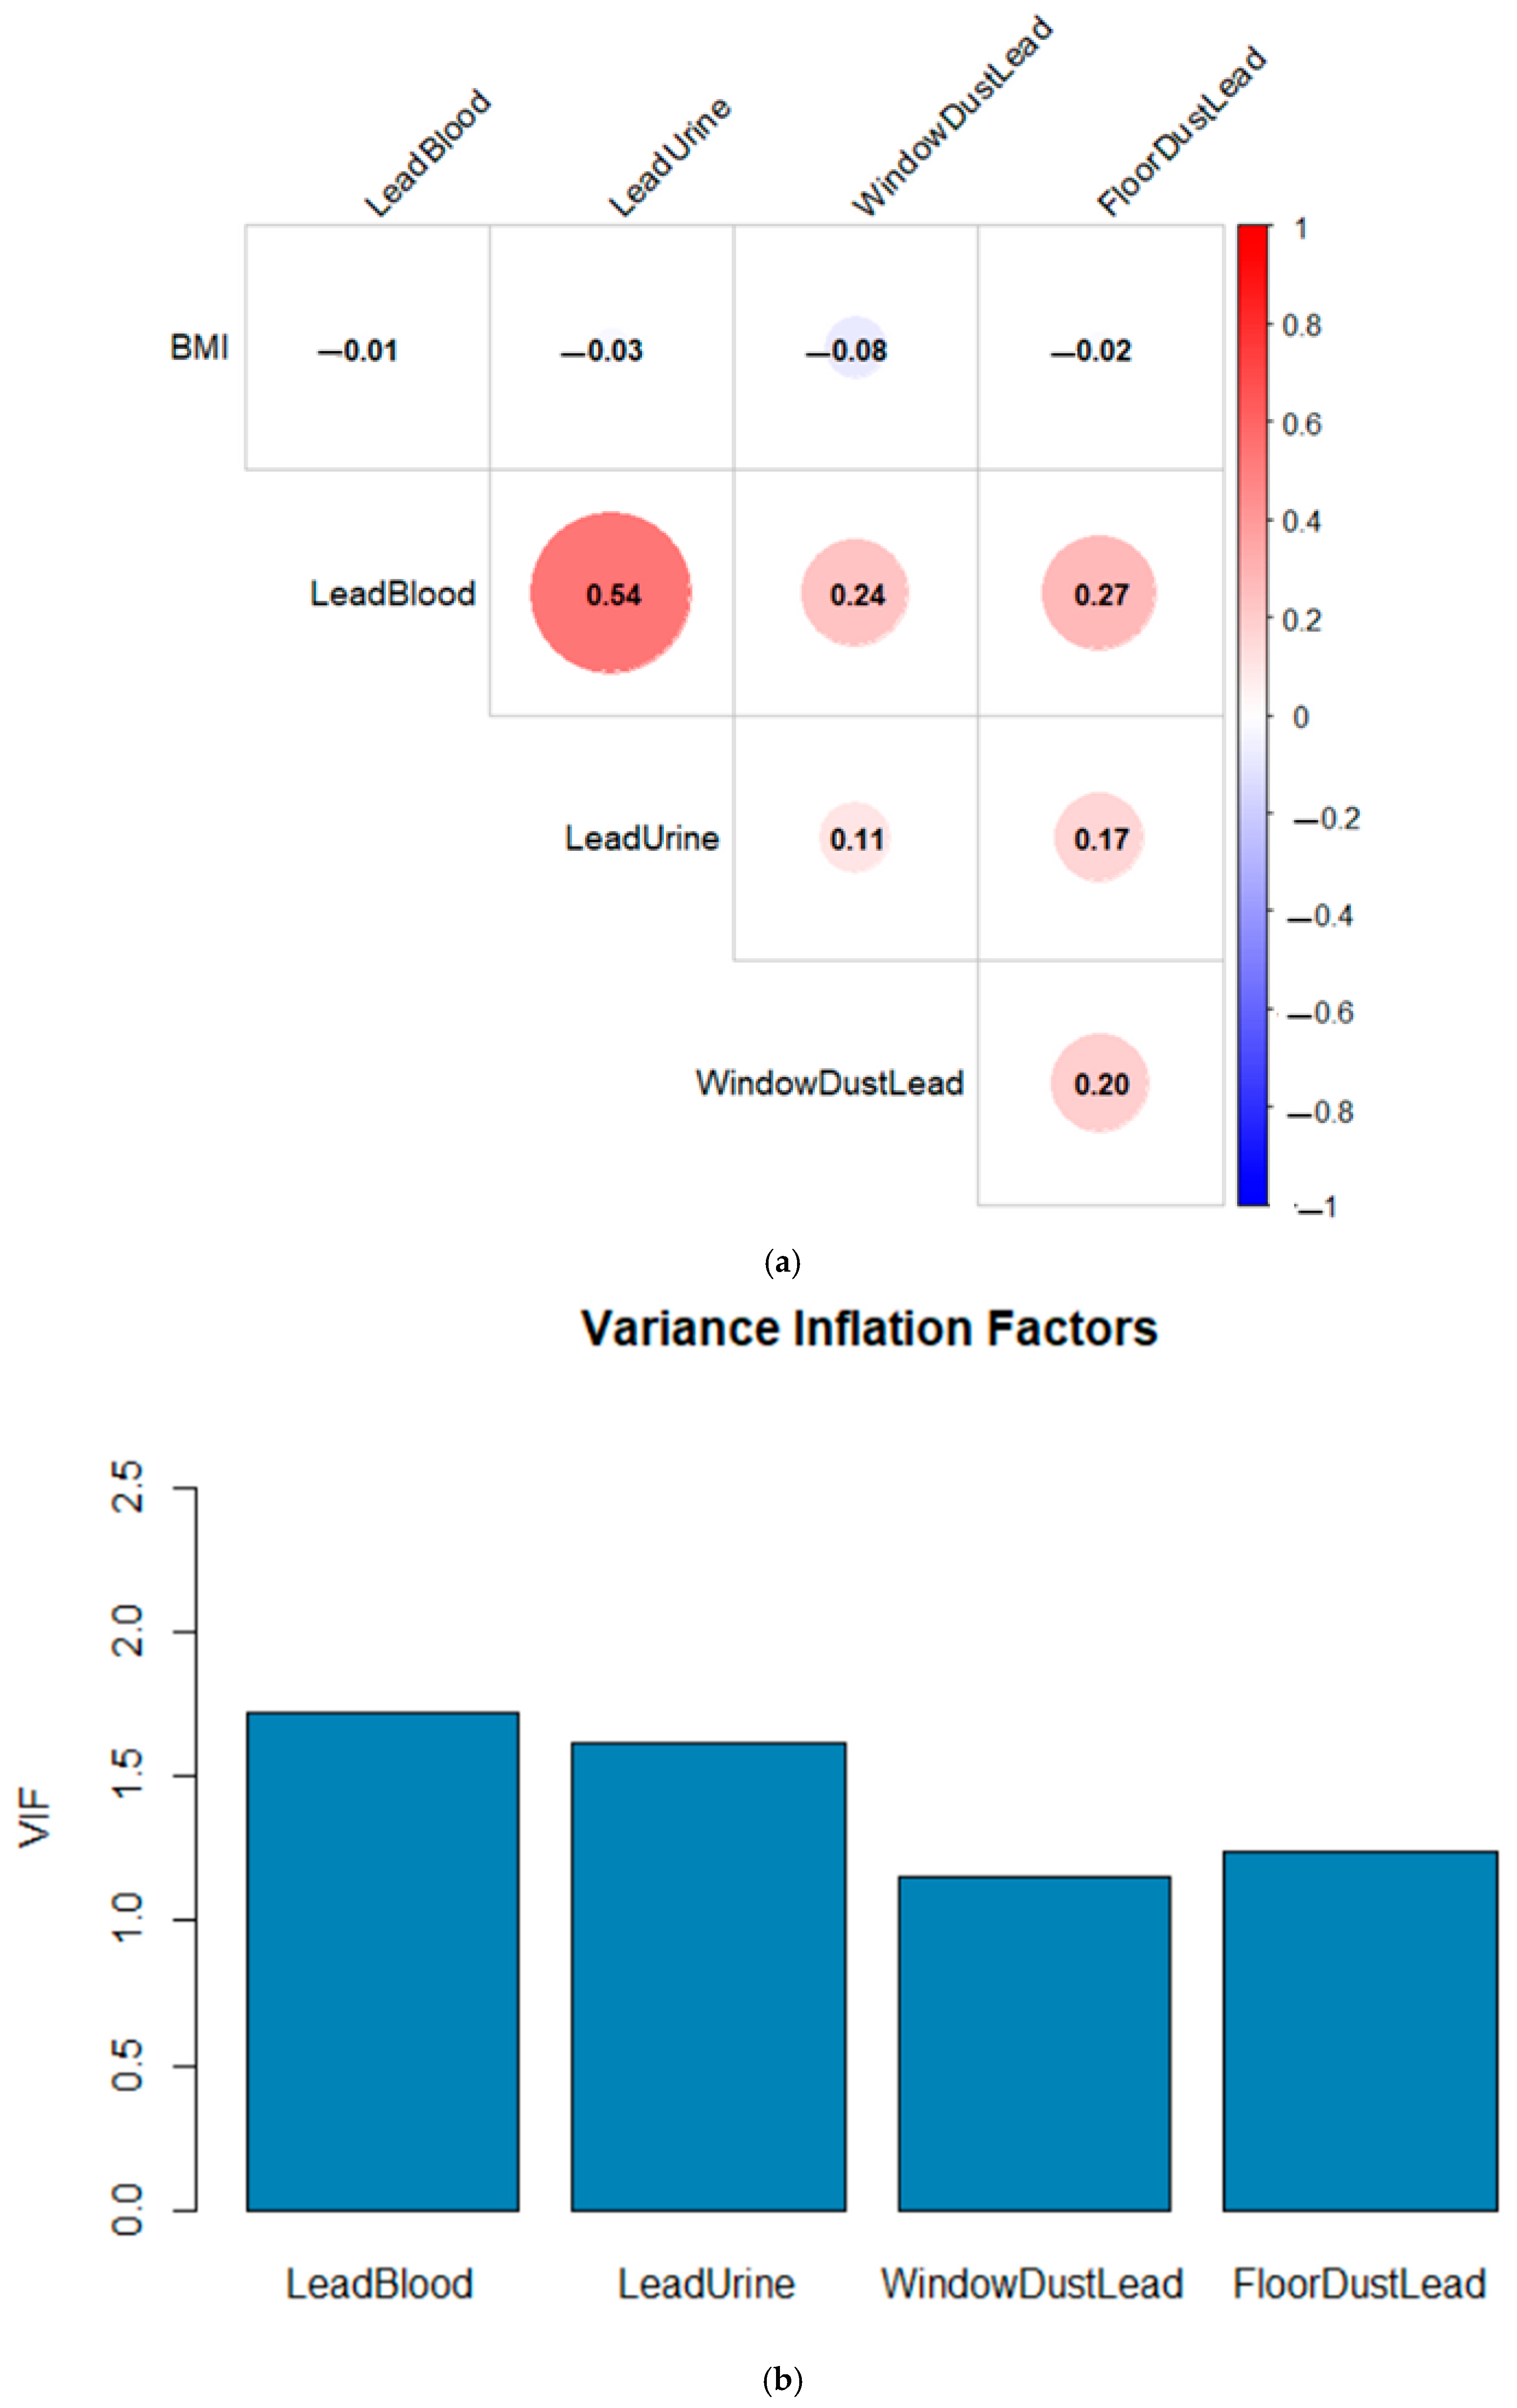
Figure 1a illustrates the Spearman correlation structure among BMI, biological lead biomarkers, and household dust lead indicators. Blood lead exhibited a higher correlation with urinary lead than with either window dust lead or floor dust lead, reflecting closer alignment between biological indicators than between biological and environmental markers. Floor dust lead showed a stronger association with blood lead than window dust lead, although both correlations remained lower than those observed among the biological measures.
Figure 1.
(a) Spearman correlation results. (b) Variance Inflation Factors results.
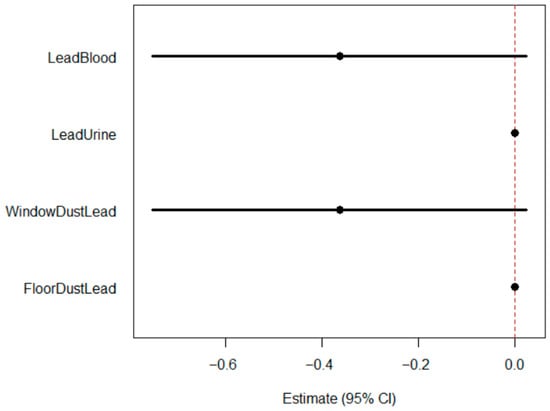
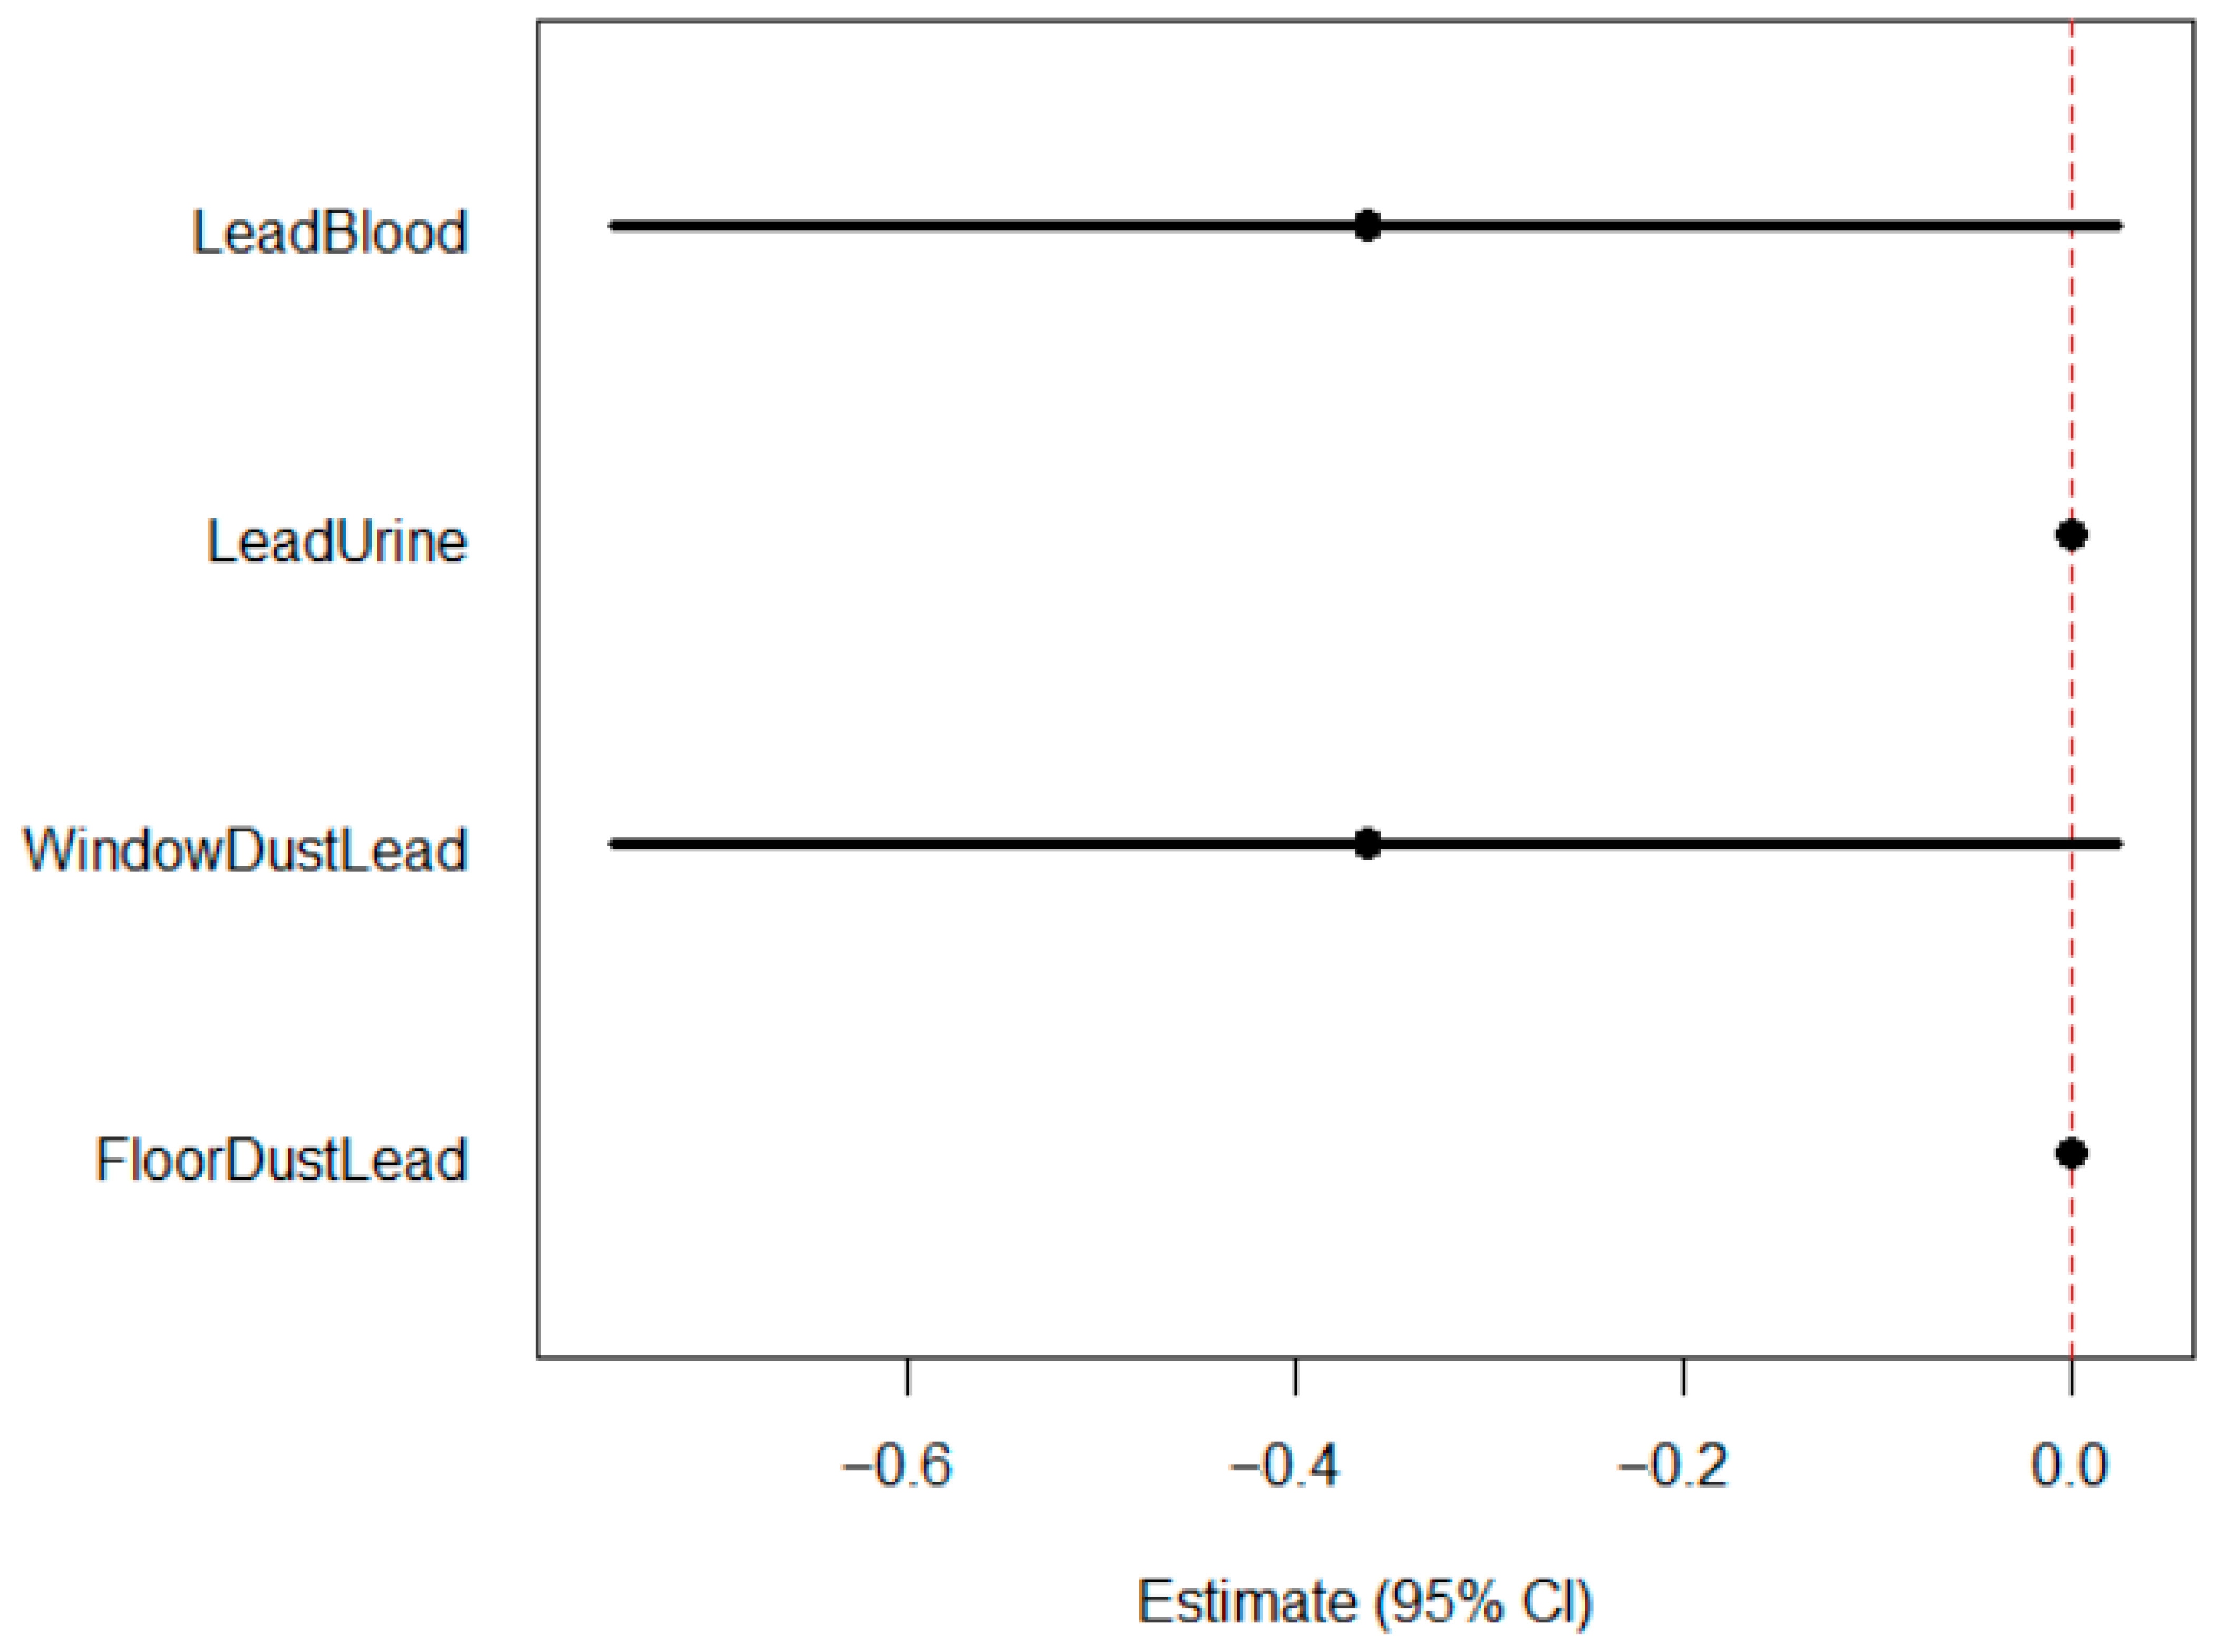
Variance inflation factors (VIF) were calculated to evaluate multicollinearity among the four lead exposure variables included in the multivariable regression models (Figure 1b). VIF values were low for all predictors: LeadBlood (1.72), LeadUrine (1.62), WindowDustLead (1.15), and FloorDustLead (1.24). All values were substantially below commonly cited thresholds for problematic multicollinearity (e.g., VIF > 5), indicating minimal linear dependence among exposure measures and supporting their simultaneous inclusion in regression analyses.
In multivariable linear regression models adjusted for age, gender, income, ethnicity, and education, several lead exposure metrics were significantly associated with BMI (Table 2). Blood lead concentration was inversely associated with BMI (β = −0.485; 95% CI: −0.566, −0.405; p < 0.001), indicating that higher circulating lead levels were associated with lower BMI after covariate adjustment. Window dust lead levels were similarly inversely associated with BMI (β = −0.00047; 95% CI: −0.00067, −0.00026; p < 0.001), although the magnitude of the coefficient reflects the scale of dust lead measurement. In contrast, floor dust lead was positively associated with BMI (β = 0.258; 95% CI: 0.209, 0.306; p < 0.001). Urinary lead showed an inverse but statistically non-significant association (β = −0.111; 95% CI: −0.235, 0.013; p = 0.079), with the confidence interval including the null. Linear regression assumes linearity, independence, and homoscedasticity of residuals. Variance inflation factors were low (<2), indicating minimal multicollinearity among exposure metrics.
Table 2.
Linear Regression BMI.
The linear regression results provided estimates of marginal associations under an assumption of linearity and independence among exposure indicators. In contrast, a BKMR framework evaluates exposure metrics jointly and allows for nonlinear and interaction-dependent effects across the exposure distribution.
BKMR was used to evaluate the relative importance of individual lead exposure metrics within the multipollutant framework (Table 3). Posterior inclusion probabilities (PIPs) quantify the probability that a given exposure contributes to the exposure–response function after accounting for correlations among exposures and uncertainty in model selection.
Table 3.
Posterior Inclusion Probabilities (PIP) from BKMR Models for BMI.
Blood lead demonstrated a PIP of 1.00, indicating that it was selected in essentially all posterior samples and was the dominant contributor to the modeled association with BMI. This suggests strong evidence that blood lead plays an important role in the mixture–BMI relationship. Window dust lead exhibited a moderate PIP (0.2624), indicating some evidence of contribution to the exposure–response surface, although substantially weaker than that observed for blood lead. In contrast, urinary lead and floor dust lead both had PIPs of 0.00, indicating that these exposures were not selected as important contributors to the BMI association within the mixture model.
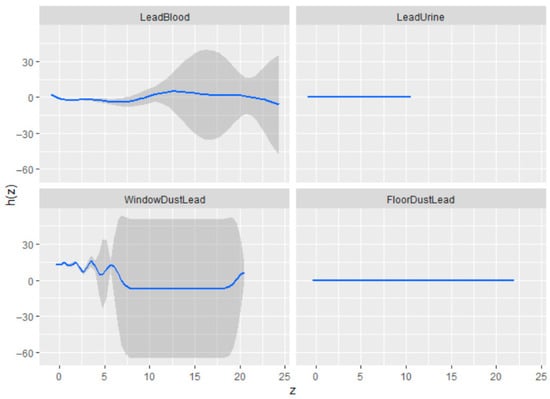
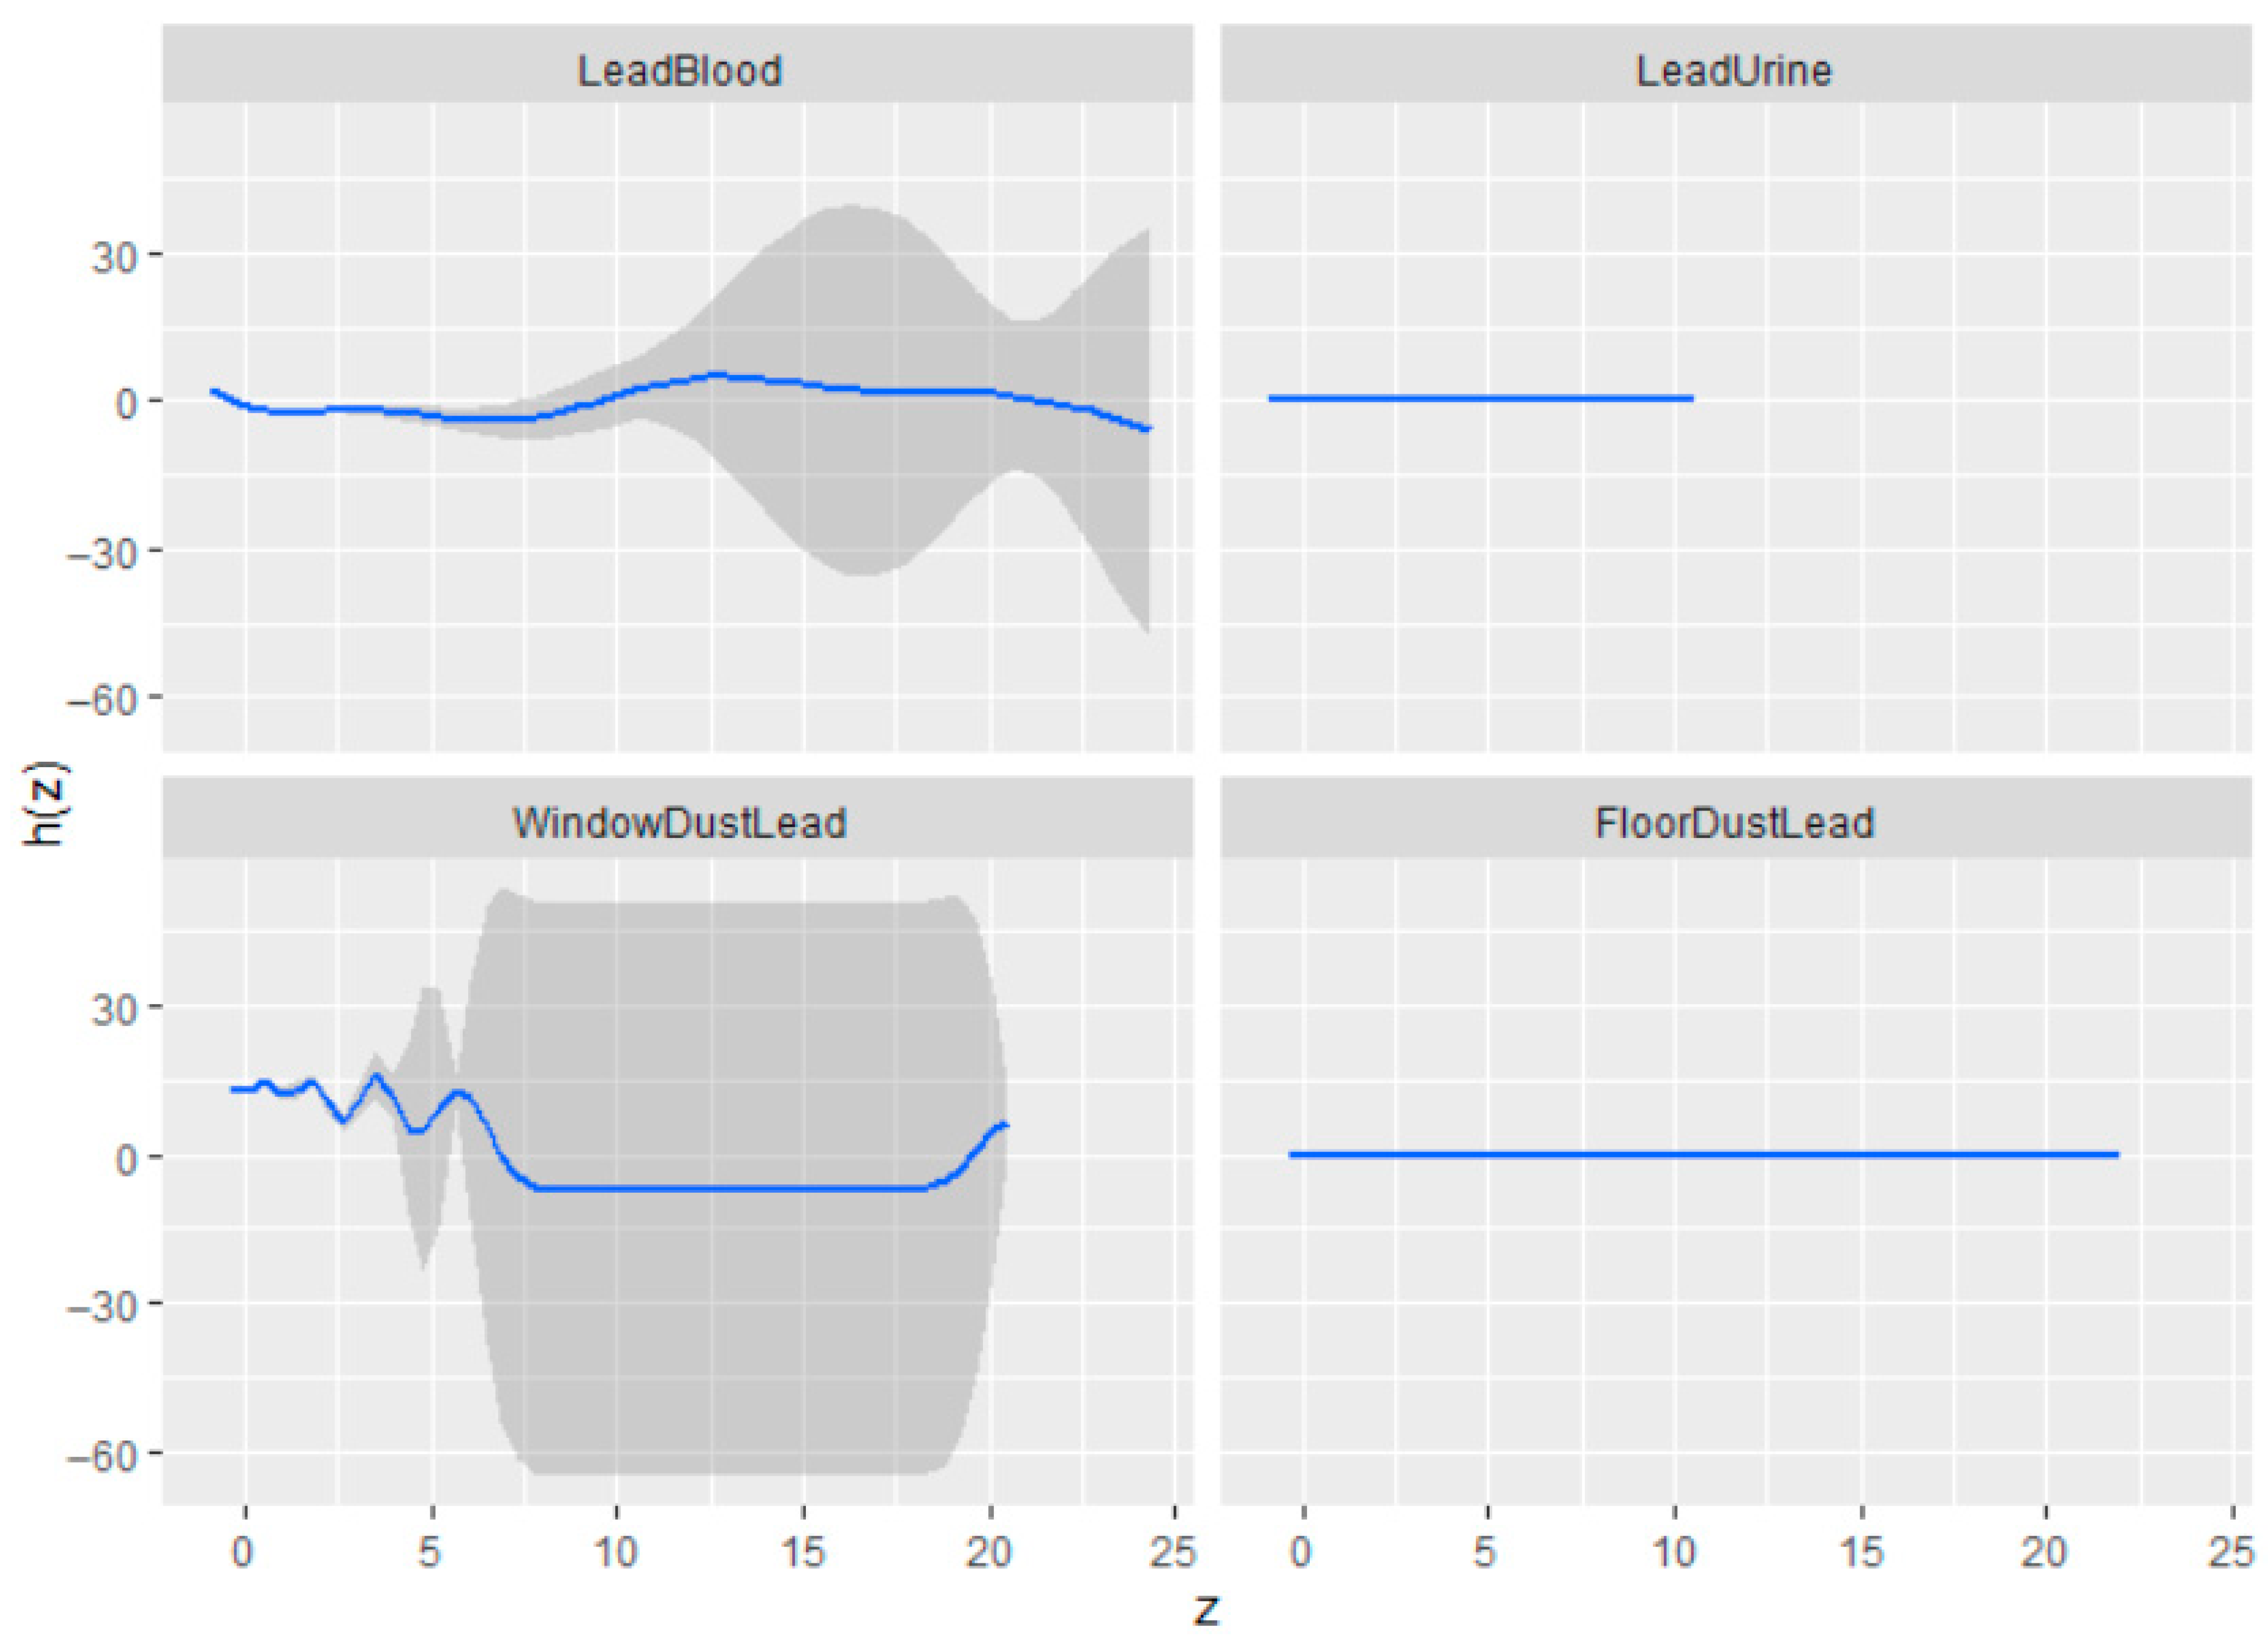
Figure 2 displays the BKMR-estimated univariate exposure–response functions for each lead metric, holding other exposures at their median levels. Blood lead demonstrated modest nonlinearity, with small fluctuations across the exposure range and increasing uncertainty at higher concentrations, as indicated by widening credible intervals. Window dust lead showed some variability and oscillations at lower levels but was largely flat across most of its distribution with a slight rise at the end. It also showed substantial uncertainty in the tails. In contrast, urinary lead and floor dust lead exhibited essentially flat exposure–response functions centered near zero, suggesting minimal independent contribution to BMI within the mixture framework.
Figure 2.
BMI Univariate dose–response. Estimate adjusted for age, gender, income, ethnicity, and education.
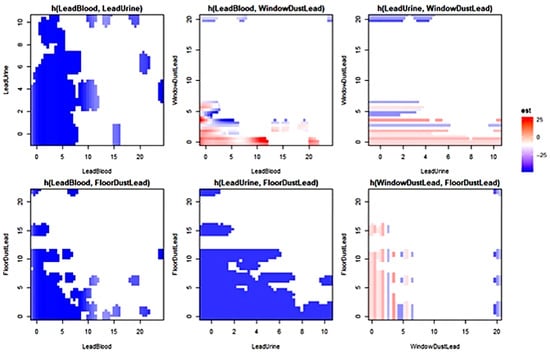
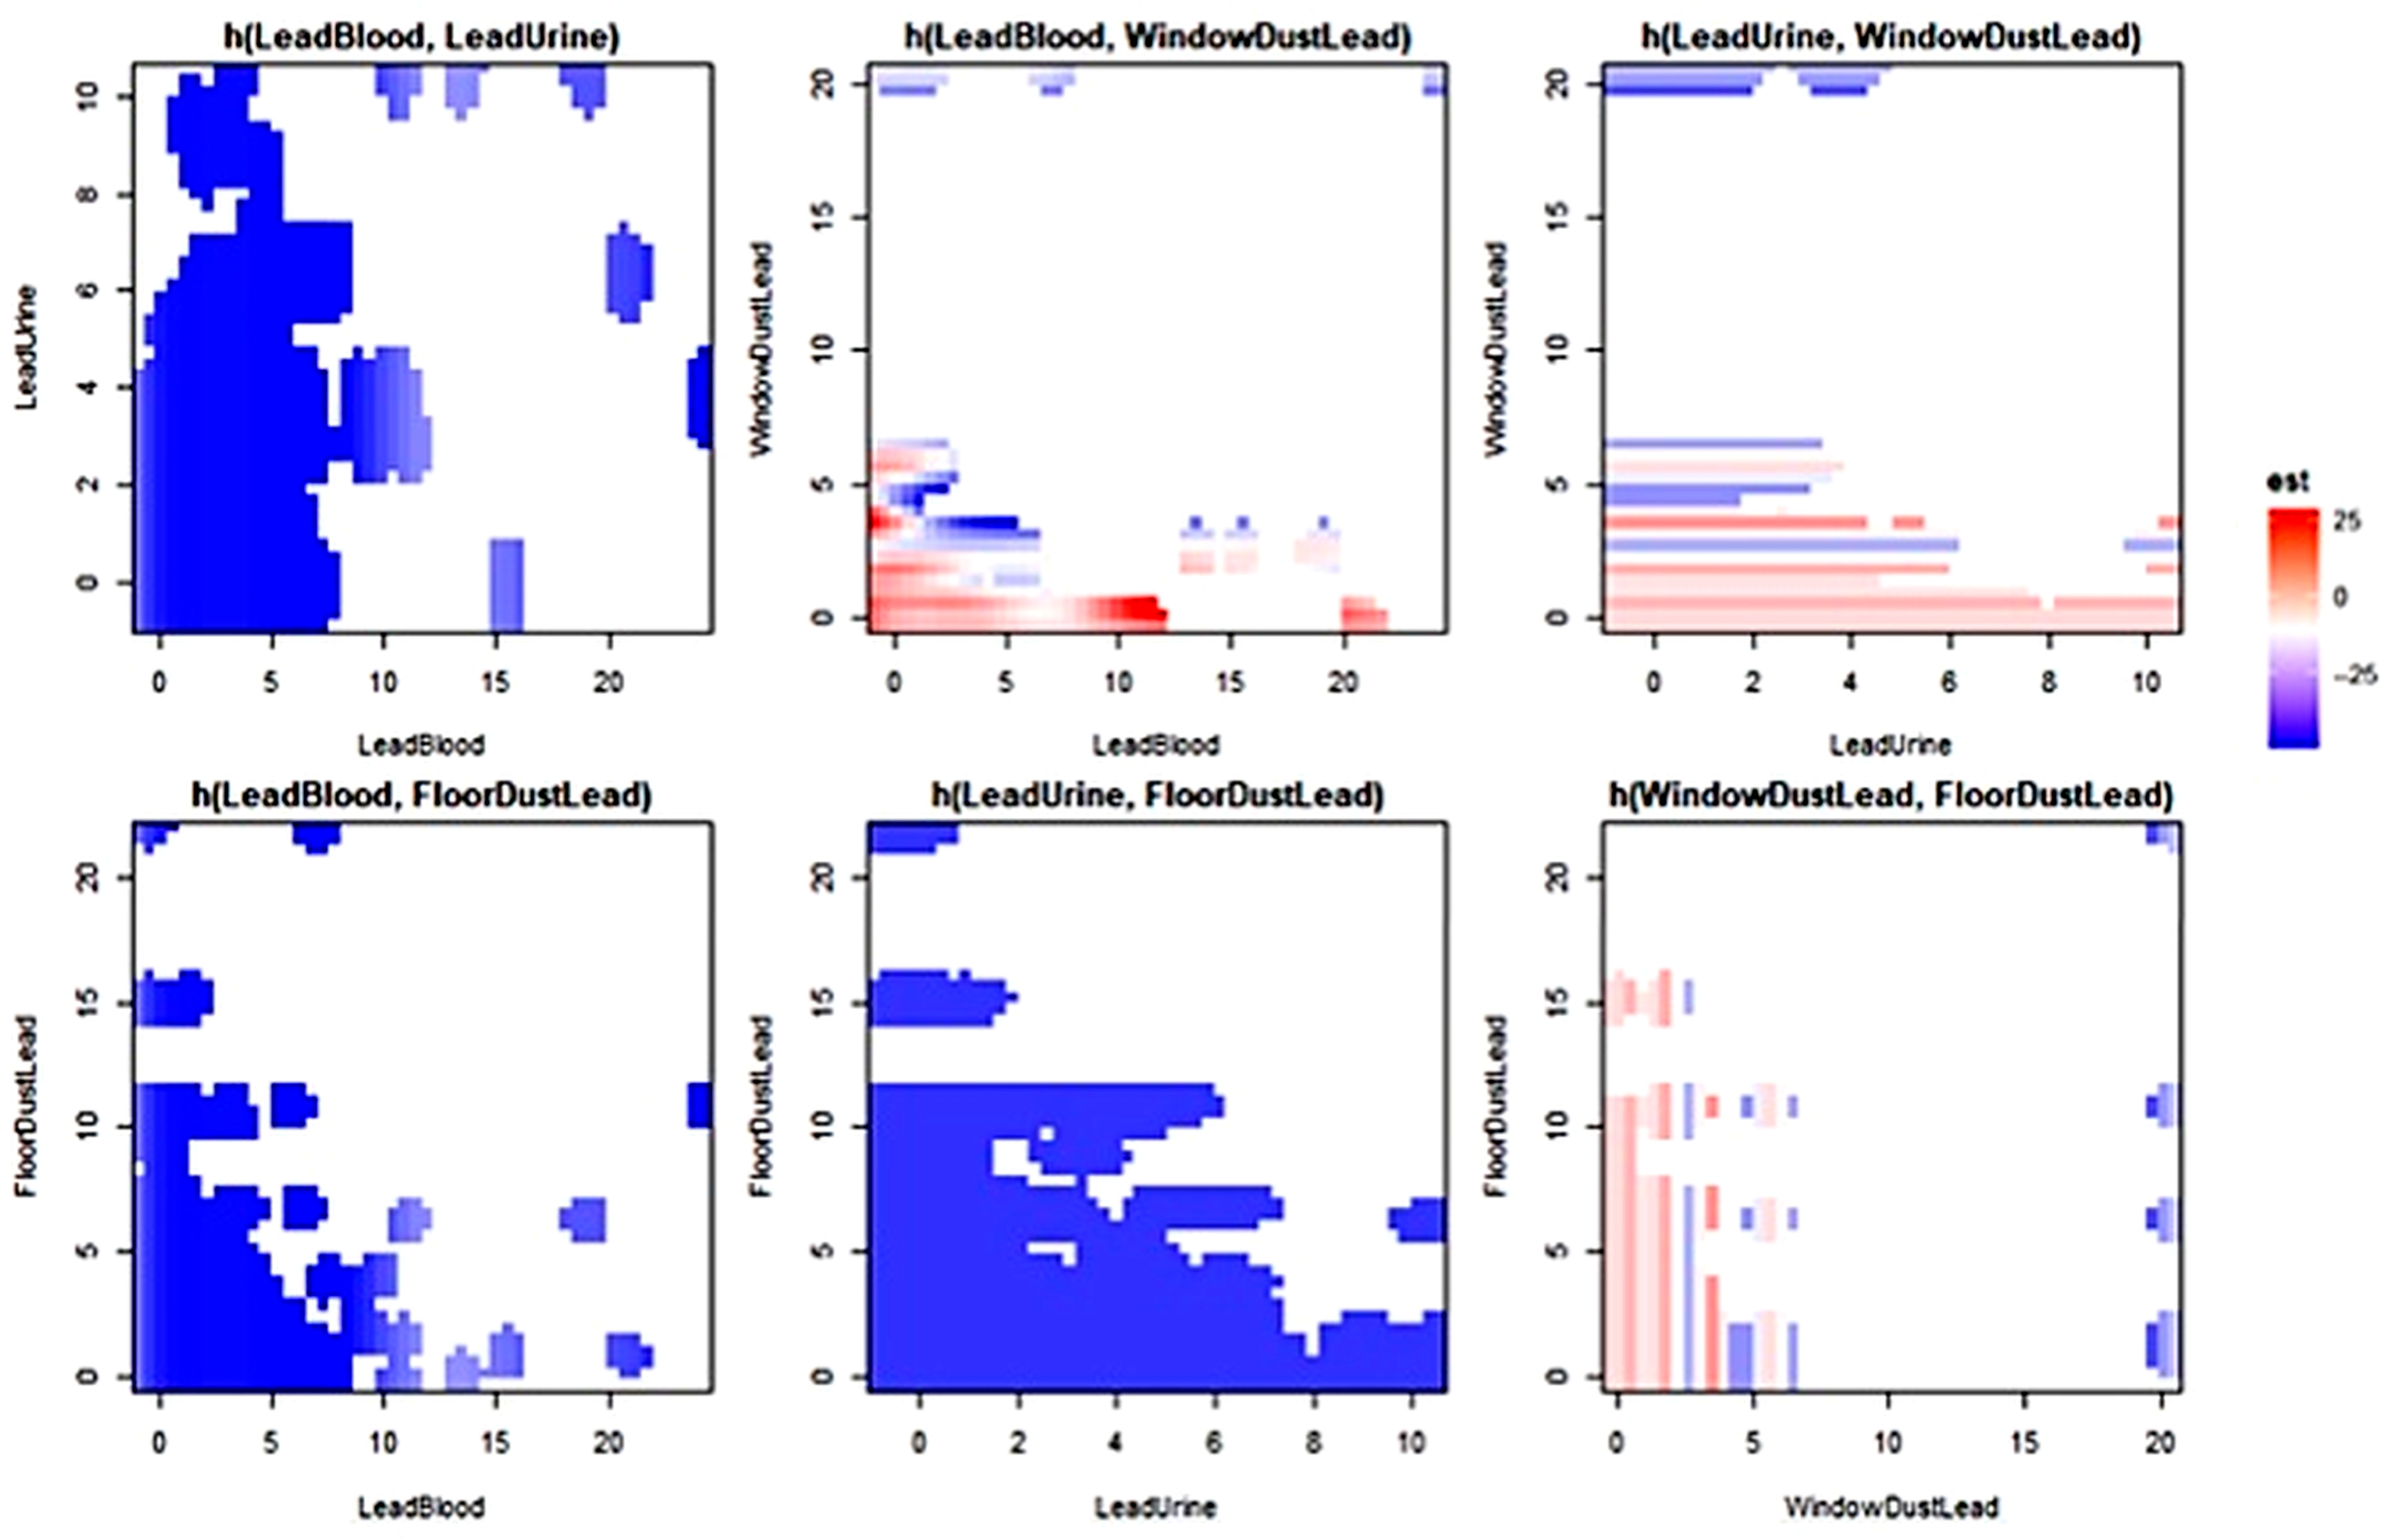
Figure 3 presents the bivariate exposure–response surfaces from the BKMR model, illustrating the joint effects of paired lead exposure metrics on BMI while holding remaining exposures at their median levels. Color gradients represent the estimated exposure–response function h(z1,z2), with red indicating positive associations and blue indicating negative associations.
Figure 3.
BMI Bivariable Exposure–Response Function. Estimate adjusted for age, gender, income, ethnicity, and education.
The strongest positive regions were observed in bivariate surfaces involving blood lead, particularly the blood lead–window dust lead pairing, with weaker positive structure in the urine lead–window dust lead and window dust lead–floor dust lead pairings.
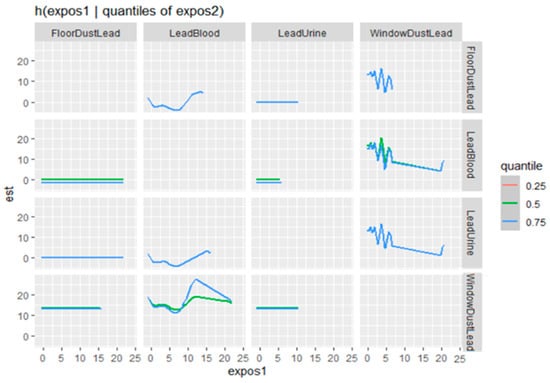
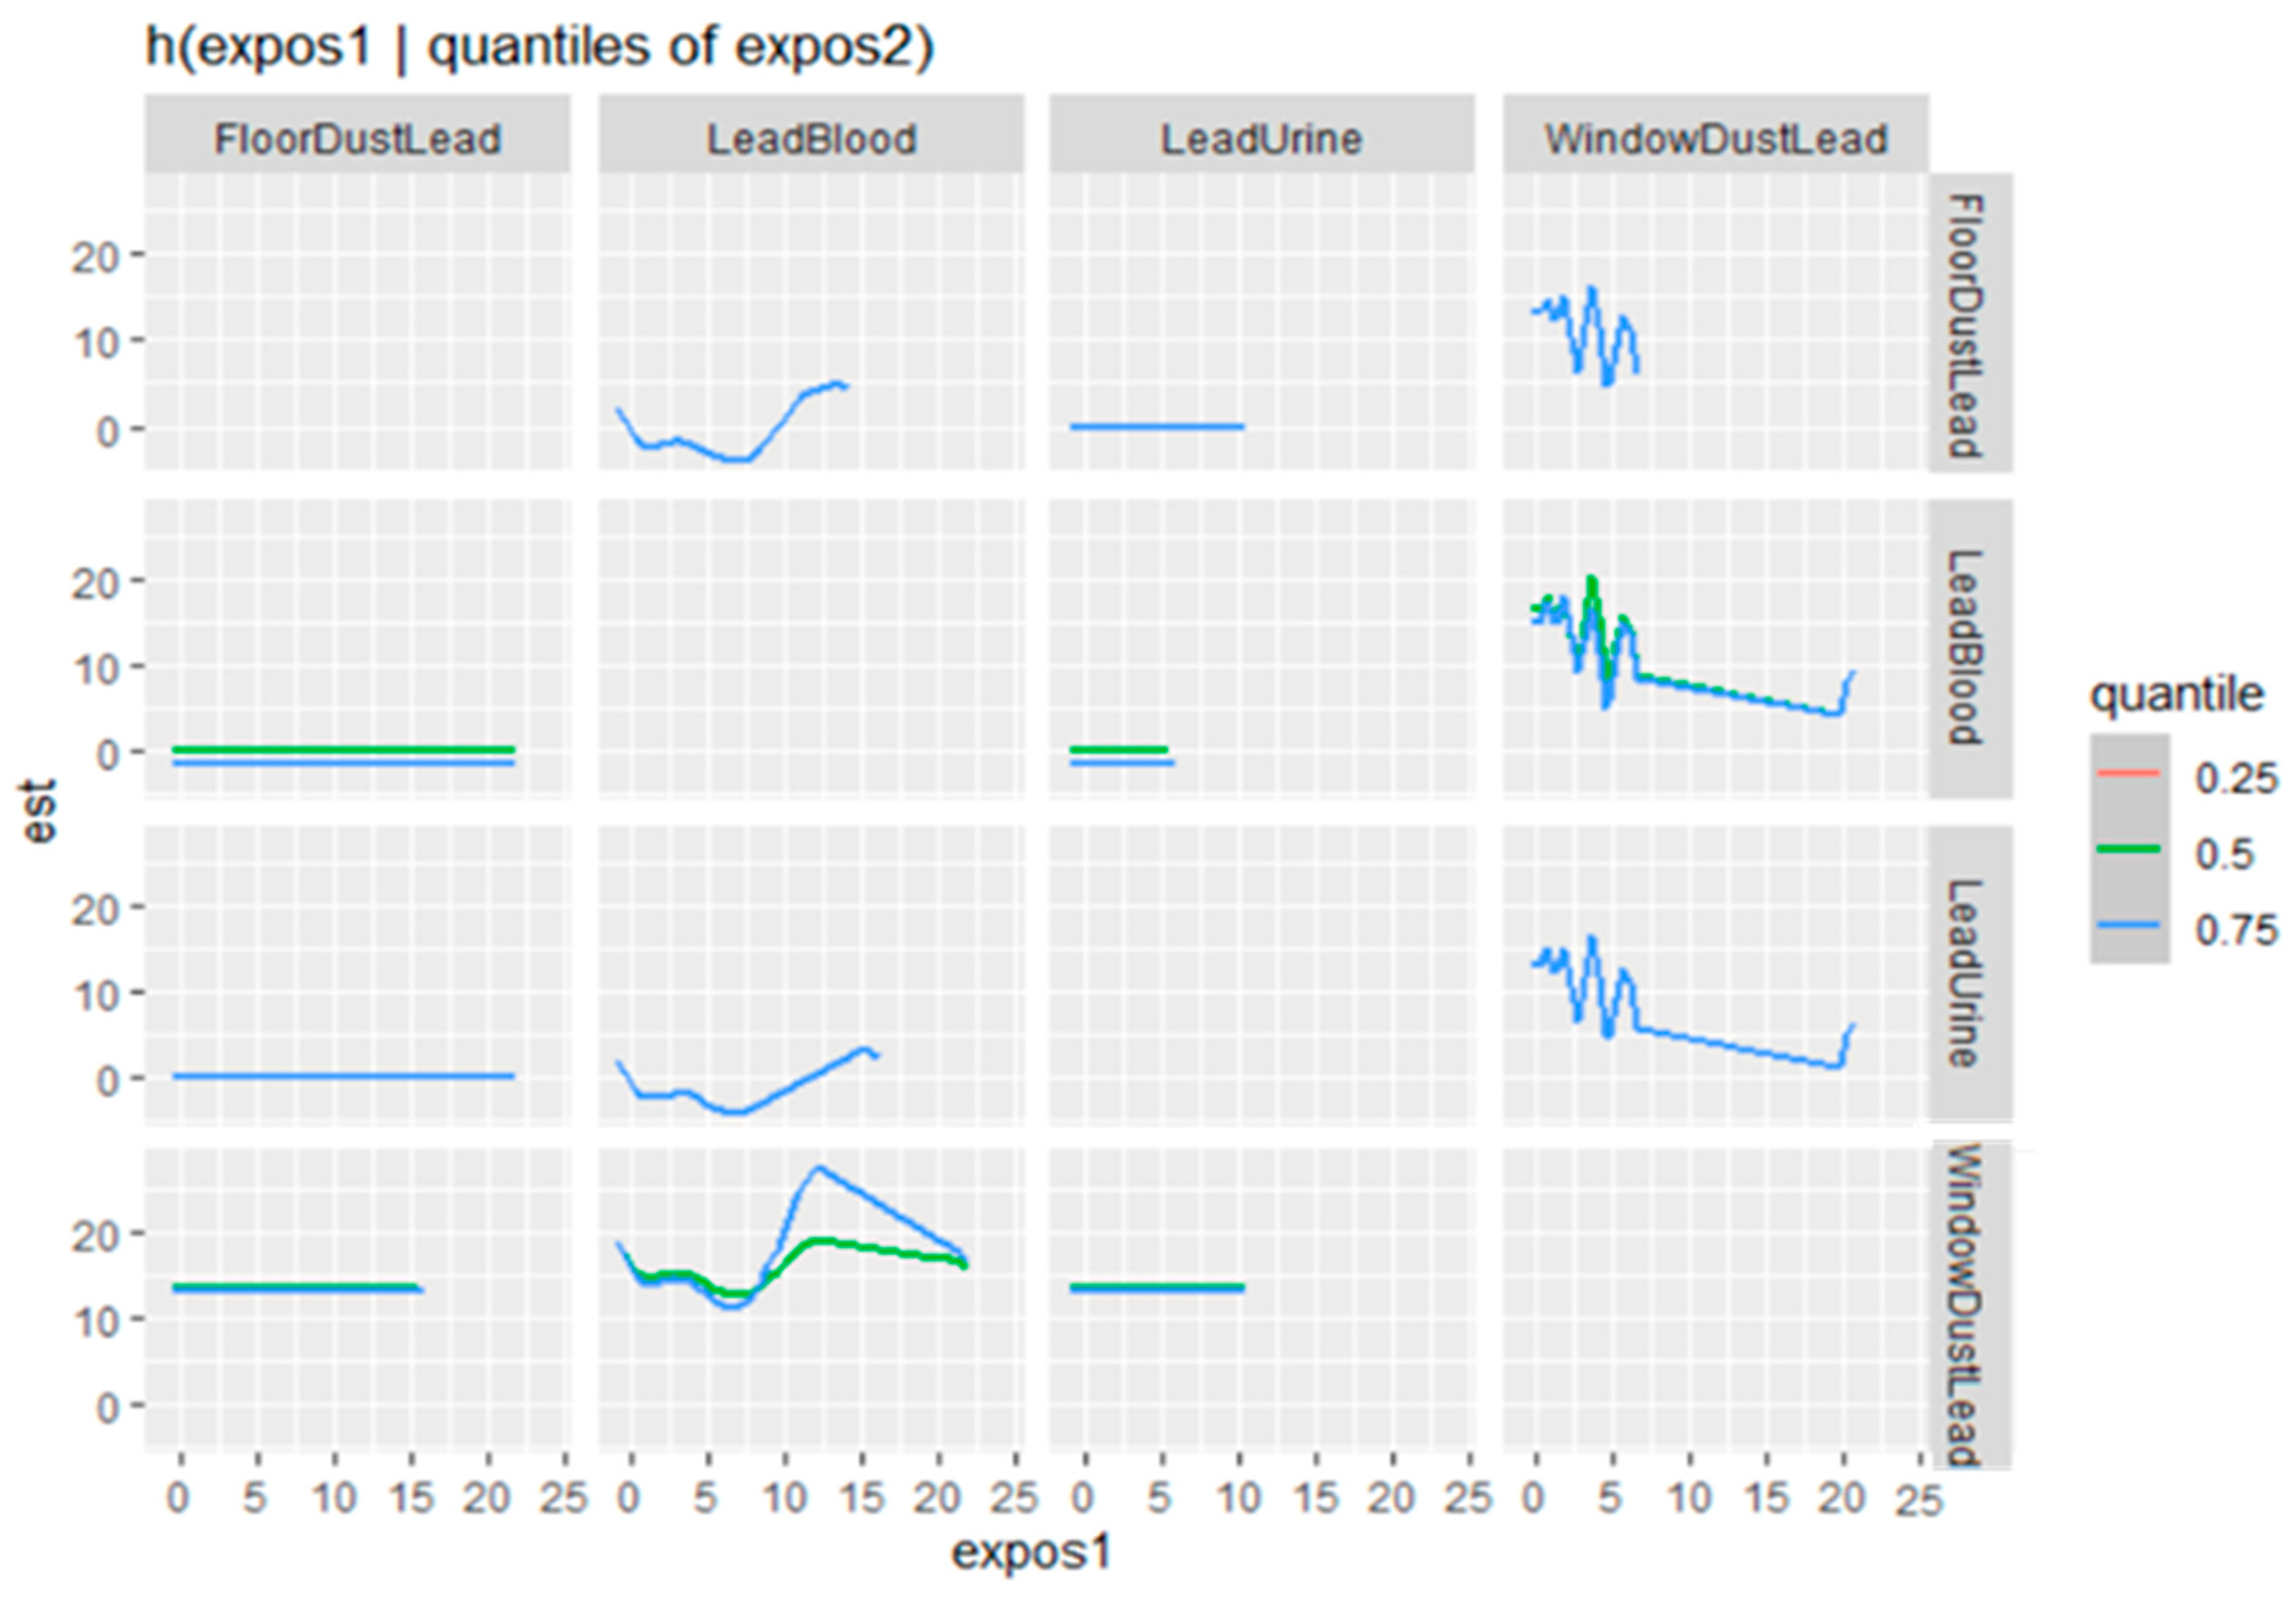
Figure 4 shows BKMR bivariate exposure–response plots where the effect of one exposure (expos1) on BMI is traced while a second exposure (expos2) is held at its 25th, 50th, or 75th percentile. The most noticeable pattern involves window dust lead: at lower levels of expos1, the curve shows an oscillating/nonlinear shape, and the separation between curves is greatest when the second exposure is fixed at the 0.75 quantile, indicating that most of the apparent interaction is concentrated at higher levels of the conditioning exposure. Blood lead also shows clear nonlinearity, with a dip at lower concentrations followed by an increase across the mid-range; this pattern becomes more pronounced when the second exposure is at the upper quartile (0.75), consistent with effect modification at higher co-exposure levels. In contrast, when urinary lead or floor dust lead are treated as expos1, the curves are largely flat and overlapping across quantiles of the other lead measures, suggesting minimal interaction for those metrics within the mixture framework.
Figure 4.
BMI Bivariate Exposure–Response quantiles. Estimate adjusted for age, gender, income, ethnicity, and education.
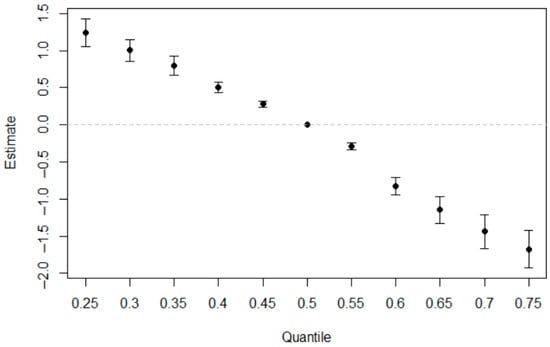
Figure 5 summarizes the overall mixture effect across increasing quantiles of the joint exposure distribution. Point estimates (with 95% credible intervals) show a clear monotonic decline in the estimated mixture effect as the joint exposure quantile increases, crossing the null near the median (≈0.50). The mixture effect is positive at lower quantiles (≈0.25–0.45) and becomes increasingly negative at higher quantiles (≈0.55–0.75), suggesting that the direction and magnitude of the joint lead mixture association with BMI varies across the exposure distribution, with the strongest positive deviation from the null at the lower quantiles and progressively stronger negative deviations at higher quantiles.
Figure 5.
BMI-Overall exposure effect. Estimate adjusted for age, gender, income, ethnicity, and education.
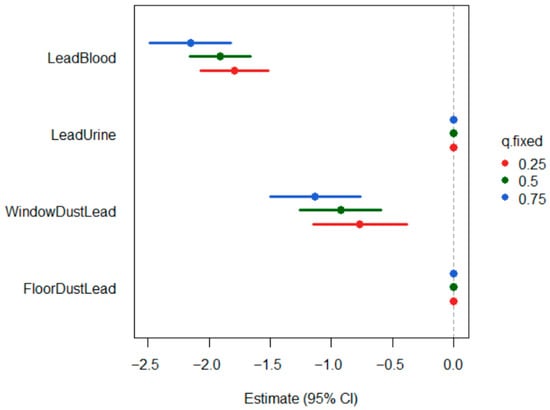
Figure 6 presents the single-exposure attributable effects for BMI. These estimates represent the change in BMI associated with shifting each exposure from its 25th to its 75th percentile while holding the remaining exposures at 0.25, 0.50, or 0.75 quantile. For BMI, blood lead produces the largest single-variable effect across the three quantile levels, indicating a strong marginal contribution of this environmental source. Window dust lead shows moderate effects with noticeable variation across quantiles, suggesting potential interaction with other mixture components. With floor dust lead and urine lead showing little effect.
Figure 6.
BMI Single Variables Effect. Estimate adjusted for age, gender, income, ethnicity, and education.
Figure 7 displays the single-variable interaction terms for BMI, estimating the change in each outcome when one exposure varies from its 25th to its 75th percentile while all other exposures are held at either the 75th or the 25th percentile. These contrasts isolate the extent to which each exposure contributes additional effect in the presence of elevated co-exposures. In the figure blood lead and window dust lead showed the clearest visual evidence of interaction-related patterning, with larger attributable effects when the remaining exposures are fixed at higher levels. This pattern indicates that dust-based and blood lead exert greater influence on BMI.
Figure 7.
BMI Single Variable Interaction Terms. Estimate adjusted for age, gender, income, ethnicity, and education.
4. Discussion
4.1. Overview of Principal Findings
This study evaluated associations between internal and residential lead exposure pathways and BMI using mixture modeling approaches. The findings indicate that circulating blood lead concentrations were the primary contributor to the overall exposure mixture signal, with evidence of nonlinear relationships and interactions with household dust lead. These results suggest that internal biomarkers of lead exposure may capture biologically relevant pathways linking environmental lead exposure to cardiometabolic outcomes. Dust lead and blood lead capture related but non-identical exposure domains: household dust reflects a residential environmental reservoir and potential for ongoing ingestion/inhalation exposure, whereas blood lead reflects the internal, bioavailable dose integrating multiple exposure sources and recent kinetics. The inclusion of both dust lead and blood as co-related but independent lead exposure variables throughout this analysis was justified through variance inflation factor analysis. The low variance inflation factor values obtained for the lead exposure variables demonstrates the absence of problematic co-linearity among the exposure measures and further supports their simultaneous inclusion in the multivariable regression models. In our study, several key findings emerged. First, lead exposures in this population were generally low, with mean blood lead <2 µg/dL and mean urinary lead near 1 µg/L, while household dust lead measures, particularly window dust lead, showed substantial variability and marked skewness, consistent with a smaller environmental subsample and heterogeneous household contamination.
Second, in covariate-adjusted linear regression, blood lead and window dust lead were inversely associated with BMI, whereas floor dust lead was positively associated with BMI; urinary lead showed an inverse but non-significant association. These findings indicate that different lead matrices may capture distinct but related exposure pathways or time windows and may not operate uniformly with respect to BMI. However, the linear regression framework imposes strong functional form assumptions (linearity and additivity), motivating use of BKMR to assess the mixture structure more flexibly.
Third, BKMR results consistently identified blood lead as the dominant contributor to the mixture–BMI association. Blood lead had a PIP of 1.00 and showed the clearest nonlinearity in the univariate exposure–response function, while urinary lead and floor dust lead exhibited near-flat exposure–response functions and PIPs of 0.00. Window dust lead showed modest importance (PIP ≈ 0.26) and a more irregular exposure–response pattern at lower exposure levels, with wider uncertainty in the tails, consistent with sparse support at extreme values and the highly skewed distribution.
Fourth, across bivariate BKMR surfaces and quantile-stratified bivariate curves, the most informative interaction patterns involved blood lead and window dust lead. In the bivariate quantile plots, separation between curves was most apparent at the median and upper-quartile levels of the conditioning exposure, with the most pronounced departures occurring when the second exposure was held at the 0.75 quantile. Window dust lead exhibited oscillation at lower levels of expos1 with greater divergence at higher quantiles of the second exposure, and blood lead showed a clearer nonlinear dip-and-rise pattern that became more pronounced at higher co-exposure levels. In contrast, when urinary lead or floor dust lead served as expos1, curves tended to overlap across quantile strata, providing limited evidence of meaningful effect modification for those metrics within the mixture.
Fifth, the overall mixture effect curve demonstrated that the estimated joint association with BMI varied across the exposure distribution. The overall mixture effect declined monotonically across increasing joint exposure quantiles, crossing the null near the median and becoming increasingly negative at higher quantiles. This pattern indicates that the mixture–BMI relationship is not constant across the joint exposure distribution and is better characterized by distribution-specific effects than by a single average slope.
Finally, the single-exposure attributable effects and interaction contrasts further reinforced the central role of blood lead and the secondary contribution of window dust lead. Blood lead produced the largest single-variable effect across quantile settings and showed stronger interaction contrasts when other exposures were held at higher levels, consistent with amplification under higher co-exposure conditions. Window dust lead showed moderate attributable effects with quantile-dependent variation, while floor dust lead and urinary lead contributed little in these BKMR-derived effect summaries.
4.2. Pathway-Specific Interpretation
Environmental lead exposure through ingestion or inhalation of fine particles present in household dust represents one pathway through which lead may influence this regulatory system. Window dust lead and floor dust lead are often underrecognized sources of exposure, as accumulated dust may persist in indoor environments and be disturbed during routine household activities, resulting in repeated low-level exposure over time [8]. Prior work suggests that even low-level lead exposure below the reference blood lead concentrations may influence cardiometabolic-related markers [18,19,20]. Lead exposure may influence BMI through several interconnected biological mechanisms. Lead is known to disrupt endocrine signaling, including interference with hypothalamic–pituitary axis regulation, which can alter appetite control and energy homeostasis [21,22]. It can induce oxidative stress and systemic inflammation, both of which impair insulin signaling and glucose metabolism, potentially contributing to alterations in adiposity and body composition [23,24]. Lead also interferes with mitochondrial function and cellular energy production, which may affect basal metabolic rate and lipid metabolism. At the neurobehavioral level, lead-related dopaminergic disruption may influence reward pathways and eating behaviors. Collectively, these mechanisms suggest that lead exposure could modify BMI through metabolic, endocrine, inflammatory, and neurobehavioral pathways [14,25,26].
In the present analysis, BKMR identified blood lead as a primary contributor to BMI, indicating greater relative importance of internal lead burden within the exposure mixture for BMI outcomes. This pattern is consistent with the hypothesis that circulating lead may differentially influence systemic metabolic and endocrine pathways, which are more closely related to energy balance regulation, adipocyte function, and insulin-mediated glucose metabolism than are external environmental reservoirs of lead [27]. Because blood lead reflects bioavailable, physiologically active exposure, it may better capture the fraction of lead capable of interacting with metabolic tissues and neuroendocrine regulatory systems that influence body mass.
4.3. Importance of Evaluating Lead Exposure Pathways
These findings underscore the importance of evaluating lead exposure across multiple pathways. Although lead is a single toxicant, distinct environmental reservoirs and biological processes capture different aspects of timing, intensity, and internal dose, resulting in overlapping but non-identical exposure pathways [28].
Analyses that explore a single pathway may provide an incomplete characterization of lead-related health effects, as they fail to distinguish between environmental and other potential sources of exposure. Such approaches can obscure pathway-specific relationships and lead to imprecise or misleading interpretations of risk [29]. Evaluating lead exposure across multiple pathways allows for a more comprehensive assessment of how different exposure metrics relate to cardiometabolic outcomes.
In the present study, window dust lead and floor dust lead were examined as indicators of residential environmental lead reservoirs, alongside blood and urinary lead as markers of internal exposure. Linear regression analyses provided initial insight into associations between individual exposure indicators and BMI. Blood lead (β = −0.485; 95% CI: −0.566, −0.405) and window dust lead (β = −0.00047; 95% CI: −0.00067, −0.00026) were significantly inversely associated with BMI, whereas floor dust lead was positively associated with BMI (β = 0.258; 95% CI: 0.209, 0.306). Urinary lead demonstrated an inverse but non-significant association (β = −0.111; 95% CI: −0.235, 0.013).
The observed inverse association between blood lead and BMI indicates that individuals with higher circulating lead concentrations tended to have lower body mass index in this cross-sectional sample. While this direction may appear counterintuitive several practical explanations may account for this pattern. First, lead exposure is socially patterned and often concentrated in older housing and lower-resource environments, where nutritional quality, food security, and overall caloric intake may differ from higher-income settings [30]. Second, lead has been shown in experimental models to interfere with metabolic and endocrine signaling pathways involved in appetite regulation, energy utilization, and adipocyte differentiation, which could plausibly influence body mass. Third, reverse causation is possible in cross-sectional data; BMI may influence lead toxicokinetics, including distribution and mobilization from bone stores, thereby affecting circulating blood lead concentrations [31,32].
Importantly, the inverse association does not imply a protective effect of lead exposure. Rather, it suggests that circulating lead burden may be associated with differences in body composition or metabolic regulation within the observed exposure range. The mixture modeling results further indicate that this relationship varies across joint exposure levels, reinforcing that the association is context-dependent rather than uniformly linear.
Overall, these findings indicate heterogeneous associations across lead matrices. However, the linear and additive assumptions inherent to conventional regression limit the ability to characterize nonlinear exposure–response relationships or interactions among correlated exposure pathways within the mixture.
By incorporating multiple lead exposure pathways within a mixture-based modeling framework, this analysis was able to better characterize the relative contributions of environmental reservoirs and BMI. These results underscore the value of pathway-specific evaluation when assessing the cardiometabolic effects of lead exposure and support the use of analytic approaches that can accommodate complex, pathway-dependent exposure–response relationships.
The use of Bayesian Kernel Machine Regression allowed for the identification of complex and nonlinear exposure–response relationships that would not be captured under linear modeling assumptions. This is particularly relevant in toxicology-focused research, where phenomena such as threshold behavior and nonmonotonic responses are well documented and may yield apparent associations that do not follow linear trends [33]. In the present study, these nonlinear patterns were evident in the univariate exposure–response functions generated for BMI.
Univariate BKMR patterns suggest that the association between lead exposure and BMI is not uniformly linear across exposure levels and may reflect differential biological responsiveness across the distribution. The modest nonlinearity observed for blood and window lead, coupled with widening credible intervals at higher concentrations, indicates that circulating lead may exert variable metabolic influence depending on exposure magnitude, although precision declines in the upper tail where fewer observations are available [34,35,36]. This is consistent with the concept that internal dose, rather than environmental reservoir measures alone, may better capture biologically active lead capable of influencing systemic metabolic pathways [37]. The largely flat exposure–response functions for urinary lead and floor dust lead further support the inference that these indicators contribute little incremental information beyond blood lead within the multipollutant framework.
Collectively, these findings reinforce the importance of modeling exposure mixtures flexibly. While conventional regression identified statistically significant linear associations for several indicators, the BKMR results indicate that the mixture signal for BMI is primarily driven by blood lead. These patterns are consistent with PIP results, which identified blood lead as the dominant mixture contributor.
The bivariate BKMR surfaces and quantile-stratified curves suggest that the mixture–BMI relationship is driven primarily by internal lead burden and that the joint signal is most apparent when blood lead co-occurs with higher residential dust lead, particularly window dust lead. This finding is consistent with prior work by Hernandez-Mendoza et al., which found associations between serum lead and overweight and obesity [15]. Our findings extend this literature by indicating that the association is not strictly additive and may vary across joint exposure strata, which standard linear models are not designed to detect.
Across panels, the most visually prominent interaction structure involved blood lead and window dust lead, where the exposure–response curves showed greater separation at the 0.75 quantile of the conditioning exposure. This pattern is biologically plausible because blood lead reflects the bioavailable internal dose, while window dust lead may represent an ongoing residential reservoir that can contribute to repeated ingestion/inhalation and sustained internal exposure [38]. In that sense, elevated dust lead could act as a marker of persistent exposure conditions under which the metabolic consequences of internal lead burden may be more detectable. Overall, window dust lead exhibited localized nonlinearity with wide credible intervals in the tails.
In contrast, bivariate curves involving urinary lead and floor dust lead were comparatively flat. This aligns with our PIP results (urine lead and floor dust lead ≈ 0) and suggests that—conditional on blood lead and window dust—these measures contributed little incremental information about BMI variation in this dataset. One interpretation is that urinary lead may be a noisier marker of internal burden at low environmental levels (and may reflect different kinetics), while floor dust lead may capture exposure pathways less tightly coupled to circulating lead than window dust in this cycle’s subsample.
Taken together, the results support a coherent message: the mixture signal for BMI is structured, with the strongest joint patterns emerging when blood lead is considered alongside window dust lead. This mixture-dependent patterning is consistent with the broader view that metabolic outcomes can reflect nonlinear responses and context-dependent effects rather than single-exposure linear relationships, particularly when exposures are correlated and represent distinct biological and environmental domains.
The single-variable interaction analysis indicated that blood lead produced the largest change in BMI when increased from the 25th to the 75th percentile, across all fixed quantile levels of the remaining exposures. Window dust lead demonstrated moderate but quantile-dependent variation, with stronger negative estimates when other lead metrics were held at higher levels, suggesting interaction under elevated co-exposure conditions. In contrast, urinary lead and floor dust lead produced estimates centered near zero with overlapping confidence intervals across quantile strata, indicating minimal interaction-driven contribution within the mixture framework. These results suggest that higher blood lead levels in the context of elevated window dust lead are associated with stronger BMI deviations than individuals with similar blood lead levels but lower environmental dust contamination.
4.4. Public Health and Policy Implications
Distinct associations between environmental dust lead and blood lead with BMI indicate differential exposure-domain contributions within the lead mixture. These findings support strengthened oversight and mitigation efforts in older housing to reduce residential lead exposure risk [13]. Under the Residential Lead-Based Paint Hazard Reduction Act of 1992, property owners are required to disclose known or potential lead hazards, but no mandatory remediation or inspection is required [3]. Expanded inspection and remediation requirements could further reduce exposure in older housing [39]. Mandating inspection and remediation policies could improve resident awareness of household hazards and reduce unsafe cleaning practices that may increase exposure. Clearer guidance on chronic low-level exposure may improve public understanding of risk. Although average blood lead levels have declined substantially over time, continued efforts to minimize exposure remain warranted [40].
Regulatory benchmarks for dust lead have become progressively more stringent. While hazard standards were historically defined as 10 µg/ft2 for interior floors and 100 µg/ft2 for windowsills, the EPA finalized a 2024 rule redefining dust-lead hazards as any reportable level, with implementation required by January 2026. In addition, post-abatement action levels were reduced to 5 µg/ft2 for floors and 40 µg/ft2 for interior windowsills [41]. In the present study, mean floor dust (0.96 µg/ft2) and window dust (36.74 µg/ft2) concentrations were below former hazard thresholds and below current post-abatement action levels. Mean blood lead concentrations (1.85 µg/dL) were also below the current CDC reference value. Accordingly, the observed associations occurred at relatively low environmental exposure levels within a regulatory context that increasingly recognizes the absence of a safe lead threshold.
Finally, although biological effects of lead are mediated through systemic circulation, household dust lead may reflect broader residential and neighborhood conditions that are independently associated with BMI. Environmental disrepair, aging housing stock, and structural disadvantage may co-occur with elevated indoor dust contamination and influence dietary behaviors, physical activity, and stress-related metabolic processes. Accordingly, dust lead may function both as an exposure reservoir and as a contextual environmental indicator, which may not be fully captured by circulating blood lead levels alone.
4.5. Strengths
This study uses data from NHANES and applies a mixture-based modeling approach to jointly evaluate environmental and biological lead exposure measures in relation to continuous BMI outcomes. The availability of a large national survey dataset enabled the application of complementary analytic approaches, including linear regression, Spearman correlation, and Bayesian Kernel Machine Regression. Conventional regression and correlation analyses were used to characterize linear and monotonic associations between individual lead exposure measures and continuous BMI outcomes, while BKMR was employed to examine potential non-linear exposure–response patterns and joint effects within the lead exposure mixture. The integration of multiple analytic methods, together with the concurrent evaluation of biological biomarkers (blood and urinary lead) and environmental indicators (floor and window dust lead), provides a comprehensive assessment of lead-related exposure domains relevant to BMI variation.
Overall, conventional linear regression identified blood lead, window dust lead, and floor dust lead as significant contributors to BMI, with floor dust lead showing a particularly strong association in the single-model framework. In contrast, the BKMR mixture analysis indicated that the primary contributors within the exposure mixture were blood lead and window dust lead. This difference likely reflects the distinction between marginal regression estimates and conditional mixture modeling. Linear regression evaluates each exposure under linear and additive assumptions, whereas BKMR simultaneously models correlated exposures and potential nonlinear relationships within the mixture. Under this framework, shared mixture signal may be preferentially attributed to the exposure that best explains the joint pattern of variation (here blood lead and, to a lesser extent, window dust lead), which can reduce the apparent contribution of correlated indicators such as floor dust lead when evaluated within the mixture context.
4.6. Limitations
Several limitations should be considered when interpreting these findings. First, the cross-sectional study design precludes inference regarding temporality or causality between biological or environmental lead exposure measures and BMI [42]. Also, since the data is reflective of only one point in time it is difficult to fully capture the implications of chronic exposure, which would require a longitudinal study [43]. An additional limitation is that residential dust lead measurements were available only for a subset of participants, which may have reduced statistical power and introduced potential selection bias. In addition, residual confounding cannot be ruled out, including the influence of underlying health conditions or unmeasured behavioral factors that may affect BMI levels [44,45].
Furthermore, BMI was used as the primary outcome measure. Although BMI is widely used in epidemiologic studies and is associated with cardiovascular disease and mortality risk [46,47], it does not distinguish between fat mass and lean mass or capture fat distribution. As a result, BMI may not fully reflect underlying metabolic dysfunction, potentially leading to exposure–outcome relationships that differ from those observed using more precise adiposity or cardiometabolic biomarkers.
Additionally, participants may have been exposed to lead through multiple pathways beyond indoor dust, including legacy lead-based paint, contaminated soil, drinking water from aging infrastructure, dietary intake, tobacco smoke, occupational exposure, and ambient air. Biological biomarkers such as blood and urinary lead reflect integrated exposure from all sources, whereas household dust lead represents a specific residential environmental reservoir. Accordingly, dust measures should be interpreted as one component of a broader exposure profile rather than as the sole source of lead burden.
4.7. Future Directions
Future studies should prioritize longitudinal cohort designs with repeated assessment of environmental and biological lead exposure mixtures to better characterize chronic exposure patterns and their temporal associations with BMI [43].
5. Conclusions
In summary, this study provides evidence that internal and residential lead exposure pathways are differentially associated with BMI in a nationally representative population. Mixture modeling results suggest that circulating blood lead concentrations contribute most strongly to the overall exposure signal, highlighting the importance of internal biomarkers when evaluating cardiometabolic effects of environmental lead exposure. These findings underscore the continued relevance of lead exposure as a public health concern and support the need for integrated environmental and biological monitoring strategies when investigating metabolic health outcomes.
Author Contributions
Conceptualization, E.O.-G.; methodology, E.O.-G.; formal analysis, Z.W. and E.O.-G.; investigation, Z.W. and E.O.-G.; resources, E.O.-G.; data curation, Z.W. and E.O.-G.; writing—original draft preparation, Z.W. and E.O.-G.; writing—review and editing, Z.W. and E.O.-G.; supervision, E.O.-G.; project administration, E.O.-G.; funding acquisition, E.O.-G. All authors have read and agreed to the published version of the manuscript.
Funding
This publication was supported by the Centers for Medicare & Medicaid Services (CMS) of the U.S. Department of Health and Human Services (HHS) and the Office of Naval Research (ONR) under Award Numbers 1W1CMS331929-01-00 and N00014-25-12363. The contents are solely the responsibility of the author(s) and do not necessarily represent the official views of, nor imply endorsement by, CMS, HHS, or ONR.
Data Availability Statement
The data presented in this study are openly available on the CDC NHANES site at https://wwwn.cdc.gov/nchs/nhanes/continuousnhanes/overview.aspx?BeginYear=2001 (accessed on 8 February 2026).
Conflicts of Interest
The authors declare no conflicts of interest.
References
- Jonasson, M.E.; Afshari, R. Historical documentation of lead toxicity prior to the 20th century in English literature. Hum. Exp. Toxicol. 2018, 37, 775–788. [Google Scholar] [CrossRef] [Scilit] [PubMed]
- Flora, G.; Gupta, D.; Tiwari, A. Toxicity of lead: A review with recent updates. Interdiscip. Toxicol. 2012, 5, 47–58. [Google Scholar] [CrossRef] [Scilit] [PubMed]
- Lanphear, B.P.; Matte, T.D.; Rogers, J.; Clickner, R.P.; Dietz, B.; Bornschein, R.L.; Succop, P.; Mahaffey, K.R.; Dixon, S.; Galke, W.; et al. The contribution of lead-contaminated house dust and residential soil to children’s blood lead levels. A pooled analysis of 12 epidemiologic studies. Environ. Res. 1998, 79, 51–68. [Google Scholar] [CrossRef] [Scilit] [PubMed]
- Nriagu, J.O. Clair Patterson and Robert Kehoe’s paradigm of “show me the data” on environmental lead poisoning. Environ. Res. 1998, 78, 71–78. [Google Scholar] [CrossRef] [Scilit]
- Wani, A.L.; Ara, A.; Usmani, J.A. Lead toxicity: A review. Interdiscip. Toxicol. 2015, 8, 55–64. [Google Scholar] [CrossRef] [Scilit]
- Chen, T.; Dai, K.; Wu, H. Effect of lead exposure on respiratory health: A systematic review and meta-analysis. Air Qual. Atmos. Health 2024, 17, 3031–3044. [Google Scholar] [CrossRef] [Scilit]
- Gonzalez-Villalva, A.; Marcela, R.-L.; Nelly, L.-V.; Patricia, B.-N.; Guadalupe, M.-R.; Brenda, C.-T.; Maria Eugenia, C.-V.; Martha, U.-C.; Isabel, G.-P.; Fortoul, T.I. Lead systemic toxicity: A persistent problem for health. Toxicology 2025, 515, 154163. [Google Scholar] [CrossRef] [Scilit]
- Sowers, T.D.; Blackmon, M.D.; Wilkin, R.T.; Rovero, M.; Bone, S.E.; Jerden, M.L.; Nelson, C.M.; Bradham, K.D. Lead Speciation, Bioaccessibility, and Sources for a Contaminated Subset of House Dust and Soils Collected from Similar United States Residences. Environ. Sci. Technol. 2024, 58, 9339–9349. [Google Scholar] [CrossRef] [Scilit]
- Yao, W.; Gallagher, D.L.; Gohlke, J.M.; Dietrich, A.M. Children and adults are exposed to dual risks from ingestion of water and inhalation of ultrasonic humidifier particles from Pb-containing water. Sci. Total Environ. 2021, 791, 148248. [Google Scholar] [CrossRef] [Scilit]
- Braun, J.M.; Yolton, K.; Newman, N.; Jacobs, D.E.; Taylor, M.; Lanphear, B.P. Residential dust lead levels and the risk of childhood lead poisoning in United States children. Pediatr. Res. 2021, 90, 896–902. [Google Scholar] [CrossRef] [Scilit]
- Klotz, K.; Göen, T. Human Biomonitoring of Lead Exposure. Met. Ions Life Sci. 2017, 17, 99–121. [Google Scholar] [CrossRef] [Scilit]
- Ho, W.C.; Lin, Y.S.; Caffrey, J.L.; Faramawi, M.F. Evaluation of lead body burden in US adolescents. Arch. Environ. Occup. Health 2022, 77, 219–226. [Google Scholar] [CrossRef] [Scilit] [PubMed]
- Rentschler, G.; Broberg, K.; Lundh, T.; Skerfving, S. Long-term lead elimination from plasma and whole blood after poisoning. Int. Arch. Occup. Environ. Health 2012, 85, 311–316. [Google Scholar] [CrossRef] [Scilit] [PubMed]
- Park, S.S.; Skaar, D.A.; Jirtle, R.L.; Hoyo, C. Epigenetics, obesity and early-life cadmium or lead exposure. Epigenomics 2017, 9, 57–75. [Google Scholar] [CrossRef] [Scilit] [PubMed]
- Hernández-Mendoza, H.; Rios-Lugo, M.J.; Álvarez-Loredo, H.E.; Romero-Guzmán, E.T.; Gaytán-Hernández, D.; Martínez-Navarro, I.; Juárez-Flores, B.I.; Chang-Rueda, C. Serum lead levels and its association with overweight and obesity. J. Trace Elem. Med. Biol. 2022, 72, 126984. [Google Scholar] [CrossRef] [Scilit]
- Centers_for_Disease_Control_and_Prevention_(CDC). Laboratory Procedure Manual. Available online: https://wwwn.cdc.gov/nchs/nhanes/continuousnhanes/labmethods.aspx?Cycle=2001-2002 (accessed on 4 March 2026).
- Centers_for_Disease_Control_and_Prevention_(CDC). Laboratory Procedure Manual: Lead Dust Wipe Samples (NHANES 2001–2002). Available online: https://wwwn.cdc.gov/nchs/data/nhanes/public/2001/labmethods/l20_b_met_lead_dust.pdf (accessed on 4 March 2026).
- Kim, H.-J.; Joo, J.; Lee, S.; Nah, S.-S.; Jeong, D.-J.; Lee, S.-H.; Kim, N.S.; Lee, B.-K. Association between angiotensin converting enzyme polymorphism and lead-related hypertensive status in lead-exposed male workers from Korea. Mol. Cell. Toxicol. 2012, 8, 349–355. [Google Scholar] [CrossRef] [Scilit]
- World Health Organization. Recommendation on the Blood Lead Concentration that Should Initiate Clinical Interventions. WHO Guideline for Clinical Management of Exposure to Lead. 2021. Available online: https://www.ncbi.nlm.nih.gov/books/NBK575284/ (accessed on 4 March 2026).
- Wang, N.; Chen, C.; Nie, X.; Han, B.; Li, Q.; Chen, Y.; Zhu, C.; Chen, Y.; Xia, F.; Cang, Z. Blood lead level and its association with body mass index and obesity in China-Results from SPECT-China study. Sci. Rep. 2015, 5, 18299. [Google Scholar] [CrossRef] [Scilit]
- Liu, D.; Shi, Q.; Liu, C.; Sun, Q.; Zeng, X. Effects of endocrine-disrupting heavy metals on human health. Toxics 2023, 11, 322. [Google Scholar] [CrossRef] [Scilit]
- Singh, B.; Chandran, V.; Bandhu, H.K.; Mittal, B.R.; Bhattacharya, A.; Jindal, S.K.; Varma, S. Impact of lead exposure on pituitary-thyroid axis in humans. Biometals 2000, 13, 187–192. [Google Scholar] [CrossRef] [Scilit]
- Obeng-Gyasi, E. Lead exposure and oxidative stress—A life course approach in US adults. Toxics 2018, 6, 42. [Google Scholar] [CrossRef] [Scilit]
- Yun, S.; Wu, Y.; Niu, R.; Feng, C.; Wang, J. Effects of lead exposure on brain glucose metabolism and insulin signaling pathway in the hippocampus of rats. Toxicol. Lett. 2019, 310, 23–30. [Google Scholar] [CrossRef] [Scilit]
- Metryka, E.; Chibowska, K.; Gutowska, I.; Falkowska, A.; Kupnicka, P.; Barczak, K.; Chlubek, D.; Baranowska-Bosiacka, I. Lead (Pb) exposure enhances expression of factors associated with inflammation. Int. J. Mol. Sci. 2018, 19, 1813. [Google Scholar] [CrossRef] [Scilit]
- Egusquiza, R.J.; Blumberg, B. Environmental obesogens and their impact on susceptibility to obesity: New mechanisms and chemicals. Endocrinology 2020, 161, bqaa024. [Google Scholar] [CrossRef] [Scilit] [PubMed]
- Mitra, P.; Sharma, S.; Purohit, P.; Sharma, P. Clinical and molecular aspects of lead toxicity: An update. Crit. Rev. Clin. Lab. Sci. 2017, 54, 506–528. [Google Scholar] [CrossRef] [Scilit] [PubMed]
- Succop, P.; Bornschein, R.; Brown, K.; Tseng, C.-Y. An empirical comparison of lead exposure pathway models. Environ. Health Perspect. 1998, 106, 1577. [Google Scholar] [CrossRef] [Scilit] [PubMed]
- Mustafa, E.; Valente, M.J.; Vinggaard, A.M. Complex chemical mixtures: Approaches for assessing adverse human health effects. Curr. Opin. Toxicol. 2023, 34, 100404. [Google Scholar] [CrossRef] [Scilit]
- Muller, C.; Sampson, R.J.; Winter, A.S. Environmental inequality: The social causes and consequences of lead exposure. Annu. Rev. Sociol. 2018, 44, 263–282. [Google Scholar] [CrossRef] [Scilit]
- Tinkov, A.A.; Aschner, M.; Ke, T.; Ferrer, B.; Zhou, J.-C.; Chang, J.-S.; Santamaría, A.; Chao, J.C.; Aaseth, J.; Skalny, A.V. Adipotropic effects of heavy metals and their potential role in obesity. Fac. Rev. 2021, 10, 32. [Google Scholar] [CrossRef] [Scilit]
- Trayhurn, P.; Bing, C. Appetite and energy balance signals from adipocytes. Philos. Trans. R. Soc. B Biol. Sci. 2006, 361, 1237–1249. [Google Scholar] [CrossRef] [Scilit]
- Sdougkou, K.; Papazian, S.; Bonnefille, B.; Xie, H.; Edfors, F.; Fagerberg, L.; Uhlén, M.; Bergström, G.; Martin, L.J.; Martin, J.W. Longitudinal Exposomics in a Multiomic Wellness Cohort Reveals Distinctive and Dynamic Environmental Chemical Mixtures in Blood. Environ. Sci. Technol. 2024, 58, 16302–16315. [Google Scholar] [CrossRef] [Scilit]
- Obeng-Gyasi, E. Sources of lead exposure in various countries. Rev. Environ. Health 2019, 34, 25–34. [Google Scholar] [CrossRef] [Scilit]
- Klepeis, N.E.; Nelson, W.C.; Ott, W.R.; Robinson, J.P.; Tsang, A.M.; Switzer, P.; Behar, J.V.; Hern, S.C.; Engelmann, W.H. The National Human Activity Pattern Survey (NHAPS): A resource for assessing exposure to environmental pollutants. J. Expo. Sci. Environ. Epidemiol. 2001, 11, 231–252. [Google Scholar] [CrossRef] [Scilit] [PubMed]
- Sallsten, G.; Ellingsen, D.G.; Berlinger, B.; Weinbruch, S.; Barregard, L. Variability of lead in urine and blood in healthy individuals. Environ. Res. 2022, 212, 113412. [Google Scholar] [CrossRef] [Scilit] [PubMed]
- Kwon, Y.-K.; Kim, M.-J.; Choi, Y.J.; Yoon, S.H.; Oh, K.-S.; Shin, Y.M. Lead exposure estimation through a physiologically based toxicokinetic model using human biomonitoring data and comparison with scenario-based exposure assessment: A case study in Korean adults. Food Chem. Toxicol. 2024, 191, 114829. [Google Scholar] [CrossRef] [Scilit] [PubMed]
- Gaitens, J.M.; Dixon, S.L.; Jacobs, D.E.; Nagaraja, J.; Strauss, W.; Wilson, J.W.; Ashley, P.J. Exposure of US children to residential dust lead, 1999–2004: I. Housing and demographic factors. Environ. Health Perspect. 2008, 117, 461. [Google Scholar] [CrossRef] [Scilit]
- Lu, H.; Romero-Canyas, R.; Hiltner, S.; Neltner, T.; McCormick, L.; Niederdeppe, J. Research to Move Toward Evidence-Based Recommendations for Lead Service Line Disclosure Policies in Home Buying and Home Renting Scenarios. Int. J. Environ. Res. Public Health 2019, 16, 963. [Google Scholar] [CrossRef] [Scilit]
- Seeger, M.; McElmurry, S.P. Larger lessons from the Jackson Mississippi and Flint water crises. Nat. Water 2023, 1, 317–318. [Google Scholar] [CrossRef] [Scilit]
- U.S. Environmental Protection Agency. Hazard Standards and Clearance Levels for Lead: Lead Paint, Dust, and Soil—TSCA Sections 402 and 403. Available online: https://www.epa.gov/lead/hazard-standards-and-clearance-levels-lead-paint-dust-and-soil-tsca-sections-402-and-403#:~:text=The%20strengthened%20standards%20became%20effective,%CE%BCg/ft%C2%B2%20for%20window%20sills (accessed on 4 March 2026).
- Figueiredo, R.G.; Patino, C.M.; Ferreira, J.C. Cross-sectional studies: Understanding applications, methodological issues, and valuable insights. J. Bras. Pneumol. 2025, 51, e20250047. [Google Scholar] [CrossRef] [Scilit]
- Caruana, E.J.; Roman, M.; Hernández-Sánchez, J.; Solli, P. Longitudinal studies. J. Thorac. Dis. 2015, 7, E537–E540. [Google Scholar] [CrossRef] [Scilit]
- DeMaris, A. Combating unmeasured confounding in cross-sectional studies: Evaluating instrumental-variable and Heckman selection models. Psychol. Methods 2014, 19, 380–397. [Google Scholar] [CrossRef] [Scilit]
- Assimon, M.M. Confounding in Observational Studies Evaluating the Safety and Effectiveness of Medical Treatments. Kidney360 2021, 2, 1156–1159. [Google Scholar] [CrossRef] [Scilit]
- Mehran, L.; Honarvar, M.; Masoumi, S.; Khalili, D.; Azizi, F.; Blaha, M.J.; Amouzegar, A. The association of body mass index variability with cardiovascular disease and mortality: A mediation analysis of pooled cohorts. Front. Endocrinol. 2024, 15, 1345781. [Google Scholar] [CrossRef] [Scilit]
- Esfandiari, M.A.; Kazemzadeh, K.; Ansari, A.; Alishiri, G.; Afshari, S.; Daliri, S.; Saleh, M.; Balanian, S.; Tamannaeifar, R.; Niazi, A.; et al. Associations of variability in body mass index with cardiovascular outcomes in the general population: A systematic review. JRSM Cardiovasc. Dis. 2024, 13, 20480040241234149. [Google Scholar] [CrossRef] [Scilit]

Disclaimer/Publisher’s Note: The statements, opinions and data contained in all publications are solely those of the individual author(s) and contributor(s) and not of MDPI and/or the editor(s). MDPI and/or the editor(s) disclaim responsibility for any injury to people or property resulting from any ideas, methods, instructions or products referred to in the content. |
© 2026 by the authors. Licensee MDPI, Basel, Switzerland. This article is an open access article distributed under the terms and conditions of the Creative Commons Attribution (CC BY) license.