


Abstract
Air pollution during mass-gathering events such as festivals and firework shows is a growing concern globally. Fireworks at festivals on average almost double the observed particulate pollution levels, while food trucks and associated diesel generators are known to result in very local air pollution hotspots that are an emerging important area of research regarding sources of urban volatile organic compounds. This study adds to the scientific body of evidence of the impact of festival fireworks and cooking pollution in the USA by quantifying the impact of fireworks and cooking emissions during short summer festivals in June and July 2023 in Utah’s Salt Lake Valley using paired PM2.5, ozone, and BC sensors located at two distances nearby to the sources. Both fireworks and cooking increased PM2.5 and BC during the evening dinner and firework displays, while evening ozone was observed to drop during fireworks. The ozone concentration reductions during fireworks displays are likely associated with NOx titration due to fireworks and cooking emissions. Regulating fireworks and cooking emissions during annual festivals has resulted in significant reductions in PM2.5 pollution and corresponding benefits to human health. These findings can support policy decisions to reduce exposure to emissions locally.
1. Introduction
Air pollution during public temporary mass-gathering events such as festivals and firework shows is a growing concern globally. As discussed by Li, et al. [1], mass-gathering events, also known as “mega-events”, can have significant impacts on air quality and human health and are an active area of research. It is well known that ambient particulate matter (PM) levels can increase dramatically during and after festivals and fireworks displays, with fireworks noted as sometimes being the primary contributor to air pollution during some episodes [2]. Air pollution both indoors and outdoors is one of many concerns that can occur at these mass gatherings along with water supply and quality, sanitation and waste management, noise pollution, and public safety [3,4]. These events across the world include festivals, meetings, and tournaments [1]. Air pollution typically worsens at mass-gathering events.
1.1. Local Air Pollution from Festival Fireworks
Fireworks at festivals are a common mass-gathering pollution source that on average almost doubled (increase of ~90%) the particulate pollution levels [1]. In contrast, air pollution control measures implemented during some international meeting events resulted in a 44% decline in particulate matter pollution due to reductions in anthropogenic emissions resulting from the control actions.
As discussed by Yerramsetti, et al. [5], the “recreational use of fireworks to celebrate festivities all over the world is among the most unusual source of short-term anthropogenic pollution which causes serious health hazards.” A reduction in air quality during festivals using fireworks has been documented in many countries across the world, including Iran [6], Germany [7], the USA [8], Slovenia [9], and Brazil [10].
An expanding area of study in air pollution health science is the effects of fireworks on particulate matter pollution. Fireworks pollution can cause very large spikes in air pollution concentrations with acute respiratory and other health effects, and the increased PM from fireworks mainly consists of fine and ultrafine particles and may be more toxic than more coarse particles [2,11]. Fireworks combustion has been shown to result in emission of hazardous toxins such as heavy metal aerosols [12,13]. Extensive studies have focused on the air pollution from fireworks during festivals in India and China and other Asia-Pacific areas [14,15,16]. A near doubling in cardiovascular and respiratory mortality was noted during the 2010 Diwali festival fireworks near Delhi, India [17].
The chemicals emitted during fireworks burning have been shown to be variable and toxic, and include different volatile organic compounds (VOCs), sulfur dioxide (SO2), ammonia (NH3), nitrogen oxide (NO), black carbon (BC), and ethyl-benzene [18,19]. Acute health effects of fireworks were cough and fever, with respiratory and pulmonary disease along with cancer among the potential long-term health effects [20,21,22].
1.2. Local Air Pollution from Festival Cooking
Household cooking impacts on indoor air pollution have been actively studied over the past 20 years [23,24,25,26]. More recently, the impacts of cooking activities on outdoor air pollution have been researched. Carter, et al. [27] found that the impacts of indoor air pollution had a small but observable effect on the outdoor air pollution surrounding the homes in question. More importantly, outdoor cooking activities such as the use of outdoor cookstoves can be associated with much higher pollution emission rates than the use of indoor cooking devices, with significant localized neighborhood pollution impacts [28]. While outdoor cooking in less developed countries is often a primary concern, studies also show that outdoor cooking during festivals or from restaurants is a concern globally. For example, organic aerosols from areas with high densities of restaurants in Pittsburgh, Pennsylvania, were found to be associated with very high organic aerosol concentrations [29].
The food truck industry is growing rapidly in the United States [30]. Food trucks and associated diesel generators in conjunction with other polluting combustion engines are known to result in local air pollution hotspots [31]. The restaurant industry and its variable impacts on local air pollution outdoors have been areas of recent research, along with research focusing on indoor air pollution at restaurants [32,33]. Localized plumes from charcoal barbecuing, grilling and those with less air pollution control equipment emit the most pollution [34]. Song, et al. [35] found that BC and ultrafine PM particles were locally elevated in urban areas with restaurant cooking. While there have been some studies looking at the amount of pollution trapped within the food truck interior due to cooking and ventilation [30,36], very little research, to our knowledge, has been conducted on quantifying the impact of festival cooking pollution emissions on the local air pollution concentrations. This study is the first to our knowledge addressing outdoor cooking emission impacts on pollution in Utah.
1.3. A Study on Local Air Pollution from Temporary Events
This study adds to the scientific body of evidence of the impact of festival fireworks and cooking pollution in the USA. For firework air pollution, which is much more studied in comparison to cooking pollution, previous studies have found notable differences in various California counties, with lower U.S. Independence Day, July 4th PM noted in areas with stricter fireworks regulations and higher PM in areas with less regulation [37,38]. One of the challenges to understanding the impacts of fireworks pollution is that health data related to risks with firework pollution is limited, and incomplete information generally exists on the emission sources and spatial and temporal variability of firework pollution in any given region [2]. In Utah, a few limited research studies have been conducted on the impact of fireworks on local pollution. A recent study analyzed the isotopic composition of PM during the 4th of July holiday [39]. The protectiveness of indoor environments against firework pollutant episodes was analyzed for the 4 July 2020 fireworks event in Provo, Utah [40], and 4 July 2018 in Taylorsville, Utah [41]. The remaining studies in the literature did not focus specifically on fireworks, but some did note the signal observed from firework emissions [42].
In this study we document variations in fine particulate matter (PM2.5), ozone, and BC in the summer of 2023 at three locations in Utah’s Salt Lake Valley (SLV). We capture and highlight through case studies two types of elevated pollution events: local fireworks and cooking activity during summer festivals. During the local events, pollution contributions from both food trucks and fireworks were observed at two locations within 1000 m from the emission sources. We observed the general wind and transport patterns at the three locations. This study adds to the growing body of studies investigating the local impacts of fireworks on outdoor air pollution and is the first to document sub-kilometer-scale variability in the particulate pollution concentrations associated with fireworks. To our knowledge, this is the first study addressing food truck pollution impacts on pollution in Utah.
2. Materials and Methods
2.1. Study Period and Location
Air pollution was measured at 2–5 s intervals and aggregated at the minute scale during three events that took place between June and July 2023 (Table 1). All events were held outdoors and had food trucks on site. The nights when firework displays took place are listed in Table 1. PM2.5, ozone, and BC were measured at two locations on each site, except for WestFest, which did not have BC measurements. One location was closer to the food trucks or fireworks and was called “Near”, and the other was called “Far” as it was between 190 and 950 m beyond the Near sensor and further from the emission sources (Figure 1). The sensor locations were dependent on several factors, including equipment safety, access to electrical power, and distance from other pollution sources.
Table 1.
Event names, dates, firework dates, latitudes, and longitudes. All events had food trucks on site.
Figure 1.
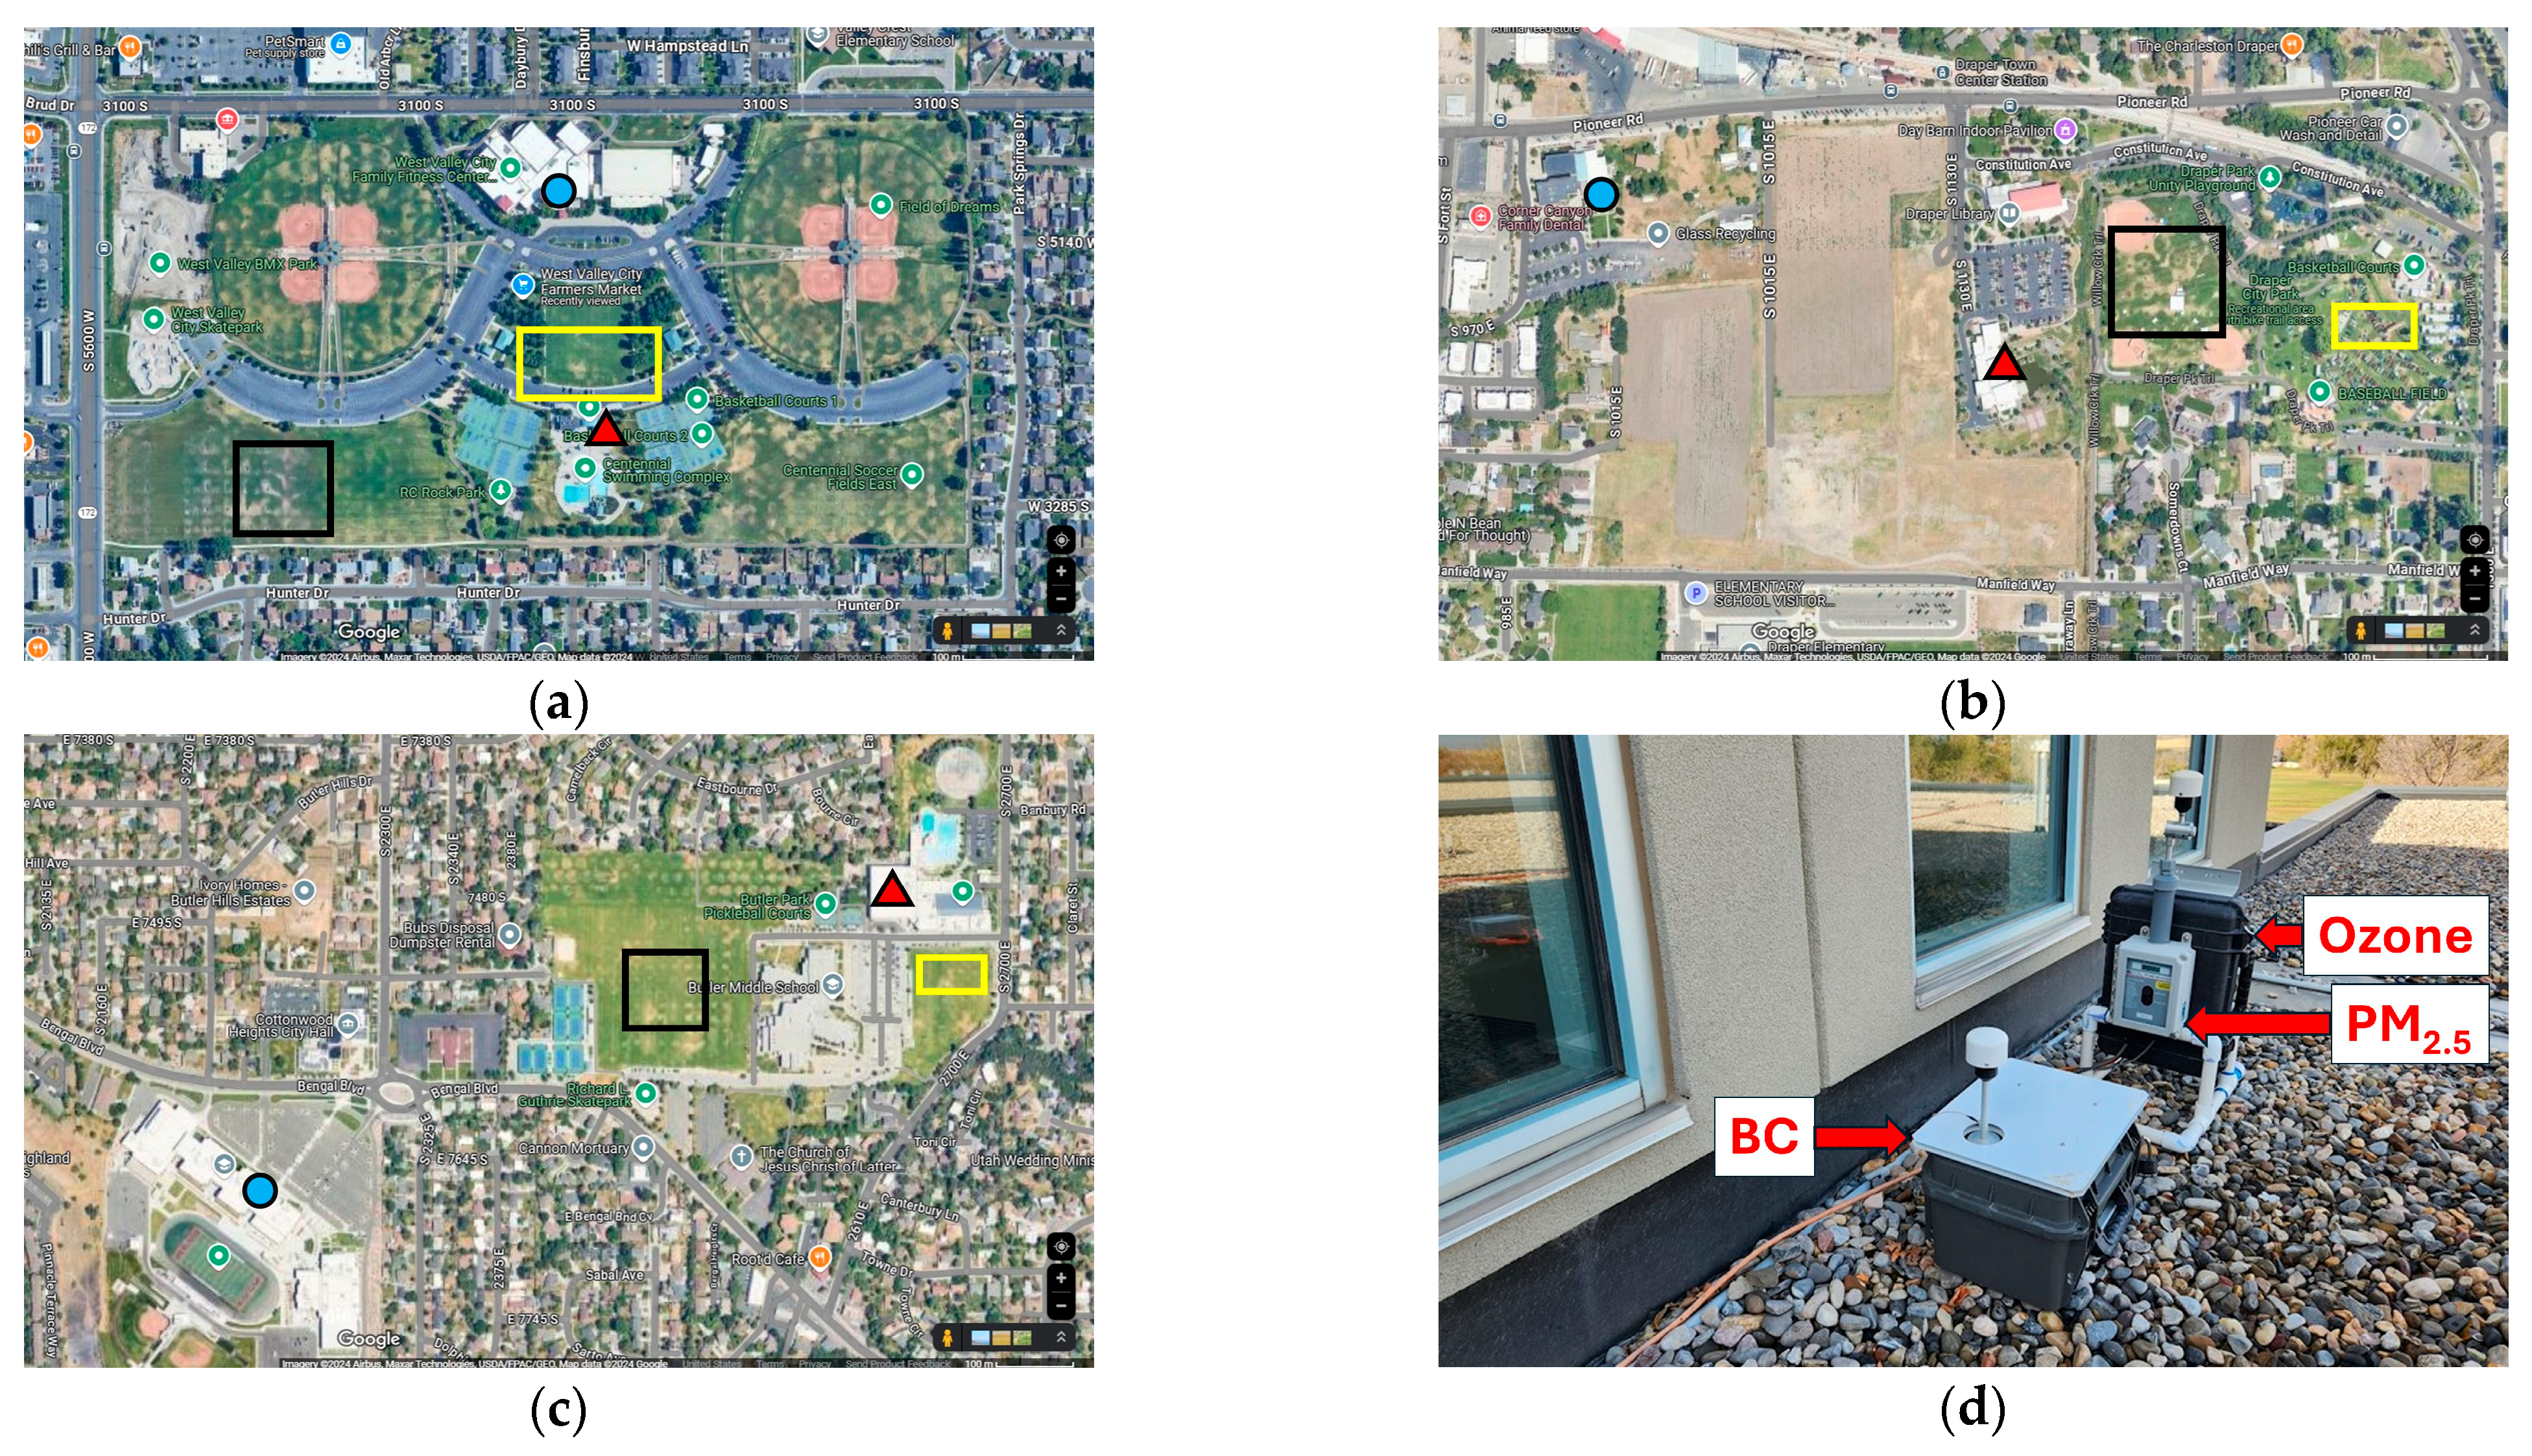
Location of events and sensor placement: (a) WestFest, (b) Draper Days, (c) Butlerville Days [43]. The red triangle and blue circle denote the locations of the Near and Far sensors, respectively; the yellow rectangle and black square denote the locations of the food vendors and fireworks, respectively. The equipment is shown in (d)—from left to right: MetOne Instruments C-12 BC monitor, MetOne Instruments ES-642 assembled with PM2.5 Cyclone, 2B Technologies Model 205 Ozone Monitor (inside Pelican case).
WestFest: The Near sensor was located approximately 40 m south of the food vendors and 200 m east-northeast of the fireworks site. The Far sensor was located approximately 190 m north of the Near sensor, 150 m north of the food vendors, and 400 m northeast of the fireworks site (Figure 1a). WestFest organizers estimated 35,000 people attended the event over the 4 festival days, with 18 food trucks and vendors [44,45].
Draper Days: The Near sensor was located approximately 350 m west of the food vendors and 150 m west of the fireworks site [46]. The Far sensor was located approximately 350 m west-northwest of the Near sensor, 700 m west of the food vendors, and 500 m west of the fireworks site (Figure 1b). It was estimated that approximately 47,300 people attended Draper Days during the length of the festival [47] and there were 13 food trucks and vendors present for the event [46].
Butlerville Days: The Near sensor was located approximately 150 m northwest of the food vendors and 300 m northeast of the fireworks site. The Far sensor was located approximately 950 m southwest of the Near sensor, 950 m west southwest of the food vendors, and 600 m southwest of the fireworks site [48] (Figure 1c).
2.2. Air Pollution and Meteorology
The research-grade instruments used for this study have the following measurement specifications:
- Met One Instruments Inc. (Grants Pass, OR, USA), ES-642 PM2.5 sensor: Measurement sensitivity: 1 µg m−3; nephelometer accuracy: ±5% traceable standard with 0.6 µm polystyrene latex (PSL) spheres [49];
- Met One Instruments Inc. (Grants Pass, OR, USA), C-12 BC monitor: Resolution: 0.1 ng m−3; lowest limit of detection: ≤70 ng m−3 [50];
- 2B Technologies Inc. (Broomfield, CO, USA), Model 205 Ozone Monitor: Resolution: 0.1 ppbv; precision (1σ; rms noise): greater of 1.0 ppbv or 2% of reading for 10 s average; accuracy: greater of 1.0 ppbv or 2% of reading [51].
The meteorological data (wind speed and wind direction) used for WestFest, Draper Days, and Butlerville Days was from the NAA, EW7701, and PC108 stations from the MesoWest network [52].
2.3. Data Analysis
The minute-aggregated air pollution data was analyzed for two time periods. The Fireworks period was from 22:00 to 23:59 as all fireworks shows started at 22:00 and lasted between 20 and 30 min. The Cooking period was between 17:00 and 21:59 as food vendors were fully operational by 17:00. The days were separated into “Festival” and “Non-Festival” days according to Table 1. Student’s t-Test was used to compare pollutant concentrations for the same time periods across festival and non-festival days. Time series of minute-resolved PM2.5 and ozone were plotted to resolve the short-term variability in pollutants, while the 24 h (8 h) air quality index (AQI) levels were also plotted for PM2.5 (ozone) for comparison to regulatory thresholds for these levels.
3. Results
3.1. WestFest
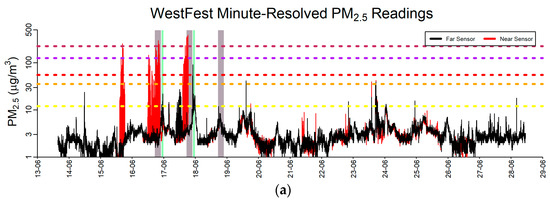
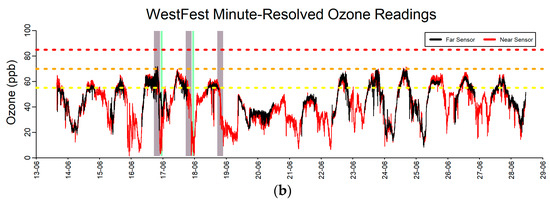
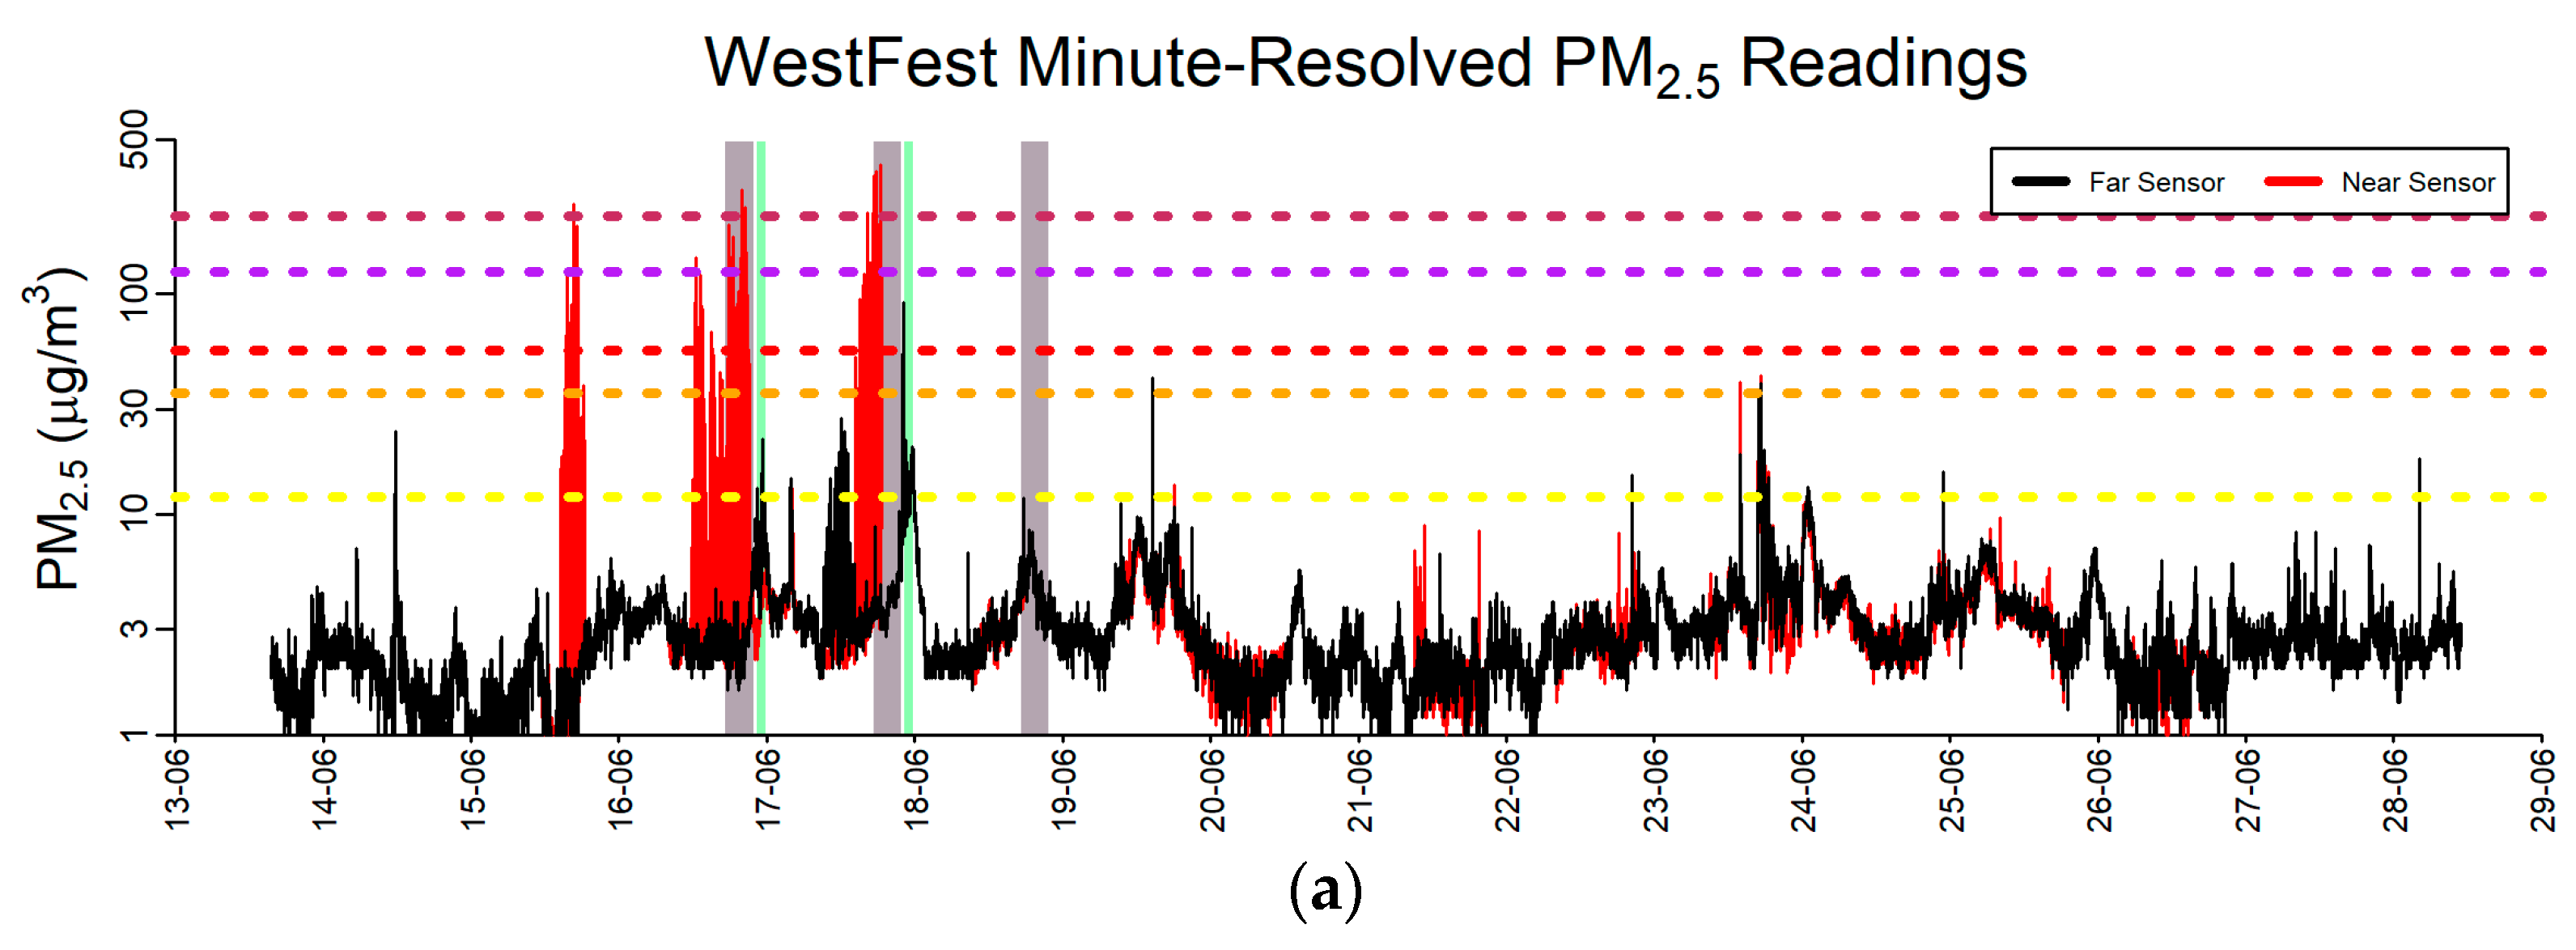
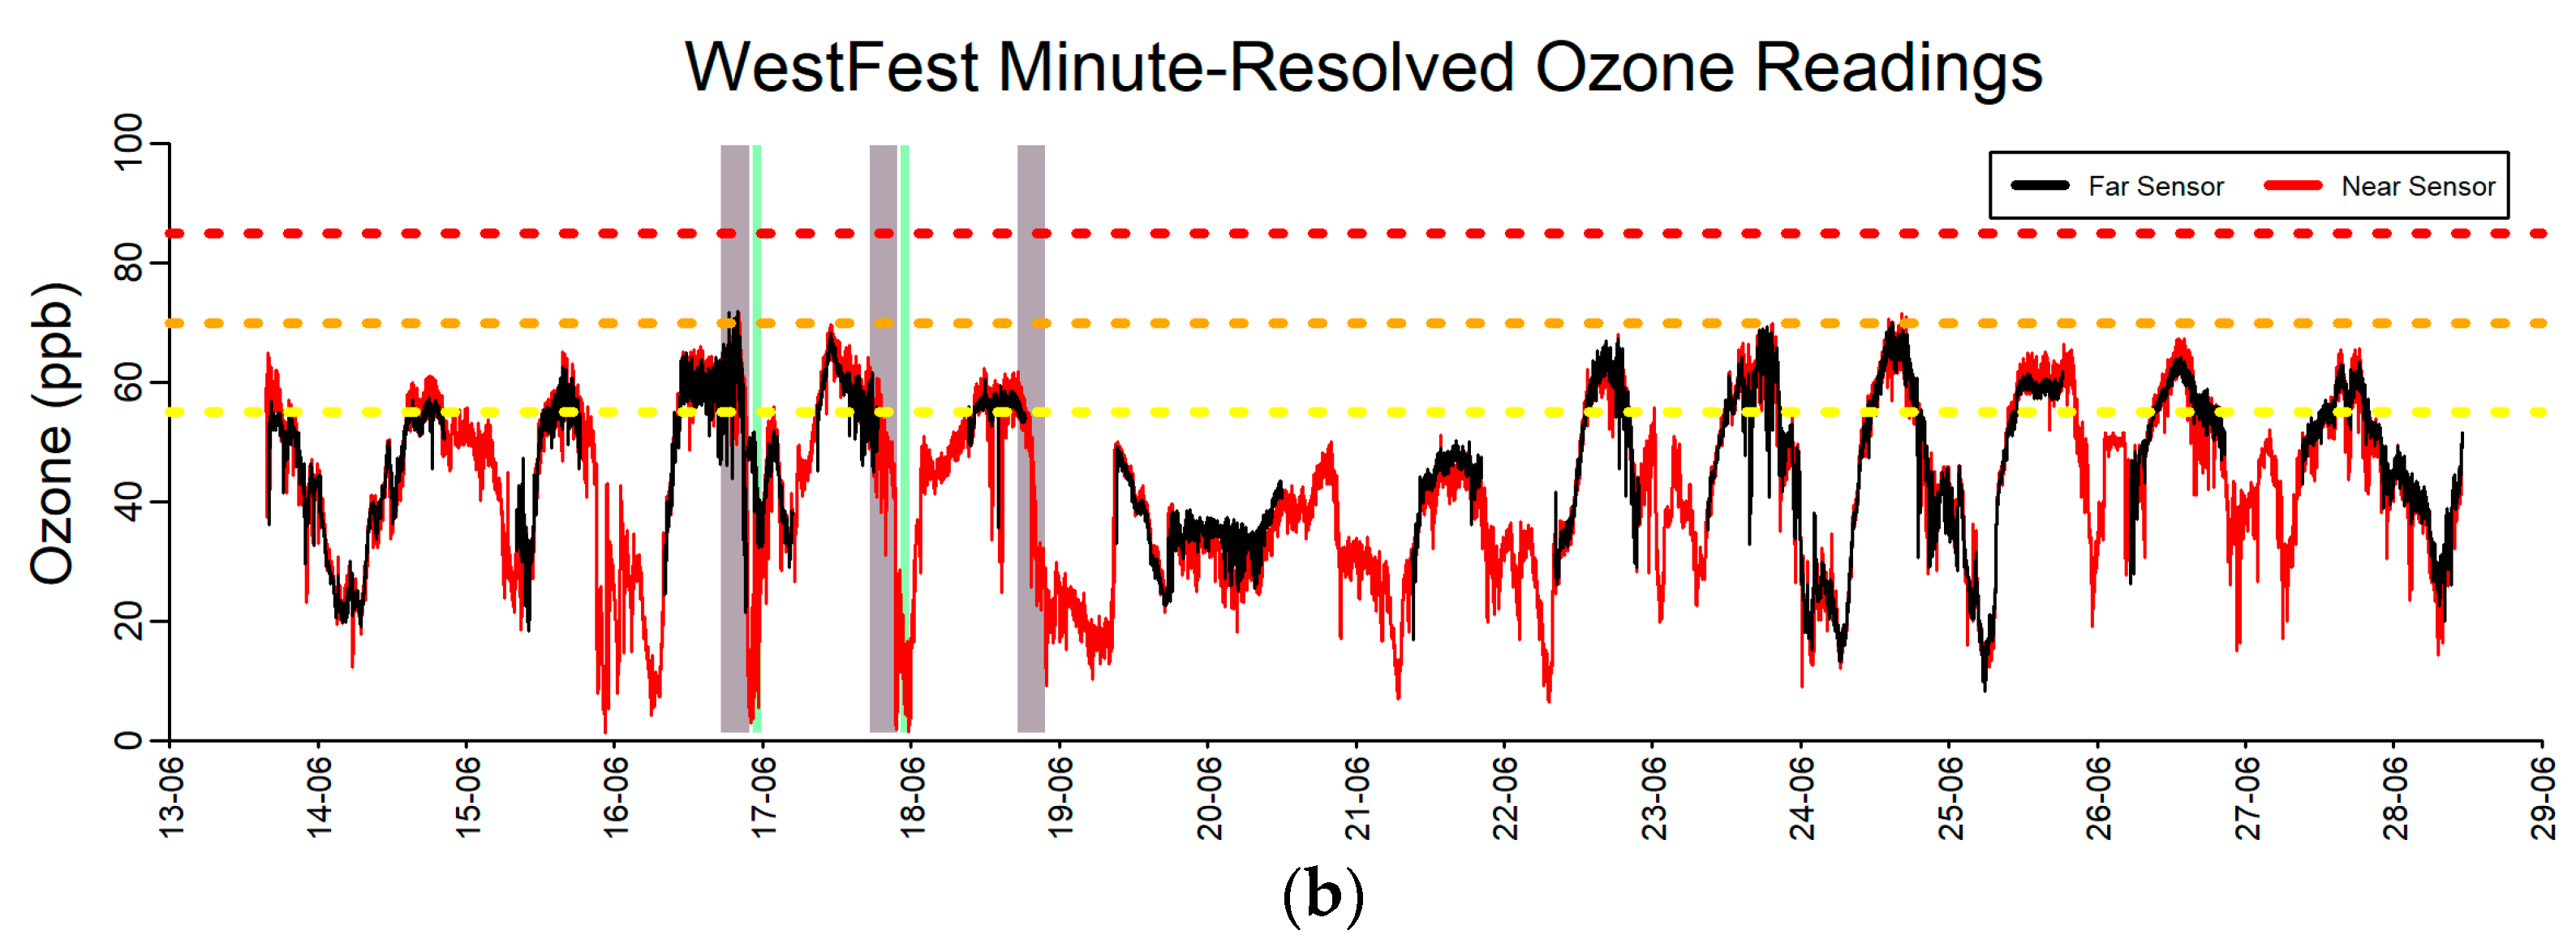
The WestFest time series event results are shown in Figure 2. The PM2.5 measurements (Figure 2a) clearly show the pronounced negative air quality impact of the firework events which took place in the evenings of 16–17 June, particularly on the Near sensor readings, which have a maximum value of 384.8 µg m−3. PM2.5 associated with cooking activity is also notable in Figure 2a during the afternoon and evening hours, also most clearly at the Near sensor, which was located directly adjacent to the food trucks. During the second fireworks event, on 17 June, the Near PM2.5 sensor suffered a malfunction, and no further data was collected from it during the fireworks event; however, data was available for the following days. The ozone concentrations were similar at both sites (Figure 2b) and showed the typical summertime diurnal cycles, with higher levels of ozone in the afternoon associated with photochemical ozone production, and decreased ozone levels below background in the nighttime associated with NOx titration from urban (likely vehicular) emissions, although the fireworks events also appear to modulate the ozone concentrations.
Figure 2.
Full study period minute-resolved (a) PM2.5 and (b) ozone time series for WestFest. The black line shows the “Far” sensor values and the red line represents the “Near” sensor values. The grey and green shaded periods represent Cooking and Fireworks periods, respectively. The horizontal lines on the PM2.5 figure denote the breakpoints for each of the 24 h air quality index (AQI) levels and the horizontal lines on the ozone figure denote the breakpoints for the 8 h AQI levels [53].
Table 2 shows that there are substantial differences in both PM2.5 and ozone levels recorded at the Far sensor during firework events and non-firework event nights, with PM2.5 elevated and ozone reduced during firework nights. Cooking hours during the festival average nearly 10 times the PM2.5 concentration at the Near site than similar hours on days when the festival is not taking place, while the Far site has only slightly elevated PM2.5 concentration, showing the very localized impact of food truck cooking emissions on particulate levels. The ozone readings at both sites during cooking hours are comparatively similar during both festival and non-festival days.
Table 2.
Event and analysis period results for the WestFest study sensors. * indicates p < 0.001.
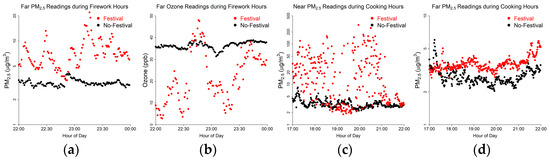
The minute-averaged results for selected subsets of data are shown in Figure 3. The firework events during festival days result in higher PM2.5 readings at the Far sensor, with multiple peaks following the 22:00 start (Figure 3a). Ozone displays an opposite pattern, with lower readings during the PM2.5 peaks (Figure 3b). Cooking hour PM2.5 readings are markedly higher on festival days at the Near site than on non-festival days (Figure 3c); the difference is present, but to a lesser extent, at the Far site (Figure 3d). The Near site also shows large variability in the PM2.5 readings during the festival days, illustrating the large temporal changes in pollutant measurements depending on various factors such as cooking intensity and atmospheric stability [54].
Figure 3.
Pollutant concentration sensor comparison during WestFest and non-festival days for (a) fireworks Far PM2.5, (b) fireworks Far ozone, (c) cooking Near PM2.5, and (d) cooking Far PM2.5.
The wind roses presented in Figure A3, show that there are relatively minor differences in the observed flow patterns between the festival and non-festival time periods. Since WestFest and the other study festivals were only between 2 and 3 days and the non-festival study period was substantially longer, it is expected that there would be more variation in the wind patterns during the non-festival period. Salt Lake County has notable topographic features and meteorological patterns including valley, canyon and slope flows and lake breezes from the Great Salt Lake that have large spatiotemporal variability [55,56]. The meteorological stations were relatively proximal to each site (<1 km) and could reflect the general conditions; however, hyperlocal measurements are unavailable; therefore, we use these wind roses as the available data to provide general understanding of the adjacent meteorological conditions.
3.2. Draper Days
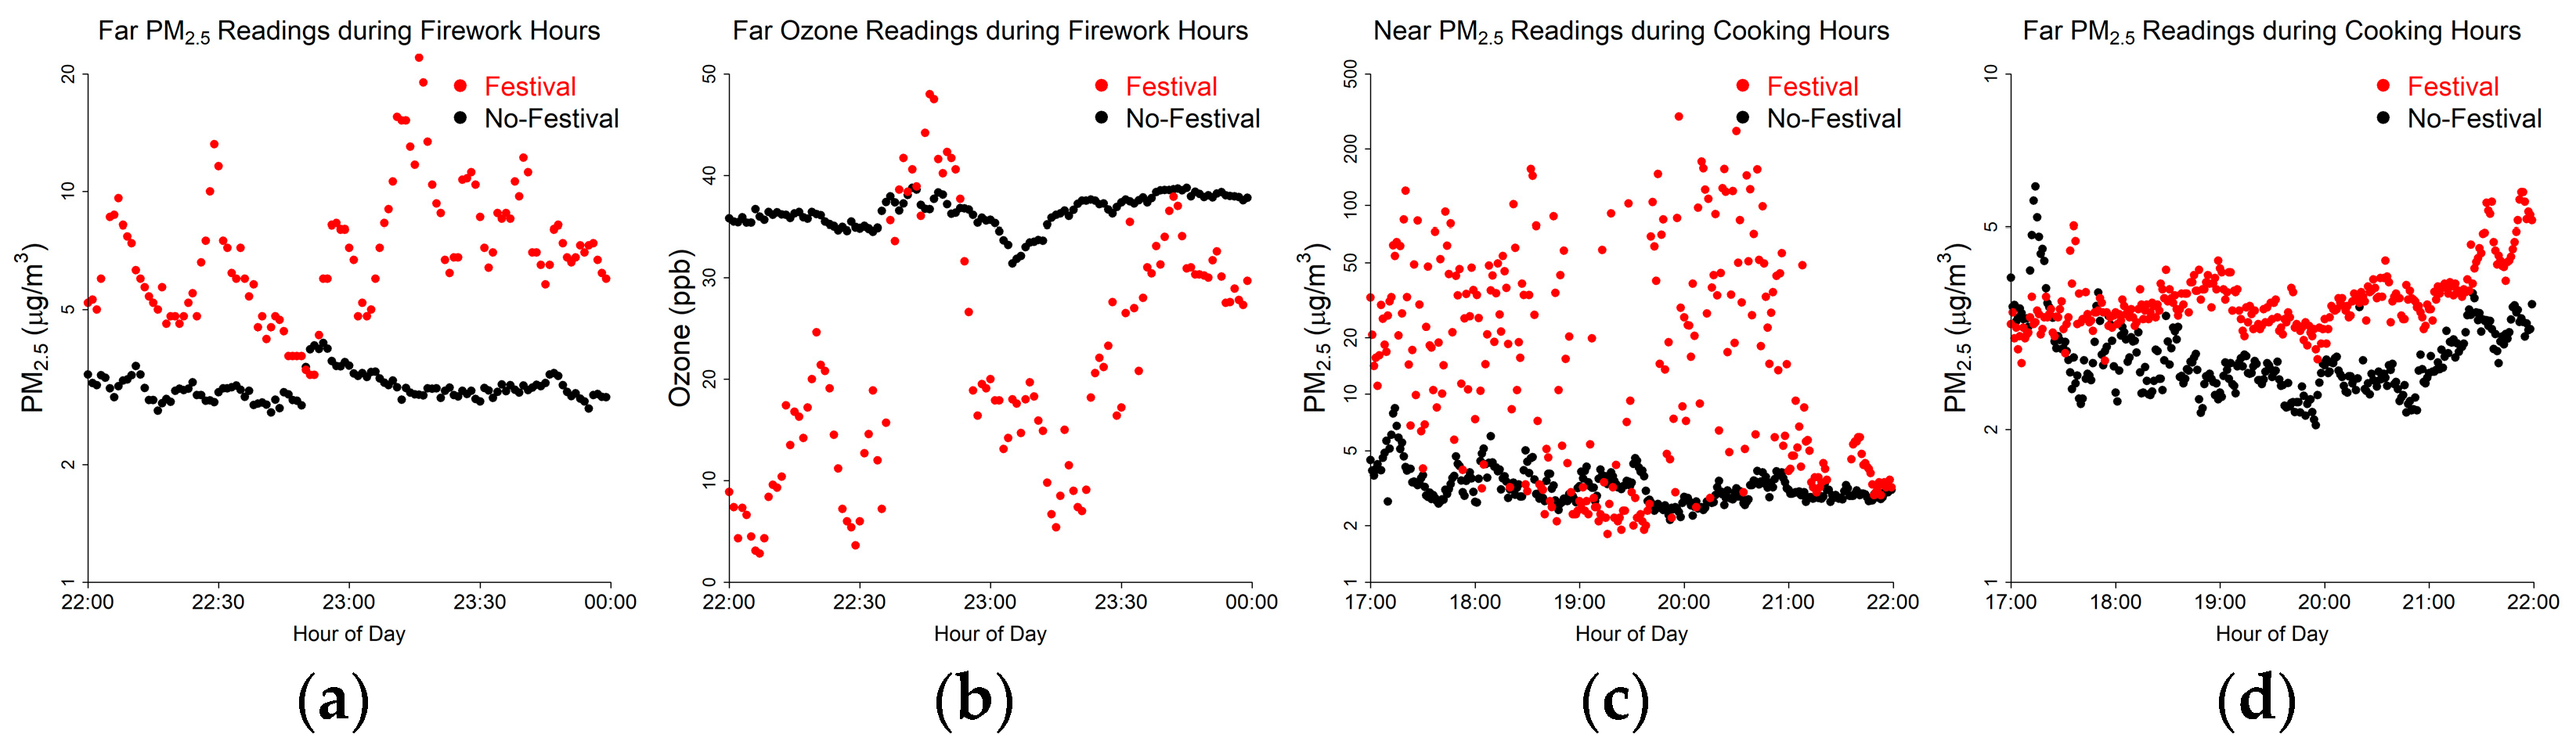
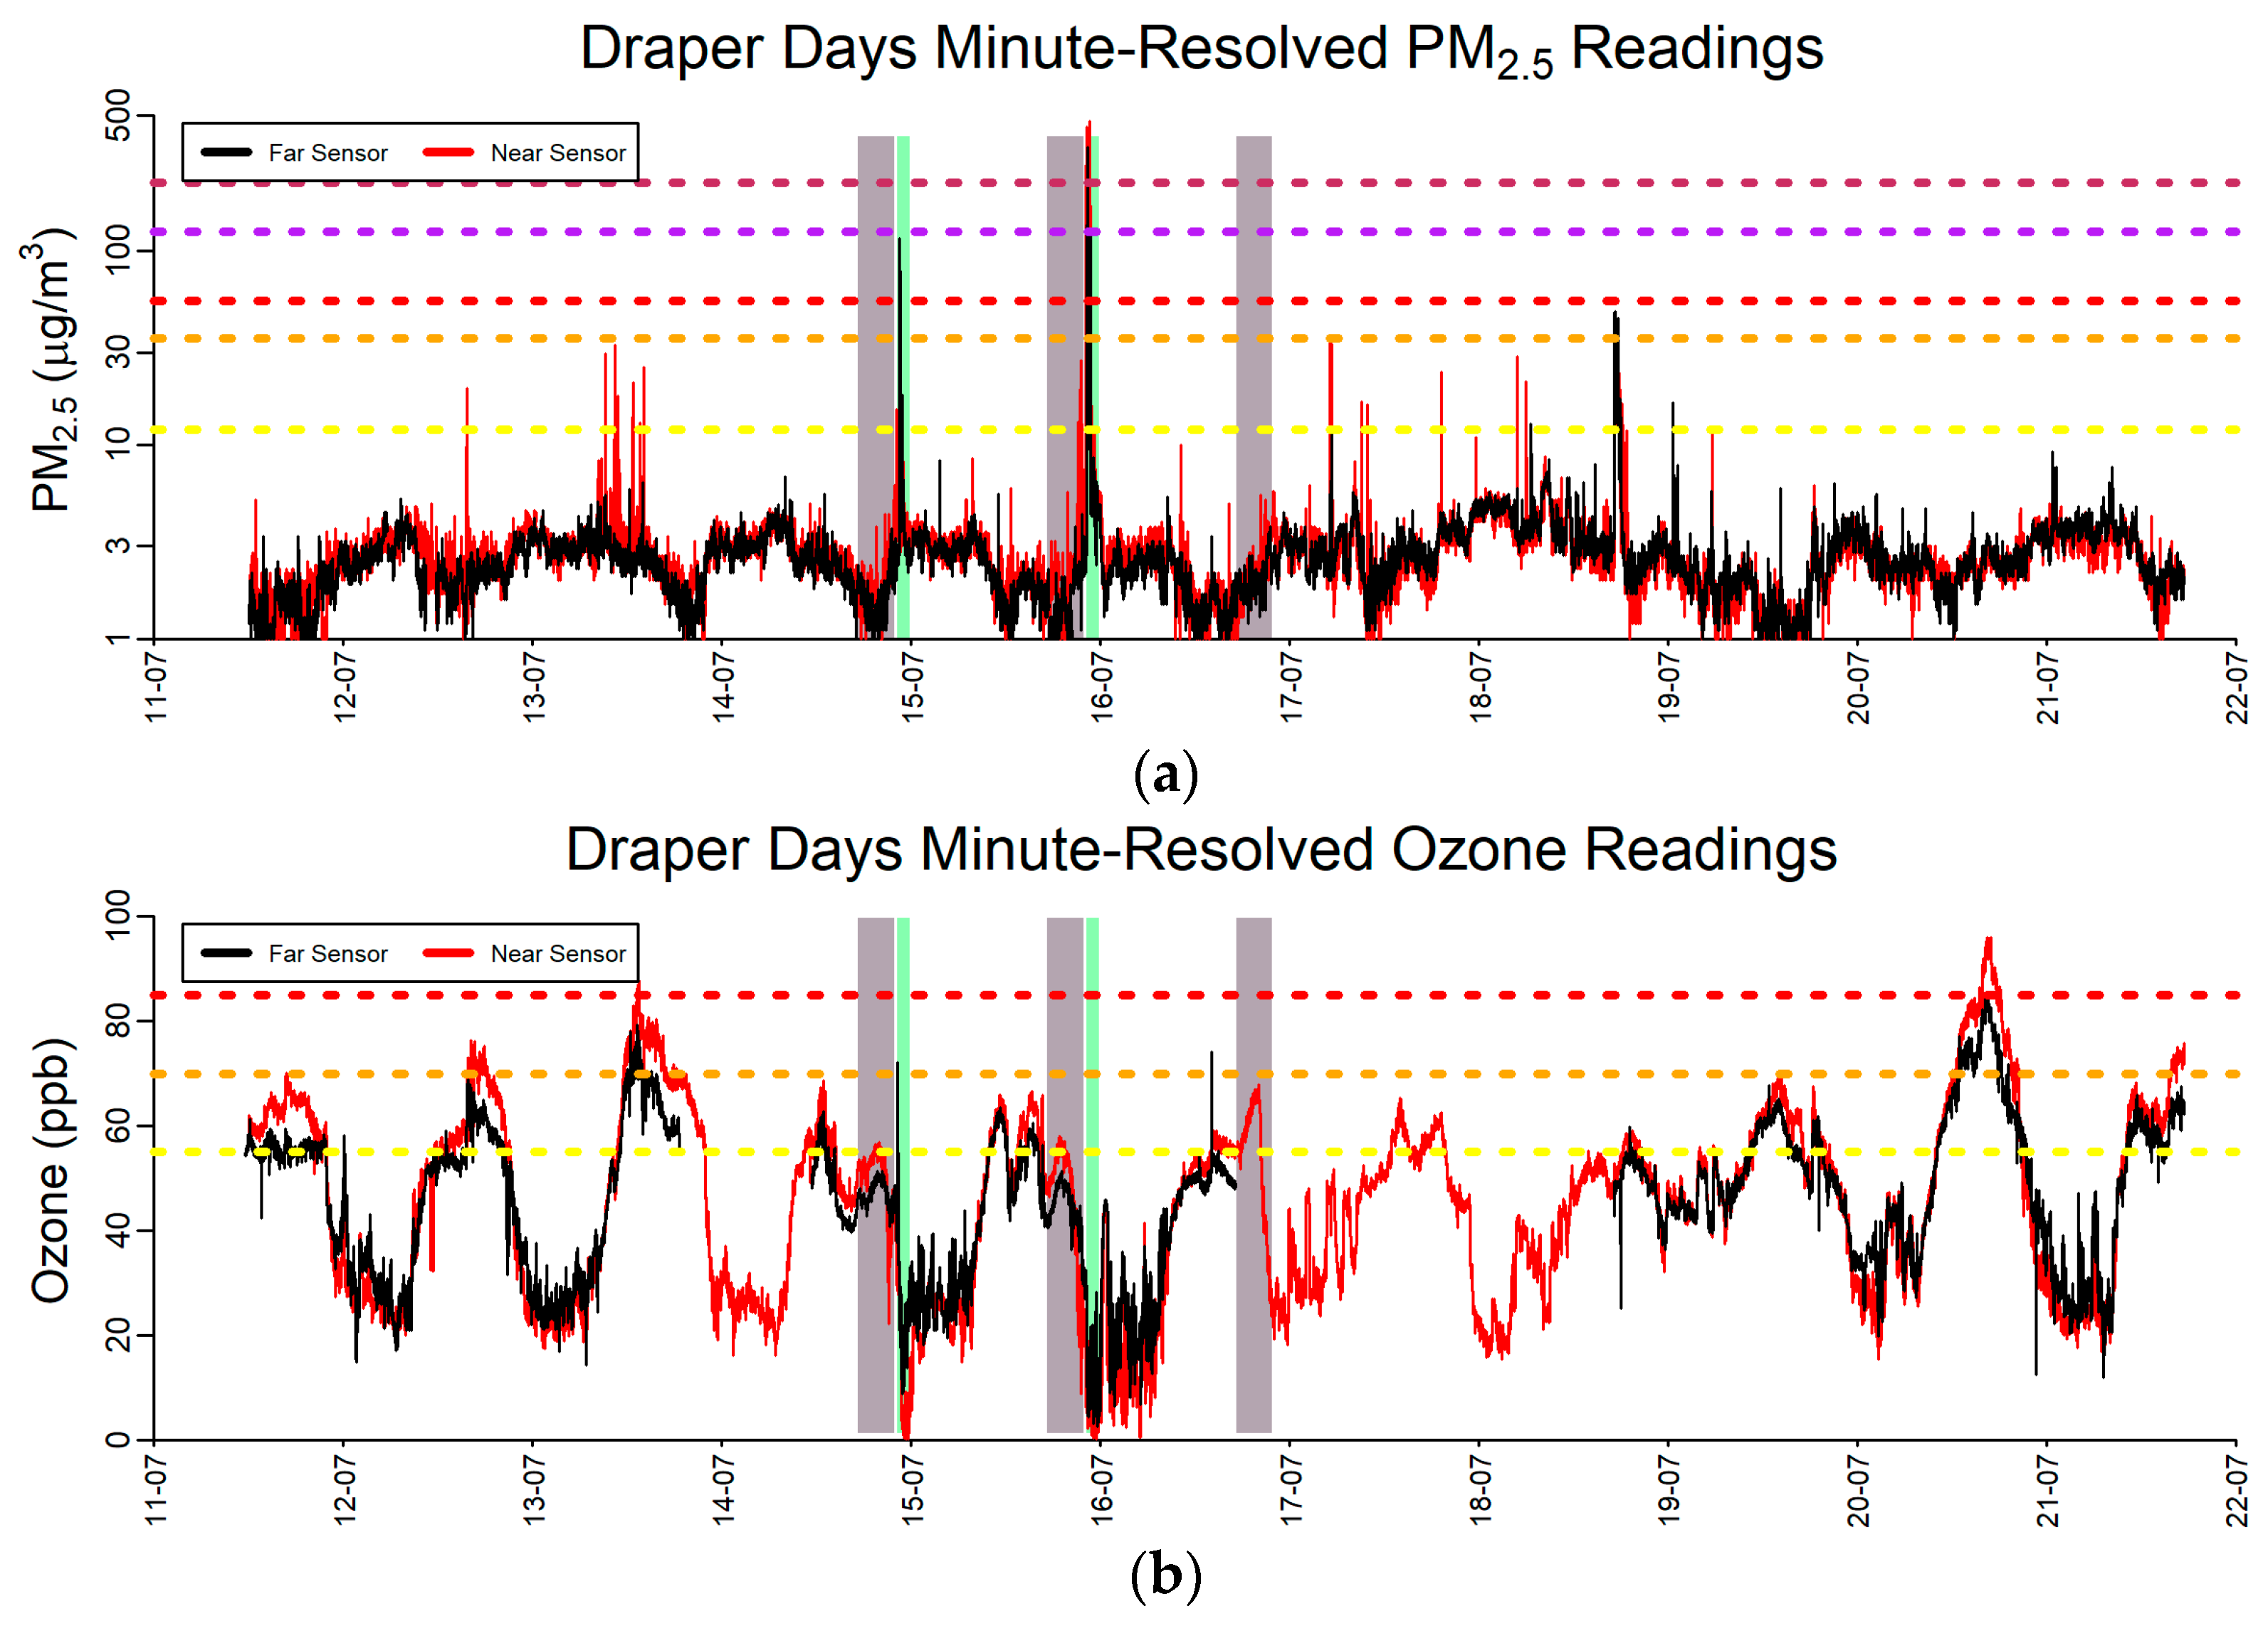
The pollutant observations for the Draper Days campaign are shown in Figure 4. The Near PM2.5 sensor registered substantially higher readings than the Far unit during firework events (Figure 4a). The Near PM2.5 sensor read a maximum value of 469.2 µg m−3 during the 15 July evening fireworks display while the highest recorded PM2.5 value for the Far sensor was 344.1 µg m−3, also during the same event.
Figure 4.
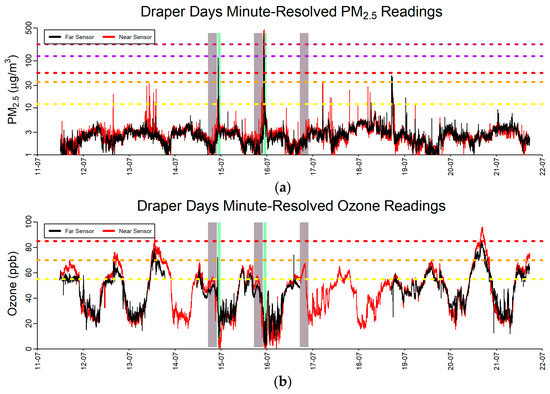
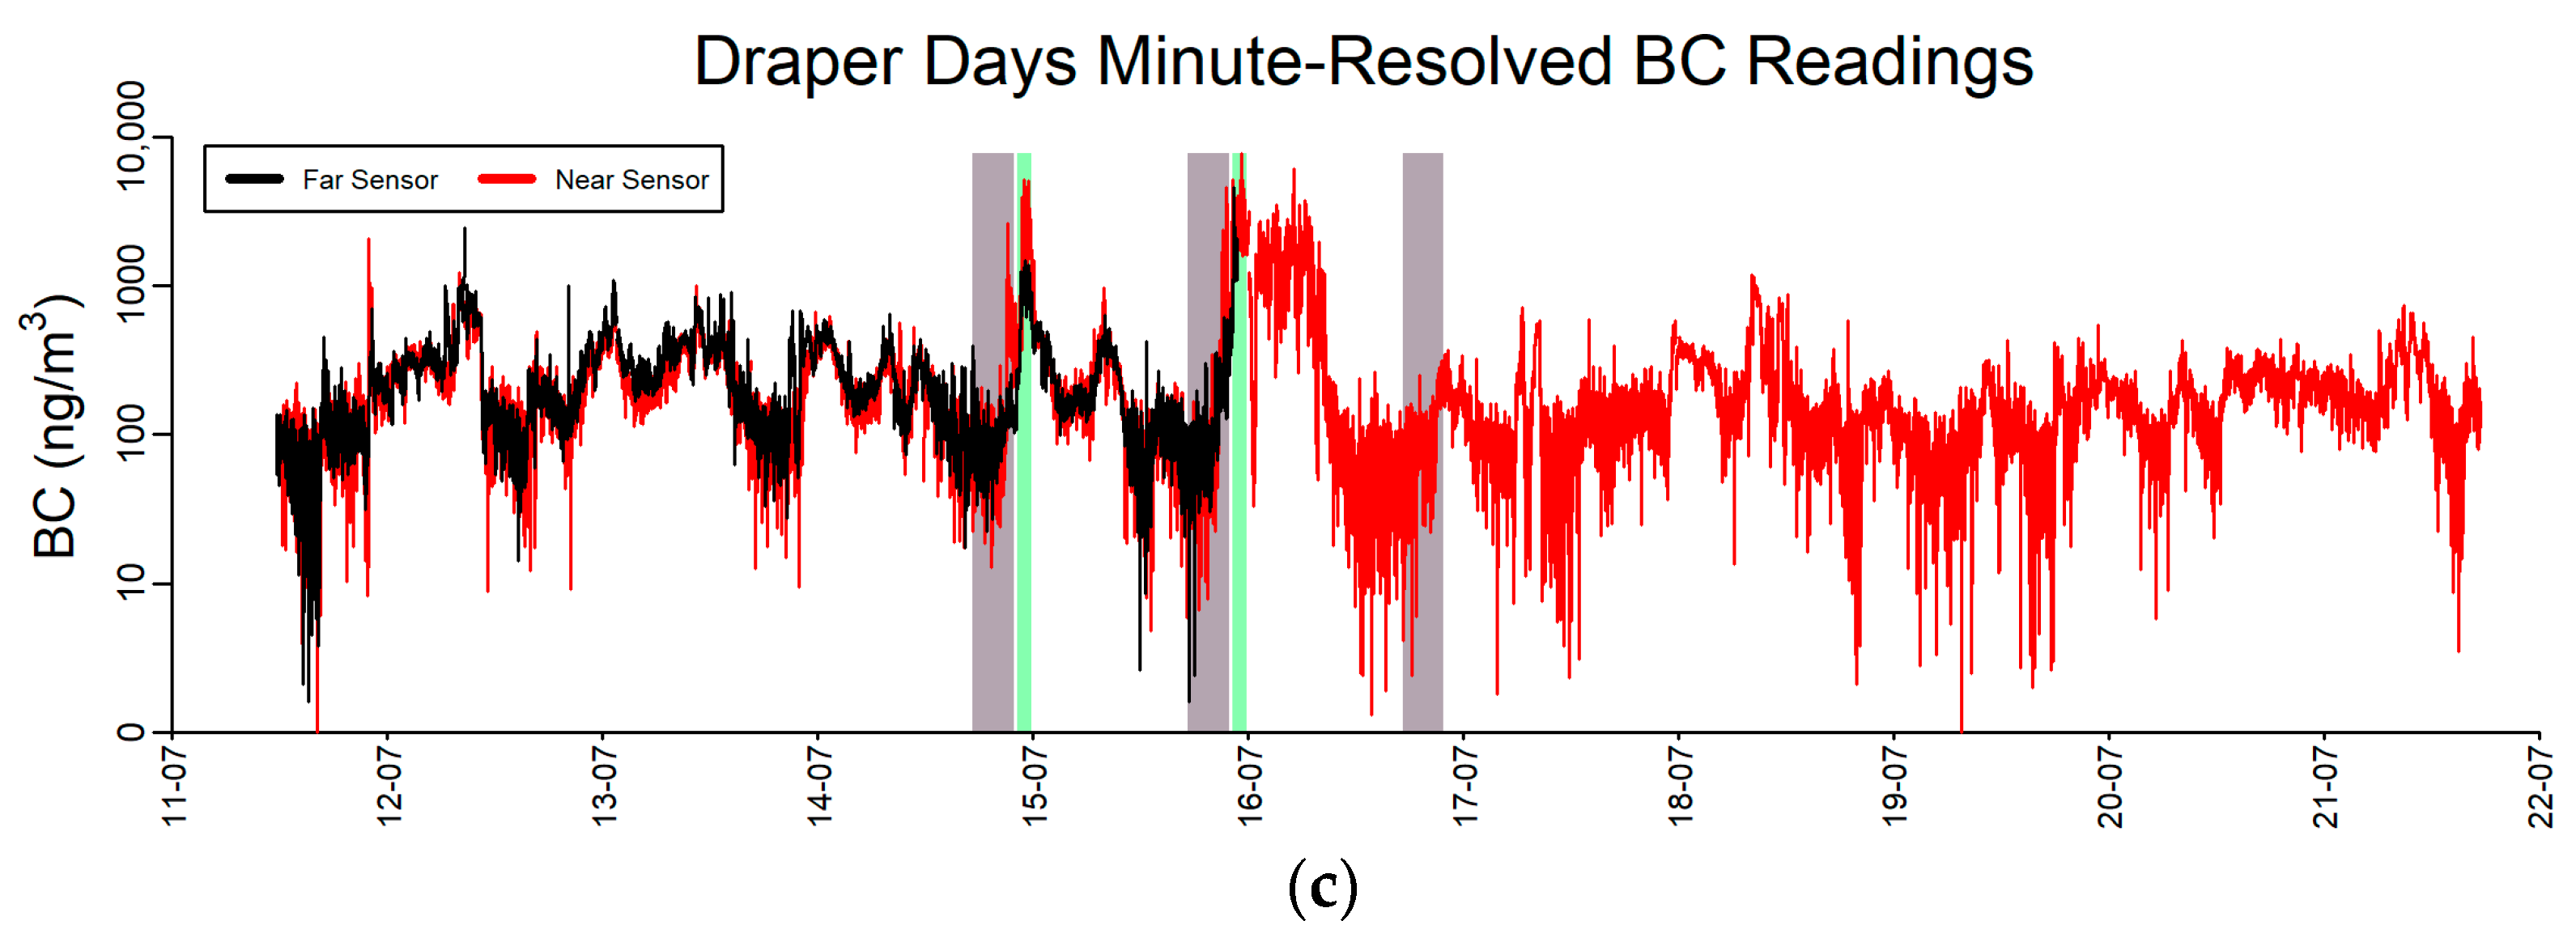
Full study period minute-resolved (a) PM2.5, (b) ozone, and (c) BC time series for Draper Days. The black line shows the “Far” sensor values and the red line represents the “Near” sensor values. The grey and green shaded periods represent Cooking and Fireworks periods, respectively. The horizontal lines on the PM2.5 figure denote the breakpoints for each of the 24 h air quality index (AQI) levels and the horizontal lines on the ozone figure denote the breakpoints for the 8 h AQI levels [53].
The ozone values (Figure 4b) are similar for both sensors and follow a typical diurnal cycle with the highest concentrations in the early to mid-afternoon. Two relatively noisy time periods, with some of the lowest ozone concentrations, took place during the early to mid-morning of 15 July and 16 July. These are the days following the firework events, and they display elevated PM2.5 (Figure 4a). The decreased ozone levels due to evening titration are to be expected like what was observed at WestFest, but the impact of fireworks on observed ozone the day after the event is unclear, with a decrease in this case but an increase observed previously at WestFest.
The BC results are shown in Figure 4c. The firework events are clearly represented in the evenings of 14 July and 15 July, with the latter showing a stronger signal. The Far sensor stopped working approximately at midnight 15 July and no data was collected after that time.
Table 3 shows that there are substantial differences between readings for all pollutants during firework events and non-firework event nights. PM2.5 and BC are elevated, especially at the Near site, and ozone is reduced during firework nights. Cooking hours during the festival show higher BC at the Near site as well as lower ozone at both the Near and Far sites compared to the same time when the festival is not taking place. The other pollutants show small variations between festival and non-festival days.
Table 3.
Event and analysis period results for the Draper Days study sensors. * indicates p < 0.001.
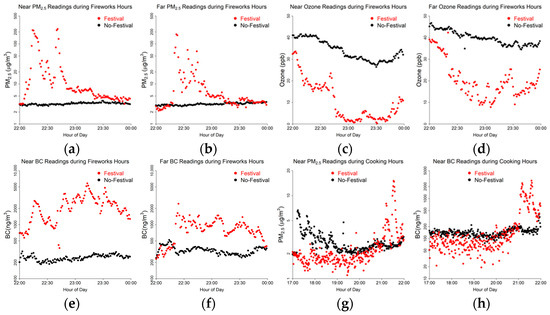
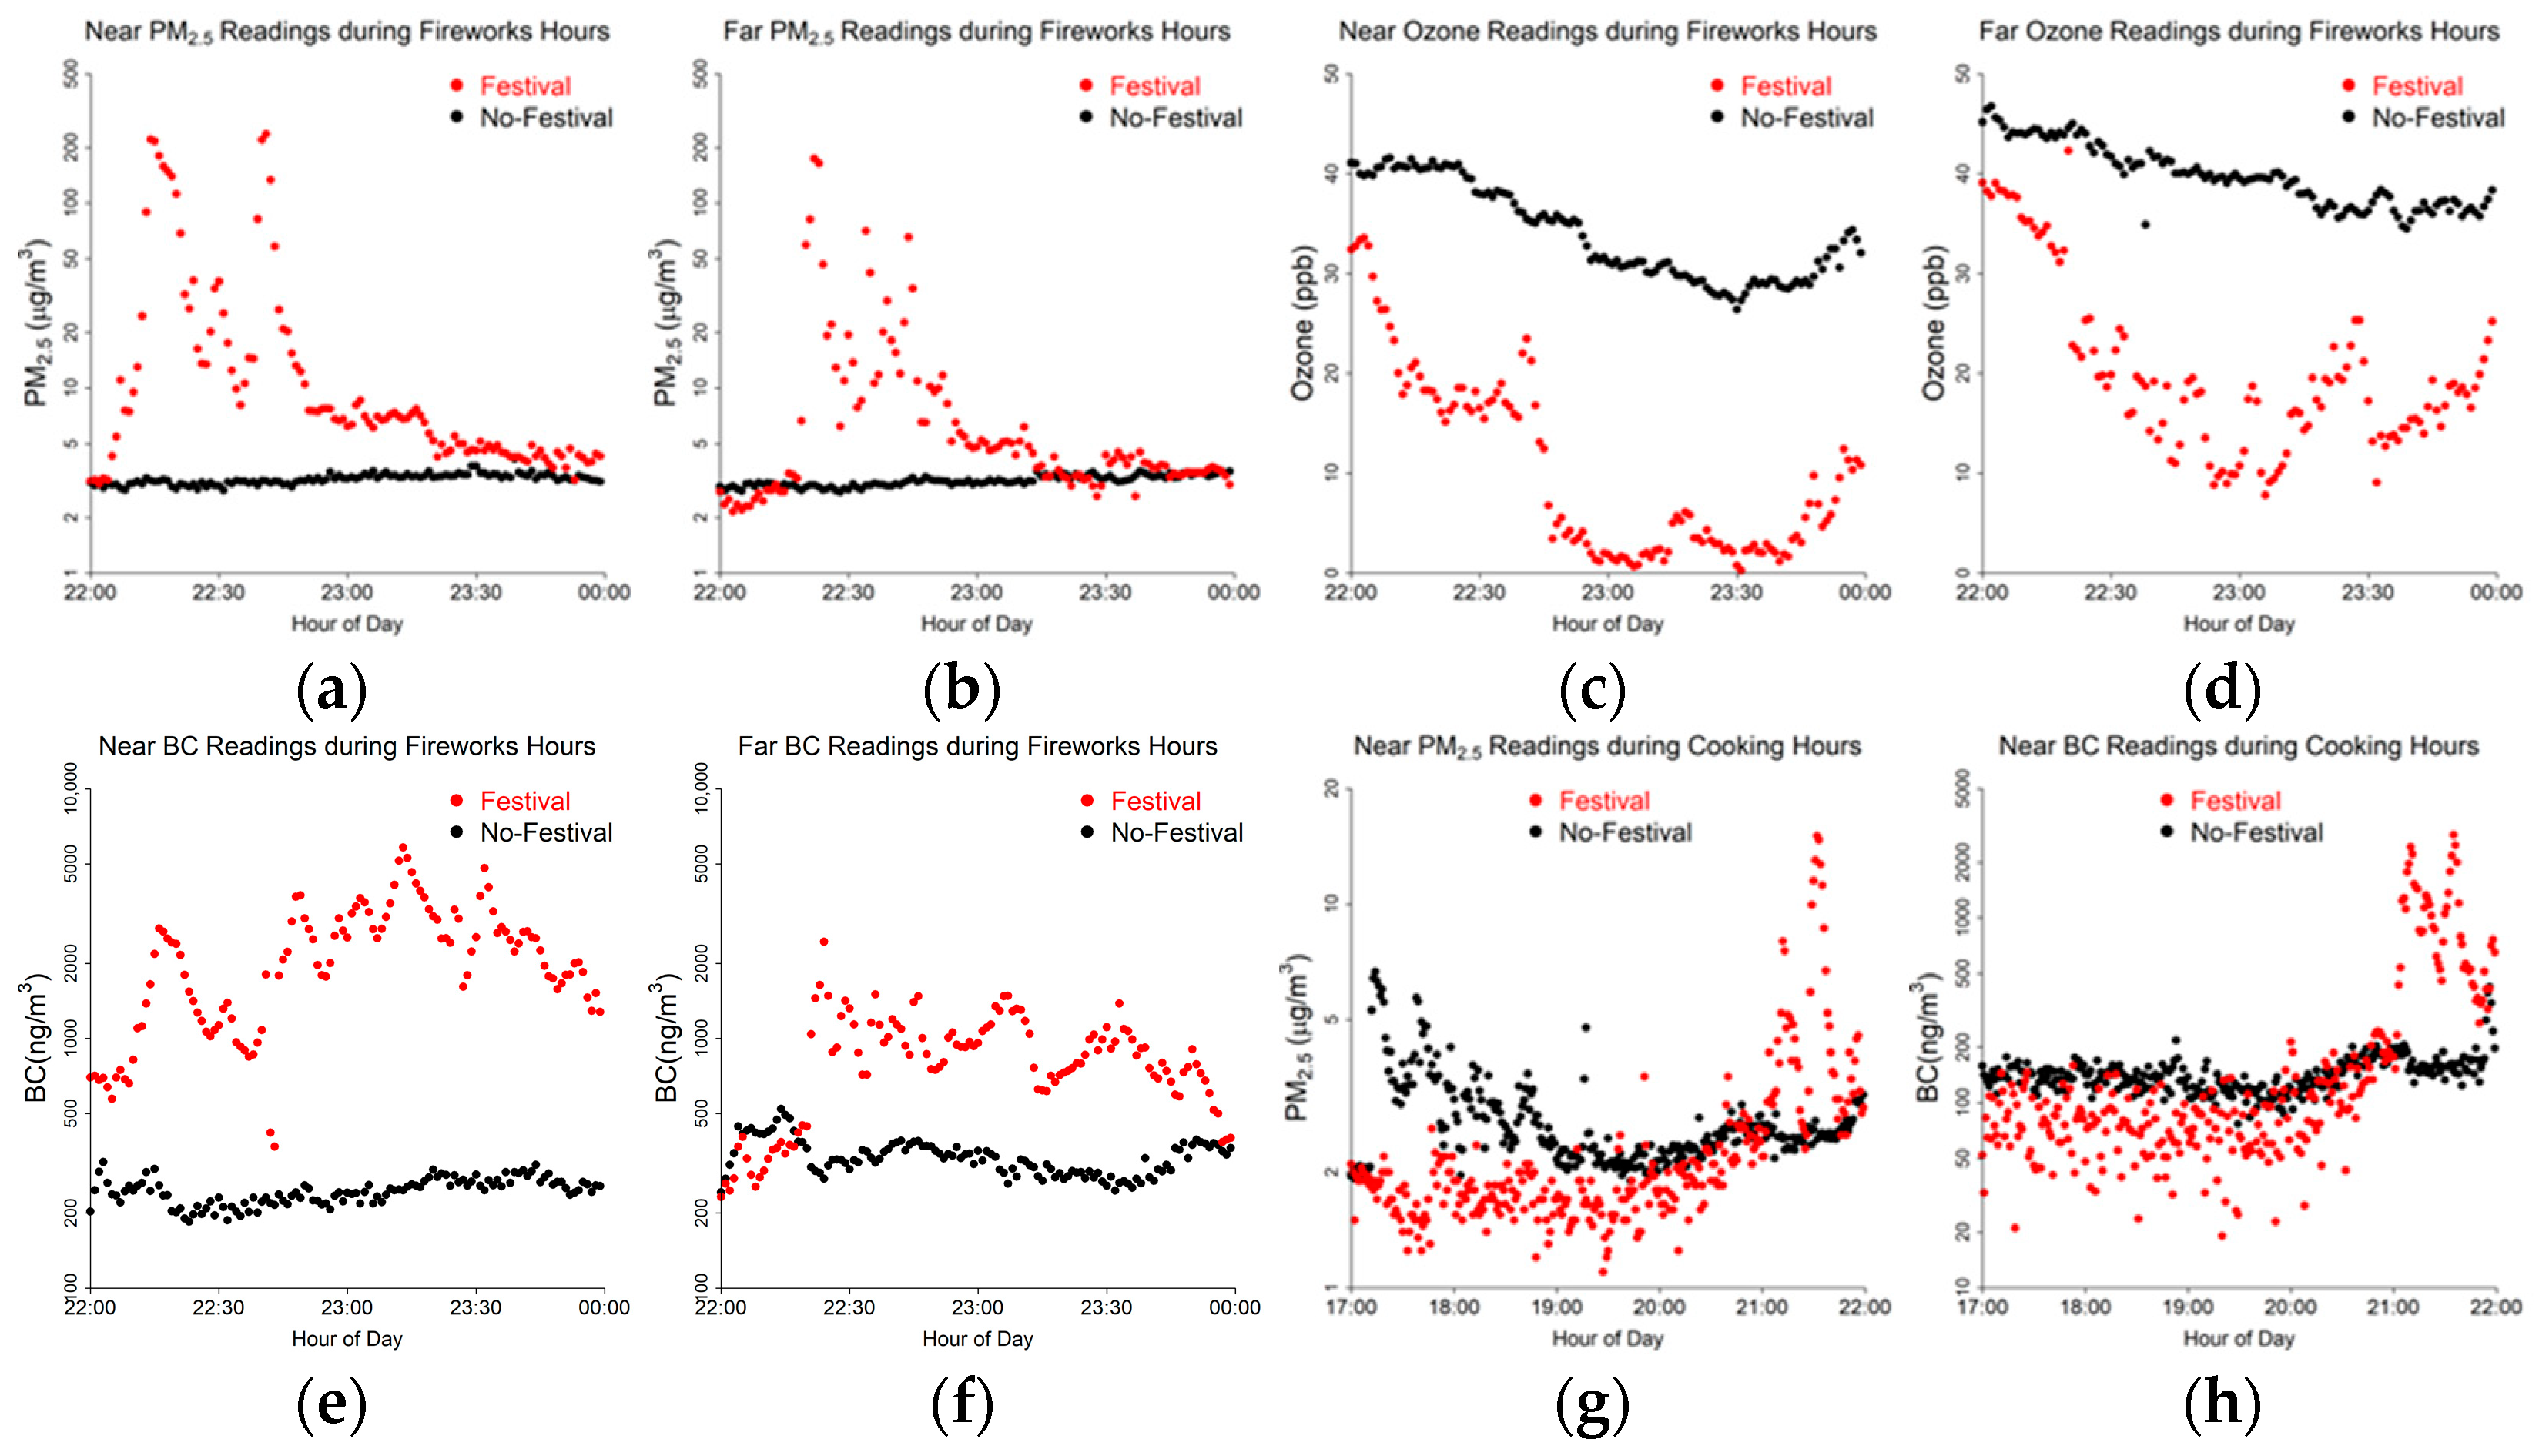
Figure 5 and Figure A1 show minute-averaged results. Both the Near (Figure 5a) and Far (Figure 5b) PM2.5 readings show the clear impact of festival fireworks on air quality. The response at the Far sensor is slightly delayed, showing that the fireworks plume takes some time to travel to it. Similarly, ozone (Figure 5c,d) decreases during firework events, likely due to NOx titration. The BC signal (Figure 5e,f) is also enhanced during fireworks compared to evenings without them. Cooking combustion is visible during the festival days for both PM2.5 and BC (Figure 5g,h). They peak nearly simultaneously around 21:00 when atmospheric conditions are relatively still, which traps air and enhances the readings. The associated wind roses (Figure A4) show similar wind patterns during festival and non-festival periods.
Figure 5.
Pollutant concentration sensor comparison during Draper Days and non-festival days for (a) fireworks Near PM2.5, (b) fireworks Far PM2.5, (c) fireworks Near ozone, (d) fireworks Far ozone, (e) fireworks Near BC, (f) fireworks Far BC, (g) cooking Near PM2.5, and (h) cooking Near BC.
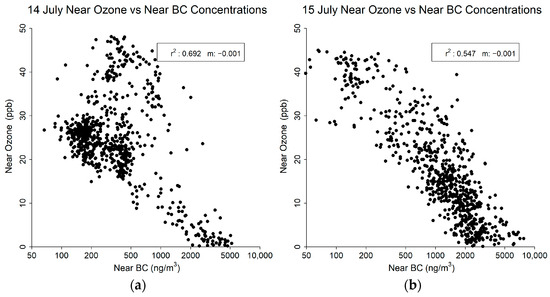
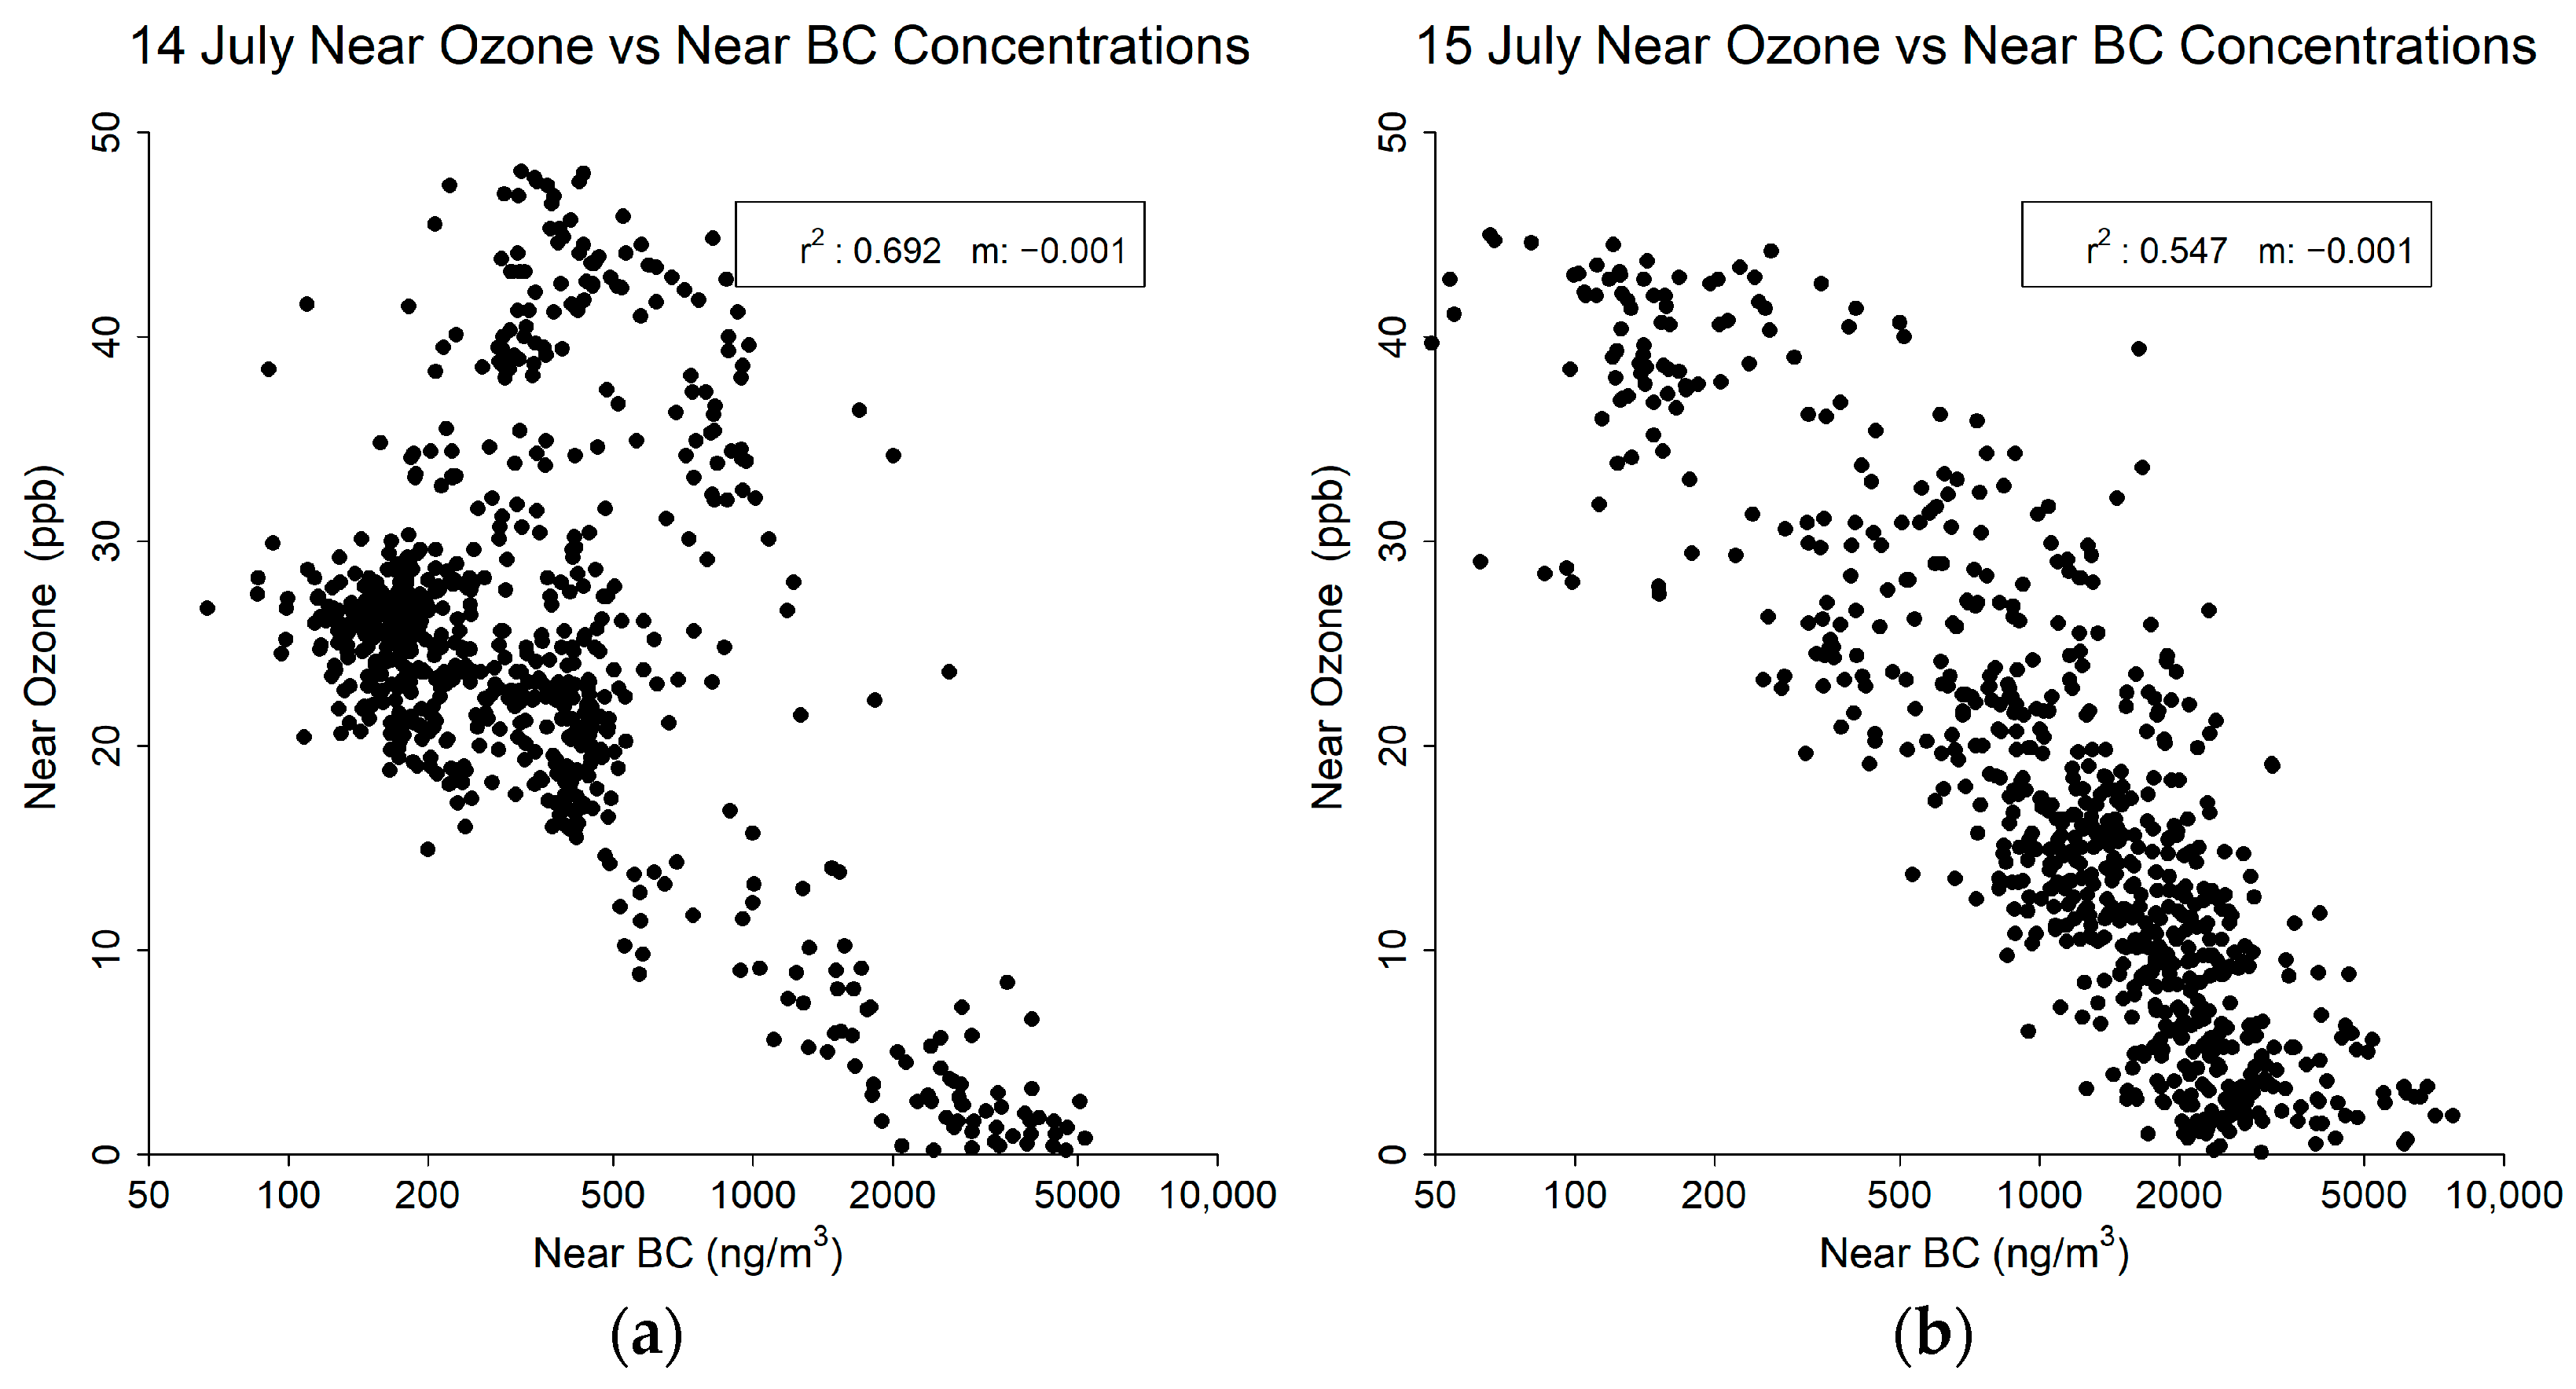
Figure 6 shows the relationship between ozone and BC collected by the Near set of sensors. The 14 July comparison shows a relatively strong negative relationship between the pollutants (Figure 5a), with a consistent drop in r2 from 0 to 60 min of lag (Figure 5b). The 15 July comparison showed a slightly weaker relationship between ozone and BC (Figure 5c) and a steeper drop in r2 from 0 to 10 min. The linear decrease in ozone noted with a linear increase in BC is observed to occur between 0 and 30 ppb ozone, but when the ozone levels are higher than 30 ppb, that relationship is non-linear.
Figure 6.
Ozone and BC concentrations on (a) 14 July and (b) 15 July.
3.3. Butlerville Days
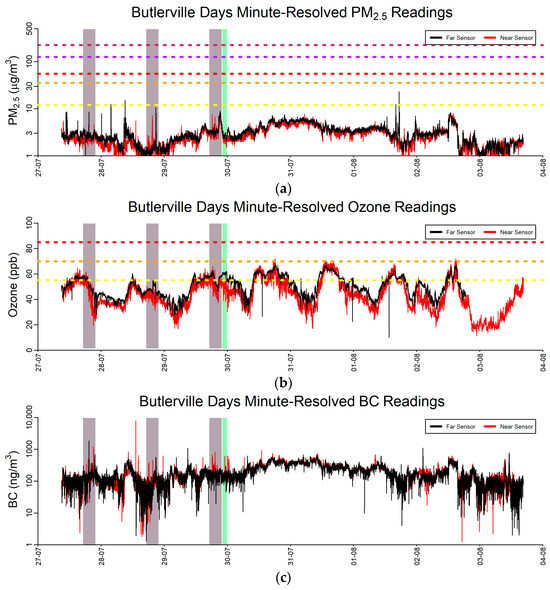
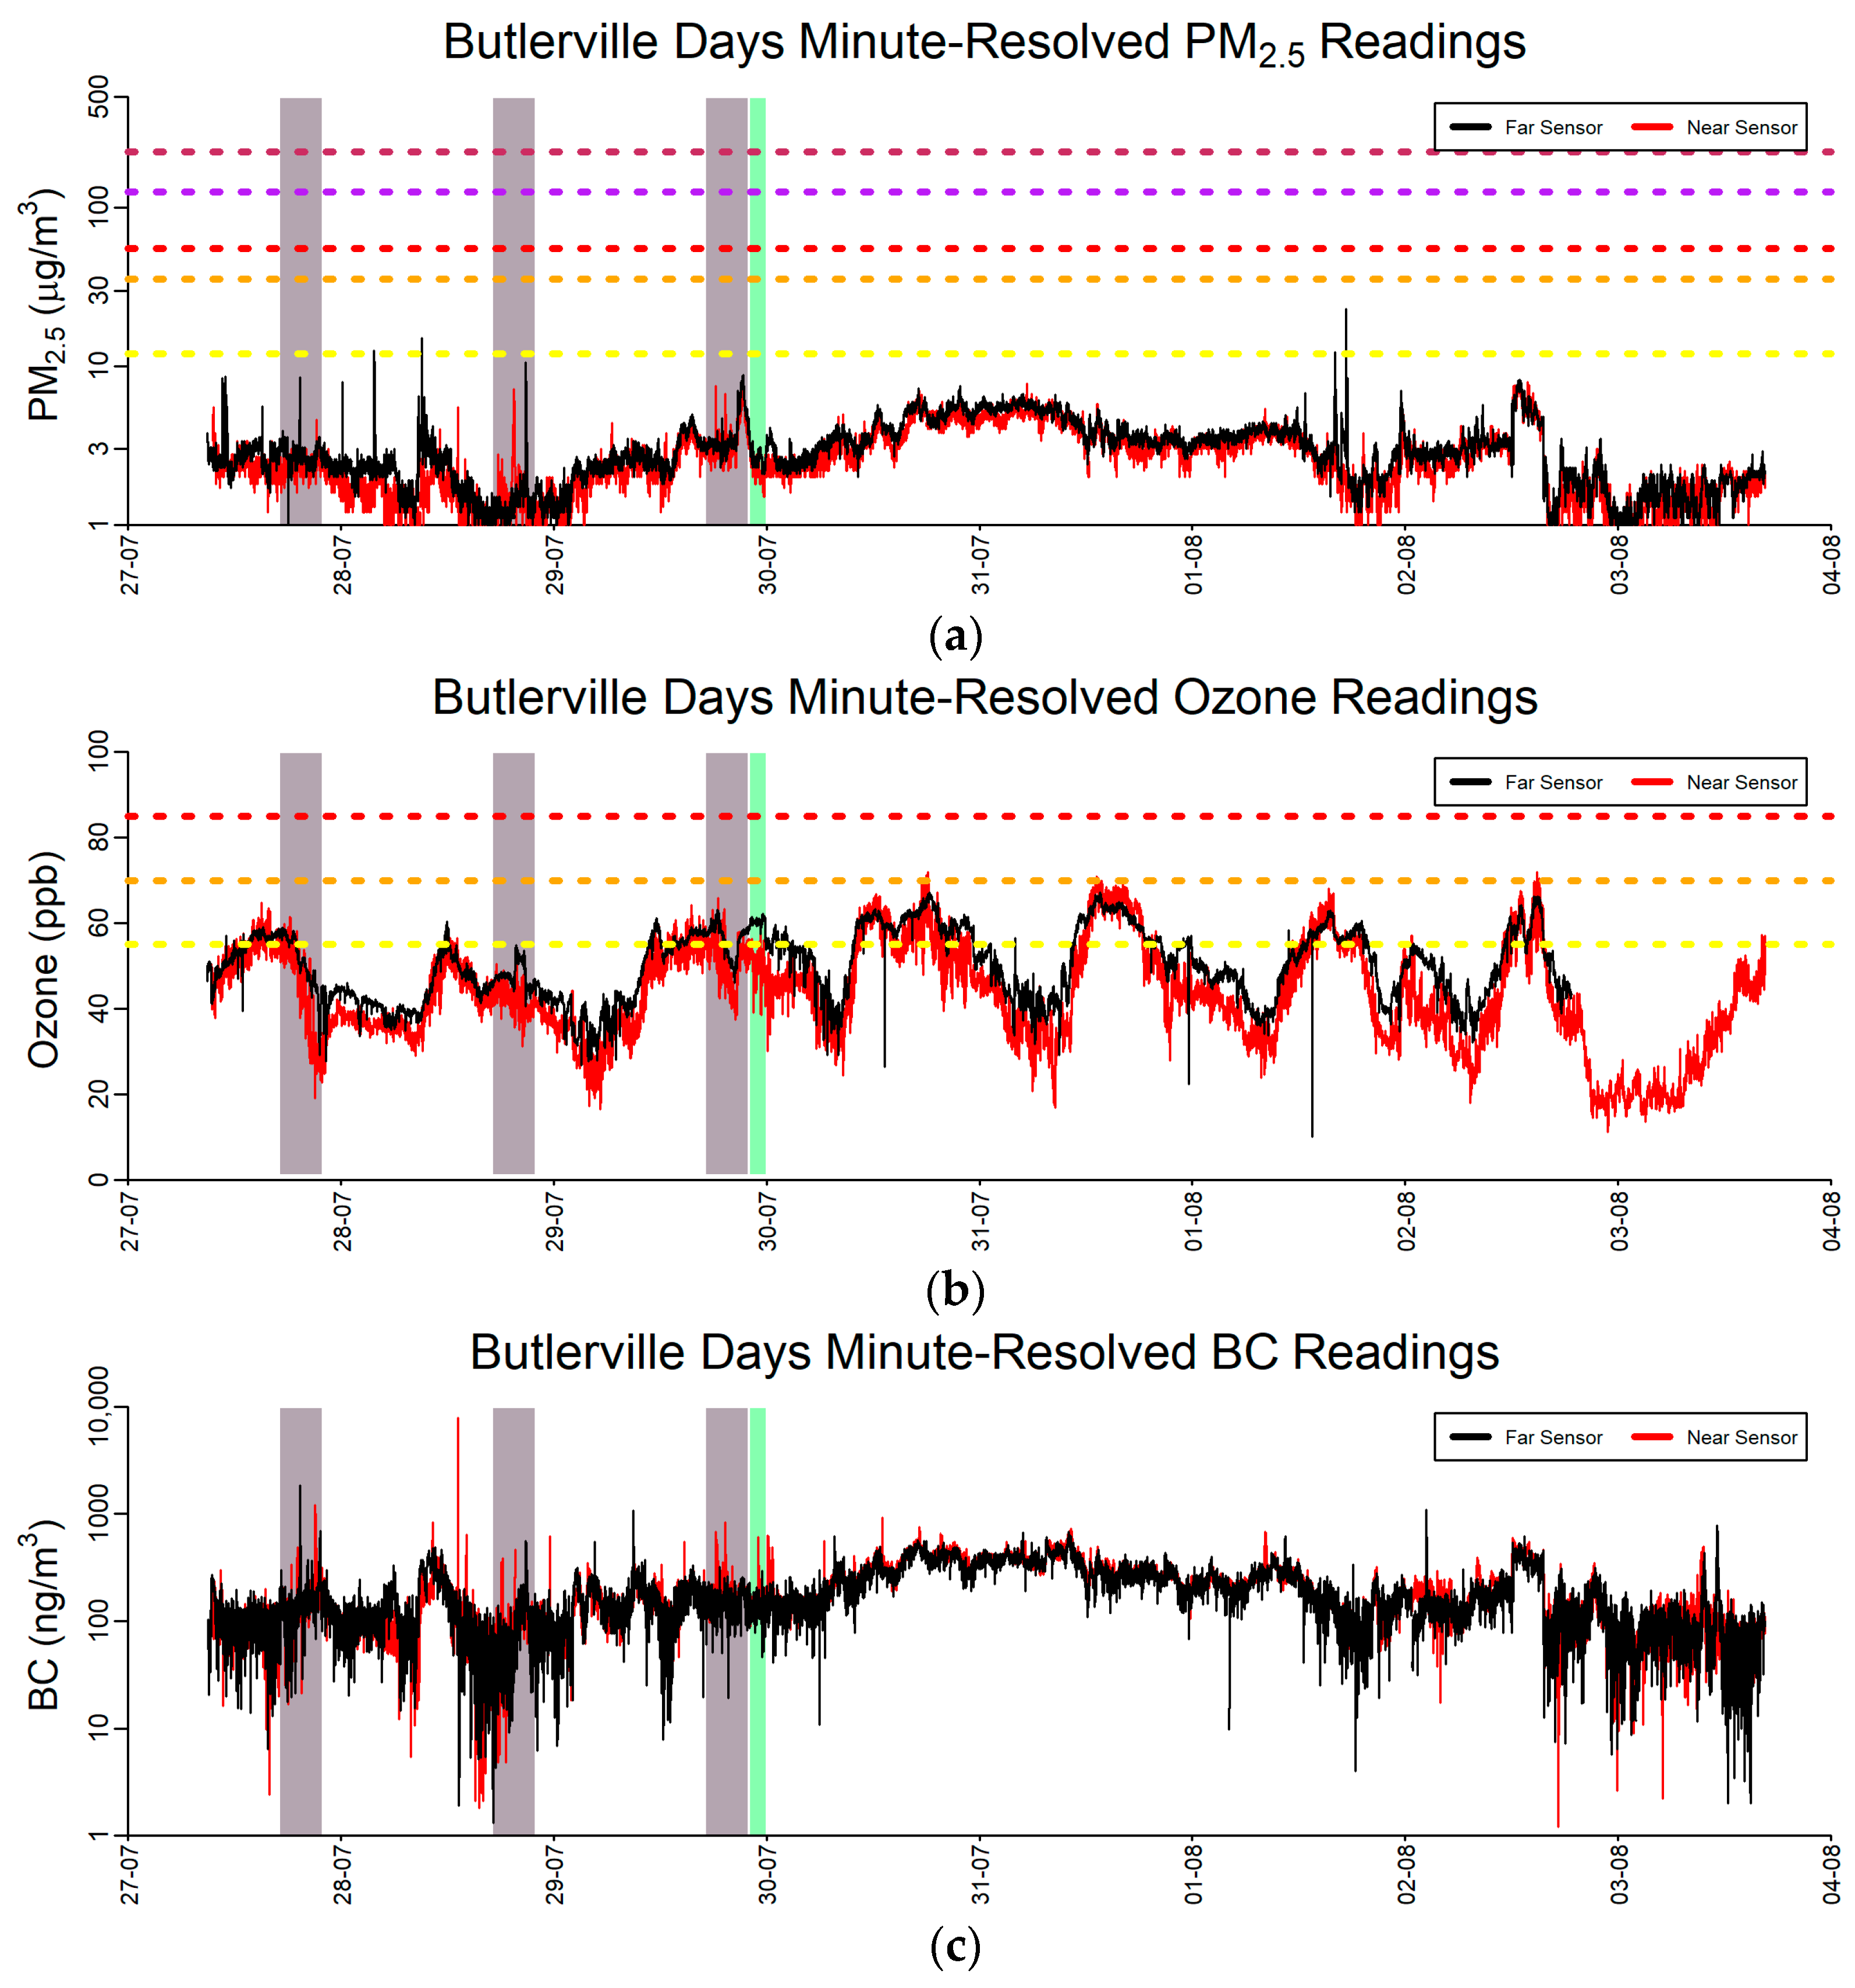
The Butlerville Days results are shown in Figure 7; none of the pollutants reached as elevated of levels compared to the WestFest or Draper (Figure 2 and Figure 4) PM levels. The fireworks signal was not as pronounced as at the other events (Figure 7a,c), partly because the sensors were located farther away. Butlerville Days ozone concentrations were also comparatively lower than those at WestFest or Draper (Figure 7b). This is in part due to less photochemical forcing and less heat driving ozone chemistry later in the summer and natural variability in weather patterns. Two wildfires were active between 30 July and 2 August [57], and their PM2.5 and BC signals were substantially larger than signals from the festival or other days.
Figure 7.
Full study period minute-resolved (a) PM2.5, (b) ozone, and (c) BC time series for Butlerville Days. The black line shows the “Far” sensor values and the red line represents the “Near” sensor values. The grey and green shaded periods represent Cooking and Fireworks periods, respectively. The horizontal lines on the PM2.5 figure denote the breakpoints for each of the 24 h air quality index (AQI) levels and the horizontal lines on the ozone figure denote the breakpoints for the 8 h AQI levels [53].
The comparison between festival and non-festival pollutant readings for the Near and Far sensors is shown in Table 4. Because of the pronounced pollution effects from the wildfire, the non-festival readings are generally higher than the festival readings across all three time periods. However, during the festival period, the fireworks BC readings were higher, and ozone was lower at the Near site compared to the Far site. During the Cooking period, the Far sensor read higher values across all pollutants compared to the Near sensor.
Table 4.
Event and analysis period results for the Butlerville Days study sensors. * indicates p < 0.001.
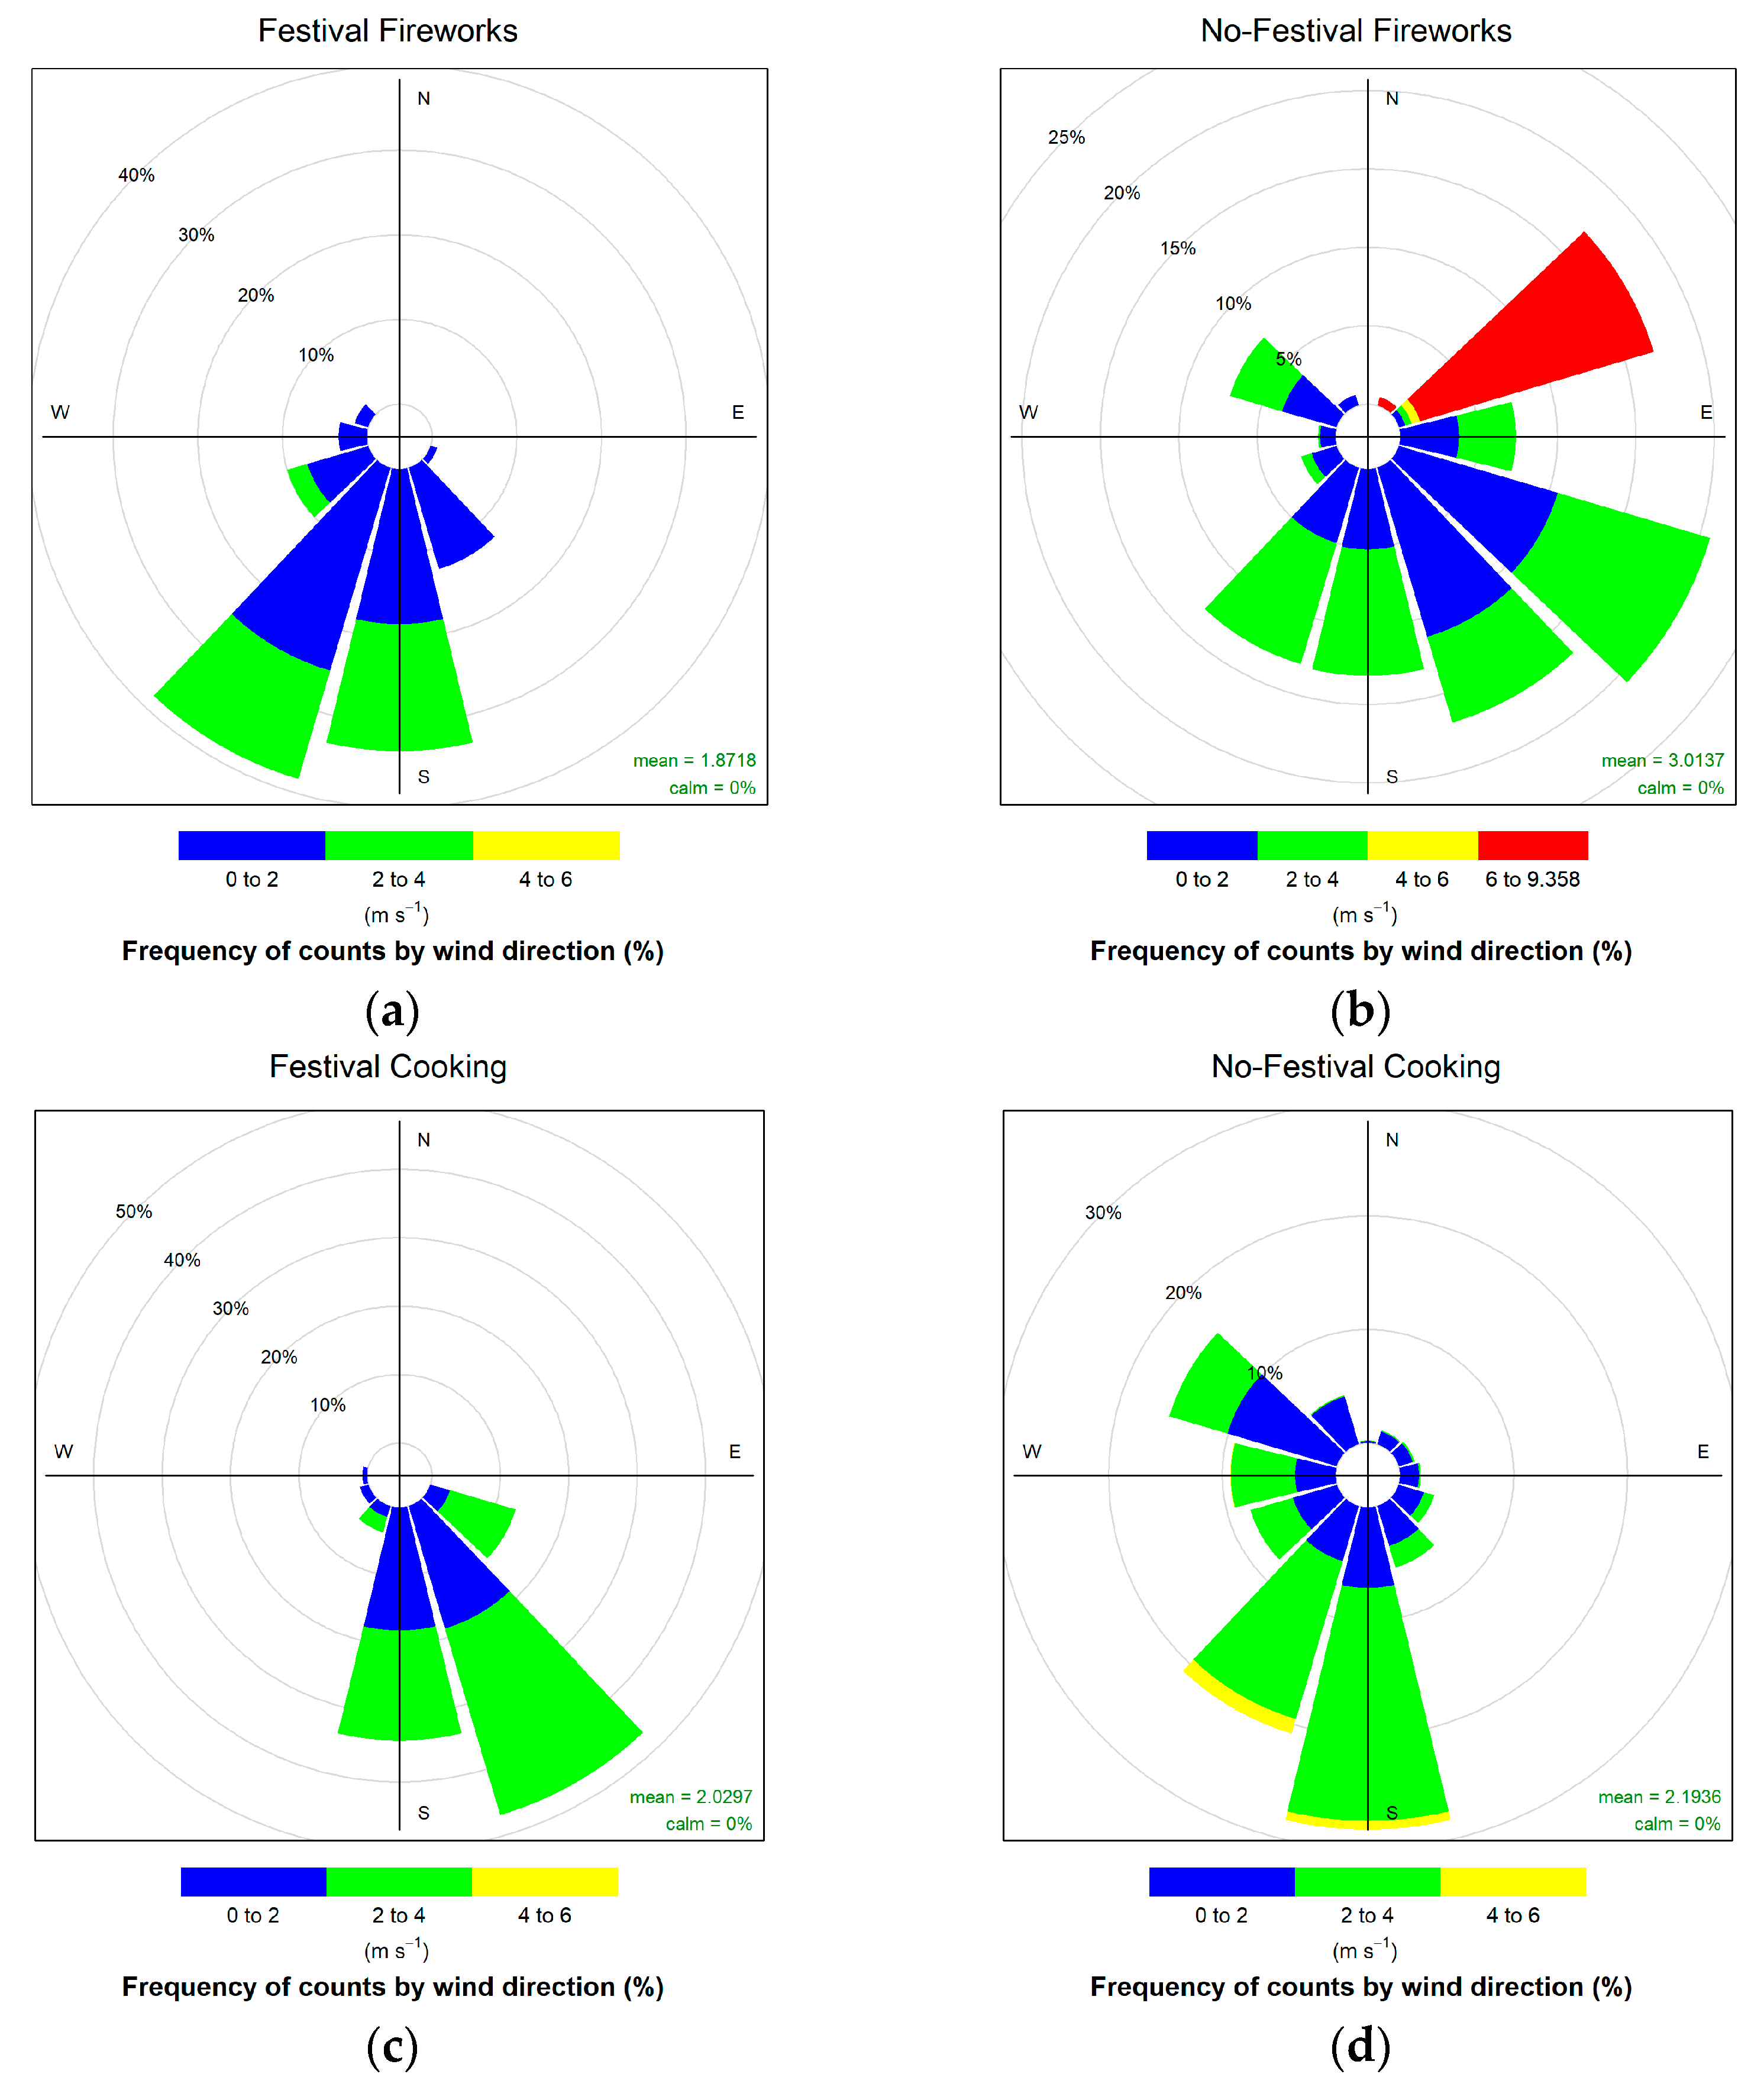
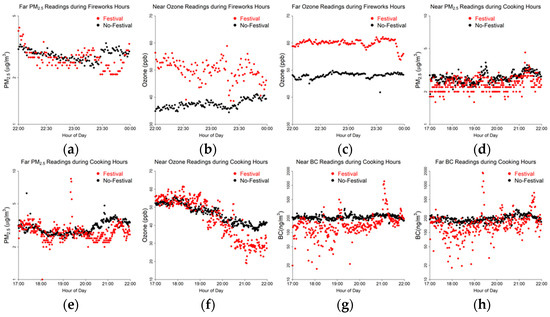
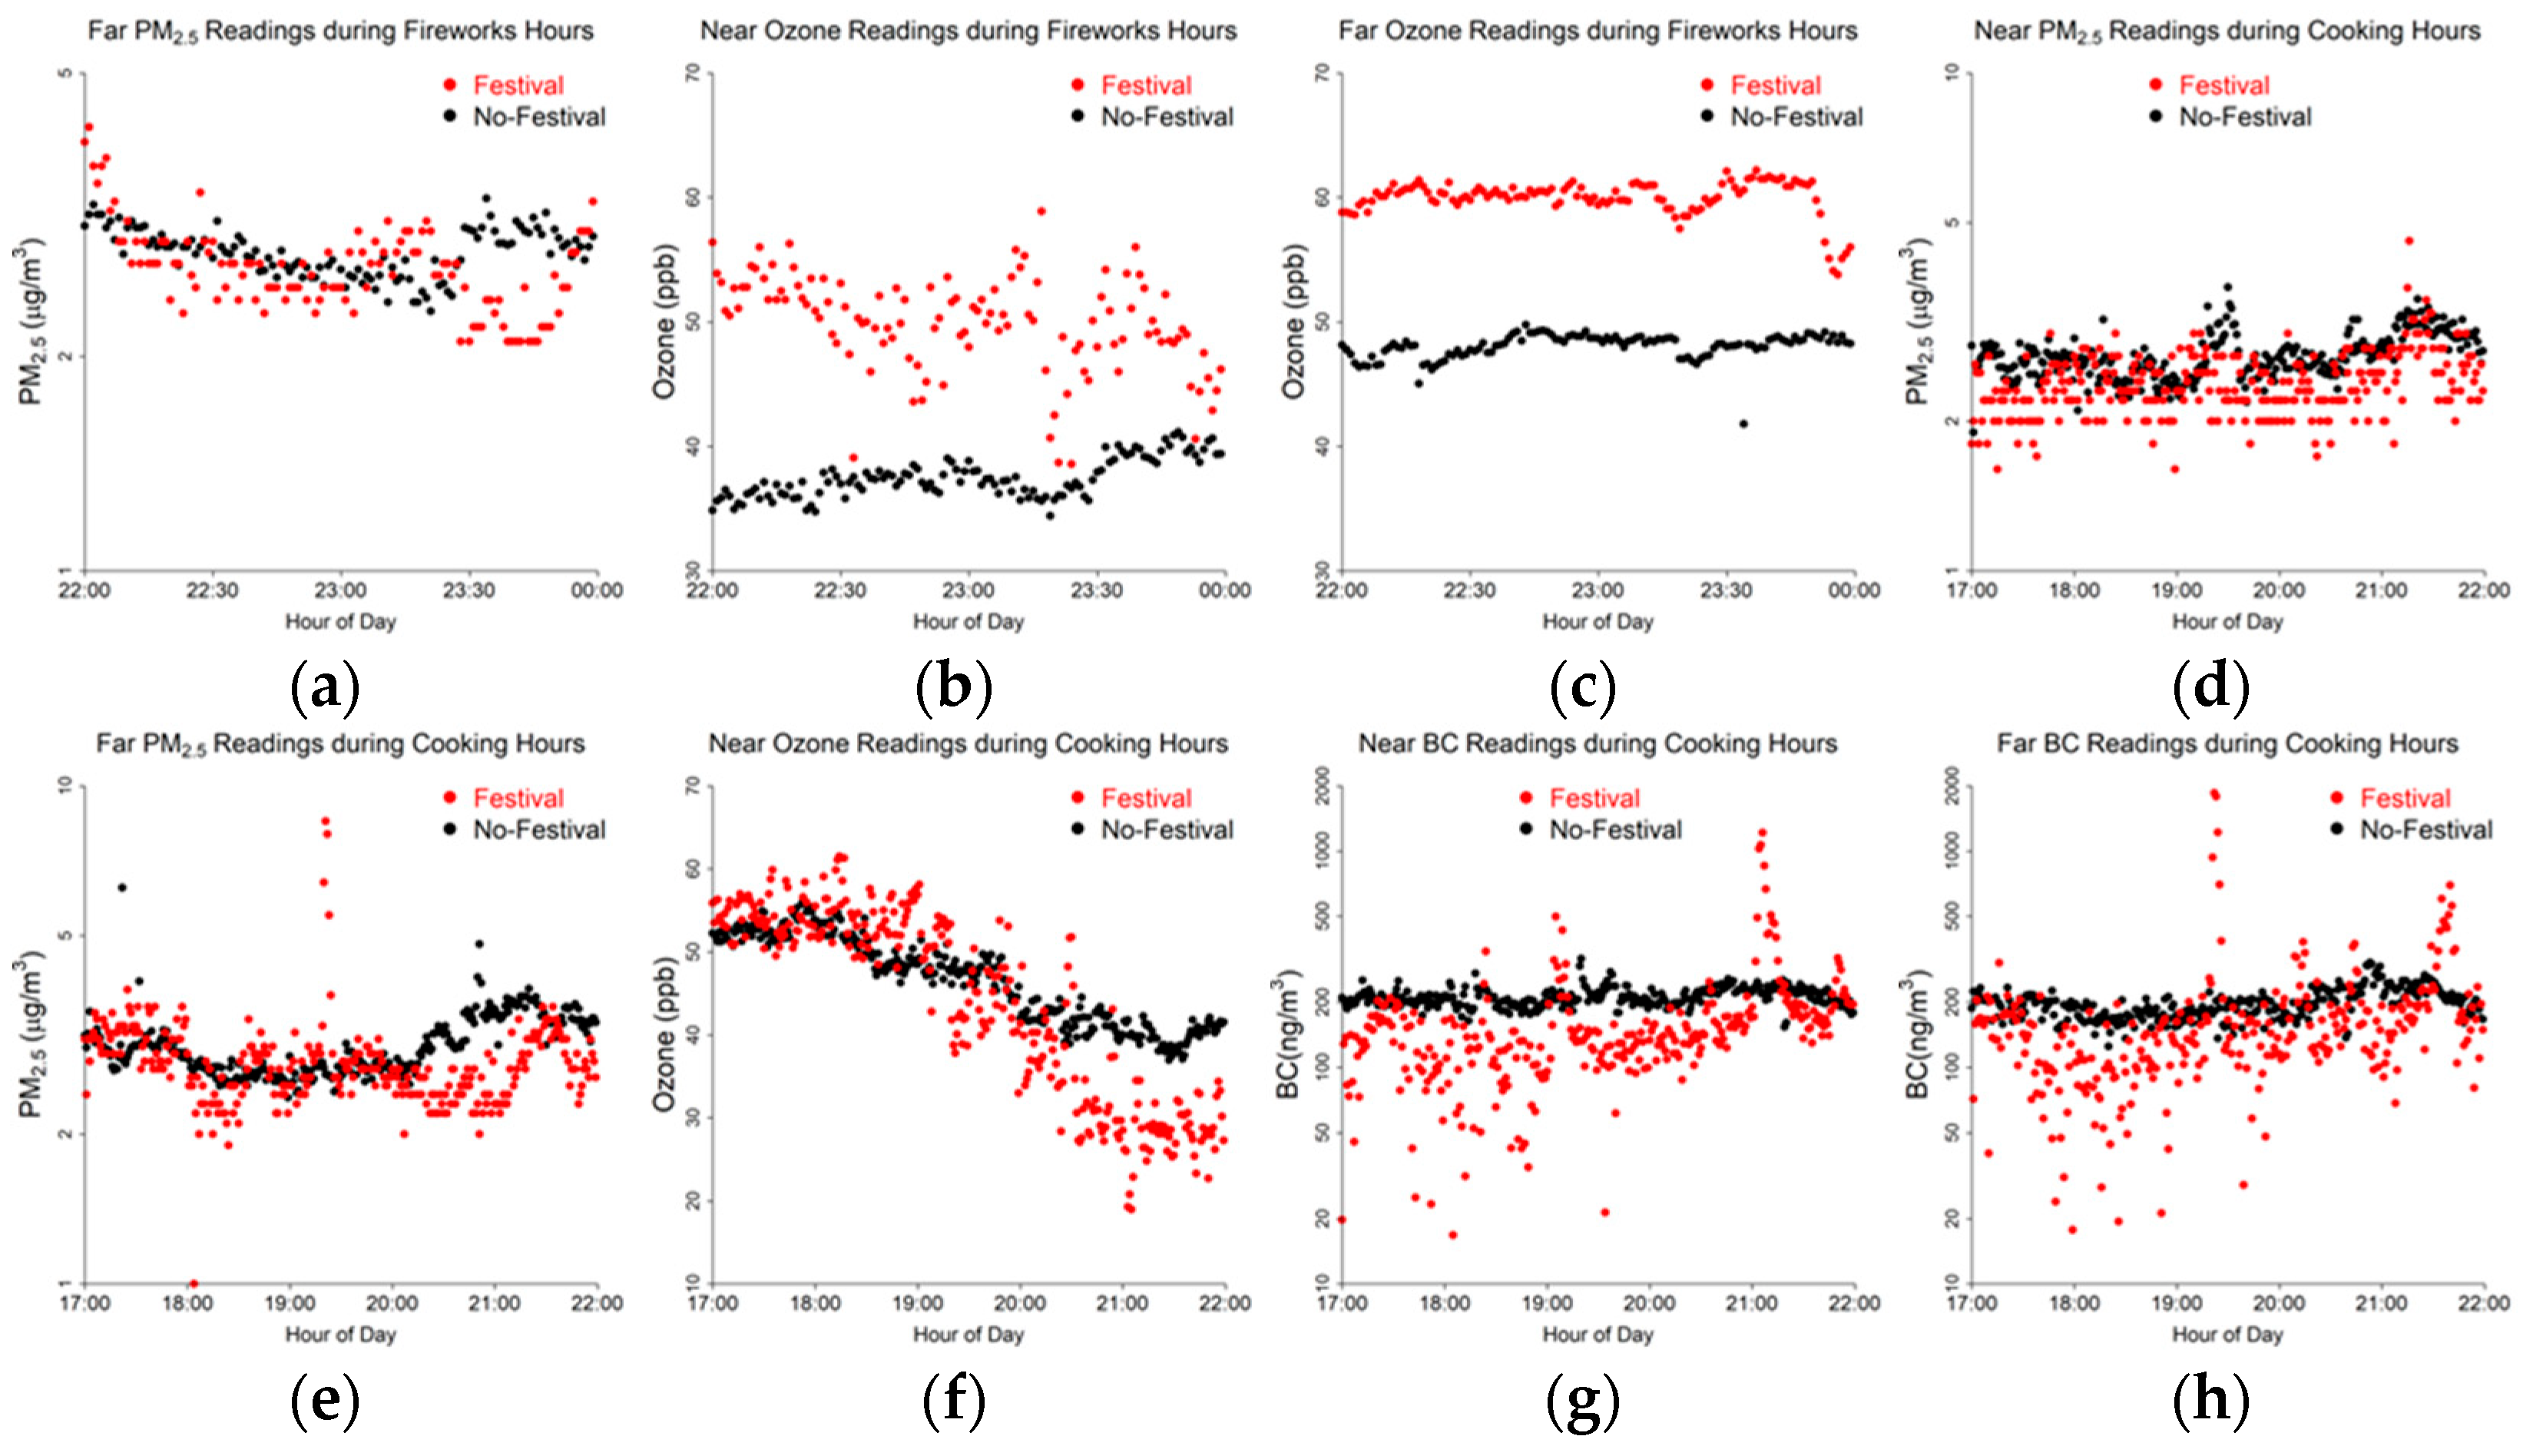
Figure 8 and Figure A2 show the relationship between festival and non-festival readings for the study periods and pollutants. The highest Far sensor PM2.5 readings during the fireworks take place almost immediately after they start at 22:00 (Figure 8a). The ozone readings are lower at the Near sensor compared to the Far sensor during the fireworks, likely due to NOx titration (Figure 8b,c). The cooking PM2.5 and BC signals show similar patterns for both the Near and Far sensors (Figure 8d,e,g,h). Both sensors show increases around 19:30 and 21:30 with corresponding decreases in ozone at those times (Figure 8f,g and Appendix A). These effects are more clearly observed at the Far sensor compared to the Near sensor. The associated wind roses (Figure A5) show similar wind patterns during festival and non-festival periods. Despite the similar average wind patterns, there are substantial differences in pollution concentrations across time periods for the different sites, illustrating the impact of the pollution events.
Figure 8.
Pollutant concentration sensor comparison during Butlerville Days and non-festival days for (a) fireworks Far PM2.5, (b) fireworks Near ozone, (c) fireworks Far ozone, (d) cooking Near PM2.5, (e) cooking Far PM2.5, (f) cooking Near ozone, (g) cooking Near BC, and (h) cooking Far BC.
4. Discussion
4.1. Observed Festival Pollutant Variability
The festival pollutant findings followed similar patterns but also highlighted specific characteristics of each event. Fireworks pollution at all sites generally spikes in the evening hours during and immediately following fireworks displays. The decrease in ozone during the fireworks is likely tied to NOx emissions from the fireworks resulting in ozone titration, like what happens alongside roads from vehicle NOx emissions. Studies have found that NOx concentrations can increase by 25–50% or more from fireworks [58,59]. While chemical transport and fate modeling would need to be conducted to be sure, we hypothesize that it is likely that the higher ozone levels following a fireworks event are the result of recirculation of precursor pollutants from the day before into the local atmosphere the following morning, allowing for enhanced photochemical production of ozone when the sun comes up in the morning. Cooking also emits NOx from fuel combustion, which is likely a cause of the observed ozone titration.
During the evening hours, the atmospheric conditions become more stable, leading to pollutant accumulation in a shallow layer near the surface. This is likely a reason why cooking PM2.5 and BC concentrations start to increase later in the evening, after 20:00, as the stability increases and pollutants accumulate near the surface [60]. Later in the evening, after the cooking rates are subsiding, there is typically a decrease in PM2.5 and BC concentrations associated with pollution as the local emissions from cooking decrease.
The Near and Far nomenclatures were used to describe linear proximity between sensors and sources. However, only Draper Days had sensors aligned on the same side of the fireworks and cooking emissions. For both WestFest and Butlerville Days, the sensors were on opposite sides of the emission sources. This may be one of the factors leading to relatively different pollution patterns at the Near and Far sensors for both events. Although pollution plumes are expected to spread relatively homogeneously during the more stable evening hours, these findings highlight the micro-scale effects of the interplay between emission sources and their environment. Furthermore, due to siting restrictions, the Butlerville Days sensors were positioned substantially farther (nearly 1 km) away compared to 100–600 m for the other two events. A clear impact of this is that the wildfire signal was much higher than either fireworks or cooking, showing the relationship between sensor proximity and readings. To our knowledge, no previous studies have looked at micro-scale variations in pollution across short distances of less than a kilometer at multiple sites surrounding fireworks or cooking. The spatiotemporal analyses of firework pollution in the literature are over broader regions, such as those observed by satellite retrievals over India [61], or comparing city-scales [62] or urban and rural firework-induced pollution [63].
4.2. Health and Policy Implications
The health impacts of elevated pollution are well known. A study in Nagpur, India, during the Diwali festival found up to a tenfold increase in particulate pollution [64]. As discussed by Puthussery, et al. [65], some inhaled particulate matter pollution can induce cellular oxidative stress, known as oxidative potential. In that same study, fireworks from the Diwali festival were found to contribute 72% of the oxidative potential during the study period [65].
Several communities host regular large gatherings which not only concentrate large groups of people but also expose them to high levels of air contaminants. However, many countries have identified the health risks associated with these events and have taken steps to minimize exposure. For example, Salt Lake City has replaced fireworks with drone shows to celebrate Independence Day and Pioneer Day [66]. Although replacing fireworks with LEDs or drone shows was originally met with some resistance, the public seemed to enjoy the new attractions [67]. Other areas in the world have also had control measures implemented and follow-up studies have demonstrated the positive impacts of restrictions on improving air quality by decreasing use of fireworks over time [68,69]. In China, the implementation of fireworks regulations during annual festivals has resulted in significant reductions in PM2.5 pollution and corresponding benefits to human health [19,70].
This study focused on short-term high-polluting events; however, the study sites also had an intrinsic set of background pollution due to being located near highly traveled roads. Furthermore, Butlerville Days took place just before a wildfire event. The compounded contaminant concentrations of urban emissions, pollution hotspots, and wildfires have been found to result in hazardous pollutant levels [71,72]. It is also worth noting that while fireworks generally emit pollutants throughout a relatively tall column, festival cooking generally takes place at closer to breathing height (0.5–1.5 m). The food truck industry has grown rapidly in the last decade in many cities in the USA and worldwide, including by more than 400% in Salt Lake City [73,74]. This growth is expected to continue throughout the next decade, with an increase in use of buses and vans and larger mobile units [75]. A recent study found that volatile organic compounds from cooking, from both fixed-location restaurants and mobile food trucks, are a major source of pollutants in urban areas [76]. This additional exposure consideration must be included in any public health risk assessment and take into consideration the exposure of the cooking staff. Additionally, the impact on morning air quality after fireworks has been found to be non-negligible and could be a concern for neighboring communities.
4.3. Future Work
A challenging aspect of this study is the need to focus on pollution observations immediately next to the pollution events due to the complexity of local urban and terrain-driven flow patterns which are not resolved by available numerical modeling or observational data. Without more detailed meteorology and emission data, we cannot be sure that the full extent of the pollution events is being captured during the events described in this manuscript, due to the local scale complexity of the wind flows and uncertainty of the exact start and end times of emissions from the events, but this study provides a starting point for documenting the impacts of these various pollution events on the ambient air quality. An important secondary consideration associated with firework pollution emissions is the height at which the fireworks are detonated. While limited research exists, several studies indicate that firework detonation pollution “bursts” occur at different altitudes ranging from 200 to 400 m above the ground [77,78]. Correlation coefficients between pollution observations on the ground and aerosol optical depth were found to be less than 0.35 at altitudes between 200 and 1000 from the ground, indicating the challenge with linking firework detonation-level pollution with surface observations [77]. The gradient in vertical profiles of firework pollution also varies seasonally and as a function of boundary layer stability and temperature [77]. Thus, numerical simulations and vertical profiles of pollution from aircraft or profiling instruments would be needed to ascertain the combined vertical and horizontal transport of the firework pollution emissions for our study, neither of which were available in our case. However, the overall wind patterns at the nearest available weather stations were generally similar during pollution and non-pollution events, giving greater confidence in our results. Additionally, because the sensors are located so close to the pollution events, they are not as dependent on transport changes as a function of flow variability (any time pollution events occur, the pollutants are observed) compared to a more complex situation where the sensors were located further away. As discussed by Brown, et al. [79], the fate of transport in the Salt Lake Valley is driven at three scales: the “atmospheric mesoscale, city scale, and building scale.” Shallow up-valley and down-valley terrain-driven and thermally driven flows interact with slope flow and lake and land breeze circulations to yield complex flow patterns [56,79,80]. These complex flow patterns are often unresolved by mesoscale models or mesonets [81]. Lu and Zhong [82] found that the thermally driven valley flows were not resolved well by the WRF model even at 500 m resolution. Future work should focus on coupling complex meteorology with disaggregated emissions so that the transport of pollution outside of the immediate vicinity of the events can be better understood. This is what was proposed in a recent paper by Hallar, et al. [83] for wintertime inversions, but we argue here that this type of coupled meteorology and pollution observational and modeling study should be conducted year-round to cover all types of episodes, such as those documented in this paper. This would yield new insights into these pollution hotspots that cannot be gleaned at this time.
This study highlighted the importance of sensor positioning and proximity to emission sources to quantify emissions. Future work will focus on increasing both sensor density and length of data collection to characterize micro-scale pollutant concentrations from fireworks and cooking at events. As cooking was found to be a substantial short-range contributor, identifying the individual combustion sources as well as food being prepared could help researchers and public health officials understand which methods could be improved. Since firework plumes are expected to travel farther than cooking emissions, increasing the sensor deployment radius would help capture these emissions. The height of firework detonation and the variable vertical profiles of pollutants, as discussed earlier, result in more complex variations in micro-scale pollution levels in the vicinity of the Near and Far sites during fireworks events. In future studies, meteorological and emission analyses combined with multiple sensors located in close proximity would provide new insight into the variations in pollution exposure observed by attendees at various festivals as a function of flow direction, atmospheric stability and distance from fireworks (detonation height).
5. Conclusions
This study quantified the impact of fireworks and cooking emissions during short summer festivals using paired PM2.5, ozone, and BC sensors located at two locations nearby (less than 500 m distance) to the sources. Pollution levels were very elevated at these proximal sites. Our study identified the need for more pollution observations at greater distances downwind, in concert with trajectory models, to further understand how fireworks and cooking during events impact pollution.
Wind speed and direction were found to be mostly similar between the event and non-event periods. However, because the pollution sensors in the study were near the pollution event emission sources, this mitigated the importance of flow direction to pollution levels, as pollutant concentration tends to build up regardless of flow direction. Both fireworks and cooking activity increased PM2.5 and BC, while evening ozone was observed to drop during fireworks. The ozone concentration reductions during fireworks displays are likely associated with NOx titration due to fireworks and cooking emissions. These findings may support public health initiatives to reduce exposure to pollution derived from short-term events.
Author Contributions
Conceptualization, D.L.M., M.C., S.A.G. and C.A.; methodology, D.L.M., M.C., S.A.G. and C.A.; software, D.L.M. and S.A.G.; validation, D.L.M., E.T.C. and S.A.G.; formal analysis, D.L.M.; investigation, D.L.M. and E.T.C.; resources, C.A.; data curation, D.L.M. and S.A.G.; writing—original draft preparation, D.L.M. and E.T.C.; writing—review and editing, D.L.M., E.T.C., M.C., S.A.G. and C.A.; visualization, D.L.M. and E.T.C.; supervision, C.A.; project administration, C.A.; funding acquisition, C.A. All authors have read and agreed to the published version of the manuscript.
Funding
This research received no external funding.
Data Availability Statement
The data presented in this study is available on request from the corresponding author due to institutional privacy.
Acknowledgments
We would like to express our thanks to Charles Snow (Salt Lake County Health Department) who offered technical assistant on this project.
Conflicts of Interest
The authors declare no conflicts of interest.
Appendix A
Figure A1.
Pollutant concentration sensor comparison during Draper Days and non-festival days for (a) cooking Far PM2.5, (b) cooking Near ozone, (c) cooking Far ozone, and (d) cooking Far BC.
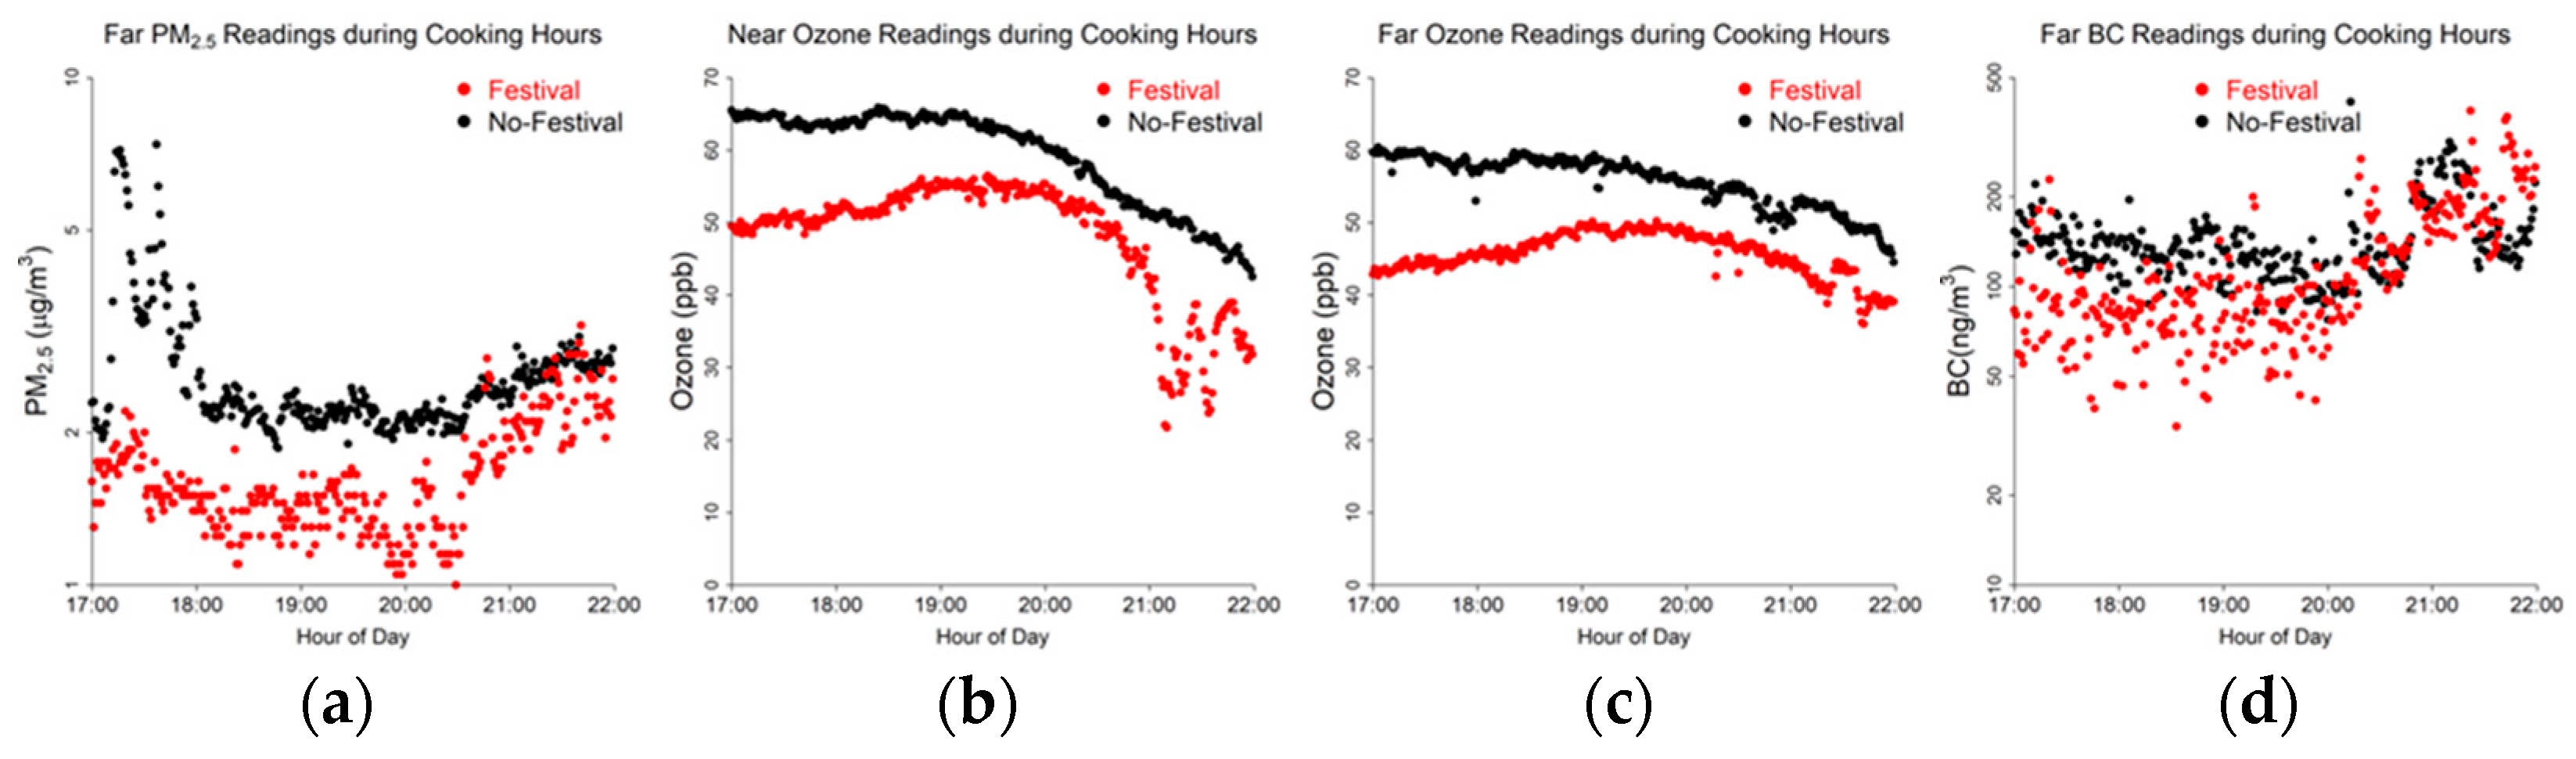
Figure A2.
Pollutant concentration sensor comparison during Butlerville Days and non-festival days for (a) fireworks Near PM2.5, (b) fireworks Near BC, (c) fireworks Far BC, and (d) cooking Far ozone.
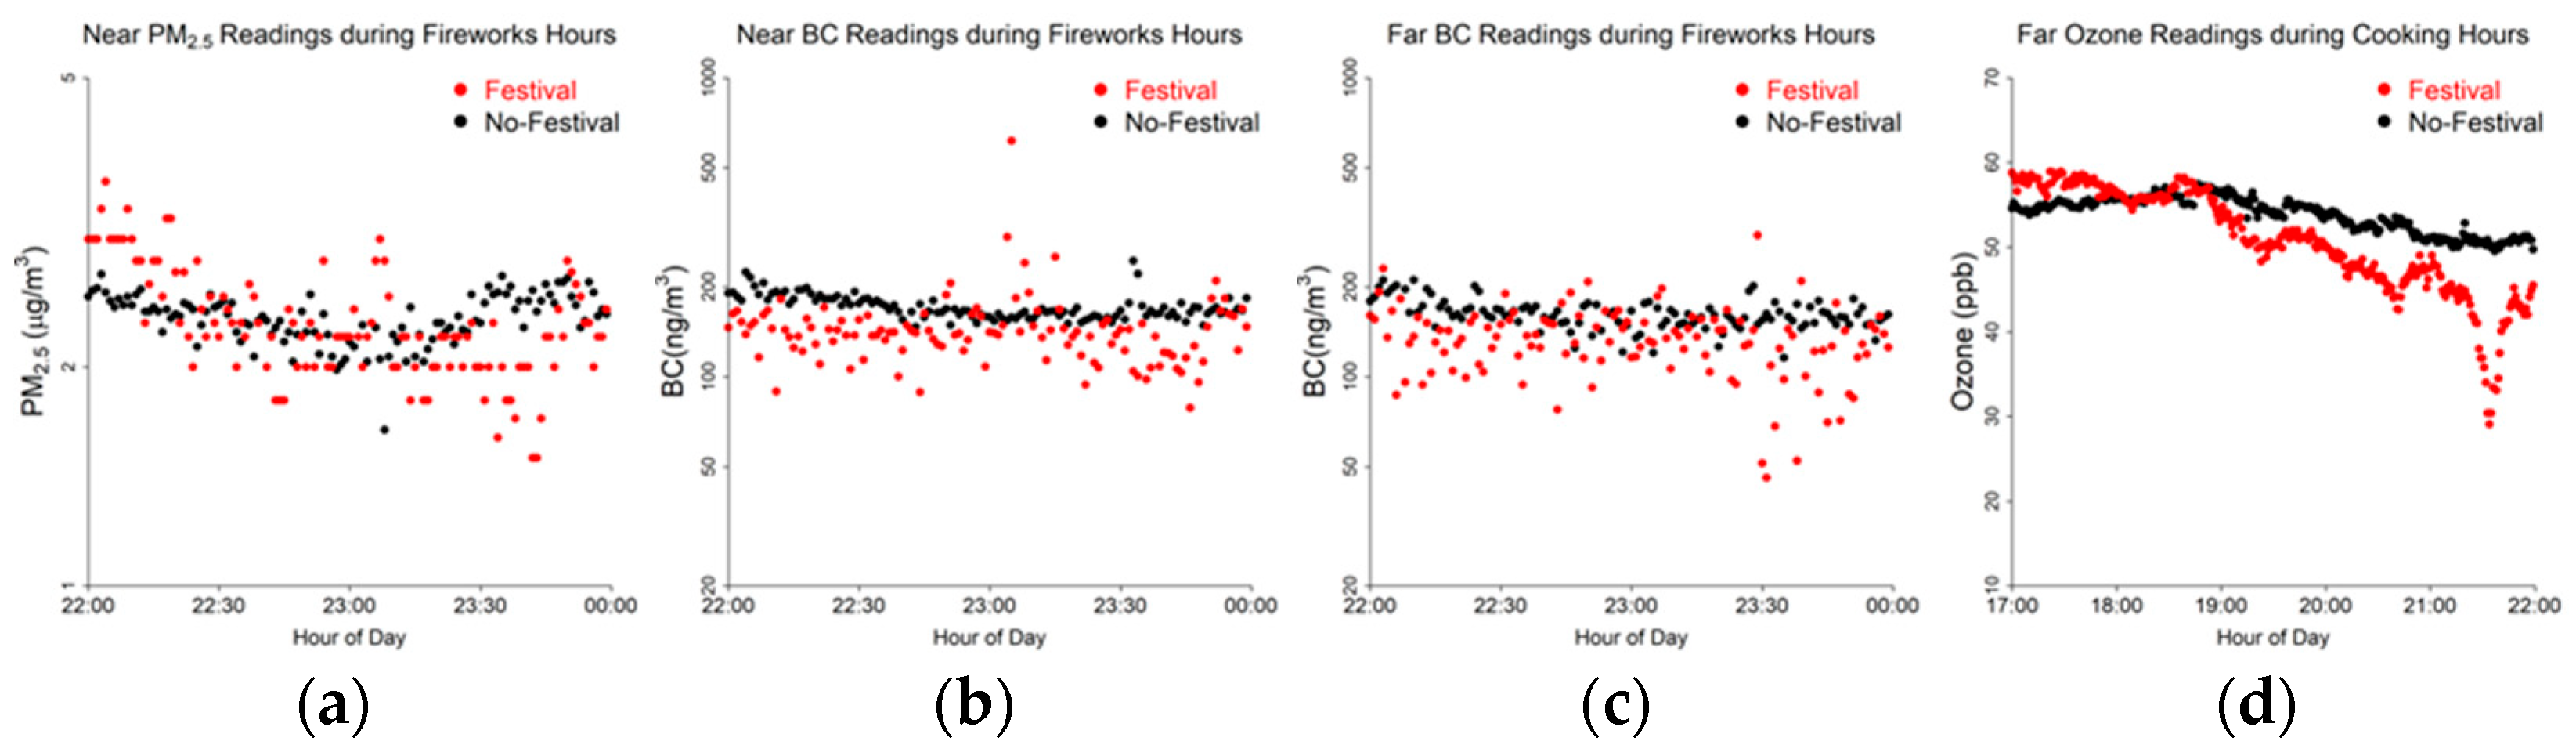
Figure A3.
Wind roses during WestFest and non-festival days: (a) fireworks hours during festival, (b) fireworks hours during non-festival days, (c) cooking hours during festival, and (d) cooking hours during non-festival days.
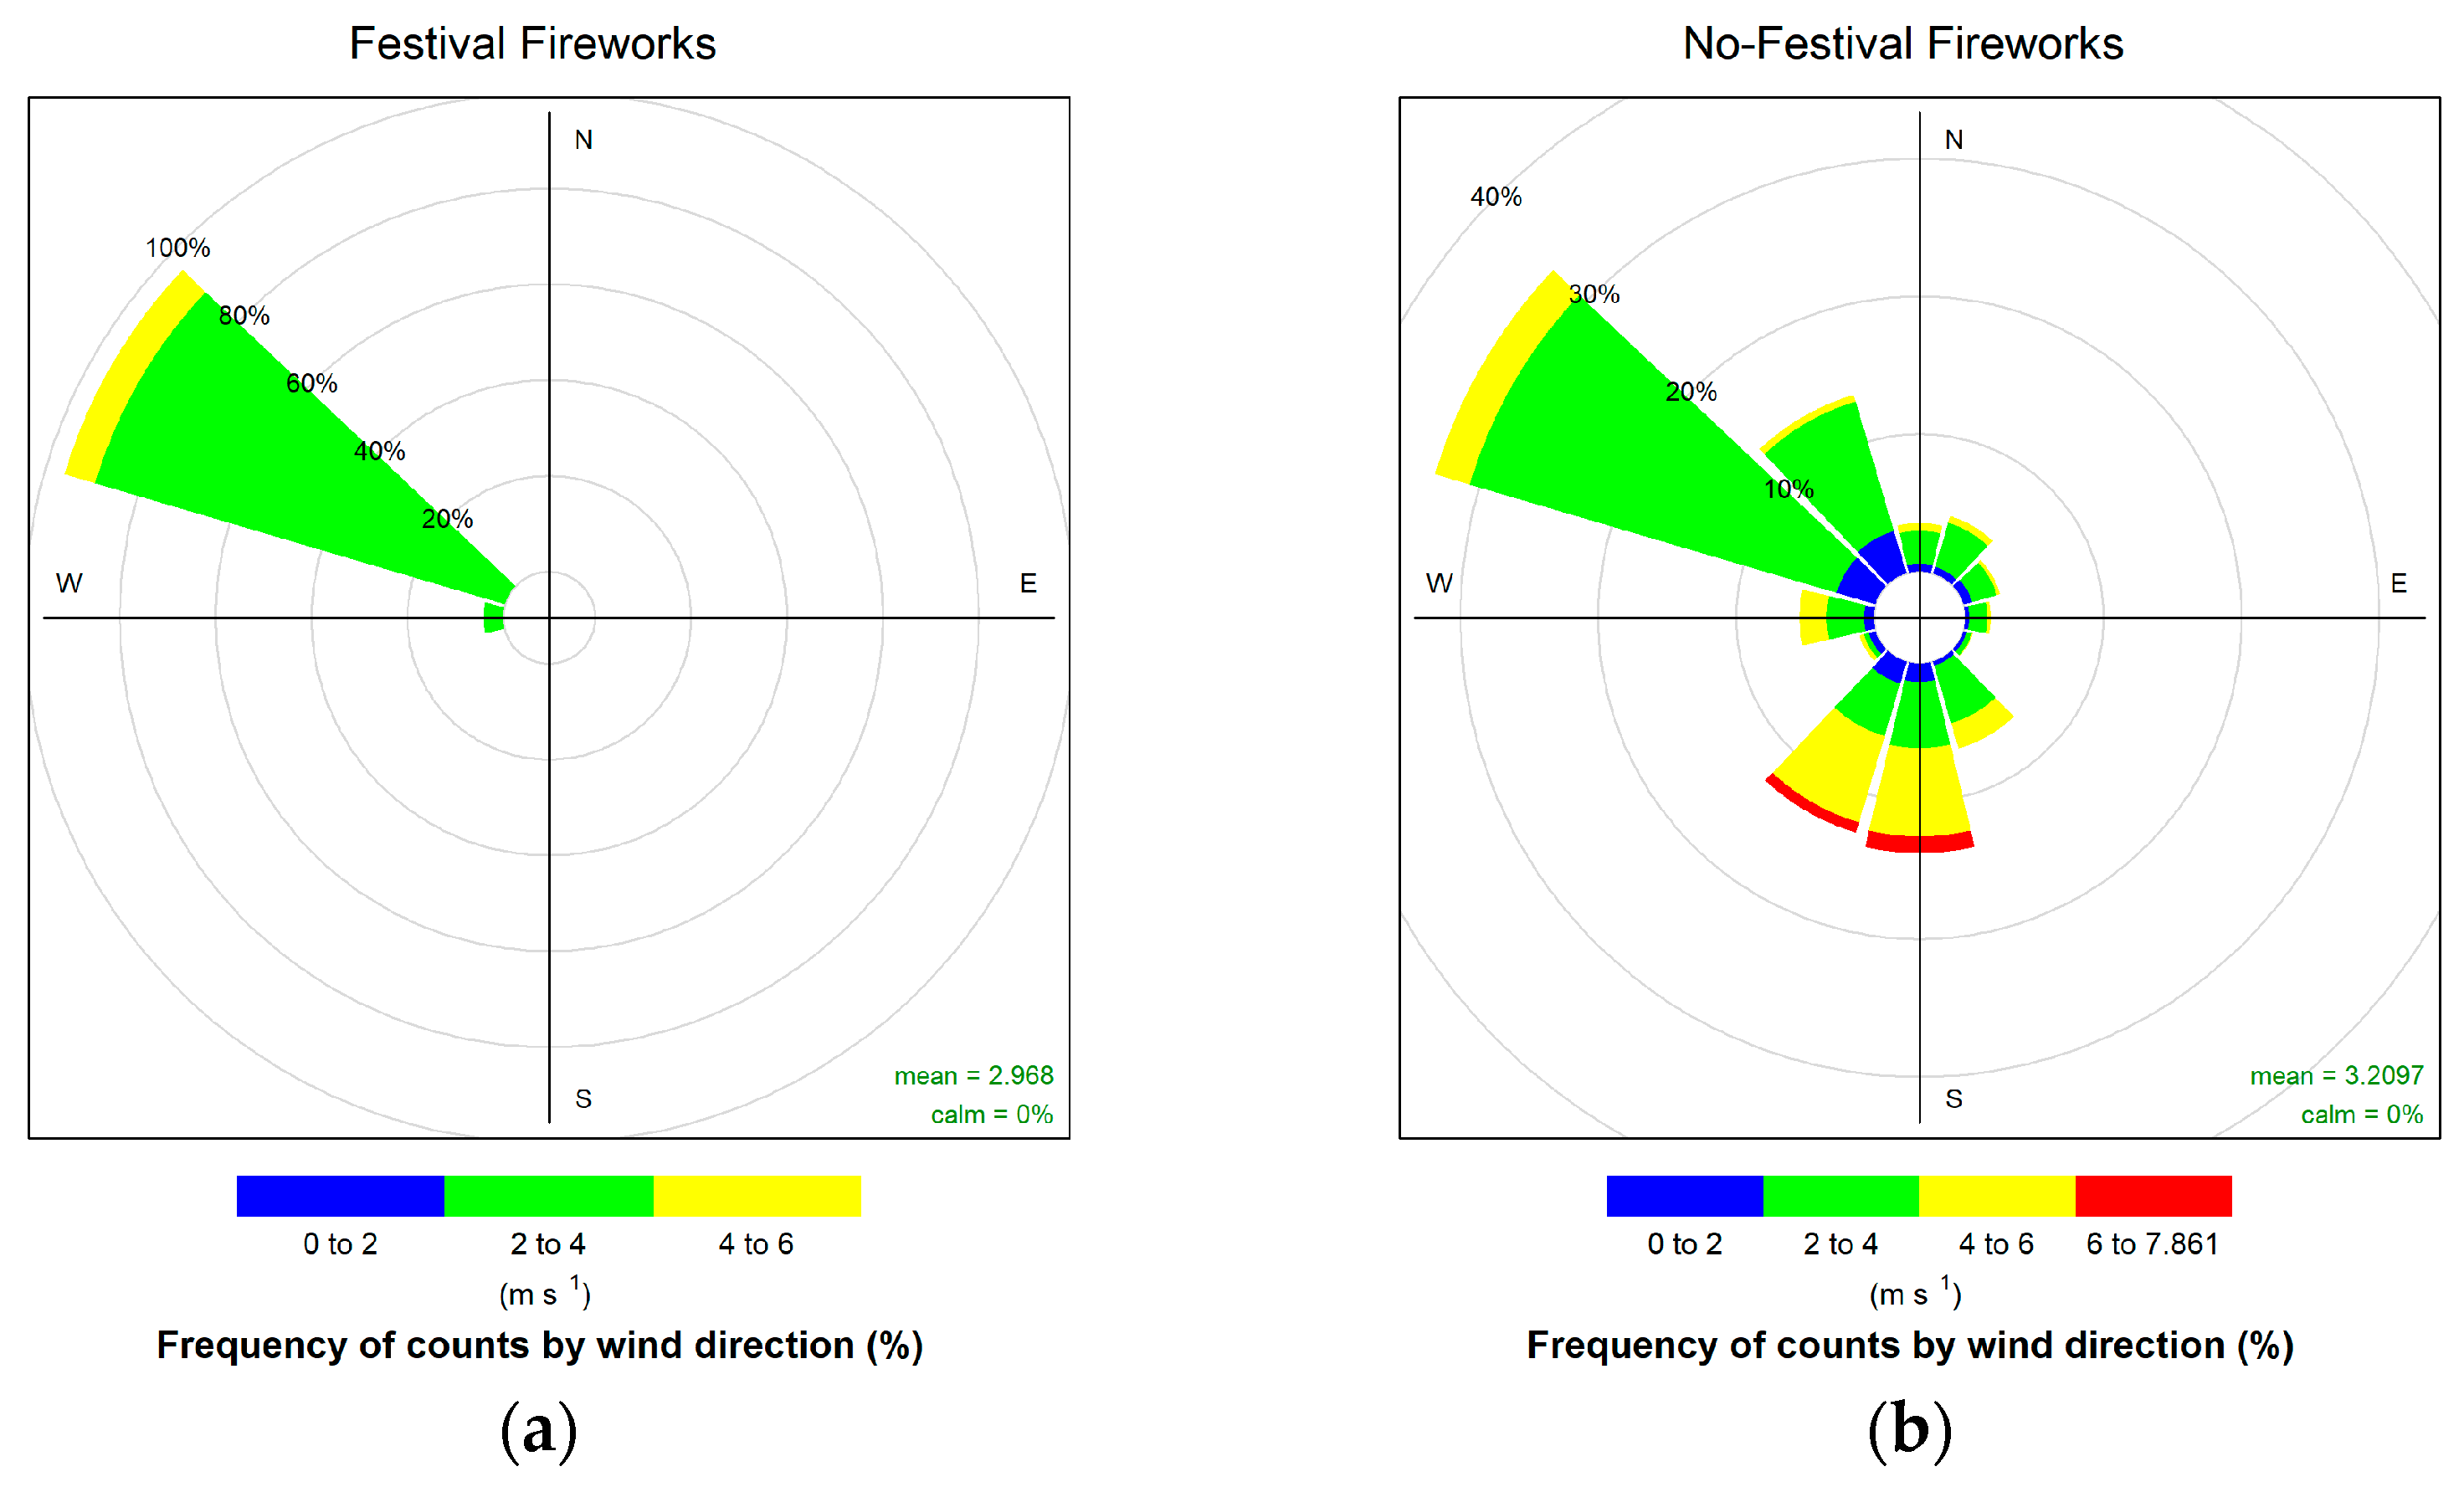
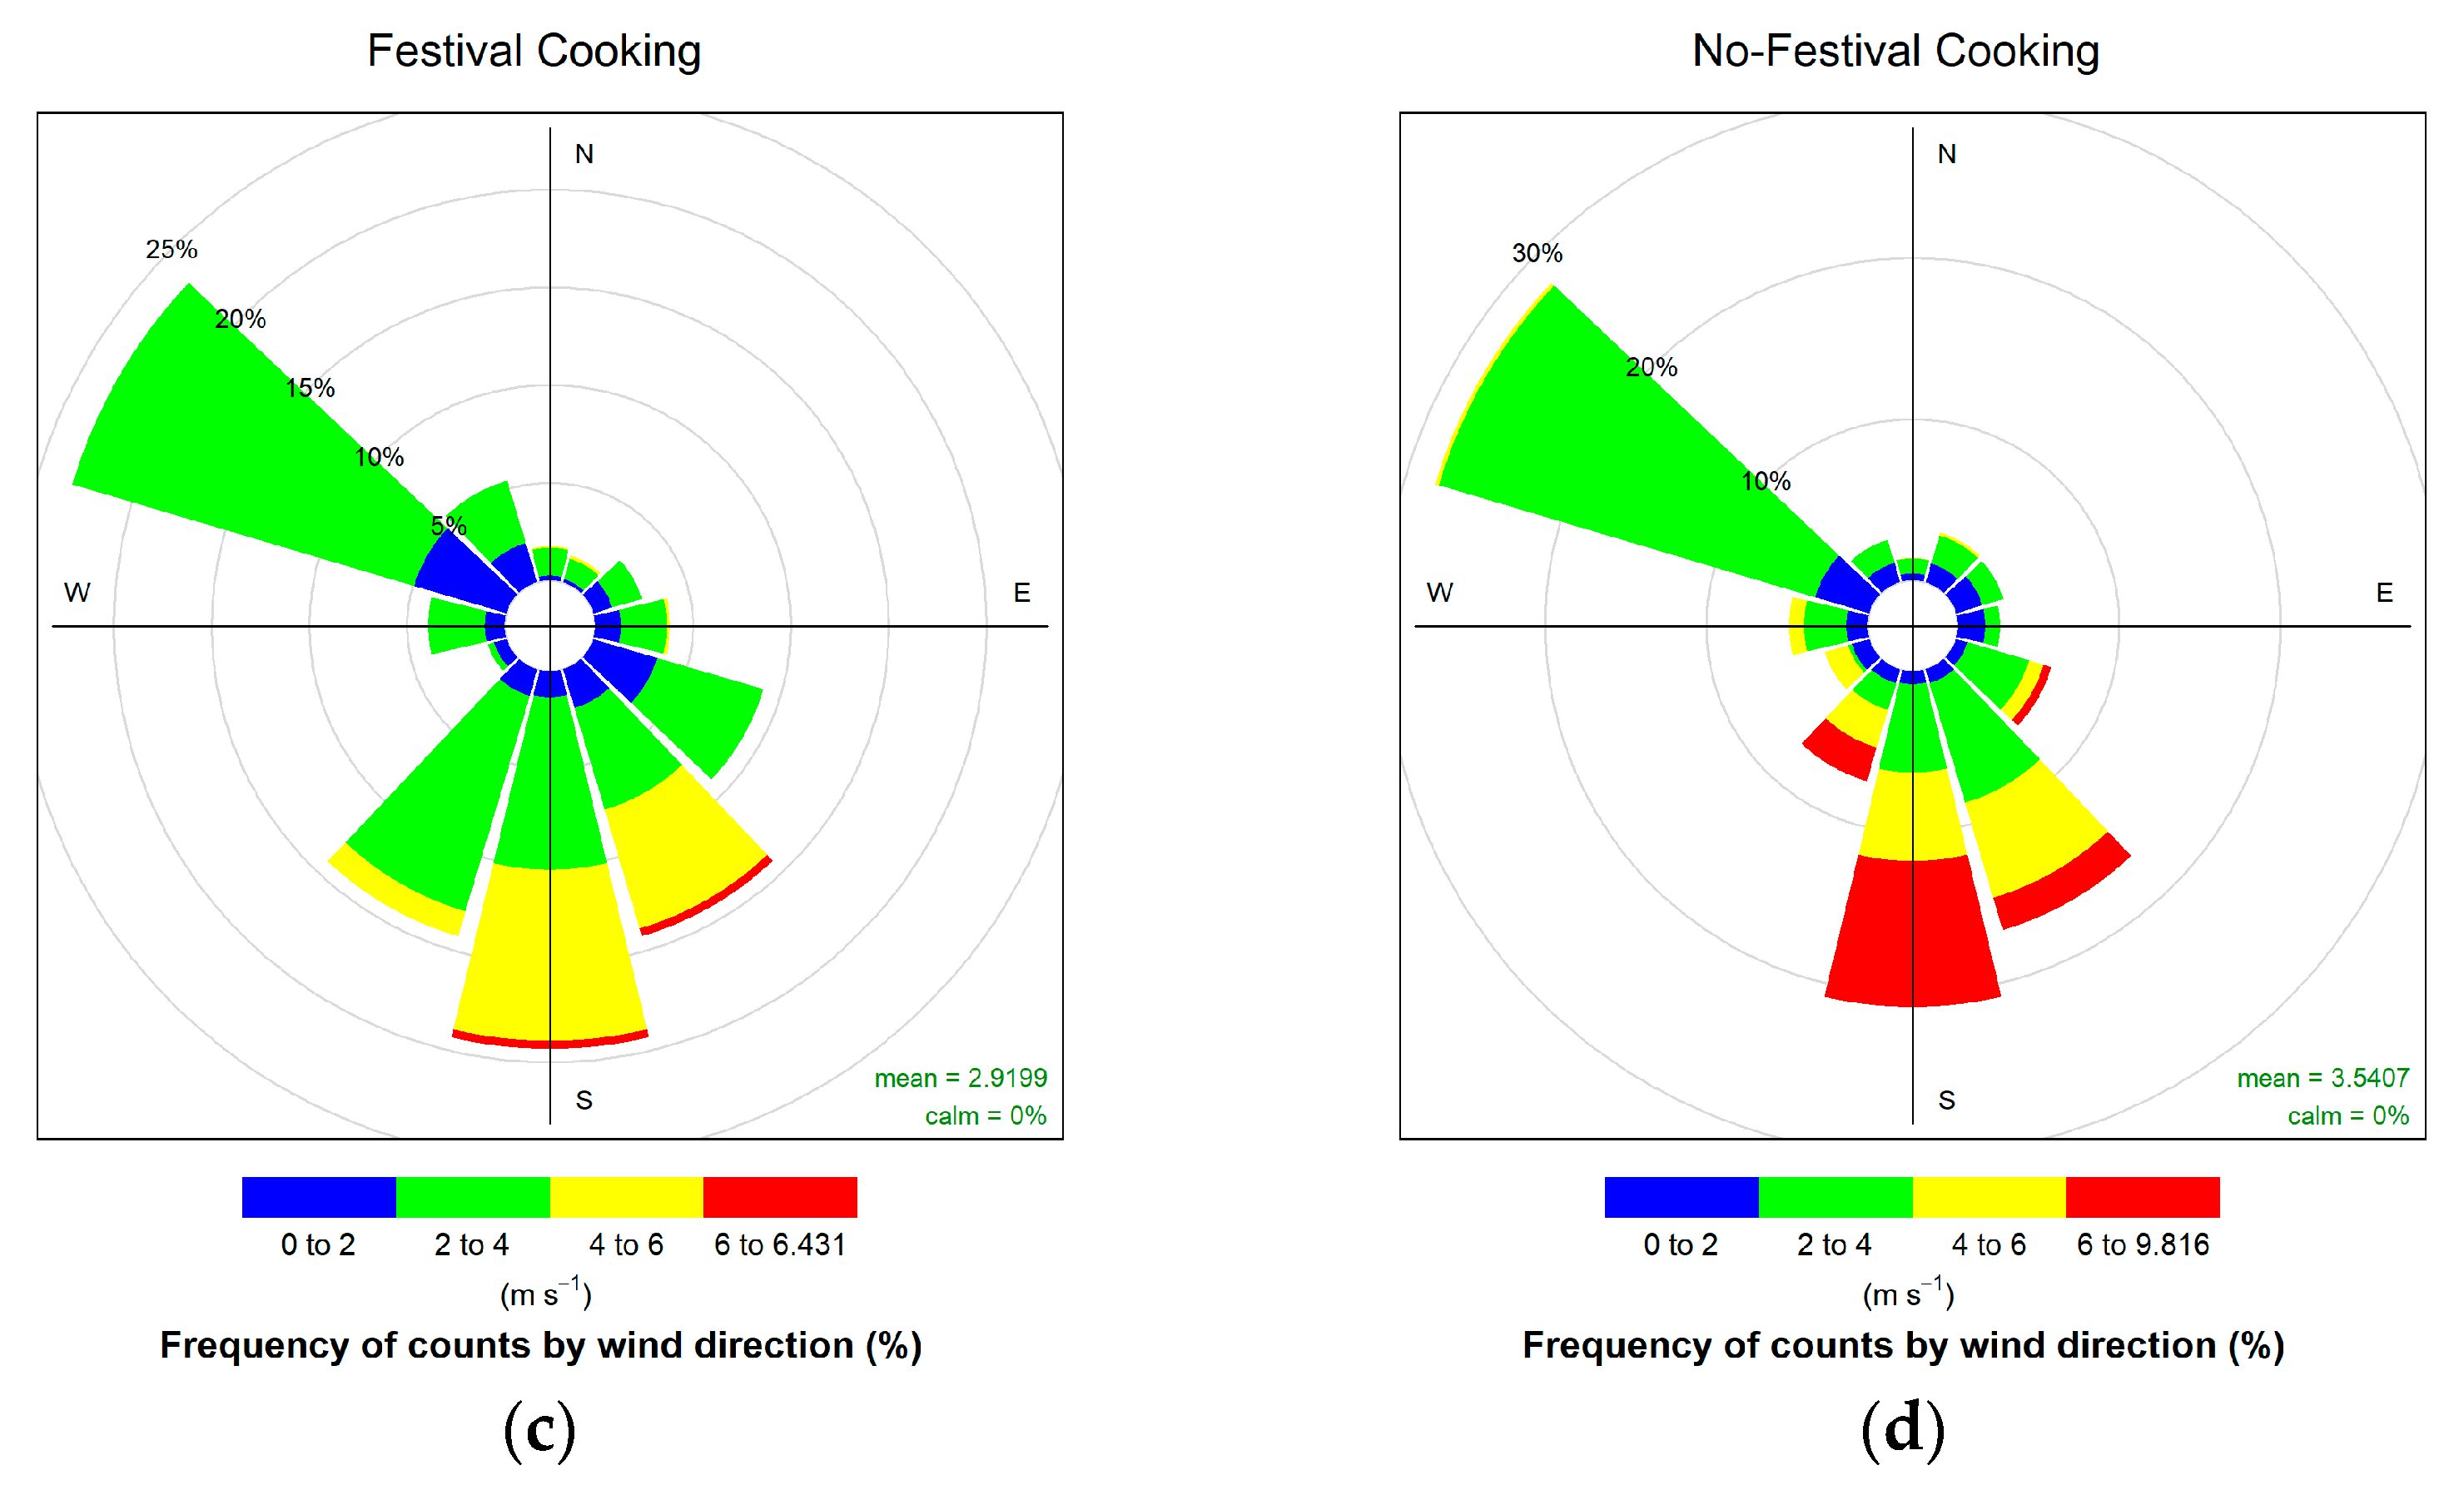
Figure A4.
Wind roses during Draper Days and non-festival days: (a) fireworks hours during festival, (b) fireworks hours during non-festival days, (c) cooking hours during festival, and (d) cooking hours during non-festival days.
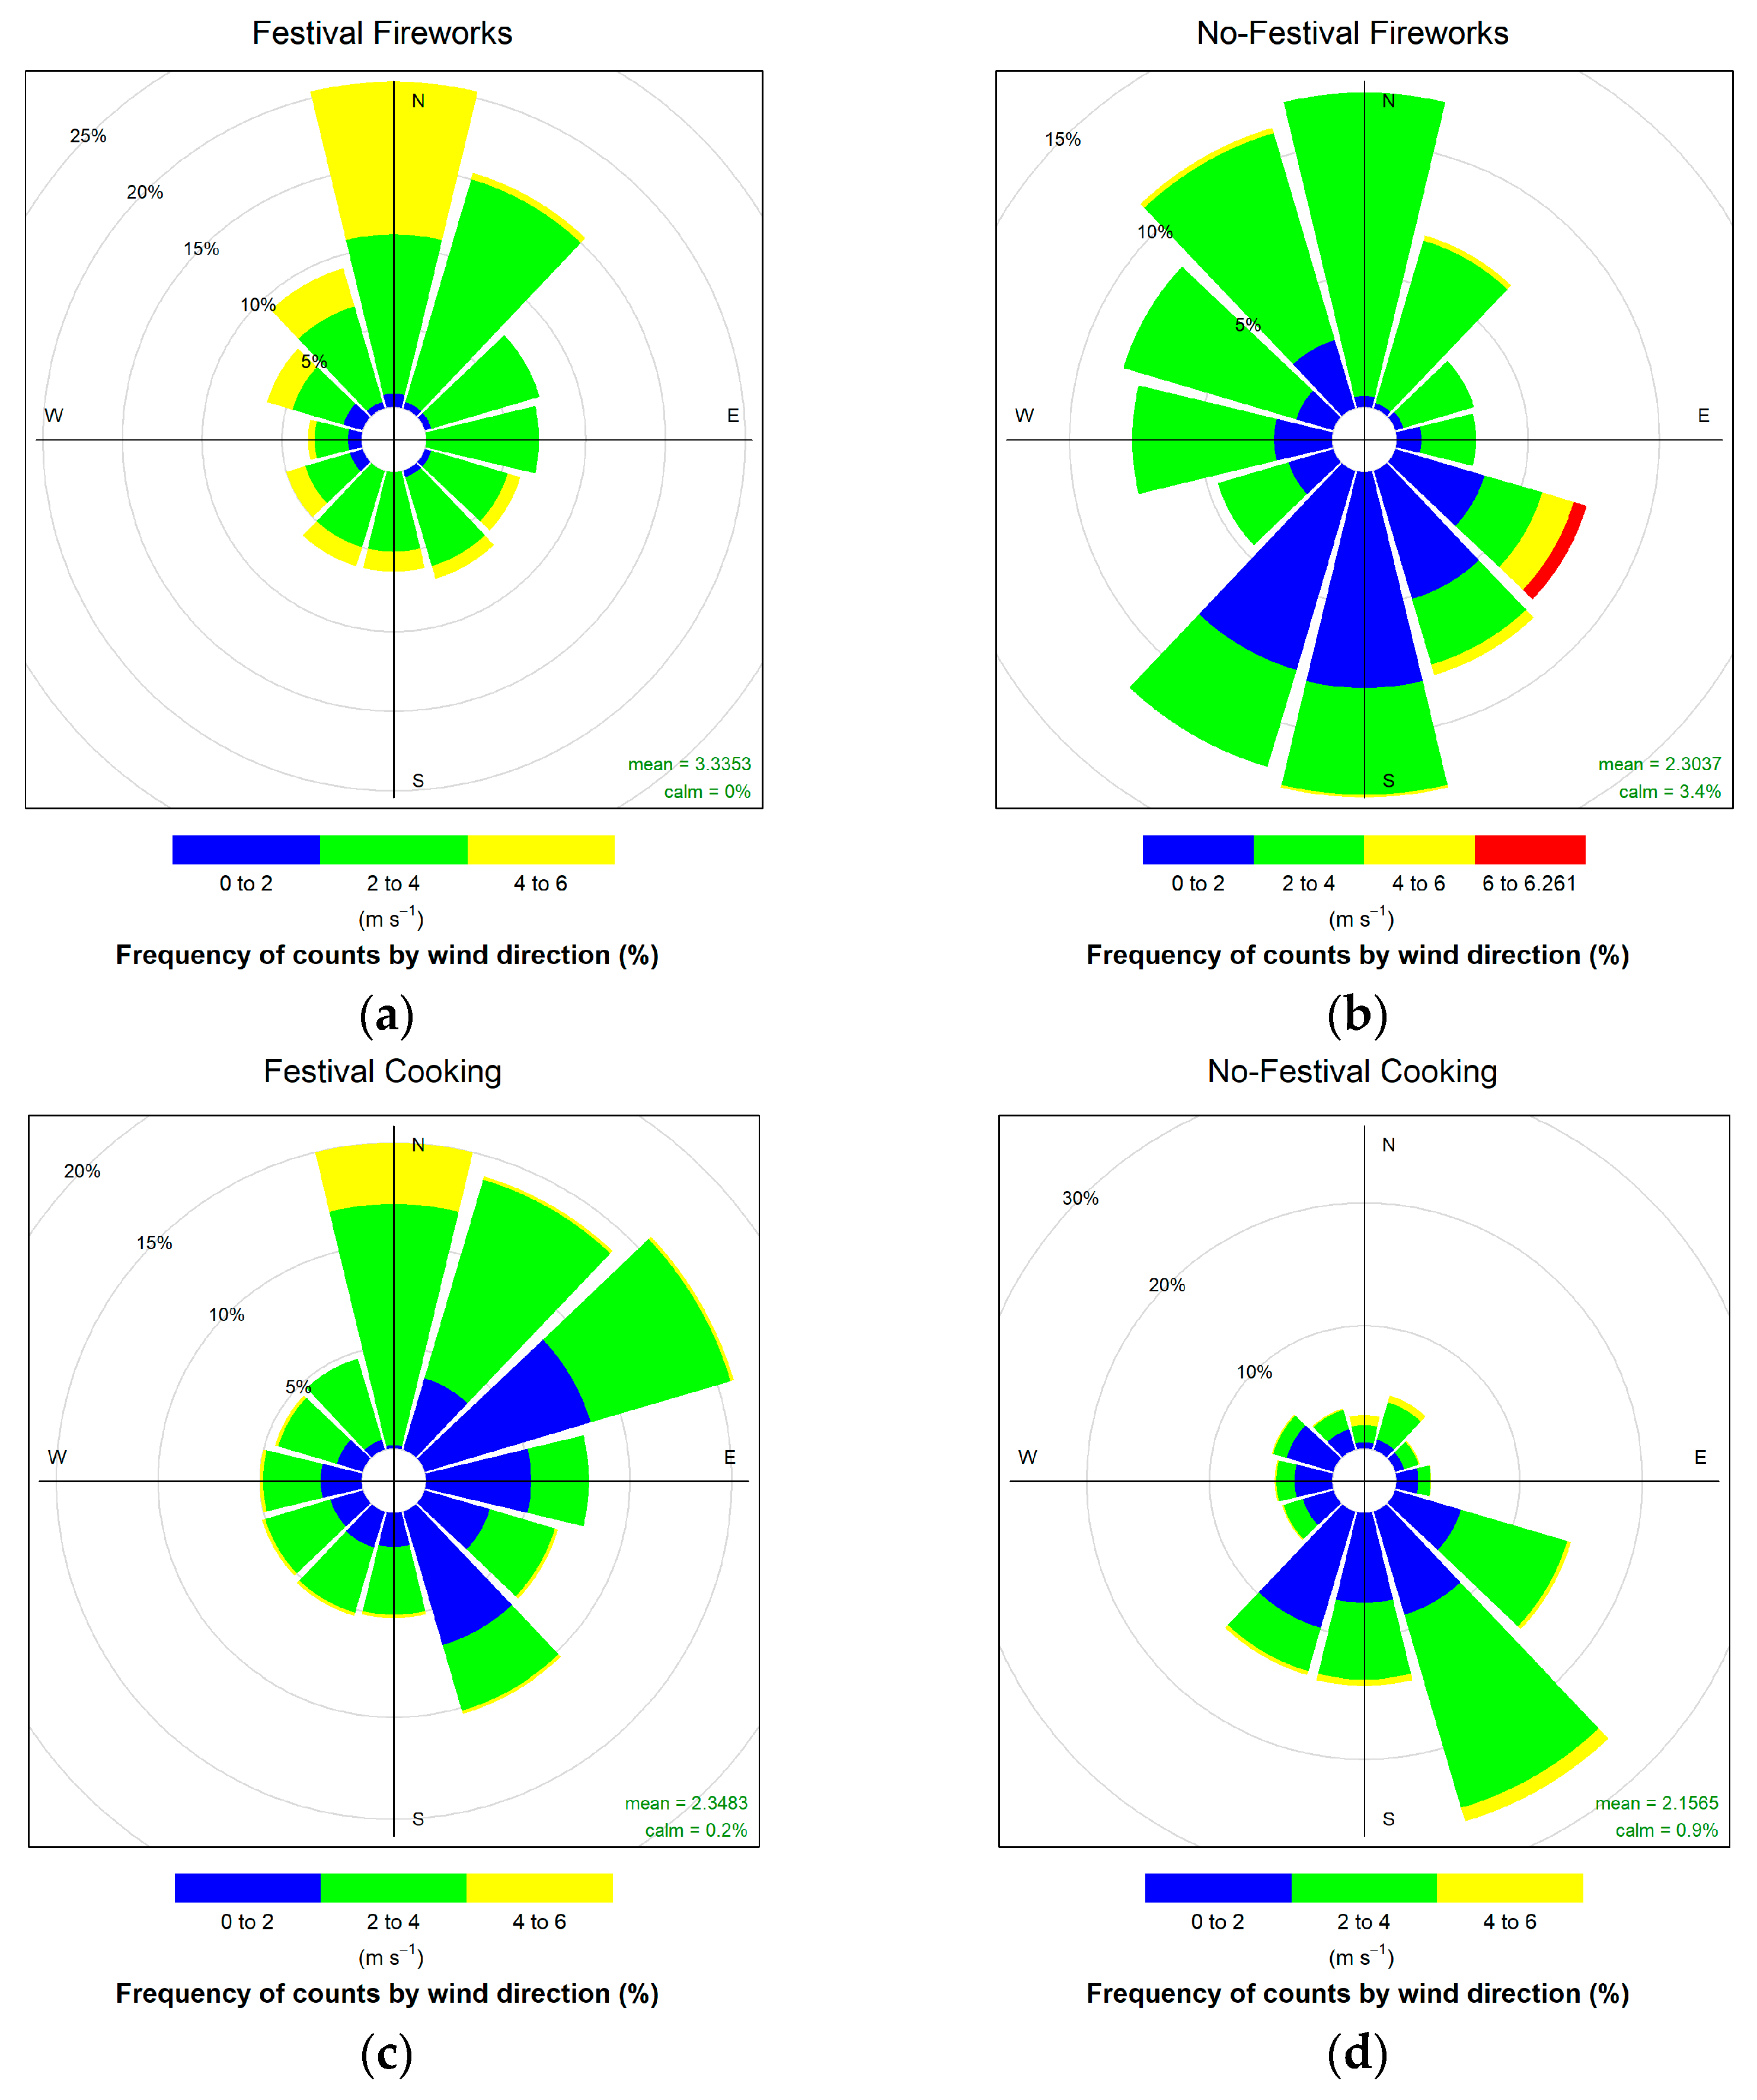
Figure A5.
Wind roses during Butlerville Days and non-festival days: (a) fireworks hours during festival, (b) fireworks hours during non-festival days, (c) cooking hours during festival, and (d) cooking hours during non-festival days.
References
- Li, S.; Lu, S.; Xu, X.; Zhao, N.; Li, A.; Xu, L. How human mega-events influence urban airborne PM2.5 pollution: A systematic review and meta-analysis. Environ. Pollut. 2021, 281, 117009. [Google Scholar] [CrossRef] [Scilit]
- Lin, C.-C. A review of the impact of fireworks on particulate matter in ambient air. J. Air Waste Manag. Assoc. 2016, 66, 1171–1182. [Google Scholar] [CrossRef] [Scilit]
- Singh, S.; Bisht, A. Environmental management in mass gatherings: A case study of Maha Kumbh Mela 2013 at Prayag, India. Int. J. Innov. Res. Sci. Technol. 2014, 1, 107–115. [Google Scholar]
- Malki-Epshtein, L.; Adzic, F.; Roberts, B.M.; Hathway, E.A.; Iddon, C.; Mustafa, M.; Cook, M. Measurement and rapid assessment of indoor air quality at mass gathering events to assess ventilation performance and reduce aerosol transmission of SARS-CoV-2. Build. Serv. Eng. Res. Technol. 2023, 44, 113–133. [Google Scholar] [CrossRef] [Scilit] [PubMed]
- Yerramsetti, V.S.; Sharma, A.R.; Gauravarapu Navlur, N.; Rapolu, V.; Dhulipala, N.C.; Sinha, P. The impact assessment of Diwali fireworks emissions on the air quality of a tropical urban site, Hyderabad, India, during three consecutive years. Environ. Monit. Assess. 2013, 185, 7309–7325. [Google Scholar] [CrossRef] [Scilit] [PubMed]
- Oroji, B.; Sadighzadeh, A.; Solgi, E. Effects of fireworks ancient celebrations on atmospheric concentration of particulate matter in Iran. Geol. Ecol. Landsc. 2020, 4, 104–110. [Google Scholar] [CrossRef] [Scilit]
- Drewnick, F.; Hings, S.S.; Curtius, J.; Eerdekens, G.; Williams, J. Measurement of fine particulate and gas-phase species during the New Year’s fireworks 2005 in Mainz, Germany. Atmos. Environ. 2006, 40, 4316–4327. [Google Scholar] [CrossRef] [Scilit]
- Seidel, D.J.; Birnbaum, A.N. Effects of Independence Day fireworks on atmospheric concentrations of fine particulate matter in the United States. Atmos. Environ. 2015, 115, 192–198. [Google Scholar] [CrossRef] [Scilit]
- Mlakar, P.; Božnar, M.Z.; Grašič, B.; Popović, D. Fireworks air pollution in Slovenia. Int. J. Environ. Pollut. 2012, 50, 31–40. [Google Scholar] [CrossRef] [Scilit]
- Vianna, N.A.; Novaes, P.; Gnoatto, N.; Miraglia, S.; Saldiva, P.H.; Andrade, L.R. Diesel Emissions Increase Air Pollution during the Carnival Festival in Salvador, Bahia-Brazil. preprint 2018. [Google Scholar] [CrossRef] [Scilit]
- Fan, S.; Li, Y.; Liu, C. Are environmentally friendly fireworks really “green” for air quality? A study from the 2019 National Day fireworks display in Shenzhen. Environ. Sci. Technol. 2021, 55, 3520–3529. [Google Scholar] [CrossRef] [Scilit]
- Moreno, T.; Querol, X.; Alastuey, A.; Amato, F.; Pey, J.; Pandolfi, M.; Kuenzli, N.; Bouso, L.; Rivera, M.; Gibbons, W. Effect of fireworks events on urban background trace metal aerosol concentrations: Is the cocktail worth the show? J. Hazard. Mater. 2010, 183, 945–949. [Google Scholar] [CrossRef] [Scilit] [PubMed]
- Pongpiachan, S.; Iijima, A.; Cao, J. Hazard quotients, hazard indexes, and cancer risks of toxic metals in PM10 during firework displays. Atmosphere 2018, 9, 144. [Google Scholar] [CrossRef] [Scilit]
- Song, Y.; Wan, X.; Bai, S.; Guo, D.; Ren, C.; Zeng, Y.; Li, Y.; Li, X. The characteristics of air pollutants during two distinct episodes of fireworks burning in a Valley City of North China. PLoS ONE 2017, 12, e0168297. [Google Scholar] [CrossRef] [Scilit] [PubMed]
- Saxena, P.; Srivastava, A.; Verma, S.; Shweta; Singh, L.; Sonwani, S. Analysis of atmospheric pollutants during fireworks festival ‘Diwali’at a residential site Delhi in India. In Measurement, Analysis and Remediation of Environmental Pollutants; Springer: Berlin/Heidelberg, Germany, 2020; pp. 91–105. [Google Scholar]
- Wang, Y.; Zhuang, G.; Xu, C.; An, Z. The air pollution caused by the burning of fireworks during the lantern festival in Beijing. Atmos. Environ. 2007, 41, 417–431. [Google Scholar] [CrossRef] [Scilit]
- Beig, G.; Chate, D.; Ghude, S.D.; Ali, K.; Satpute, T.; Sahu, S.; Parkhi, N.; Trimbake, H. Evaluating population exposure to environmental pollutants during Deepavali fireworks displays using air quality measurements of the SAFAR network. Chemosphere 2013, 92, 116–124. [Google Scholar] [CrossRef] [Scilit]
- Ravindra, K.; Kumar, S.; Mor, S. Long term assessment of firework emissions and air quality during Diwali festival and impact of 2020 fireworks ban on air quality over the states of Indo Gangetic Plains airshed in India. Atmos. Environ. 2022, 285, 119223. [Google Scholar] [CrossRef] [Scilit]
- Foreback, B.; Dada, L.; Daellenbach, K.R.; Yan, C.; Wang, L.; Chu, B.; Zhou, Y.; Kokkonen, T.V.; Kurppa, M.; Pileci, R.E. Measurement report: A multi-year study on the impacts of Chinese New Year celebrations on air quality in Beijing, China. Atmos. Chem. Phys. 2022, 22, 11089–11104. [Google Scholar] [CrossRef] [Scilit]
- Nasir, U.; Brahmaiah, D. Impact of fireworks on ambient air quality: A case study. Int. J. Environ. Sci. Technol. 2015, 12, 1379–1386. [Google Scholar] [CrossRef] [Scilit]
- Mishra, M.; Boopathy, R.; Mallik, C.; Das, T. The Diwali festival: Short-term high effect of fireworks emissions on particulates and their associated empirically calculated health risk assessment at Bhubaneswar city. Environ. Geochem. Health 2024, 46, 21. [Google Scholar] [CrossRef] [Scilit]
- Mehta, D.; Kumar, N.; Srivastava, A. Toxicity of ultrafine particles during Diwali’s firework: An in-vitro study of A549 cells. Toxicol. Environ. Health Sci. 2024, 16, 325–340. [Google Scholar] [CrossRef] [Scilit]
- Yu, K.-P.; Yang, K.R.; Chen, Y.C.; Gong, J.Y.; Chen, Y.P.; Shih, H.-C.; Lung, S.-C.C. Indoor air pollution from gas cooking in five Taiwanese families. Build. Environ. 2015, 93, 258–266. [Google Scholar] [CrossRef] [Scilit]
- Chafe, Z.A.; Brauer, M.; Klimont, Z.; Van Dingenen, R.; Mehta, S.; Rao, S.; Riahi, K.; Dentener, F.; Smith, K.R. Household cooking with solid fuels contributes to ambient PM2. 5 air pollution and the burden of disease. Environ. Health Perspect. 2014, 122, 1314–1320. [Google Scholar] [CrossRef] [Scilit] [PubMed]
- Zhao, Y.; Zhao, B. Emissions of air pollutants from Chinese cooking: A literature review. Build. Simul. 2018, 11, 977–995. [Google Scholar] [CrossRef] [Scilit]
- Chen, C.; Zhao, Y.; Zhao, B. Emission rates of multiple air pollutants generated from Chinese residential cooking. Environ. Sci. Technol. 2018, 52, 1081–1087. [Google Scholar] [CrossRef] [Scilit]
- Carter, T.J.; Shaw, D.R.; Carslaw, D.C.; Carslaw, N. Indoor cooking and cleaning as a source of outdoor air pollution in urban environments. Environ. Sci. Process. Impacts 2024, 26, 975–990. [Google Scholar] [CrossRef] [Scilit]
- Edwards, R.; Princevac, M.; Weltman, R.; Ghasemian, M.; Arora, N.K.; Bond, T. Modeling emission rates and exposures from outdoor cooking. Atmos. Environ. 2017, 164, 50–60. [Google Scholar] [CrossRef] [Scilit]
- Robinson, E.S.; Gu, P.; Ye, Q.; Li, H.Z.; Shah, R.U.; Apte, J.S.; Robinson, A.L.; Presto, A.A. Restaurant impacts on outdoor air quality: Elevated organic aerosol mass from restaurant cooking with neighborhood-scale plume extents. Environ. Sci. Technol. 2018, 52, 9285–9294. [Google Scholar] [CrossRef] [Scilit]
- Phillips, H.; Oh, J. Evaluation of Aldehydes, polycyclic aromatic hydrocarbons, and PM2. 5 levels in food trucks: A pilot study. Workplace Health Saf. 2020, 68, 443–451. [Google Scholar] [CrossRef] [Scilit]
- Tong, Z.; Zhang, K.M. The near-source impacts of diesel backup generators in urban environments. Atmos. Environ. 2015, 109, 262–271. [Google Scholar] [CrossRef] [Scilit]
- Eghomwanre, A.; Oyedele, P.; Ehanire, G.; Ebiziem, M.; Ojehanon, C.; Odumamwen, S.; Amadasun, F. Indoor Air Quality and Microclimatic conditions in selected Restaurants and Kitchens at a Tertiary Institution in Benin City, Nigeria. J. Appl. Sci. Environ. Manag. 2023, 27, 161–167. [Google Scholar] [CrossRef] [Scilit]
- Zhao, Y.; Tao, P.; Zhang, B.; Huan, C. Contribution of Chinese hot pot and barbecue restaurants on indoor environmental parameters. Aerosol Air Qual. Res. 2020, 20, 2920–2940. [Google Scholar] [CrossRef] [Scilit]
- ElSharkawy, M.F.; Ibrahim, O.A. Impact of the restaurant chimney emissions on the outdoor air quality. Atmosphere 2022, 13, 261. [Google Scholar] [CrossRef] [Scilit]
- Song, R.; Presto, A.A.; Saha, P.; Zimmerman, N.; Ellis, A.; Subramanian, R. Spatial variations in urban air pollution: Impacts of diesel bus traffic and restaurant cooking at small scales. Air Qual. Atmos. Health 2021, 14, 2059–2072. [Google Scholar] [CrossRef] [Scilit]
- Yang, D.L. Evaluation of Ventilation Performance and Respirable Particles in Food Trucks. Master’s Thesis, The University of Alabama at Birmingham, Birmingham, AL, USA, 2022. [Google Scholar]
- Mousavi, A.; Yuan, Y.; Masri, S.; Barta, G.; Wu, J. Impact of 4th of July fireworks on spatiotemporal PM2. 5 concentrations in California based on the PurpleAir Sensor Network: Implications for policy and environmental justice. Int. J. Environ. Res. Public Health 2021, 18, 5735. [Google Scholar] [CrossRef] [Scilit]
- Masri, S.; Flores, L.; Rea, J.; Wu, J. Race and street-level firework legalization as primary determinants of July 4th air pollution across Southern California. Atmosphere 2023, 14, 401. [Google Scholar] [CrossRef] [Scilit]
- Marcy, M.J.; Carling, G.T.; Thompson, A.N.; Bickmore, B.R.; Nelson, S.T.; Rey, K.A.; Fernandez, D.P.; Heiner, M.; Adams, B.R. Trace element chemistry and strontium isotope ratios of atmospheric particulate matter reveal air quality impacts from mineral dust, urban pollution, and fireworks in the Wasatch Front, Utah, USA. Appl. Geochem. 2024, 162, 105906. [Google Scholar] [CrossRef] [Scilit]
- Mendoza, D.L.; Benney, T.M.; Crosman, E.T.; Bares, R.; Mallia, D.V.; Pirozzi, C.S.; Freeman, A.L.; Boll, S. Using Indoor and Outdoor Measurements to Understand Building Protectiveness against Wildfire, Atmospheric Inversion, and Firework PM2.5 Pollution Events. Environments 2024, 11, 186. [Google Scholar] [CrossRef] [Scilit]
- Mendoza, D.L.; Benney, T.M.; Boll, S. Long-term analysis of the relationships between indoor and outdoor fine particulate pollution: A case study using research grade sensors. Sci. Total Environ. 2021, 776, 145778. [Google Scholar] [CrossRef] [Scilit]
- Long, R.W.; Eatough, N.L.; Eatough, D.J.; Meyer, M.B.; Wilson, W.E. Continuous determination of fine particulate matter mass in the Salt Lake City Environmental Monitoring project: A comparison of real-time and conventional TEOM monitor results. J. Air Waste Manag. Assoc. 2005, 55, 1782–1796. [Google Scholar] [CrossRef] [Scilit]
- Google Maps. Available online: https://www.google.com/maps (accessed on 12 December 2025).
- ABC4.com. Westfest’s 44th Annual Celebration. Available online: https://www.abc4.com/gtu/westfests-44th-annual-celebration/ (accessed on 11 November 2024).
- West Valley City. WestFest. Available online: https://www.wvc-ut.gov/2034/WestFest (accessed on 16 November 2024).
- Draper City. Draper Days 2023 Interactive Events Map. Available online: https://experience.arcgis.com/experience/79e4cbd4fd1040b18173cedf6a6fc41e (accessed on 16 November 2024).
- Draper City. Draper Days 2024 Sponsorhip Opportunities. Available online: https://www.draperutah.gov/events-programs/community-events/draper-days/ (accessed on 25 January 2026).
- Cottonwood Heights. Butlerville Days. Available online: https://www.cottonwoodheights.utah.gov/community/events/butlerville-days/ (accessed on 16 November 2024).
- Met One Instruments Inc. ES-642 Dust Monitor Operation Manual; Met One Instruments Inc: Grants Pass, OR, USA, 2013. [Google Scholar]
- Met One Instruments Inc. C-12 Black Carbon Monitor Observation Manual; Met One Instruments Inc: Grants Pass, OR, USA, 2022. [Google Scholar]
- 2B Technologies Inc. Ozone Monitor Operation Manual Model 205; 2B Technologies Inc: Broomfield, CO, USA, 2024. [Google Scholar]
- Horel, J.; Splitt, M.; Dunn, L.; Pechmann, J.; White, B.; Ciliberti, C.; Lazarus, S.; Slemmer, J.; Zaff, D.; Burks, J. Mesowest: Cooperative Mesonets in the Western United States. Bull. Am. Meteorol. Soc. 2002, 83, 211–225. [Google Scholar] [CrossRef] [Scilit]
- United States Environmental Protection Agency. Air Quality Index (AQI) Basics. Available online: https://www.airnow.gov/aqi/aqi-basics/ (accessed on 12 December 2023).
- Crawford, B.; Christen, A.; McKendry, I. Diurnal course of carbon dioxide mixing ratios in the urban boundary layer in response to surface emissions. J. Appl. Meteorol. Climatol. 2016, 55, 507–529. [Google Scholar] [CrossRef] [Scilit]
- Blaylock, B.K.; Horel, J.D.; Crosman, E.T. Impact of Lake Breezes on Summer Ozone Concentrations in the Salt Lake Valley. J. Appl. Meteorol. Climatol. 2017, 56, 353–370. [Google Scholar] [CrossRef] [Scilit]
- Whiteman, C.D.; Zhong, S. Downslope flows on a low-angle slope and their interactions with valley inversions. Part I: Observations. J. Appl. Meteorol. Climatol. 2008, 47, 2023–2038. [Google Scholar] [CrossRef] [Scilit]
- ABC4.com. UPDATE: Box Elder Co. Fire Continues to Grow, 10% Containment. Available online: https://www.abc4.com/utah-weather/wildfire/new-wildfire-starts-in-west-utah-doubles-in-size-overnight/ (accessed on 9 October 2025).
- Barman, S.; Singh, R.; Negi, M.; Bhargava, S. Ambient air quality of Lucknow City (India) during use of fireworks on Diwali Festival. Environ. Monit. Assess. 2008, 137, 495–504. [Google Scholar] [CrossRef] [Scilit] [PubMed]
- Yavaş, S.P.; Baysan, C.; Önal, A.E. The effect of firework explosion at the fireworks factory on air pollutant levels. Anatol. J. Fam. Med. 2021, 4, 80. [Google Scholar] [CrossRef] [Scilit]
- Hanna, S.R.; Britter, R.; Franzese, P. A baseline urban dispersion model evaluated with Salt Lake City and Los Angeles tracer data. Atmos. Environ. 2003, 37, 5069–5082. [Google Scholar] [CrossRef] [Scilit]
- Kumar, M.; Singh, R.; Murari, V.; Singh, A.; Singh, R.; Banerjee, T. Fireworks induced particle pollution: A spatio-temporal analysis. Atmos. Res. 2016, 180, 78–91. [Google Scholar] [CrossRef] [Scilit]
- Liu, Z.; Liu, Q.; Cao, X.; Zhang, X. Effects of residential customs on spatio-temporal pollution characteristics of fireworks burning during Chinese New Year. Asia-Pac. J. Atmos. Sci. 2022, 58, 169–180. [Google Scholar] [CrossRef] [Scilit]
- Zhang, J.; Yang, L.; Chen, J.; Mellouki, A.; Jiang, P.; Gao, Y.; Li, Y.; Yang, Y.; Wang, W. Influence of fireworks displays on the chemical characteristics of PM2.5 in rural and suburban areas in Central and East China. Sci. Total Environ. 2017, 578, 476–484. [Google Scholar] [CrossRef] [Scilit]
- Khaparde, V.V.; Pipalatkar, P.P.; Pustode, T.; Rao, C.C.; Gajghate, D.G. Influence of burning of fireworks on particle size distribution of PM10 and associated barium at Nagpur. Environ. Monit. Assess. 2012, 184, 903–911. [Google Scholar] [CrossRef] [Scilit] [PubMed]
- Puthussery, J.V.; Dave, J.; Shukla, A.; Gaddamidi, S.; Singh, A.; Vats, P.; Salana, S.; Ganguly, D.; Rastogi, N.; Tripathi, S.N. Effect of biomass burning, diwali fireworks, and polluted fog events on the oxidative potential of fine ambient particulate matter in Delhi, India. Environ. Sci. Technol. 2022, 56, 14605–14616. [Google Scholar] [CrossRef] [Scilit] [PubMed]
- Salt Lake City. Salt Lake City Introduces Second Year of Drone Shows as a Safe, Spectacular Alternative to Fireworks. Available online: https://www.slc.gov/mayor/2024/07/02/salt-lake-city-introduces-second-year-of-drone-shows-as-a-safe-spectacular-alternative-to-fireworks/ (accessed on 9 October 2025).
- ABC4.com. Liberty Park Drone Show Draws Crowds. Available online: https://www.abc4.com/news/liberty-park-drone-show-draws-crowds/ (accessed on 9 October 2025).
- Lai, Y.; Brimblecombe, P. Changes in air pollutants from fireworks in chinese cities. Atmosphere 2022, 13, 1388. [Google Scholar] [CrossRef] [Scilit]
- Pang, N.; Gao, J.; Zhao, P.; Wang, Y.; Xu, Z.; Chai, F. The impact of fireworks control on air quality in four Northern Chinese cities during the Spring Festival. Atmos. Environ. 2021, 244, 117958. [Google Scholar] [CrossRef] [Scilit]
- Chen, S.; Jiang, L.; Liu, W.; Song, H. Fireworks regulation, air pollution, and public health: Evidence from China. Reg. Sci. Urban Econ. 2022, 92, 103722. [Google Scholar] [CrossRef] [Scilit]
- Mendoza, D.L.; Crosman, E.T.; Benney, T.M.; Anderson, C.; Gonzales, S.A. A Preliminary Case Study on the Compounding Effects of Local Emissions and Upstream Wildfires on Urban Air Pollution. Fire 2024, 7, 184. [Google Scholar] [CrossRef] [Scilit]
- Mendoza, D.L.; Crosman, E.T.; Anderson, C.; Chaudhari, M.; Gonzales, S.A. Comparing indoor and outdoor temperature and air pollution at an urban cooling center: A multiyear case study. Environ. Res. Health 2025, 3, 015010. [Google Scholar] [CrossRef] [Scilit]
- Carpenter, D.M.; Sweetland, K. Does the growth of food trucks threaten the sustainability of restaurants? Evidence from a nationwide analysis of US businesses. J. Foodserv. Bus. Res. 2025, 28, 650–671. [Google Scholar] [CrossRef] [Scilit]
- Koay, K.Y.; Cheah, C.W.; Ganesan, N. The rise of the food truck phenomenon: An integrated model of consumers’ intentions to visit food trucks. Br. Food J. 2023, 125, 3288–3303. [Google Scholar] [CrossRef] [Scilit]
- Alkaabi, K.; Mehmood, K. Exploring key factors influencing food truck businesses success: A case of the UAE. Eur. Bus. Rev. 2025, 37, 637–665. [Google Scholar] [CrossRef] [Scilit]
- Coggon, M.M.; Stockwell, C.E.; Xu, L.; Peischl, J.; Gilman, J.B.; Lamplugh, A.; Bowman, H.J.; Aikin, K.; Harkins, C.; Zhu, Q. Contribution of cooking emissions to the urban volatile organic compounds in Las Vegas, NV. Atmos. Chem. Phys. 2024, 24, 4289–4304. [Google Scholar] [CrossRef] [Scilit]
- Duanmu, L.; Chen, W.; Guo, L.; Fu, J.; You, B.; Yang, H.; Zhang, T. Concentrated fireworks display-induced changes in aerosol vertical characteristics and atmospheric pollutant emissions. Atmos. Environ. 2024, 322, 120370. [Google Scholar] [CrossRef] [Scilit]
- Zrnić, D.S.; Zhang, P.; Melnikov, V.; Kabela, E. Fireworks on weather radar and camera. Bull. Am. Meteorol. Soc. 2020, 101, E90–E108. [Google Scholar] [CrossRef] [Scilit]
- Brown, M.; Leach, M.; Calhoun, R.; Smith, S.; Stevens, D.; Reisner, J.; Lee, B.; Chin, S.; DeCroix, D. Multiscale modeling of air flow in Salt Lake City and the surrounding region. In Structures 2001: A Structural Engineering Odyssey; ASCE Library: Kansas City, MO, USA, 2001; pp. 1–15. [Google Scholar] [CrossRef] [Scilit]
- Pinto, J.; Parsons, D.; Brown, W.; Cohn, S.; Chamberlain, N.; Morley, B. Coevolution of down-valley flow and the nocturnal boundary layer in complex terrain. J. Appl. Meteorol. Climatol. 2006, 45, 1429–1449. [Google Scholar] [CrossRef] [Scilit]
- Zhong, S.; Chow, F.K. Meso-and fine-scale modeling over complex terrain: Parameterizations and applications. In Mountain Weather Research and Forecasting: Recent Progress and Current Challenges; Springer: Berlin/Heidelberg, Germany, 2012; pp. 591–653. [Google Scholar] [CrossRef] [Scilit]
- Lu, W.; Zhong, S. A numerical study of a persistent cold air pool episode in the Salt Lake Valley, Utah. J. Geophys. Res. Atmos. 2014, 119, 1733–1752. [Google Scholar] [CrossRef] [Scilit]
- Hallar, A.G.; Brown, S.S.; Crosman, E.; Barsanti, K.C.; Cappa, C.D.; Faloona, I.; Fast, J.; Holmes, H.A.; Horel, J.; Lin, J.; et al. Coupled Air Quality and Boundary-Layer Meteorology in Western US Basins during Winter: Design and Rationale for a Comprehensive Study. Bull. Am. Meteorol. Soc. 2021, 102, E2012–E2033. [Google Scholar] [CrossRef] [Scilit]

Disclaimer/Publisher’s Note: The statements, opinions and data contained in all publications are solely those of the individual author(s) and contributor(s) and not of MDPI and/or the editor(s). MDPI and/or the editor(s) disclaim responsibility for any injury to people or property resulting from any ideas, methods, instructions or products referred to in the content. |
© 2026 by the authors. Licensee MDPI, Basel, Switzerland. This article is an open access article distributed under the terms and conditions of the Creative Commons Attribution (CC BY) license.