Evaluation of Spatial Variability in Fecal Indicator Bacteria in Urban Recreational Lakes by One-Way ANOVA



Abstract
1. Introduction
- (i)
- quantify the spatial variability in microbiological indicators (E. coli and intestinal enterococci) across sampling locations within each lake;
- (ii)
- test whether observed spatial differences are statistically significant using one-way ANOVA;
- (iii)
- compare microbiological patterns between two contrasting urban lakes; and
- (iv)
- interpret the results in the context of European bathing water quality standards.
2. Experimental Part
2.1. Sampling
2.2. Determination of Microbiological Parameters
2.3. Method-Statistical Analysis
2.3.1. Statistical Frame
- Response variables: log10(E. coli) and log10(intestinal enterococci) [CFU/100 mL]
- Fixed factor: Sampling location
- Factor levels: Lake Bundek: 3 locations (B1–B3)
- Great Lake Jarun: 6 locations (TU01–TU06)
- Small Lake Jarun: 6 locations (TU07–TU12)
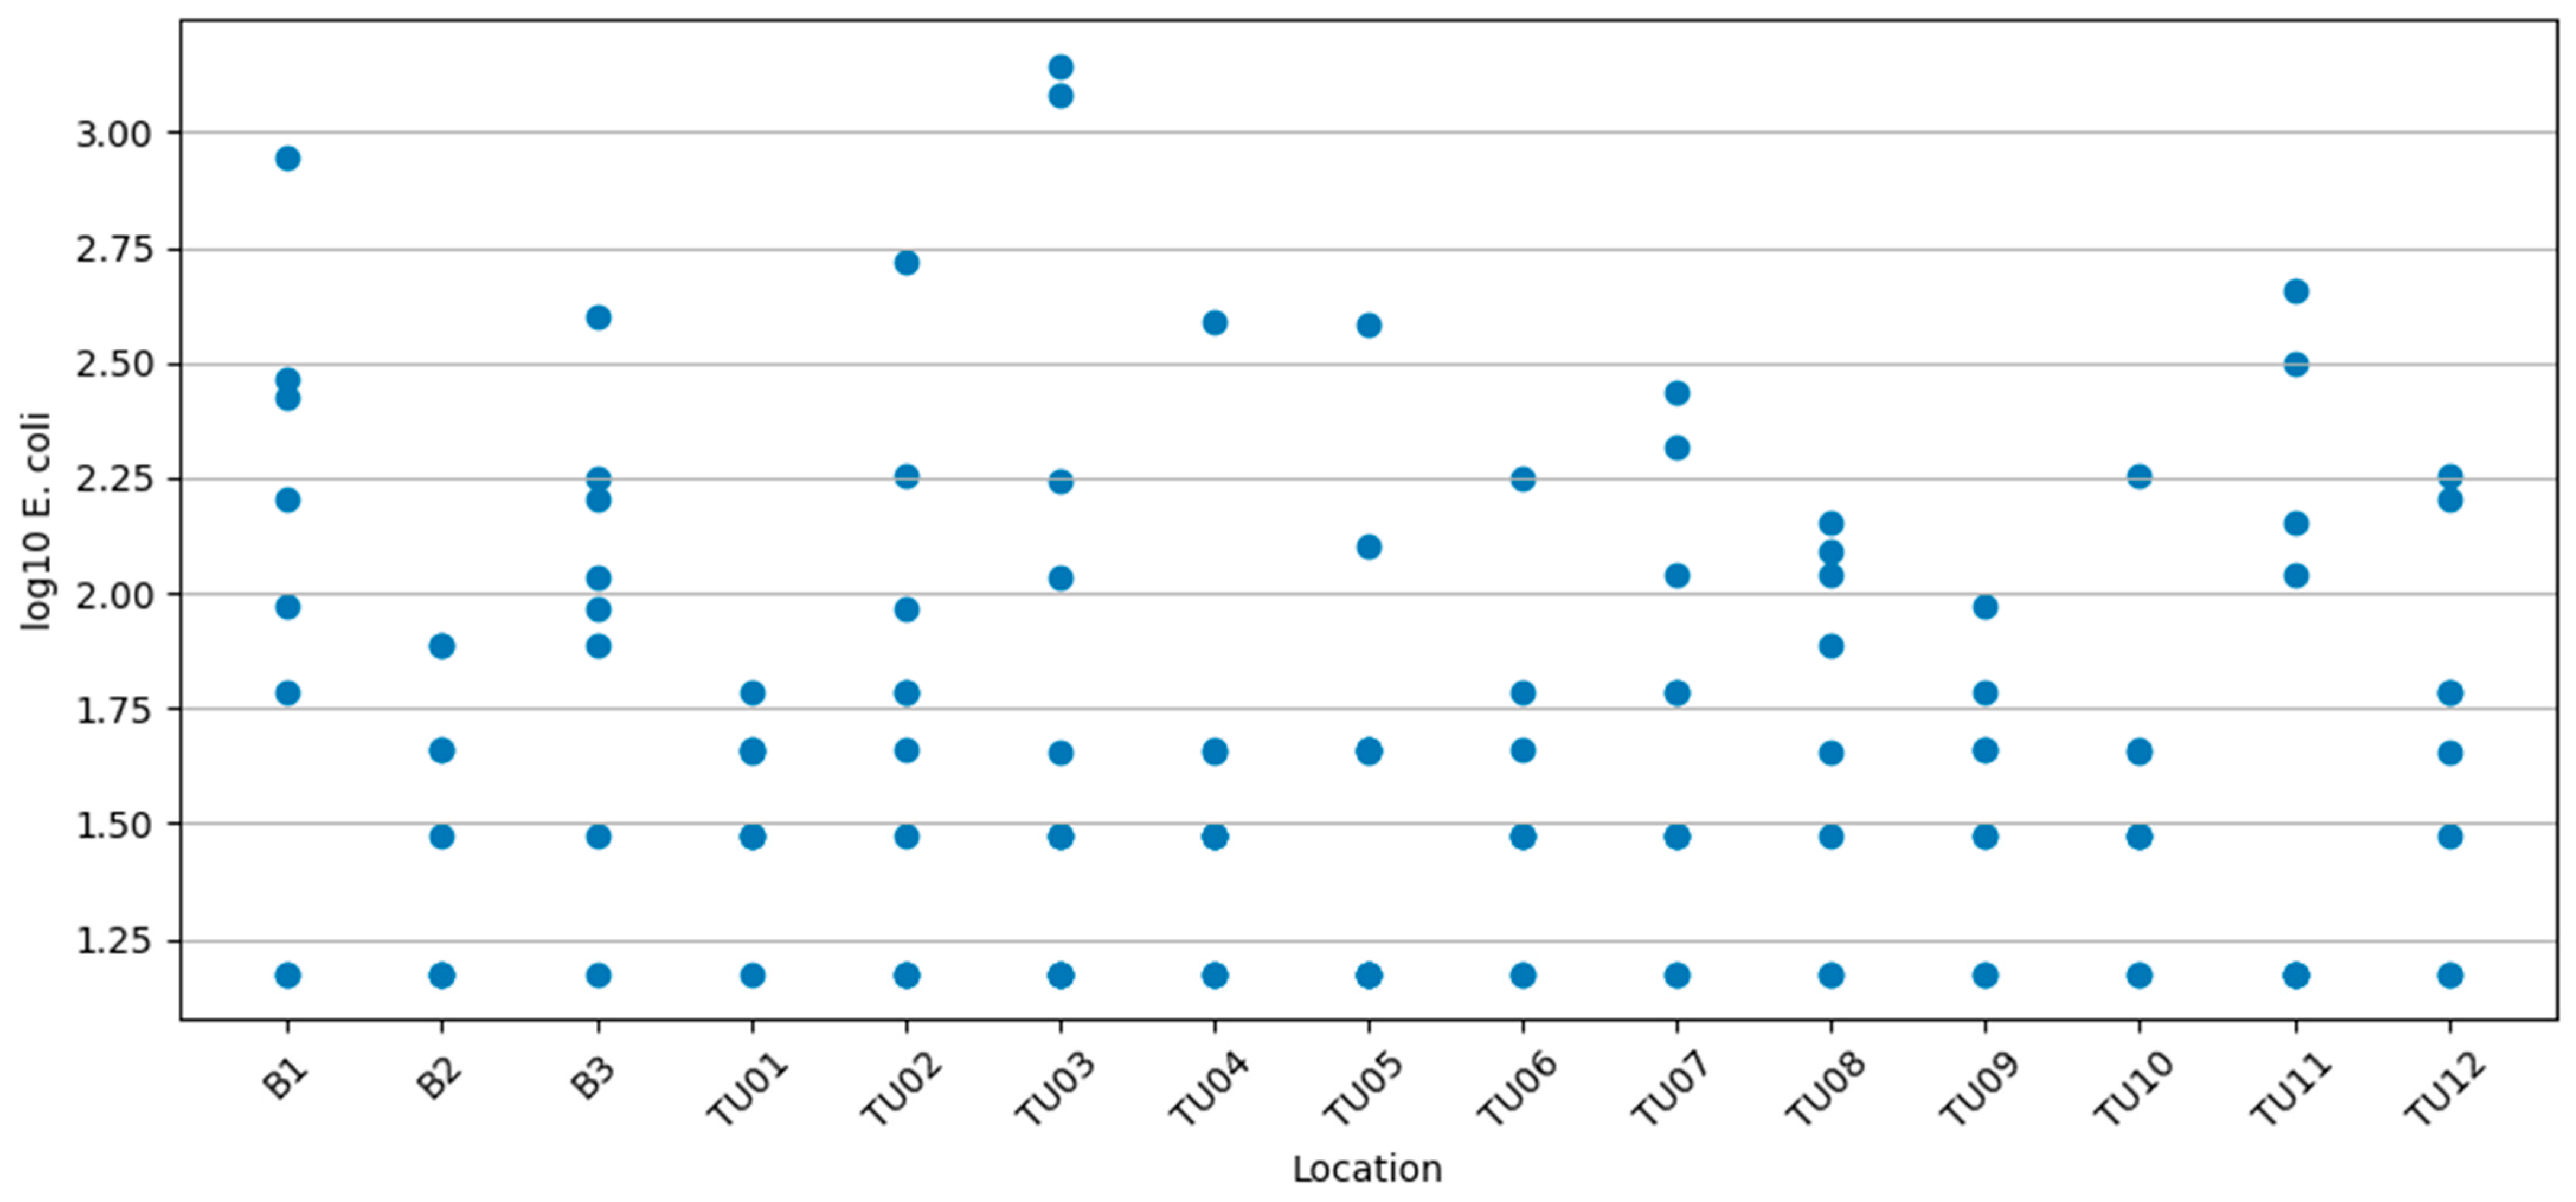
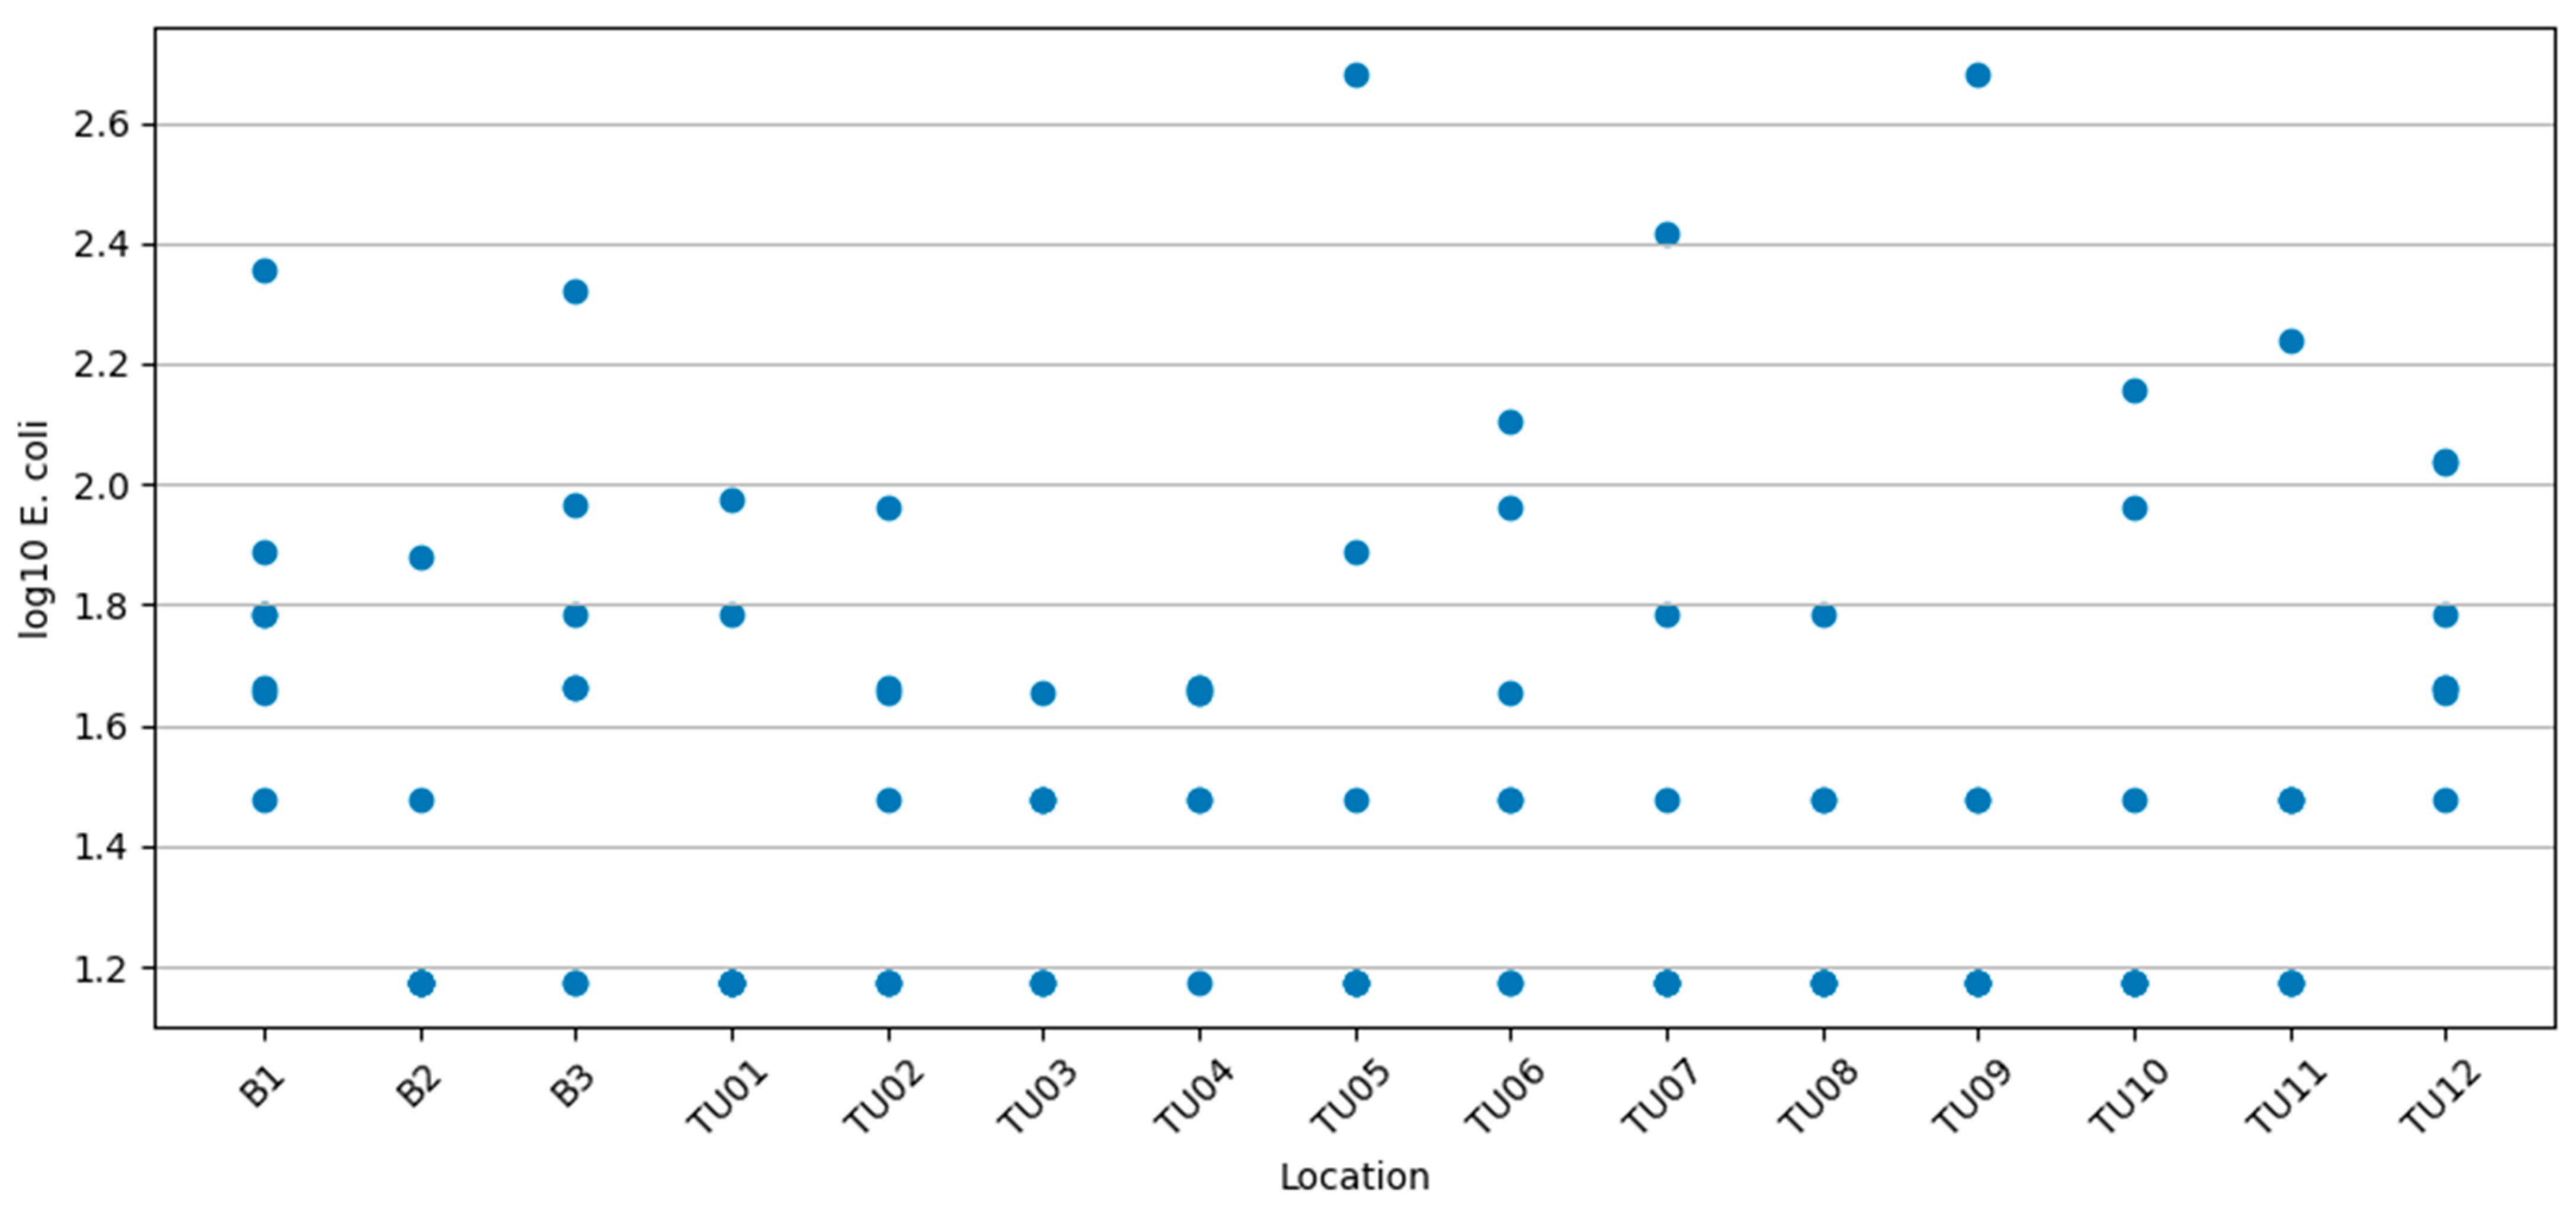
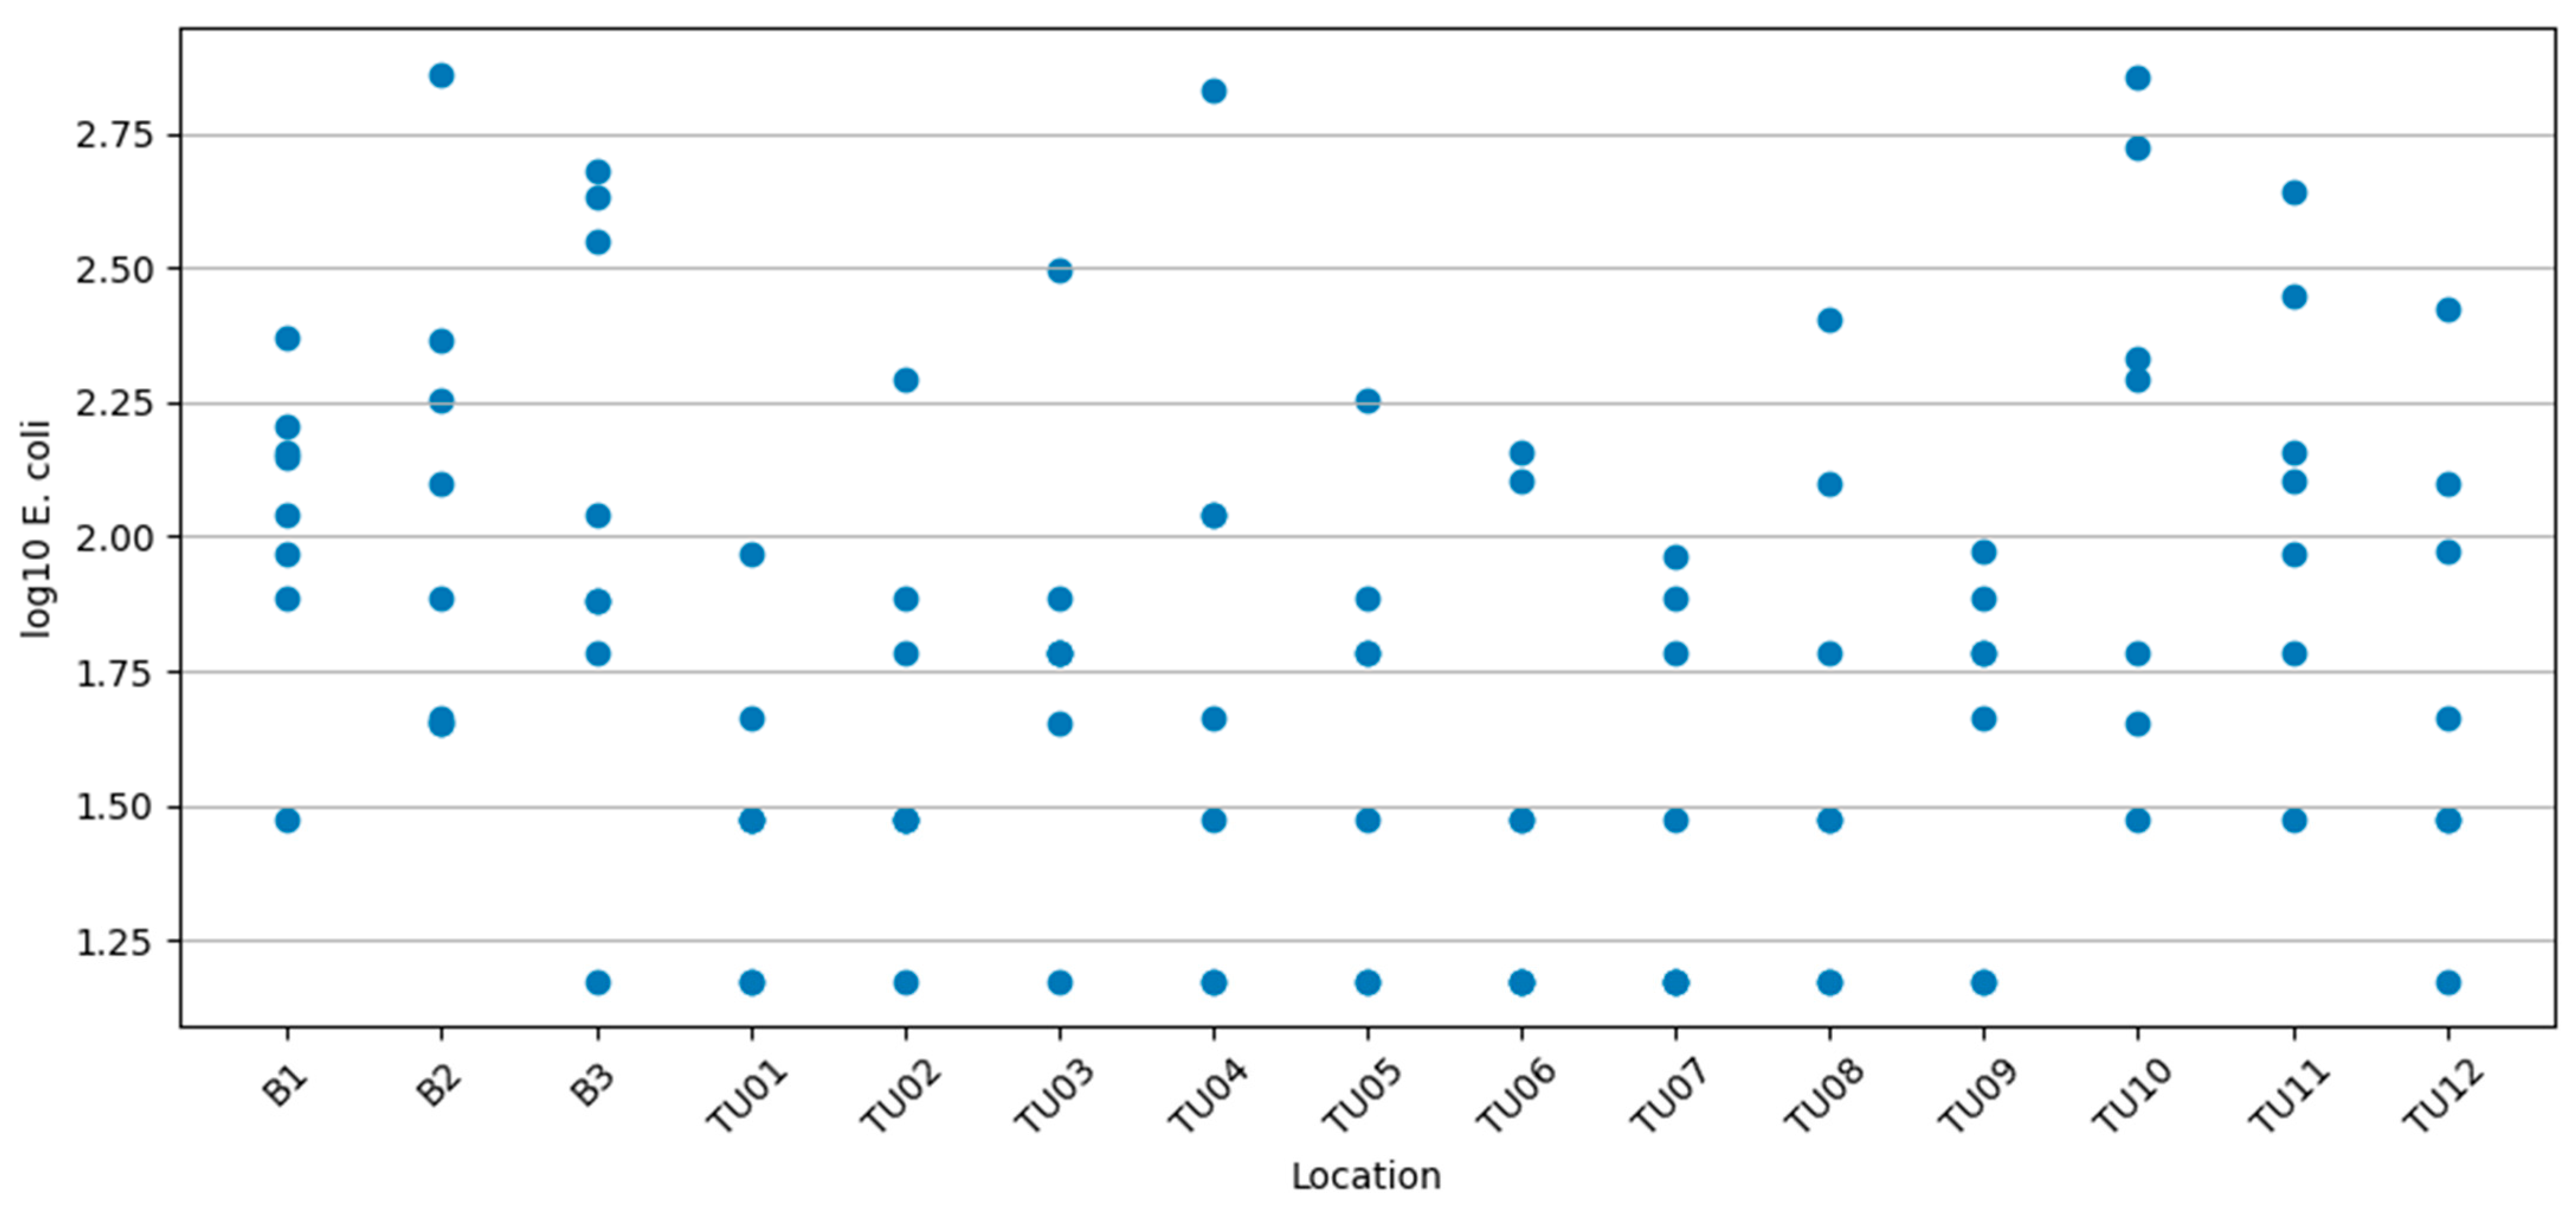
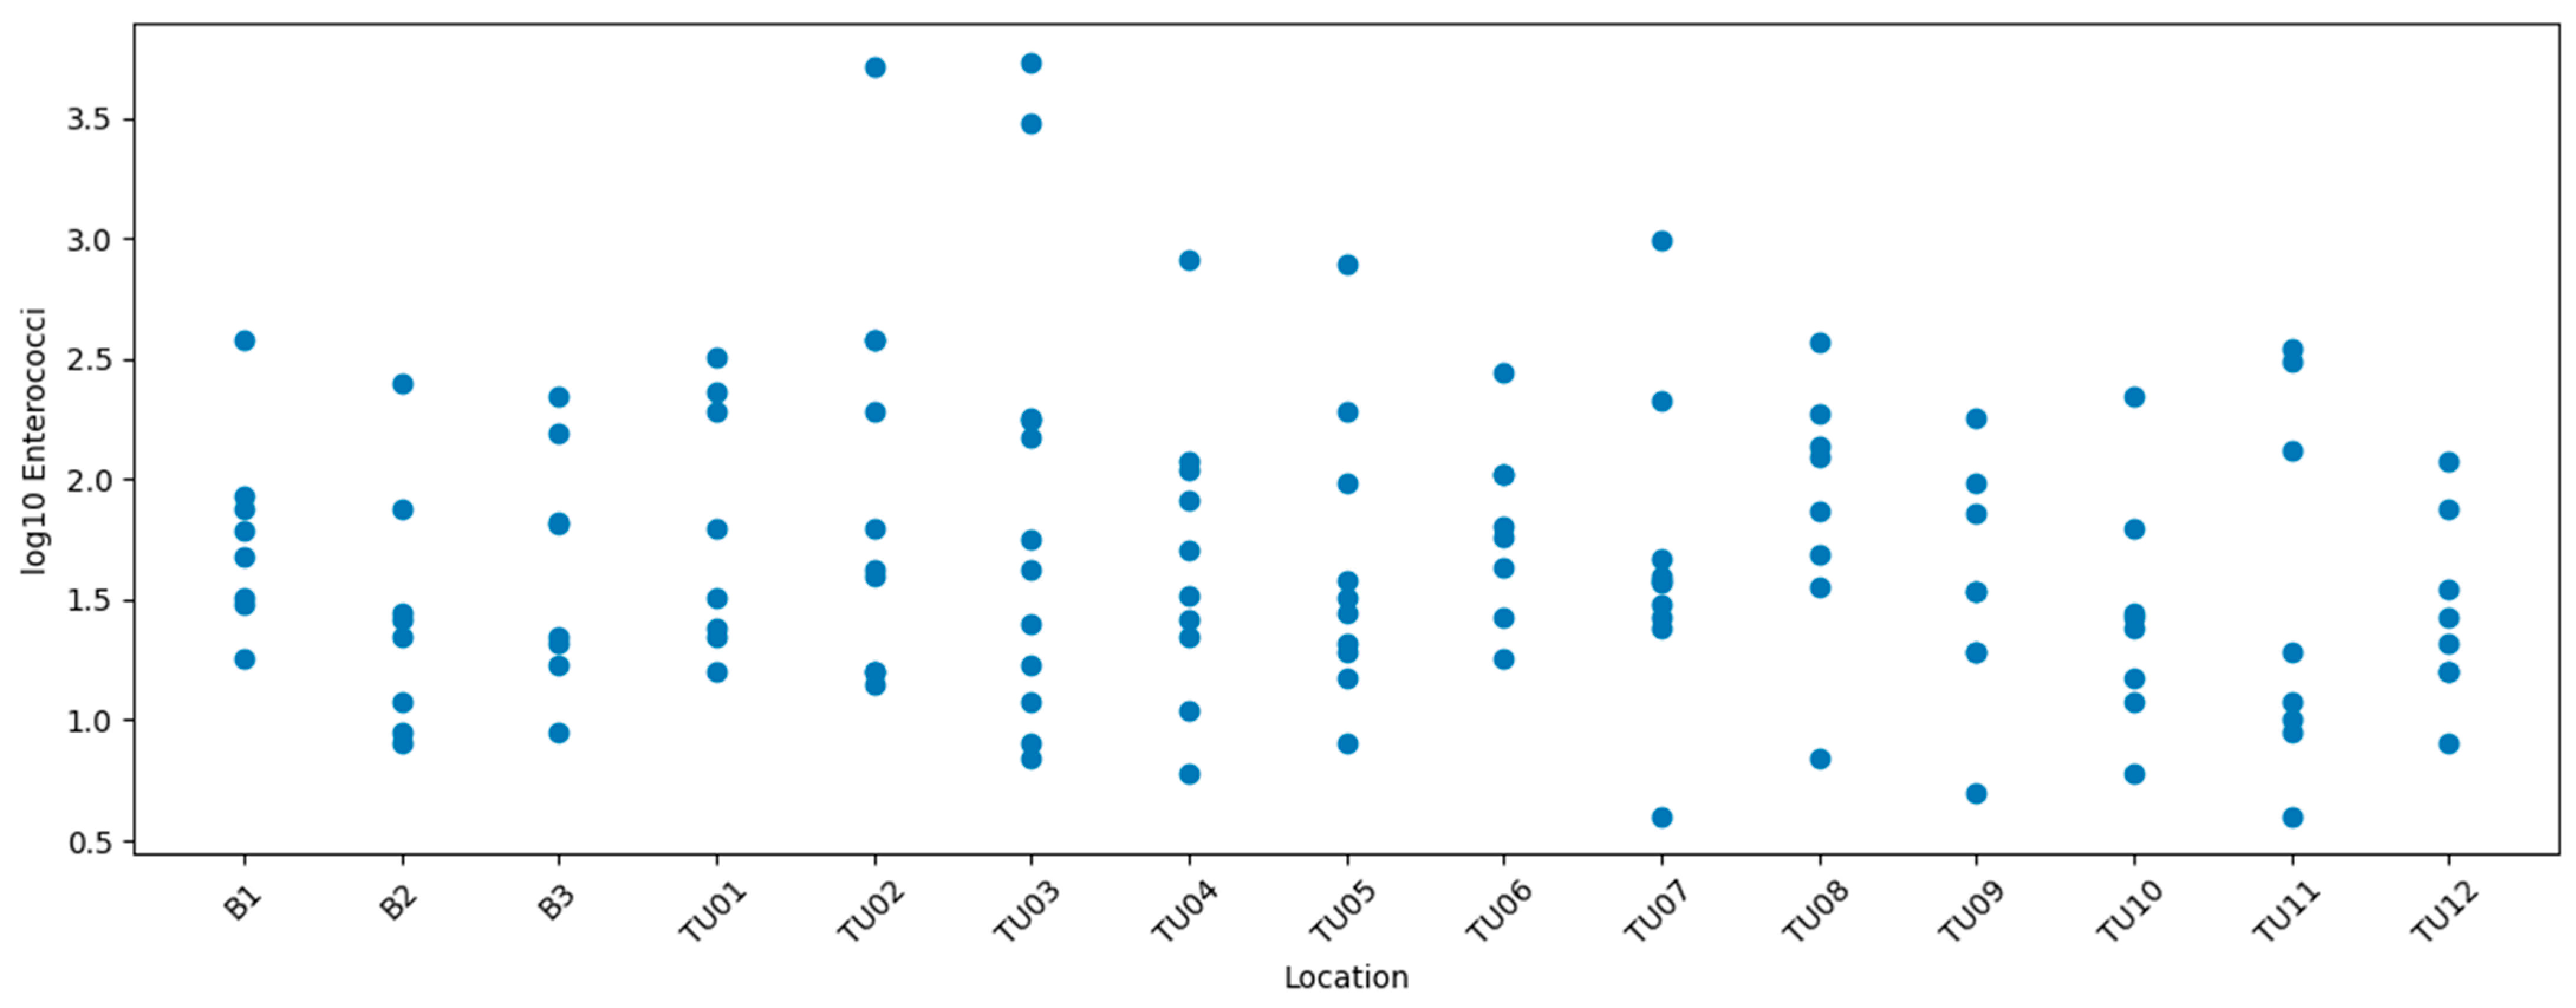
- Sample size: A total of 465 samples were analysed for each microbiological indicator across the study period (2016–2019).
- Significance level: α = 0.05
2.3.2. Assumptions and Diagnostic Tests
- Independence of observations was ensured by sampling at spatially distinct locations and by treating each sampling event as an independent observation. Because samples at each location were collected on distinct dates over multiple bathing seasons, with substantial temporal separation and under varying meteorological and hydrological conditions, individual observations can be reasonably treated as approximately independent realizations, allowing all years to be pooled for an overall one-way ANOVA focused on average spatial differences.
- Normality of residuals was assessed using the Shapiro–Wilk test applied to log-transformed data. Most datasets showed statistically significant deviations from normality (p < 0.05), particularly when all sampling locations and years were pooled (W = 0.875–0.921, p < 0.001). However, smaller subsets (e.g., single-year data from Lake Bundek with n ≈ 30–31 per location) were closer to normal distribution (p = 0.118 for E. coli and p = 0.341 for enterococci in 2016), allowing borderline acceptance of normality in some cases. Despite these deviations, one-way ANOVA was applied because ANOVA is known to be robust against moderate departures from normality when sample sizes are similar across groups and sufficiently large (n ≥ 25–30 per group), as was the case in this study. The nonparametric Kruskal-Wallis test, performed as a sensitivity analysis, yielded nearly identical conclusions regarding the presence or absence of significant spatial differences between sampling locations. Log-transformation substantially reduced asymmetry of the distributions. Therefore, the parametric approach was considered appropriate and the results were interpreted with confidence, supported by the consistency with the nonparametric equivalent.
- Homogeneity of variances was evaluated using Levene’s test. The test results confirmed that variances among sampling locations were not significantly different (p > 0.05), supporting the use of ANOVA.
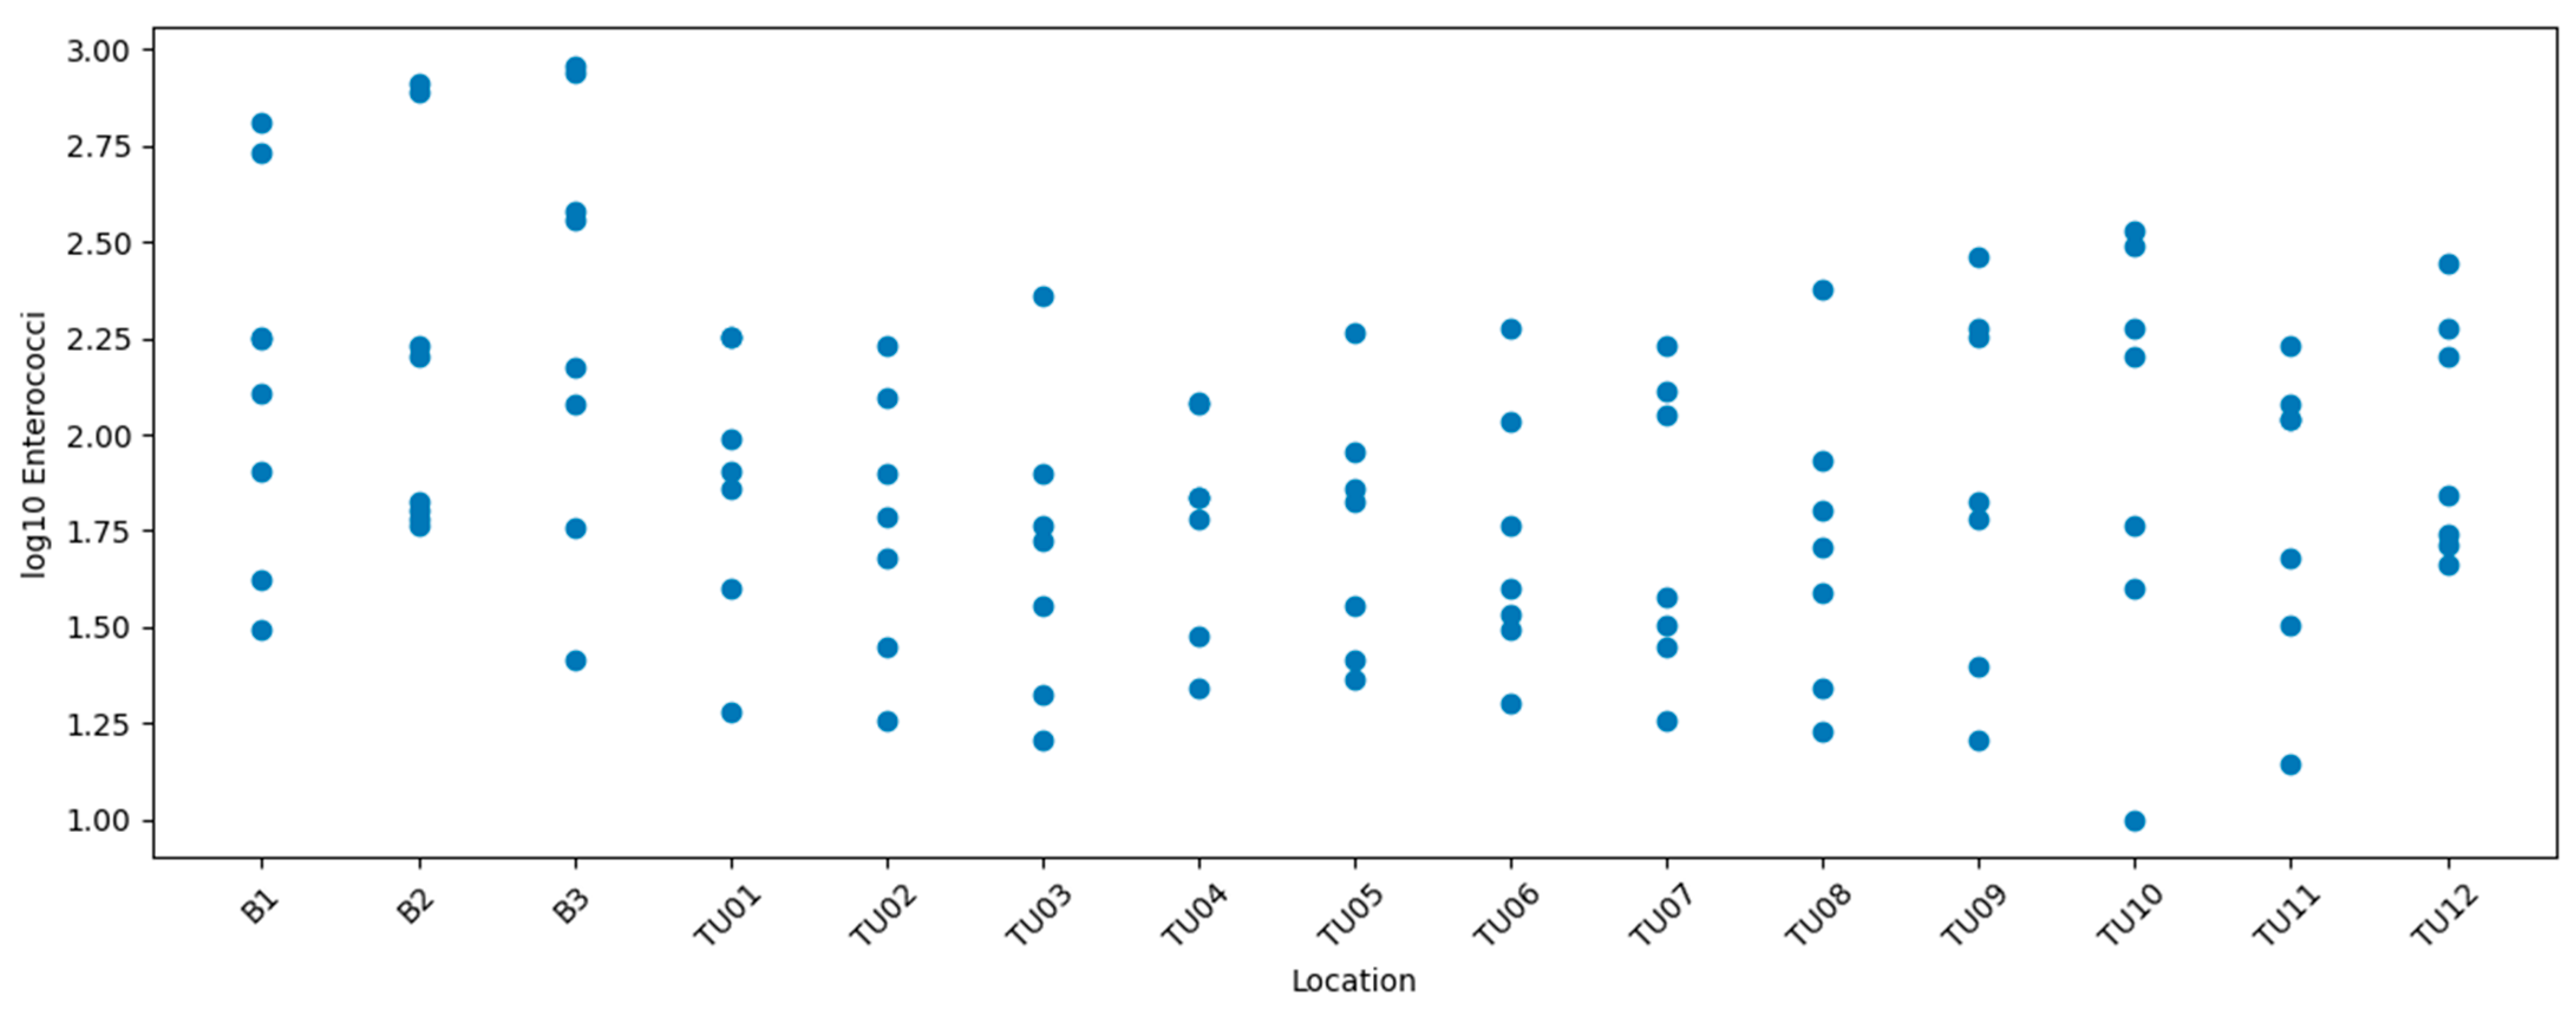
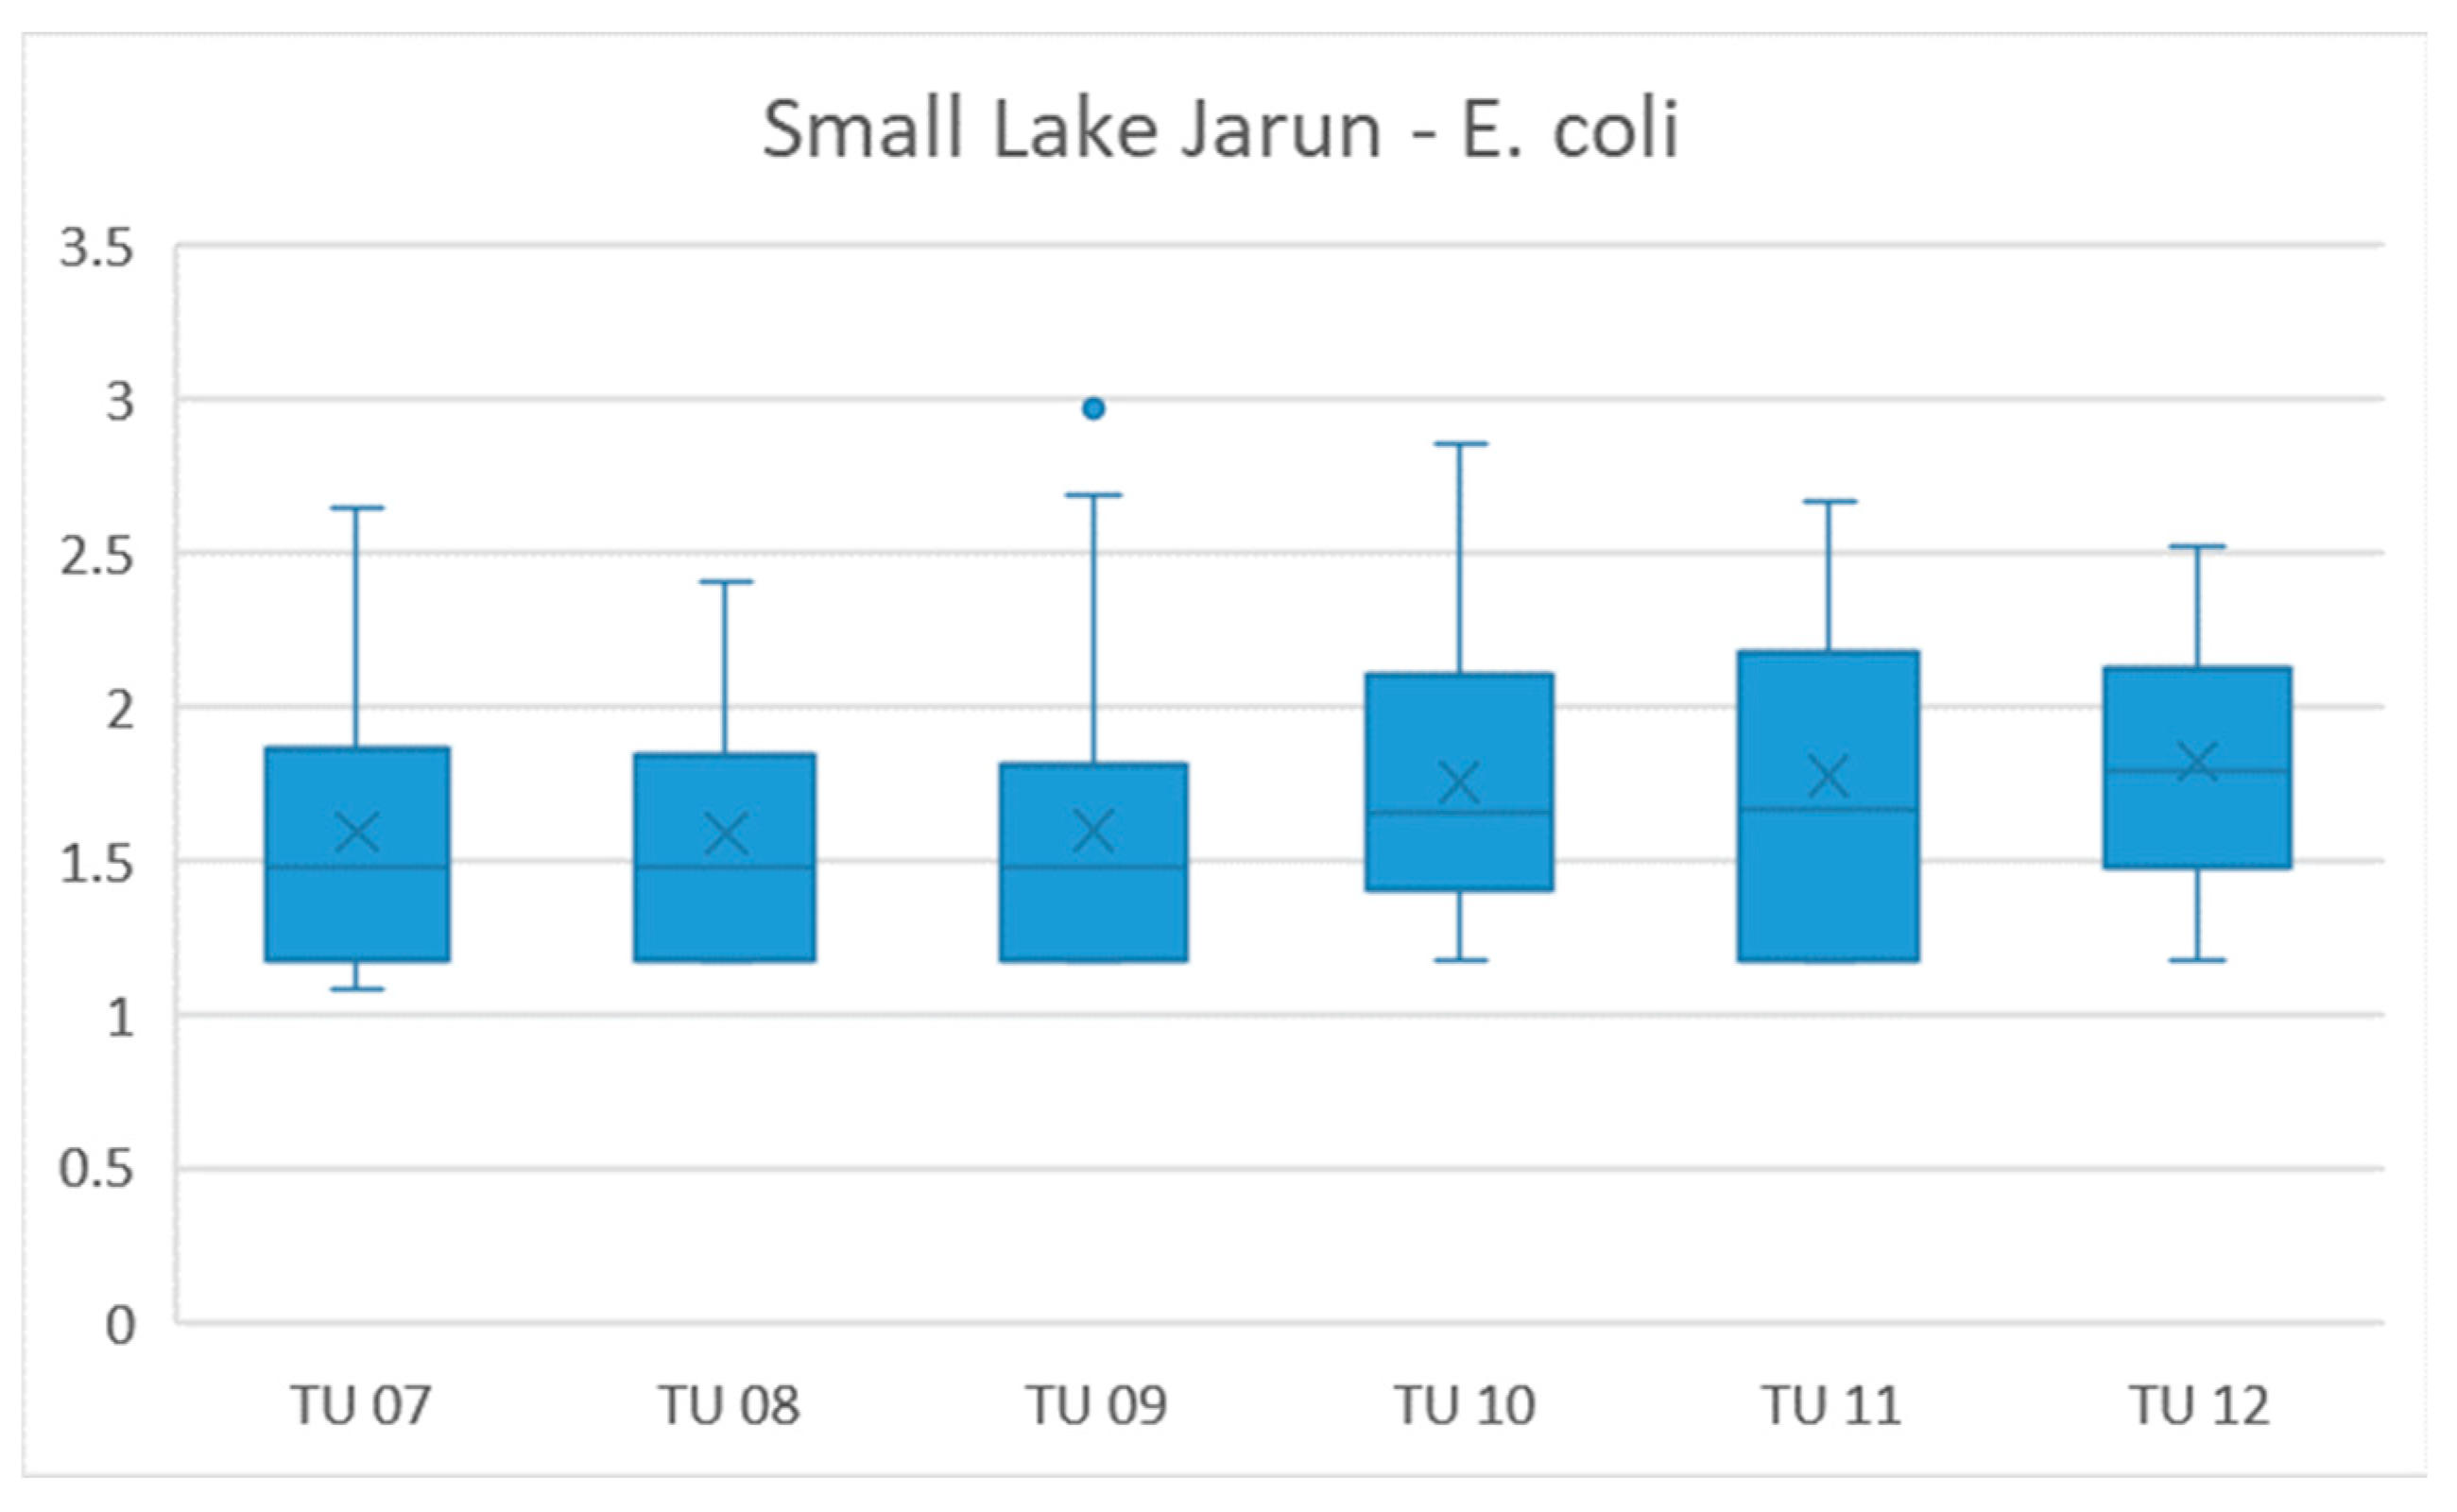
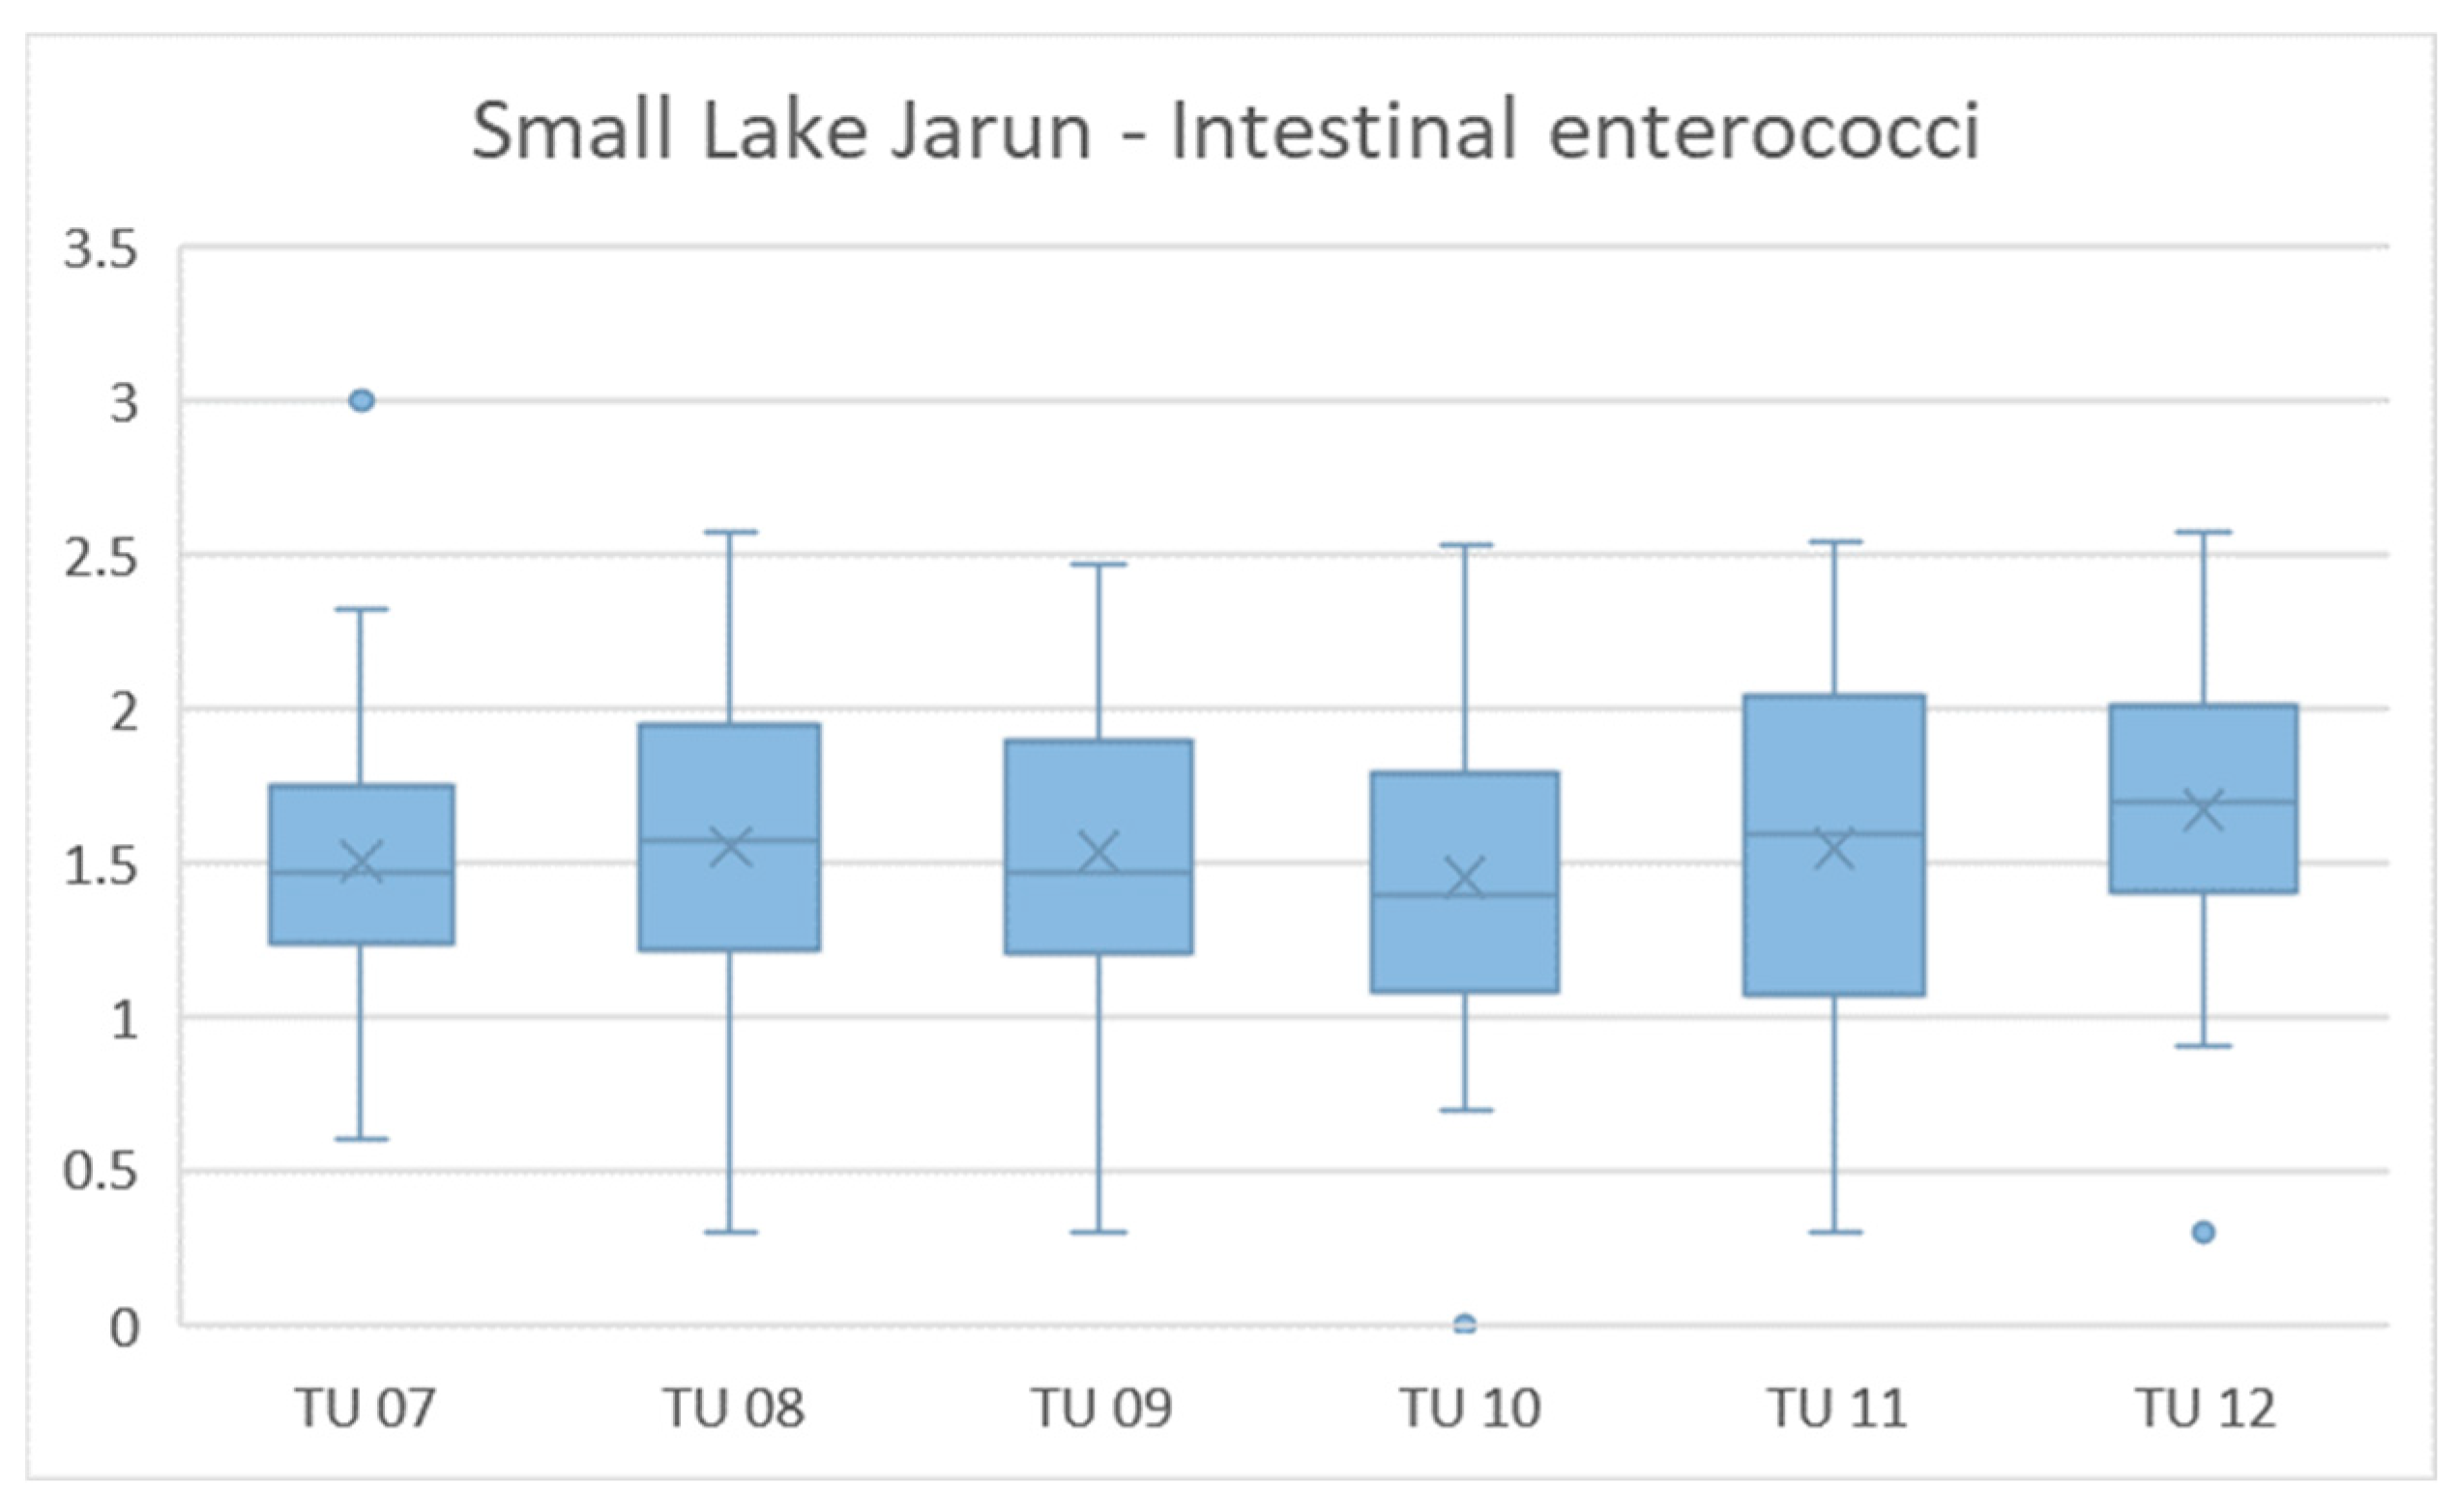
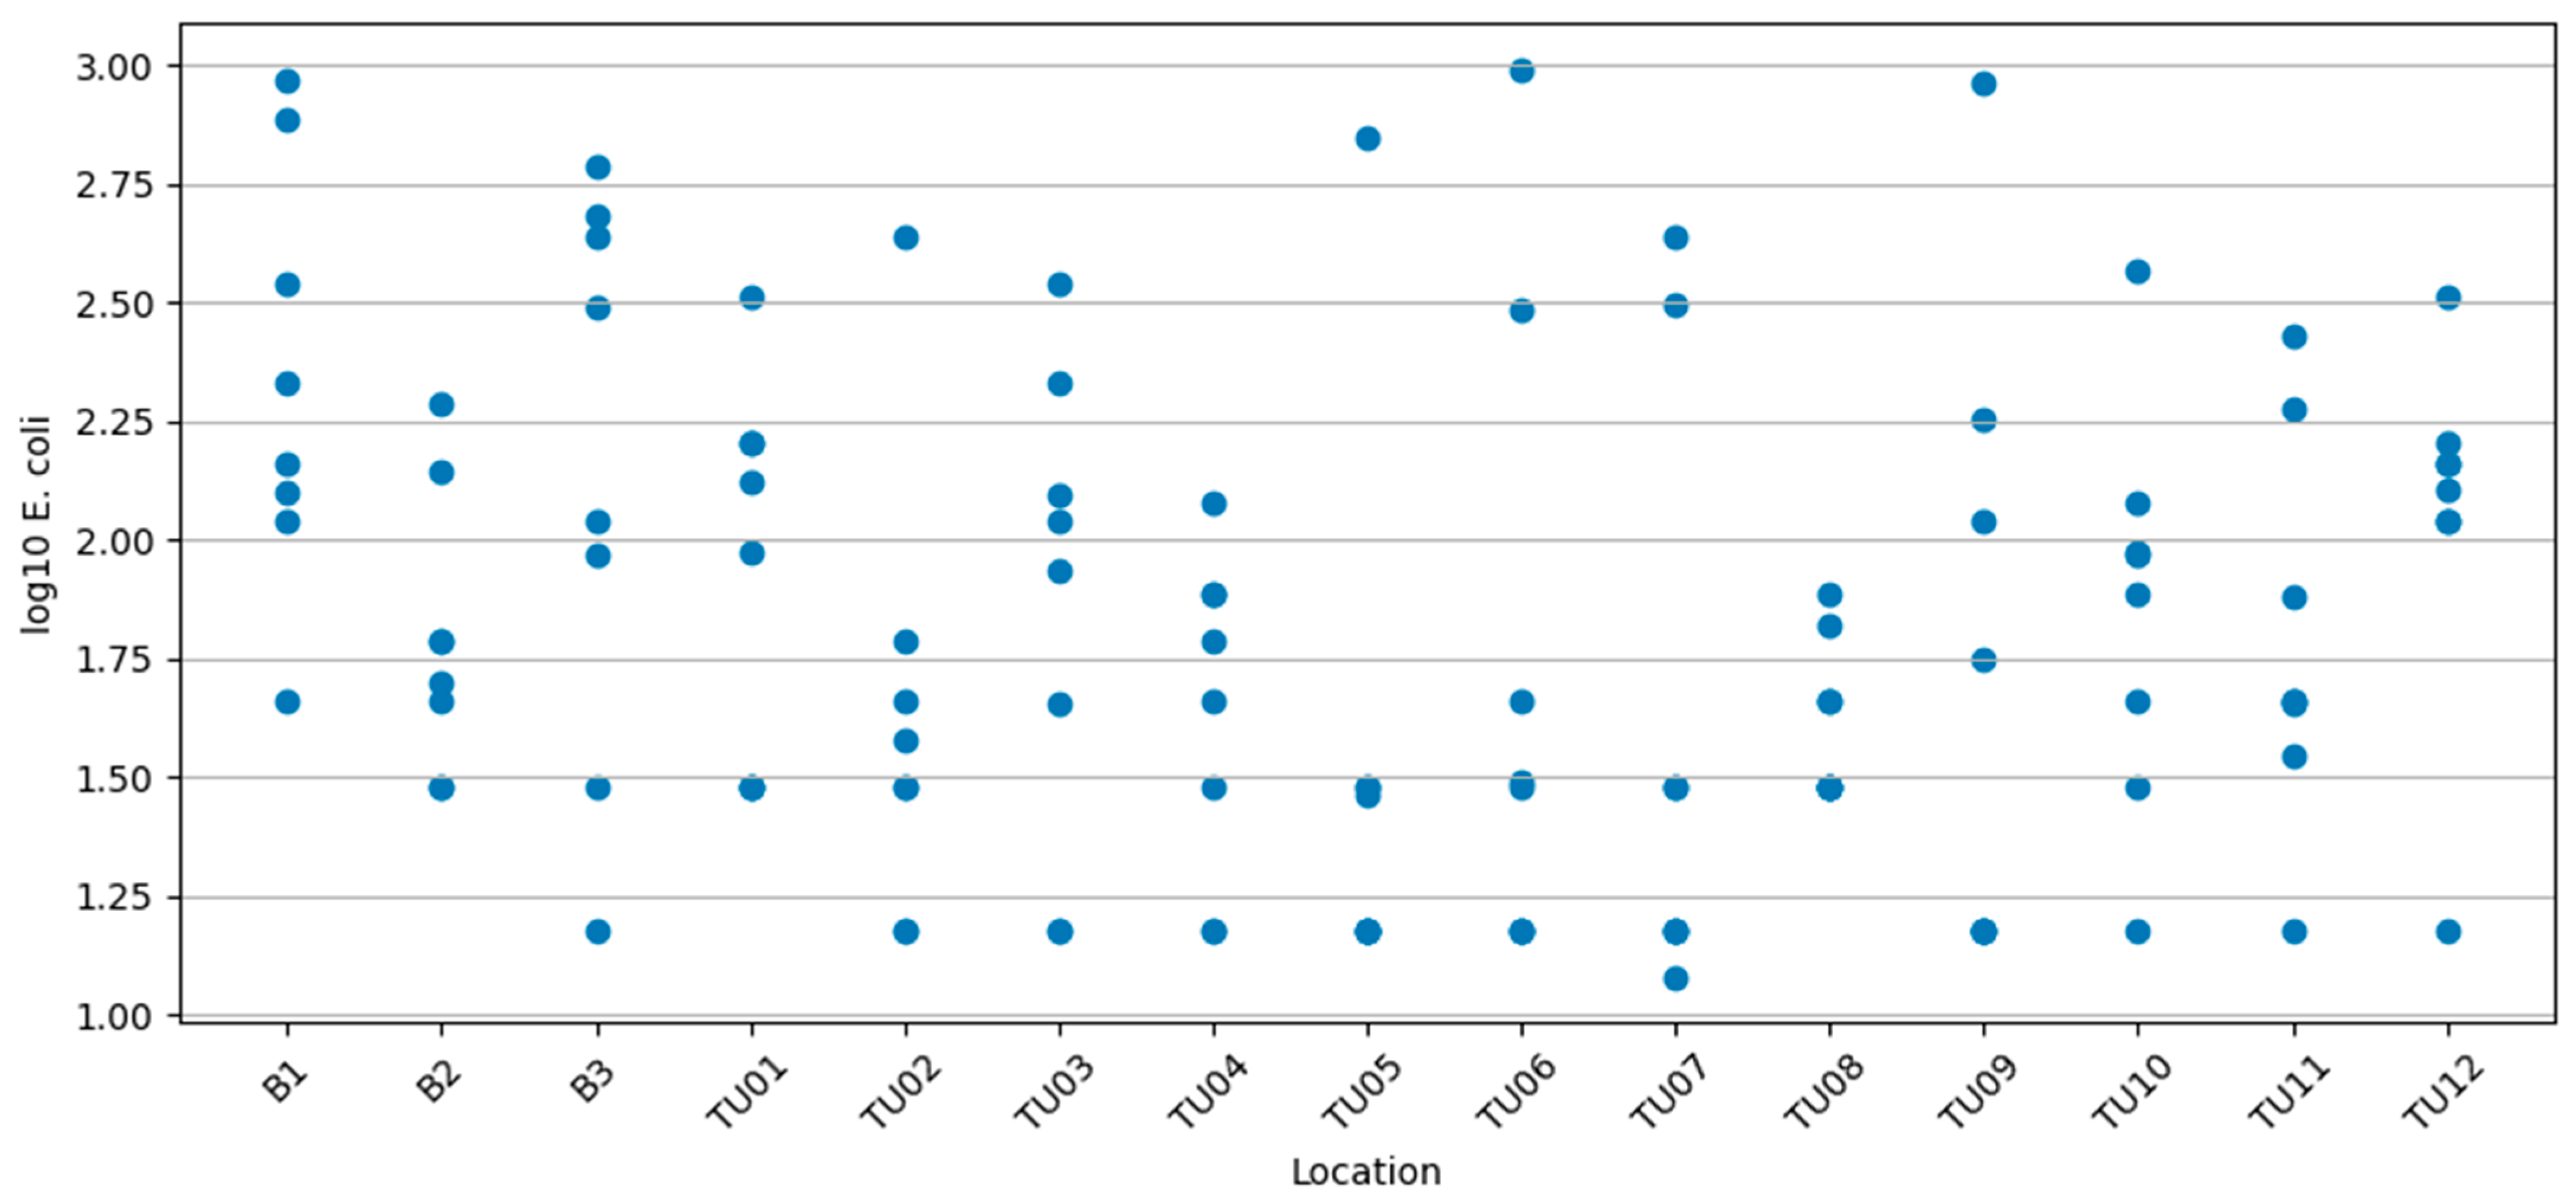
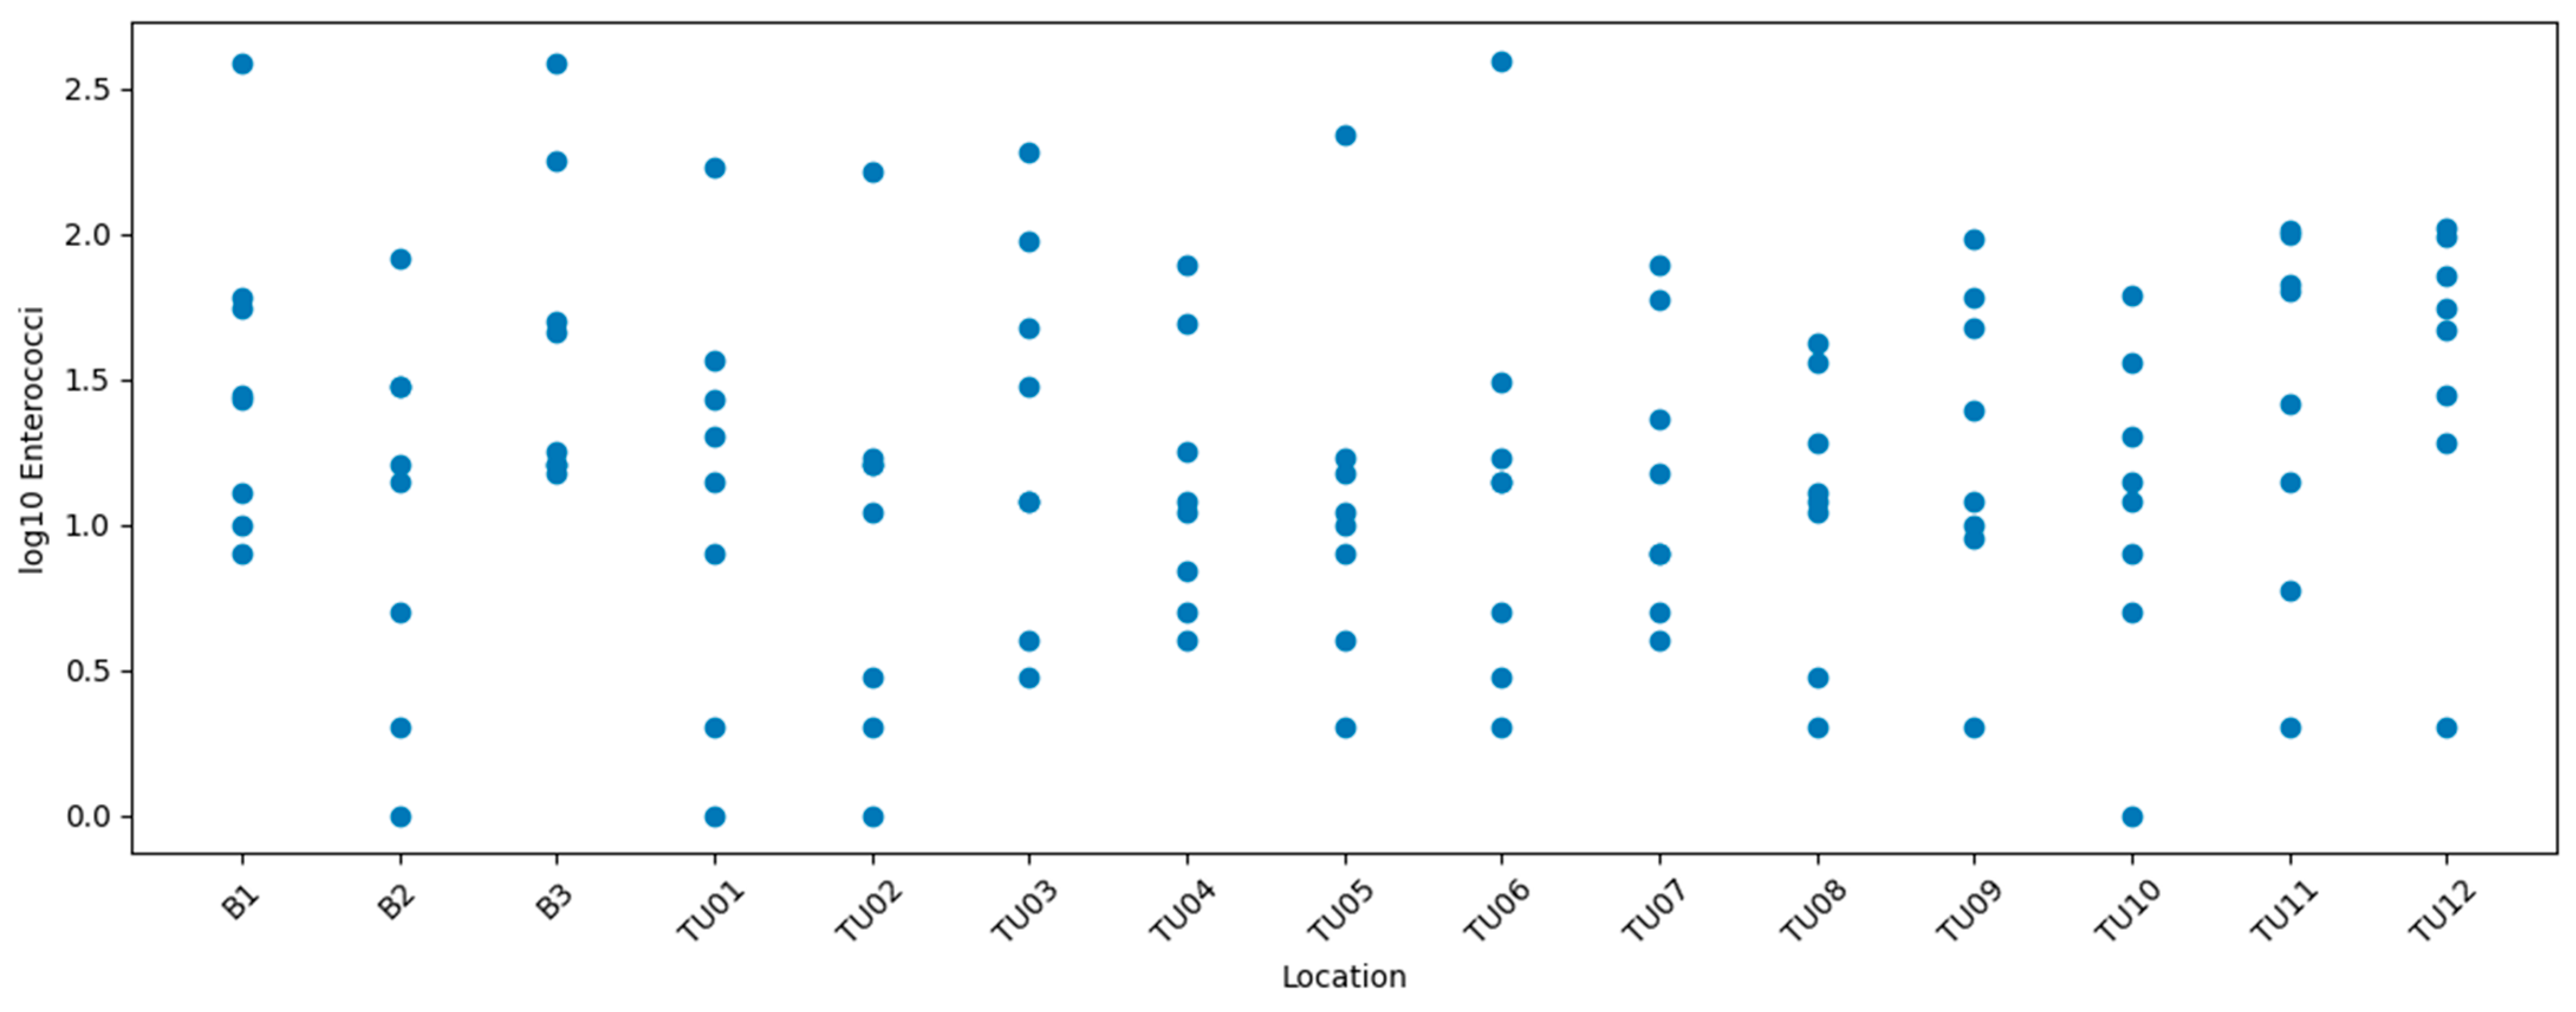
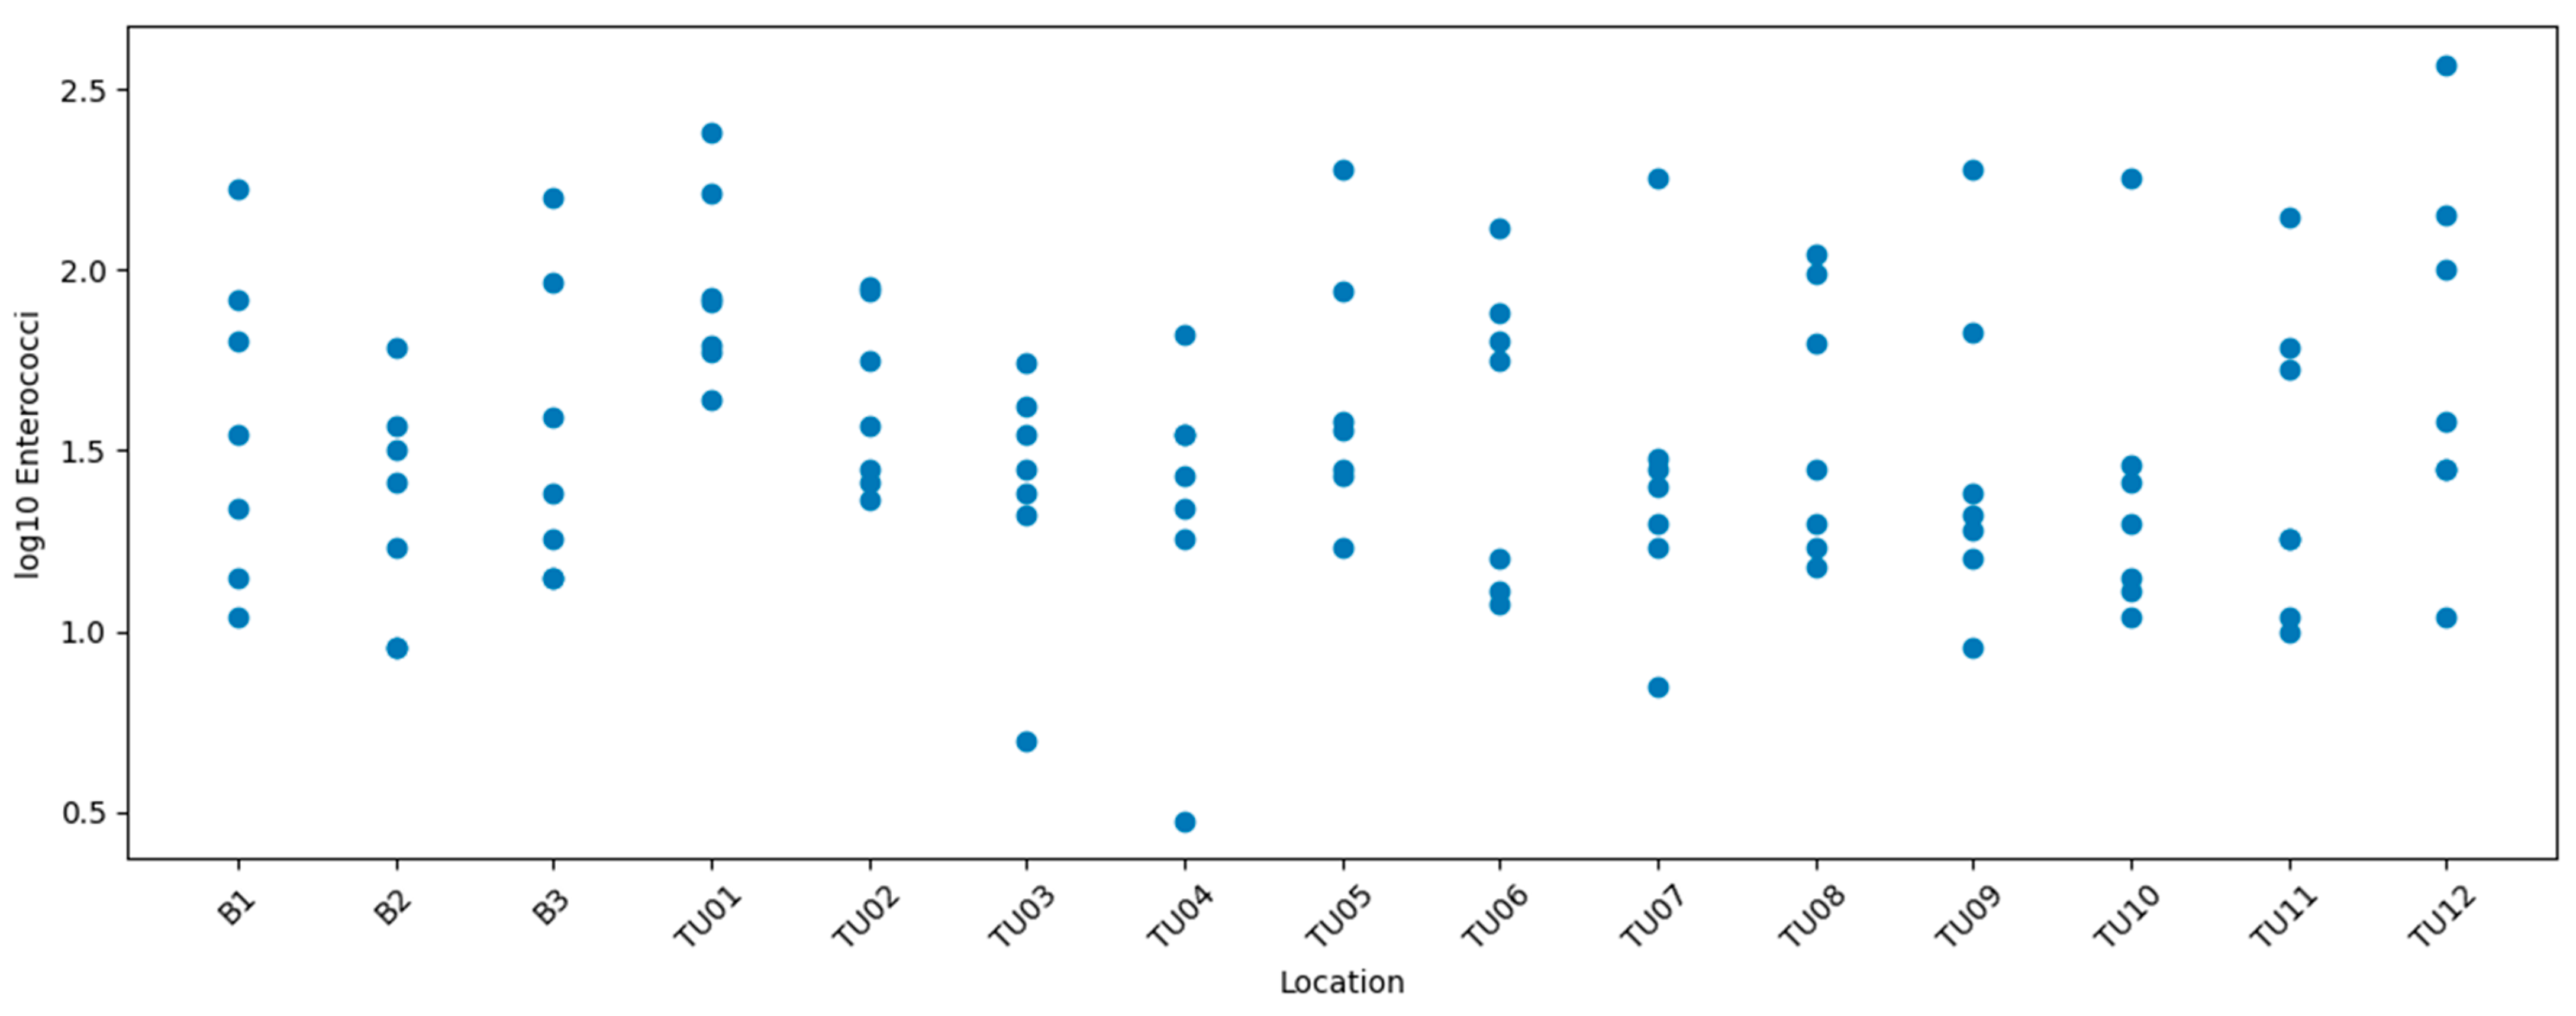
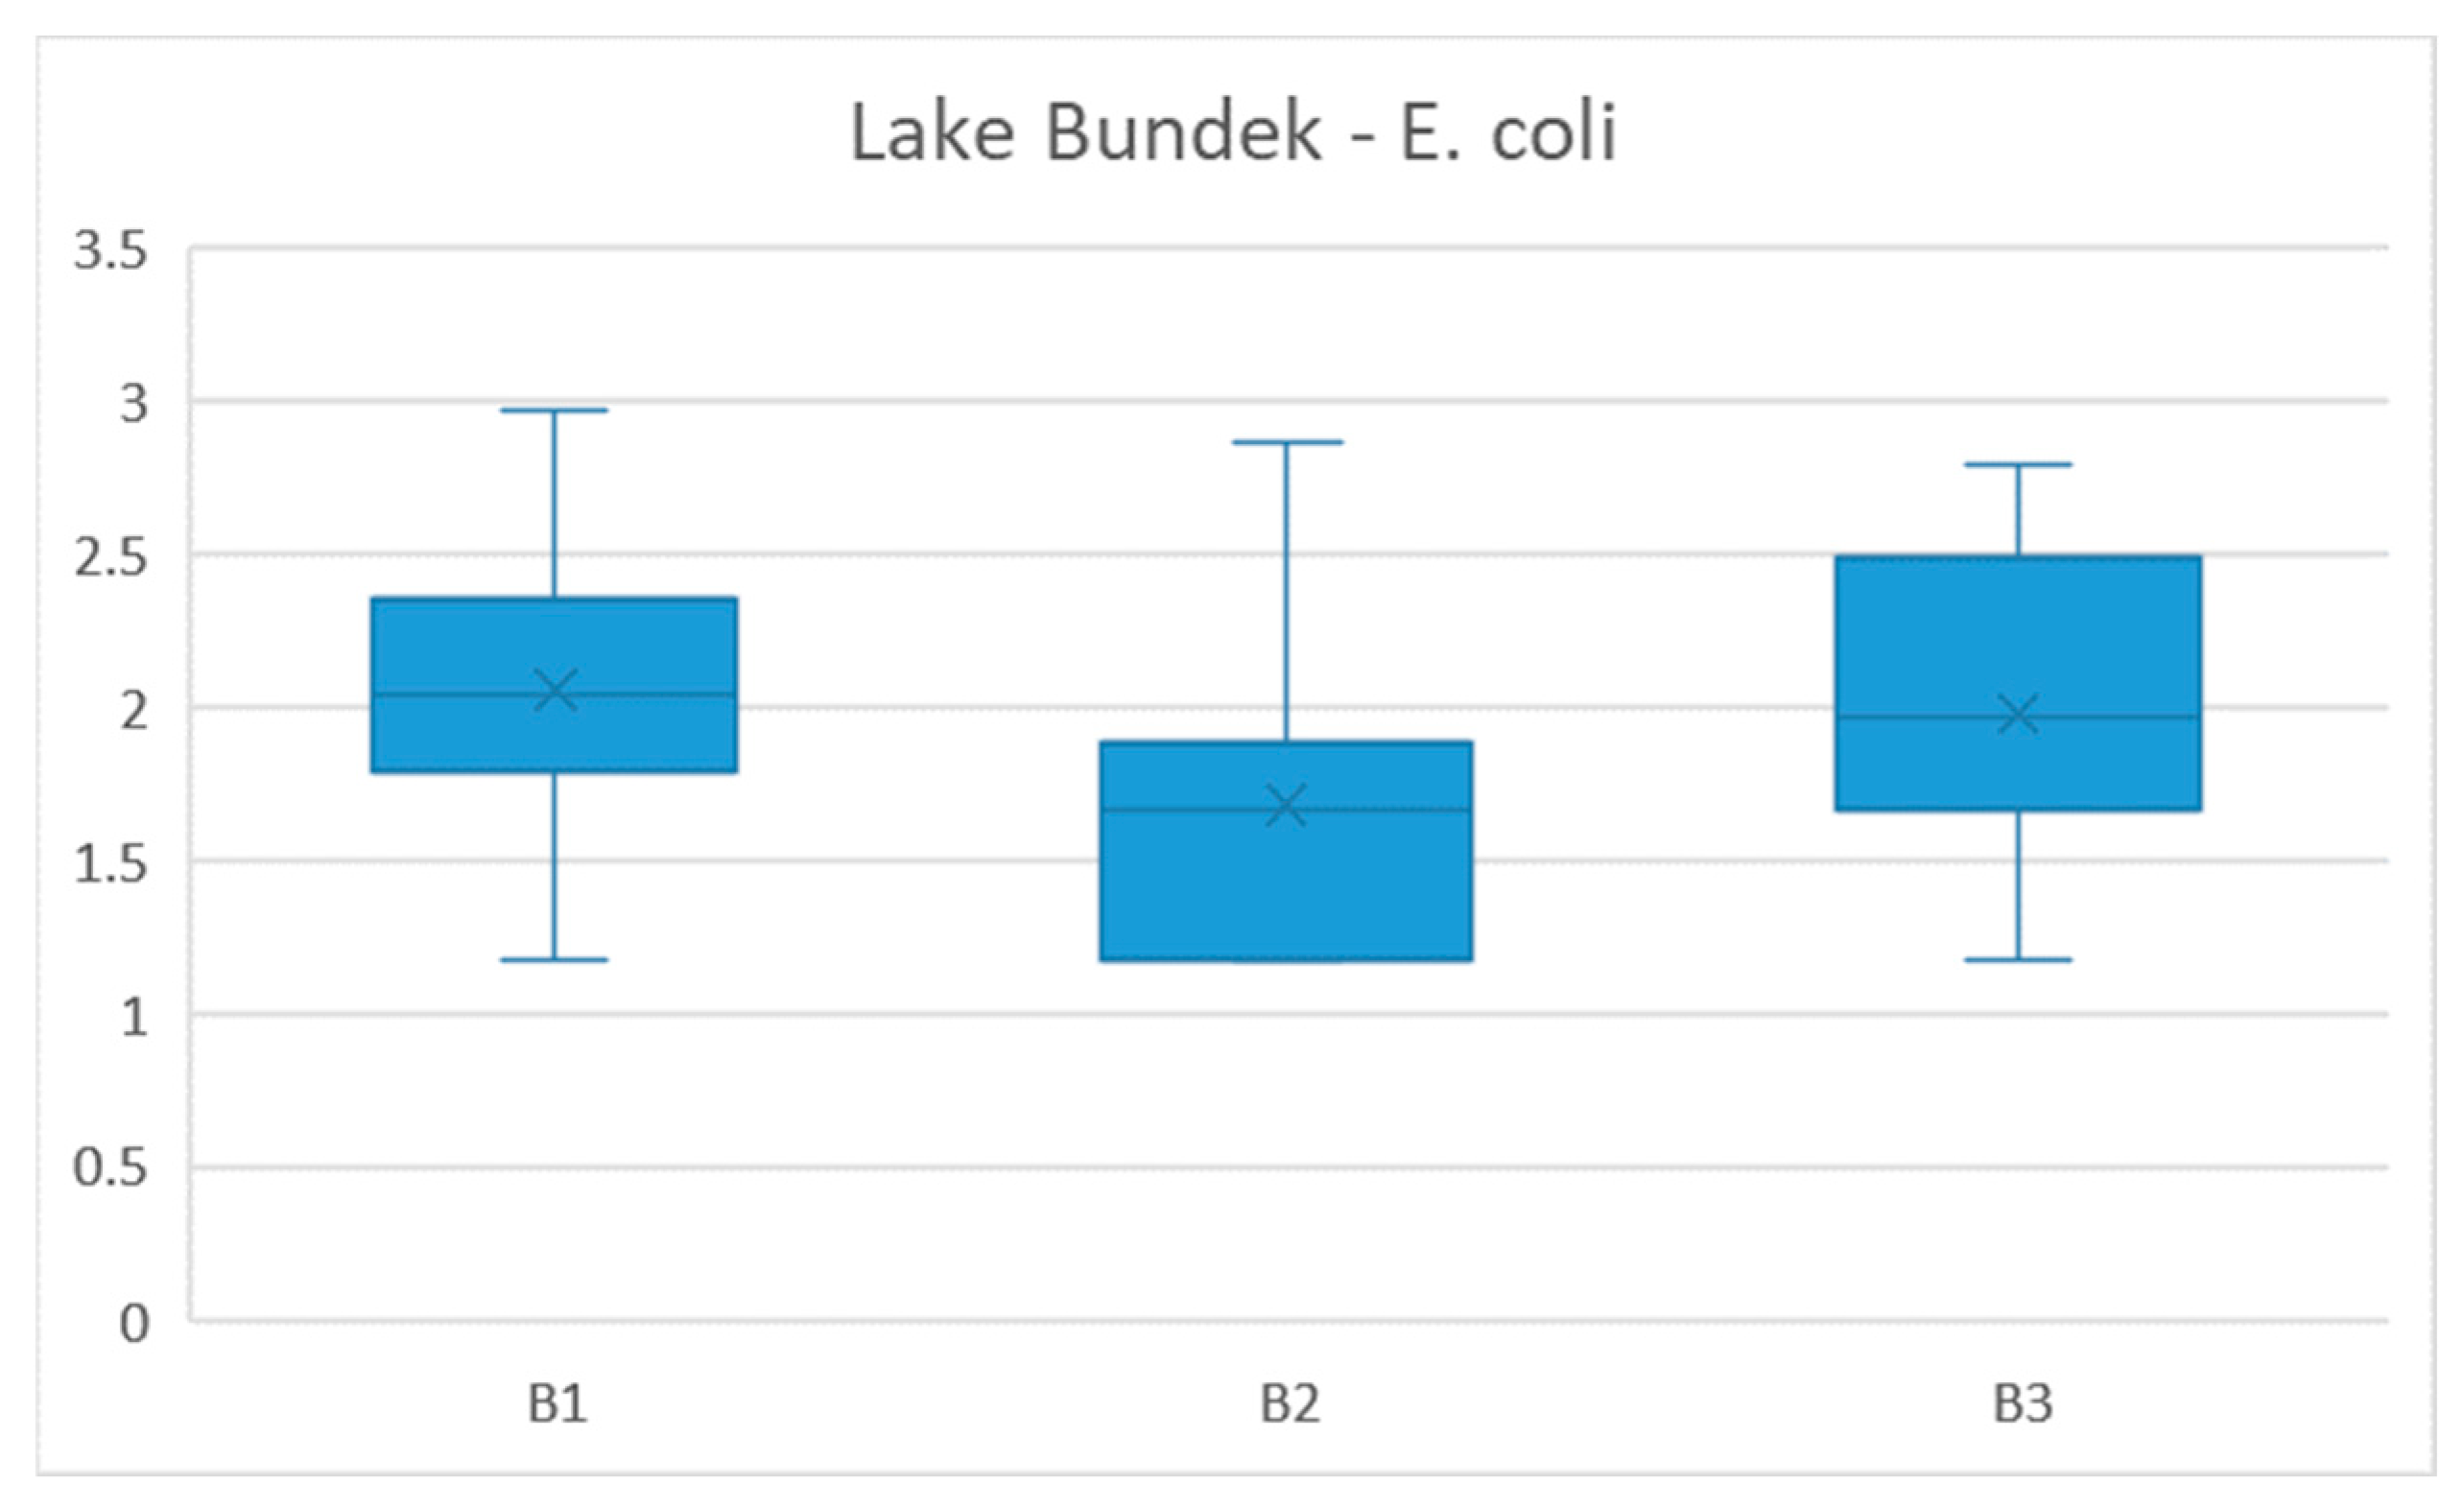
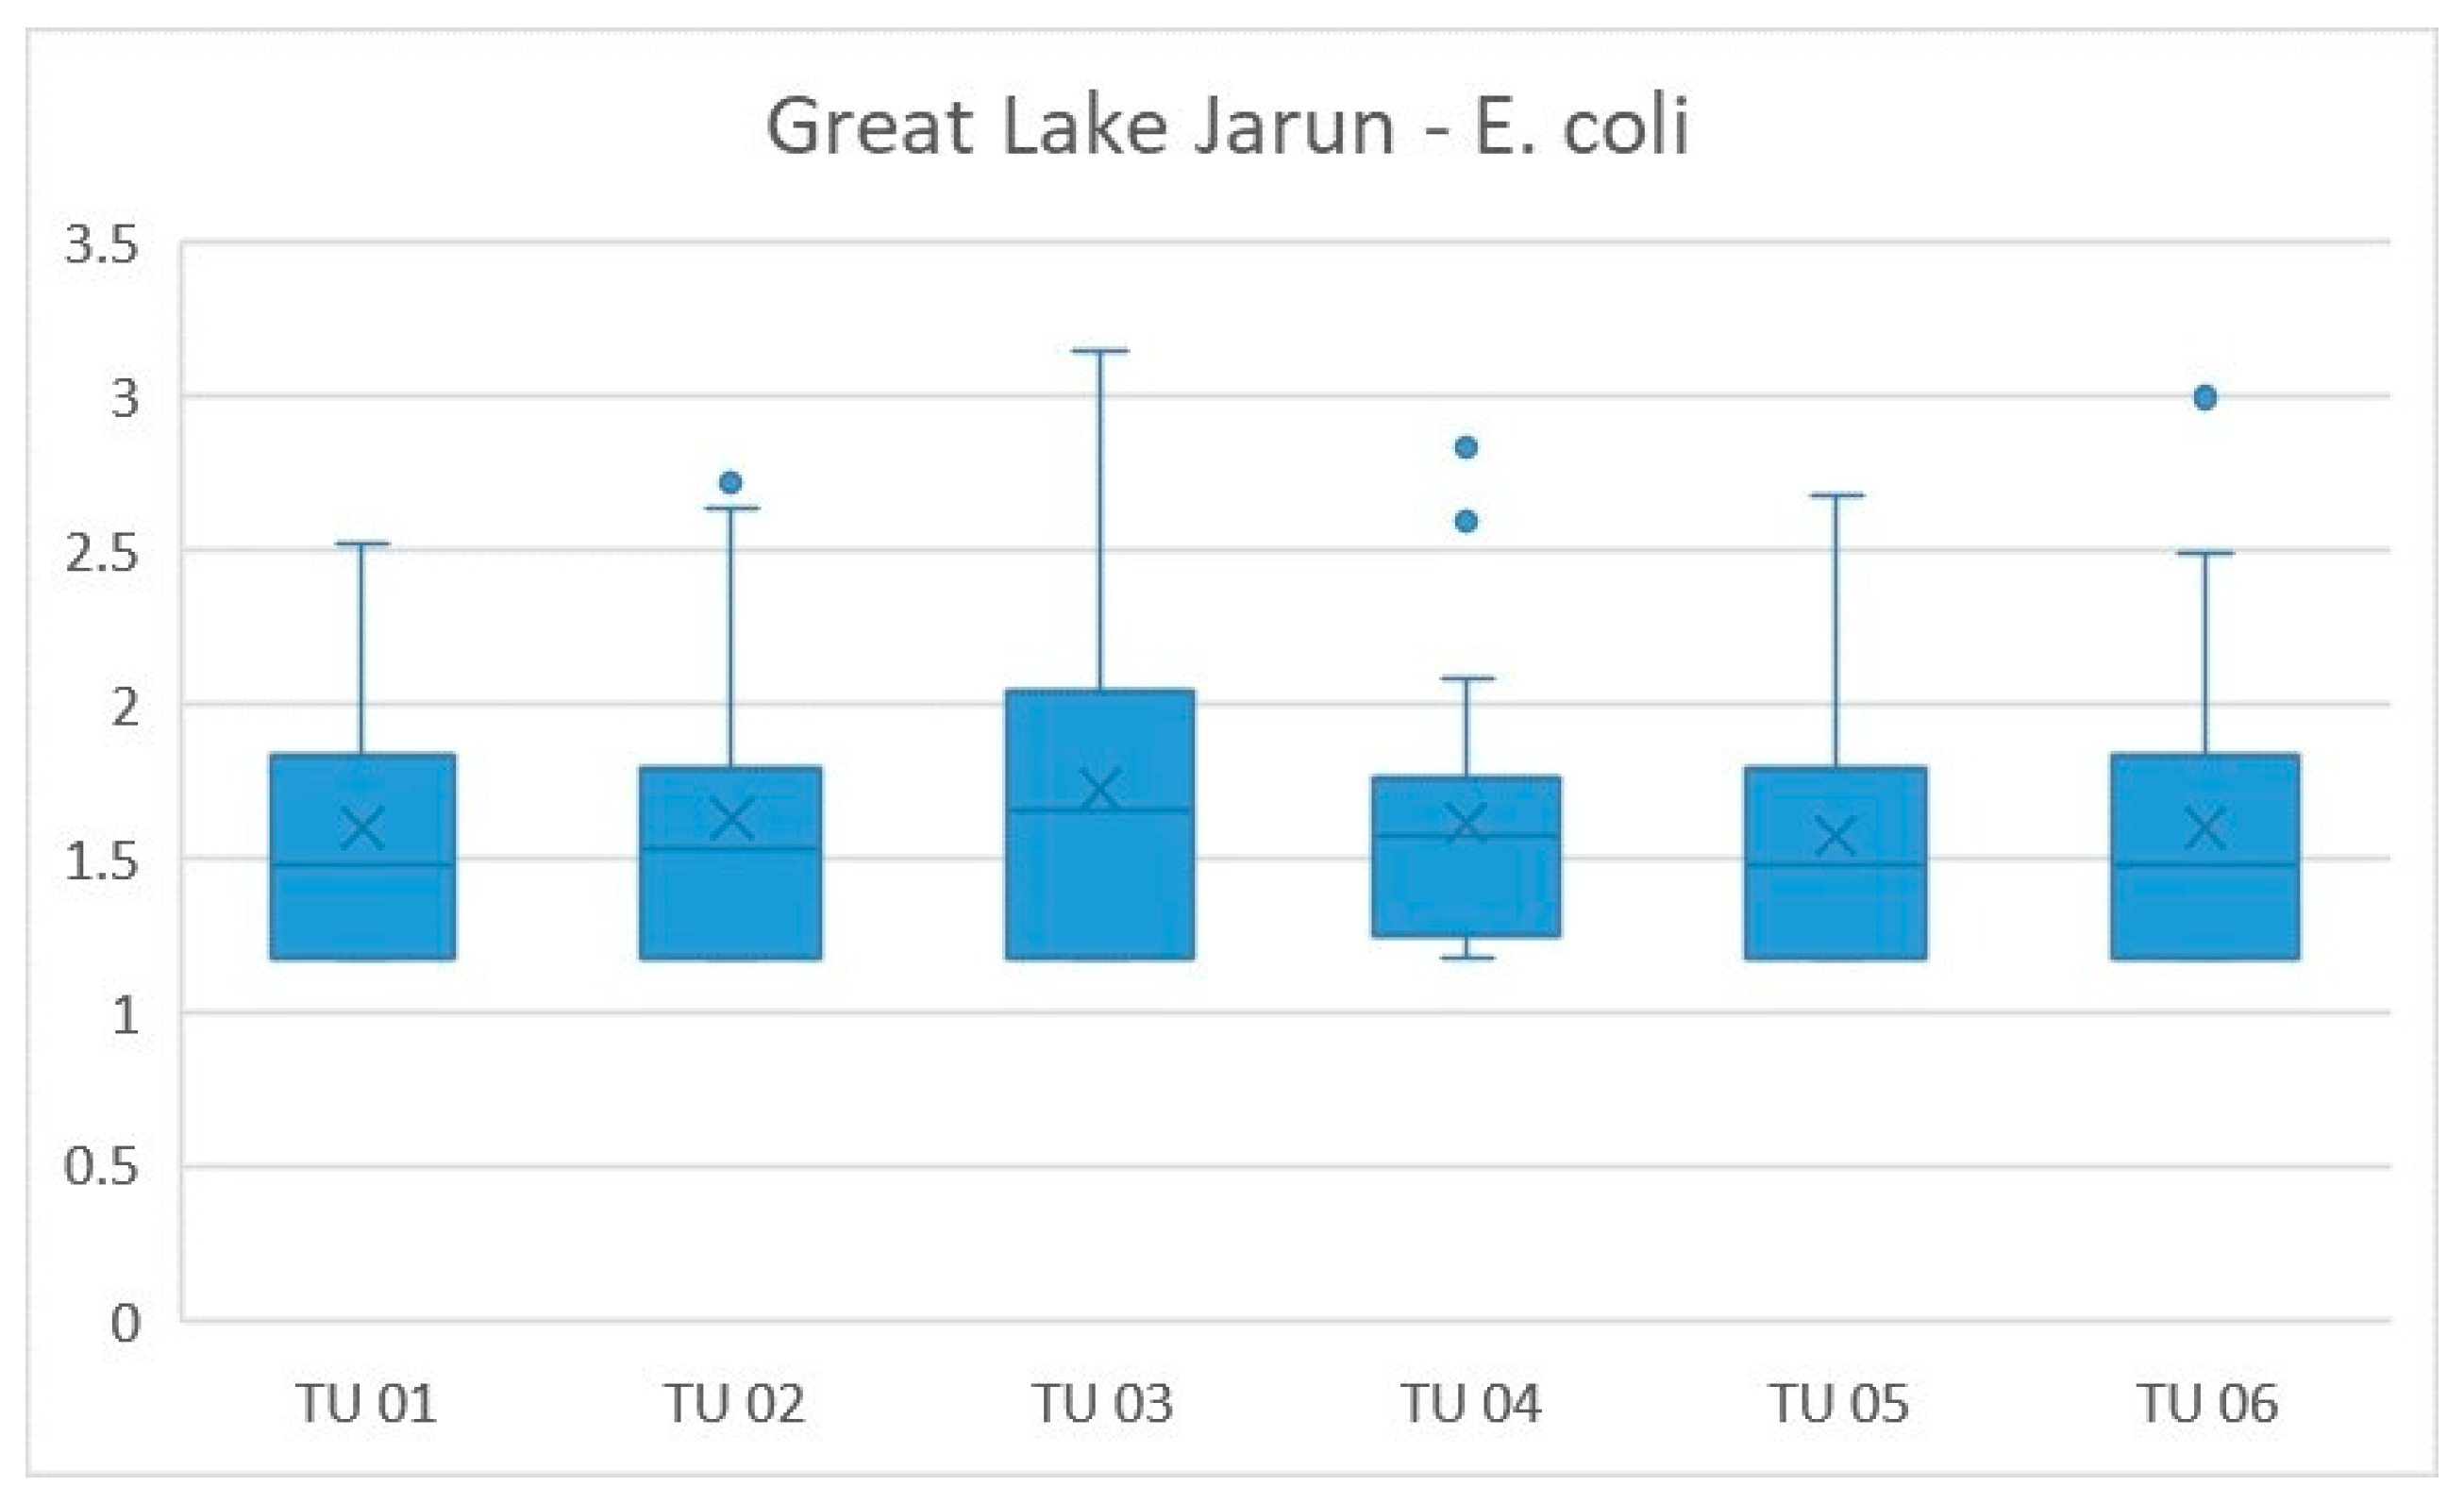
- No data points were excluded from the analysis. Values identified as extreme in boxplot visualisations were retained, as they represent environmentally relevant observations rather than measurement errors.
2.3.3. Hypothesis Testing and Post Hoc Analysis
- if p < α (0.05), H0 was rejected and a significant spatial difference was inferred;
- if p ≥ α, H0 was not rejected and no significant spatial difference was concluded.
2.3.4. Software
3. Results and Discussion
3.1. Descriptive Statistics




3.2. One-Factor Analysis of Variance
3.2.1. The Amount of Escherichia coli in Lakes Bundek and Jarun

3.2.2. The Number of Intestinal Enterococci in Lakes Bundek and Jarun
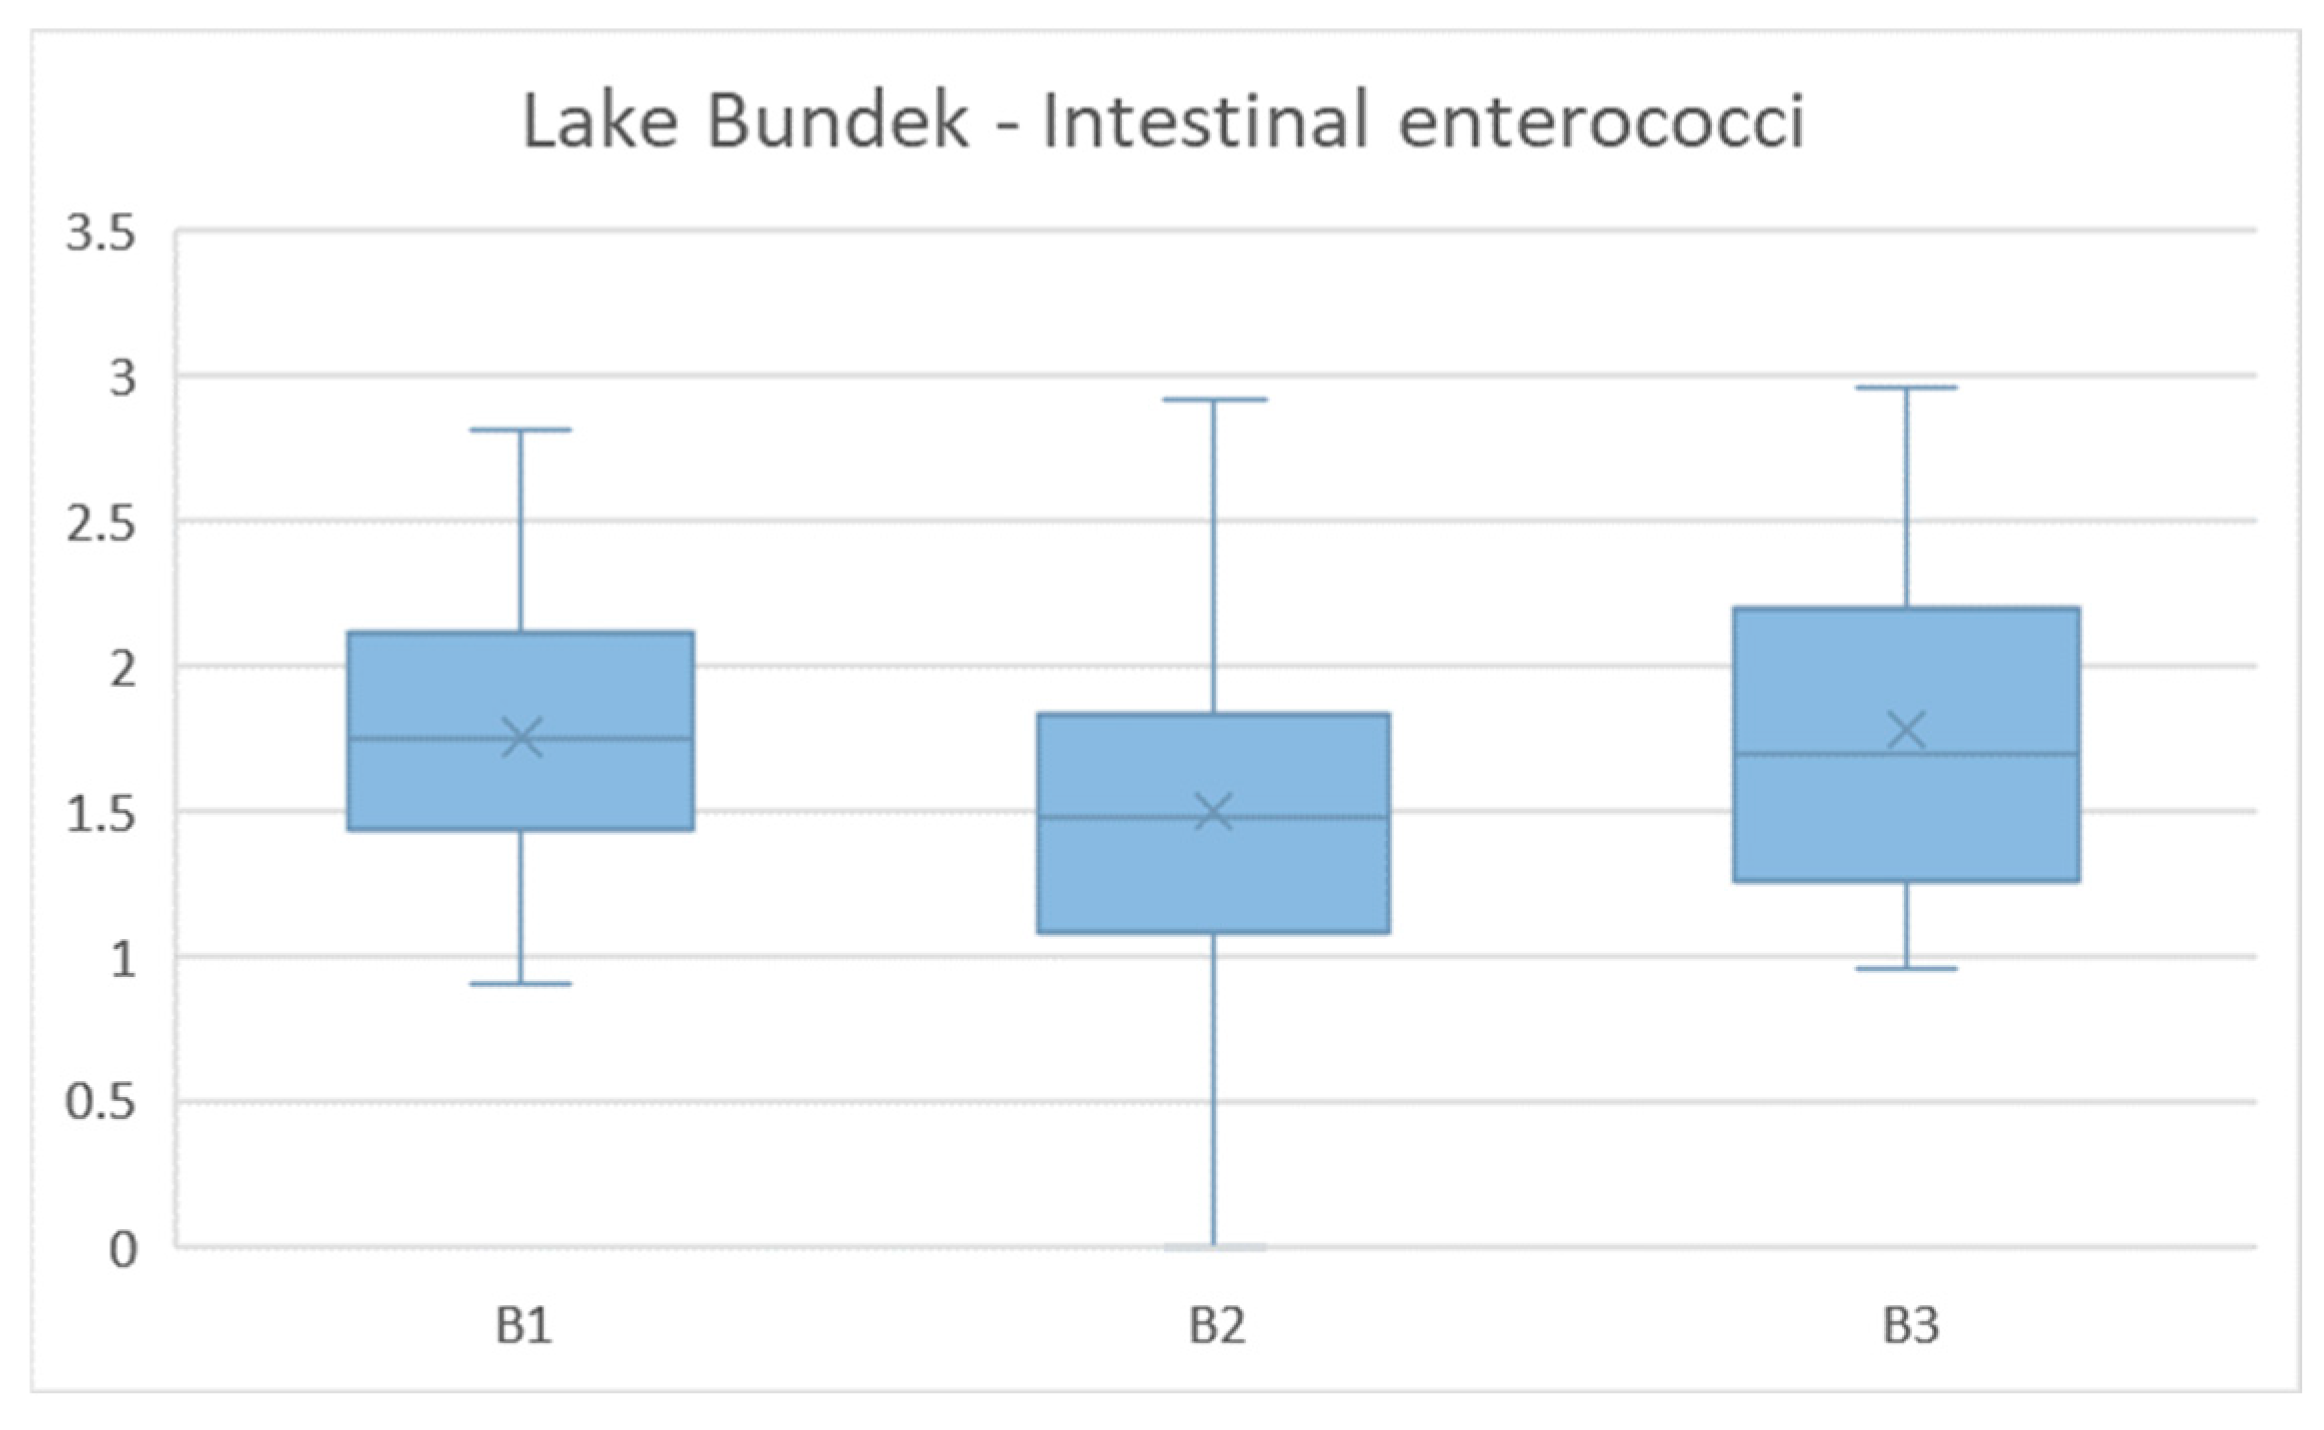
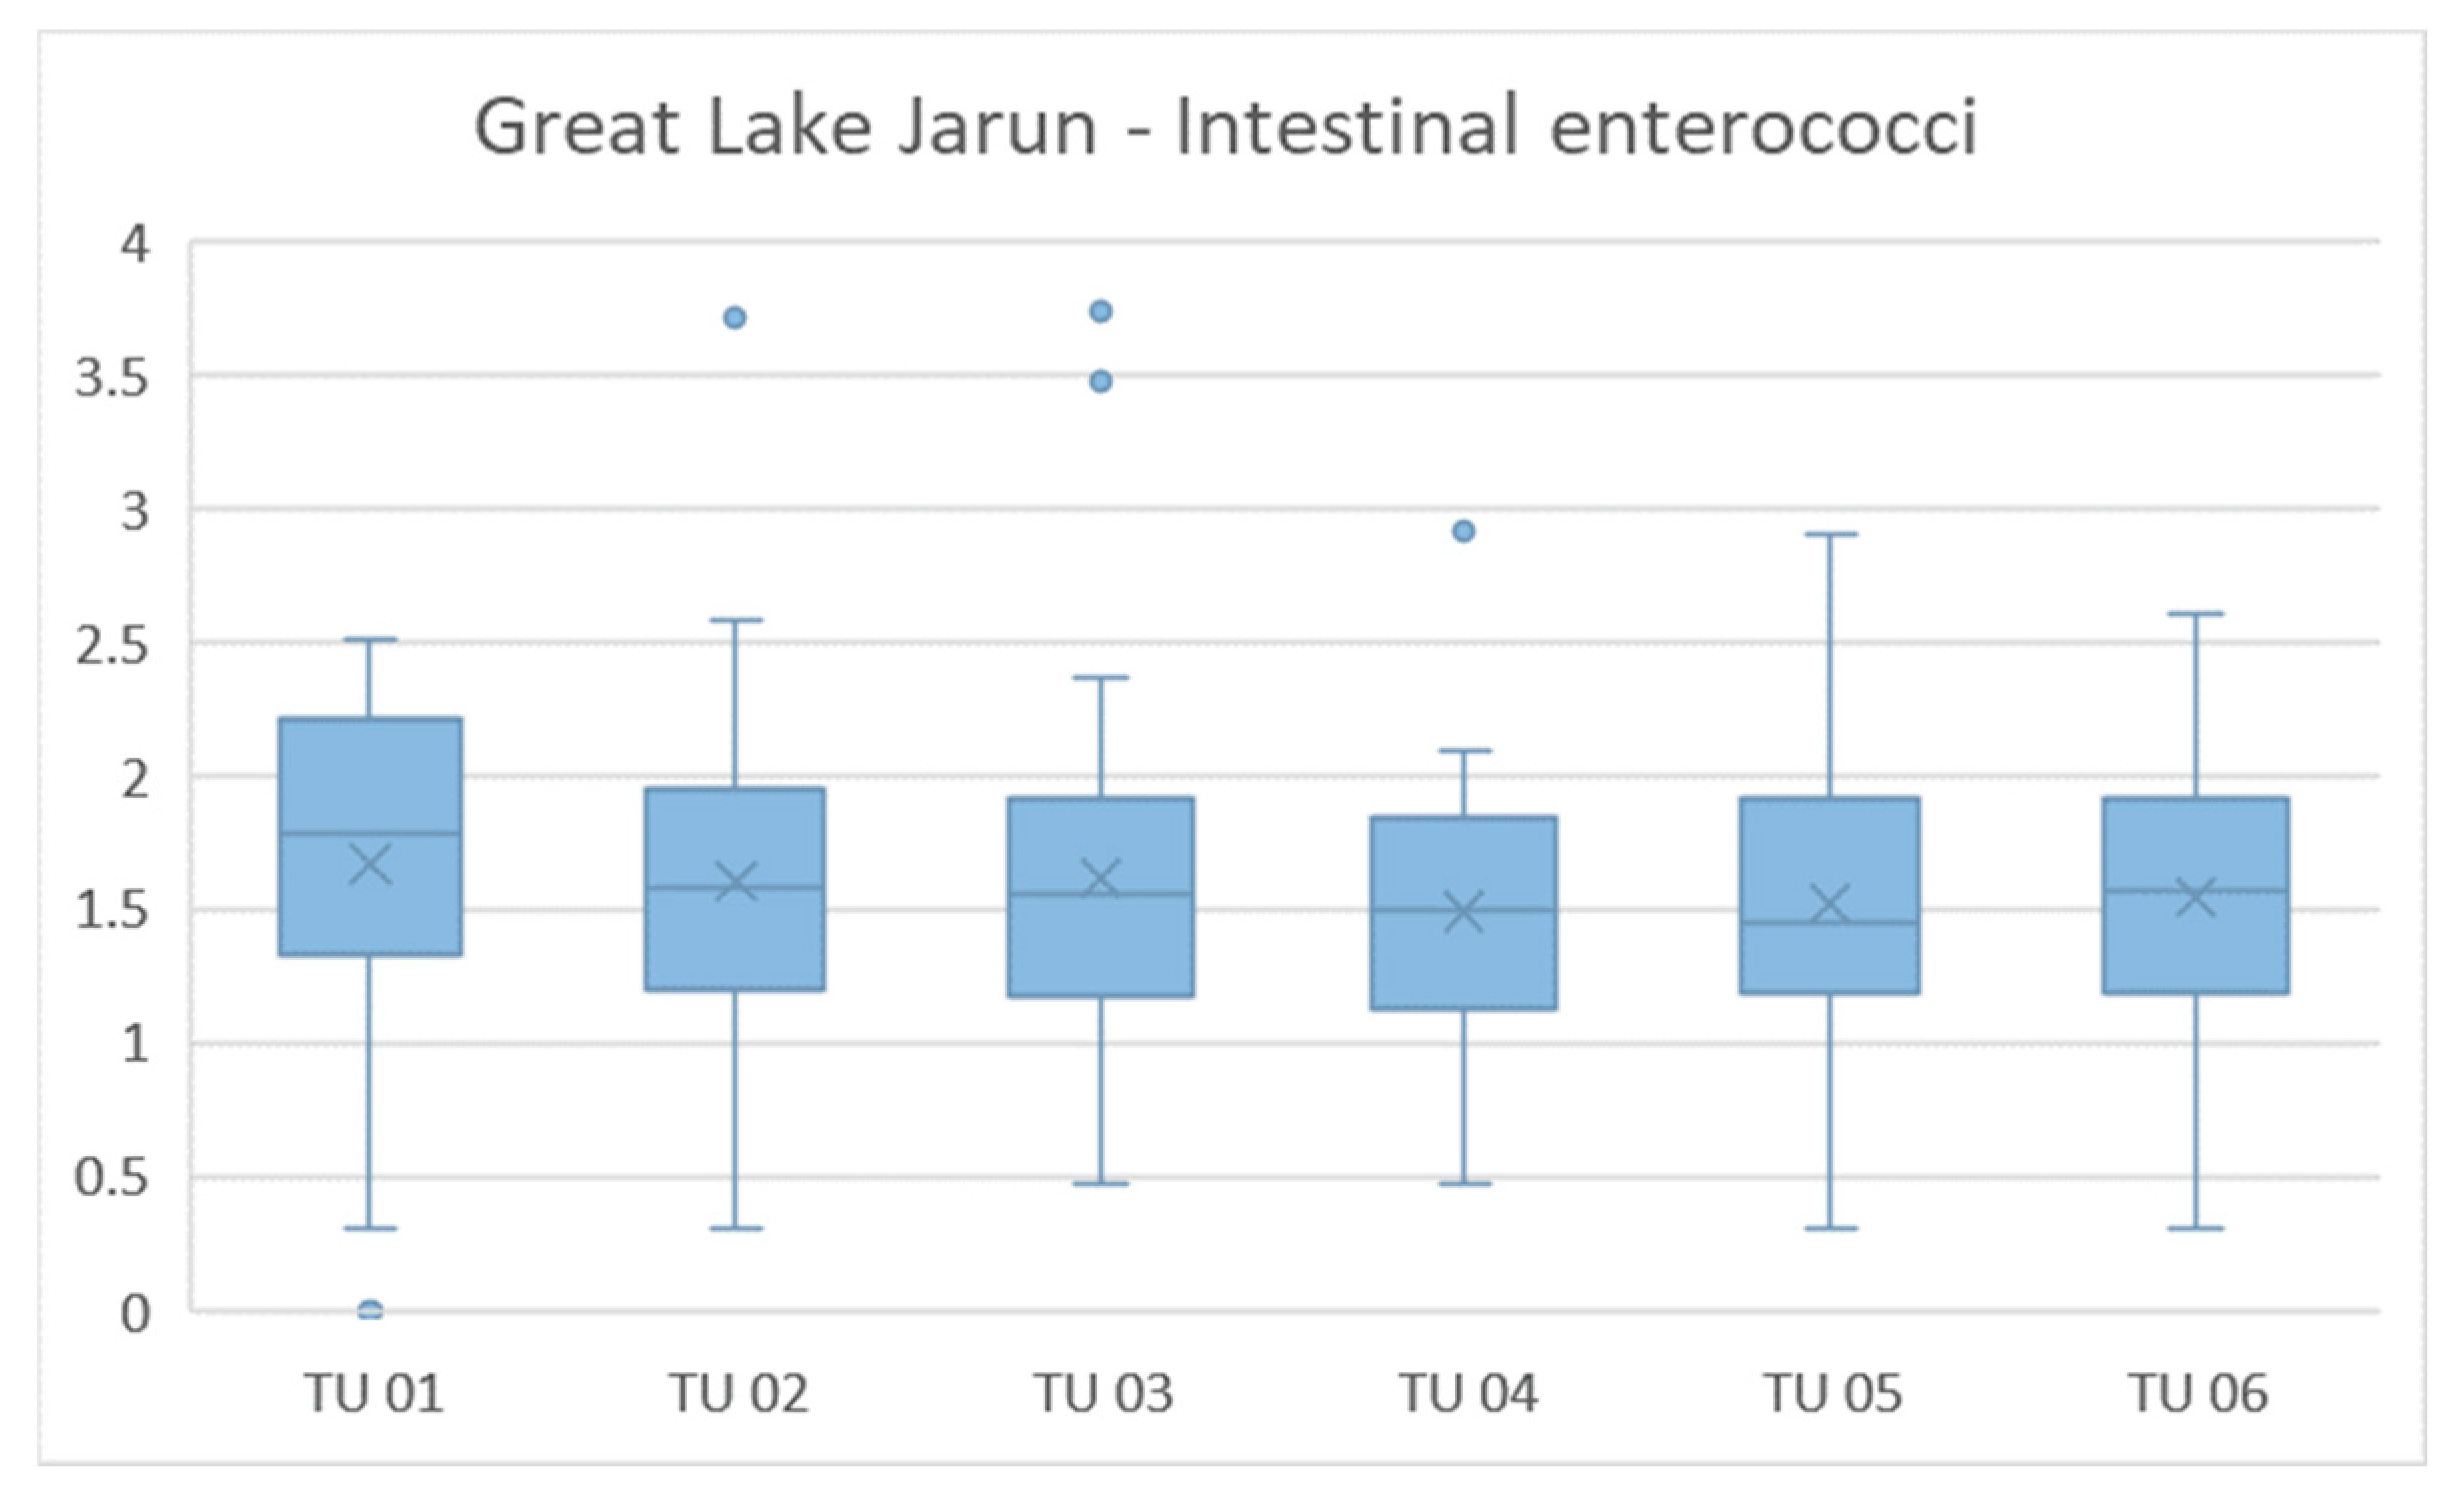

4. Conclusions
Author Contributions
Funding
Data Availability Statement
Conflicts of Interest
References
- Freshwater Crisis. National Geographic. Available online: https://www.nationalgeographic.com/environment/freshwater/freshwater-crisis/ (accessed on 20 September 2025).
- Boelee, E.; Geerling, G.; van der Zaan, B.; Blauw, A.; Vethaak, A.D. Water and health: From environmental pressures to integrated responses. Acta. Trop. 2019, 193, 217–226. [Google Scholar] [CrossRef] [Scilit] [PubMed]
- Gomes, L.; Bordalo, A.A.; Machado, A. Characterization of Escherichia coli Isolates in Recreational Waters: Implications for Public Health and One Health Approach. Water 2024, 16, 2925. [Google Scholar] [CrossRef] [Scilit]
- Directive 2006/7/EC of the European Parliament and of the Council of 15 February 2006 Concerning the Management of Bathing Water Quality and Repealing Directive 76/160/EEC. Available online: https://eur-lex.europa.eu/eli/dir/2006/7/oj/eng (accessed on 7 January 2026).
- Dimpor, J.J.; Lucky, O.P.; Kwarkye, D.F.; Watts, S.; Oguayo, C.P.; Ojewole, C.O.; Kusi, J. Identifying spatiotemporal patterns and drivers of fecal indicator bacteria in an urban lake for water quality assessment and management. Heliyon 2025, 11, e40955. [Google Scholar] [CrossRef] [Scilit] [PubMed]
- van der Meulen, E.S.; Tertienko, A.; Blauw, A.N.; Sutton, N.B.; van de Ven, F.H.M.; Rijnaarts, H.H.M.; Oel, P.R. A review of prediction models for E. coli in urban surface waters. Urban Water J. 2024, 21, 539–548. [Google Scholar] [CrossRef] [Scilit]
- Yoneda, I.; Nishiyama, M.; Watanabe, T. Comparative experiment to select water quality parameters for modelling the survival of Escherichia coli in lakes. Environ. Pollut. 2024, 357, 124423. [Google Scholar] [CrossRef] [Scilit] [PubMed]
- Jozić, S.; Cenov, A.; Glad, M.; Peroš-Pucar, D.; Kurić, K.; Puljak, T.; Ordulj, M.; Vrdoljak Tomaš, A.; Baumgartner, N.; Ivanković, D.; et al. The effect of sampling frequency and spatial and temporal variation in the density of fecal indicator bacteria on the assessment of coastal bathing water quality. Water Res. 2024, 264, 122192. [Google Scholar] [CrossRef] [Scilit] [PubMed]
- Quero, G.M.; Guicciardi, S.; Penna, P.; Catenacci, G.; Brandinelli, M.; Bolognini, L.; Luna, G.M. Increasing trends in faecal pollution revealed over a decade in the central Adriatic Sea (Italy). Water Res. 2024, 262, 122083. [Google Scholar] [CrossRef] [Scilit] [PubMed]
- Heasley, C.; Sanchez, J.J.; Tustin, J.; Young, I. Systematic review of predictive models of microbial water quality at freshwater recreational beaches. PLoS ONE 2016, 16, e0256785. [Google Scholar] [CrossRef] [Scilit] [PubMed]
- Rose, J.B.; Hofstra, N.; Hollmann, E.; Katsivelis, P.; Medema, G.J.; Murphy, H.M.; Naughton, C.C.; Verbyla, M.E. Global microbial water quality data and predictive analytics: Key to health and meeting SDG 6. PLoS Water 2023, 2, e0000166. [Google Scholar] [CrossRef] [Scilit]
- Manini, E.; Baldrighi, E.; Ricci, F.; Grilli, F.; Giovannelli, D.; Intoccia, M.; Casabianca, S.; Capellacci, S.; Marinchel, N.; Penna, P.; et al. Assessment of Spatio-Temporal Variability of Faecal Pollution along Coastal Waters during and after Rainfall Events. Water 2022, 14, 502. [Google Scholar] [CrossRef] [Scilit]
- World Health Organization (WHO). Guidelines on Recreational Water Quality: Volume 1 Coastal and Fresh Waters. Available online: https://www.who.int/publications/i/item/9789240031302 (accessed on 7 January 2026).
- Federigi, I.; Bonadonna, L.; Bonanno Ferraro, G.; Briancesco, R.; Cioni, L.; Coccia, A.M.; Carducci, A. Quantitative microbial risk assessment as support for bathing waters profiling. Mar. Pollut. Bull. 2020, 157, 111319. [Google Scholar] [CrossRef] [Scilit]
- Seis, W.; Ten Veldhuis, M.C.T.; Rouault, P.; Steffelbauer, D.; Medema, G. A new Bayesian approach for managing bathing water quality at river bathing locations vulnerable to short-term pollution. Water Res. 2024, 252, 121186. [Google Scholar] [CrossRef] [Scilit] [PubMed]
- Adhikary, R.K.; Starrs, D.; Wright, D.; Croke, B.; Glass, K.; Lal, A. Spatio-Temporal Variation in the Exceedance of Enterococci in Lake Burley Griffin: An Analysis of 16 Years’ Recreational Water Quality Monitoring Data. Int. J. Environ. Res. Public Health 2024, 21, 579. [Google Scholar] [CrossRef] [Scilit] [PubMed]
- Durham, B.W.; Porter, L.; Webb, A.; Thomas, J. Seasonal influence of environmental variables and artificial aeration on Escherichia coli in small urban lakes. J. Water Health 2016, 14, 929–941. [Google Scholar] [CrossRef] [Scilit] [PubMed]
- Palmer, J.A.; Law, J.Y.; Soupir, M.L. Spatial and temporal distribution of E. coli contamination on three inland lake and recreational beach systems in the upper Midwestern United States. Sci. Total Environ. 2020, 722, 137846. [Google Scholar] [CrossRef] [Scilit] [PubMed]
- Zagreb Danas, Bundek Gradski Park i Jezero. Available online: https://www.zgportal.com/o-zagrebu/povijest-zagrebackih-naselja/bundek/ (accessed on 20 September 2025).
- Kratka Povijest Zagrebačkog Jezera Jarun. Available online: https://kurziv.net/kratka-povijest-zagrebackog-jezera-jarun/ (accessed on 10 January 2026).
- Bathing Water Quality Regulation (NN 51/14). Available online: https://narodne-novine.nn.hr/clanci/sluzbeni/2014_04_51_978.html (accessed on 20 September 2025).
- EPA. Recreational Water Quality Criteria. Available online: https://www.epa.gov/sites/production/files/2015-10/documents/rwqc2012.pdf (accessed on 20 September 2025).
- HRN EN ISO 9308-3:2000; Water Quality-Detection Numeration of Escherichia coli Coliform Bacteria in Surface Waste Water Part 3 Miniature Method (Most Likely Number Method) for Detection Counting of, E. coli in Surface and Waste Water. European Committee for Standardization (CEN): Brussels, Belgium, 2000.
- HRN EN ISO 7899_2: 2000; Water Quality-Detection and Enumeration of Intestinal Enterococci-Part 2: Membrane Filtration Method. ISO: Geneva, Switzerland, 2000.
- Zar, Z.H. Biostatistical Analysis; Printice Hall Inc.: Englewood Clifs, NJ, USA, 1999; pp. 592–663. [Google Scholar]
- Hoffman, J.I.E. (Ed.) Analysis of Variance I. One-Way. In Biostatistics for Medical and Biomedical Practitioners; Academic Press: Cambridge, MA, USA, 2015; pp. 391–420. [Google Scholar]
- Hassan, A.; Samy, G.; Hegazy, M.; Balah, A.; Fathy, S. Statistical analysis for water quality data using ANOVA (Case study–Lake Burullus influent drains). Ain. Shams Eng. J. 2024, 15, 102652. [Google Scholar] [CrossRef] [Scilit]
- Pujar, P.M.; Kenchannavar, H.H.; Kulkarni, R.M.; Kulkarni, U.P. Real-time water quality monitoring through Internet of Things and ANOVA-based analysis: A case study on river Krishna. Appl. Water Sci. 2020, 10, 22. [Google Scholar] [CrossRef] [Scilit]
- Thomas, E.O. Evaluation of groundwater quality using multivariate, parametric and non-parametric statistics, and GWQI in Ibadan, Nigeria. Water Sci. 2023, 37, 117–130. [Google Scholar] [CrossRef] [Scilit]
- Berkowitz, M.; Altman, R.; Loughin, T. Random forests for survival data: Which methods work best and under what conditions? Int. J. Biostat. 2024, 20, 315–345. [Google Scholar] [CrossRef] [Scilit] [PubMed]

| Location | Arithmetic Mean (log10 E. coli) | Location | Arithmetic Mean (log10 Intestinal Enterococci) |
|---|---|---|---|
| B1 | 2.05508 | B1 | 1.752095 |
| B2 | 1.68057 | B2 | 1.498872 |
| B3 | 1.97527 | B3 | 1.78066 |
| TU 01 | 1.582943 | TU 01 | 1.66786 |
| TU 02 | 1.62532 | TU 02 | 1.600568 |
| TU 03 | 1.71827 | TU 03 | 1.61636 |
| TU 04 | 1.61365 | TU 04 | 1.49078 |
| TU 05 | 1.57161 | TU 05 | 1.52082 |
| TU 06 | 1.59633 | TU 06 | 1.546847 |
| TU 07 | 1.58972 | TU 07 | 1.502533 |
| TU 08 | 1.58771 | TU 08 | 1.5492 |
| TU 09 | 1.59623 | TU 09 | 1.534743 |
| TU 10 | 1.752 | TU 10 | 1.450347 |
| TU 11 | 1.7709 | TU 11 | 1.54305 |
| TU 12 | 1.81728 | TU 12 | 1.667085 |
| ||||||
| Lake | Year | Mean (log10) | Median (log10) | SD (log10) | % >500 | N |
| Bundek | 2016 | 2.164 | 2.123 | 0.456 | 13.6 | 22 |
| Bundek | 2017 | 1.827 | 1.886 | 0.512 | 4.2 | 24 |
| Bundek | 2018 | 1.644 | 1.663 | 0.365 | 0 | 19 |
| Bundek | 2019 | 2.055 | 2.041 | 0.4 | 4.2 | 24 |
| Jarun | 2016 | 1.754 | 1.663 | 0.451 | 2.8 | 107 |
| Jarun | 2017 | 1.673 | 1.565 | 0.461 | 2.1 | 140 |
| Jarun | 2018 | 1.517 | 1.477 | 0.349 | 0 | 110 |
| Jarun | 2019 | 1.684 | 1.658 | 0.421 | 2.7 | 112 |
| ||||||
| Lake | Year | Mean (log10) | Median (log10) | SD (log10) | % >200 | N |
| Bundek | 2016 | 1.458 | 1.439 | 0.56 | 9.1 | 22 |
| Bundek | 2017 | 1.606 | 1.491 | 0.468 | 12.5 | 24 |
| Bundek | 2018 | 1.479 | 1.415 | 0.394 | 0 | 19 |
| Bundek | 2019 | 2.21 | 2.19 | 0.488 | 33.3 | 24 |
| Jarun | 2016 | 1.283 | 1.204 | 0.514 | 2.8 | 107 |
| Jarun | 2017 | 1.713 | 1.613 | 0.602 | 16.4 | 140 |
| Jarun | 2018 | 1.592 | 1.544 | 0.393 | 2.7 | 110 |
| Jarun | 2019 | 1.812 | 1.796 | 0.376 | 8 | 112 |
| Sources of Data Dispersion | Degrees of Freedom | Sum of Squares of Deviations | Corrected Variance | Value of the Test Statistic | p Value | Critical Value of the Test Statistic |
|---|---|---|---|---|---|---|
| Among the arrays | 2 | 2.413 | 1.206 | 5.632 | 0.005 | 3.098 |
| Random error | 90 | 19.276 | 0.214 | |||
| Total | 92 | 21.688 |
| Sources of Data Dispersion | Degrees of Freedom | Sum of Squares of Deviations | Corrected Variance | Value of the Test Statistic | p Value | Critical Value of the Test Statistic |
|---|---|---|---|---|---|---|
| Among the arrays | 5 | 0.439 | 0.088 | 0.436 | 0.823 | 2.263 |
| Random error | 184 | 37.080 | 0.202 | |||
| Total | 189 | 37.519 |
| Sources of Data Dispersion | Degrees of Freedom | Sum of Squares of Deviations | Corrected Variance | Value of the Test Statistic | p Value | Critical Value of the Test Statistic |
|---|---|---|---|---|---|---|
| Among the arrays | 5 | 1.692 | 0.338 | 1.697 | 0.138 | 2.265 |
| Random error | 184 | 35.085 | 0.199 | |||
| Total | 189 | 36.777 |
| Sources of Data Dispersion | Degrees of Freedom | Sum of Squares of Deviations | Corrected Variance | Value of the Test Statistic | p Value | Critical Value of the Test Statistic |
|---|---|---|---|---|---|---|
| Among the arrays | 2 | 1.459 | 0.730 | 2.134 | 0.124 | 3.098 |
| Random error | 90 | 30.774 | 0.342 | |||
| Total | 92 | 32.234 |
| Sources of Data Dispersion | Degrees of Freedom | Sum of Squares of Deviations | Corrected Variance | Value of the Test Statistic | p Value | Critical Value of the Test Statistic |
|---|---|---|---|---|---|---|
| Among the arrays | 5 | 0.682 | 0.136 | 0.372 | 0.867 | 2.263 |
| Random error | 184 | 67.429 | 0.366 | |||
| Total | 189 | 68.111 |
| Sources of Data Dispersion | Degrees of Freedom | Sum of Squares of Deviations | Corrected Variance | Value of the Test Statistic | p Value | Critical Value of the Test Statistic |
|---|---|---|---|---|---|---|
| Among the arrays | 5 | 0.774 | 0.155 | 0.538 | 0.747 | 2.265 |
| Random error | 176 | 50.660 | 0.288 | |||
| Total | 181 | 51.435 |
Disclaimer/Publisher’s Note: The statements, opinions and data contained in all publications are solely those of the individual author(s) and contributor(s) and not of MDPI and/or the editor(s). MDPI and/or the editor(s) disclaim responsibility for any injury to people or property resulting from any ideas, methods, instructions or products referred to in the content. |
© 2026 by the authors. Licensee MDPI, Basel, Switzerland. This article is an open access article distributed under the terms and conditions of the Creative Commons Attribution (CC BY) license.
Share and Cite
Ptiček Siročić, A.; Kovač, S.; Šebina, A. Evaluation of Spatial Variability in Fecal Indicator Bacteria in Urban Recreational Lakes by One-Way ANOVA. Environments 2026, 13, 80. https://doi.org/10.3390/environments13020080
Ptiček Siročić A, Kovač S, Šebina A. Evaluation of Spatial Variability in Fecal Indicator Bacteria in Urban Recreational Lakes by One-Way ANOVA. Environments. 2026; 13(2):80. https://doi.org/10.3390/environments13020080
Chicago/Turabian StylePtiček Siročić, Anita, Sanja Kovač, and Alice Šebina. 2026. "Evaluation of Spatial Variability in Fecal Indicator Bacteria in Urban Recreational Lakes by One-Way ANOVA" Environments 13, no. 2: 80. https://doi.org/10.3390/environments13020080
APA StylePtiček Siročić, A., Kovač, S., & Šebina, A. (2026). Evaluation of Spatial Variability in Fecal Indicator Bacteria in Urban Recreational Lakes by One-Way ANOVA. Environments, 13(2), 80. https://doi.org/10.3390/environments13020080