


Abstract
Soil degradation can strongly constrain plant establishment and ecosystem restoration, highlighting the need for amendments able to improve both soil functionality and plant–microbiome interactions. This study evaluated whether biochar preconditioned for six months in healthy pine forest soil could enhance the early growth of Pinus halepensis Mill. compared with untreated biochar in degraded agricultural soil. Seedlings were grown for 85 days under controlled conditions in five substrates, including pine forest soil, non-intensively cultivated agricultural soil, degraded agricultural soil, and degraded soil amended with either untreated or bioactivated biochar. Above- and below-ground plant morphological traits, soil chemistry, and rhizosphere microorganism communities were assessed. Untreated biochar markedly promoted root development, increasing absorptive fine-root length, root biomass, and stem diameter compared with degraded soil and forest-conditioned biochar. In contrast, bioactivated biochar resulted in more limited early seedling growth. Microbial community composition varied among treatments, whereas Shannon diversity did not differ significantly. Bacterial communities showed partial overlap among treatments, while fungal communities displayed clearer treatment-associated separation. Overall, forest-soil conditioning did not improve biochar effectiveness during early seedling development. Further drought and field trials are required to determine whether these contrasting growth and rhizosphere responses influence long-term establishment and restoration performance.
1. Introduction
Soil biodiversity contributes to the development of aboveground vegetation and the enrichment of soil quality through the decomposition of plant residues [1]. Soil resilience, defined as the capacity to maintain functional health after a severe disturbance, is enhanced by biodiversity itself. Globally, the contribution of soil biodiversity to ecosystem services has been estimated to range between €1.4 and €12.5 trillion per year [2]. Soil organic carbon is recognized as a primary determinant of agricultural productivity and water security, representing a key factor for biodiversity and resilience to climate change [2]. The loss of organic carbon, especially in arid regions where baseline levels are already low, invariably leads to soil degradation and the impairment of related ecosystem functions. It is estimated that between one-third and one-quarter of the world’s land area is affected by some form of degradation [3], a phenomenon that contributes to declining agricultural yields, disruption of hydrological cycles, and the release of greenhouse gases. The overexploitation of soils for agricultural purposes led to systematic degradation, characterized by secondary salinization and severe depletion of the indigenous microbiome [4,5]. In addition to intensive agricultural practices, wildfires represent one of the major disturbances to soil and natural habitats.
In this context, the introduction of hardy pioneer species like Pinus spp. constitutes an effective approach to facilitate land-use transitions in degraded ecosystems [6]. The objective is to establish a structural and functional foundation that facilitates subsequent spontaneous recolonization by plant species typical of neighboring natural habitats, specifically, those species that occur naturally in the area due to specific environmental conditions. However, this operation faces significant obstacles: the mere planting of saplings may not be sufficient due to the drastic reduction in biodiversity and the loss of key symbionts, such as mycorrhizal fungi [7]. The latter are indispensable for vegetation recovery and the restoration of the soil-plant equilibrium. Their absence severely limits the establishment capacity of seedlings and the functional recovery of the ecosystem [8].
Carbon and micronutrient cycles are predominantly driven by bacterial diversity, which can mitigate anthropogenic effects on soil and plant productivity [9]. Various species of soil bacteria and fungi are capable of solubilizing nutrients and producing molecules and phytohormones that support plant health [7,10,11]. Within this perspective, interest in the use of biochar as an amendment has grown over the last two decades due to its specialized properties: (1) water and nutrient retention capacity; (2) high porosity, which provides a refuge for beneficial microorganisms; and (3) increased stable carbon sequestration [10]. Biochar has shown significant effects on the microbial communities’ composition, including mycorrhizae and enzymatic activity [12,13,14,15,16]. Furthermore, long-term biochar application has proven to be an effective strategy for the rehabilitation of degraded soils, stabilizing interactions between nutrients, metabolites, and the soil microbiome [17]. Specifically, it has been widely documented that biochar application can significantly improve plant traits, including root biomass and length, fostering more efficient soil exploration [18]. However, the efficacy of “as-is” biochar may be limited by its initial biological inertia. To overcome these limitations, recent research has focused on pre-conditioning (or bioactivation) techniques aimed at optimizing biochar–soil–plant interactions and enzymatic activity in the rhizosphere [19,20,21]. Significant examples include nutrient loading and co-composting, which enhance the biotic response of the system [19,20,21].
To date, biochar manipulation has primarily referred to studies on the efficacy of biochar-loaded composts, which report variable results (positive, negative, or neutral) on plant growth, demonstrating that composting is not a universal solution for the safety of the biochar–plant system [20]. There is a growing consensus that the microbial activation of biochar contributes to its positive impacts on plant productivity and health [20,22].
Within this framework, and as part of the STOREROOM project implemented in Italy under the National Recovery and Resilience Plan (PNRR), this study tested an innovative pre-conditioning phase consisting of the inoculation of biochar in healthy soil of pine forest prior to its application in degraded agricultural soil. The aim is to evaluate whether soil-mediated conditioning can promote microbial recovery and plant growth, specifically improving the development of Pinus halepensis Mill. in soil degraded by intensive agriculture.
2. Materials and Methods
2.1. Biochar Bioactivation
The site selected for the bioactivation phase is a natural pine forest located along the Ionian arc near Taranto, Apulia, Southern Italy, which has not been affected by fire since 1982 (40.521935° N, 17.085023° E). This area is a Special Area of Conservation (SAC, IT9130006) under the Habitats Directive (92/43/EEC). The biochar used in this study was produced by Romagna Carbone s.n.c. (Bagnacavallo, RA, Italy) from orchard pruning residues through slow pyrolysis. The main biochar feature are reported in the Table 1. The untreated biochar was sieved through a 1 cm mesh to remove the finer fraction, and only the particles retained on the sieve (>1 cm) were placed into mesh bags with a 1 cm mesh size. The bags were then buried at a depth of 5 cm and covered with the same native forest topsoil removed when the burial pit was excavated. After an in-soil incubation period of approximately 6 months, the bioactivated biochar was retrieved and stored at 4 °C until experimental use, which occurred within the days following its recovery from the forest.
Table 1.
Physicochemical characteristics and production parameters of the biochar used in the study.
2.2. Experimental Design
Growth chamber experiments were conducted using Pinus halepensis Mill. (Aleppo pine) as the target species. Seeds were collected from the aforementioned Taranto pine forest in collaboration with ARIF Puglia, the Regional Agency for Irrigation and Forestry of Apulia. An intensively cultivated agricultural greenhouse soil was selected as the degraded agricultural soil (AD). The classification of this soil as degraded was based on both its long-term intensive management history and its chemical characteristics (Table 2). All soils were collected from the upper 15 cm of the soil profile, with one collection site representing each source-soil category. In the pine forest (P), the approximately 1 cm thick litter layer was removed before sampling the underlying soil. Soil samples were stored at 4 °C and used in the experiment within a few days of collection. Soil from each site was homogenized before pot filling, and the same homogenized degraded agricultural soil was used for all treatments involving this substrate. The experiment comprised five substrate treatments, each represented by five replicate pots containing one seedling per pot:
Table 2.
Analytical methods, instrumentation, operating conditions, and quality control procedures used for the chemical characterization of soil samples.
- P: natural pine forest soil, from the same site of the biochar bioactivation;
- A: non-intensively cultivated agricultural soil (no use of pesticides, herbicides, chemical fertilizers, or heavy machinery);
- AD: degraded, intensively cultivated agricultural soil (use of pesticides, herbicides, chemical fertilizers, and heavy machinery);
- ADB: degraded agricultural soil amended with untreated biochar;
- ADBP: degraded agricultural soil amended with bioactivated biochar.
The experiment was designed to compare untreated and forest-conditioned biochar in degraded agricultural soil, using the corresponding unamended soil as the control. Pine forest soil and non-intensively cultivated agricultural soil were included as reference substrates. The design therefore comprised five substrate treatments and was not intended as a factorial test of soil type and biochar treatment.
Pinus halepensis seeds were pre-germinated in Petri dishes and sown in 2 L pots containing 1.85 L of substrate. Before biochar application, the moisture content of each biochar was determined by oven-drying subsamples at 105 °C to constant mass. Untreated and bioactivated biochar were applied without prior drying, with their masses adjusted to provide the same dose of 21.9 g dry weight per pot, equivalent to approximately 15 Mg ha−1 (15,000 Kg ha−1) based on the substrate surface area. Both types of biochar were thoroughly mixed with the soil before pot filling. Pots were then placed in a growth chamber under controlled environmental conditions. Seedlings were maintained at a constant temperature of 25 °C with a 16 h light/8 h dark photoperiod. Photosynthetically active radiation (PAR, 400–700 nm), measured at plant height, was 400 ± 27 μmol m−2 s−1. The cultivation cycle lasted 85 days. Pots were checked daily on weekdays and manually watered as needed to prevent excessive substrate drying, adding approximately 50–100 mL of water per pot at each watering event. Before weekends, water was left in the saucers to provide a reserve for uptake through the drainage holes and reduce substrate drying between checks.
2.3. Morphological Measurements
At the end of the growth period, the seedlings were destructively sampled, and the roots remaining attached to them were gently cleaned of adhering soil and analysed for root traits. Roots that became detached and remained in the soil were quantified according to [23] and included in the estimates of whole-root-system traits. Roots were scanned submerged in water at a resolution of 800 dpi with a calibrated flatbed scanner coupled to a transparency unit for image acquisition ( Expression 13,000 XL, Epson Italia S.p.A., Cinisello Balsamo, MI, Italy.) and analyzed by using WinRhizo Pro V. 2007d (Regent Instruments Inc.,Quebec City, QC, Canada). Micrometric image analysis was used to define functional diameter classes of P. halepensis fine roots, following the approach described by Montagnoli, Terzaghi [24]. The following parameters were measured: total dry biomass of leaves, stems, and root systems; plant height, crown width, lateral branch number, stem diameter; root length of the whole root system and for functional diameter classes; specific root length (SRL), root tissue density (RTD) and root:shoot ratio.
During sampling, rhizosphere samples were also collected and prepared for microbiological analysis to evaluate the effects of the treatments on soil quality and microbial biodiversity, as described in Section 2.5.
2.4. Soil Characterization
2.4.1. Soil Chemical Analyses
The methods for chemical soil characterization are reported in Table 2.
2.4.2. Soil Texture Analysis (Andreasen Pipette Method)
A dispersing solution was prepared by dissolving sodium carbonate (Na2CO3) and sodium hexametaphosphate (NaPO3)6 in Milli-Q water and combining the two solutions. Approximately 10 g of air-dried soil (<2 mm) was placed in a 500 mL container, and 240 mL of distilled water and 10 mL of dispersing solution were added. The suspension was mechanically shaken for 2 h (130–160 rpm) to ensure complete particle dispersion. The sample was then wet-sieved through a 0.2 mm mesh using an Andreasen sedimentation apparatus to separate the coarse sand fraction, which was collected, rinsed, and transferred into a pre-weighed container (SG). The remaining suspension, containing finer particles, was transferred into a sedimentation cylinder, brought to volume, and homogenized. Sedimentation times were determined according to Stokes’ law, and aliquots were collected at fixed intervals to separate silt and clay fractions. All fractions (coarse sand, silt + clay, and clay) were dried at 105 °C overnight, weighed, and their percentages calculated. Soil texture was then determined using the IUSS soil texture triangle based on particle-size distribution.
2.5. Microbiome Analyses
The pine forest bulk soil and microbial rhizo-communities, collected from five Aleppo pine roots for each experimental group, were analyzed using an NGS approach to estimate their bacterial and fungal composition, according to Piccolo, Gentile [25]. Briefly, root-associated microorganisms were extracted by suspending 2.5 g of roots in 25 mL of sterile physiological solution (NaCl, 9.0 g/L), followed by agitation at 200 rpm for 30 min at 25 °C. After root removal, the suspension was centrifuged at 600 rpm for 10 min. The resulting supernatant was collected and subjected to two sequential washing steps by centrifugation at 3000× g for 15 min. After removing the supernatant, the pellet was resuspended in 200 μL of sterile physiological solution (NaCl 0.9%). Subsequently, 10 μL of a 0.1 OD600 solution was added to 90 μL of extraction buffer from the Extract-N-Amp™ Plant PCR Kit (Merck Life Science, Milan, Italy) and incubated at 94 °C for 20 min. Then, 100 μL of dilution buffer, included in the kit, was added and mixed by pipetting. This procedure was performed in triplicate. The target regions, 16S rDNA and ITS, were then amplified following the manufacturer’s instructions. In particular, the V3–V4 hypervariable region of the bacterial 16S rRNA gene was amplified, in triplicate, using the specific primers 341F (5′-CCTACGGGRSGCAGCAG-3′) and 909R (5′-TTTCAGYCTTGCGRCCGTAC-3′), whereas the fungal ITS2 region was amplified using the ITS3 (5′-GCATCGATGAAGAACGCAGC-3′) and ITS4 (5′-TCCTCCGCTTATTGATATGC-3′) primers. An annealing temperature of 55 °C was used. Amplicon libraries were prepared and sequenced using an NGS approach by Genomics4life company (Baronissi, SA, Italy). Illumina sequence data were sorted based on unique barcodes and quality-controlled using Quantitative Insights into Microbial Ecology 2 (QIIME 2, version 2019.4), with the demux2, dada2, and feature-table plugins. Alpha- and beta-diversity analyses were performed using the alignment and diversity plugins. For taxonomic analysis, a pre-trained Naive Bayes classifier based on the SILVA 138 Operational Taxonomic Units database was used for 16S rDNA sequences, trimmed to include the V3–V5 region of the 16S rRNA gene bound by the 341F/909R primer pair. Meanwhile, the classifier for fungal ITS2 sequences was pre-trained on the UNITE database, version 7–99%, and applied to paired-end sequence reads to generate taxonomy tables. Taxonomic and compositional analyses were conducted using the feature-classifier, taxa, and composition plugins.
2.6. Statistical Analysis
2.6.1. Morphological Data Analyses
Morphometric data were subjected to statistical analysis using SPSS Statistics (Version 25). Data distribution and variance homogeneity were assessed using the Shapiro–Wilk and Levene’s tests, respectively. When the assumptions for parametric analysis were not met, data were transformed using square-root or logarithmic functions, as appropriate. Differences among treatments were assessed using one-way ANOVA, with substrate treatment as a fixed factor with five levels (P, A, AD, ADB, and ADBP) and individual pots as experimental units (n = 5 per treatment), followed by Fisher’s least significant difference (LSD) test for pairwise comparisons. Differences were considered statistically significant at p < 0.05.
2.6.2. Microbiological Data Analyses
Alpha diversity was evaluated to characterize within-sample microbial diversity using the Observed features, Chao1, Shannon, and Simpson indices. Alpha-diversity analyses and statistical comparisons among experimental groups were performed in RStudio (Version 2024.12.1+563). Differences in alpha-diversity metrics among groups were assessed using the Kruskal–Wallis test (referenza), with statistical significance set at p < 0.05. The resulting diversity indices were used to assess differences in microbial richness, evenness, and overall community diversity among the experimental groups. Beta diversity was evaluated to assess differences in microbial community composition among samples. Bray–Curtis dissimilarity and weighted UniFrac distance matrices were calculated separately for the bacterial and fungal datasets. Principal coordinates analysis (PCoA) was used to visualize patterns of community composition based on both distance measures. In addition, three-dimensional PCoA ordinations were generated from Bray–Curtis and weighted UniFrac distance matrices to provide a complementary visualization of sample distribution according to soil condition.
The significance of differences in community composition among groups was assessed using permutational multivariate analysis of variance (PERMANOVA) implemented with the adonis2 function in the vegan package. Statistical significance was evaluated at p < 0.05.
Relationships among bacterial genera, soil chemical properties, and plant morphometric traits were assessed using Pearson’s correlation coefficient based on n = 20 independent observations. Microbial relative abundances were subjected to a centered log-ratio (CLR) transformation prior to correlation analysis, after replacement of zero values with a small pseudocount. Pearson’s correlation coefficients were then calculated between CLR-transformed microbial abundances and soil chemical and plant morphological variables. To account for the large number of simultaneous correlation tests, p-values were adjusted for multiple comparisons using the Benjamini–Hochberg false discovery rate (FDR) procedure. Correlations were considered statistically significant at an FDR-adjusted p < 0.05.
Pearson’s correlation analysis was carried out in the R statistical environment using RStudio (Version 2024.12.1+563). The analysis was performed to investigate linear relationships among the quantitative variables measured (relative frequency of the OTUs, soil chemical parameter, plant morphological parameter) in the study. Before the analysis, the dataset was screened to verify data consistency and to exclude non-numeric variables or missing observations that could affect matrix computation. Pairwise correlation coefficients were then calculated using Pearson’s method. The correlation matrix was graphically represented using the corrplot package in R. Correlation coefficients were displayed according to their sign and magnitude, allowing clear visualization of positive (blue color) and negative associations (red color) among variables. The intensity of the color scale reflected the strength of each relationship whilst the presence of the white dot indicated statistical significance (p < 0.05). This approach was used to identify groups of strongly associated variables, inverse relationships, and general patterns of co-variation within the dataset.
3. Results
3.1. Soil Analyses
In this study, the growth of P. halepensis seedlings and their rhizosphere microbiome were evaluated under different treatments based on biochar amendments preconditioned in healthy pine forest soil. The soils used in this experimentation, including the healthy one where the biochar was conditioned, were preliminarily analyzed from a chemical point of view (Table 3).
Table 3.
Analyses of the five soils used in the experiment. Each value is the mean (n = 5) ± SE. P, pine forest soil; A, non-intensively cultivated agricultural soil; AD, degraded agricultural soil; ADB, degraded agricultural soil amended with untreated biochar; and ADBP, degraded agricultural soil amended with pine-forest-soil-bioactivated biochar.
The five substrates showed marked differences in their chemical properties. Among the unamended soils, AD had the lowest TOC and relatively low total N, P, and K contents, but considerably higher concentrations of Cl, K, Ca, Mg, and more trace elements than P and A. Biochar amendment markedly increased TOC, with a higher value in ADB than in ADBP, whereas total N and K changed only slightly compared with AD. ADBP showed a more pronounced increase in total P and generally slightly higher concentrations of mineral and trace elements than ADB. The soil texture analyses highlighted that the three different soils were classified as clay soil on the basis of soil texture analyses.
3.2. Morphological Results
Fine roots were classified into three functional classes: absorptive fine roots (AFR; diameter < 0.45 mm), pioneer-transport fine roots (PFR; diameter 0.45–0.70 mm), and transport-structural fine roots (TSFR; diameter > 0.70 mm). Only 1.74% of the total root volume was associated with root diameters greater than 2 mm, corresponding to the basal portion of the taproot, immediately below the root collar.
Table 4 shows different plant traits, divided into aboveground and belowground categories. Among aboveground traits, plant height differed significantly among soil treatments. The greatest values were observed in seedlings grown in the degraded agricultural soil, both without amendment (AD) and with untreated biochar (ADB), and these two treatments did not differ significantly from each other. Both AD and ADB produced taller seedlings than the non-intensively cultivated agricultural soil (A), whereas pine forest soil (P) and degraded agricultural soil amended with bioactivated biochar (ADBP) showed intermediate values, not significantly different from either extreme. Crown width showed a similar pattern. The highest value was observed in AD, which was significantly greater than A and ADBP, but did not differ from P or ADB. Seedlings grown in ADB also had significantly wider crowns than those in A, whereas P and ADBP again displayed intermediate values. In contrast, lateral branch number was not significantly affected by treatment. Stem diameter showed an opposite trend compared with height and crown width. The largest diameter was recorded in P, which differed significantly from all other treatments. Seedlings grown in A also had significantly larger stem diameter than those in all degraded agricultural soil treatments. Within the latter group, stem diameter was significantly greater in ADB than in AD and ADBP, which showed similarly low values.
Table 4.
Above- and belowground traits of 85-day-old Pinus halepensis Mill. seedlings grown in five different soils: P, pine forest soil; A, non-intensively cultivated agricultural soil; AD, degraded agricultural soil; ADB, degraded agricultural soil amended with untreated biochar; and ADBP, degraded agricultural soil amended with pine-forest-soil-bioactivated biochar.
Among belowground traits, no significant differences were observed in the mean root diameter of the 0.0–0.45 mm (AFR) and 0.45–0.70 mm (PFR) classes. By contrast, the coarse root fraction (> 0.7 mm, TSFR) differed significantly among treatments. In this class, ADB showed the highest mean diameter, whereas AD showed the lowest.
ADB was significantly higher than A, AD, and ADBP, whereas P was intermediate and differed significantly only from AD. Root system mean diameter was highest in P and lowest in ADB. Pine forest soil produced significantly greater values than AD, ADB, and ADBP, although it did not differ significantly from A. The A treatment was intermediate and differed significantly only from ADB, whereas no significant differences were found among AD, ADB, and ADBP.
Root functional traits were also significantly influenced by substrate. Specific root length (SRL) was highest in AD, which differed significantly from all other treatments. Intermediate SRL values were observed in ADB and ADBP; these two treatments did not differ significantly from each other, but both were significantly lower than AD and significantly higher than P and A. The lowest SRL values were recorded in P and A, which did not differ significantly from each other. Root tissue density (RTD) showed the opposite pattern, with the lowest value in AD. This treatment had significantly lower RTD than P, A and ADB but did not differ significantly from ADBP. The highest RTD was observed in P, which differed significantly from AD and ADBP, but not from A or ADB. Overall, A and ADB occupied intermediate positions, whereas ADBP remained statistically similar to AD, A, and ADB. The root:shoot ratio was highest in A, with values significantly greater than those observed in AD and ADBP. P and ADB showed intermediate values.
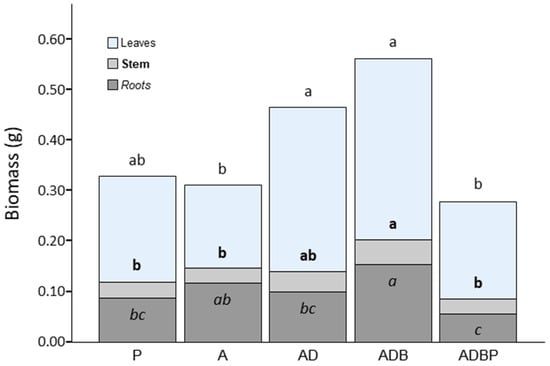
Figure 1 shows the biomass data for leaves, stems, and roots. Leaf biomass was significantly higher in AD and ADB than in A and ADBP. No significant differences were found within both pairs, while P showed intermediate values. Stem biomass was significantly greater in ADB than in P, A, and ADBP, whereas AD showed intermediate values and did not differ significantly from any other treatment. Root biomass was also maximized in ADB, which significantly exceeded P, AD, and ADBP. In contrast, A showed intermediate values, whereas ADBP exhibited the lowest root biomass, corresponding to an almost threefold reduction compared with ADB.
Figure 1.
Biomass of the leaf, stem, and root compartments. Different lowercase letters in regular, bold, and italic type indicate significant differences among treatments for leaves, stems, and roots, respectively (LSD test, p < 0.05). P, pine forest soil; A, non-intensively cultivated agricultural soil; AD, degraded agricultural soil; ADB, degraded agricultural soil amended with untreated biochar; and ADBP, degraded agricultural soil amended with pine-forest-soil-bioactivated biochar.
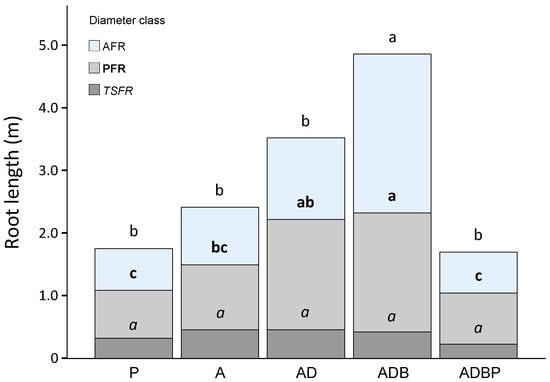
No significant differences among treatments were detected for the length of TSFR (Figure 2), although a marked, albeit non-significant, reduction was observed in ADBP; interestingly, this decrease was significant when assessed on a volumetric basis. By contrast, AFR length responded significantly to the addition of untreated biochar to AD soil, with ADB showing nearly double the values recorded in all other treatments. A similar trend was found for PFR roots, whose length was greatest in ADB, although it did not differ significantly from AD. Overall, the volumetric patterns of the three root classes mirrored those observed for root length.
Figure 2.
Root length in the three diameter classes investigated. Different lowercase letters in regular, bold, and italic type indicate significant differences among treatments for the AFR (0.00–0.45 mm), PFR (0.45–0.70 mm), and TSFR (>0.70 mm) diameter root classes, respectively (LSD test, p < 0.05. P, pine forest soil; A, non-intensively cultivated agricultural soil; AD, degraded agricultural soil; ADB, degraded agricultural soil amended with untreated biochar; and ADBP, degraded agricultural soil amended with pine-forest-soil-bioactivated biochar.
3.3. Microbiome Results
3.3.1. Rhizosphere Bacterial Community
Table 5 reported the results of the rhizosphere bacterial community associated with the P. halepensis root grown in the AD soil, amended with biochar (ADB), and with biochar conditioned in pine forest soil (ADBP). Moreover, the rhizosphere of P. halepensis growth in non-intensive agricultural soil (A) was investigated and considered as control. In this case, the most abundant OTU was Hydrogenophaga (18.7%), followed by Pseudomonas (15.2%) and Acidovorax (11.6%).
The other seven OTUs are less represented with relative abundance comprising between 5.8% and 3.0% in the case Arthrobacter and Rhodobacter, respectively. Considering the AD soil used to assay the effects of biochar being conditioned or not, on growth of P. halepensis seedlings, the OTUs most represented were Pseudomonas (22.8%) and Bacillus (17.7%), followed by Hydrogenophaga (12.8%) and Agrobacterium (8.6%). The less represented OTUs were Rubrivivax, Acidovorax, Actinoplanes and Streptomyces characterized by a relative abundance comprising between 7.5% (Rubrivivax) and 2.3% (Streptomyces).
Table 5.
Relative abundance (%) of rhizosphere bacterial community associated with the P. halepensis root. A, non-intensively cultivated agricultural soil; AD, degraded agricultural soil; ADB, degraded agricultural soil amended with untreated biochar; and ADBP, degraded agricultural soil amended with pine-forest-soil-bioactivated biochar.
When the ADB experimental group was considered, Pseudomonas were represented at 27.8% whilst Hydrogenophaga was represented at 23.1%. The other OTUs less represented were Acidovorax (6.5%), Bacillus (5.3%), Arthrobacter (5.1%) and Agrobacterium (2.5%). Moreover, the rhizosphere bacterial community differed from ADBP for the presence of Rhodobacter (3.3%).
A similar qualitative trend was observed in the case of the rhizosphere of P. halepensis belonging to the ADBP experimental group; in fact, the most represented OTU was Pseudomonas (39.8%), followed by Hydrogenophaga (16.8%). Other relevant but less represented OTUs were Acidovorax, Bacillus, Arthrobacter and Agrobacterium, which ranged between 7.4% and 3.3%.
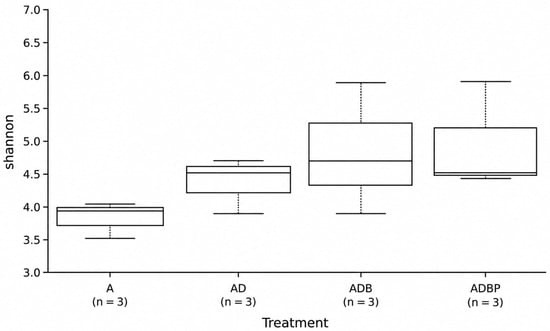
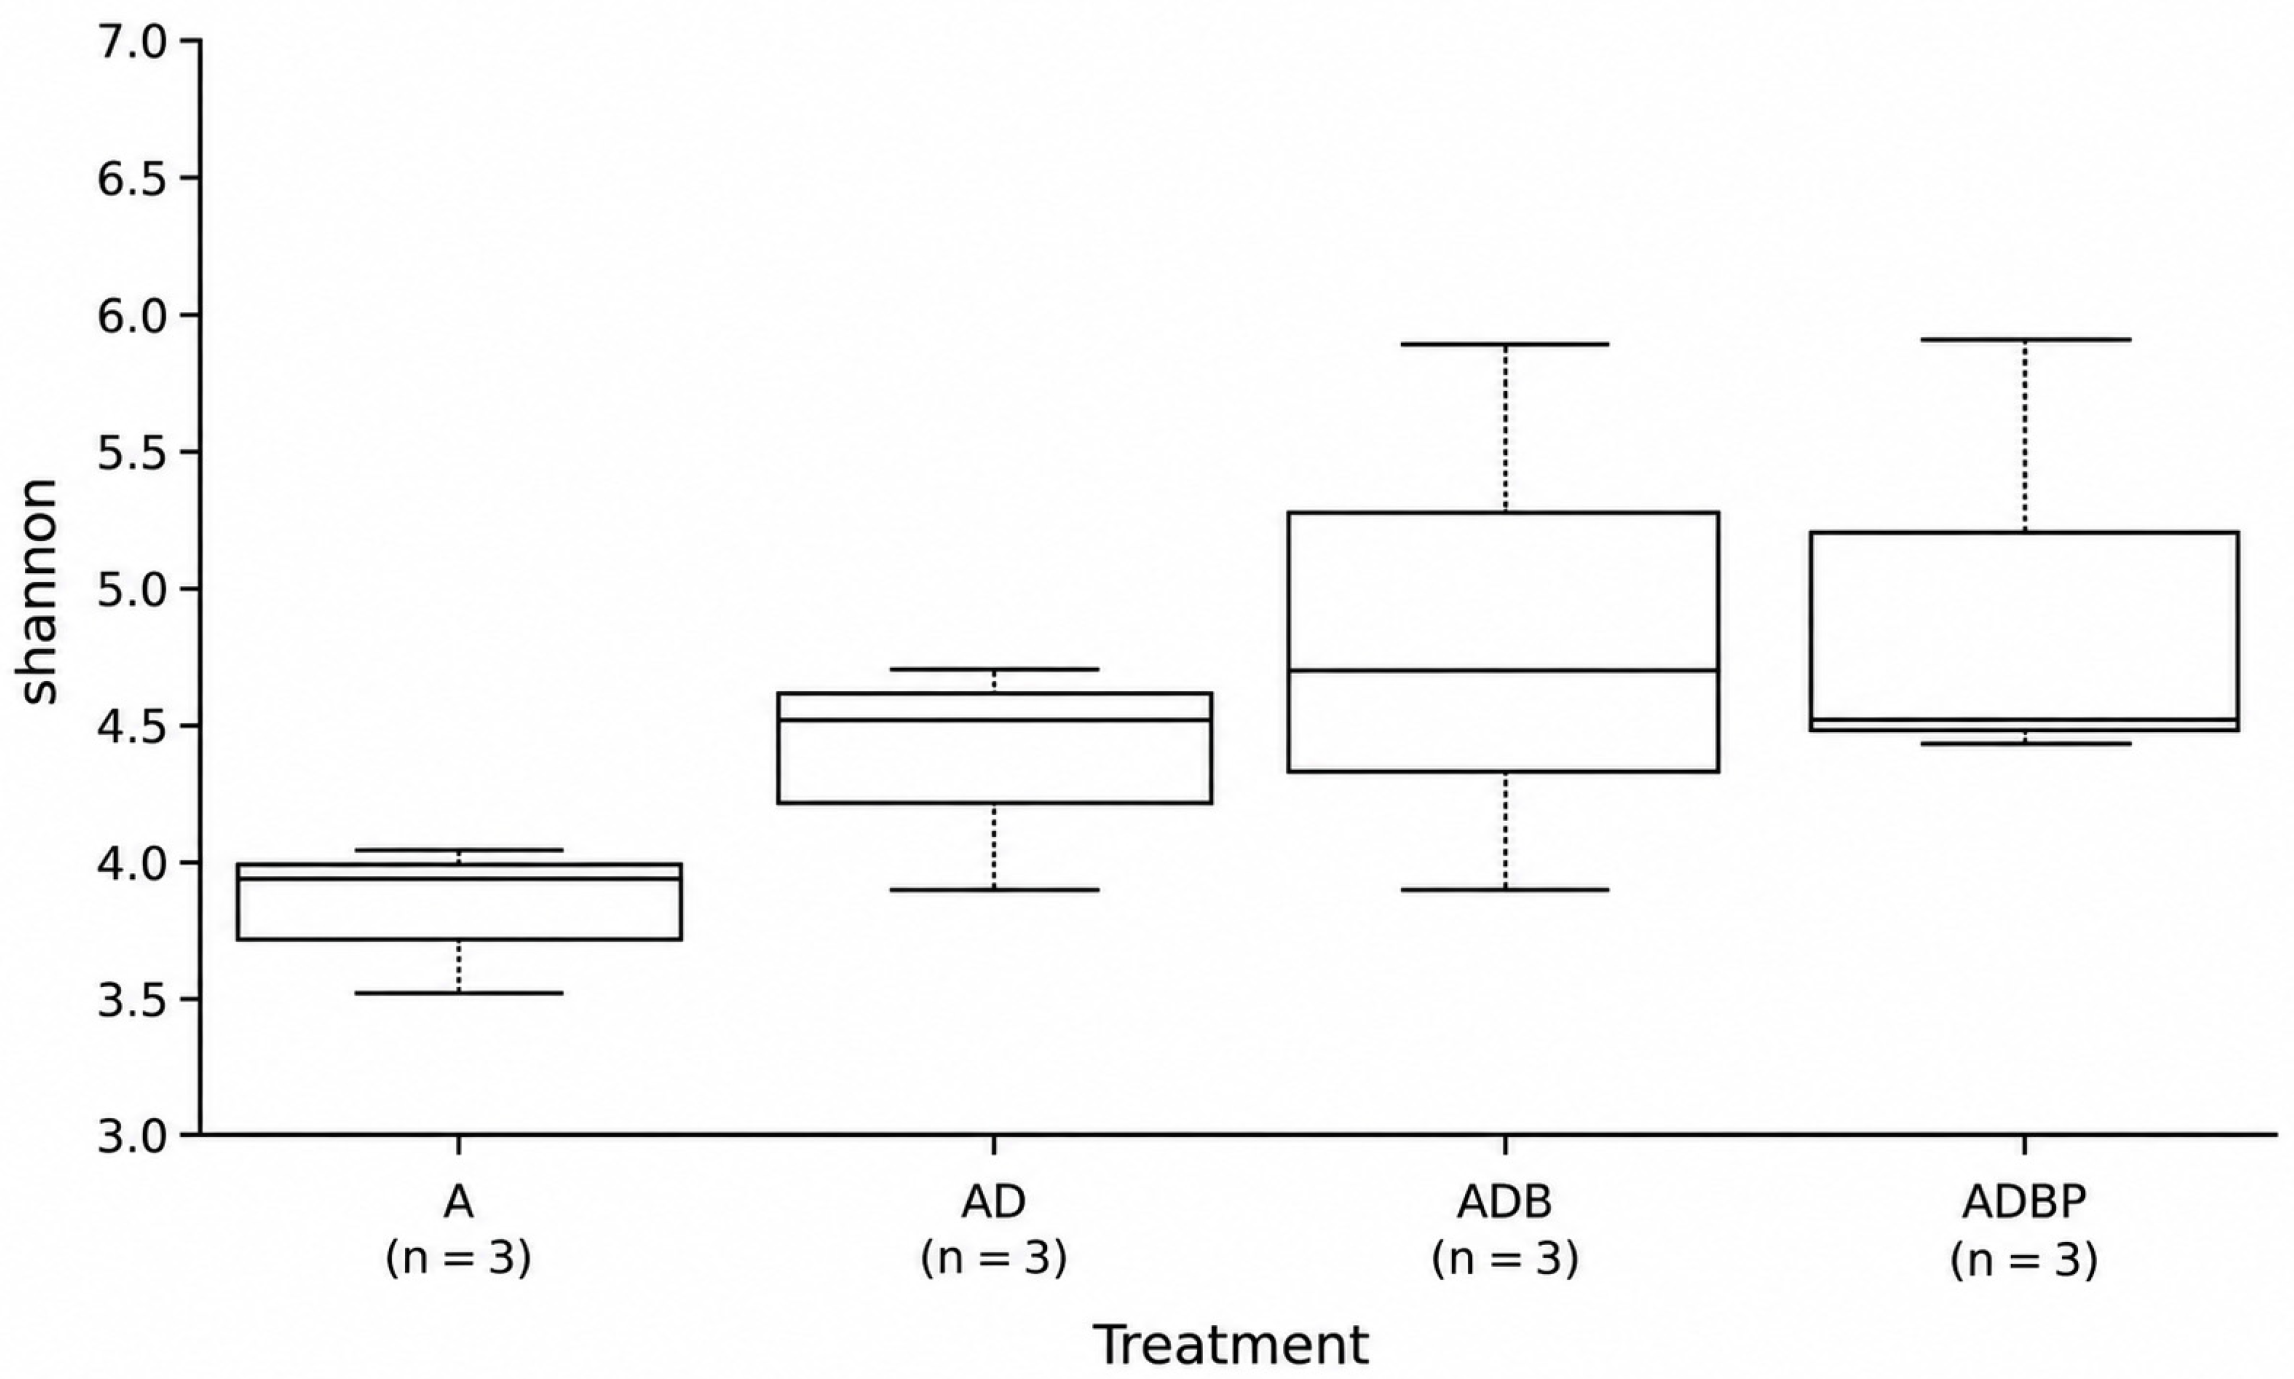
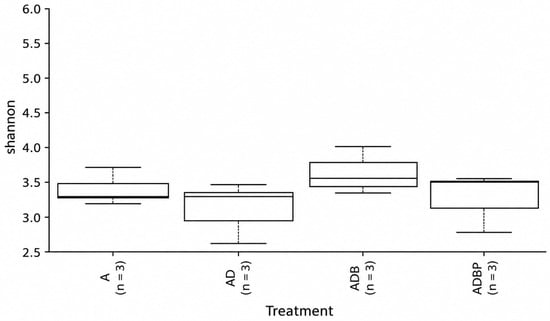
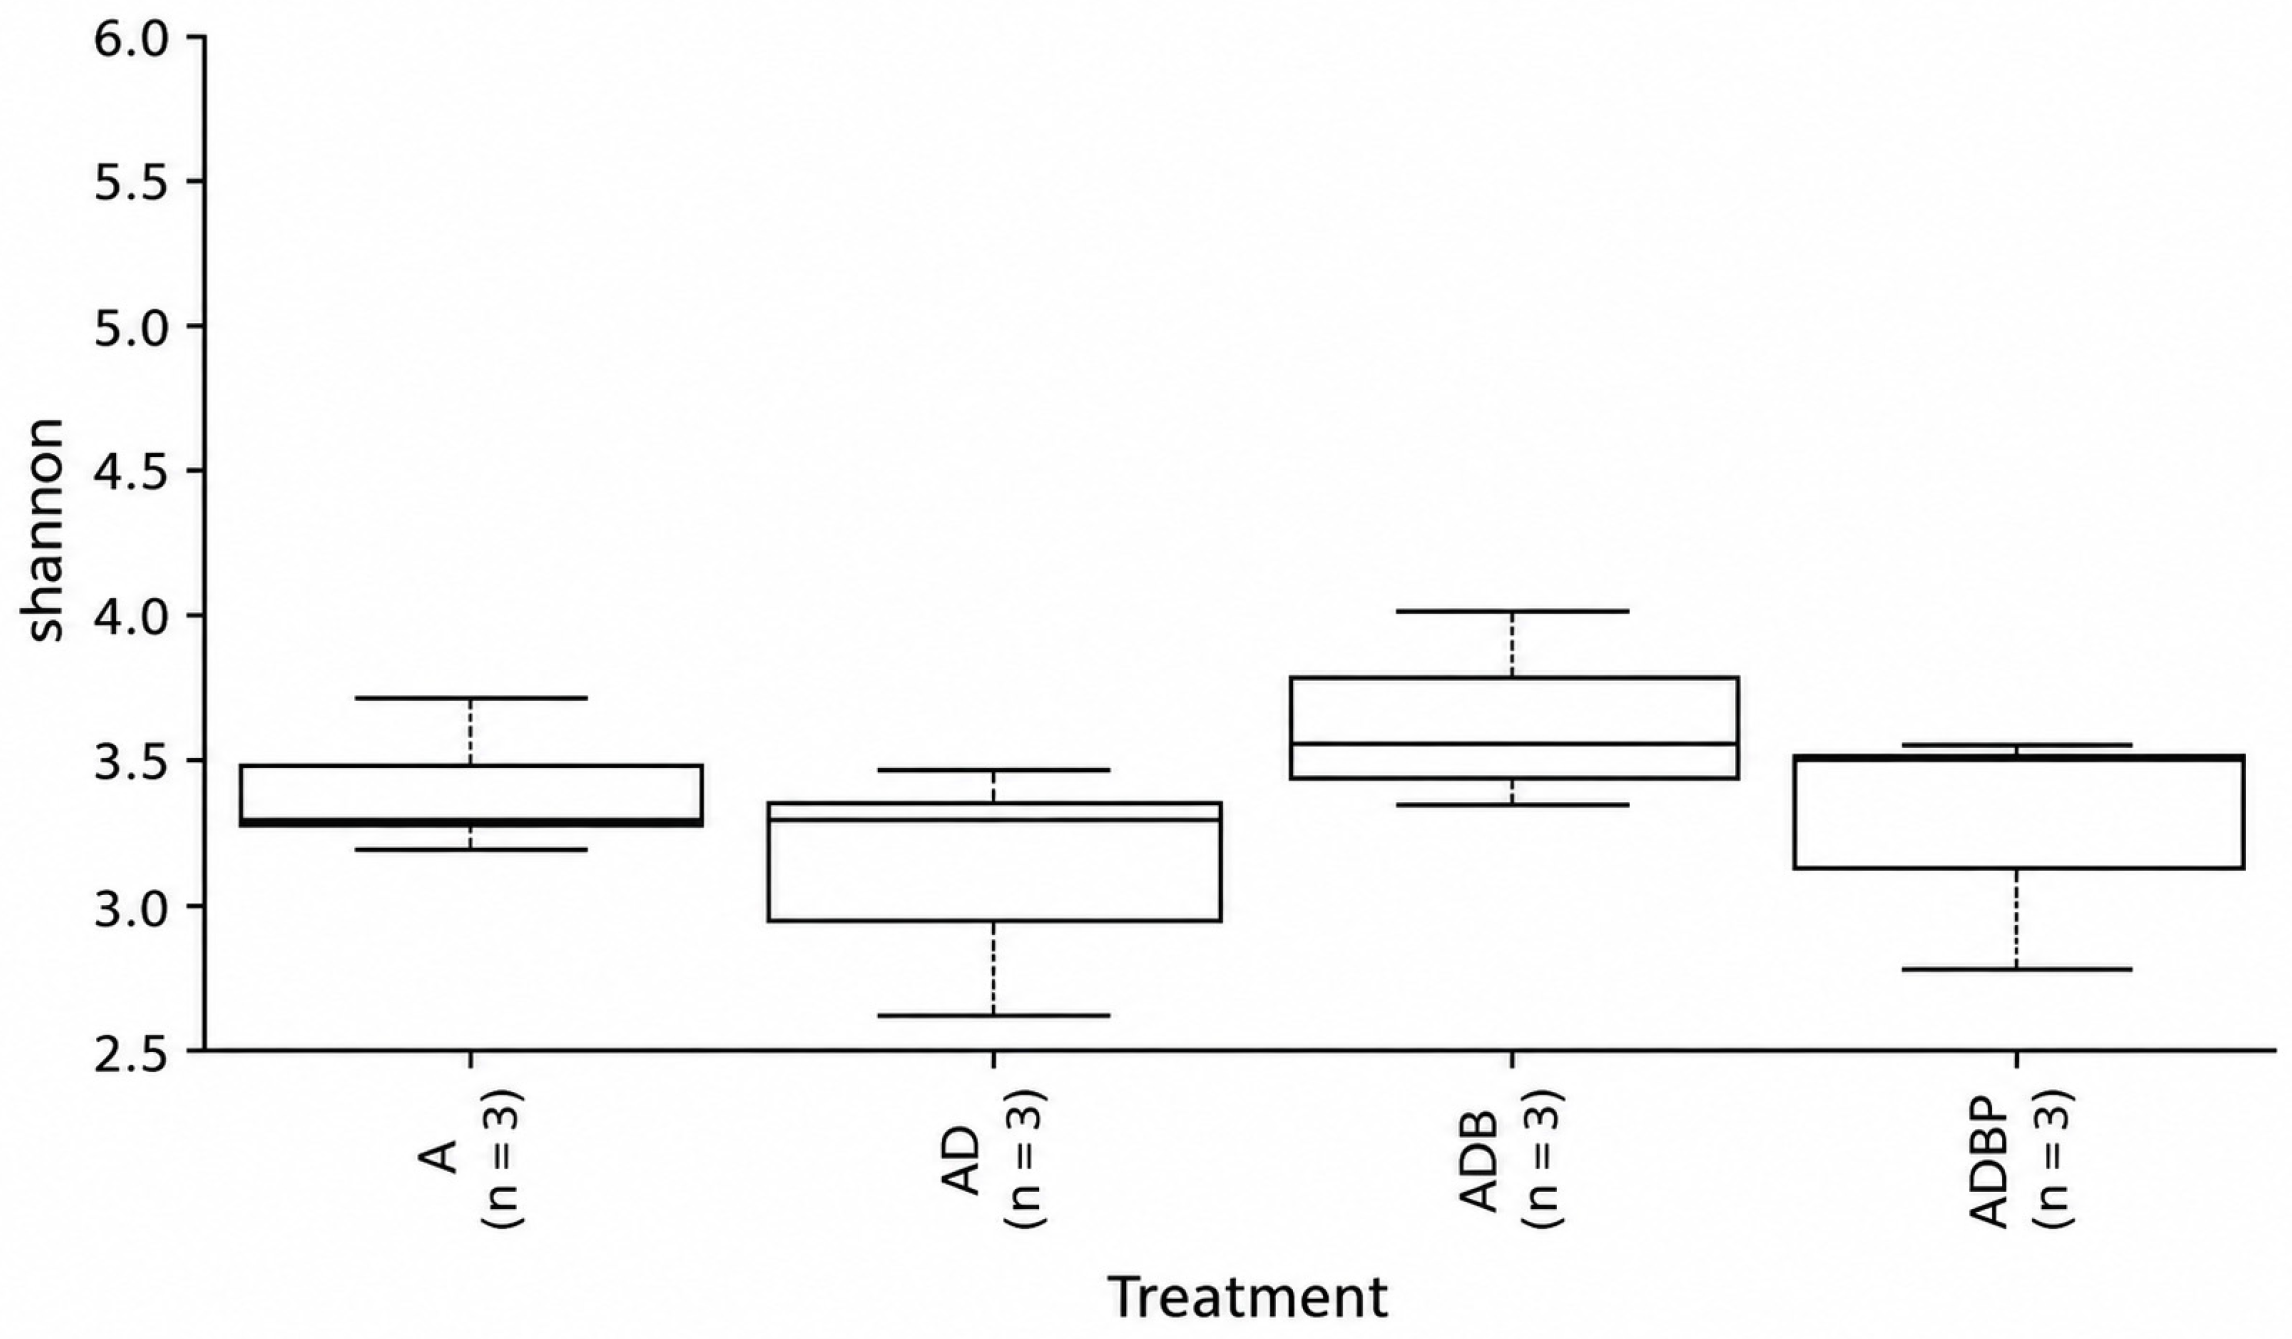
Alpha diversity, measured by the Shannon index, showed a clear upward trend across the experimental groups (Figure 3), although this difference was not statistically significant. Interestingly, the ADB group showed the highest median diversity and the greatest internal variance.
Figure 3.
Alpha diversity of rhizosphere bacterial communities. Differences among groups were assessed using the Kruskal–Wallis test (p < 0.05). A, non-intensively cultivated agricultural soil; AD, degraded agricultural soil; ADB, degraded agricultural soil amended with untreated biochar; and ADBP, degraded agricultural soil amended with pine-forest-soil-bioactivated biochar.
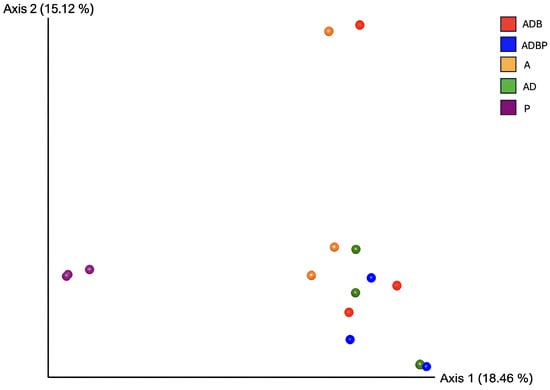
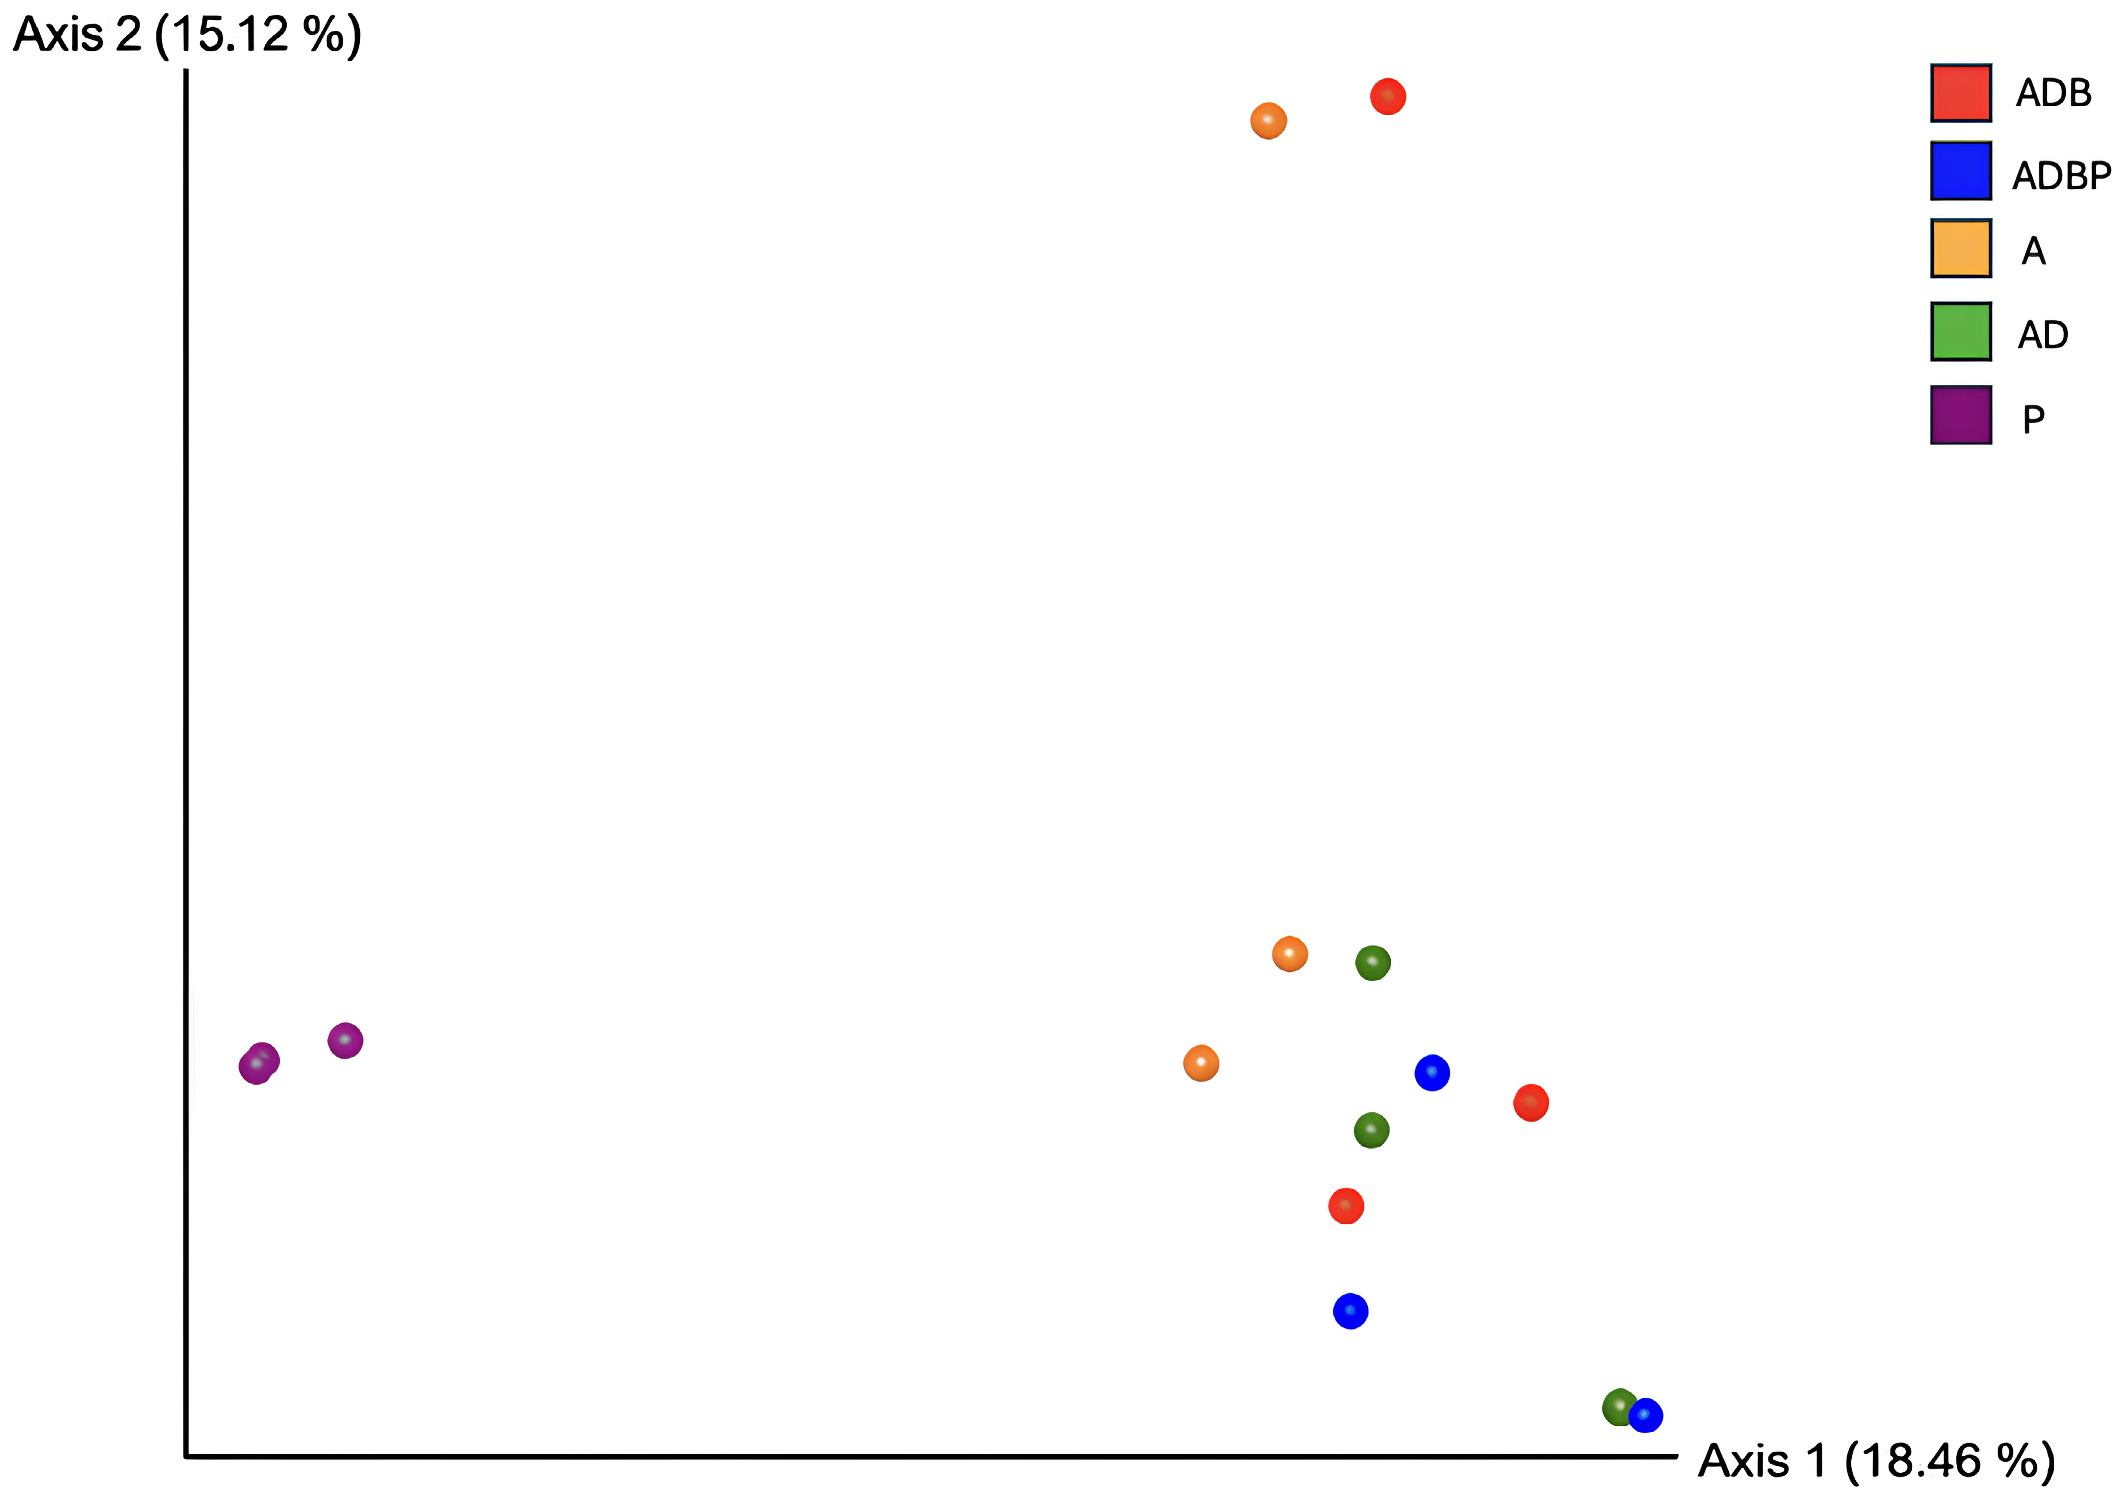
The beta-diversity analysis based on Bray–Curtis dissimilarity, visualized through Emperor ordination, revealed that ADB, ADBP, A, and AD samples showed partial overlap, although a degree of separation is still observable, particularly along Axis 1 (18.46) and Axis 2 (15.12%) (Figure 4).
Figure 4.
Beta diversity of bacterial communities based on the Bray–Curtis dissimilarity index. Principal Coordinates Analysis (PCoA) was used to visualize differences in community composition among samples. Each point represents an individual sample, and distances between points reflect differences in microbial community structure. P, pine forest soil; A, non-intensively cultivated agricultural soil; AD, degraded agricultural soil; ADB, degraded agricultural soil amended with untreated biochar; and ADBP, degraded agricultural soil amended with pine-forest-soil-bioactivated biochar.
3.3.2. Rhizosphere Fungal Community
In Table 6, OTUs with a relative abundance greater than 1% in at least one experimental group are reported. Overall, the fungal community was more consistent among treatments compared to bacteria, although several dominant genera showed strong variability across treatments. The most abundant genus was Plectosphaerella, which reached its highest relative abundance in ADB (38.4%) and AD (29.9%), followed by ADBP (13.2%). Another highly represented OTU was the Lobulomycetales group, which was mainly associated with ADB (18.0%) and ADBP (9.9%), while it was nearly absent in the other experimental groups. Penicillium is consistently present across all treatments, with relatively stable abundances ranging from 3.5% (AD) to 9.8% (ADBP), indicating a widespread distribution independent of treatment conditions. Malassezia showed a marked enrichment in A (13.2%) and ADBP (8.1%), while lower abundances were observed in the other treatments. Similarly, Cladosporiaceae exhibited high abundance in A (13.0%) and ADBP (7.3%) but much lower values in the remaining groups. Among filamentous fungi, Fusarium and related taxa (e.g., Dactylonectria) were broadly distributed, with moderate abundances across all treatments, although Dactylonectria was particularly enriched in A (5.1%) and ADBP (6.9%). Notably, Suillus represented a dominant genus in AD (39.3%), while it was almost absent in the other treatments. Additionally, a number of low-abundance genera (<2%) were detected across all experimental groups, contributing to the overall fungal diversity.
Table 6.
Relative abundance (%) of rhizosphere fungal community associated with the P. halepensis root. A, non-intensively cultivated agricultural soil; AD, degraded agricultural soil; ADB, degraded agricultural soil amended with untreated biochar; and ADBP, degraded agricultural soil amended with pine-forest-soil-bioactivated biochar.
The Shannon index was not statistically significant different across treatments, even if ADB soil promoted the highest fungal diversity and the ADBP experimental group led to increased heterogeneity (Figure 5).
Figure 5.
Alpha diversity of rhizosphere fungal communities. Differences among groups were assessed using the Kruskal–Wallis test (p < 0.05). A, non-intensively cultivated agricultural soil; AD, degraded agricultural soil; ADB, degraded agricultural soil amended with untreated biochar; and ADBP, degraded agricultural soil amended with pine-forest-soil-bioactivated biochar.
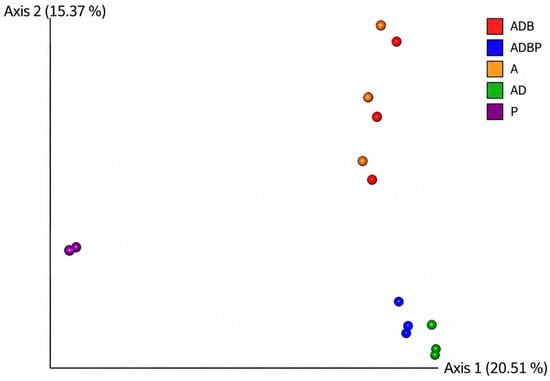
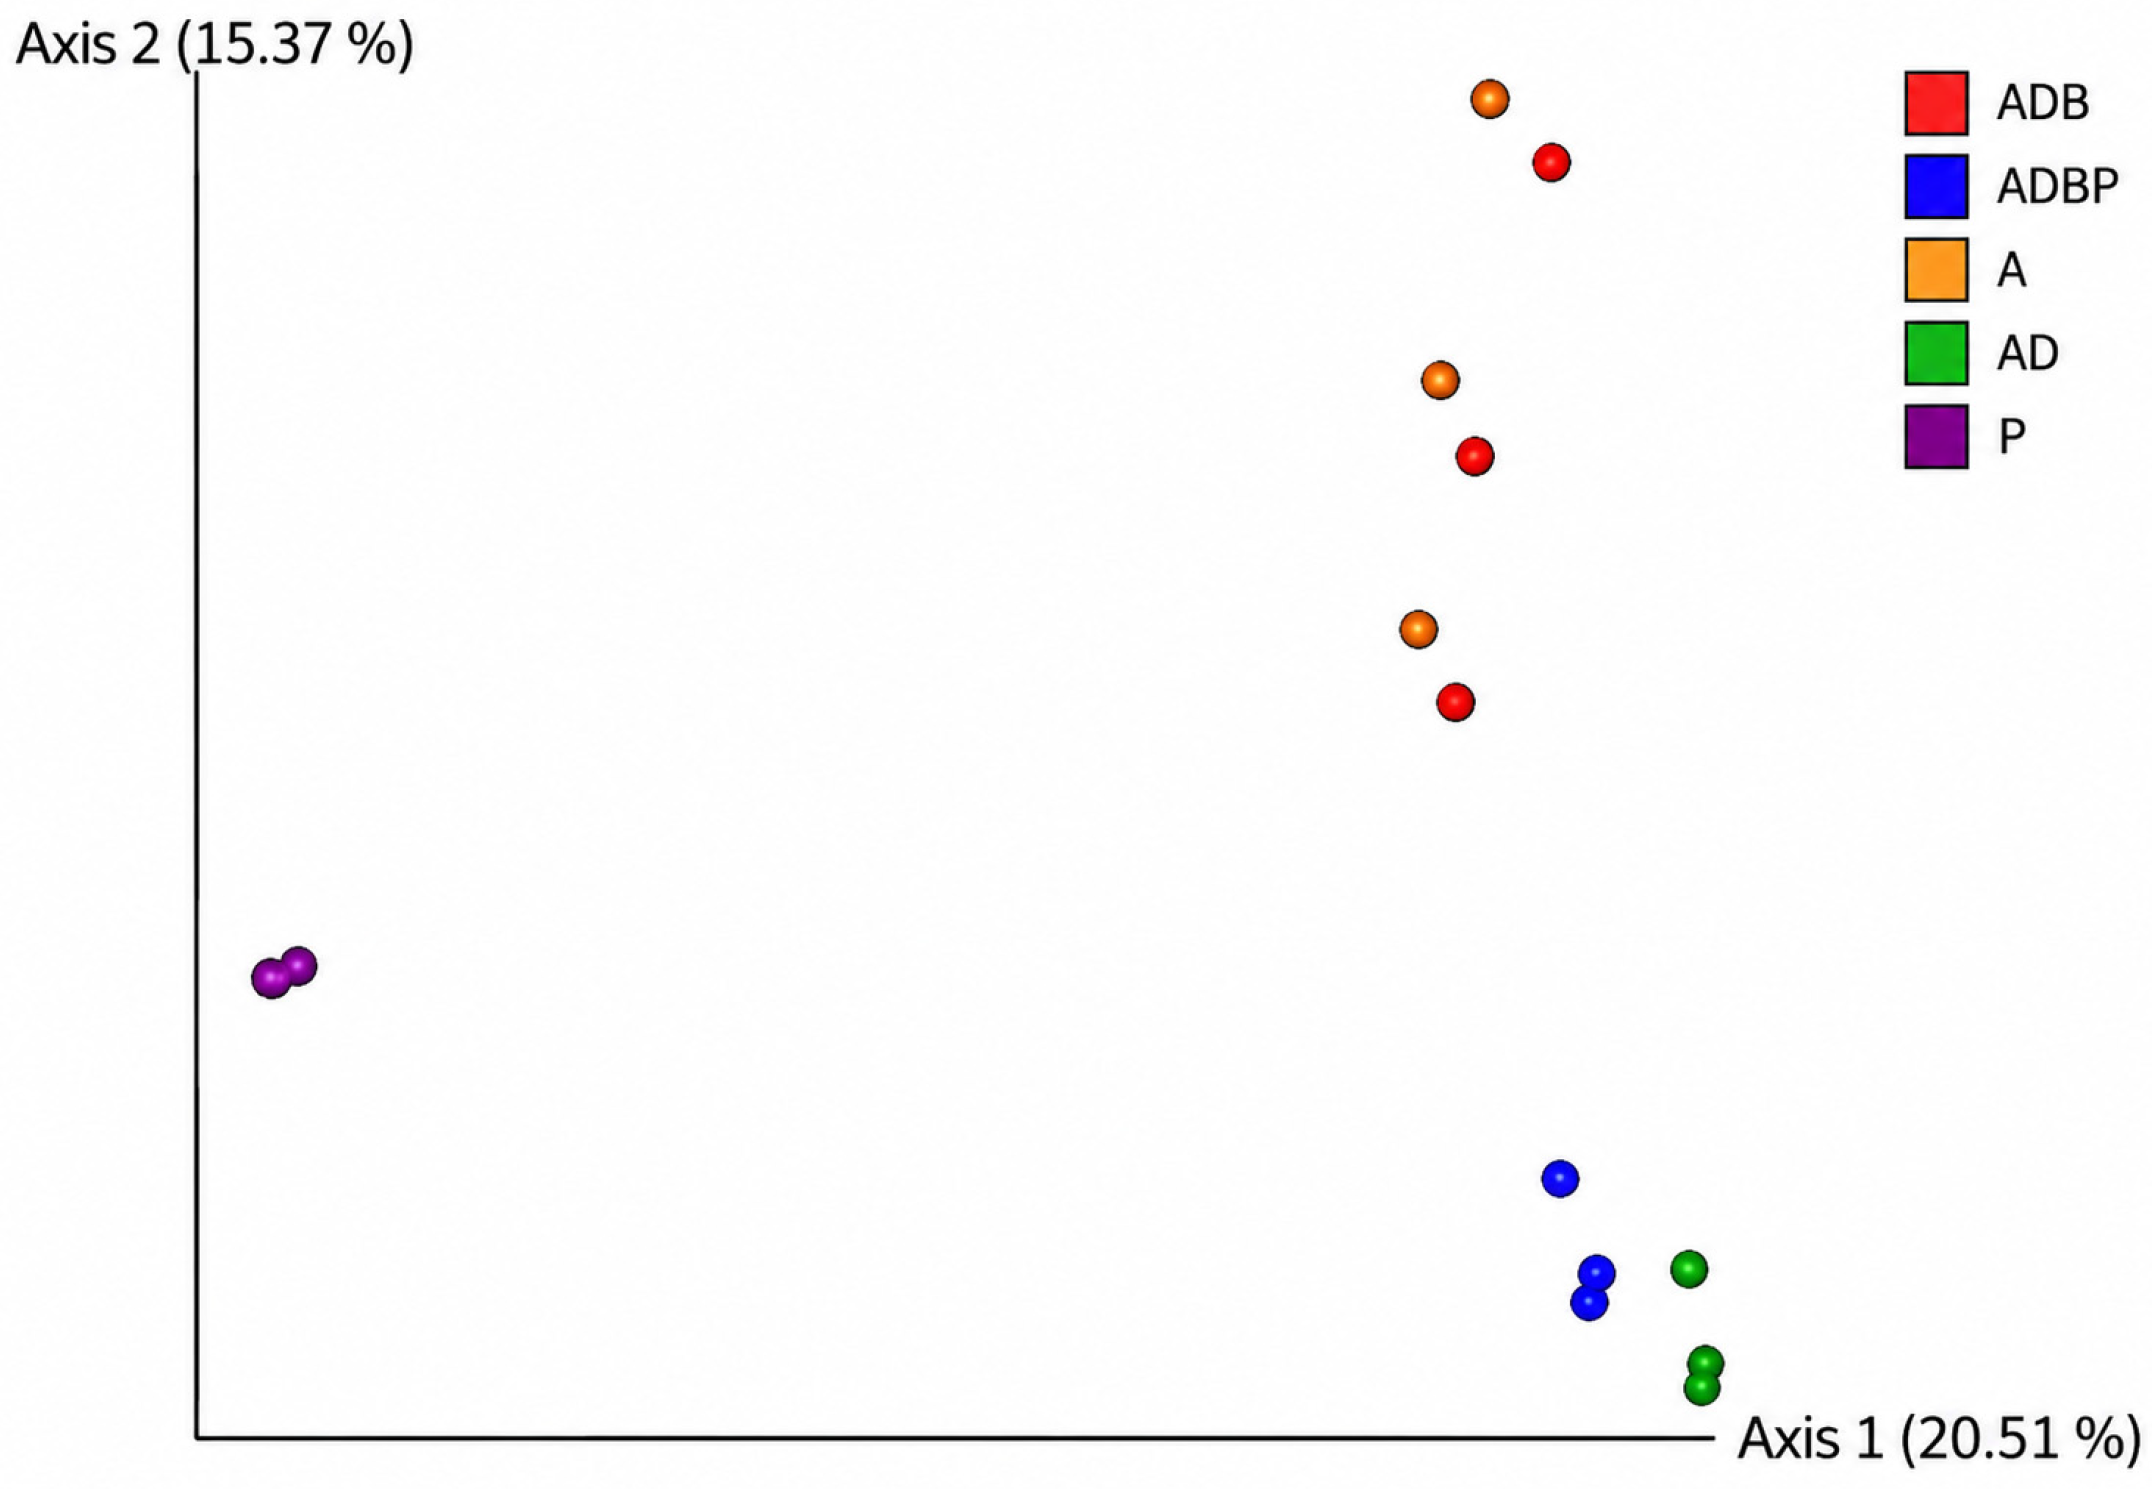
The Bray–Curtis beta-diversity analysis, visualized through Emperor ordination, showed a clear separation of samples; ADBP and AD samples cluster distinctly from ADB and A. Notably, P bulk soil samples clustered separately from the other ones across the ordination space (Figure 6).
Figure 6.
Beta diversity of fungal communities based on the Bray–Curtis dissimilarity index. Principal Coordinates Analysis (PCoA) was used to visualize differences in community composition among samples. Each point represents an individual sample, and distances between points reflect differences in microbial community structure. P, pine forest soil; A, non-intensively cultivated agricultural soil; AD, degraded agricultural soil; ADB, degraded agricultural soil amended with untreated biochar; and ADBP, degraded agricultural soil amended with pine-forest-soil-bioactivated biochar.
3.4. Correlation Plot
The OTUs (represented by a relative abundance greater than 1% for at least one experimental thesis), micro- and macro-nutrients, and the main morphological parameter measured for P. halepensis under the different experimental theses were analyzed to investigate the potential positive or negative correlation among them.
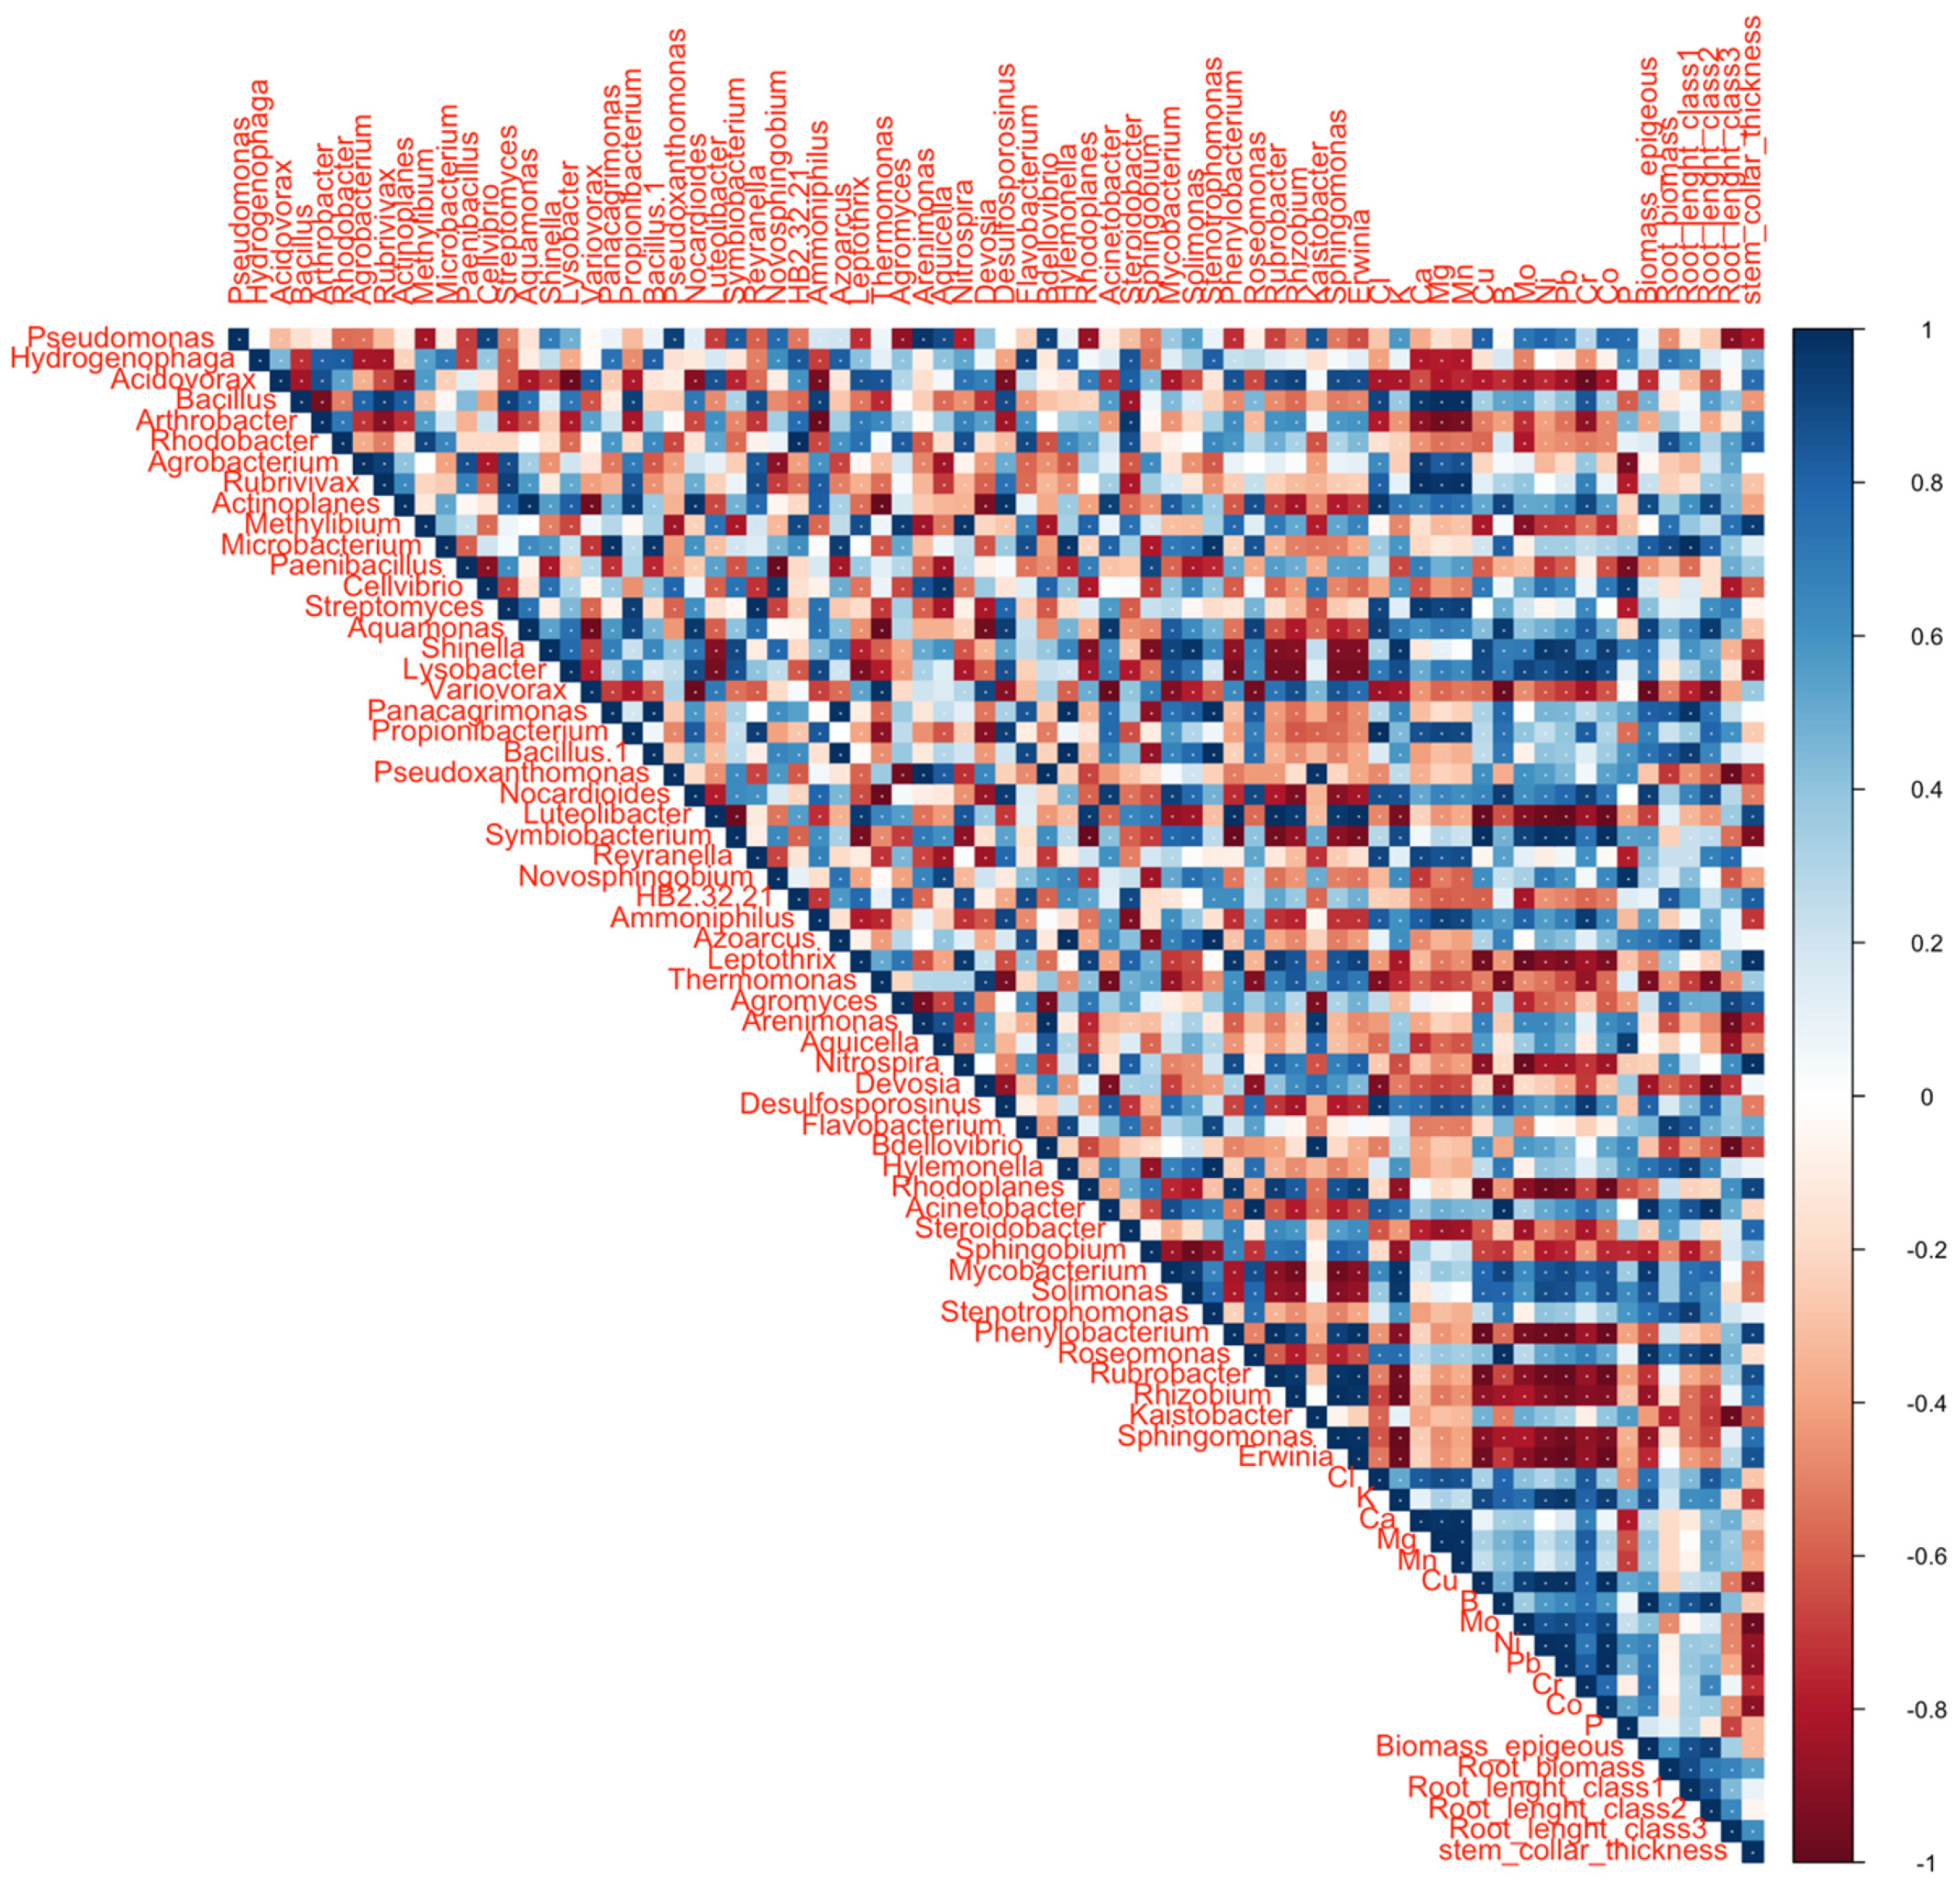
In Figure 7, the correlation plot is reported where the blue and red colors are associated with positive (+1) or negative (−1) correlation, respectively. Moreover, a statistical test was carried out to highlight the significant results (p < 0.001). The correlation among genera and root growth parameters was positive and statistically significant in the case of several genera such as Hydrogenophaga, Rhodobacter, Aquamonas, Microbacterium and Bacillus. Among soil chemical variables, Ca is statistically and positively correlated with root biomass and root length (all three classes). Nevertheless, the results also showed that Cl concentrations were statistically and positively correlated with the same OTUs previously identified and with root growth, whilst the contrary (negative correlation) was observed in the case of Mg concentrations. In fact, they statistically and negatively correlated with the main root parameter. It is noteworthy that the Mg concentrations were also strongly and negatively correlated with the OTUs previously found (e.g., Hydrogenophaga, Rhodobacter, etc.). Similarly, the same and most abundant OTUs such as Hydrogenopaha, Rhodobacter, and Aquamonas were negatively correlated (p < 0.001) with the concentrations of some micronutrients such as Mo, Ni, B and with heavy metals (HMs) such as Pb, Cr and Co. On the contrary Pseudomonas and Bacillus were positively correlated with both micronutrients and HMs.
Figure 7.
Correlation matrix showing the relationships among the relative abundance of dominant microbial genera, soil chemical properties, and plant growth parameters. Correlation coefficients (Pearson’s r) are represented by the color scale, ranging from −1 (red, strong negative correlation) to +1 (blue, strong positive correlation). The triangular matrix is displayed to avoid redundancy. White dots indicate statistically significant correlations (p < 0.05).
Figure 7 also highlights the correlation among the OTUs allowing us to emphasize the co-occurrence (positive correlation) of the bacterial genera already correlated with root growth and Cl and Ca concentrations. In particular, Hydrogenophaga, Rhodobacter, Microbacterium, Aquamonas and Bacillus showed a strongly positive correlation among them (p < 0.001), suggesting a co-occurrence among the experimental group. In addition, a positive correlation was also observed in the case of Cellvibrio and Shinella, which were, however, positively correlated with the root parameter but not in a statistically significant way. In the case of Ca concentrations, it was positively and statistically correlated only with the root diameter belonging to classes 2 or 3, corresponding to the thick ones.
As in the case of bacterial community analyses, the fungal OTUs, micro- and macro- nutrients and the main morphological parameter measured for P. halepensis underwent the correlation analyses reported in Figure 8.
Figure 8.
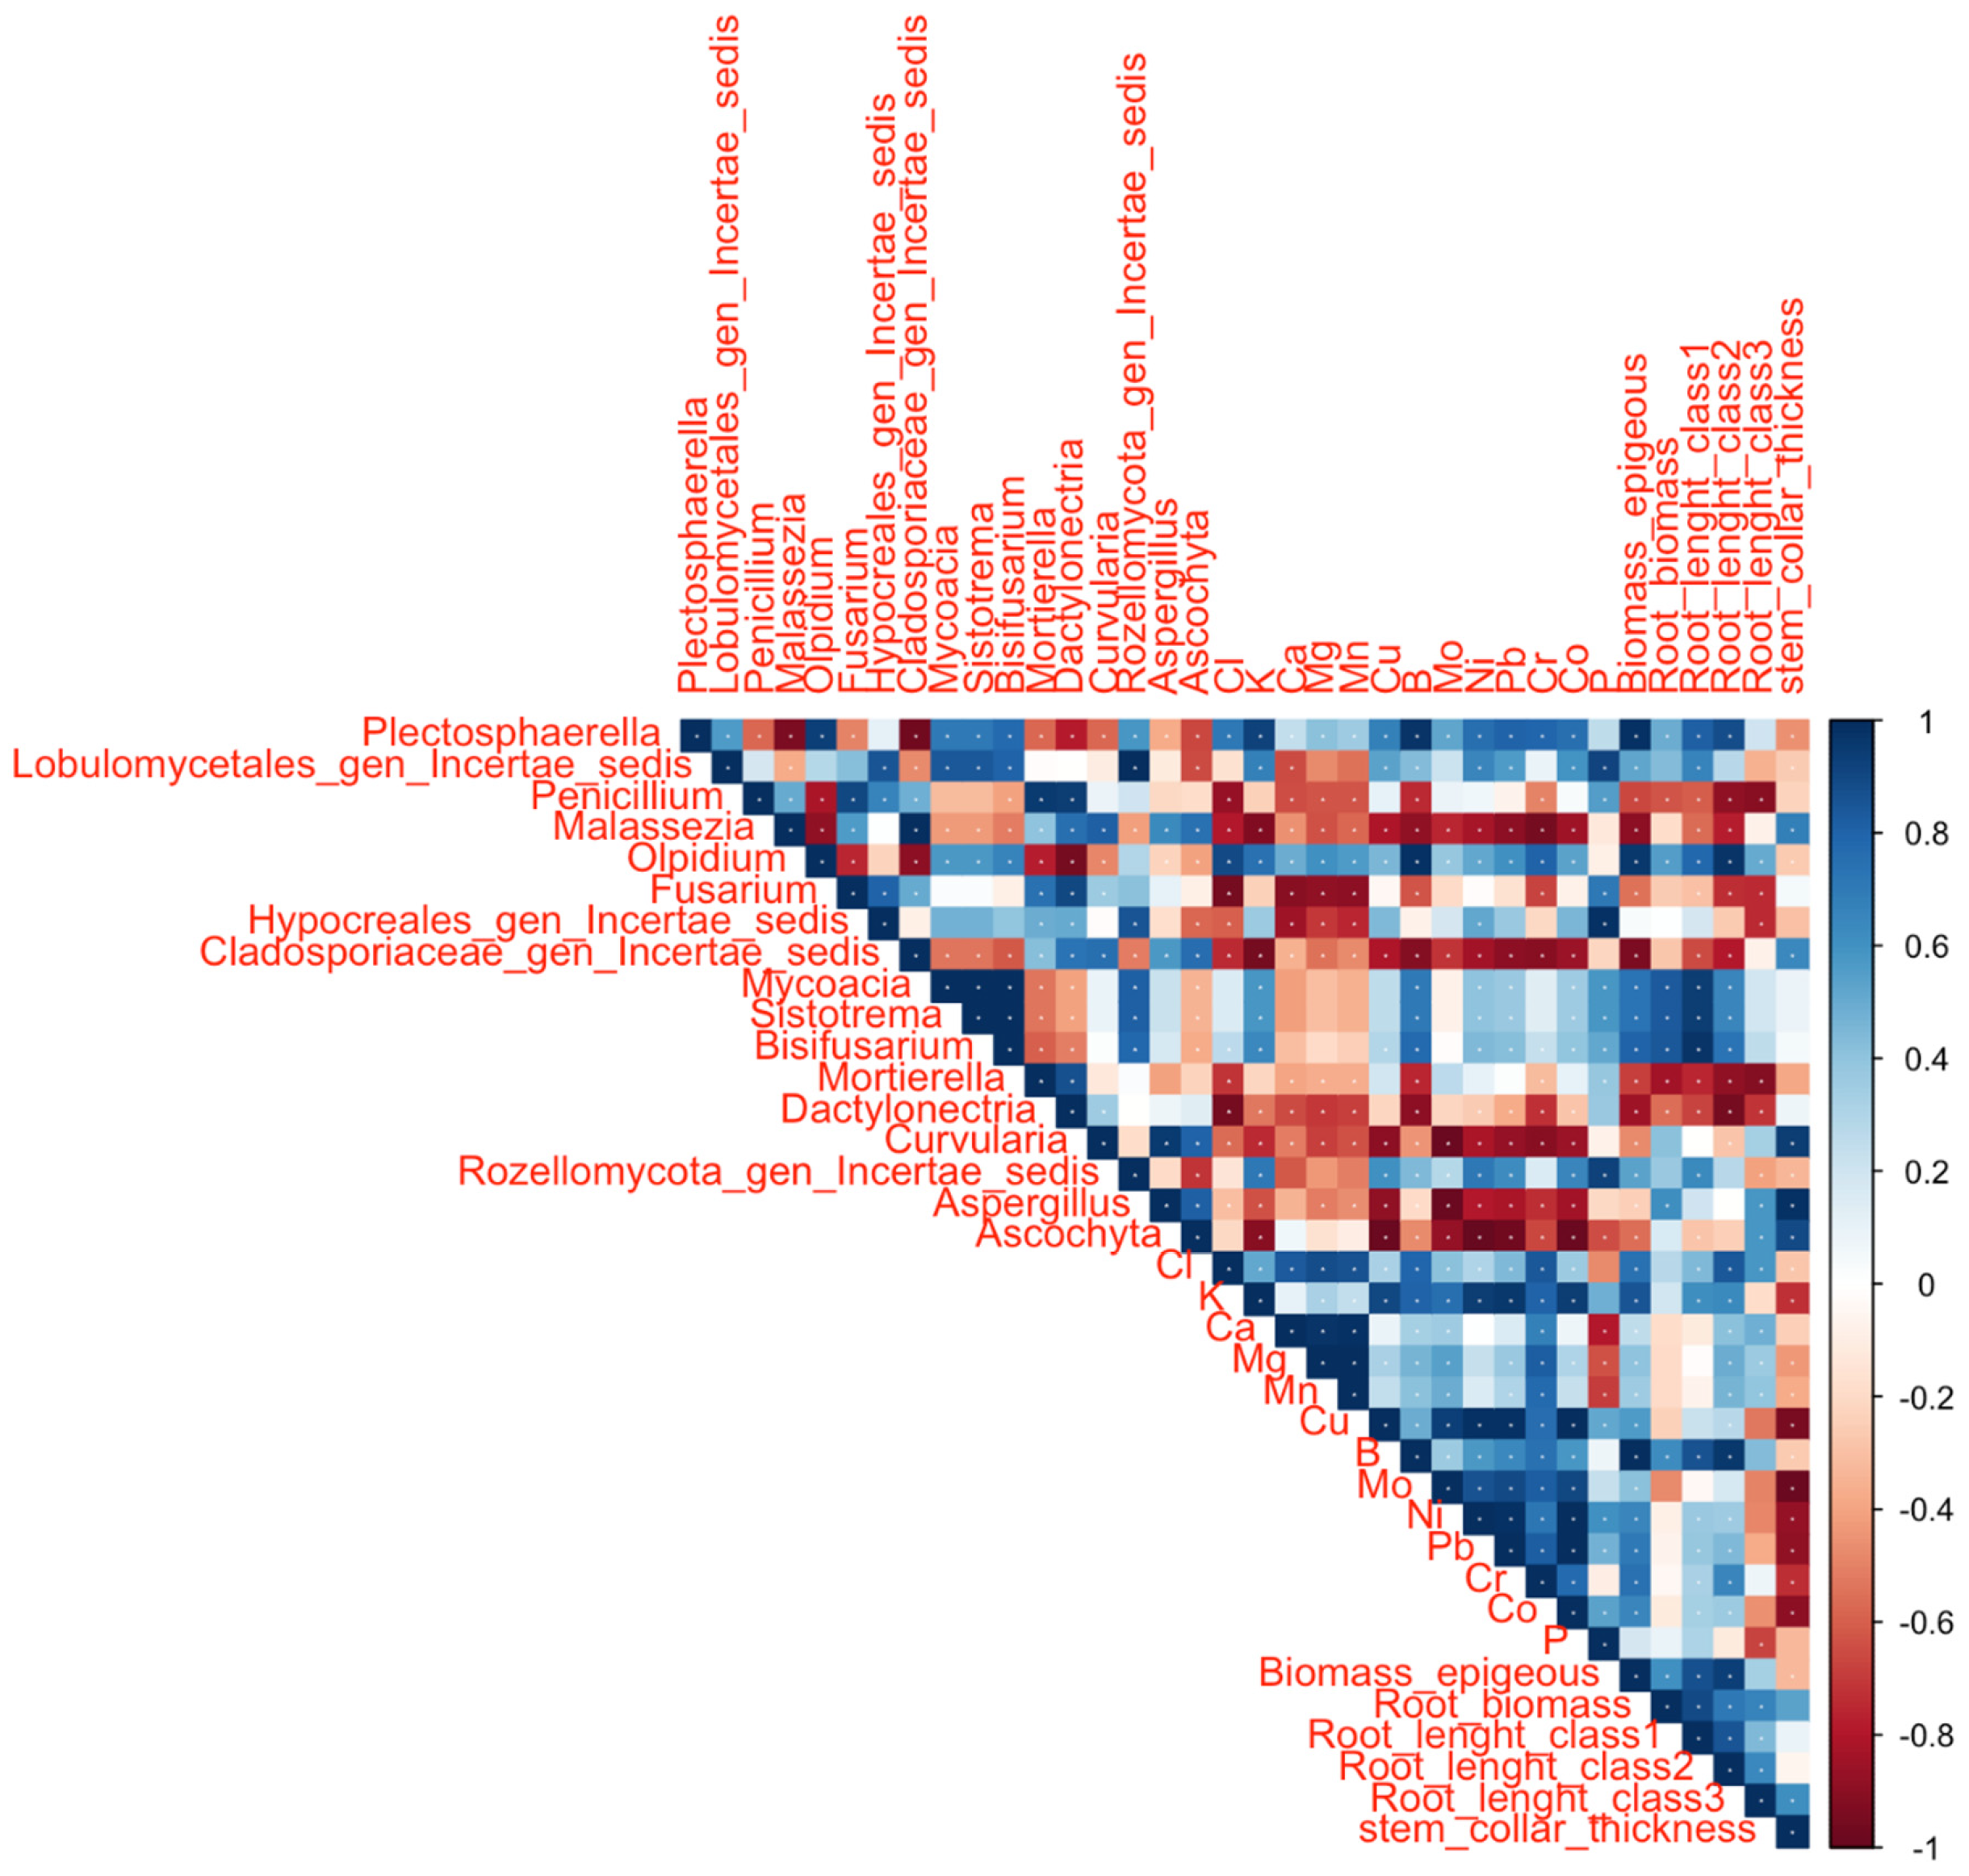
Correlation matrix showing the relationships among the relative abundance of dominant fungal genera, soil chemical properties, and plant growth parameters. Correlation coefficients (Pearson’s r) are represented by the color scale, ranging from −1 (red, strong negative correlation) to +1 (blue, strong positive correlation). The lower triangular matrix is displayed to avoid redundancy. White dots indicate statistically significant correlations (p < 0.05).
Significant positive correlations were observed between the main root growth parameters and several fungal taxa, including Plectosphaerella, Lobulomycetales, Olpidium, Mycoacia, Sistotrema, and Bisifusarium. Among soil chemical variables, the results showed that Cl concentrations were statistically and positively correlated with the same OTUs previously identified and with the root growth, whilst the contrary (negative correlation) was observed in the case Mg concentrations. It is noteworthy that Plectosphaerella and Olpidium, etc. were strongly and positively correlated (p < 0.001) with the HMs and micronutrients analyzed as, for instance, in the case of Pb, Cr, Cu, Ni, B etc. On the contrary, Malassezia was significantly and negatively correlated with the chemical concentration estimated. Figure 8 illustrates the correlation patterns among identified OTUs, highlighting significant co-occurrences between fungal genera previously associated with root development and Cl or Ca concentrations. Notably, Plectosphaerella, Lobulomycetales, and Olpidium exhibited strong mutual positive correlations (p < 0.001), suggesting a robust co-occurrence pattern within the experimental groups.
4. Discussion
Forest-soil conditioning did not enhance the effectiveness of biochar in supporting early P. halepensis development. Instead, untreated biochar promoted absorptive fine-root elongation and stem thickening in degraded agricultural soil, while maintaining leaf biomass comparable to the unamended treatment. This response addresses the central hypothesis of the study: exposing biochar to a forest environment before application did not necessarily produce a more beneficial plant–microbiome association, at least during the early seedling development. Across substrates, differences in biomass allocation and root traits were more evident than changes in lateral branch number or the mean diameter of the two finest root classes, suggesting plasticity in growth and biomass investment within a broadly similar morphological framework.
The contrasting SRL and RTD values in AD and P indicate different patterns of root construction. AD seedlings produced more root length per unit dry mass, whereas P seedlings had thicker stems and denser root tissues. These combinations are consistent with relatively acquisitive and conservative tendencies, respectively. Root traits can vary along partly independent dimensions [26], and the higher root:shoot ratio in A further shows that allocation did not follow a single gradient across substrates. Seedling quality therefore requires consideration of both shoot and root development, particularly because nursery morphology interacts with field conditions in determining establishment [27].
Untreated biochar modified the AD phenotype chiefly by expanding the finest root fraction. AFR length was approximately doubled, whereas TSFR length did not differ significantly among treatments. This selective response supports resolving fine roots into narrower classes rather than using a single diameter cutoff [28]. In Pinus sylvestris, Mucha, Zadworny [29] showed that a cutoff of 0.5 mm better represented absorptive-root nutrient characteristics than the conventional 2 mm threshold, while emphasizing that classification must account for species and site differences. The present 0.45 mm boundary similarly reveals a treatment response concentrated in the putatively absorptive compartment. Because AFR mean diameter remained unchanged, this response primarily involved elongation or production of roots within that class [30].
ADB also had greater stem diameter than AD and ADBP and the largest mean root biomass, indicating that root expansion accompanied additional structural growth. Nevertheless, ADB and ADBP had similar SRL, distinguishing overall root-system size from length produced per unit biomass. The positive root response agrees with the synthesis by Xiang, Deng [18]. Experiments also show that biochar properties can influence root development through nutrient supply and changes in the rooting environment [31,32]. These mechanisms are plausible here, although their relative contributions remain unresolved. Notably, ADBP contained more extractable phosphorus than ADB but supported weaker root development. This indicates that greater extractable P did not translate into improved growth. A contribution of P-related nutritional imbalances cannot be excluded, although the available data do not establish excessive P supply or accumulation in plant tissues.
The difference between ADB and ADBP also highlights the specificity of conditioning procedures. Managed preconditioning of biochar-containing media can improve plant responses [33], while co-composting can generate nutrient-rich organic coatings that alter biochar properties [34]. Six months of forest-soil incubation represent a different process, potentially combining microbial colonization with chemical and physical changes. Its outcome cannot therefore be interpreted as the effect of microbial inoculation alone. The smaller root system in ADBP compared with ADB indicates that forest-soil conditioning did not reproduce the benefits of untreated biochar within 85 days. However, the present study cannot determine whether this difference resulted from microbial activity, altered substrate properties or their interaction. Nevertheless, the lower biomass accumulation in ADBP should not automatically be interpreted as poorer suitability for restoration. Seedling height and crown width were close to those observed in P, suggesting that forest-conditioned biochar supported a more restrained pattern of shoot development than untreated biochar. This raises the possibility that lower early growth could be compatible with establishment under resource-limited conditions. However, this resemblance was partial, as ADBP seedlings retained thinner stems, higher SRL and lower RTD than those grown in P. Whether their smaller size reduces water demand sufficiently to compensate for a less developed root system remains unresolved. Conversely, the greater root development in ADB could improve water acquisition after planting. Drought trials are therefore needed to determine whether these contrasting growth responses represent different establishment strategies or differences in seedling vigor.
Bacterial profiles suggest that biochar modified the relative representation of shared genera rather than producing wholly distinct assemblages. Shannon diversity did not differ significantly, and the bacterial ordination showed partial overlap. This differs from experiments in which biochar-associated diversity changes were accompanied by demonstrated changes in microbial substrate utilization [22]. In the present study, Pseudomonas was most abundant in ADBP, whereas root development was greatest in ADB. Its relative abundance was therefore insufficient to predict growth promotion. Evidence specific to Aleppo pine reinforces the importance of microbial partners: Rincón, Ruiz-Díez [35] found that Pseudomonas fluorescens and Suillus granulatus stimulated seedling growth when co-inoculated, but not when applied individually. Thus, taxonomic presence alone is less informative than the functional interactions established in the recipient substrate [36,37].
Fungal profiles provided a complementary perspective. The ordination visually separated AD and ADBP from A and ADB more clearly than the bacterial ordination, suggesting treatment-associated reorganization without a significant change in Shannon diversity. Suillus dominated AD but represented less than 1% of sequences in either biochar treatment. Although selected Suillus collinitus inocula have improved Aleppo pine survival in degraded gypsum soil [38], the present sequence abundances cannot quantify functional ectomycorrhizal colonization. Moreover, forest-soil inoculation benefits in Aleppo pine can diminish under drought and competition [39]. The high representation of Plectosphaerella in ADB likewise identifies an association with vigorous root development, without establishing a beneficial function. However, genus-level identification alone does not establish whether these fungi promoted plant growth or caused disease.
The correlations between fungal relative abundances and seedling growth do not establish that fungi caused the observed growth responses. Several explanations remain possible: fungal activity may have contributed to plant development; larger root systems may have altered fungal communities through changes in rhizodeposition and habitat availability; or both fungi and seedlings may have responded independently to substrate properties [40]. The potential influence of plants on microbial communities is consistent with the role of root exudate chemistry in microbial assembly [37]. Because fungal profiles and plant traits were assessed at the same final harvest, the temporal sequence of these responses cannot be resolved. Furthermore, a higher relative abundance does not necessarily indicate greater absolute fungal abundance or activity. These associations should therefore be treated as hypotheses for targeted experiments combining fungal inoculation with measurements of colonization, absolute abundance, and plant responses. Correlations with Ca, Cl, Mg and trace elements should similarly be treated as hypotheses rather than evidence of nutrient stimulation or toxicity. Shared treatment effects and the compositional nature of sequencing data constrain causal interpretation [41]. Because biochar amendments were tested only in the degraded agricultural soil, the experiment does not resolve soil × biochar interactions. The observed amendment effects therefore apply to the degraded soil examined here, while comparisons with the forest and non-intensively cultivated agricultural soils provide reference conditions rather than evidence of biochar responses across soil types. Furthermore, each source soil originated from a single collection site, and replication was at the pot level. Differences among source soils therefore cannot be attributed to management history independently of other site-specific characteristics.
These findings concern early seedling responses during an 85-day pot experiment and do not demonstrate improved field productivity or long-term establishment. For restoration-oriented seedling production, the main implication is that untreated biochar supported absorptive-root development without reducing leaf biomass, while forest conditioning provided no additional benefit in the early growth traits measured. The next step is to establish whether this morphology improves water acquisition and survival after outplanting. More targeted conditioning with selected, compatible microorganisms could also be tested but should be evaluated against untreated biochar using direct colonization and functional measurements. Such comparisons would distinguish successful microbial delivery from plant benefit and determine whether the early response persists under field conditions.
5. Conclusions
Untreated biochar promoted absorptive fine-root development and stem thickening in P. halepensis seedlings grown in degraded agricultural soil, whereas forest-conditioned biochar supported more limited growth during the first 85 days after germination. However, lower biomass accumulation in ADBP does not necessarily imply poorer suitability for restoration. Although some shoot dimensions resembled those observed in forest soil, this partial similarity does not establish an equivalent conservative strategy or greater drought tolerance. Associations between microbial composition and plant traits do not establish causal effects on growth, highlighting the need to assess microbial functions alongside plant responses. Drought and outplanting trials are therefore required to determine whether the contrasting developmental responses translate into differences in water use and survival, and whether forest conditioning provides benefits beyond the early growth stage.
Author Contributions
Conceptualization, F.G. and M.T.; methodology, P.P., A.G. and G.P.; software, P.P. and A.G.; validation, G.P., M.T. and A.G.; formal analysis, P.P., G.P. and C.L.; investigation, P.P., A.G., G.P. and C.L.; resources, F.G., and M.T.; data curation, P.P., G.P.; writing—original draft preparation, P.P., A.G., G.P. and C.L.; writing—review and editing, F.G. and M.T.; visualization, G.P., M.T. and A.G.; supervision, F.G. and M.T.; project administration, F.G. and M.T.; funding acquisition, F.G. and M.T. All authors have read and agreed to the published version of the manuscript.
Funding
This research was funded by the Italian Ministry of University and Research (MUR) under the National Recovery and Resilience Plan (PNRR), Mission 4, Component 2, Investment 1.1, “Fund for the National Research Programme and Projects of Significant National Interest (PRIN)”, project “FaST sOil REstoration with biochaR as a micrObiOMe carrier” (STOREROOM), grant number P2022TFEJJ, CUP D53D23022070001.
Data Availability Statement
Data is contained within the article.
Acknowledgments
The authors would like to thank Stefano Castiglione for his kind hospitality and for providing access to the laboratory facilities.
Conflicts of Interest
The authors declare no conflicts of interest.
References
- Köninger, J.; Lugato, E.; Panagos, P.; Kochupillai, M.; Orgiazzi, A.; Briones, M.J.I. Manure management and soil biodiversity: Towards more sustainable food systems in the EU. Agric. Syst. 2021, 194, 103251. [Google Scholar] [CrossRef] [Scilit]
- Laban, P.; Metternicht, G.; Davies, J. Soil Biodiversity and Soil Organic Carbon: Keeping Drylands Alive; International Union for Conservation of Nature and Natural Resources: Gland, Switzerland, 2018. [Google Scholar]
- Gibbs, H.K.; Salmon, J.M. Mapping the world’s degraded lands. Appl. Geogr. 2015, 57, 12–21. [Google Scholar] [CrossRef] [Scilit]
- Ceccarelli, S.; Grando, S.; Maatougui, M.; Michael, M.; Slash, M.; Haghparast, R.; Rahmanian, M.; Taheri, A.; Al-Yassin, A.; Benbelkacem, A.; et al. Plant breeding and climate changes. J. Agric. Sci. 2010, 148, 627–637. [Google Scholar] [CrossRef] [Scilit]
- Machado, R.M.A.; Serralheiro, R.P. Soil Salinity: Effect on Vegetable Crop Growth. Management Practices to Prevent and Mitigate Soil Salinization. Horticulturae 2017, 3, 30. [Google Scholar] [CrossRef] [Scilit]
- Tudor, C.; Constandache, C.; Dinca, L.; Murariu, G.; Badea, N.O.; Tudose, N.C.; Marin, M. Pine afforestation on degraded lands: A global review of carbon sequestration potential. Front. For. Glob. Change 2025, 8, 1648094. [Google Scholar] [CrossRef] [Scilit]
- Wall, C.B.; Egan, C.P.; Swift, S.I.O.; Hynson, N.A. Three decades post-reforestation has not led to the reassembly of arbuscular mycorrhizal fungal communities associated with remnant primary forests. Mol. Ecol. 2020, 29, 4234–4247. [Google Scholar] [CrossRef] [Scilit] [PubMed]
- Dyshko, V.; Hilszczanska, D.; Davydenko, K.; Matic, S.; Moser, W.K.; Borowik, P.; Oszako, T. An Overview of Mycorrhiza in Pines: Research, Species, and Applications. Plants 2024, 13, 506. [Google Scholar] [CrossRef] [Scilit] [PubMed]
- Jia, J.Y.; Zhang, J.Z.; Li, Y.Z.; Koziol, L.; Podzikowski, L.; Delgado-Baquerizo, M.; Wang, G.Z.; Zhang, J.L. Relationships between soil biodiversity and multifunctionality in croplands depend on salinity and organic matter. Geoderma 2023, 429, 116273. [Google Scholar] [CrossRef] [Scilit]
- Joseph, S.; Cowie, A.L.; Van Zwieten, L.; Bolan, N.; Budai, A.; Buss, W.; Cayuela, M.L.; Graber, E.R.; Ippolito, J.A.; Kuzyakov, Y.; et al. How biochar works, and when it doesn’t: A review of mechanisms controlling soil and plant responses to biochar. Glob. Change Biol. Bioenergy 2021, 13, 1731–1764. [Google Scholar] [CrossRef] [Scilit]
- Pelliza, Y.I.; Souto, C.P.; Tadey, M. Successional traits mediate germination responses to grazing: Implications for restoration. Agric. Ecosyst. Environ. 2026, 396, 109957. [Google Scholar] [CrossRef] [Scilit]
- Lévesque, V.; Rochette, P.; Hogue, R.; Jeanne, T.; Ziadi, N.; Chantigny, M.H.; Dorais, M.; Antoun, H. Greenhouse gas emissions and soil bacterial community as affected by biochar amendments after periodic mineral fertilizer applications. Biol. Fertil. Soils 2020, 56, 907–925. [Google Scholar] [CrossRef] [Scilit]
- Manirakiza, E.; Ziadi, N.; Hamel, C.; Lévesque, V.; Antoun, H.; Karam, A. Soil microbial community dynamics after co-application of biochar and paper mill biosolids. Appl. Soil Ecol. 2021, 165, 103960. [Google Scholar] [CrossRef] [Scilit]
- Ning, Y.N.; Xiao, Z.Y.; Weinmann, M.; Li, Z.F. Phosphate Uptake is Correlated with the Root Length of Celery Plants Following the Association between Arbuscular Mycorrhizal Fungi, Pseudomonas sp. and Biochar with Different Phosphate Fertilization Levels. Agronomy 2019, 9, 824. [Google Scholar] [CrossRef] [Scilit]
- Warnock, D.D.; Lehmann, J.; Kuyper, T.W.; Rillig, M.C. Mycorrhizal responses to biochar in soil—Concepts and mechanisms. Plant Soil 2007, 300, 9–20. [Google Scholar] [CrossRef] [Scilit]
- Wu, D.; Zhang, W.; Sun, W.; Zhang, Y.; Gu, W.; Sun, Y.; Liu, Z.; Wang, W.; Chen, W. Biochar as a Long-Term Strategy for Rehabilitating Degraded Soils: Multi-Omics Analysis of Soil–Metabolite–Microbe Interactions in Continuous Soybean Cultivation. Land Degrad. Dev. 2025, 36, 4718–4731. [Google Scholar] [CrossRef] [Scilit]
- Hashar, M.R.; Nasrin, S.; Freese, D.; Veste, M. Study of phosphorus status and sorption properties in reclaimed lignite mine soils under different age stands of Robinia pseudoacacia L. in Welzow, Germany. Land Degrad. Dev. 2024, 35, 4189–4200. [Google Scholar] [CrossRef] [Scilit]
- Xiang, Y.; Deng, Q.; Duan, H.; Guo, Y. Effects of biochar application on root traits: A meta-analysis. GCB Bioenergy 2017, 9, 1563–1572. [Google Scholar] [CrossRef] [Scilit]
- Ali, A.; Jabeen, N.; Chachar, Z.; Chachar, S.; Ahmed, S.; Ahmed, N.; Laghari, A.A.; Sahito, Z.A.; Farruhbek, R.; Yang, Z.P. The role of biochar in enhancing soil health & interactions with rhizosphere properties and enzyme activities in organic fertilizer substitution. Front. Plant Sci. 2025, 16, 1595208. [Google Scholar] [CrossRef] [Scilit] [PubMed]
- Jaiswal, A.K.; Elad, Y.; Paudel, I.; Graber, E.R.; Cytryn, E.; Frenkel, O. Linking the Belowground Microbial Composition, Diversity and Activity to Soilborne Disease Suppression and Growth Promotion of Tomato Amended with Biochar. Sci. Rep. 2017, 7, 44382. [Google Scholar] [CrossRef] [Scilit] [PubMed]
- Rombel, A.; Krasucka, P.; Oleszczuk, P. Sustainable biochar-based soil fertilizers and amendments as a new trend in biochar research. Sci. Total Environ. 2022, 816, 151588. [Google Scholar] [CrossRef] [Scilit] [PubMed]
- Kolton, M.; Graber, E.R.; Tsehansky, L.; Elad, Y.; Cytryn, E. Biochar-stimulated plant performance is strongly linked to microbial diversity and metabolic potential in the rhizosphere. New Phytol. 2017, 213, 1393–1404. [Google Scholar] [CrossRef] [Scilit] [PubMed]
- Pardi, R.; Gargano, M.L.; Lasorella, C.; Terzaghi, M. Optimizing soil core fine root collection and characterization: Significant time reduction with a sub-sampling approach. Plant Soil 2025, 508, 347–360. [Google Scholar] [CrossRef] [Scilit]
- Montagnoli, A.; Terzaghi, M.; Giussani, B.; Scippa, G.S.; Chiatante, D. An integrated method for high-resolution definition of new diameter-based fine root sub-classes of Fagus sylvatica L. Ann. For. Sci. 2018, 75, 76. [Google Scholar] [CrossRef] [Scilit]
- Piccolo, P.; Gentile, A.; Cicatelli, A.; Guarino, F.; Castiglione, S. Effects of Pollutants in Urban Wastewater on Rhizoplane Microbial Communities in Constructed Wetlands: Resistance and Resilience of Macrophyte-Associated Microbiomes. Environments 2025, 12, 414. [Google Scholar] [CrossRef] [Scilit]
- Kramer-Walter, K.R.; Bellingham, P.J.; Millar, T.R.; Smissen, R.D.; Richardson, S.J.; Laughlin, D.C. Root traits are multidimensional: Specific root length is independent from root tissue density and the plant economic spectrum. J. Ecol. 2016, 104, 1299–1310. [Google Scholar] [CrossRef] [Scilit]
- Pinto, J.R.; Marshall, J.D.; Dumroese, R.K.; Davis, A.S.; Cobos, D.R. Establishment and growth of container seedlings for reforestation: A function of stocktype and edaphic conditions. For. Ecol. Manag. 2011, 261, 1876–1884. [Google Scholar] [CrossRef] [Scilit]
- McCormack, M.L.; Dickie, I.A.; Eissenstat, D.M.; Fahey, T.J.; Fernandez, C.W.; Guo, D.; Helmisaari, H.-S.; Hobbie, E.A.; Iversen, C.M.; Jackson, R.B.; et al. Redefining fine roots improves understanding of below-ground contributions to terrestrial biosphere processes. New Phytol. 2015, 207, 505–518. [Google Scholar] [CrossRef] [Scilit] [PubMed]
- Mucha, J.; Zadworny, M.; Helmisaari, H.-S.; Nihlgård, B.; Repo, T.; Żytkowiak, M.; Małek, S.; Reich, P.B.; Oleksyn, J. Fine root classification matters: Nutrient levels in different functional categories, orders and diameters of roots in boreal Pinus sylvestris across a latitudinal gradient. Plant Soil 2020, 447, 507–520. [Google Scholar] [CrossRef] [Scilit]
- Li, H.C.; Li, J.J.; Zhang, H.; Liu, Y. Effects of Secondary Succession on Vegetation and Soil Microbes Communities in Open-Pit Coal Mining Areas. Clean-Soil Air Water 2026, 54, e70128. [Google Scholar] [CrossRef] [Scilit]
- Honvault, N.; Nobile, C.; Faucon, M.-P.; Firmin, S.; Houben, D. Direct and indirect interactions between biochar properties, plant belowground traits, and plant performance. GCB Bioenergy 2022, 14, 1254–1265. [Google Scholar] [CrossRef] [Scilit]
- Prendergast-Miller, M.T.; Duvall, M.; Sohi, S.P. Biochar–root interactions are mediated by biochar nutrient content and impacts on soil nutrient availability. Eur. J. Soil Sci. 2014, 65, 173–185. [Google Scholar] [CrossRef] [Scilit]
- Jaiswal, A.K.; Elad, Y.; Cytryn, E.; Graber, E.R.; Frenkel, O. Activating biochar by manipulating the bacterial and fungal microbiome through pre-conditioning. New Phytol. 2018, 219, 363–377. [Google Scholar] [CrossRef] [Scilit] [PubMed]
- Hagemann, N.; Joseph, S.; Schmidt, H.-P.; Kammann, C.I.; Harter, J.; Borch, T.; Young, R.B.; Varga, K.; Taherymoosavi, S.; Elliott, K.W.; et al. Organic coating on biochar explains its nutrient retention and stimulation of soil fertility. Nat. Commun. 2017, 8, 1089. [Google Scholar] [CrossRef] [Scilit] [PubMed]
- Rincón, A.; Ruiz-Díez, B.; García-Fraile, S.; García, J.A.L.; Fernández-Pascual, M.; Pueyo, J.J.; de Felipe, M.R. Colonisation of Pinus halepensis roots by pseudomonas fluorescens and interaction with the ectomycorrhizal fungus Suillus granulatus. FEMS Microbiol. Ecol. 2005, 51, 303–311. [Google Scholar] [CrossRef] [Scilit] [PubMed]
- Das, N.; Pandey, P. Biochar-driven rhizoremediation of soil contaminated with organic pollutants: Engineered solutions, microbiome enrichment, and bioeconomic benefits for ecosystem restoration. Biochar 2025, 7, 101. [Google Scholar] [CrossRef] [Scilit]
- Tang, K.H.D. Biochar Amendments for Soil Restoration: Impacts on Nutrient Dynamics and Microbial Activity. Environments 2025, 12, 425. [Google Scholar] [CrossRef] [Scilit]
- Rincón, A.; de Felipe, M.R.; Fernández-Pascual, M. Inoculation of Pinus halepensis Mill. with selected ectomycorrhizal fungi improves seedling establishment 2 years after planting in a degraded gypsum soil. Mycorrhiza 2007, 18, 23–32. [Google Scholar] [CrossRef] [Scilit] [PubMed]
- Herol, L.; Avidar, M.; Yirmiahu, S.; Zach, Y.Y.; Klein, T.; Shemesh, H.; Livne-Luzon, S. Context-dependent benefits of forest soil addition on Aleppo pine seedling performance under drought and grass competition. Mycorrhiza 2024, 34, 217–227. [Google Scholar] [CrossRef] [Scilit] [PubMed]
- Kumar, Y.; Ren, W.; Tao, H.Y.; Tao, B.; Lindsey, L.E. Impact of biochar amendment on soil microbial biomass carbon enhancement under field experiments: A meta-analysis. Biochar 2025, 7, 2. [Google Scholar] [CrossRef] [Scilit]
- Gloor, G.B.; Macklaim, J.M.; Pawlowsky-Glahn, V.; Egozcue, J.J. Microbiome Datasets Are Compositional: And This Is Not Optional. Front. Microbiol. 2017, 8, 2017. [Google Scholar] [CrossRef] [Scilit] [PubMed]

Disclaimer/Publisher’s Note: The statements, opinions and data contained in all publications are solely those of the individual author(s) and contributor(s) and not of MDPI and/or the editor(s). MDPI and/or the editor(s) disclaim responsibility for any injury to people or property resulting from any ideas, methods, instructions or products referred to in the content. |
© 2026 by the authors. Licensee MDPI, Basel, Switzerland. This article is an open access article distributed under the terms and conditions of the Creative Commons Attribution (CC BY) license.