


Abstract
Coffee husk and disposable surgical masks are contrasting feedstocks for thermochemical co-processing. This study examined how blend ratio and heating rate affect non-additive mass-loss behavior during co-pyrolysis under nitrogen. Thermogravimetric analysis used a nominal sample mass of 5 mg for coffee husk (CH100), unused three-ply surgical-mask material (M100), and coffee-husk-to-mask mass ratios of 75/25 (CH75M25), 50/50 (CH50M50), and 25/75 (CH25M75). Samples were heated from ambient temperature to 800 °C at 10, 20, and 30 °C min−1 under a nitrogen flow of 25 mL min−1. Blend curves were compared with mass-weighted pure-feedstock predictions at the matching heating rate over 50–750 °C. This common evaluation interval included moisture release, principal devolatilization, and subsequent slower mass loss, with residual mass compared at 750 °C. The primary derivative thermogravimetric (DTG) peak shifted from 314.4 to 336.3 °C for CH100 and from 403.7 to 432.7 °C for M100 between 10 and 30 °C min−1. CH50M50 had the most negative mean mass deviation among the tested blends: −14.31, −13.43, and −12.93 percentage points at the respective rates. The results identify blend-dependent departures from the additive reference and CH50M50 as a candidate for further controlled co-pyrolysis studies. The observed mass deviations alone do not establish a chemical mechanism or improved product yield.
1. Introduction
Co-processing agricultural residues and polymer-containing waste offers a possible route to recover resources from materials with different composition and thermal behavior. Coffee husk (CH) is a lignocellulosic residue from coffee processing, whereas the disposable surgical-mask material (M) examined here comprises the three mask layers and retained ear loops, with nose wires removed. Thermal conversion of coffee residues and mask waste has been investigated previously [1,2,3,4]. The present nitrogen-atmosphere TGA experiments examine pyrolysis of the individual feedstocks and co-pyrolysis of their blends; they do not directly measure gasification performance. The valorization of coffee husk has been addressed also in terms of bioactive chemicals and biomass-based value chains [5,6]. Separate reviews of environmental problems, waste generation and management solutions for disposable masks have been published [7,8,9], including circular-economy techniques [10]; larger plastic-waste management studies stress the need to rigorously evaluate potential recovery routes [11].
TGA measures mass change during a prescribed temperature program and can identify decomposition windows, characteristic mass-loss temperatures, and residual mass. Derivative thermo gravimetric (DTG) is obtained from the TG signal and highlights the rate of mass loss; it is not an independent chemical characterization method. Multiple heating rates show changes in temperature dependency, which can enable kinetic analysis when the underlying data and experimental settings are appropriate [12]. The paired Thermogravimetry–Fourier Transform Infrared Spectroscopy–Gas Chromatography–Mass Spectrometry (TG-FTIR-GC–MS) has given more information than only mass change for masks [2], while coffee-husk investigations have examined kinetics and particle-size conversion [1,4].
For biomass-plastic blends, an established screening method compares the observed response to the mass-weighted response of the constituent feedstocks. Deviations from this additive reference may be dependent upon temperature, composition, heating rate, and experimental circumstances. Possible reasons are overlapping breakdown, contact with molten polymer, radical transfer reactions, and impacts of char or mineral. Heat and mass transfer may also play a role [13,14,15]. Therefore, a TG deviation indicates an apparent difference to the reference but does not identify its chemical basis. Co-pyrolysis of biomass and plastics is reviewed considering the interactions of reactants, catalysts, fuels, chemicals and carbon materials [16,17,18].
A temperature-resolved deviation keeps information about changes in sign and magnitude of non-additivity that may be obscured by an endpoint residue or a single DTG maximum. Negative and positive deviations might occur in separate conversion intervals, and both should be stated, rather than lumping them together into an unqualified synergy claim [14]. Matching each blend to pure-feedstock curves acquired at the same heating rate decouples blend composition from a distinct thermal program. Other thermogravimetric and kinetic experiments include biomass with food-packaging plastics [19], binary single-use plastics [20], laminated packaging [21], and polyurethane foam [22,23]. Machine-learning algorithms were also utilized to study the interactions of biomass and plastic during co-pyrolysis [24,25], while microwave-assisted researches explore more operating situations [26].
Here, the research gap is feedstock-specific. Idris et al. [27] studied wasted coffee grounds and facemasks by thermal kinetics and pyrolysis–gas chromatography/mass spectrometry (Py-GC/MS) product analysis. The work shows that coffee-derived-waste/mask co-processing has already been researched. The present work does not claim primacy for that general concept. Coffee husk and wasted coffee grounds are generated at different phases of processing, and so their thermal reactions are not interchangeable. This study focuses on temperature-resolved departures of coffee-husk/mask blends from heating-rate-matched additive references. Table 1 compares the relevant evidence and identifies the narrower scope of the present assessment.
Table 1.
Published evidence relevant to coffee-husk and disposable-mask thermal decomposition and the scope of the present comparison.
The objective is to determine how blend ratio and heating rate affect apparent non-additivity during coffee-husk/surgical-mask co-pyrolysis under nitrogen at 10, 20, and 30 °C min−1. Five compositions are considered, and the three blends are compared with pure-feedstock additive references at matching heating rates over 50–750 °C within an ambient-to-800 °C acquisition program. The comparison focuses on the magnitude and temperature dependence of mass deviations. Mechanistic interpretation is distinguished from measured mass-loss behavior because no evolved-product characterization is reported.
2. Materials and Methods
2.1. Definitions of Feedstocks and Blends
Coffee husk (CH) and disposable three-ply mask material (M) were examined individually and at three CH/M dry-mass ratios. The sample codes are CH100 (100/0), CH75M25 (75/25), CH50M50 (50/50), CH25M75 (25/75) and M100 (0/100). The masks were new, unused Medline ASTM Level 1 three-ply isolation face masks with elastic ear loops, yellow, product code NON27122Z. The product designation and code were verified against the original package label. Only the nose wires were removed; the outer, middle, and inner layers and ear loops were retained and processed together. M100 therefore represents the prepared mask assembly excluding nose wires, rather than pure polypropylene. The same material was used in all coffee-husk/mask blends.
Coffee husk was oven-dried at (Memmert GmbH & Co. KG, Schwabach, Germany)105 °C for 24 h, while the prepared mask material was oven-dried at 60 °C for 48 h. Following drying, the mask material was cut with scissors, and the feedstocks were ground separately using an RH-100G grinder (Shanghai Jingxin Industrial Development Co., Ltd., Shanghai, China). The ground materials were sieved through a 0.25 mm sieve, and the fraction passing the sieve was retained for analysis and blend preparation. Sample preparation was carried out by the experimenter and laboratory technician, with drying and sieving conditions documented in the corresponding laboratory records. The blends were prepared on a dry-mass basis. The retained layers and ear loops define the material represented by the mask and blend measurements; their individual polymer identities were not established by sample-specific spectroscopy.
Coffee-husk proximate analysis was conducted at the Geological Survey of Ethiopia, Geochemical Laboratory Directorate, Hydrocarbon Laboratory. Carbon, hydrogen, nitrogen, and sulfur contents were measured directly using Thermo Scientific Flash 2000 elemental analyzer (Thermo Fisher Scientific Inc., Waltham, MA, USA). Thermal-analysis data were processed using BJHENVEN analysis V1.0 software by dynamic flash combustion, followed by gas-chromatographic separation and thermal-conductivity detection. Representative homogenized samples were weighed into tin capsules before analysis. The analyzed M100 sample comprised the three retained mask layers and ear loops, with nose wires excluded, matching the prepared mask feedstock used in the TGA experiments. Quality controls included calibration using BBOT reference material, analysis of empty tin-capsule blanks, duplicate determinations of each sample, and periodic analysis of a reference material to check instrument performance.
Oxygen was not measured directly but determined by difference. When the findings are expressed on a common dry basis, the calculation is O (%) = 100 − C − H − N − S − ash; when on a common as-received basis, moisture is additionally subtracted. All terms must be on the same reporting basis. Table 2 includes the original laboratory-reported results, with no conversion or renormalization, including the reported oxygen readings. The ratios for dry-mass blend preparation differ from the foundation of analytical reporting. The proximal fractions are expressed on a moist basis and not as dry-basis values. Blend entries are per mass feedstock values to the indicated precision and are not handled as independent blend analyses. For CH100, C + H + N + S + O + ash + MC = 99.994%; for M100, the corresponding total is 99.81%. The difference approach is established, but the initial basis for the computation and the disagreement in M100 need to be clarified in the laboratory; no numerical correction is implied from closure alone. Such compositional data is utilized descriptively.
Table 2.
Laboratory-reported proximate and elemental composition values (wt.%). VM: volatile matter; FC: fixed carbon; MC: moisture content. Pure-feedstock CHNS contents were measured directly, whereas oxygen was calculated by difference. All values are reproduced at the supplied precision without conversion or renormalization. Blend entries follow mass-weighted feedstock values to the displayed precision. Proximate and elemental fractions are separate descriptions. See Section 2.1 for the reporting-basis and oxygen-closure qualification.
2.2. Acquisition and Processing of Thermogravimetric Information
TGA measurements were conducted at Bahir Dar University, Bahir Dar Institute of Technology, Ethiopia, using a STAT2012 thermogravimetric analyzer. A nominal sample mass of 5 mg was targeted for every run. Samples were placed in alumina crucibles and heated from ambient temperature to 800 °C at 10, 20, and 30 °C min−1. All individual-feedstock and blend runs used nitrogen of 99.999% purity, grade 5.0, supplied by Air Liquide, at a constant flow rate of 25 mL min−1. The nitrogen specification was confirmed by the laboratory technician responsible for the TGA measurements. These conditions identify the individual-feedstock experiments as pyrolysis and the blend experiments as co-pyrolysis under nitrogen. The design comprised five compositions at three heating rates, with one record per composition and rate, giving 15 records. Individual recorded initial masses and the instrument calibration, blank-correction, and any separate balance-protection-flow details were not available for assessment.
For numerical comparison, the records were placed on a common uniformly spaced temperature grid, smoothed using a cubic Savitzky–Golay filter with a reported effective temperature window of 20 °C, and differentiated numerically. The interpolation method, grid interval, filter point count, and boundary treatment must be recovered from the processing records to reproduce this procedure. The positive mass-loss-rate signal is DTG = −β(dm/dT), where β is the positive heating rate in °C min−1 and m is normalized residual mass in percent of initial mass; DTG therefore has units of % min−1. T5, T10 and T50 denote temperatures at 5%, 10% and 50% loss of initial mass. A differential thermal analysis (DTA) channel retained in some 20 °C min−1 sheets is not used here as evidence for a separate chemical identification or validated mechanistic analysis.
2.3. Additive Baseline and Quantitative Interaction Analysis
At each heating rate, the additive residual-mass prediction was calculated from the corresponding CH100 and M100 curves using Equation (1). Here, xCH is the dimensionless coffee-husk mass fraction; mCH and madd are residual masses expressed as a percent of the initial sample mass; T is temperature in °C; and β is heating rate in °C min−1. The coffee-husk fraction corresponds to the dry-mass preparation ratio. Parent and blend curves are adjusted to their initial TGA mass. Similar normalization and representative sampling are necessary for additive comparison.
madd (T,β) = xCH mCH (T,β) + (1 − xCH)mM (T,β)
The deviation of the measured blend curve from the additive forecast is defined in Equation (2) as a function of temperature. Since both masses are percentages on the same reference basis, Δm is in percentage points, abbreviated pp.
Δm(T,β) = mexp(T,β) − madd(T,β)
A negative Δm indicates that the mix has less mass than predicted additively at the same temperature and heating rate. A positive Δm suggests it holds on to more mass. These signals indicate apparent relative mass conversion, but they do not establish a particular chemical reaction, a greater output of fuel, or better recovery of energy. Deviation may also be affected by sample variability, packing and normalization problems, and apparatus drift.
The acquisition procedure was from ambient temperature to 800 °C. All the reported blend–additive comparisons were using the common numerical interval of 50–750 °C. This time span was determined in an effort to cover moisture release, main devolatilization of coffee husk and mask material, and subsequent slower mass-loss activities. The 750 °C endpoint is beyond the main decomposition zone in the reported profiles and facilitates residual-mass comparison at the same temperature for the distinct feedstocks and blends; it is not the final acquisition temperature. The 50 °C lower bound does not specify a moisture-free or dry-normalized initial state, nor does the interval specify full breakdown or a stable final residue. Minimum and maximum Δm and their temperatures, the signed temperature-average in Equation (3), and the endpoint deviation were evaluated over this same interval. The integral has units of percent points x °C. Dividing by T2 − T1 yields a mean deviation in percent points. The numerical integration method necessitates validation from the initial processing documents.
The deviance was also compared at 750 °C since this temperature is within the recorded data. Only one run per composition and heating rate is described, so repeatability and between-run uncertainty are not quantified, and no test of statistical significance is reported. Summary values represent the reported dataset rather than population means. Residues at 750 °C are thermal residues, not automatically equivalent to ash measured under a separate proximate-analysis protocol.
2.4. Kinetic Scope Versus Heating-Rate Comparison
Characteristic temperatures, DTG peak positions, and apparent mass-deviation metrics were evaluated at the three heating rates. Three independent temperature programs can support an isoconversional analysis; lack of replicates alone does not make that analysis impossible [12]. A proper kinetic evaluation would involve consistent response circumstances, assessment of baseline and smoothing sensitivity, and uncertainty reporting. In these multi-component mixes, apparent activation energies would not uniquely identify a chemical process.
3. Results and Discussion
3.1. TG/DTG Behavior at Varied Heating Rates
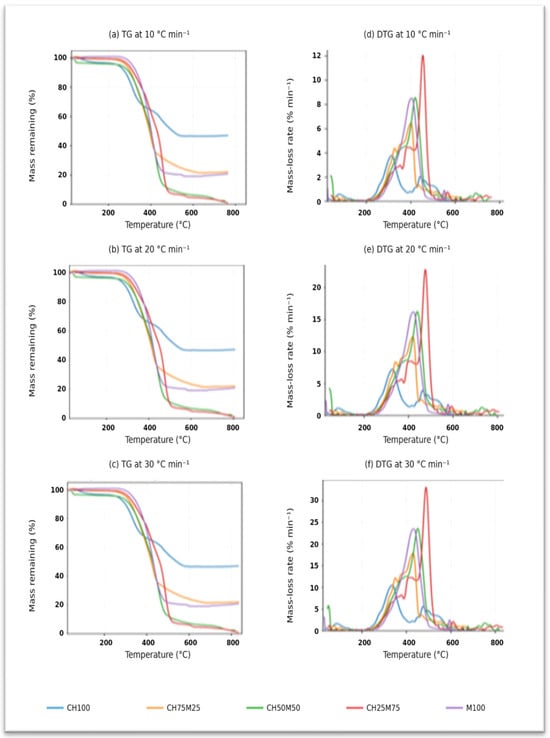
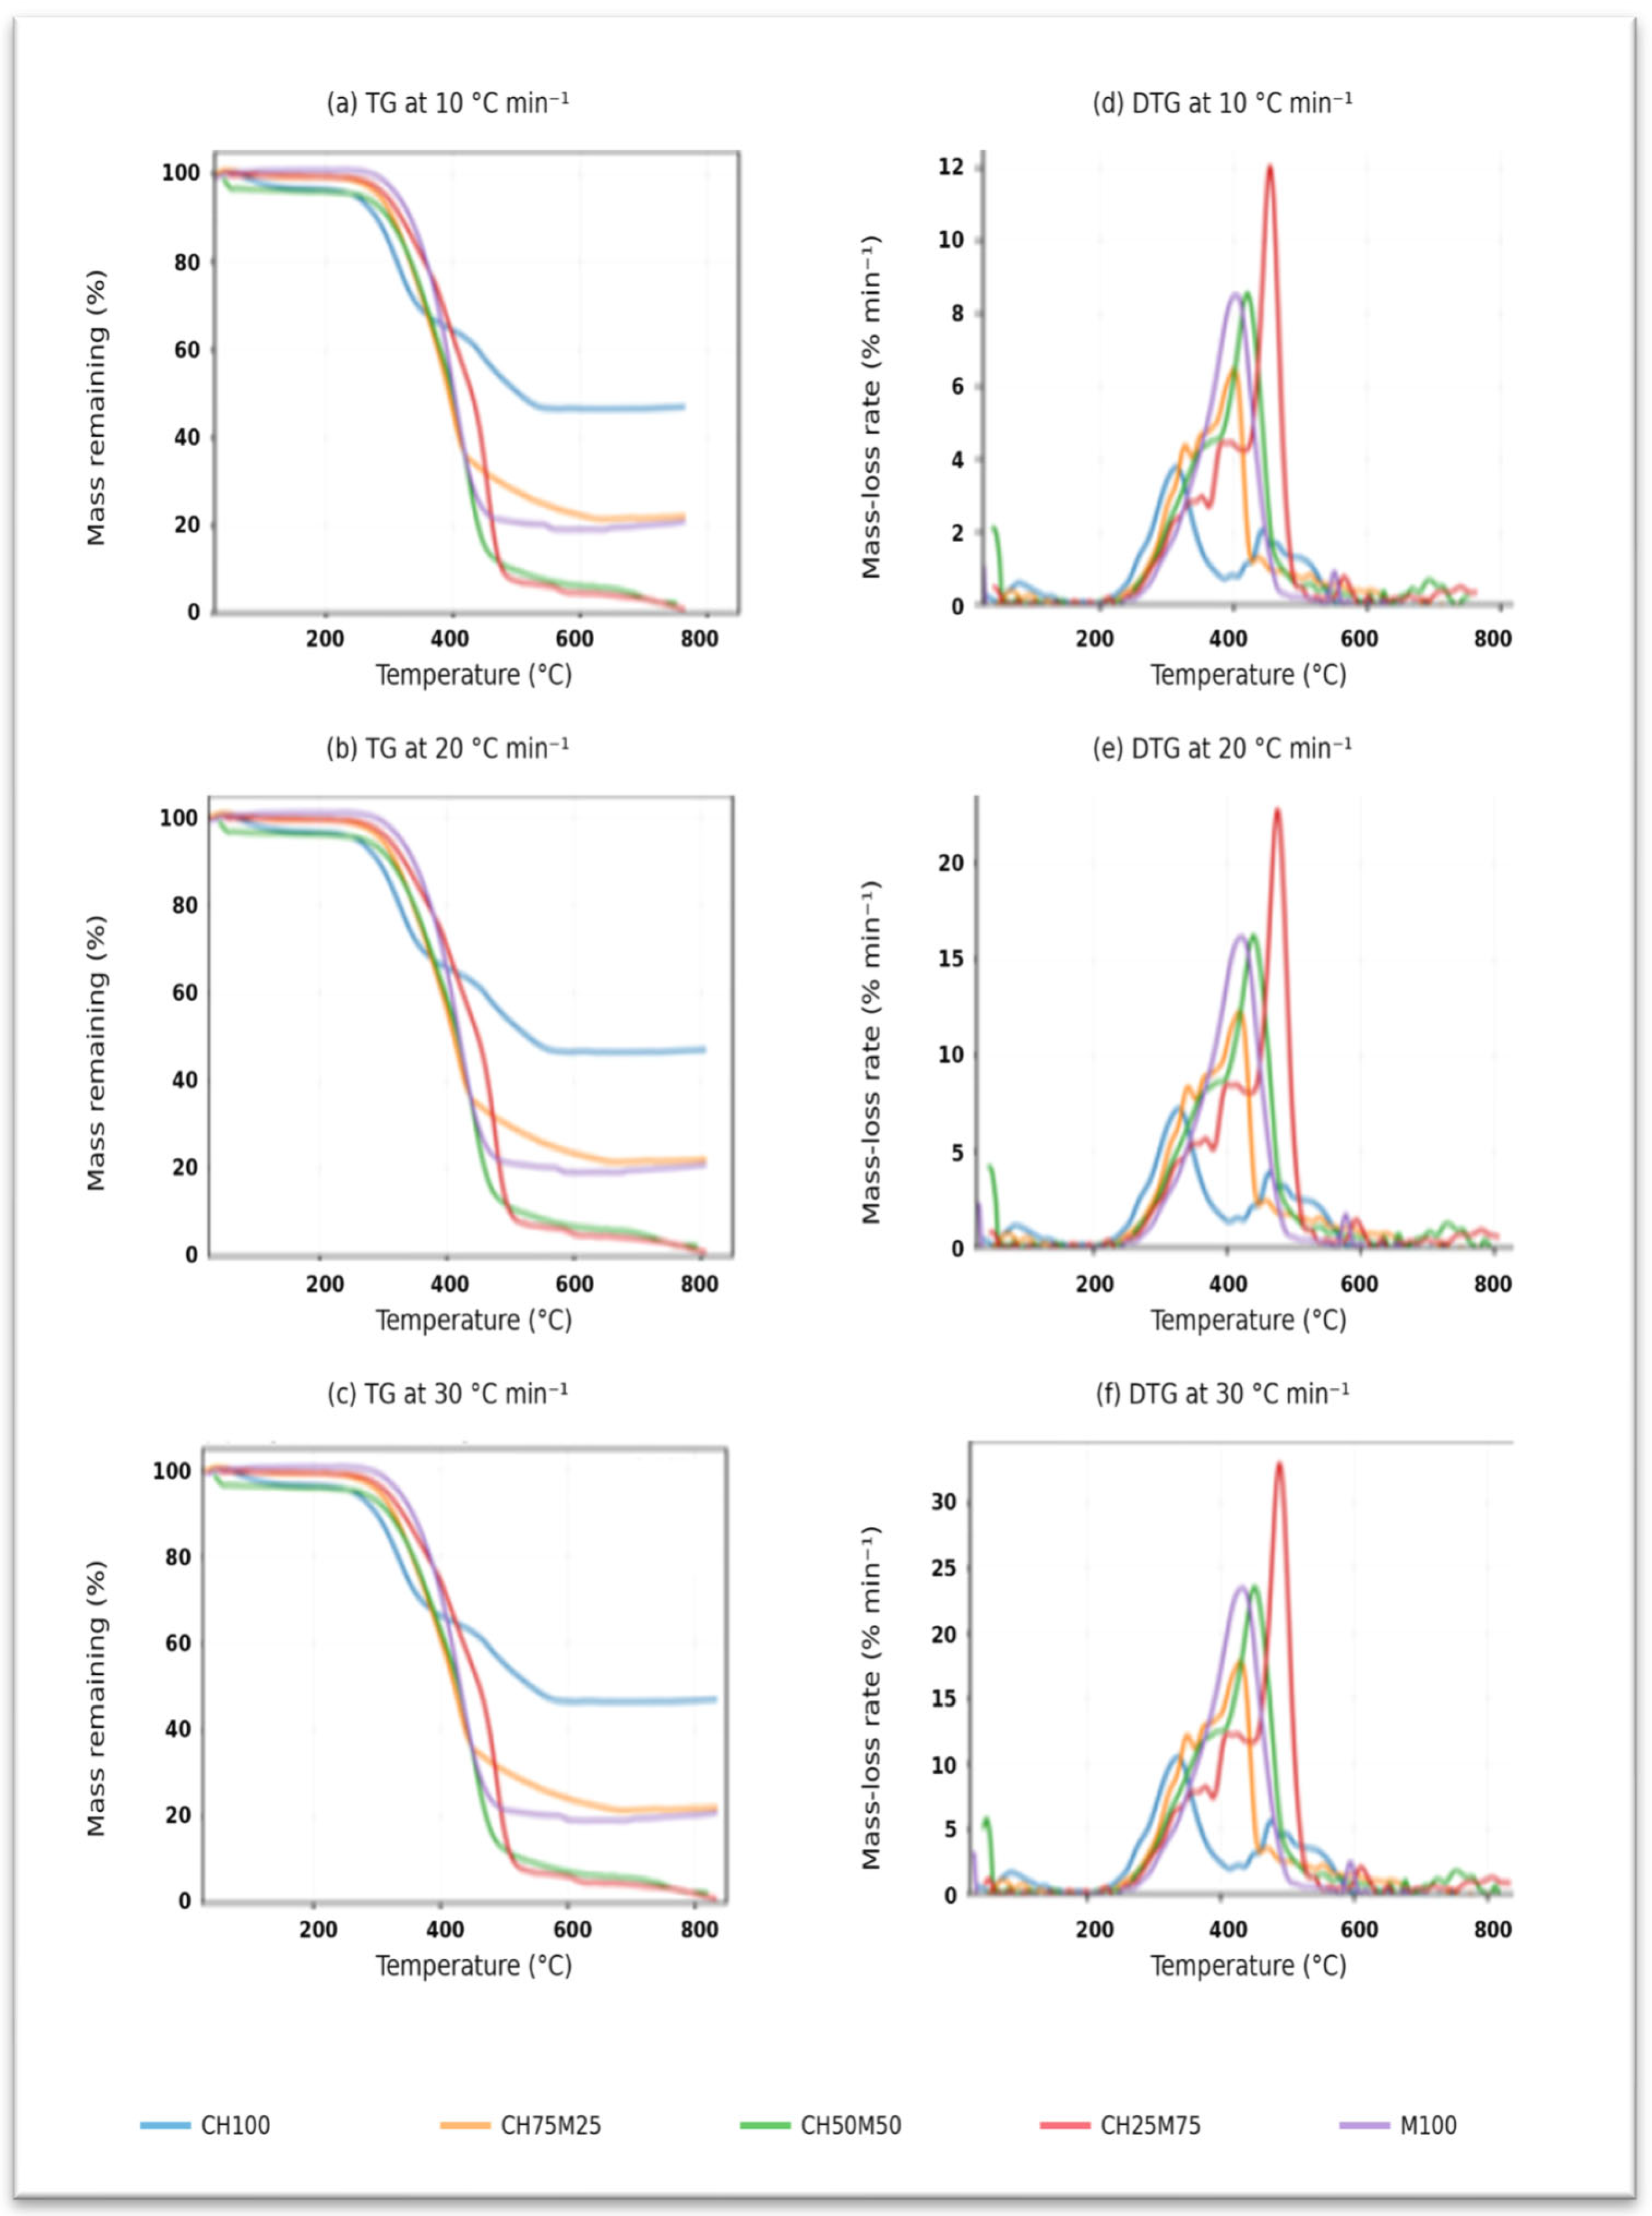
Figure 1 shows the reported TG and processed DTG responses for CH100, M100 and the three mixes at 10, 20 and 30 °C min−1. The phases of mass loss, peak temperature, peak mass-loss rate as a function of time, and residual mass are compared. But similar overall TG shapes across heating rates do not imply the same temperature dependency.
Figure 1.
TG curves (a–c) and processed DTG curves (d–f) for five coffee husk/mask mixtures at heating speeds of 10, 20, and 30 °C per minute. In the data given, an increase in the heating rate shifts the main breakdown features to higher temperatures. At any programmed temperature, less time is available for conversion, and the measured response may also depend on sample and instrument heat transfer. These effects cannot be distinguished by visual inspection alone. DTG in % min−1 is produced by multiplying −dm/dT by β; therefore, increasing the heating rate also affects the time-rate scale; a higher DTG maximum is not an independent indication of stronger chemical interaction.
The coffee-husk curve is compatible with overlapping breakdown of lignocellulosic biomass. Early loss may contain moisture and low-temperature volatiles. The main event may contain hemicellulose and cellulose degradation. Wider late-stage loss may contain lignin-derived material and secondary reactions. The main reaction is compatible with a polymer-rich disintegration event. However, TG alone cannot establish polypropylene identification or identify specific developed species [1,2]. In mixtures, overlap and changes in physical contact can alter the profile. Melting of a polymer may modify transport or contact, but it is not a mass-loss process per se. Late-stage loss is explained in terms of pyrolytic decomposition and secondary reactions under nitrogen purge without attributing it to oxidative combustion or gasification. The purge gas is defined by the given nitrogen supply specification; it is not a direct indication of residual oxygen inside the furnace.
CH50M50 and CH25M75 are low in reported late-stage residues at all three rates. However, their 750 °C residues are lower than the corresponding laboratory-reported ash indicators in Table 2; these values have not been harmonized to a common analytical basis. Differences between analytical protocols and possible inorganic loss must be considered alongside sampling, blend composition, and normalization. The reporting basis and residue comparison therefore require verification before the late-stage difference is interpreted as chemical enhancement. Agreement of blend rankings across rates does not exclude a shared systematic artifact.
3.2. Heating-Rate Dependence of Characteristic Temperatures and DTG Features
The reported maximum time-based mass-loss rate increases from 3.78 to 10.55% min−1 for CH100, from 8.52 to 23.50% min−1 for M100 and from 12.05 to 33.07% min−1 for CH25M75 between 10 and 30 °C min−1. As these numbers contain the factor β, a rise in them should not be taken as direct proof of decreased activation energy or synergism. Profiles of temperature derivatives would allow a supplementary comparison after recovering the original records. The qualitative consistency of the shifts in the heating rates with existing thermal investigations is noted, although quantitative comparability is not unqualified because of differing experimental circumstances [1,28,29]. These thermal comparisons are complementary to studies on thermochemical valorization of disposable masks [30].
3.3. Experimental-Versus-Theoretical Blend Interaction at 10, 20, and 30 °C min−1
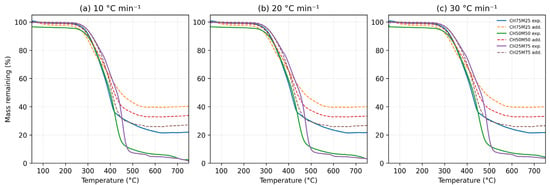
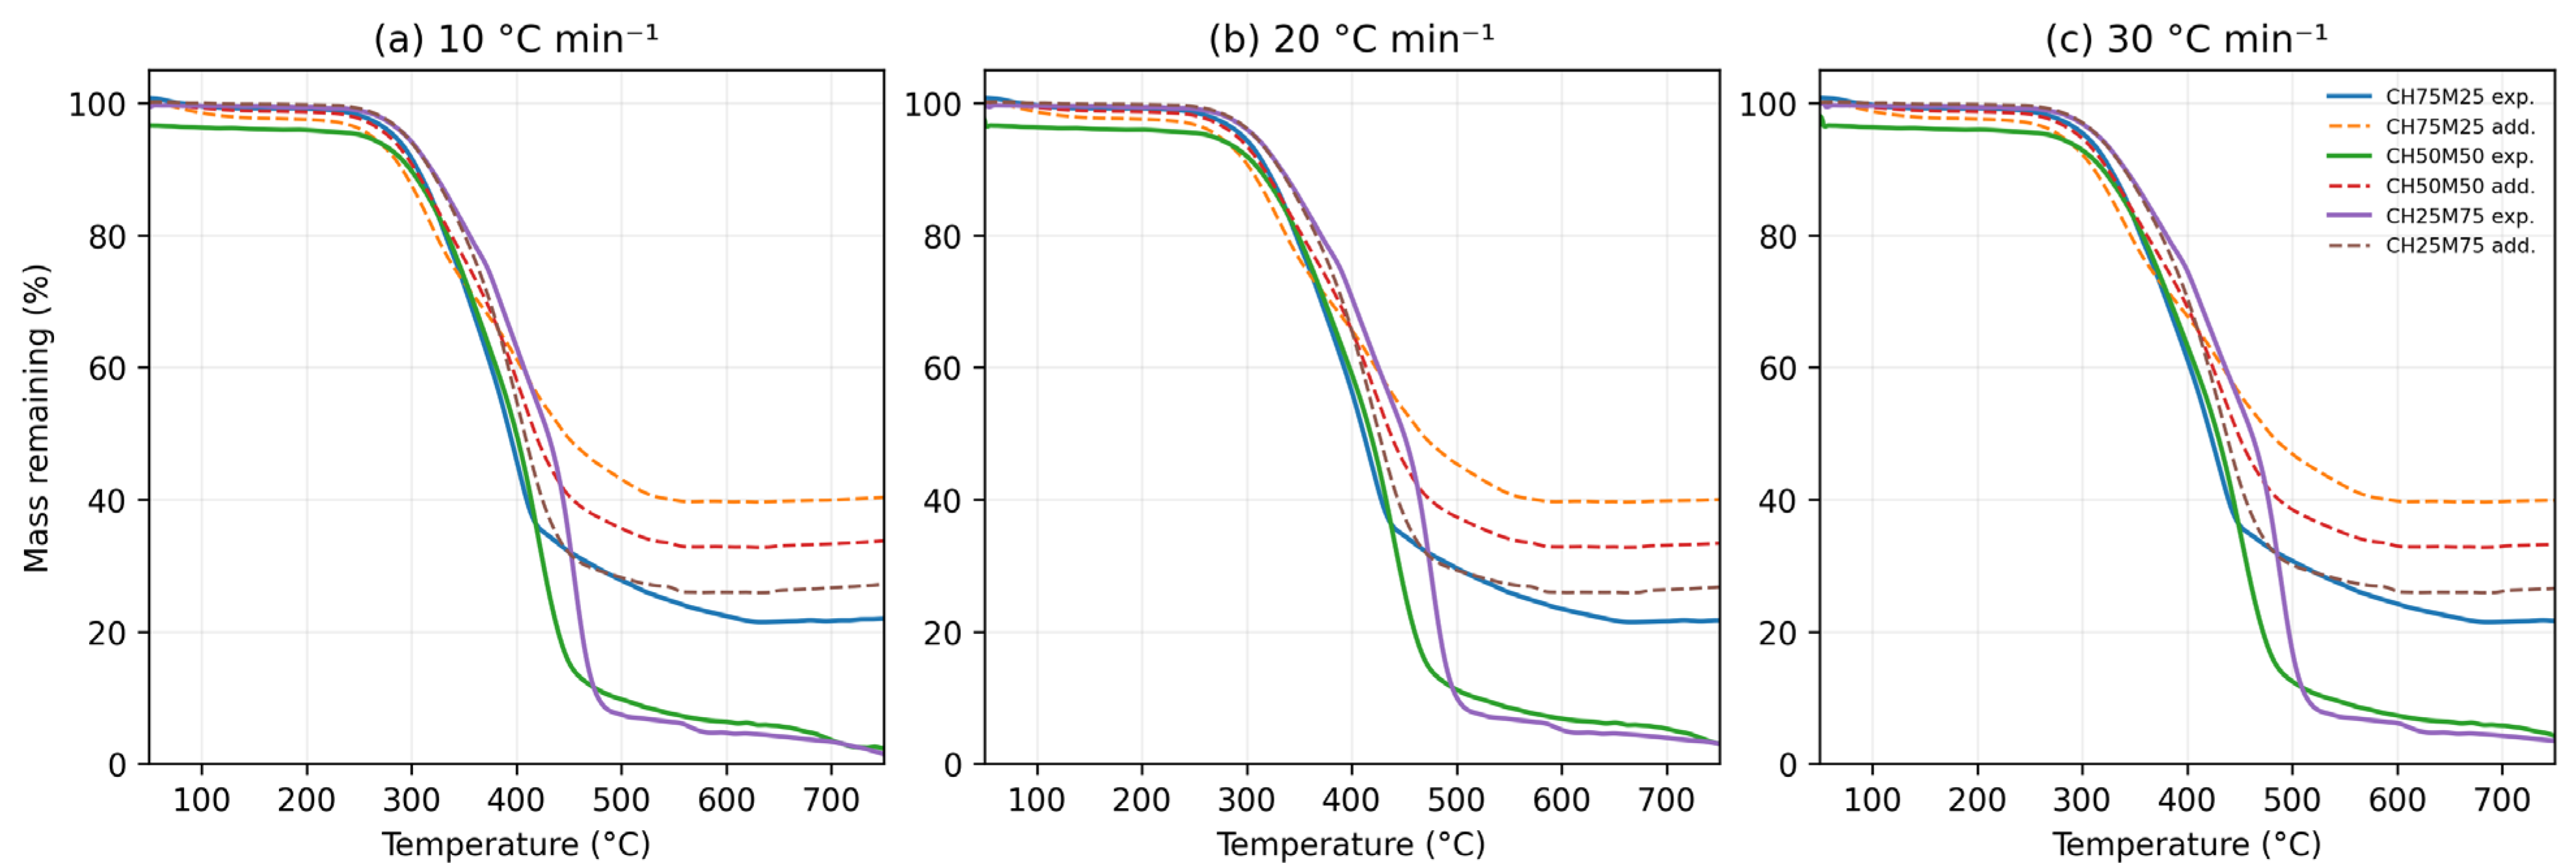
Figure 2 shows the reported blend curves compared to additive predictions at corresponding heating rates. Departures occur during and after major decomposition processes. Table 3 gives a summary of the extrema, mean deviations, and 750 °C endpoint deviations. These comparisons characterize the apparent non-additivity in the supplied dataset. They do not prove that a difference is due only to chemical interaction.
Figure 2.
Experimental and mass-weighted additive TG curves for (a) 10 (b) 20 and (c) 30 °C min−1 for CH75M25, CH50M50 and CH25M75.
Table 3.
Reported mass deviation metrics over 50–750 °C for the three blends. pp: percentage points. The ‘Maximum Δmis the largest signed value (and can be negative). Residual masses and extrema of deviations at endpoints should be verified against original records.
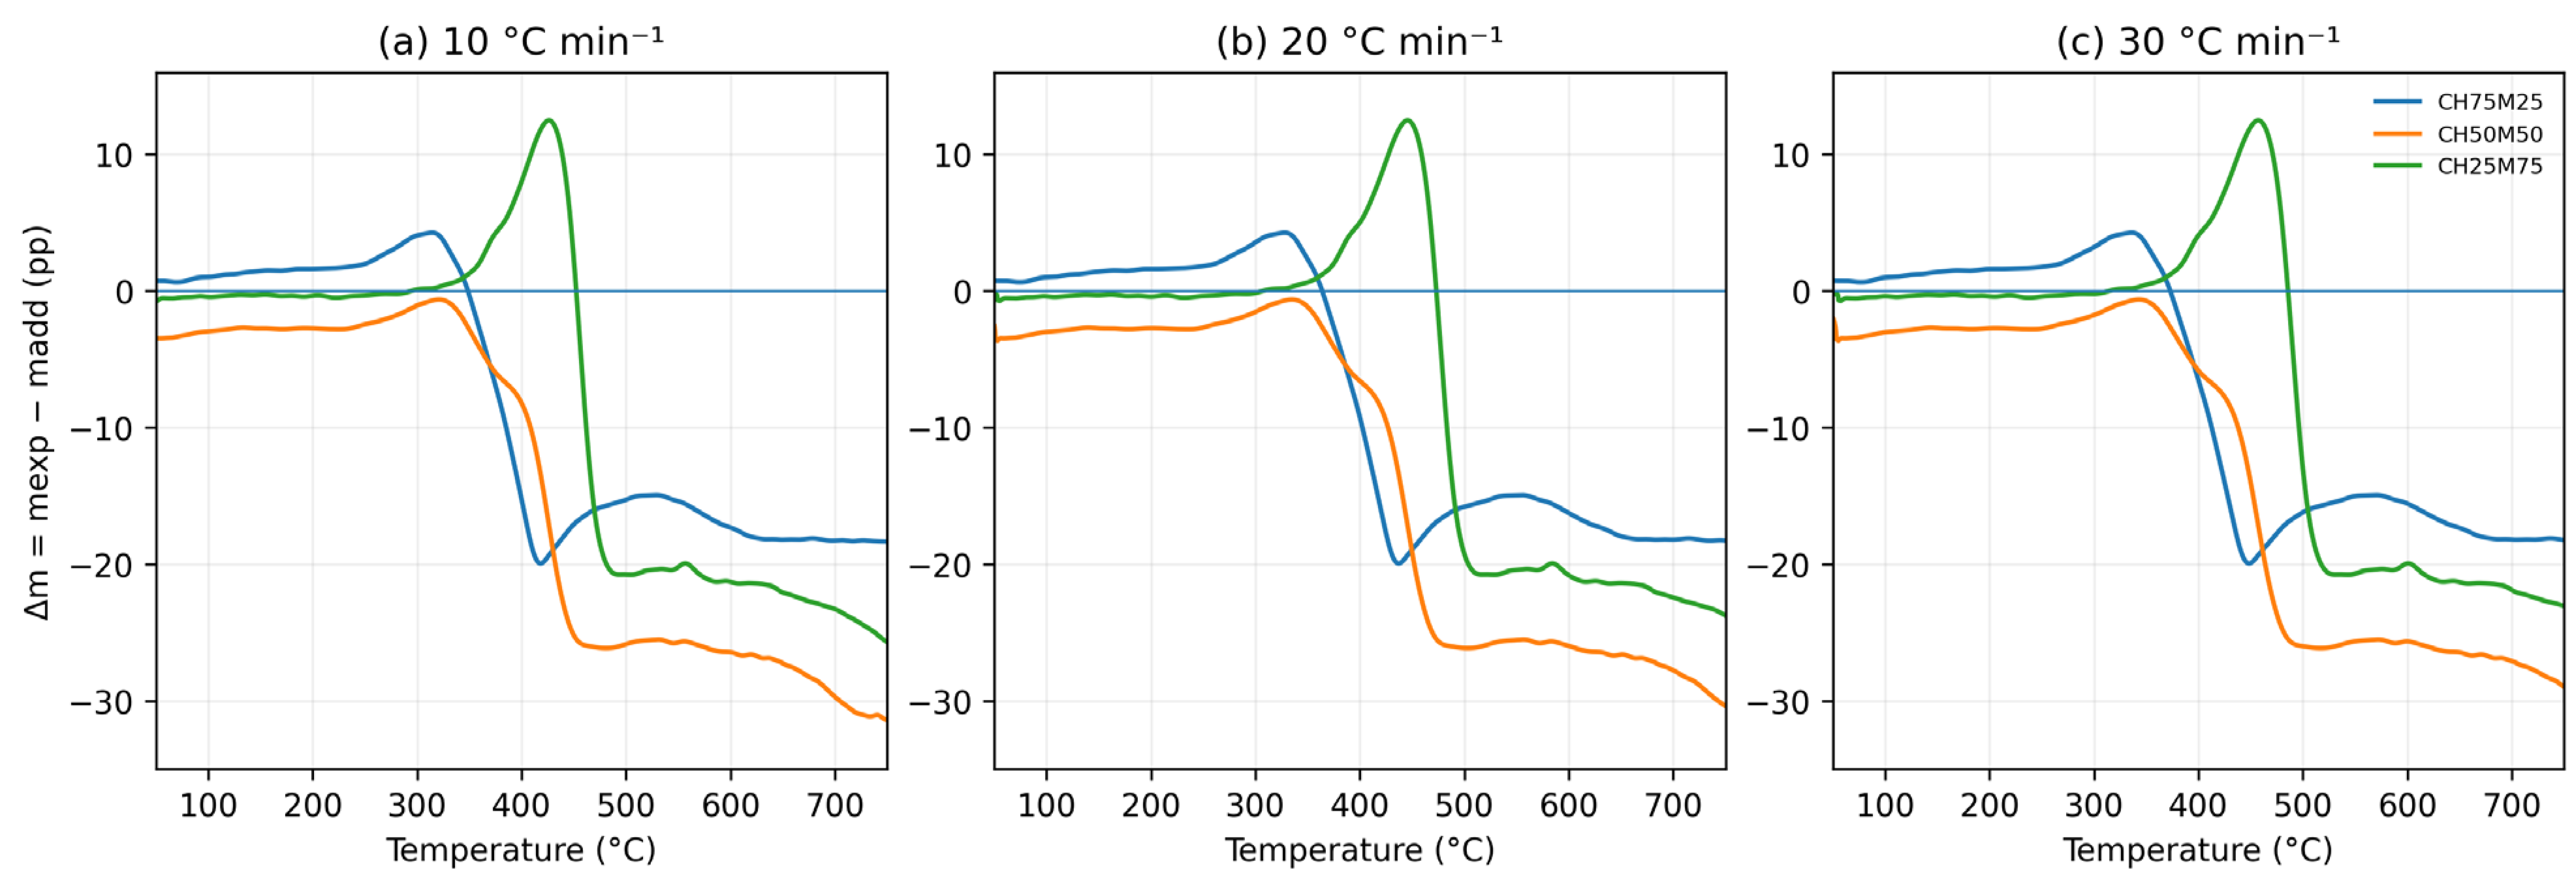
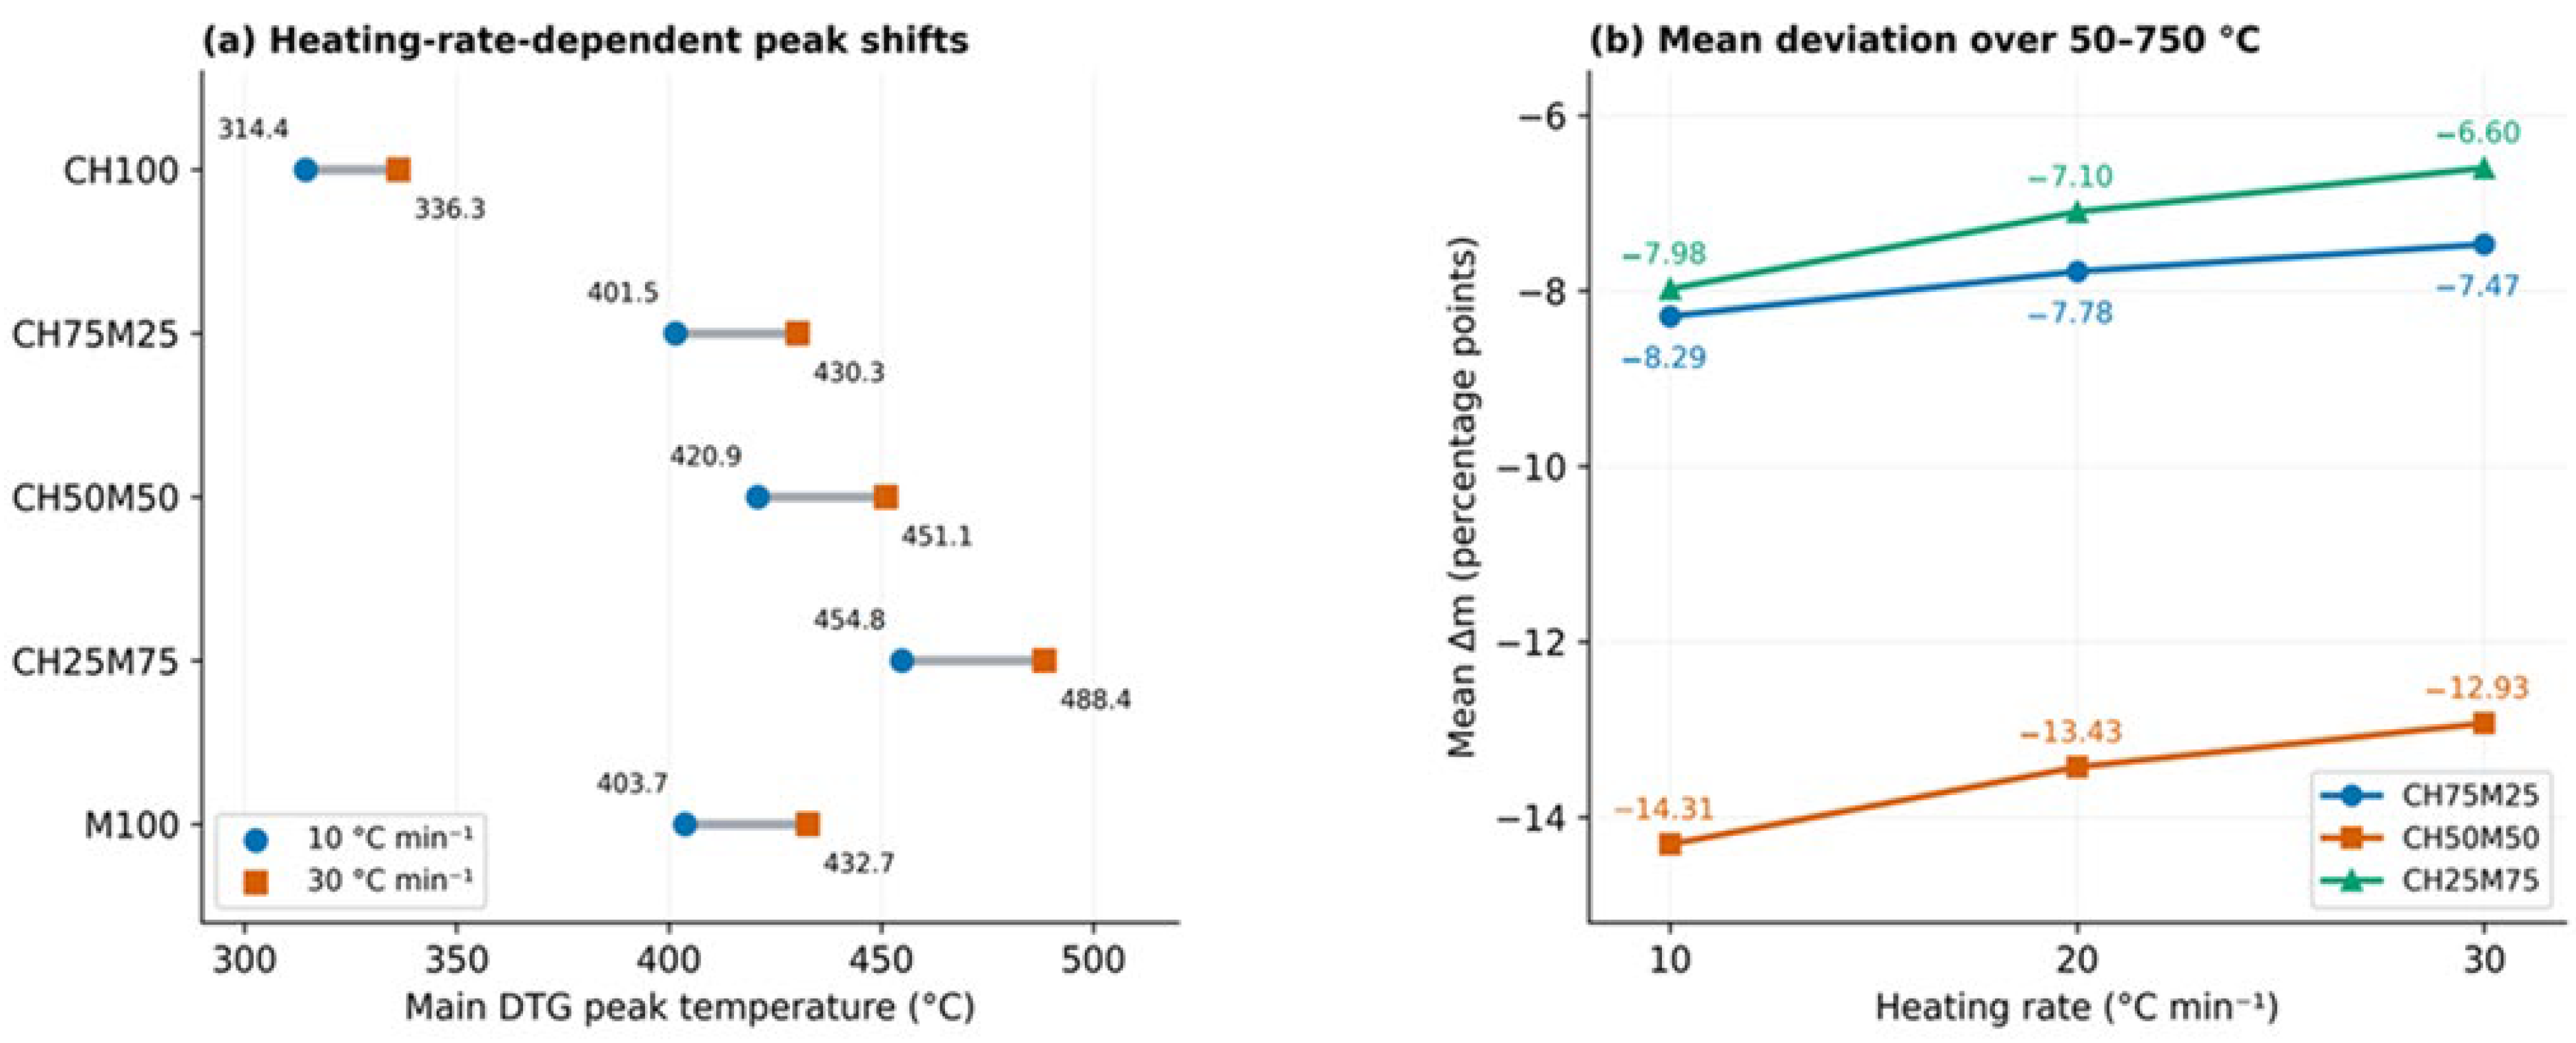
Figure 3 presents the temperature-resolved mass deviation (Δm) between the experimental and mass-weighted additive TG curves for CH75M25, CH50M50, and CH25M75 at heating rates of 10, 20, and 30 °C min−1. The largest negative mean deviation was found for the blends evaluated at each rate for CH50M50: −14.31, −13.43 and −12.93 pp at 10, 20 and 30 °C min−1, respectively (Table 3; Figure 4b). Its reported endpoint deviations are −31.36, −30.38 and −28.98 pp at 750 °C. Both other blends also have negative mean deviations. For CH50M50, the magnitude of the negative mean decreases by 1.38 pp between 10 and 30 °C min−1. These are descriptive changes without quantified repeatability; “statistically significant enhancement” is not inferred. The unusually low residues discussed in Section 3.1 limit interpretation of the endpoint differences.
Figure 3.
Temperature-resolved mass deviation for the three CH/M blends at (a) 10, (b) 20 and (c) 30 °C min−1.
Figure 4.
Summary of reported (a) primary DTG peak temperatures at 10–30 °C min−1 and (b) mean mass deviations at all three heating rates. Lines link separate reported values, not reconstructed TG curves or kinetic fits.
The sign and temperature position of the reported departures are dependent on the mix ratio and heating rate. The Δm for CH75M25 shows the minimum values of around 418, 437, and 449 °C at the three speeds. CH25M75 shows a positive interval followed by a negative departure in the late stage, with the maximum shifting from 426 to 446 and 458 °C. CH50M50 remained below is its additive reference in the range of evaluation given. The highest values of CH50M50 are hence, they are not positive-deviation peaks. Several extrema across rates are equal to two decimal places. Before interpreting this pattern physically, it is necessary to check the independence of the raw data and the processing mechanism.
Published biomass-polypropylene investigation identifies interactions between typical biomass components and polymer breakdown [13]. Other explanations for the current deviations include changed contact following polymer softening, subsequent volatile–char interactions, and mineral effects. Competing transport and data-processing theories remain plausible. A temporary positive deviation may represent delayed release or altered transport, whereas a subsequent negative deviation may represent increased loss of solid mass. TG alone does not confirm any of these candidate hypotheses [14,15].
The CH100 main DTG peak shifts from 314.4 °C at 10 °C min−1 to 328.3 °C at 20 °C min−1 and 336.3 °C at 30 °C min−1. The corresponding M100 values are 403.7, 421.6, and 432.7 °C. Thus, the endpoint shifts are 21.9 and 29.0 °C for CH100 and M100. Across 10–30 °C min−1, the reported blend peak shifts are 401.5–430.3 °C for CH75M25, 420.9–451.1 °C for CH50M50 and 454.8–488.4 °C for CH25M75. The alterations in the endpoints are summarized in Figure 4a, showing the differences even when the TG forms overlap. Peak comparisons with other studies require comparable atmosphere, heating rate, sample size, and preparation.
3.4. Comparison with Published Studies and Implications for Co-Processing
The present contribution is a comparison of coffee-husk/mask mixtures using temperature-resolved, heating-rate-matched additive references. It does not introduce a new non-additivity method. Among the three tested blends, CH50M50 has the most negative reported mean deviation at each rate and may be included as a candidate in further controlled experiments once data consistency is established. This result does not identify an optimum for batch or continuous reactors, which have different heat transfer, mixing, residence time, and product-recovery conditions.
Combining thermogravimetric measurements with chemical characterization and product analysis provides complementary evidence for interpreting decomposition pathways and possible interactions [2,27]. Yousef et al. [2] combined mask thermal analysis with Fourier transform infrared spectroscopy (FTIR) and GC–MS, while Idris et al. [27] examined spent-coffee-ground/disposable face-mask kinetics and Py-GC/MS product composition. These studies provide relevant pyrolysis/co-pyrolysis context for the present nitrogen-atmosphere experiments. Their evolved-gas and product findings cannot be assigned directly to the present coffee-husk and prepared mask-assembly samples. The present work includes feedstock elemental characterization alongside TG/DTG, but no FTIR, Raman, or evolved-product measurements. Elemental composition characterizes the bulk feedstock; it does not identify the molecular species released during decomposition. DTG is derived from the TG signal rather than an independent chemical measurement. Analyzes of experimental pyrolysis methods offer additional insight for mechanistic characterization [31]. The outcomes related to the catalytic pyrolysis of polylactic acid and its composites [32] involve diverse polymers and catalytic conditions, making direct assignment to the present samples unfeasible.
Table 1 places the study alongside coffee-husk kinetics, mask characterization, and the directly related spent-coffee-ground/mask work. The distinction is the tested feedstock and the temperature-resolved comparison, not a claim that coffee waste and mask blends are unexplored. Lower retained mass cannot establish a greater gas yield, higher calorific value, reduced emissions, or better resource recovery. Such results need product composition, mass and energy balances, and proper reactor measurements. Cross-rate screening ranking should be used to choose trials, not to prescribe a commercial operational formulation even after validation. Literature centered on products encompasses mask pyrolysis/steam gasification [33], mask conversion within an updraft gasifier [34], coffee-husk gasification in reactive environments [35], and analyzes of combustible gas generation from biomass–plastic co-pyrolysis [36]. The various process variables do not determine the gasification efficacy for the current nitrogen-atmosphere TGA trials.
3.5. Kinetic and Mechanistic Verification: Limitations and Demands
Three heating rates are a good starting point for kinetic analysis as recommended by the International Confederation for Thermal Analysis and Calorimeter (ICTAC) [12]. Future confirmed studies should define conversion on a physically justifiable decomposition interval, isolate drying when feasible, and compare relevant isoconversional estimates over conversion. One residual degree of freedom is associated with a three-point linear fit with just three rates, and derivative noise, smoothing, and baseline selection can considerably impact the result. Replicate runs give robustness to the uncertainty evaluation, but their absence is not the only reason to withhold kinetic estimates. No stated activation-energy trend or reaction model is presented here without the original data and diagnostics.
The interpretation has five major limitations. First, the TGA repeatability cannot be estimated because there is only one TGA record per composition and heating rate, and repeated elemental determinations do not give replicate thermal runs. Second, the person who recorded starting masses, instrument calibration and blank-correction, and the full processing settings is not available for review. Thirdly, the reporting basis of the original composition data, the oxygen closure, and the unexpectedly low thermal residues relative to the stated ash indicators need to be reconciled. Fourth, the additive comparison relies on consistent normalization and representative blending, which can be influenced by sampling, packing, and processing. Fifth, no measures of the developed products identify the species accountable for the mass loss. The M100 is also a heterogeneous material because of the retained ear loops and three layers of mask. These constraints restrict chemical-mechanism and product-performance claims without altering the specified nitrogen co-pyrolysis conditions.
Further work should include an audit of acquisition and processing records, reconciliation of ash and thermal residue data, and replicate TGA measurements. Sample-specific characterization such as attenuated total reflectance Fourier transform infrared spectroscopy (ATR-FTIR) could help establish the polymers in the retained layers and ear loops. Sample-loading and purge-flow sensitivity should also be assessed. Coupled TG-FTIR or TG-MS, product analysis, and reactor-scale mass and energy balances would provide additional evidence for kinetic, mechanistic, and practical co-processing assessment.
4. Conclusions
Coffee-husk/surgical-mask co-pyrolysis under nitrogen produced reported TG responses that depart from heating-rate-matched additive references within the common 50–750 °C evaluation interval. The acquisition program extended from ambient temperature to 800 °C, with a nominal 5 mg loading in alumina crucibles and a nitrogen flow of 25 mL min−1. The main DTG peaks migrated to higher temperatures with increasing heating rate; the time-based variations in DTG magnitude scaled with heating rate. CH50M50 had the most negative reported mean deviation among the tested blends, with values of −14.31, −13.43, and −12.93 percentage points at 10, 20, and 30 °C min−1. CH25M75 showed a transitory positive deviation followed by a negative late-stage departure. These observations support selection of blends for further controlled co-pyrolysis experiments. Lack of replicate TGA runs and incomplete ash–thermal-residue reconciliation limit mechanistic interpretation. The results do not establish gasification performance, evolved-product yields, reduced activation energy, or an optimum reactor formulation.
Author Contributions
Conceptualization, D.T.W., V.R.A. and S.M.A.; methodology, D.T.W., V.R.A. and S.M.A.; validation, V.R.A., S.M.A. and E.A.; formal analysis, D.T.W. and V.R.A.; investigation, D.T.W.; data curation, D.T.W.; writing—original draft preparation, D.T.W. and S.M.A.; writing—review and editing, V.R.A., S.M.A. and E.A.; visualization, V.R.A., S.M.A. and E.A.; supervision, V.R.A., S.M.A. and E.A.; project administration, D.T.W. and V.R.A.; funding acquisition, V.R.A. All authors have read and agreed to the published version of the manuscript.
Funding
Partial financial support was given by Jimma University Research and Publication Office. The article processing charge was funded by the University of Rostock within the Excellence in Science and Technology initiative (ExiST–KfW project 51325; BMZ No. 201166305).
Data Availability Statement
The thermogravimetric workbooks and processed data underlying the reported results are available from the corresponding author upon reasonable request. Reproducibility additionally requires the original acquisition metadata, sample preparation records, and processing procedure; these should accompany any data release.
Acknowledgments
Publication support from University of Rostock towards APC payment through Excellence in Science and Technology (ExiST-KfW project 51325 BMZ No. 201166305) project agreement is gratefully acknowledged. JU Research and Publication office is also to be acknowledged for partial financial support.
Conflicts of Interest
The authors declare no conflict of interest.
References
- Mukherjee, A.; Okolie, J.A.; Tyagi, R.; Dalai, A.K.; Niu, C. Pyrolysis kinetics and activation thermodynamic parameters of exhausted coffee residue and coffee husk using thermogravimetric analysis. Can. J. Chem. Eng. 2021, 99, 1683–1695. [Google Scholar] [CrossRef] [Scilit]
- Yousef, S.; Eimontas, J.; Striūgas, N.; Abdelnaby, M.A. Pyrolysis kinetic behaviour and TG-FTIR-GC–MS analysis of Coronavirus Face Masks. J. Anal. Appl. Pyrolysis 2021, 156, 105118. [Google Scholar] [CrossRef] [Scilit]
- Sun, X.; Liu, Z.; Shi, L.; Liu, Q. Pyrolysis of COVID-19 disposable masks and catalytic cracking of the volatiles. J. Anal. Appl. Pyrolysis 2022, 163, 105481. [Google Scholar] [CrossRef] [Scilit]
- Afessa, M.M.; Locaspi, A.; Debiagi, P.; Frassoldati, A.; Caraccio, R.; Ramayya, A.V.; Faravelli, T. Pyrolysis of large biomass particles: Model validation and application to coffee husks valorization. J. Anal. Appl. Pyrolysis 2025, 188, 107028. [Google Scholar] [CrossRef] [Scilit]
- Ali, M.A.; Bhowmik, S. Bioactive compounds in coffee husk: Extraction, functional properties, applications, and sustainable approach in circular economy. RSC Sustain. 2025, 3, 4410–4425. [Google Scholar] [CrossRef] [Scilit]
- Tamilselvan, K.; Sundarajan, S.; Ramakrishna, S.; Amirul, A.-A.A.; Vigneswari, S. Sustainable valorisation of coffee husk into value added product in the context of circular bioeconomy: Exploring potential biomass-based value webs. Food Bioprod. Process. 2024, 145, 187–202. [Google Scholar] [CrossRef] [Scilit]
- Dharmaraj, S.; Ashokkumar, V.; Hariharan, S.; Manibharathi, A.; Show, P.L.; Chong, C.T.; Ngamcharussrivichai, C. The COVID-19 pandemic face mask waste: A blooming threat to the marine environment. Chemosphere 2021, 272, 129601. [Google Scholar] [CrossRef] [Scilit]
- Selvaranjan, K.; Navaratnam, S.; Rajeev, P.; Ravintherakumaran, N. Environmental challenges induced by extensive use of face masks during COVID-19: A review and potential solutions. Environ. Chall. 2021, 3, 100039. [Google Scholar] [CrossRef] [Scilit]
- Torres, F.G.; De-la-Torre, G.E. Face mask waste generation and management during the COVID-19 pandemic: An overview and the Peruvian case. Sci. Total Environ. 2021, 786, 147628. [Google Scholar] [CrossRef] [Scilit]
- Hou, E.J.; Hsieh, Y.Y.; Hsu, T.W.; Huang, C.S.; Lee, Y.C.; Han, Y.S.; Chu, H.T. Using the concept of circular economy to reduce the environmental impact of COVID-19 face mask waste. Sustain. Mater. Technol. 2022, 33, e00475. [Google Scholar] [CrossRef] [Scilit]
- Fellner, J.; Brunner, P.H. Plastic waste management: Is circular economy really the best solution? J. Mater. Cycles Waste Manag. 2022, 24, 1–3. [Google Scholar] [CrossRef] [Scilit]
- Vyazovkin, S.; Burnham, A.K.; Criado, J.M.; Pérez-Maqueda, L.A.; Popescu, C.; Sbirrazzuoli, N. ICTAC Kinetics Committee recommendations for performing kinetic computations on thermal analysis data. Thermochim. Acta 2011, 520, 1–19. [Google Scholar] [CrossRef] [Scilit]
- Chen, R.; Zhang, S.; Cong, K.; Li, Q.; Zhang, Y. Insight into synergistic effects of biomass-polypropylene co-pyrolysis using representative biomass constituents. Bioresour. Technol. 2020, 307, 123243. [Google Scholar] [CrossRef] [Scilit]
- Engamba Esso, S.B.; Xiong, Z.; Chaiwat, W.; Kamara, M.F.; Longfei, X.; Xu, J.; Ebako, J.; Jiang, L.; Su, S.; Hu, S.; et al. Review on synergistic effects during co-pyrolysis of biomass and plastic waste: Significance of operating conditions and interaction mechanism. Biomass Bioenergy 2022, 159, 106415. [Google Scholar] [CrossRef] [Scilit]
- Tan, C.H.; Arifin, N.A.; Hafriz, R.S.R.M.; Nomanbhay, S.; Shamsuddin, A.H. Co-pyrolysis of biomass and plastic: Circularity of wastes and comprehensive review of synergistic mechanism. Results Eng. 2023, 17, 100989. [Google Scholar] [CrossRef] [Scilit]
- Ansari, K.B.; Hassan, S.Z.; Bhoi, R.; Ahmad, E. Co-pyrolysis of biomass and plastic wastes: A review on reactants synergy, catalyst impact, process parameter, hydrocarbon fuel potential, COVID-19. J. Environ. Chem. Eng. 2021, 9, 106436. [Google Scholar] [CrossRef] [Scilit]
- Deng, J.; Yi, B.; Mašek, O.; Yuan, X.; Hwang, S.Y.; Ong, H.C.; Hua, Z.; Ok, Y.S. Co-pyrolysis of biomass and plastic waste into carbon materials with environmental applications: A critical review. Green Chem. 2025, 27, 6320–6341. [Google Scholar] [CrossRef] [Scilit]
- Wang, Z.; Burra, K.G.; Lei, T.; Gupta, A.K. Co-pyrolysis of waste plastic and solid biomass for synergistic production of biofuels and chemicals—A review. Prog. Energy Combust. Sci. 2021, 84, 100899. [Google Scholar] [CrossRef] [Scilit]
- Fang, Y.; Tang, Y.; Li, G.; Song, M.; Ye, C.; Guo, W.; Wang, L.; Cen, J.; Ma, J.; Zheng, Y. Co-pyrolysis of waste biomass and plastics from food packaging waste: Pyrolysis characteristics, synergetic effects, and reaction kinetics. J. Environ. Manag. 2025, 395, 127800. [Google Scholar] [CrossRef] [Scilit]
- Mariyam, S.; Parthasarathy, P.; Pradhan, S.; Al-Ansari, T. Co-pyrolysis of biomass and binary single-use plastics: Synergy, kinetics, and thermodynamics. Int. J. Sustain. Energy 2024, 43, 2168003. [Google Scholar] [CrossRef] [Scilit]
- Olalo, J. Thermogravimetric and synergy analysis of the co-pyrolysis of coconut husk and laminated plastic packaging for biofuel production. Energy Eng. 2022, 119, 555–567. [Google Scholar] [CrossRef] [Scilit]
- Stančin, H.; Mikulčić, H.; Manić, N.; Stojiljković, D.; Vujanović, M. Thermogravimetric and kinetic analysis of waste biomass and plastic mixtures. J. Sustain. Dev. Energy Water Environ. Syst. 2023, 11, 1110469. [Google Scholar] [CrossRef] [Scilit]
- Stančin, H.; Mikulčić, H.; Manić, N.; Stojiljković, D.; Vujanović, M.; Wang, X.; Duić, N. Thermogravimetric and kinetic analysis of biomass and polyurethane foam mixtures co-pyrolysis. Energy 2021, 237, 121592. [Google Scholar] [CrossRef] [Scilit]
- Jiang, P.; She, W.; Zhang, H.; Li, L.; Lin, H.; Ji, T.; Mu, L.; Lu, X.; Zhu, J. Unlocking the synergistic effects in biomass-plastic co-pyrolysis using a hybrid machine learning approach with blended rule descriptors. Biomass Bioenergy 2025, 201, 108130. [Google Scholar] [CrossRef] [Scilit]
- Prasertpong, P.; Onsree, T.; Khuenkaeo, N.; Tippayawong, N.; Lauterbach, J. Exposing and understanding synergistic effects in co-pyrolysis of biomass and plastic waste via machine learning. Bioresour. Technol. 2023, 369, 128419. [Google Scholar] [CrossRef] [Scilit]
- Zeng, Y.; Xu, C.; Tian, X.; Ke, L.; Cobb, K.; Zhou, N.; Liu, Y.; Ruan, R.; Yang, J.; Wang, Y. Synergistic effects of biomass-plastic co-pyrolysis: Enhanced performance with microwave assistance and biomass type variability. Energy 2026, 342, 139602. [Google Scholar] [CrossRef] [Scilit]
- Idris, I.A.; Nisamaneenate, J.; Atong, D.; Kaewpengkrow, P.R.; Sricharoenchaikul, V. Investigating the synergy of fast co-pyrolysis of spent coffee ground and disposed urban facemask: Analysis of kinetics and product compositions. Environ. Chall. 2025, 21, 101344. [Google Scholar] [CrossRef] [Scilit]
- Salema, A.A.; Mohd Zaifullizan, Y.; Wong, W.H. Pyrolysis and combustion kinetics of disposable surgical face mask produced during Covid-19 pandemic. Energy Sources Part A Recovery Util. Environ. Eff. 2022, 44, 566–576. [Google Scholar] [CrossRef] [Scilit]
- Singh, S.; Tagade, A.; Verma, A.; Sharma, A.; Tekade, S.P.; Sawarkar, A.N. Insights into kinetic and thermodynamic analyses of co-pyrolysis of wheat straw and plastic waste via thermogravimetric analysis. Bioresour. Technol. 2022, 356, 127332. [Google Scholar] [CrossRef] [Scilit]
- Jung, S.; Lee, S.; Dou, X.; Kwon, E.E. Valorization of disposable COVID-19 mask through the thermo-chemical process. Chem. Eng. J. 2021, 405, 126658. [Google Scholar] [CrossRef] [Scilit]
- Nanduri, A.; Kulkarni, S.S.; Mills, P.L. Experimental techniques to gain mechanistic insight into fast pyrolysis of lignocellulosic biomass: A state-of-the-art review. Renew. Sustain. Energy Rev. 2021, 148, 111262. [Google Scholar] [CrossRef] [Scilit]
- Alsouleman, K.; Pal, S.K.; Giridara Srinivaas, M.S.; Behrendt, F.; Vinu, R. Effect of HZSM-5 catalyst on product distribution of pyrolysis of PLA and PBAT/PLA blend. J. Mater. Cycles Waste Manag. 2026, 28, 3157–3176. [Google Scholar] [CrossRef] [Scilit]
- Kiminaitė, I.; González-Arias, J.; Striūgas, N.; Eimontas, J.; Seemann, M. Syngas production from protective face masks through pyrolysis/steam gasification. Energies 2023, 16, 5417. [Google Scholar] [CrossRef] [Scilit]
- Yousef, S.; Eimontas, J.; Zakarauskas, K.; Jančauskas, A.; Striūgas, N. An eco-friendly strategy for recovery of H2-CH4-rich syngas, benzene-rich tar and carbon nanoparticles from surgical mask waste using an updraft gasifier system. Energy Sources Part A Recover. Util. Environ. Eff. 2023, 45, 5063–5080. [Google Scholar] [CrossRef] [Scilit]
- Nam, N.H.; Ngoc, C.T.A.; Bay, T.V. Investigation on gasification of coffee husk in CO2, H2O, and mixed atmospheres. Vietnam J. Chem. 2021, 59, 775–780. [Google Scholar] [CrossRef] [Scilit]
- Luo, X.; Li, J.; Xu, K.; Fang, Y.; Yu, J.; Li, S. Synergistic co-pyrolysis of biomass and waste plastics for enhanced combustible gas production: A comprehensive review. Process Saf. Environ. Prot. 2026, 213, 108954. [Google Scholar] [CrossRef] [Scilit]

Disclaimer/Publisher’s Note: The statements, opinions and data contained in all publications are solely those of the individual author(s) and contributor(s) and not of MDPI and/or the editor(s). MDPI and/or the editor(s) disclaim responsibility for any injury to people or property resulting from any ideas, methods, instructions or products referred to in the content. |
© 2026 by the authors. Licensee MDPI, Basel, Switzerland. This article is an open access article distributed under the terms and conditions of the Creative Commons Attribution (CC BY) license.