


Abstract
Data centers are a critical component of digital infrastructure, and their expansion in the artificial intelligence era raises concerns about environmental pressures and potential implications for human health. This systematic review and evidence map synthesized evidence on data-center-related environmental pressures, exposures and health impacts. Bibliographic databases, Google Scholar, preprint servers, gray literature and citation searching were used to identify eligible studies. Methodological quality was assessed using QualSyst or the JBI checklist, and each result was classified along a four-level pathway from environmental pressure to population exposure, modeled health impact and observed health outcome (PROSPERO CRD420261502966). Thirty-six studies yielding 112 quantitative estimates were included. The most downstream level reached was environmental pressure only in 18 studies (50.0%), population exposure in 12 (33.3%) and modeled health impact in only six (16.7%); no study reached the observed-health-outcome level. Across heterogeneous satellite, modeling, and field-monitoring studies, reported localized temperature differences ranged from 0.35 to 2.07 °C, with preliminary evidence of vegetation loss. Exposure assessment was predominantly model-based (26/36), and all six studies reaching the health-impact level estimated rather than observed health outcomes; four of these six studies were preprints. Environmental pressures attributable to data-center activity have been quantified across multiple domains, but evidence linking these pressures to human health remains limited to modeled health impacts. No included study evaluated observed human-health outcomes using epidemiological or clinical data. Therefore, the current evidence base does not establish whether data-center-related exposures are associated with health effects in exposed populations.
1. Introduction
Data centers are a core component of global digital infrastructure, and the diffusion of generative artificial intelligence (AI) is accelerating their expansion. At the same time, AI applications are expanding across clinical and public-health domains, including infectious-disease management, antimicrobial stewardship, and population-level forecasting and early-warning systems [1,2,3,4]. Global data-center electricity consumption was approximately 415 TWh in 2024, about 1.5% of the global total, and is projected to reach around 945 TWh by 2030 [5]. This growth is not evenly distributed, and capacity clusters regionally, so that national averages may fail to capture pressures concentrated around individual facilities or facility clusters [6]. In the European Union, for instance, data centers accounted for an estimated 1.8–2.6% of total electricity use in 2022, but for approximately 18% in Ireland [7]. Facilities range from enterprise and colocation sites to hyperscale campuses whose site-level electricity demand reaches hundreds of megawatts [8].
Data-center operation generates environmental pressures through two distinct sets of pathways. The first arises at or near the site: air pollutants from on-site backup generation and, increasingly, gas turbines; noise from cooling equipment and generator testing; and rejected heat [9]. The second comprises resource-mediated or life-cycle pressures, including water demand associated with cooling and electricity generation, emissions from off-site power plants, and greenhouse-gas emissions. Land-use and vegetation changes may additionally arise from facility siting and construction [10,11]. A single large facility may use several million gallons of water per day, with a substantial share of direct consumption drawn from potable supplies in some settings, and indirect requirements can exceed direct on-site consumption several-fold at the national scale [12,13]. For this review, we distinguish environmental pressures generated by data-center operation from population exposures arising when these pressures reach human receptors. Both direct facility-level pathways and indirect resource-mediated pathways are considered where they are explicitly attributable to data-center activity.
Some of these pressures correspond to exposures with well-established health effects: ambient air pollution, environmental noise and heat are recognized contributors to cardiovascular, respiratory, sleep-related and mental-health risks [14,15,16]. Others, such as water withdrawal, greenhouse-gas emissions and land-use change, act on human health through longer and less-direct causal chains. For climate-related pathways, downstream health effects may also occur through disruption of food systems and access to essential resources, with disproportionate consequences for vulnerable populations [17]. Available evidence linking data-center operation to human health appears to rely predominantly on modeling approaches rather than direct epidemiological observation [18]. Direct measurement remains sparse: occupational noise inside facilities has been characterized in a small number of surveys [19,20], indoor-air contamination in limited workplace monitoring studies [21], and localized warming around facilities in recent neighborhood-scale field campaigns [22].
Exposure pathways may also differ between workers and surrounding communities. Workers may experience occupational exposures within or near facilities, whereas residents may be affected by off-site emissions, environmental noise, heat, water-resource pressures and other community-level impacts. Host communities are not a uniform population, and site-specific analyses have raised the possibility that pressures concentrate in areas of existing socioeconomic disadvantage [23,24].
Research on these dimensions remains fragmented across energy analysis, hydrology, local climatology, land-use and ecological sciences and acoustics. Within this literature, human health is rarely investigated directly and is more often treated as a modeled endpoint. No previous review appears to have integrated these environmental domains with population exposure and human-health outcomes. This matters because facilities are being sited and permitted at a pace that may shape environmental conditions in host communities for decades.
These characteristics also expose a regulatory gap. Conventional Environmental Impact Assessment (EIA) frameworks evaluate a single project at the time of permitting, typically examining each environmental medium separately and each facility in isolation [25,26]. Hyperscale data centers, however, generate concurrent pressures (noise, thermal plumes, on-site and grid-related emissions) that may combine at the receptor level in ways that medium-specific assessments are not designed to capture [27]. Spatial clustering and non-linear post-permit growth of AI workloads mean that the cumulative burden on host communities can exceed the sum of individually acceptable footprints, while indirect emissions from off-site power generation, often a large share of total pressure, generally fall outside the spatial and legal boundaries of facility-level review [6,18]. Together, these limitations underscore the need for an integrated evidence base linking data-center activity to population exposure and health.
This review therefore aims to identify, critically appraise, and synthesize evidence on the environmental pressures generated by data centers, the resulting population and occupational exposure pathways, and their observed or modeled implications for human health. The search included gray-literature and preprint sources alongside bibliographic databases, and the synthesis explicitly distinguishes environmental-pressure estimates, population exposure, modeled health impacts, and observed health outcomes. Secondary objectives are to characterize evidence across environmental domains and data-center settings, identify susceptible populations and research gaps, and determine how far the available evidence progresses along the pathway from data-center activity to environmental pressure, population exposure, and human health.
2. Materials and Methods
2.1. Study Design and Reporting
This systematic review was designed to identify, critically appraise, and synthesize the available evidence on environmental pressures and exposures associated with data centers and their observed or modeled implications for public health. The review was reported in accordance with the Preferred Reporting Items for Systematic Reviews and Meta-Analyses (PRISMA 2020) [28] statement, and the literature-search process was additionally documented according to the PRISMA-S extension [29]. The completed PRISMA 2020 checklist is provided in the Supplementary Materials (Supplementary Table S1), and the PRISMA 2020 flow diagram is presented in Figure 1. The review protocol was developed a priori and registered in the International Prospective Register of Systematic Reviews (PROSPERO; CRD420261502966).
Figure 1.
Flow diagram outlining the study selection process.
Given the interdisciplinary nature of the literature, spanning environmental epidemiology, exposure science, engineering, hydrology, local climatology, land-use science, life-cycle assessment, and public health, the review incorporated both human exposure or health evidence and quantitative studies characterizing upstream environmental pressures attributable to data-center infrastructure. These forms of evidence were retained but explicitly distinguished according to their position along the pathway from data-center activity to environmental pressure, population exposure, and human health.
2.2. Information Sources and Search Strategy
A systematic literature search was conducted in PubMed, Embase, Scopus, and Web of Science from database inception to 31 July 2026. Search strategies combined controlled vocabulary, where available, and free-text terms related to data centers and their environmental and public-health impacts. Search terms covered data centers, hyperscale facilities, cloud infrastructure, artificial intelligence infrastructure, and major environmental exposure domains, including air pollution and atmospheric emissions, diesel backup generators and gas turbines, environmental noise, waste heat and local heat effects, water use and water scarcity, greenhouse-gas emissions, land use, electronic waste, and environmental justice. A mandatory public-health or health-outcome search block was intentionally not applied. Because the review was designed to capture the full pathway from upstream environmental pressures to population exposure and modeled or observed health outcomes, requiring terms such as ‘public health’, ‘environmental health’, ‘environmental epidemiology’, ‘exposure assessment’, or ‘health impact’ would have risked excluding relevant environmental and engineering studies that quantified data-center-related pressures without explicitly framing their findings in health terminology. Health relevance was therefore assessed during study screening and evidence-link classification rather than used as a mandatory retrieval criterion. The complete search strategies for each database are reported in Supplementary Table S2.
The database search was complemented by backward and forward citation searching of all included studies, together with targeted searches of governmental and institutional gray literature. Local planning, permitting, and Environmental Impact Assessment (EIA) repositories were not systematically searched on a facility-by-facility basis. Regulatory or EIA documents identified through the gray-literature, Google Scholar, or citation-searching procedures were eligible when they contained original quantitative environmental or exposure data attributable to data-center activity and met the other eligibility criteria.
Targeted searches of relevant preprint servers were also performed to capture rapidly emerging evidence not yet indexed in bibliographic databases. Google Scholar was added as a supplementary search source after completion of the primary database search to improve the retrieval of emerging and non-indexed environmental evidence; it was not used as a substitute for bibliographic databases [30]. Separate searches were conducted for the major environmental exposure domains. Because Google Scholar uses dynamically ranked relevance-based results and does not permit fully reproducible systematic export, searches were conducted on a prespecified date and results were screened sequentially in relevance order. Screening continued until the prespecified stopping rule of two consecutive pages without identification of a new potentially eligible study was reached. Records retrieved through Google Scholar, gray-literature sources, preprint servers, and citation searching were cross-checked against the core bibliographic database records and across supplementary sources using standardized bibliographic metadata, including title, author, and publication year, to identify duplicate or overlapping records before eligibility assessment.
2.3. Eligibility Criteria
Eligibility criteria were structured using a framework informed by the Population, Exposure, Comparator, and Outcome (PECO) structure [31] and extended to encompass upstream environmental evidence. Two complementary evidence streams were considered: (i) human exposure or health evidence involving residents, workers, nearby communities, or other potentially exposed populations; and (ii) upstream environmental evidence, for which an explicitly defined human population was not required when the study provided an original quantitative assessment of an environmental pressure directly attributable to a data center, data-center cluster, or data-center sector.
Because environmental studies frequently refer to data centers without explicitly identifying the underlying computational workload as AI-related, eligibility was based on attribution of the environmental pressure or exposure to data-center infrastructure rather than on the presence of an explicit AI label. Evidence generated before the recent expansion of generative AI was therefore eligible when the investigated pathway remained relevant to contemporary data-center infrastructure.
Eligible exposures included air pollution and atmospheric emissions; emissions from diesel backup generators or gas turbines; environmental noise; waste heat and local heat-island effects; water use, withdrawal, scarcity, or stress; greenhouse-gas emissions and climate-related pressures; land-use change; electronic waste; and environmental inequalities associated with data-center-related exposures. These domains reflect the exposure categories specified in the review protocol.
No comparator was required for inclusion. When available, eligible comparisons included lower versus higher exposure, exposed versus reference populations or areas, geographical or temporal contrasts, before-and-after comparisons, alternative technological scenarios, and comparisons with background environmental conditions.
Eligible environmental endpoints included quantitative measures of air-pollutant emissions or concentrations; environmental noise; waste heat or temperature change; water use, withdrawal, consumption, scarcity or stress; greenhouse-gas emissions; land-use or vegetation change; electronic waste; and environmental inequalities. Eligible human-health endpoints included observed or modeled mortality and morbidity, respiratory and cardiovascular outcomes, emergency-department visits, hospital admissions, sleep disturbance, mental-health outcomes, quality of life, disability-adjusted life years (DALYs), and years of life lost (YLLs). Environmental monitoring, exposure modeling, Environmental-Health Assessments, Health-Impact Assessments (HIA), Quantitative Risk Assessments (QRA), and life-cycle assessments were considered eligible methodological approaches rather than outcomes per se, provided that they contained original quantitative data meeting the eligibility criteria.
Eligible study designs included cohort, case–control, cross-sectional and ecological studies; environmental epidemiological investigations; exposure-assessment and environmental-monitoring studies; HIA and QRA; quantitative environmental modeling; life-cycle assessment (LCA) or environmental-footprint studies when they produced original quantitative estimates directly attributable to data-center activities; and governmental or institutional technical reports containing original quantitative environmental or public-health data.
Editorials, commentaries, opinion papers, narrative reviews, conference abstracts without sufficient original data, and purely qualitative publications were excluded. Studies concerned exclusively with engineering performance, server optimization, power usage effectiveness (PUE), cooling efficiency, computational optimization, or energy-system design were excluded when they did not quantify an environmental pressure or exposure relevant to the review. Similarly, studies evaluating mitigation technologies solely in terms of technical performance or avoided impacts, without characterizing the underlying environmental burden attributable to data-center activities, were excluded. This distinction was applied to prevent the review from becoming a general assessment of data-center energy efficiency or sustainability.
No restriction was imposed according to peer-review status. Preprints and full conference papers were eligible when they reported sufficient original quantitative methods and results to permit eligibility assessment and data extraction. Conference abstracts without sufficient original data remained excluded. When both a preprint and a subsequently published peer-reviewed version of the same study were available, the peer-reviewed publication was treated as the primary report and the study was counted only once.
Only studies available in English were eligible for full-text inclusion.
2.4. Study Selection
All records retrieved from the bibliographic databases were imported into Rayyan (Rayyan Systems Inc., Cambridge, MA, USA, https://www.rayyan.ai/) [32], where duplicate records were identified and removed. Titles and abstracts were independently screened by two reviewers, followed by full-text assessment of all potentially eligible records. Disagreements were resolved through discussion and, when necessary, consultation with an additional reviewer. Reasons for exclusion were recorded at the full-text stage and are presented in the PRISMA 2020 flow diagram.
Records retrieved through supplementary Google Scholar, citation searching, gray-literature sources, and preprint servers were screened using the same eligibility criteria as records retrieved from the bibliographic databases. Records were cross-checked against the core bibliographic databases and across supplementary sources using standardized bibliographic metadata, including title, author, and publication year, and duplicate or overlapping records were consolidated before inclusion. Multiple reports referring to the same underlying study or dataset, including preprint and subsequently published versions, were linked during study selection and treated as a single study for study-level analyses. When both a preprint and a subsequently published peer-reviewed version were available, the peer-reviewed publication was treated as the primary report and the study was counted only once; complementary information from related reports was retained when necessary.
2.5. Data Extraction
Data were extracted using a standardized Microsoft Excel form developed specifically for this review. Before formal extraction, the form was piloted and iteratively refined on a sample of potentially eligible full-text articles representing different exposure domains and study designs. The final extraction framework included study-level characteristics, data-center characteristics, environmental exposure information, population and health outcomes when applicable, quantitative effect or exposure estimates, methodological characteristics, and information required for evidence mapping. Data were independently extracted by two reviewers. Discrepancies were resolved through discussion and, when necessary, by consultation with a third reviewer.
Study-level information included publication year, country and geographical region, study design, study objectives, publication type, funding, conflicts of interest, and major study limitations. Data-center characteristics included facility type and operational status, number of facilities, information technology (IT) capacity or load where available, cooling technology, backup-power characteristics, electricity source, PUE and water usage effectiveness (WUE) when relevant, local water-stress context, urban or rural setting, and spatial scale or distance from receptors.
For each environmental exposure, the specific exposure, assessment method, metric and unit, exposure timeframe, comparator or contrast, and environmental pathway or life-cycle stage were recorded. Quantitative estimates were extracted at the effect level, together with their units or functional normalization, 95% confidence intervals when reported, adjustment status, direction and statistical significance when applicable, time points or lag structures, and the corresponding verbatim source data or explanatory notes. Population characteristics and health outcomes were extracted only when relevant to the study design.
For epidemiological studies reporting multiple estimates for the same exposure–outcome relationship, the maximally adjusted estimate was preferentially selected for the primary quantitative synthesis. Additional estimates were retained when required to characterize distinct exposure contrasts, outcomes, lag structures, or analytical scenarios. Missing information was distinguished as not reported or not applicable whenever this distinction could be established.
For quantitative synthesis and presentation, units were harmonized using deterministic unit conversions only. Large absolute quantities were rescaled where appropriate to improve comparability and readability (e.g., tons to megatons, m3 to million or billion m3), without altering the underlying quantity. Conversions requiring assumptions regarding facility utilization, operating time, exposure conditions, or model parameters were not performed. Where values or units were rescaled for presentation, the originally reported form was preserved in the verbatim source-data field whenever available to maintain traceability.
When a directly comparable contrast could be derived by simple arithmetic from values explicitly reported within the same study (e.g., exposed minus reference value), the derived estimate was calculated and flagged as such. No model-based imputation or conversion requiring additional assumptions was performed.
2.6. Evidence-Link Classification
To distinguish environmental evidence from evidence directly informing human health, each extracted result was classified according to a four-level evidence-link framework developed for this review:
First, environmental pressure only, when the study quantified an environmental burden or emission at the facility, sectoral or system level without estimating exposure at a human receptor.
Second, receptor/population exposure, when measured, modeled, or spatially assigned environmental conditions were explicitly linked to a human population or receptor location. Classification at this level did not imply individual-level exposure measurement. Modeled health impact, when health outcomes were quantitatively estimated using HIA, QRA, burden-of-disease, dispersion–exposure–response, or related modeling approaches.
Third, observed health outcome, when associations with human-health outcomes were based on observed epidemiological or clinical data.
This classification was intended to represent the directness of the evidence along the pathway data center → environmental pressure → population exposure → health impact, and was not interpreted as a measure of methodological quality.
2.7. Methodological Critical Appraisal
For quantitative environmental, exposure-assessment, ecological, modeling, life-cycle assessment, Health-Impact Assessment, and related studies, methodological and reporting appraisal was evaluated using the quantitative checklist of the Standard Quality Assessment Criteria for Evaluating Primary Research Papers from a Variety of Fields (QualSyst) developed by Kmet et al. [33]. The checklist comprises 14 criteria addressing the clarity of the research question and study design, appropriateness of data sources or input variables, exposure or outcome measurement, sample adequacy, analytical methods, uncertainty, control of confounding where applicable, completeness of results reporting, and consistency between results and conclusions. Each applicable criterion was rated as Yes (2 points), Partial (1 point), or No (0 points); criteria that were not relevant to a particular study design were rated as Not applicable and excluded from the denominator. A standardized methodological quality score was calculated as the total score obtained divided by the maximum possible score for applicable items. No study was excluded solely on the basis of its methodological quality score. Items Q5–Q7 (randomization and blinding) were considered not applicable to the non-interventional environmental studies. Q9 was applied only when an empirical study sample could be meaningfully assessed, and Q12 only when confounding was conceptually relevant to an observational comparative analysis. For Q11, Partial was assigned when uncertainty or sensitivity was quantitatively characterized without a formal variance estimate. Detailed item-level ratings and standardized methodological quality scores for all studies assessed with QualSyst are reported in Supplementary Table S7A.
The single study with a quasi-experimental design was assessed separately using the 2020 version of the Joanna Briggs Institute (JBI) Critical Appraisal Checklist for Quasi-Experimental Studies, which comprises nine design-specific items rated as Yes, No, Unclear, or Not applicable and provides an overall appraisal of Include, Exclude, or Seek further information [34]. Appraisal results were used to inform interpretation of the evidence rather than as a measure of evidence-link directness. The item-level JBI appraisal is reported in Supplementary Table S7B.
2.8. Data Synthesis and Statistical Analysis
The evidence was synthesized using descriptive quantitative methods, synthesis without meta-analysis (SWiM) [35], and evidence and gap mapping. Meta-analysis was not undertaken because the available estimates were insufficiently comparable and commonly lacked a defined comparator or statistical precision.
Sets of estimates sharing a sufficiently similar exposure construct and measurement unit were descriptively juxtaposed when informative. Differences in measurement approach, spatial scale, and study setting were retained explicitly and precluded quantitative pooling. Within each cluster, values were summarized using ranges and direction of effect. Estimates derived at substantially different spatial or methodological scales were presented separately. An exploratory study-level direction-of-effect summary was performed for studies with a defined comparator. This analysis was intended as a descriptive visualization and was not interpreted as an estimate of pooled association or evidence strength.
For studies reporting a defined comparator, direction of effect was synthesized using structured vote counting and displayed in a harvest plot by exposure domain [36]. Vote counting was based on direction of effect rather than statistical significance. When a study contributed multiple directional estimates within the same exposure domain, it was classified as adverse when all interpretable estimates indicated a less favorable outcome with greater exposure, and as mixed/unclear when a single direction could not be assigned consistently.
As a publication-status robustness analysis of evidence-link distribution, the study-level distribution of the most downstream evidence-link level reached was recalculated after exclusion of preprints to assess whether the maturity of the evidence base was influenced by non-peer-reviewed studies.
Technical characteristics were additionally synthesized to examine how data-center design and operation mapped onto environmental-pressure pathways. Extracted parameters included IT capacity and load, cooling system, backup-power technology and operating assumptions, electricity source, power usage effectiveness (PUE), water usage effectiveness (WUE), and local water-stress context. A technical parameter was considered represented when it was explicitly reported or incorporated into the study model, including cases in which site-specific or scenario-specific values precluded extraction of a single summary value. Reporting of technical parameters was cross-classified by environmental exposure domain at the study level.
For studies comparing alternative technical configurations or system-level scenarios using the same environmental or health-related metric, within-study relative changes were additionally calculated as 100 × (alternative value − reference value)/reference value. Negative values therefore indicate a reduction relative to the reference configuration and positive values an increase. When percentage changes were directly reported by the study authors, the reported values were retained; derived percentages were calculated only when both reference and alternative values had been explicitly extracted. These within-study contrasts were not pooled across studies because technical interventions, system boundaries, environmental outcomes, and study settings were heterogeneous.
2.9. Evidence Mapping
In addition to the narrative synthesis, an evidence map was developed to characterize the distribution and directness of the available literature and to identify research clusters and gaps. Evidence-mapping procedures were informed by established guidance for systematic evidence and gap maps [37]. Studies were mapped according to environmental exposure domain, study design, geographical region, outcome category, and evidence-link level.
Three complementary matrices were constructed: environmental exposure domain by outcome category; study design by geographical region; and environmental exposure domain by evidence-link level. Counts were performed at the study level rather than the effect-estimate level. In the exposure-domain × outcome-category matrix, a study could contribute to more than one outcome category within the same domain, but was counted only once within each cell. In the study-design × geographical-region matrix, each study contributed to a single design and region category. In the exposure-domain × evidence-link matrix, each study was assigned to the most downstream evidence-link level reached within each exposure domain. Studies addressing multiple exposure domains could therefore appear in more than one row.
Overall evidence-link distributions were similarly based on the most downstream evidence-link level reached by each study across all domains. The evidence map was used descriptively and was not interpreted as a quantitative measure of evidence strength.
2.10. Certainty of Evidence
Certainty of evidence was planned to be assessed using the Grading of Recommendations Assessment, Development and Evaluation (GRADE) framework [38] when a sufficiently coherent body of studies directly evaluated the same human exposure–health outcome relationship. Because no such body of direct epidemiological evidence was identified, GRADE was not applied. Environmental-pressure-only studies, engineering-derived estimates, and modeled-health-impact studies were instead characterized through the study-level methodological critical-appraisal procedures described above.
3. Results
3.1. Literature Search
Database searching identified 3651 records: 1838 from Scopus, 1248 from Web of Science, 313 from Embase and 252 from PubMed. After removal of 502 duplicates, 3149 records were screened on title and abstract, of which 3129 were excluded, 20 reports were sought for retrieval and one could not be obtained, leaving 19 reports assessed in full text. Seven reports were excluded: five because the outcome did not meet the eligibility criteria and two because of study design. Twelve studies were included from this source.
Because data-center environmental research is recent and a substantial part of it is not indexed in bibliographic databases, the database search was supplemented by other methods. Google Scholar was searched on 10 August 2026 using five domain-specific search strategies covering air pollution and emissions, water, noise, heat, and land use/environmental justice (Supplementary Table S3). Each string returned approximately 15,500 to 17,700 results. Since Google Scholar ranks results by relevance and does not allow systematic export, results were screened in relevance order until a prespecified stopping rule was met, which occurred after four to eight pages per string; 280 records were screened in total. A further 20 records were identified through targeted searching of preprint servers and gray-literature sources, and seven through backward and forward citation searching of the included studies. Across these sources, 55 reports were sought for retrieval, five were not obtained and 50 were assessed in full text. Twenty-six were excluded, most frequently because the outcome (n = 14), study design (n = 6) or exposure (n = 5) did not meet the eligibility criteria, and one because of language. Twenty-four studies were included from these sources.
In total, 36 studies met the inclusion criteria and were included in the review (Figure 1).
3.2. Geographic Distribution of the Included Studies
The evidence base was geographically concentrated. North America accounted for half of the included studies (n = 18) [6,18,21,22,23,24,39,40,41,42,43,44,45,46,47,48,49,50], almost all of which were conducted in the United States (n = 17) [6,18,21,22,23,24,39,40,41,43,44,45,46,47,48,49,50,51,52,53,54]. Six studies [51,52,53,54,55,56] had a global or multi-region scope. Outside North America, five studies were conducted in Europe [18,57,58,59,60] and four in the Asia–Pacific region [61,62,63,64], all concerning the Chinese data-center sector. Latin America [65] and the Middle East and North Africa [66] are each represented by a single study, conducted in Brazil and Iran respectively. No included study addressed Sub-Saharan Africa, South Asia or Southeast Asia. One study [67] did not report the country of the facility examined. The geographical distribution of included studies is shown in Figure 2.
Figure 2.
Geographic distribution of the 36 included studies. Countries are shaded according to the number of included country-specific studies; global and multi-region studies are not assigned to individual countries.
Within the United States, several studies focused on individual states or metropolitan areas, notably Arizona, California, Texas and Virginia, reflecting the regional clustering of data-center capacity. Most studies were conducted in mixed settings (n = 22) [6,18,19,21,39,40,42,43,44,45,48,50,51,53,57,58,59,60,61,62,63,64], with six [26,46,47,49,65,66] set explicitly in urban areas, four [50,51,52,53,54] adopting a global scale, and three [22,24,41] conducted in suburban residential contexts adjacent to operating facilities in the United States, and one [67] for which the setting was not reported.
The evidence was therefore geographically concentrated in regions with established data-center markets, while several world regions had no included studies.
The cross-classification of study design and geographical region is provided in Supplementary Table S4.
3.3. Characteristics of the Included Studies
As shown in Table 1, 22 [6,21,22,23,40,42,47,49,50,51,52,54,57,58,59,60,61,62,63,64,65,66] of the included studies were journal articles, 10 [18,34,43,44,45,46,48,53,55,56] were preprints, and four [22,27,41,67] were conference papers. Twenty [6,22,24,25,27,40,41,44,45,47,51,53,56,58,59,61,62,64,65,66,67] were exposure-assessment studies and 11 [42,43,49,50,52,55,57,58,60,62,63,64] were quantitative modeling studies with public-health implications. Three [39,44,48] were Health-Impact Assessments, one [26] was an ecological study and one [46] an environmental epidemiology study of another design. No cohort, case–control or cross-sectional study met the inclusion criteria, and no included study reported an observed health outcome in an exposed population.
Table 1.
Characteristics of the included studies (n = 36).
The evidence base was highly recent: 20 of 36 studies (55.6%) were published in 2025 [24,43,50,54,55,57,61] or 2026 [18,22,23,39,44,45,48,53,56,58,62,64], including all ten preprints.
The facilities examined were most often described generically. Sixteen studies [6,22,40,43,44,45,46,48,50,53,54,59,61,63,64,65] covered mixed or multiple facility types and 14 [18,21,23,39,41,42,49,50,55,57,58,60,62,67] did not specify the type; enterprise and hyperscale facilities were each the explicit focus of two studies, and cloud and colocation facilities were the focus of one each. Twenty-one studies [6,19,21,23,24,39,45,47,48,51,52,53,56,60,61,62,63,65,66,67] concerned facilities in operation. Nine [18,43,44,46,50,55,58,59,64] addressed a mixed or not applicable operational status, generally because they modeled national or sectoral aggregates rather than identified sites, four [40,49,54,57] modeled a hypothetical facility, one [41] examined facilities under construction and one [42] a proposed development.
The number of facilities examined varied by several orders of magnitude, reflecting two distinct research traditions. At one end, single-facility studies characterized one to four sites, generally through direct measurement of noise, indoor air or air temperature. At the other, satellite and inventory-based assessments covered hundreds to thousands of facilities, up to 8472 [46,48,52,56] in a global remote-sensing analysis, generally without measurement at any individual site. Sixteen studies [6,18,24,39,42,43,44,50,51,53,54,55,61,63,64,65] reported no facility count, mostly national or global modeling exercises in which the unit of analysis was aggregate electricity or water demand rather than identified facilities.
A defined human population was described in 19 studies. Residents and nearby communities were the population of interest in 15 [18,22,23,24,39,41,43,44,45,46,48,49,53,56,65] and workers inside facilities in four [19,21,68,69]. In the remaining studies [6,40,42,47,50,51,52,54,55,57,58,59,60,61,62,63,64] no population was specified, because the outcome assessed was an environmental pressure such as a carbon, water or land footprint, with no human exposure evaluated.
Exposure assessment was predominantly model-based: 26 studies [6,18,39,40,41,42,43,44,45,46,48,49,50,51,52,54,55,57,58,59,60,61,62,63,64,65] (72.2%) relied primarily on modeled or estimated exposures, six (16.7%) [19,21,22,24,66,67] used direct environmental monitoring, and four (11.1%) [23,47,53,56] used other approaches, principally remote-sensing or geospatial analyses. Notably, all six directly monitored studies reached the population-exposure level but none evaluated a health outcome, whereas all six studies reaching the modeled-health-impact level relied on model-based approaches.
Exposure domains were unevenly represented. Thirteen studies [6,18,19,23,40,42,43,48,51,53,58,59,60] addressed multiple domains simultaneously, most often through life-cycle or footprint assessment. Among studies addressing a single domain, water use and scarcity was the most frequent (n = 6) [44,47,54,55,61,65], followed by environmental noise (n = 5) [19,24,41,66,67], waste heat and local heat-island effects (n = 4) [22,45,52,56] and greenhouse-gas emissions (n = 4) [57,62,63,64]. Only two studies [21,39] addressed ambient air pollution as their principal domain and two [46,49] addressed diesel backup generators and gas turbines specifically. No included study addressed electronic waste.
3.4. Engineering Characteristics and Environmental Pathways
Technical characterization varied substantially according to the environmental pathway investigated (Table 2; Supplementary Table S8). Electricity source or grid mix was the most frequently represented engineering parameter, being characterized in 22 [6,18,39,40,42,43,45,46,47,48,50,51,54,55,57,58,59,60,61,62,63,64] of 36 studies (61.1%), including all studies addressing greenhouse-gas emissions (12/12) [6,40,42,43,50,51,57,58,59,62,63,64], 10 [6,39,40,47,50,51,54,55,59,61] of 12 water-related studies, and five [18,39,43,48,60] of six air-pollution studies. IT capacity or load was reported in 21 studies [6,18,19,22,39,40,42,43,44,45,46,47,48,50,53,54,57,58,60,61,65] (58.3%). Cooling systems were characterized in 15 studies [19,22,40,41,43,44,45,47,50,54,57,60,61,65,66] (41.7%), particularly in studies addressing water use (7/12) [40,44,47,50,54,61,65] and environmental noise (3/5) [19,41,66]. Backup-power characteristics were reported in all four studies [18,43,46,49] specifically evaluating backup generators or gas turbines. PUE was represented in 12 studies [22,40,43,47,50,52,58,60,61,63,64,65] (33.3%), whereas WUE was represented in eight [40,47,50,55,58,59,61,65] (22.2%); both WUE and local water-stress context were reported in eight [6,42,44,47,50,55,59,61] of the 12 water-related studies.
Table 2.
Report of engineering and operational characteristics across environmental exposure domains.
Within-study technical and system-level comparisons further showed that environmental burdens were sensitive to infrastructure configuration and operating assumptions (Supplementary Table S9). Relative to its baseline life-cycle scenario, Bux et al. [57] reported an 11.1% reduction in greenhouse-gas emissions with an extended IT refresh interval and a 22.3% reduction under an efficient physical-infrastructure scenario, whereas an alternative electricity-mix scenario resulted in a small 1.3% increase. In a study by Chen et al. [39], economization reduced operational carbon emissions by 11.0%, on-site water use by 22.4%, and water-scarcity impact by 14.7%. Larger combined scenarios were associated with reductions of 51.5–58.3% in projected water footprint in Jiang et al. [61] and up to 86% in water footprint and 73% in carbon emissions in another study [50].
The extracted evidence also identified trade-offs and context dependence. In Karimi et al. [47], the facility with the lower PUE (1.63 vs. 1.84; 11.4% lower) had a substantially higher source WUE (9.11 vs. 3.10 L/kWh; 193.9% higher, or 2.94-fold), illustrating that improved energy efficiency did not necessarily correspond to lower water intensity. In Liang et al. [65], a drought-related electricity-grid scenario increased indirect water consumption by 27.2%. At the health-impact level, Han et al. [18] reported that health-informed workload shifting reduced modeled health costs by approximately one quarter. These within-study contrasts were not pooled. Overall, these within-study comparisons indicate that environmental pressures were not fixed properties of data-center operation but varied materially with infrastructure configuration, cooling strategy, electricity supply, and workload-management assumptions.
3.5. Evidence and Gap Map
The evidence map revealed a pronounced structural drop-off along the pathway from environmental pressure to observed human-health outcomes (Table 3; Figure 3). Of the 36 included studies, exactly half (n = 18; 50.0%) [6,39,43,44,47,50,52,54,55,57,58,59,61,62,63,64,65] reached only the environmental-pressure level. A further 12 studies (33.3%) [19,21,22,23,41,45,49,51,53,56,66,67] reached the population-exposure level, while only six (16.7%) [18,40,42,46,48,60] progressed to modeled health impacts. No study reached the observed-health-outcome level. Thus, the available literature becomes progressively smaller as the evidence pathway moves from environmental accounting toward direct health relevance.
Table 3.
Exposure domain by evidence-link level (study-level counts).
Figure 3.
Evidence and gap map showing the number of included studies at each evidence-link level by exposure domain (N = 36). No study reported an empirically observed health outcome in an exposed population.
This bottleneck was particularly apparent for upstream footprint-based evidence. All study–domain contributions concerning greenhouse-gas emissions/climate change and water use/withdrawal/scarcity/stress remained at the environmental-pressure level, without progressing to receptor-level exposure or health-impact assessment. In contrast, air pollution showed the greatest progression toward downstream health relevance, with four [18,40,48,60] of six studies reaching the modeled-health-impact level. These health outcomes nevertheless represented modeled projections rather than effects directly observed in exposed populations.
The cross-classification of exposure domains and health-outcome categories is provided in Supplementary Table S5.
The limited downstream evidence was also strongly dependent on publication status. After excluding the 10 preprints, 15 [6,40,47,50,51,52,54,57,58,59,61,62,63,64,65] of 26 studies (57.7%) remained at the environmental-pressure-only level, nine [19,21,22,23,24,41,49,66,67] (34.6%) reached population exposure, and only two [42,60] (7.7%) reached modeled health impact. Thus, four [18,39,46,48] of the six studies contributing the most downstream level of health-related evidence were preprints. No observed-health-outcome study was identified in either analysis.
3.6. Descriptive Synthesis of Comparable Quantitative Estimates
Among 112 extracted quantitative estimates, 93 (83.0%) lacked a defined comparator and 11 (9.8%) reported a 95% confidence interval. The complete result-level dataset is provided in Supplementary Table S6. Four sets of estimates were sufficiently similar in construct and unit to permit descriptive comparison, although methodological and spatial heterogeneity precluded pooling (Table 4; Figure 4).
Table 4.
Descriptive synthesis of comparable quantitative estimates.
Figure 4.
Individual study estimates within homogeneous quantitative outcome clusters. (A) Temperature elevation attributable to data-center operation, including 13 estimates from five studies: Chakraborty [53], Marinoni [56], Molla [23], Hu [45], and Sailor [22]. Colors distinguish estimates obtained through satellite/remote sensing, urban-climate modelling, and field monitoring. (B) Occupational noise levels measured inside operational server rooms, including estimates from three studies: Alnuaimy [67], Jalilzadeh [66], and Miljkovic [19]. Horizontal lines represent reported measurement ranges, whereas points indicate individual measurements. The dashed vertical line indicates the NIOSH recommended exposure limit of 85 dB(A) as an 8-h time-weighted average, for reference only. (C) Vegetation loss near data-center facilities, expressed as differences in the Normalized Difference Vegetation Index (NDVI), including three estimates from two studies: Chakraborty [53] and Molla [23]. (D) Increases in ambient PM2.5 concentrations attributable to electricity demand from data centers, based on two studies: Chen [39] and Muller [48]. Horizontal lines represent reported ranges of estimated increases. All estimates are presented individually and were not statistically pooled. Diamond symbols indicate values derived from explicitly reported source data rather than directly extracted differences.
Localized temperature elevation attributable to data-center operation was reported in five studies (13 estimates) [22,23,45,53,56] and was positive in all estimates. Values ranged from 0.48 to 2.07 °C in satellite/remote-sensing studies [21,53,56], 0.35 to 1.98 °C in an urban-climate modeling study [45], and 0.5 to 1.0 °C in a field-monitoring study [22]. Occupational noise inside operational server rooms ranged from 65.0 to 82.7 dB(A) across three studies [19,66,67]. Local vegetation change ranged from −0.02 to −0.163 in NDVI differential across two studies [23,53] and consistently indicated vegetation loss. Two studies [40,48] estimated PM2.5 increases attributable to data-center electricity demand, ranging from 0 to 0.08 µg/m.
3.7. Exploratory Direction-of-Effect Synthesis
After exclusion of one greenhouse-gas mitigation scenario that represented a policy-induced emissions reduction rather than an exposure–harm contrast, direction of effect was available for 19 of 112 estimates from nine independent studies [18,22,23,24,40,41,46,48,49] (Figure 5). Seven studies [22,23,24,41,46,48,49] consistently indicated a less favorable environmental or health-related outcome with greater data-center-related exposure, whereas two [18,40] showed an unclear or mixed direction. No study evaluating an exposure–harm relationship showed a protective direction. This descriptive pattern should not be interpreted as evidence of a pooled adverse association, because the contributing outcomes, exposure metrics, study designs, and statistical precision differed substantially.
Figure 5.
Direction of effect by environmental exposure domain (harvest plot). The harvest plot summarizes the direction of effect reported by studies with a defined exposure–outcome comparator across six environmental domains: air pollution, environmental noise, diesel backup generators, waste heat, land-use change, and environmental justice. Each bar segment represents one study, with orange indicating a positive association between exposure and an adverse environmental or health-related outcome and grey indicating mixed or unclear findings. The studies represented are Chen [39], Han [18], and Muller [48] for air pollution; Conaway [41] and Ngata [24] for environmental noise; Jia [46] and Olaguer [49] for diesel backup generators; Molla [23] and Sailor [22] for waste heat; and Molla [23] for both land-use change and environmental justice. Letters indicate methodological quality tiers based on QualSyst scores (H = high, M = medium, L = low), while JBI identifies the study assessed using the Joanna Briggs Institute checklist for quasi-experimental studies. Vote counting was based on the direction of effect rather than statistical significance. Studies contributing to multiple exposure domains are represented separately within each relevant domain. The plot provides a descriptive synthesis and should not be interpreted as a pooled effect estimate or a quantitative measure of evidence strength.
3.8. Methodological Critical Appraisal
Thirty-five studies were appraised using the QualSyst quantitative checklist, while the single quasi-experimental study was assessed separately using the JBI Critical Appraisal Checklist for Quasi-Experimental Studies (Figure 6). QualSyst standardized scores ranged from 0.364 to 1.000, with a median of 0.889 (interquartile range [IQR] 0.778–0.944). These standardized scores were interpreted descriptively because the number of applicable QualSyst items varied across study designs.
Figure 6.
Methodological quality assessment of the included studies. (A) QualSyst appraisal: Distribution of item-level ratings among studies for which each criterion was applicable (n = 35 studies) [33]. Items Q5–Q7 are not displayed because they were not applicable to any of the 35 studies assessed with QualSyst; Q9 was applicable to 10 studies and Q12 to six studies. (B) JBI Critical Appraisal Checklist for Quasi-Experimental Studies: Item-level appraisal of the single quasi-experimental study by Jia et al. [46], with seven of nine criteria rated Yes and two rated Unclear; the overall appraisal was Include. The JBI appraisal was conducted using the checklist referenced in [34]. Separate legends are provided for panels A and B because the two appraisal tools use different rating categories.
Reporting was generally strong. All 35 studies [6,18,19,21,22,23,24,39,40,41,42,43,44,45,47,48,49,50,51,52,53,54,55,56,57,58,59,60,61,62,63,64,65,66,67] fully met the criterion on clarity of the research question or objective, and results were reported in sufficient detail in 34 studies (97.1%) [6,18,19,21,22,23,39,40,41,42,43,44,45,47,48,49,50,51,52,53,54,55,56,57,58,59,60,61,62,63,64,65,66,67]. Study design was judged appropriate in 31 studies (88.6%) [6,18,19,21,22,23,39,40,41,42,44,45,47,48,49,50,51,53,54,55,57,58,59,60,61,62,63,64,65,66,67], partially appropriate in three (8.6%) [24,52,56] and inappropriate in one (2.9%) [43]. Description of subject or unit characteristics was adequate in 32 studies (91.4%) [6,18,19,21,22,39,40,41,42,44,45,47,48,49,50,51,52,53,54,55,56,57,58,59,60,61,62,63,64,65,66,67], and partial in three (8.6%) [23,24,43]. Conclusions were supported by the reported results in 27 studies (77.1%) [6,18,21,23,39,40,41,42,44,45,47,48,49,50,51,54,55,57,58,59,60,61,62,63,64,65,66], partially supported in seven (20.0%) [19,22,24,43,52,53,67] and unsupported in one (2.9%) [56].
Characterization of statistical variability or uncertainty remained the most frequent methodological limitation: only seven studies [21,39,40,45,47,54,60] (20.0%) fully met this criterion, 15 (42.9%) [6,18,44,48,50,51,52,53,56,58,61,62,63,64,65] partially met it, and 13 (37.1%) [19,22,23,24,41,42,43,49,55,57,59,66,67] did not provide an adequate estimate of variance or comparable uncertainty measure.
The description or appropriateness of data sources and input variables was fully adequate in 22 studies (62.9%) [18,19,21,39,40,42,44,45,47,48,49,50,51,53,54,55,57,58,59,60,61,62,63,64,65] and partial in 13 (37.1%) [19,22,23,24,41,42,52,56,58,63,64,66,67], and exposure or outcome measurement was fully adequate in 20 studies (57.1%) [18,19,21,22,39,40,42,44,45,47,48,49,50,53,54,57,60,61,62,66] and partial in 15 (42.9%) [6,23,24,41,43,51,52,55,56,58,59,63,64,65,67]. Analytical methods were judged fully appropriate in 29 studies (82.9%) [6,18,19,21,23,39,40,41,42,44,45,47,48,49,50,51,53,54,55,57,58,59,60,61,62,63,64,65,66], partially appropriate in four (11.4%) [22,52,56,67] and inappropriate in two (5.7%) [24,25,26,27,28,29,30,31,32,33,34,35,36,37,38,39,40,41,42,43].
Sample-size adequacy was applicable to 10 empirical studies: two [53,56] fully met the criterion, seven [19,21,22,23,47,66,67] partially met it and one did not [24]. Control of confounding was relevant to six observational comparative studies: none fully met the criterion, four [22,47,53,56] partially addressed potential confounding and two [23,24] did not account for it. Items on randomization and blinding (Q5–Q7) were not applicable to any included study.
The single quasi-experimental study [46] assessed using the 2020 JBI checklist received an overall appraisal of “Include”, with seven of nine items rated as Yes and two as Unclear. Detailed study-level and item-level assessments are provided in Supplementary Table S7A,B.
3.9. Certainty of Evidence
GRADE was not applied because no sufficiently coherent body of studies directly evaluated the same observed human exposure–health outcome relationship.
4. Discussion
4.1. Main Findings
This systematic review identified 36 studies addressing environmental pressures generated by data centers and their potential implications for human health. The central finding is the absence of direct epidemiological evidence: no included study reported an empirically observed health outcome in an exposed population. Half of the studies reached only the environmental-pressure level, a third characterized population exposure, and six produced modeled health impacts. The evidence base therefore documents environmental pressures generated by data centers but does not yet provide direct evidence of health effects among people living or working near them. The apparent maturity of the health-related evidence was also sensitive to publication status, since most studies reaching the modeled-health-impact level were preprints. This dependence on preprint evidence materially affects the interpretation of the health-related findings. Four of the six studies reaching the modeled-health-impact level had not undergone peer review, and exclusion of preprints reduced the proportion of studies reaching this level from 16.7% to 7.7%. The apparent progression of the literature toward health-impact assessment is therefore substantially weaker when restricted to peer-reviewed evidence. Because preprint findings may change following peer review, particularly with respect to modeling assumptions, exposure inputs, uncertainty characterization, and interpretation of downstream health estimates, the modeled health impacts identified in this review should be regarded as provisional rather than confirmatory evidence.
The distance from health varied systematically by exposure domain. Among the study–domain contributions classified as greenhouse-gas/climate or water-related, all were confined to the environmental-pressure-only level. Air pollution showed the greatest progression toward health relevance among the individual exposure domains, reflecting the availability of established emission inventories and exposure–response functions rather than any local measurement. Environmental noise occupied an intermediate position, with exposure characterized at a receptor but never linked to an outcome. Environmental justice was represented by only one study, leaving the distribution of data-center-related exposures across socioeconomically vulnerable populations largely unexplored, while no included study addressed electronic waste. This is an important gap because aggregate environmental-pressure estimates do not identify which populations bear those burdens. Distributional analyses should therefore consider environmental exposures together with socioeconomic disadvantage and underlying community vulnerability [68].
Four clusters of estimates were sufficiently comparable for descriptive synthesis. Across heterogeneous satellite, modeling, and field-monitoring approaches, reported localized temperature differences were positive and ranged from 0.35 to 2.07 °C. These estimates operated at different spatial scales and should not be interpreted as a pooled effect range. Occupational-noise levels and attributable PM2.5 increments describe exposure levels or estimated increments rather than health effects or a direction of effect, and were derived using measurement approaches that are not always directly comparable across studies. Direction of effect relative to a comparator could be determined in nine studies: seven consistently indicated a less favorable environmental or health-related outcome with greater data-center-related exposure, whereas two showed an unclear or mixed direction. Although none reported a protective direction, this pattern should be interpreted cautiously, because most estimates lacked a comparator and the underlying outcomes were heterogeneous. Given the small number of studies with defined comparators and the heterogeneity of endpoints, this direction-of-effect summary provides descriptive rather than inferential evidence.
4.2. Interpretation of Findings
Three features of the evidence explain why it stops where it does. First, the field is methodologically upstream. Twenty-six studies (72.2%) estimated exposure through modeling rather than measurement, and the unit of analysis was frequently a national or sectoral aggregate rather than an identified facility. Aggregate accounting answers questions about sectoral footprints, not about receptor-level exposure, and cannot by itself support an epidemiological inference. Even the six studies using direct environmental monitoring reached only the population-exposure level, and none evaluated a health outcome.
Second, the estimates are rarely constructed for comparison. Of 112 quantitative estimates, 93 (83.0%) lacked a defined comparator and only 11 (9.8%) reported a confidence interval. This is consistent with the QualSyst appraisal, in which characterization of variability or uncertainty was the single most frequent limitation. The frequent absence of comparators partly reflects study purpose, since many footprint and life-cycle assessments are designed primarily to quantify environmental burdens rather than to contrast exposed and unexposed groups.
Third, the magnitudes reported are not necessarily negligible, which makes the absence of health studies consequential rather than merely academic. The localized warming identified here, of up to 2.07 °C, was derived from satellite, modeling and field-monitoring approaches operating at different spatial scales and is therefore not a single comparable quantity; it is nonetheless relevant because heat exposure is an established contributor to excess mortality, including cardiovascular mortality [14]. Consistent with the broader public-health relevance of heat exposure, a recent systematic review and meta-analysis found increased hospitalizations and emergency-department visits during heat waves among frail older adults [69]. Reported occupational noise measurements were numerically below the 85 dB(A) NIOSH recommended exposure limit; [70] however, this value applies to an 8 h time-weighted average, and the included measurements were not consistently reported on a directly comparable basis. Being below that value does not exclude non-auditory effects, effects related to prolonged exposure or intermittent peaks, or risks in community settings, where the guideline values identified by the WHO European guidelines for annoyance and sleep disturbance are considerably lower [15,71]. None of the included studies compared measured community noise levels with those guideline values. Attributable PM2.5 increments of a few hundredths of a µg/m3 are individually small, yet the WHO global air quality guidelines emphasize that no threshold below which fine particulate matter is safe has been identified [14], and small increments applied to large populations generate non-trivial attributable burdens, which is the logic underlying the modeled mortality estimates identified in this review [18,72].
These findings document environmental pressures attributable to data centers rather than demonstrating health effects, and they are consistent with, and provide, an empirical basis for calls in the recent literature for primary health research on data-center host communities [9] and for context-specific investigation of water-related risks [10]. What those commentaries proposed as a gap, this review documents as an absence in the eligible evidence base, across 36 studies and 112 estimates.
4.3. Engineering Determinants, Resource Trade-Offs, and Public-Health Relevance
From an engineering perspective, our findings indicate that the environmental performance of data centers cannot be adequately characterized by a single efficiency metric. PUE and WUE are strongly influenced by cooling architecture, infrastructure efficiency, climate, workload characteristics, and electricity-system conditions, and improvements in one dimension may shift environmental burdens to another [73,74]. This trade-off was evident in the present synthesis, where one facility configuration combined an approximately 11% lower PUE with a 2.94-fold higher source WUE, illustrating that greater energy efficiency did not necessarily correspond to lower water intensity in that comparison [47]. More broadly, within-study comparisons showed that changes in infrastructure efficiency, economization, electricity supply, cooling configuration, and workload allocation could substantially alter greenhouse-gas emissions, direct and indirect water use, water-scarcity impacts, and, in modeling studies, health-related costs [18,39,50,57,61]. These findings support a systems-level interpretation in which facility-level metrics should be considered together with the surrounding energy and resource systems. In particular, volumetric water use alone does not capture environmental or public-health relevance, because the consequences of a given water demand depend on local scarcity, competing uses, water-source characteristics, and temporal conditions [10,12,75]. This distinction is important because an identical volumetric water footprint may have very different implications across locations. Water withdrawals occurring in a water-abundant setting with resilient supply infrastructure cannot be assumed to carry the same community consequences as equivalent withdrawals in a water-stressed area with competing domestic, agricultural, or municipal demands. In addition, water quantity does not capture potential concerns related to water quality, source substitution, supply reliability, or the affordability of household water access [76]. These dimensions are particularly relevant for public health because community vulnerability depends not only on the volume of water consumed by a facility, but also on baseline water insecurity, infrastructure capacity, and the ability of households and local systems to absorb additional demand. Similarly, the environmental consequences of electricity demand depend on the regional generation mix and can occur far from the data-center site through power-sector emissions and atmospheric transport, providing a pathway from engineering decisions to population exposure and modeled health burden [40,44]. Future environmental-health assessments of data centers should therefore report, at minimum, IT load, cooling architecture, PUE, WUE, backup-power characteristics, electricity mix, and local resource constraints, allowing technical design choices to be more directly linked to environmental pressures and their potential public-health implications. These relationships are likely to become increasingly important as AI infrastructure moves toward higher-density computing. New generations of GPU-based systems increase rack-level power and heat densities, reducing the feasibility of conventional air cooling and accelerating adoption of direct liquid and other advanced cooling technologies. This transition may reduce cooling-energy requirements and, depending on system design, water use, but it may also change the magnitude and location of heat rejection, electricity demand, and water-related pressures. Environmental-health assessment will therefore need to evolve alongside hardware and cooling architectures rather than treating current facility configurations as technologically static [77].
4.4. Implications for Public Health and Policy
Because the available evidence stops short of health outcomes, siting and permitting decisions may be taken without a sufficiently developed evidence base on health consequences for nearby populations. Some proposed or operating facilities may involve substantial backup-generation capacity and water demand, and this creates a potential mismatch between the engineering information used in authorization processes and the limited evidence available on health consequences for nearby residents, in a context where facility-level operational data are frequently not publicly available [10]. This matters because such decisions may have long-lasting consequences over decadal timescales. The public-health significance of a given environmental pressure may also vary across communities because population health and access to essential resources are shaped by socioeconomic, demographic, institutional and health-system contexts [78,79]. Siting and permitting decisions should therefore consider not only the magnitude of projected environmental pressures but also their distribution across populations with different baseline environmental and socioeconomic vulnerabilities. More broadly, health-system resource availability does not translate uniformly into population-health performance, suggesting that the capacity of local systems to absorb and respond to new environmental pressures should not be inferred from expenditure or resources alone [80].
Three implications follow. For large facilities, siting and permitting frameworks should incorporate prospective, site-specific assessment of relevant environmental pressures and receptor-level exposures, including cumulative impacts where multiple facilities or exposure pathways coexist [25,26]. Such assessments should consider noise propagation at nearby receptors, localized thermal effects, water demand in relation to local water-stress conditions, and, where relevant, air emissions associated with backup-generator testing and operation [81,82]. Finally, the disclosure of facility-level operational data, including water withdrawals, generator run-hours and emissions, would be a practical precondition for much future epidemiological research, since these data are currently withheld in many jurisdictions [10,83].
4.5. Strengths and Limitations
A principal strength and original contribution of this review is its integration of environmental engineering and public-health evidence within a single pressure–exposure–health framework. Rather than treating carbon, water, heat, noise, air pollution, land-use change, and environmental justice as separate fields of literature, the review maps each study according to how far its evidence progresses from environmental pressure to population exposure, modeled health impact, and observed health outcome. This approach makes the central methodological gap directly visible: a substantial environmental-footprint literature exists, but evidence becomes progressively sparse as the pathway approaches human health. A further strength is the deliberate use of supplementary search methods and the inclusion of gray literature. Only 12 of the 36 included studies were identified through bibliographic databases, so a database-only search would have captured one third of the evidence base. Gray literature carried a disproportionate share of the evidence closest to health: 10 included studies were preprints, and four of the six studies reaching the modelled-health-impact level were preprints. When preprints were excluded, only two of the remaining 26 studies (7.7%) reached that level, so a review restricted to peer-reviewed sources would have concluded that almost no health-relevant evidence exists. The most downstream evidence in this field is therefore concentrated in sources that have not yet undergone peer review. The review was registered in PROSPERO and conducted in accordance with PRISMA 2020 and PRISMA-S, with study selection and data extraction performed independently by two reviewers. Finally, the pressure-to-exposure-to-outcome framework allowed the evidence to be positioned along a conceptual evidence pathway rather than merely counted. Several limitations should be acknowledged. The evidence base is geographically narrow: 18 of 36 studies concern North America and 17 the United States alone, with no study from Sub-Saharan Africa, South Asia or Southeast Asia. This limitation is not merely one of representativeness. The same facility design, with identical water withdrawals and backup-generator testing schedules, may impose a substantially different burden depending on where it is sited, because its pressures interact with baseline water stress [84], with the resilience of municipal water and power infrastructure and, in some jurisdictions, with less-stringent environmental-noise and land-use regulation. Where grid reliability is low, backup diesel generators may also operate well beyond routine testing, increasing local air-pollutant emissions [85]. The public-health significance of a given pressure therefore depends on baseline exposures and on the capacity of local infrastructure and health systems to absorb it [79]. The magnitudes summarized here, derived predominantly from North American settings, should therefore not be assumed to be globally generalizable. Data-center-related environmental pressures may differ substantially across regions because of variation in electricity-generation mixes, grid reliability, cooling requirements, water availability and baseline water stress, climatic conditions, regulatory frameworks, and the resilience of local infrastructure. These contextual differences may be particularly important in low- and middle-income countries and other rapidly expanding data-center markets, where greater reliance on carbon-intensive electricity or backup generation, constrained water resources, and higher baseline population vulnerability could modify both the magnitude of environmental exposures and their public-health implications. The present evidence base is therefore insufficient to determine whether the environmental and health-related patterns identified predominantly in North American settings apply to other geographical contexts.
Meta-analysis was not possible, and vote counting is a weak form of synthesis, sensitive to the number of studies rather than to their precision or size [35]. Eligibility was restricted a priori to studies available in English; although prespecified, this criterion may have excluded relevant evidence, particularly from regions under-represented in the included studies. The reliance on preprints is an additional limitation, particularly because four of the six studies reaching the modeled-health-impact level had not undergone peer review. These studies contribute disproportionately to the most downstream evidence in the review, and their methods, assumptions, effect estimates, or conclusions may change during peer review. Accordingly, the apparent maturity of the health-related evidence should be interpreted cautiously, and the modelled health impacts identified here should be considered provisional until replicated and confirmed in peer-reviewed studies. In addition, Google Scholar was used as a supplementary source and screened in relevance order until a prespecified stopping rule was met; because its ranking is dynamic and not fully reproducible, potentially eligible records appearing beyond the stopping point may have been missed. Moreover, local planning, permitting, and Environmental Impact Assessment repositories were not systematically searched for every identified data-center facility. Consequently, relevant facility-specific regulatory assessments may have been missed, particularly when available only through local administrative repositories or in languages other than English. The boundary between environmental-pressure studies and health-relevant studies required judgment that another team might have exercised differently. One study did not report the country of the facility examined, and engineering parameters were too incompletely reported to support any analysis by facility size or cooling technology. Methodological appraisal relied on QualSyst and the JBI quasi-experimental checklist. QualSyst primarily captures methodological and reporting adequacy across heterogeneous designs and should not be interpreted as a design-specific risk-of-bias assessment. GRADE was not applied because no sufficiently coherent body of evidence on a single exposure–health outcome relationship was identified. Finally, the statement that no previous review has integrated these exposure domains with human-health outcomes reflects the searches conducted for this review and cannot exclude the existence of reviews not captured by them.
4.6. Future Research
The principal research need is to complement further footprint accounting with studies that measure exposure at human receptors and link it to health outcomes. Several study designs are feasible now. Community noise monitoring at defined distances from operating facilities, with concurrent assessment of annoyance and sleep disturbance, requires no access to proprietary data [86]. Small-area ecological studies linking facility locations and generator permit data to routinely collected health outcomes are feasible where permitting records are public, subject to the limitations of ecological inference [87]. Prospective or quasi-experimental before-and-after studies around newly commissioned facilities, ideally incorporating matched comparison areas, could directly address the current lack of temporal comparators and observed health outcomes. Finally, occupational cohorts within facility operators, using existing audiometric surveillance, would address the worker population characterized in only four studies.
Water deserves particular attention. Water use was one of the two most frequently studied domains, yet no included study progressed beyond quantification of volumes to examine household or community water security, affordability or health, which represents a major unaddressed pathway in this domain [6]. More broadly, the public-health relevance of water-related environmental pressures extends beyond quantity alone, since water quality, population exposure and contextual vulnerability may also intersect with population disease burden [88].
Geographical diversification should be a priority for future research. Evidence is particularly needed outside North America, including in low- and middle-income countries and rapidly expanding data-center markets in regions currently absent or under-represented in the literature. Studies conducted across different electricity systems, climatic conditions, water-stress contexts, regulatory environments, and levels of infrastructure resilience are needed not only to improve geographical representation but also to determine how these contextual factors modify environmental pressures, population exposures, and potential health impacts. Multi-region studies using harmonized exposure and outcome measures would be especially valuable for distinguishing facility-related effects from region-specific background conditions and for assessing the transferability of findings across settings. Future studies should also examine temporal variability in generator operation, cooling-system noise and waste-heat emissions, and should assess whether exposures are disproportionately concentrated in socioeconomically disadvantaged communities or among people with pre-existing vulnerability. Community studies should also consider co-occurring exposures, particularly noise, air pollution and heat, rather than examining each pathway in isolation [27]. Longitudinal or repeated-measures designs are particularly relevant, because these exposures are often intermittent. Greater methodological standardization is needed to make future field studies comparable and quantitatively synthesizable. At a minimum, studies should report the exact location and distance of environmental receptors relative to the data-center site and relevant emission, cooling, or backup-power sources; use a clearly defined reference condition, such as a matched comparison location, pre-operational baseline, or background environmental measurement; report uncertainty around quantitative estimates, including confidence intervals or other appropriate measures of variability where applicable; and use established, domain-specific exposure metrics and units. Repeated measurements should characterize temporal variability and distinguish routine operation from periods of generator testing or emergency operation where relevant. Studies should also report sufficient facility and operational characteristics—including IT load or capacity, cooling configuration, backup-power characteristics, and measurement duration and timing—to permit interpretation of between-study differences. Rather than prescribing a single receiver distance across all exposure domains, future studies should use predefined and explicitly reported receptor locations or distance bands appropriate to the exposure pathway, thereby allowing exposure gradients and between-study comparisons to be evaluated.
5. Conclusions
Environmental pressures associated with data centers are increasingly quantified across greenhouse-gas emissions, water use and scarcity, localized warming, vegetation loss, noise, and air-pollution pathways. Health-relevant evidence, however, remains predominantly modeled, and no eligible study identified an empirically observed health outcome in a data-center-exposed population. This absence of direct epidemiological evidence should not be interpreted as evidence of no health effect; rather, it identifies an important evidence gap that should be explicitly considered in siting and permitting decisions. Pending stronger epidemiological evidence, regulatory and planning frameworks should require prospective, site-specific assessment of relevant environmental pressures and potential receptor-level exposures for large facilities, including cumulative impacts where multiple facilities or exposure pathways coexist. Depending on the local context, such assessments should address noise propagation at nearby receptors, localized thermal effects, water demand in relation to local water scarcity, and emissions associated with backup-power operation. Public disclosure of facility-level operational data, including water withdrawals, generator run-hours and associated emissions, would further support regulatory oversight and independent evaluation. Closing the evidence gap will require standardized exposure metrics, defined comparators and uncertainty estimates, and studies designed around human receptors rather than facility footprints. Because AI infrastructure is evolving rapidly, these assessments must also remain sensitive to changes in computing density, hardware generation, cooling architecture, and facility-level energy and water management.
Supplementary Materials
The following supporting information can be downloaded at: https://www.mdpi.com/article/10.3390/environments13100568/s1, Table S1: Completed PRISMA 2020 checklist; Table S2: Full database search strategies: PubMed, Embase, Scopus, Web of Science; Table S3: Google Scholar and supplementary-search log (query, date, pages screened, records identified, included studies); Table S4: Study design by geographical region (study-level counts); Table S5: Exposure domain by health outcome category (study-level counts); Table S6: Extracted quantitative estimates from the included studies (n = 112 estimates); Table S7A: QualSyst study-level appraisal (Q1–Q14 and scores); Table S7B: JBI appraisal of the quasi-experimental study; Table S8: Technical and operational characteristics of the included studies; Table S9: Within-study environmental and health-related changes associated with alternative technical or system-level configurations.
Author Contributions
Conceptualization, F.P. and A.P.; methodology, F.P. and A.P.; software, F.P., A.P., G.D. and S.B.; validation, F.P., A.P.; formal analysis, F.P., G.D. and A.P.; investigation, F.P., A.P., G.D. and S.B.; resources, C.S.; data curation, F.P., A.P., S.B. and G.D.; writing—original draft preparation, F.P., A.P., S.B. and G.D., C.S.; writing—review and editing, F.P.; visualization, A.P.; supervision, F.P. and C.S. All authors have read and agreed to the published version of the manuscript.
Funding
This research received no external funding.
Institutional Review Board Statement
Not applicable.
Informed Consent Statement
Not applicable.
Data Availability Statement
The original contributions presented in this study are included in the article/Supplementary Materials. Further inquiries can be directed to the corresponding author.
Conflicts of Interest
The authors declare no conflicts of interest.
References
- Pennisi, F.; Pinto, A.; Borgonovo, F.; Scaglione, G.; Ligresti, R.; Santangelo, O.E.; Provenzano, S.; Gori, A.; Baldo, V.; Signorelli, C.; et al. Artificial Intelligence Models for Forecasting Mosquito-Borne Viral Diseases in Human Populations: A Global Systematic Review and Comparative Performance Analysis. Mach. Learn. Knowl. Extr. 2026, 8, 15. [Google Scholar] [CrossRef] [Scilit]
- Pennisi, F.; Pinto, A.; Ricciardi, G.E.; Signorelli, C.; Gianfredi, V. Artificial Intelligence in Antimicrobial Stewardship: A Systematic Review and Meta-Analysis of Predictive Performance and Diagnostic Accuracy. Eur. J. Clin. Microbiol. Infect. Dis. 2025, 44, 463–513. [Google Scholar] [CrossRef] [Scilit] [PubMed]
- Pinto, A.; Pennisi, F.; Odelli, S.; De Ponti, E.; Veronese, N.; Signorelli, C.; Baldo, V.; Gianfredi, V. Artificial Intelligence in the Management of Infectious Diseases in Older Adults: Diagnostic, Prognostic, and Therapeutic Applications. Biomedicines 2025, 13, 2525. [Google Scholar] [CrossRef] [Scilit] [PubMed]
- Pennisi, F.; Borlini, S.; Harrison, H.; Cuciniello, R.; D’Amelio, A.C.; Barclay, M.; Ricciardi, G.E.; Lyratzopoulos, G.; Renzi, C. Cancer Risk Prediction Using Machine Learning for Supporting Early Cancer Diagnosis in Symptomatic Patients: A Systematic Review of Model Types. Cancer Med. 2025, 14, e71463. [Google Scholar] [CrossRef] [Scilit] [PubMed]
- International Energy Agency. Energy and AI. Available online: https://www.iea.org/reports/energy-and-ai (accessed on 2 September 2026).
- Siddik, M.A.B.; Shehabi, A.; Marston, L. The Environmental Footprint of Data Centers in the United States. Environ. Res. Lett. 2021, 16, 064017. [Google Scholar] [CrossRef] [Scilit]
- Kamiya, G.; Bertoldi, P. Energy Consumption in Data Centres and Broadband Communication Networks in the EU; JRC135926; Publications Office of the European Union: Luxembourg, 2024. [Google Scholar] [CrossRef]
- McKinsey & Company. The Data Center Balance: How US States Can Navigate the Opportunities and Challenges; McKinsey & Company: New York, NY, USA, 2025. [Google Scholar]
- Tao, Y.; Gao, P. Global Data Center Expansion and Human Health: A Call for Empirical Research. Eco-Environ. Health 2025, 4, 100157. [Google Scholar] [CrossRef] [Scilit] [PubMed]
- Shah, S.H. Four Water Insecurity Concerns about Datacenters Driving the AI Revolution. PLoS Water 2026, 5, e0000500. [Google Scholar] [CrossRef] [Scilit]
- Shehabi, A.; Smith, S.J.; Hubbard, A.; Newkirk, A.; Lei, N.; Siddik, M.A.B.; Holecek, B.; Koomey, J.; Masanet, E.; Sartor, D. 2024 United States Data Center Energy Usage Report; LBNL-2001637; Lawrence Berkeley National Laboratory: Berkeley, CA, USA, 2024. [Google Scholar]
- Lei, N.; Lu, J.; Shehabi, A.; Masanet, E. The Water Use of Data Center Workloads: A Review and Assessment of Key Determinants. Resour. Conserv. Recycl. 2025, 219, 108310. [Google Scholar] [CrossRef] [Scilit]
- Mytton, D. Author Correction: Data centre water consumption. npj Clean Water 2021, 4, 49. [Google Scholar] [CrossRef] [Scilit]
- Ebi, K.L.; Capon, A.; Berry, P.; Broderick, C.; de Dear, R.; Havenith, G. Hot Weather and Heat Extremes: Health Risks. Lancet 2021, 398, 698–708. [Google Scholar] [CrossRef] [Scilit] [PubMed]
- World Health Organization. WHO Global Air Quality Guidelines: Particulate Matter (PM2.5 and PM10), Ozone, Nitrogen Dioxide, Sulfur Dioxide and Carbon Monoxide; World Health Organization: Geneva, Switzerland, 2021. [Google Scholar]
- World Health Organization Regional Office for Europe. Environmental Noise Guidelines for the European Region; WHO Regional Office for Europe: Copenhagen, Denmark, 2018. [Google Scholar]
- Nucci, D.; Pennisi, F.; Pinto, A.; De Ponti, E.; Ricciardi, G.E.; Signorelli, C.; Veronese, N.; Castagna, A.; Maggi, S.; Cadeddu, C.; et al. Impact of Extreme Weather Events on Food Security among Older People: A Systematic Review. Aging Clin. Exp. Res. 2025, 37, 137. [Google Scholar] [CrossRef] [Scilit] [PubMed]
- Han, Y.; Wu, Z.; Li, P.; Wierman, A.; Ren, S. Health-Informed Computing: Estimating and Addressing the Public Health Impact of Data Centers. arXiv 2026, arXiv:2412.06288. [Google Scholar] [CrossRef] [Scilit]
- Miljković, D. Noise within a Data Center. In Proceedings of the 39th International Convention on Information and Communication Technology, Electronics and Microelectronics (MIPRO), Opatija, Croatia, 30 May 2016–3 June 2016; IEEE: New York, NY, USA, 2016; pp. 1145–1150. [Google Scholar] [CrossRef] [Scilit]
- Yun, D.J.; Choi, J.S.; Kim, C.Y.; Kim, H.J. Case Study on Noise Impact Assessments and Countermeasures for Emergency Generators of the Data Center Building. Trans. Korean Soc. Noise Vib. Eng. 2012, 22, 932–939. [Google Scholar] [CrossRef] [Scilit]
- Batterman, S.; Godwin, C.; Chernyak, S.; Jia, C.; Charles, S. Brominated Flame Retardants in Offices in Michigan, U.S.A. Environ. Int. 2010, 36, 548–556. [Google Scholar] [CrossRef] [Scilit] [PubMed]
- Sailor, D.J.; Samareh Abolhassani, S.; Martin, E.P. Data Center Waste Heat as an Emerging Urban Thermal Hazard: First Field Measurements of Neighborhood-Scale Air Temperature Impacts. J. Eng. Sustain. Build. Cities 2026, 7, 024501. [Google Scholar] [CrossRef] [Scilit]
- Molla, A. In My Backyard? Digital Heat Islands and the Environmental Justice of AI Infrastructure in Phoenix. Clim. Phys. Atmos. Sci. Sci. Insights Soc. Chall. 2026, 3–4, 100016. [Google Scholar] [CrossRef] [Scilit]
- Ngata, W.; Bashir, N.; Westerlaken, M.; Liote, L.; Chandio, Y.; Olivetti, E. The Cloud Next Door: Investigating the Environmental and Socioeconomic Strain of Datacenters on Local Communities. In Proceedings of the ACM SIGCAS/SIGCHI Conference on Computing and Sustainable Societies (COMPASS ’25); Association for Computing Machinery: New York, NY, USA, 2025; pp. 769–774. [Google Scholar] [CrossRef] [Scilit]
- Duinker, P.N.; Greig, L.A. The Impotence of Cumulative Effects Assessment in Canada: Ailments and Ideas for Redeployment. Environ. Manag. 2006, 37, 153–161. [Google Scholar] [CrossRef] [Scilit] [PubMed]
- Canter, L.; Ross, B. State of Practice of Cumulative Effects Assessment and Management: The Good, the Bad and the Ugly. Impact Assess. Proj. Apprais. 2010, 28, 261–268. [Google Scholar] [CrossRef] [Scilit]
- Sexton, K.; Linder, S.H. Cumulative Risk Assessment for Combined Health Effects from Chemical and Nonchemical Stressors. Am. J. Public Health 2011, 101, S81–S88. [Google Scholar] [CrossRef] [Scilit] [PubMed]
- Page, M.J.; McKenzie, J.E.; Bossuyt, P.M.; Boutron, I.; Hoffmann, T.C.; Mulrow, C.D.; Shamseer, L.; Tetzlaff, J.M.; Akl, E.A.; Brennan, S.E.; et al. The PRISMA 2020 Statement: An Updated Guideline for Reporting Systematic Reviews. BMJ 2021, 372, n71. [Google Scholar] [CrossRef] [Scilit] [PubMed]
- Rethlefsen, M.L.; Kirtley, S.; Waffenschmidt, S.; Ayala, A.P.; Moher, D.; Page, M.J.; Koffel, J.B.; PRISMA-S Group. PRISMA-S: An Extension to the PRISMA Statement for Reporting Literature Searches in Systematic Reviews. Syst. Rev. 2021, 10, 39. [Google Scholar] [CrossRef] [Scilit] [PubMed]
- Haddaway, N.R.; Collins, A.M.; Coughlin, D.; Kirk, S. The Role of Google Scholar in Evidence Reviews and Its Applicability to Grey Literature Searching. PLoS ONE 2015, 10, e0138237. [Google Scholar] [CrossRef] [Scilit] [PubMed]
- National Toxicology Program. Handbook for Conducting a Literature-Based Health Assessment Using OHAT Approach for Systematic Review and Evidence Integration; National Institute of Environmental Health Sciences: Research Triangle Park, NC, USA, 2019. [Google Scholar]
- Ouzzani, M.; Hammady, H.; Fedorowicz, Z.; Elmagarmid, A. Rayyan—A Web and Mobile App for Systematic Reviews. Syst. Rev. 2016, 5, 210. [Google Scholar] [CrossRef] [Scilit] [PubMed]
- Kmet, L.M.; Lee, R.C.; Cook, L.S. Standard Quality Assessment Criteria for Evaluating Primary Research Papers from a Variety of Fields; Alberta Heritage Foundation for Medical Research: Edmonton, AB, Canada, 2004. [Google Scholar] [CrossRef]
- Tufanaru, C.; Munn, Z.; Aromataris, E.; Campbell, J.; Hopp, L. Systematic Reviews of Effectiveness (2020). In JBI Manual for Evidence Synthesis; Aromataris, E., Lockwood, C., Porritt, K., Pilla, B., Jordan, Z., Eds.; JBI: Adelaide, Australia, 2024. [Google Scholar] [CrossRef] [Scilit]
- Campbell, M.; McKenzie, J.E.; Sowden, A.; Katikireddi, S.V.; Brennan, S.E.; Ellis, S.; Hartmann-Boyce, J.; Ryan, R.; Shepperd, S.; Thomas, J.; et al. Synthesis without Meta-Analysis (SWiM) in Systematic Reviews: Reporting Guideline. BMJ 2020, 368, l6890. [Google Scholar] [CrossRef] [Scilit] [PubMed]
- Ogilvie, D.; Fayter, D.; Petticrew, M.; Sowden, A.; Thomas, S.; Whitehead, M.; Worthy, G. The Harvest Plot: A Method for Synthesising Evidence about the Differential Effects of Interventions. BMC Med. Res. Methodol. 2008, 8, 8. [Google Scholar] [CrossRef] [Scilit] [PubMed]
- White, H.; Albers, B.; Gaarder, M.; Kornør, H.; Littell, J.; Marshall, Z.; Matthew, C.; Pigott, T.; Snilstveit, B.; Waddington, H.; et al. Guidance for Producing a Campbell Evidence and Gap Map. Campbell Syst. Rev. 2020, 16, e1125. [Google Scholar] [CrossRef] [Scilit] [PubMed]
- Morgan, R.L.; Thayer, K.A.; Bero, L.; Bruce, N.; Falck-Ytter, Y.; Ghersi, D.; Guyatt, G.; Hooijmans, C.; Langendam, M.; Mandrioli, D.; et al. GRADE: Assessing the Quality of Evidence in Environmental and Occupational Health. Environ. Int. 2016, 92–93, 611–616. [Google Scholar] [CrossRef] [Scilit] [PubMed]
- Chen, Y.; Wang, S.; Senga, J.R.L.; White, A.S.; Wong, A.Y.H.; Freese, L.M.; Bell, M.L.; Selin, N.E. Air Quality and Health Impacts of Data Center Electricity Demand in the United States. EarthArXiv 2026. [Google Scholar] [CrossRef] [Scilit]
- Chen, L.; Wemhoff, A.P. The Sustainability Benefits of Economization in Data Centers Containing Chilled Water Systems. Resour. Conserv. Recycl. 2023, 196, 107053. [Google Scholar] [CrossRef] [Scilit]
- Conaway, M.T.; Baldassano, J. It’s Only One More Data Center! When Scope Creep Becomes Sound Emissions Creep. In Proceedings of the INTER-NOISE and NOISE-CON Congress and Conference; Institute of Noise Control Engineering: Reston, VA, USA, 2024; Volume 269, pp. 206–215. [Google Scholar] [CrossRef] [Scilit]
- Dandres, T.; Vandromme, N.; Obrekht, G.; Wong, A.; Nguyen, K.K.; Lemieux, Y.; Cheriet, M.; Samson, R. Consequences of Future Data Center Deployment in Canada on Electricity Generation and Environmental Impacts: A 2015–2030 Prospective Study. J. Ind. Ecol. 2017, 21, 1312–1322. [Google Scholar] [CrossRef] [Scilit]
- Eslami, E. Air Quality and Greenhouse Gas Emissions Assessment of Data Centers in Texas: Quantifying Impacts and Environmental Tradeoffs. arXiv 2025, arXiv:2509.21312. [Google Scholar]
- Han, Y.; Li, P.; Wierman, A.; Ren, S. Small Bottle, Big Pipe: Quantifying and Addressing the Impact of Data Centers on Public Water Systems. arXiv 2026, arXiv:2603.02705. [Google Scholar] [CrossRef] [Scilit]
- Hu, H.; Shehabi, A.; He, C.; Sanders, K.; Zhang, J. Spatially Concentrated Heat Emissions from Data Centers Lead to Localized Urban Warming and Heat Exposure. Res. Sq. 2026. [Google Scholar] [CrossRef] [Scilit] [PubMed]
- Jia, Y. The Local Air Pollution of Data Centers. SSRN 2026. [Google Scholar] [CrossRef] [Scilit]
- Karimi, L.; Yacuel, L.; Degraft-Johnson, J. Water-Energy Tradeoffs in Data Centers: A Case Study in Hot-Arid Climates. Resour. Conserv. Recycl. 2022, 181, 106194. [Google Scholar] [CrossRef] [Scilit]
- Muller, N.Z. Measuring the Impact of Data Centers in the United States Economy: Monetary Damage from Air Pollution and Greenhouse Gas Emissions; National Bureau of Economic Research: Cambridge, MA, USA, 2026. [Google Scholar] [CrossRef] [Scilit]
- Olaguer, E.P.; Knipping, E.; Shaw, S.; Ravindran, S. Microscale Air Quality Impacts of Distributed Power Generation Facilities. J. Air Waste Manag. Assoc. 2016, 66, 795–806. [Google Scholar] [CrossRef] [Scilit] [PubMed]
- Xiao, T.; Fuso Nerini, F.; Matthews, H.D.; Tavoni, M.; You, F. Environmental Impact and Net-Zero Pathways for Sustainable Artificial Intelligence Servers in the USA. Nat. Sustain. 2025, 8, 1541–1553. [Google Scholar] [CrossRef] [Scilit]
- Al Kez, D.; Foley, A.M.; Laverty, D.; Furszyfer Del Rio, D.; Sovacool, B. Exploring the Sustainability Challenges Facing Digitalization and Internet Data Centers. J. Clean. Prod. 2022, 371, 133633. [Google Scholar] [CrossRef] [Scilit]
- Baniata, H.; Mahmood, S.; Kertesz, A. Assessing Anthropogenic Heat Flux of Public Cloud Data Centers: Current and Future Trends. PeerJ Comput. Sci. 2021, 7, e478. [Google Scholar] [CrossRef] [Scilit] [PubMed]
- Chakraborty, T.C. Local Heat Islands and Vegetation Losses Are Microclimatic Consequences of Global Data Centers. EarthArXiv 2026. [Google Scholar] [CrossRef] [Scilit]
- Herrera, M.; Xie, X.; Menapace, A.; Zanfei, A.; Brentan, B.M. Sustainable AI Infrastructure: A Scenario-Based Forecast of Water Footprint under Uncertainty. J. Clean. Prod. 2025, 526, 146528. [Google Scholar] [CrossRef] [Scilit]
- Li, P.; Yang, J.; Islam, M.A.; Ren, S. Making AI Less “Thirsty”: Uncovering and Addressing the Secret Water Footprint of AI Models. Commun. ACM 2025, 68, 54–61. [Google Scholar] [CrossRef] [Scilit]
- Marinoni, A.; Lio’, P.; Cambria, E.; Dal Zilio, L.; Lin, W.; Dalla Mura, M.; Chanussot, J.; Ragusa, E.; Mengaldo, G.; Tso, C.Y.; et al. The Data Heat Island Effect: Quantifying the Impact of AI Data Centers in a Warming World. arXiv 2026, arXiv:2603.20897. [Google Scholar]
- Bux, C.; Rana, R.L.; Lombardi, M.; Giungato, P.; Tricase, C. A Critical Analysis of Global Warming Potential of Data Centers in the Digital Era. Int. J. Life Cycle Assess. 2025, 30, 2390–2402. [Google Scholar] [CrossRef] [Scilit]
- Hankendi, C.; Coskun, A.K.; Sovacool, B.K. Beyond the Carbon Emissions of Artificial Intelligence (AI): A Whole-Systems Energy and Environmental Sustainability Analysis of Datacenters in Denmark, Germany and Norway. Energy Res. Soc. Sci. 2026, 138, 104839. [Google Scholar] [CrossRef] [Scilit]
- Jerléus, K.; Ibrahim, M.A.; Augustsson, A. Environmental Footprints of the Data Center Service Sector in Sweden. Heliyon 2024, 10, e31290. [Google Scholar] [CrossRef] [Scilit] [PubMed]
- Whitehead, B.; Andrews, D.; Shah, A. The Life Cycle Assessment of a UK Data Centre. Int. J. Life Cycle Assess. 2015, 20, 332–349. [Google Scholar] [CrossRef] [Scilit]
- Jiang, F.; Duan, C.; Chen, B. Facility-Level Energy-Driven Water Footprint and Scarcity Implications of Chinese Data Centers: A Bottom-Up Analysis and Scenario-Based Projection. Appl. Energy 2025, 399, 126522. [Google Scholar] [CrossRef] [Scilit]
- Ni, W.; Hu, X.; Du, H.; Kang, Y.; Ju, Y.; Wang, Q. CO2 Emission-Mitigation Pathways for China’s Data Centers. Resour. Conserv. Recycl. 2024, 202, 107383. [Google Scholar] [CrossRef] [Scilit]
- Zhou, F.; Wang, R.; Ma, G. Carbon Emission Scenario Analysis of Data Centers in China under the Carbon Neutrality Target. Int. J. Refrig. 2024, 168, 648–661. [Google Scholar] [CrossRef] [Scilit]
- Zhou, K.; Yang, Z.; Lu, X.; Hu, R. Carbon Emissions Flow and Inequality Embodied in Cross-Regional Computility Transfer in China. Humanit. Soc. Sci. Commun. 2026, 13, 123. [Google Scholar] [CrossRef] [Scilit]
- Liang, G. The Cloud’s Thirst: Quantifying AI’s Water Footprint and Its Impact on the Water-Energy Nexus in São Paulo, Brazil. Camb. Prism. Water 2026, 4, 1–6. [Google Scholar] [CrossRef] [Scilit]
- Jalilzadeh, S.Z.; Asgari, M.; Sadeghi, M.E. A Quantitative Noise Survey in a General Room-Based Data Center. Int. J. Occup. Hyg. 2014, 6, 16–22. [Google Scholar]
- Alnuaimy, A.; Shushura, O.; Zhyrov, G. Impact of Noise Inside Server Room. CEUR Workshop Proc. 2022, 3149, 9–16. [Google Scholar]
- Popovich, N.; Figueroa, A.J.; Sunter, D.A.; Shah, M. Identifying Disadvantaged Communities in the United States: An Energy-Oriented Mapping Tool That Aggregates Environmental and Socioeconomic Burdens. Energy Res. Soc. Sci. 2024, 109, 103391. [Google Scholar] [CrossRef] [Scilit]
- Pinto, A.; Pennisi, F.; Borlini, S.; De Ponti, E.; Signorelli, C.; Cozza, A.; Baldo, V.; Gianfredi, V. Effects of Heat Waves on Hospitalizations, Emergency Department Visits, and Outpatient Care in Frail Older Adults: A Systematic Review and Meta-Analysis. Diseases 2026, 14, 176. [Google Scholar] [CrossRef] [Scilit] [PubMed]
- National Institute for Occupational Safety and Health. Criteria for a Recommended Standard: Occupational Noise Exposure, Revised Criteria 1998; DHHS (NIOSH) Publication No. 98-126; U.S. Department of Health and Human Services, Centers for Disease Control and Prevention, National Institute for Occupational Safety and Health: Cincinnati, OH, USA, 1998.
- Basner, M.; Brink, M.; Davis, A.; van Kamp, I.; Kujawa, S.G.; Münzel, T.; Smith, M.G. Auditory and Non-Auditory Effects of Noise on Health: Updated Evidence and Future Directions. Environ. Res. 2026, 302, 124648. [Google Scholar] [CrossRef] [Scilit] [PubMed]
- Burnett, R.; Chen, H.; Szyszkowicz, M.; Fann, N.; Hubbell, B.; Pope, C.A.; Apte, J.S.; Brauer, M.; Cohen, A.; Weichenthal, S.; et al. Global Estimates of Mortality Associated with Long-Term Exposure to Outdoor Fine Particulate Matter. Proc. Natl. Acad. Sci. USA 2018, 115, 9592–9597. [Google Scholar] [CrossRef] [Scilit] [PubMed]
- Lei, N.; Masanet, E. Climate- and Technology-Specific PUE and WUE Estimations for U.S. Data Centers Using a Hybrid Statistical and Thermodynamics-Based Approach. Resour. Conserv. Recycl. 2022, 182, 106323. [Google Scholar] [CrossRef] [Scilit]
- Chien, A.A.; Gupta, U.; Ren, S.; Sriraman, A.; Tomlinson, B. Strategies and Design for Increasing AI Sustainability. Nat. Rev. Clean Technol. 2026, 2, 624–638. [Google Scholar] [CrossRef] [Scilit]
- Barnett-Itzhaki, Z. The Water Footprint of Artificial Intelligence: Emerging Solutions and Governance Imperatives. Water Res. 2026, 299, 125866. [Google Scholar] [CrossRef] [Scilit] [PubMed]
- Etter, R.G.; Maxcy-Brown, J.; Barnett, M.O. Affordability of Community Water Systems and Private, Self-Supply Drinking Water Wells. PLoS Water 2025, 4, e0000423. [Google Scholar] [CrossRef] [Scilit]
- Al Kez, D.; Foley, A.M.; Wong, B.M.H.; Dolfi, A.; Srinivasan, G. AI-Driven Cooling Technologies for High-Performance Data Centres: State-of-the-Art Review and Future Directions. Sustain. Energy Technol. Assess. 2025, 82, 104511. [Google Scholar] [CrossRef] [Scilit]
- Pennisi, F.; Pinto, A.; Nucci, D.; Barbano, M.; Cozza, A.; Signorelli, C.; Baldo, V.; Gianfredi, V. Food Security in Italian Adults: Associations with Sociodemographic Characteristics, Lifestyle Behaviours and Food-App Use in a Cross-Sectional Study. Int. J. Food Sci. Nutr. 2026, 77, 473–483. [Google Scholar] [CrossRef] [Scilit] [PubMed]
- Stacchini, L.; De Ponti, E.; Ricciardi, G.E.; Pinto, A.; Pennisi, F.; Minutolo, G.; Nucci, D.; Signorelli, C.; Baldo, V.; Gianfredi, V. Investigating the Impact of Demographic, Economic, Governance, and Health Indicators on the Global Burden of Disease: A Theory-Informed Exploratory Cross-Country Analysis of 26 European Nations. J. Public Health 2026. [Google Scholar] [CrossRef] [Scilit]
- Pinto, A.; Pennisi, F.; Signorelli, C. Healthcare Expenditure and Health System Efficiency in 25 European Countries: A Multidimensional Data Envelopment Analysis with Bootstrap Correction and Second-Stage Regression. Epidemiologia 2026, 7, 92. [Google Scholar] [CrossRef] [Scilit] [PubMed]
- Hajat, A.; Hsia, C.; O’Neill, M.S. Socioeconomic Disparities and Air Pollution Exposure: A Global Review. Curr. Environ. Health Rep. 2015, 2, 440–450. [Google Scholar] [CrossRef] [Scilit] [PubMed]
- Anderson, L.B.; Holm, R.H.; Black, C.; Biddle, D.J.; Chiu, W.A.; Bhatnagar, A.; Smith, T. An Environmental Vulnerability Index Framework Supporting Targeted Public Health Interventions at the Census Tracts Level. J. Expo. Sci. Environ. Epidemiol. 2026, 36, 77–88. [Google Scholar] [CrossRef] [Scilit] [PubMed]
- De Vries-Gao, A. The Carbon and Water Footprints of Data Centers and What This Could Mean for Artificial Intelligence. Patterns 2026, 7, 101430. [Google Scholar] [CrossRef] [Scilit] [PubMed]
- Kuzma, S.; Bierkens, M.F.P.; Lakshman, S.; Luo, T.; Saccoccia, L.; Sutanudjaja, E.H.; van Beek, R. Aqueduct 4.0: Updated Decision-Relevant Global Water Risk Indicators; Technical Note; World Resources Institute: Washington, DC, USA, 2023. [Google Scholar] [CrossRef] [Scilit]
- Farquharson, D.; Jaramillo, P.; Samaras, C. Sustainability Implications of Electricity Outages in Sub-Saharan Africa. Nat. Sustain. 2018, 1, 589–597. [Google Scholar] [CrossRef] [Scilit]
- Wheeler, M.R.; Everett, B.; Williamson, S.M.; Prybutok, V. Infrasound and Low-Frequency Noise in Data Center Environments: A Narrative Review Toward Health-Protective Acoustic Design Standards. Clean Technol. 2026, 8, 126. [Google Scholar] [CrossRef] [Scilit]
- Wakefield, J. Ecologic Studies Revisited. Annu. Rev. Public Health 2008, 29, 75–90. [Google Scholar] [CrossRef] [Scilit] [PubMed]
- Pinto, A.; Minutolo, G.; Pennisi, F.; Stacchini, L.; De Ponti, E.; Ricciardi, G.E.; Nucci, D.; Signorelli, C.; Baldo, V.; Gianfredi, V. Quality, Environmental Contaminants and Disease Burden in Europe: An Ecological Analysis of Associations with Disability-Adjusted Life Years. Environments 2026, 13, 36. [Google Scholar] [CrossRef] [Scilit]
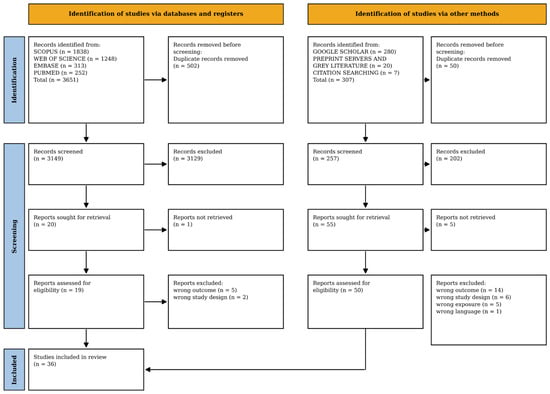
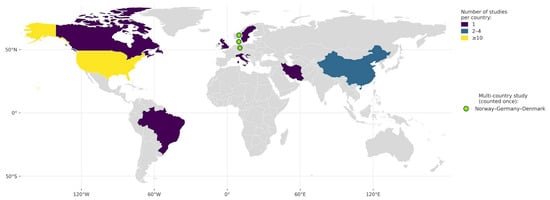
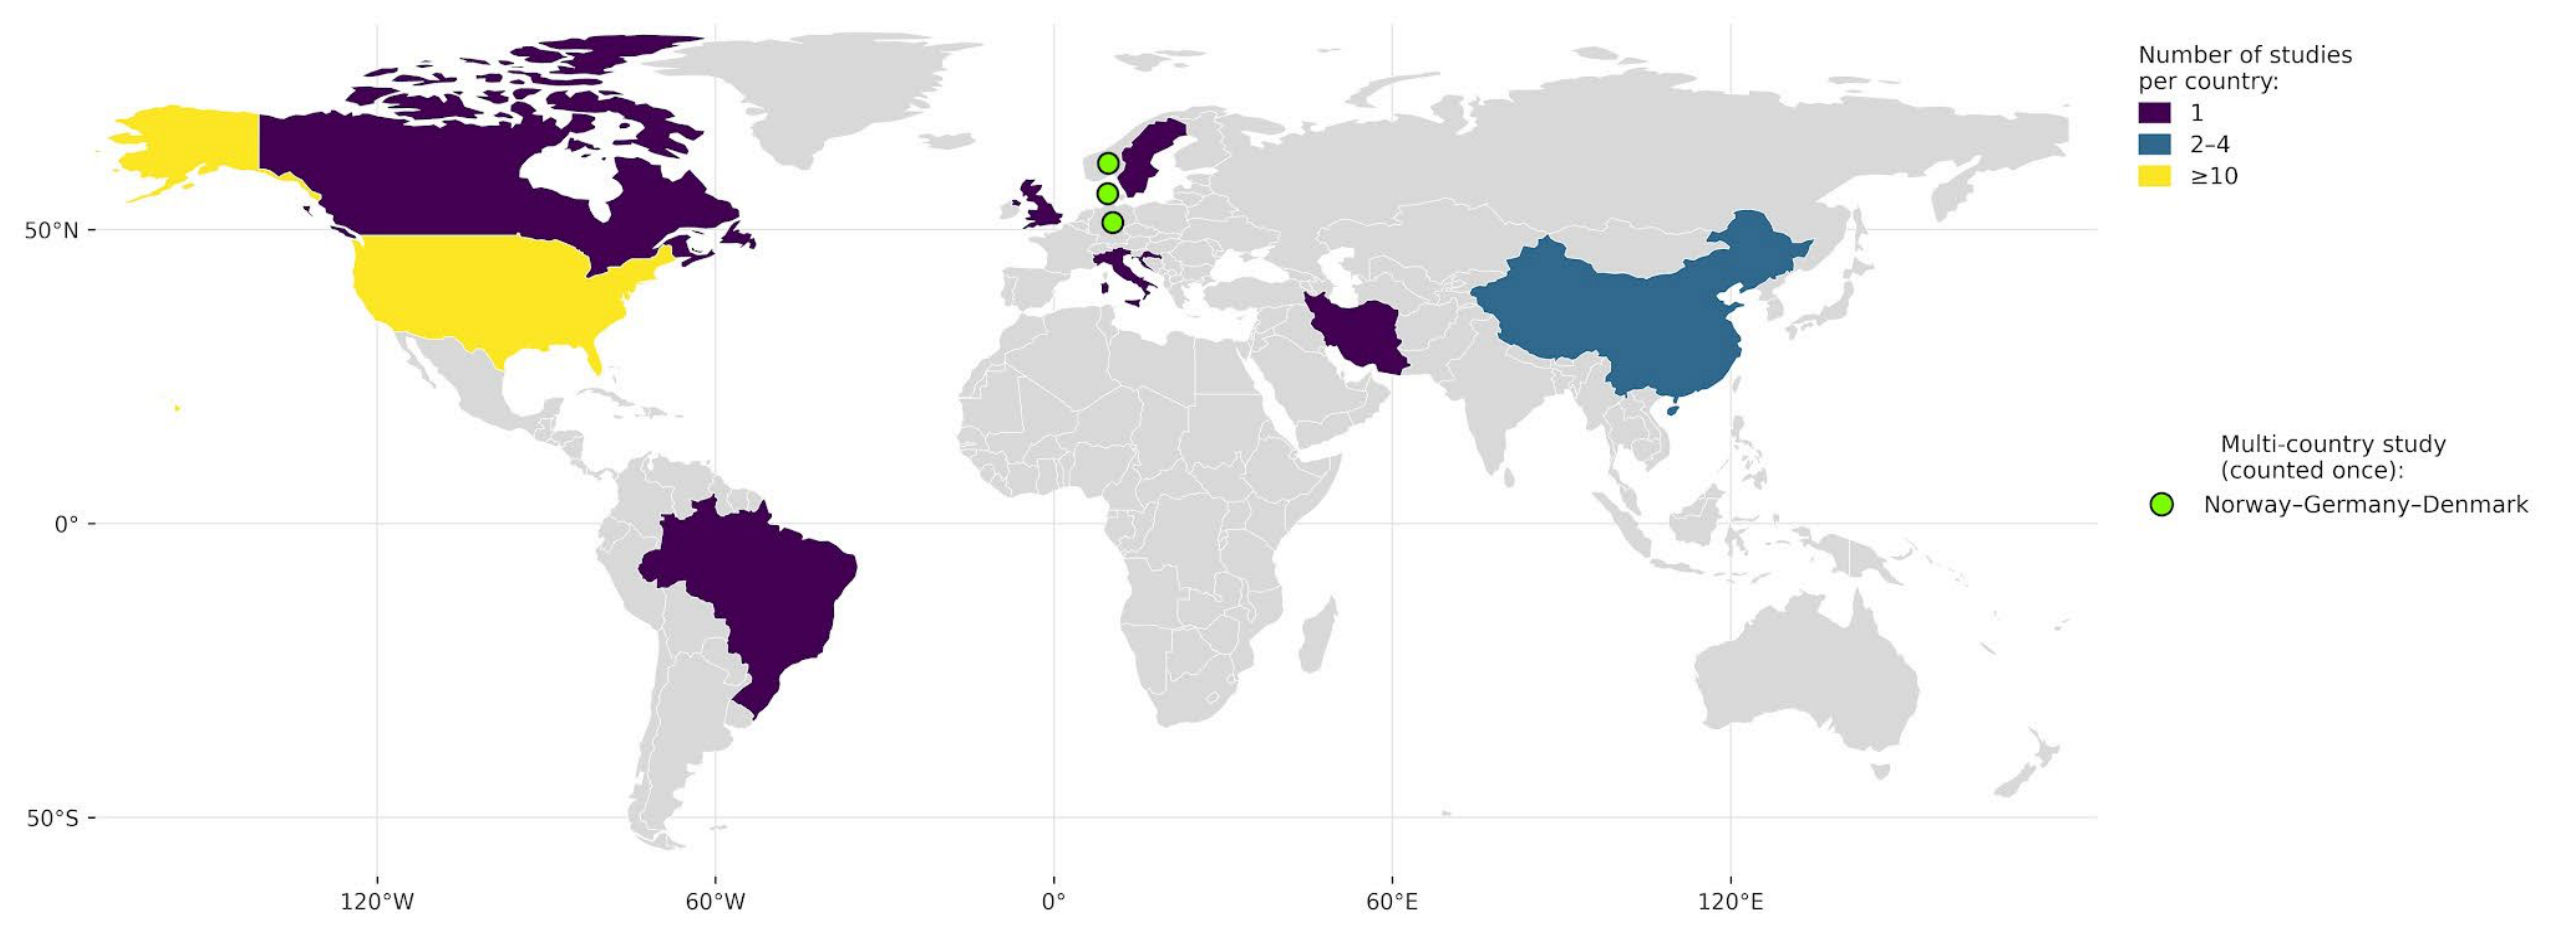
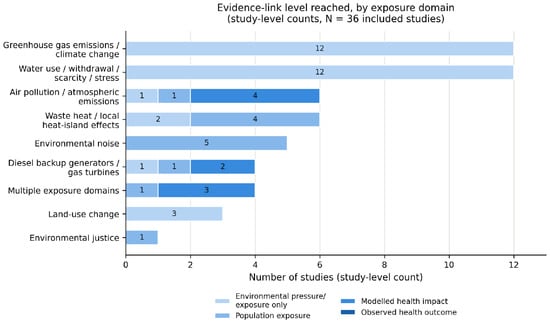
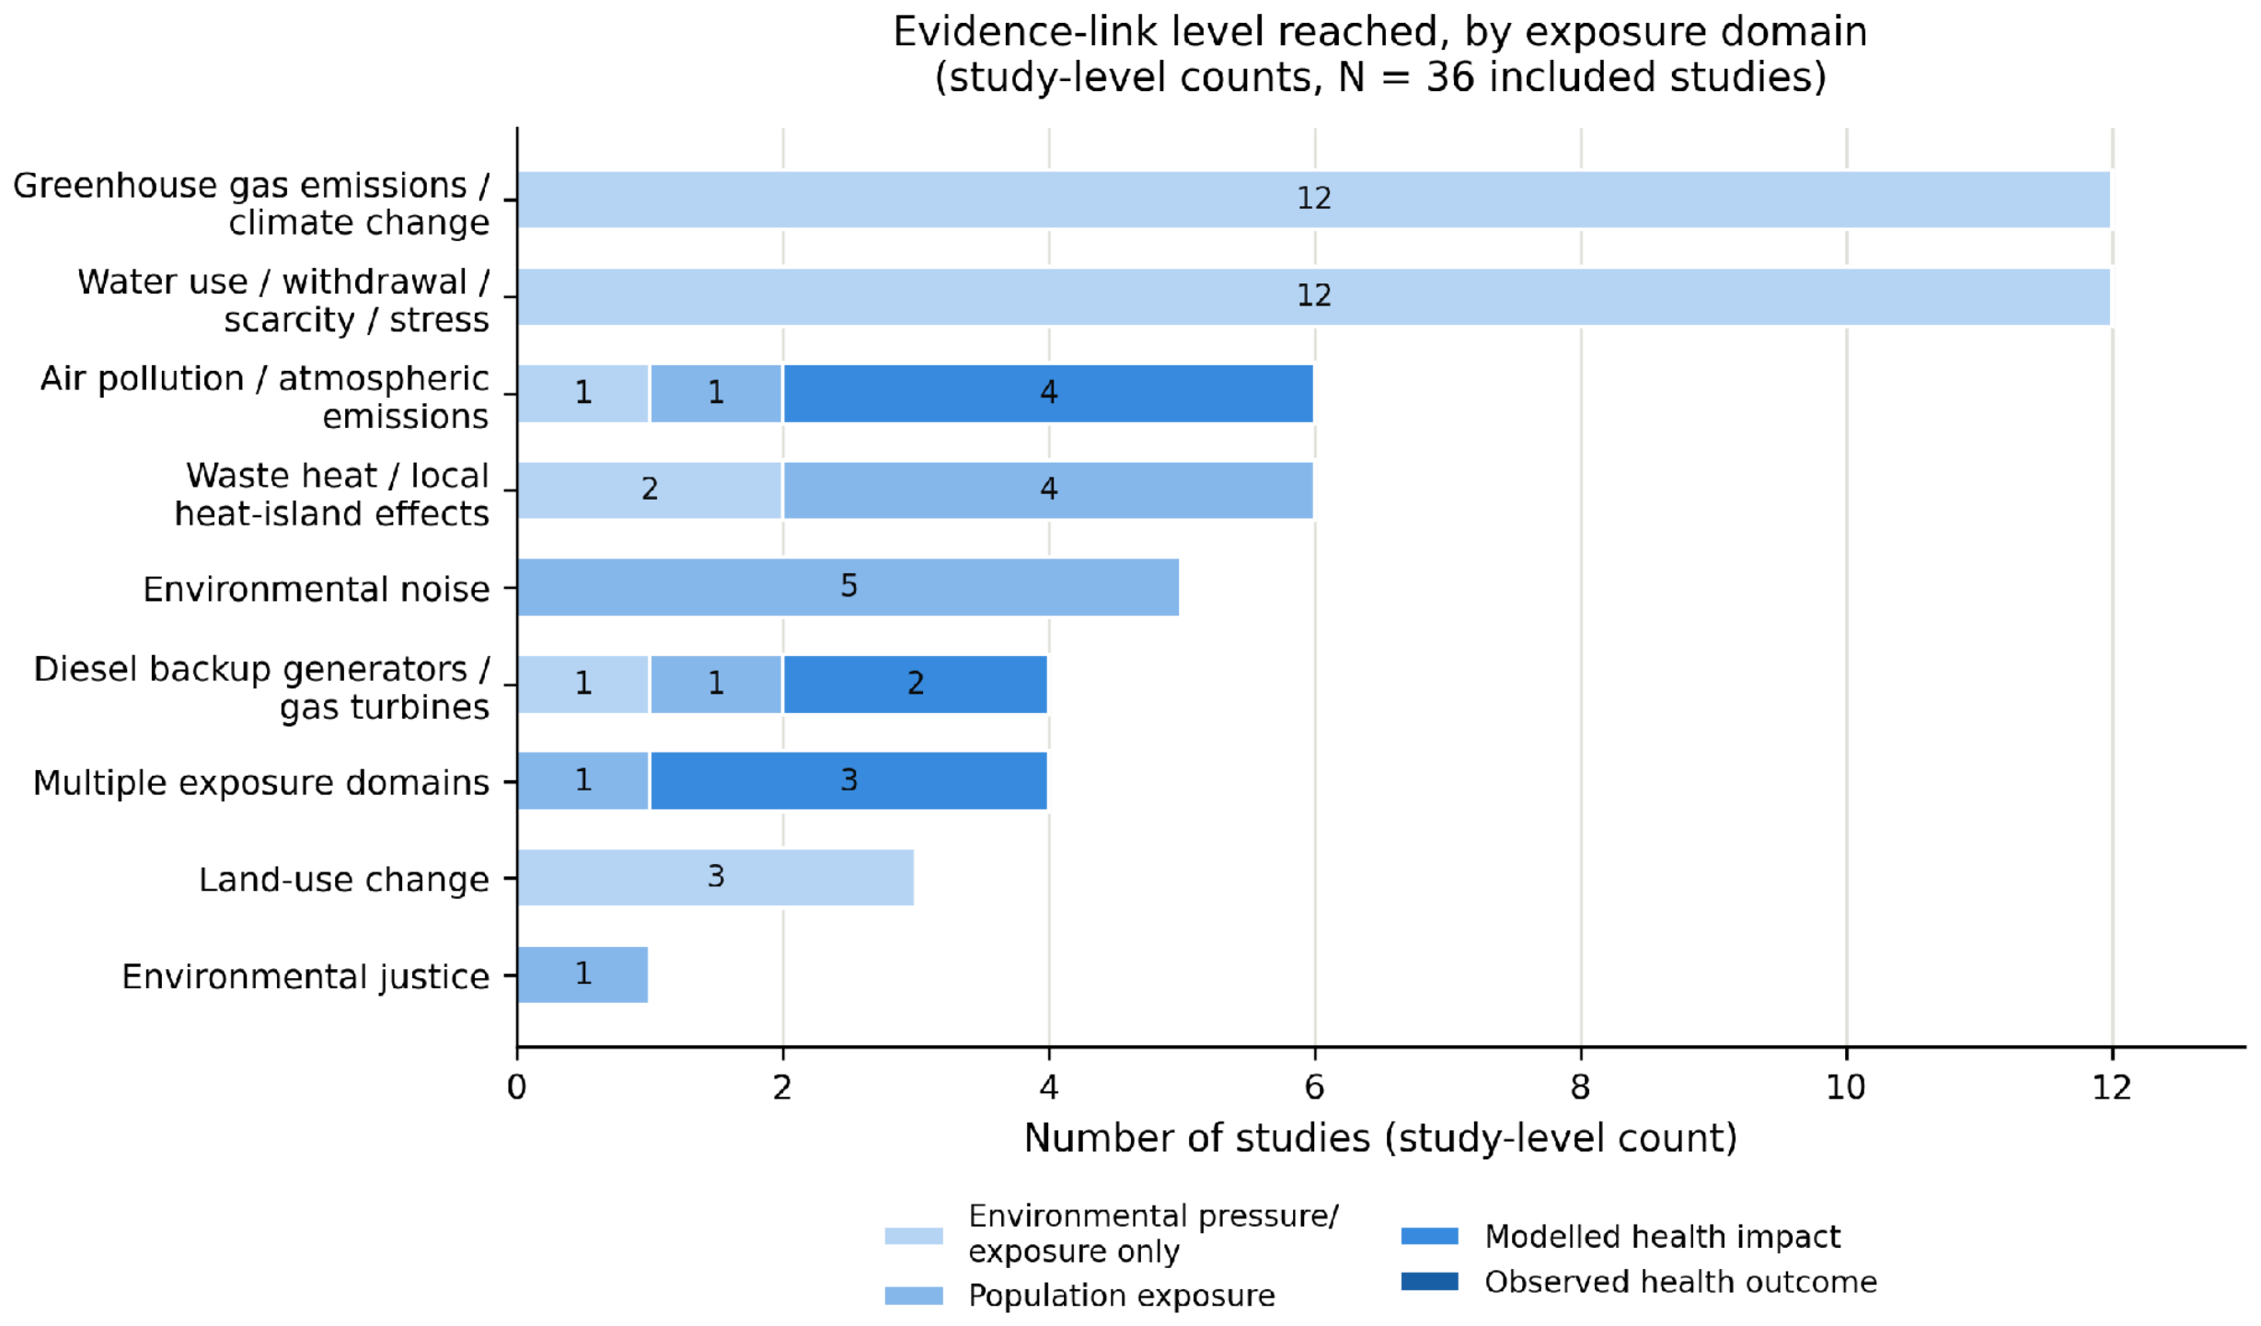
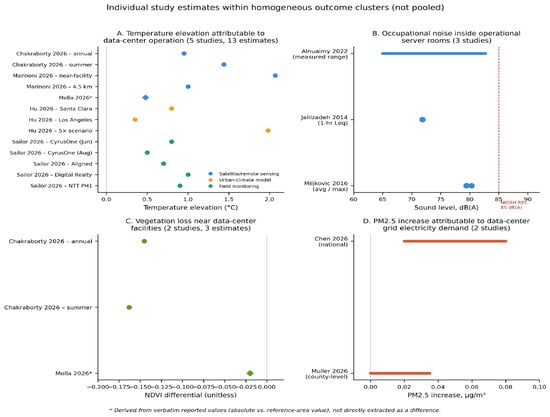
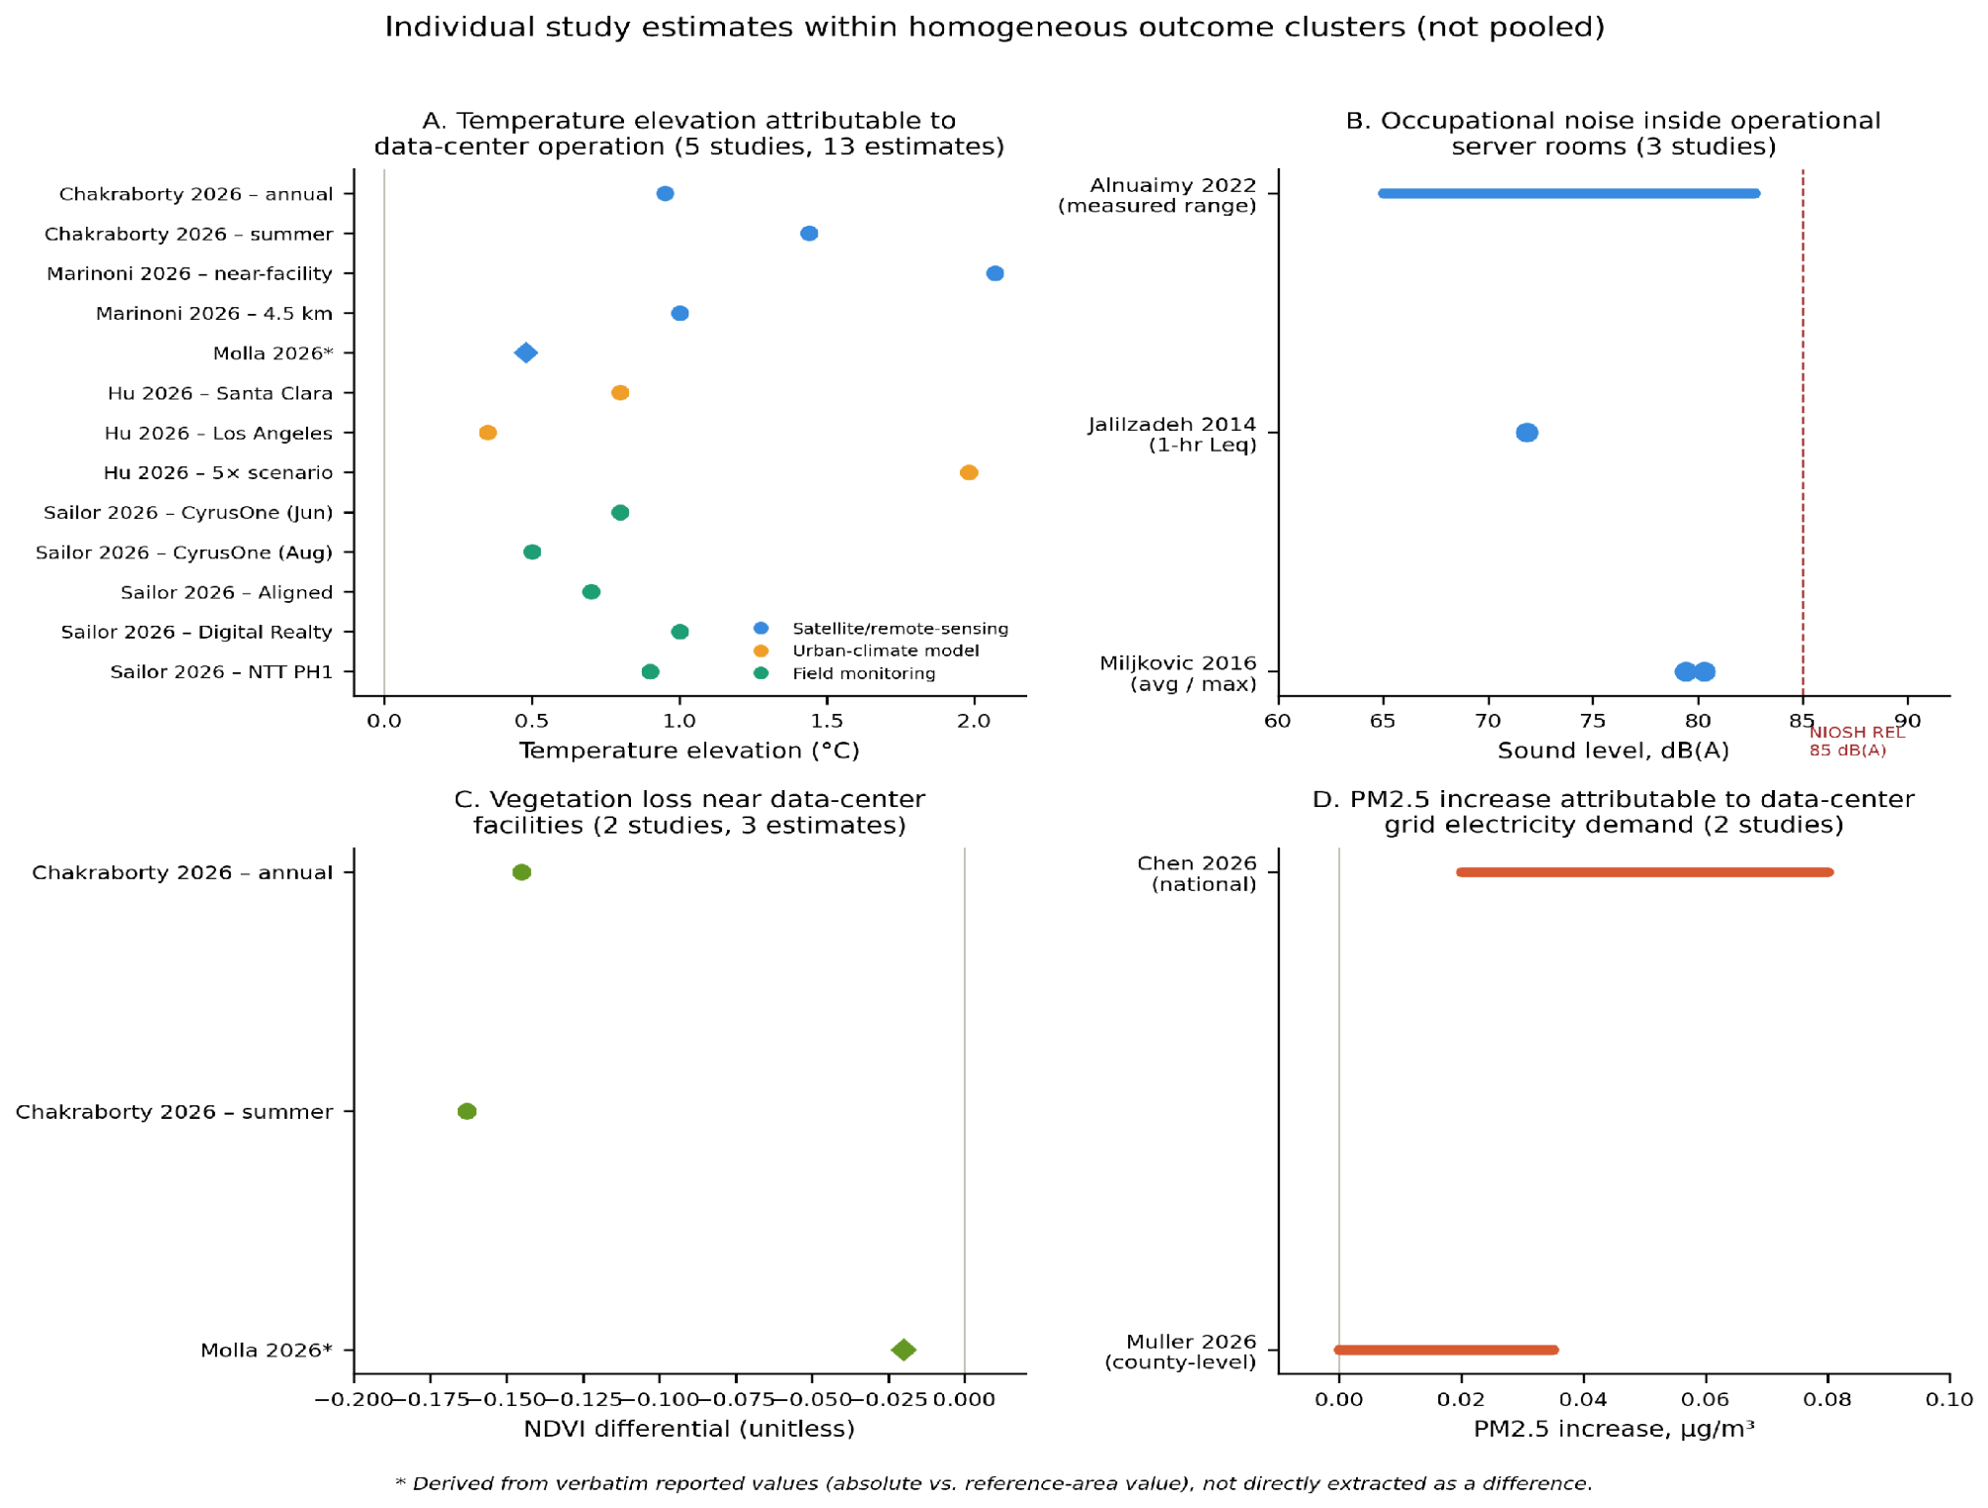
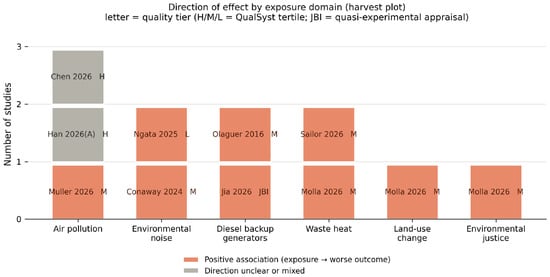
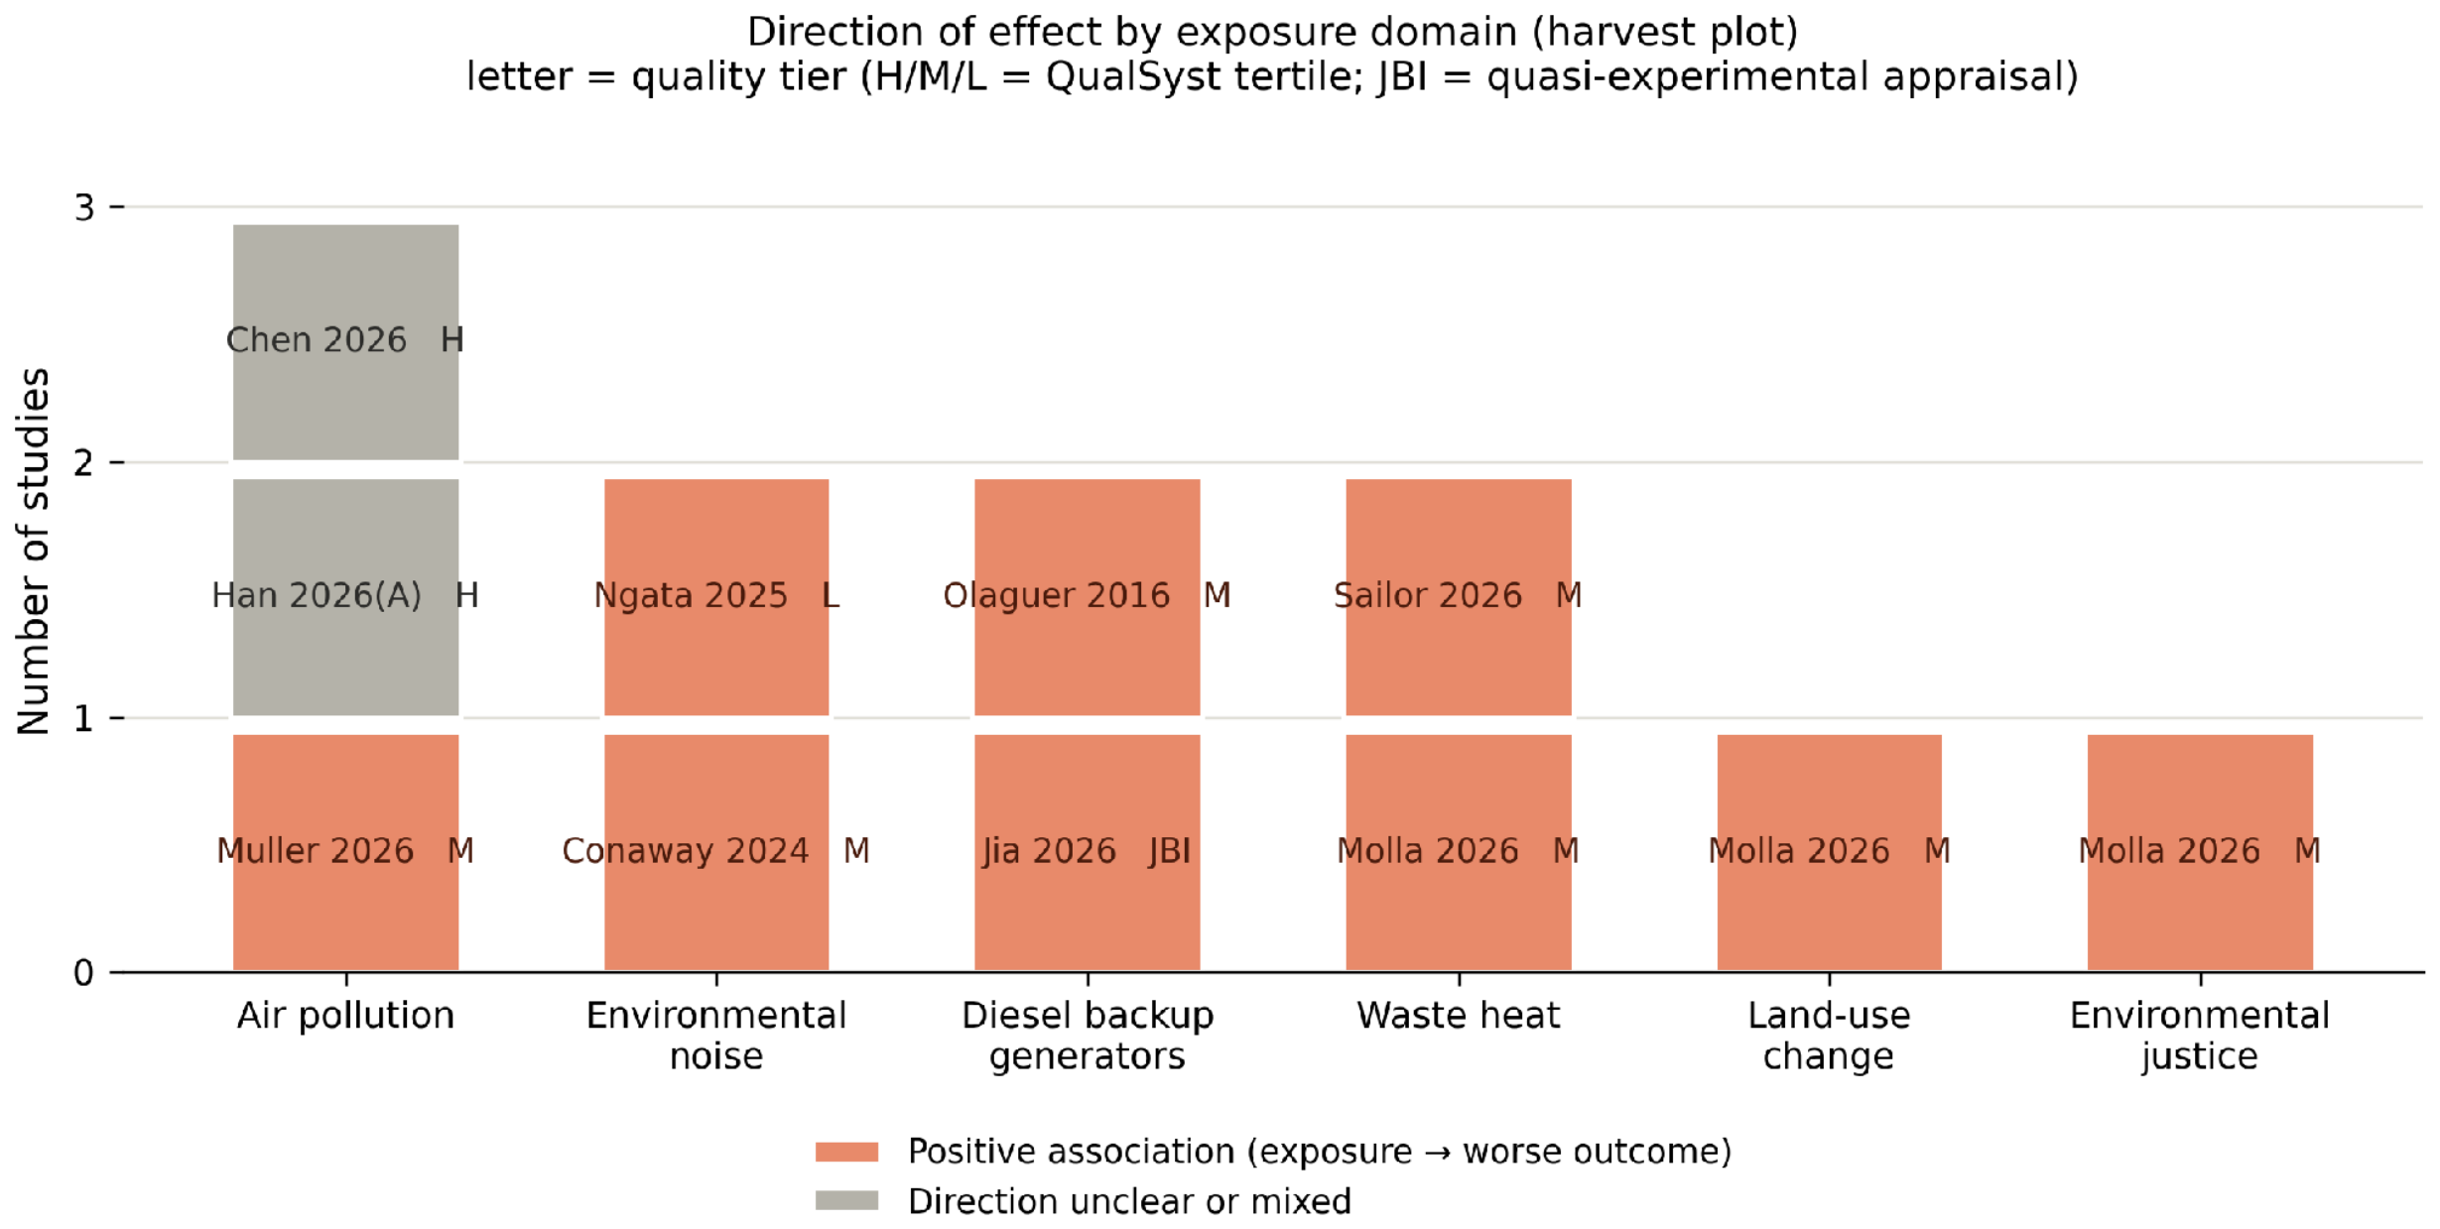
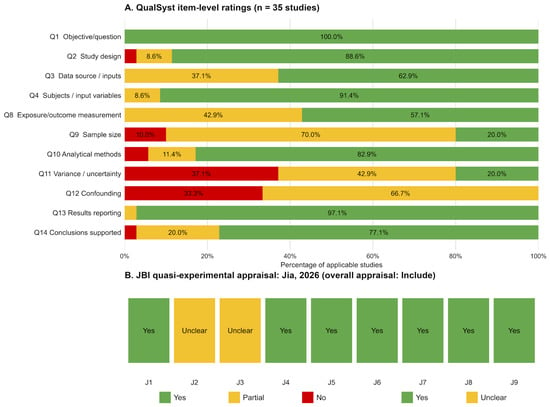
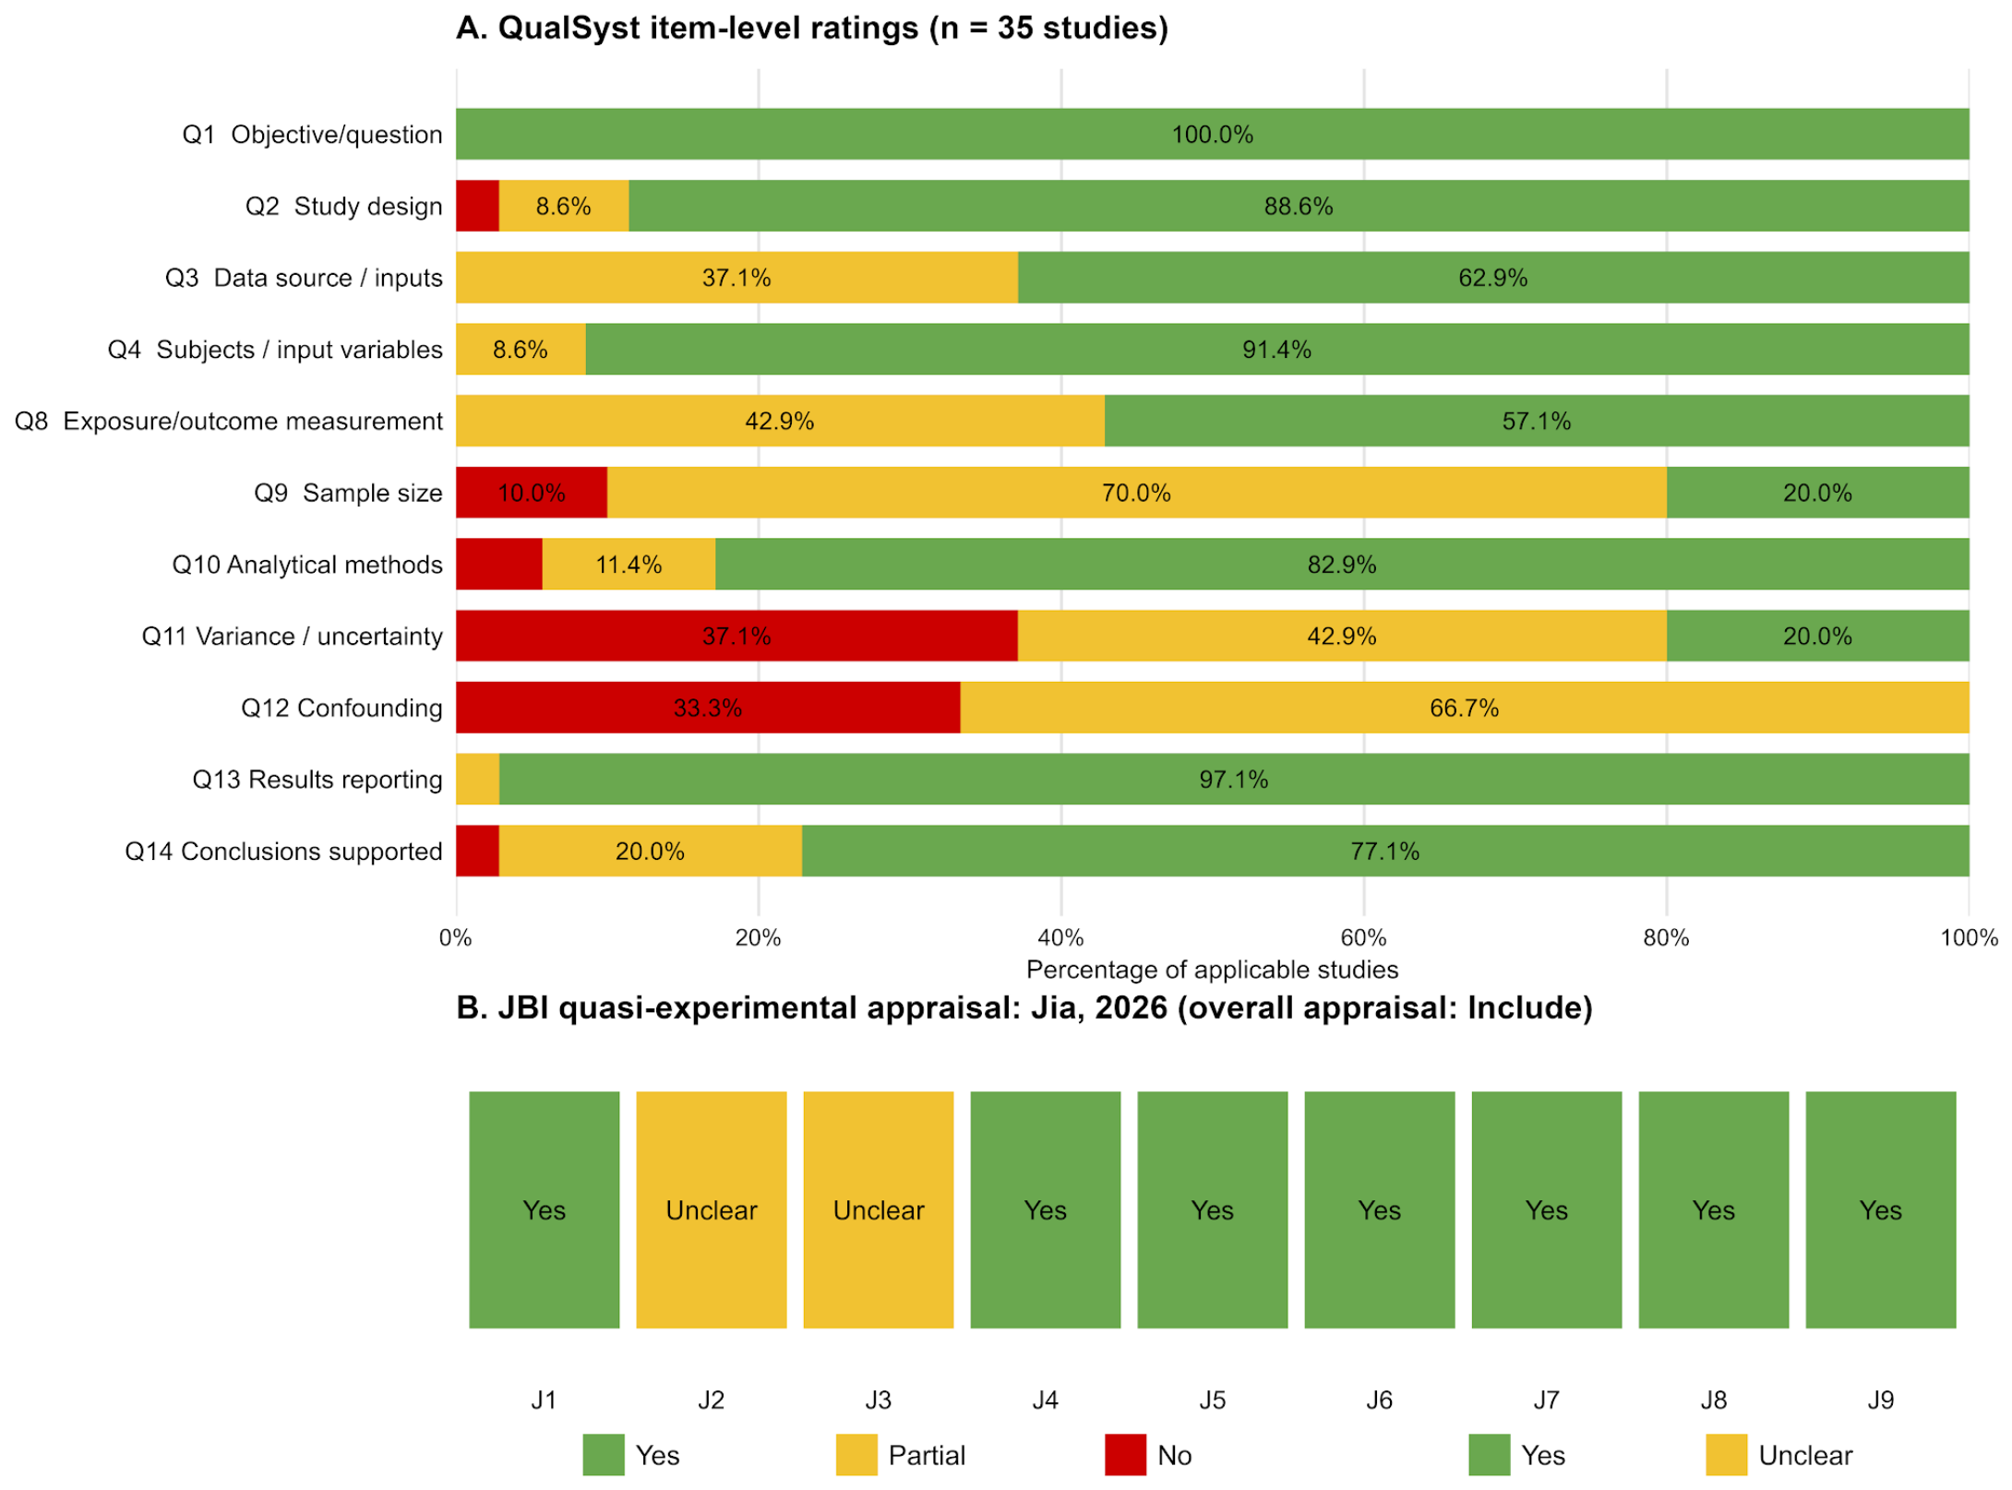

Disclaimer/Publisher’s Note: The statements, opinions and data contained in all publications are solely those of the individual author(s) and contributor(s) and not of MDPI and/or the editor(s). MDPI and/or the editor(s) disclaim responsibility for any injury to people or property resulting from any ideas, methods, instructions or products referred to in the content. |
© 2026 by the authors. Licensee MDPI, Basel, Switzerland. This article is an open access article distributed under the terms and conditions of the Creative Commons Attribution (CC BY) license.