


Abstract
Avocado-processing residues can support circular biorefinery development, but optimization strategies must be evaluated with harmonized environmental and economic boundaries to avoid burden shifting. This study compares a baseline thermal-extractive avocado oil biorefinery (S0) with three optimized alternatives: green chemistry (S1), heat integration (S2), and water integration (S3). The comparison uses a functional unit of 1 kg avocado oil at the biorefinery gate, a limited cradle-to-biorefinery-gate boundary, subdivision as the main allocation approach, deterministic life cycle impact assessment, techno-economic assessment, Monte Carlo uncertainty, and allocation sensitivity. Deterministic results show that S2 provides the largest climate-change reduction, decreasing impacts from 3.73 to 1.65 kg CO2 eq kg−1 oil (−55.8%), while also improving economic performance with the highest ROI (100.6%), IRR (55.0%), and the shortest simple payback time (1.75 years). S3 provides the strongest deterministic water-related benefit within the selected LCIA categories, reducing freshwater eutrophication by 85.9% and water use by 10.0% relative to S0. S3 shows a clear freshwater-eutrophication advantage over S0 and S1, with non-overlapping uncertainty intervals. Its marine-eutrophication benefit is more modest, as the intervals partially overlap with those of S0. In contrast, S1 increases climate change by 15.3% and marine eutrophication by 11.1%, indicating that solvent substitution is not automatically environmentally preferable when upstream solvent burdens are included. The results demonstrate that heat integration is the most promising economic and climate-mitigation lever, whereas water integration is the most robust eutrophication-mitigation lever. The main contribution is an uncertainty-aware LCA-TEA framework that distinguishes criterion-specific scenario advantages rather than assigning a single universal best configuration.
1. Introduction
Agricultural side streams are increasingly framed as strategic feedstocks for the circular bioeconomy because they can expand biomass valorization without additional land occupation for dedicated crops and can reduce unmanaged organic waste streams. Avocado-focused reviews and bibliometric analyses show that peels, seeds, pulp residues, and non-edible fractions are being reconsidered as sources of oil, antioxidants, biochar, fuels, and other value-added products, yet these streams remain far from full industrial integration [1,2,3]. This underutilization is especially relevant in Colombia and other agro-based economies where residue valorization is tied to environmental performance as well as to rural development, distributed processing, and regional biorefinery opportunities [4,5].
Within that context, avocado-related life cycle evidence remains limited and fragmented. Some studies examine avocado supply chains or rural biorefineries at a small scale [4,6], while others focus on the technical or environmental appraisal of extractive-based valorization systems in the Colombian Caribbean [5,7,8]. Meramo et al. advanced this field by reporting a thermal-extractive avocado oil biorefinery that converts non-edible avocado side streams into avocado oil, biochar, pulp without fat, chlorophyll-rich extract, and treated peel, thereby establishing a reference configuration already grounded in process simulation, TEA, and LCA [9].
The need to optimize that reference system follows directly from the baseline results. The published avocado biorefinery exhibited operating-cost pressure driven largely by raw materials and utilities, while its environmental profile was shaped by energy demand, steam use, cooling-related services, solvent use, and wastewater management [9]. Related Colombian avocado biorefinery assessments also indicate that resource efficiency and environmental burdens are sensitive to process configuration, utility consumption, foreground inventory treatment, and regional background assumptions [4,7,8,10]. These findings make the system suitable for comparative optimization rather than a single-variable improvement exercise.
At the broader biorefinery scale, combined TEA-LCA has become a key decision framework for identifying whether process modifications generate real sustainability gains or simply shift burdens across categories and cost structures [11,12,13]. Recent reviews and integrated case studies emphasize that meaningful scenario comparison requires harmonized functional units, aligned system boundaries, explicit treatment of multifunctionality, and interpretation of environmental and economic indicators side by side rather than in isolation [11,12,13,14]. This comparative logic is especially important for emerging biorefineries, where process improvements often affect utilities, chemicals, equipment networks, and capital structure simultaneously.
Among the optimization levers most relevant to avocado oil biorefineries are solvent substitution, heat integration, and water integration. Green-solvent literature shows that solvent choice can dominate safety, toxicity, and upstream environmental burdens in extraction systems, making substitution a plausible route to reduce fossil dependence and hazardous emissions [15,16,17]. In parallel, pinch analysis and process-integration methods have repeatedly shown that systematic heat recovery can reduce external heating and cooling utilities in bioprocesses and biorefineries [13,18,19]. Water-network integration follows the same resource-efficiency rationale by minimizing freshwater intake and wastewater generation, although its net sustainability benefit still needs to be verified through harmonized LCA-TEA rather than inferred from water savings alone [8,18].
Despite this conceptual maturity, the avocado literature still lacks a harmonized comparison in which green chemistry, heat integration, and water integration are evaluated as alternative optimization pathways within the same reference biorefinery. Existing studies have mapped biomass potential [1,2,3], explored Colombian rural and multi-feedstock configurations [4,5], assessed extractive-based avocado systems [7,8], or quantified baseline and heat-integrated avocado routes separately [9,10]. They do not yet provide a four-scenario framework anchored to a common functional unit, common allocation logic, common proxy disclosure, and common interpretation sequence.
Accordingly, this study compares three process-optimization strategies for an avocado oil biorefinery, namely green chemistry (S1), heat integration (S2), and water integration (S3), against a previously published thermal-extractive reference scenario (S0) using a harmonized TEA-LCA framework. The contribution of the work is threefold: it integrates a scenario-specific methodology with a common exclusion of foreground transport across all scenarios together with consistent ethanol and proxy-dataset treatment; it organizes the comparison around deterministic impacts, hotspots, uncertainty, and sensitivity rather than a single-point ranking; and it interprets the results as environmental-economic trade-offs to support decision-making for avocado residue valorization and related biomass biorefineries. The thermal-extractive baseline (S0) and the heat-integration route build on previously reported process simulations [9,10,20]. Here, the baseline inventory and impact model are re-implemented on a common SimaPro 9.4.0.3 and ecoinvent 3.10 basis. The green-chemistry and water-integration inventories, the Monte Carlo uncertainty propagation, and the allocation sensitivity are developed for the first time.
2. Materials and Methods
2.1. Reference Process Description
The reference configuration (S0) corresponds to the thermal-extractive avocado oil biorefinery reported by Meramo et al. [9]. The process valorizes non-edible avocado side streams from Northern Colombia at a processing capacity of about 9614 t y−1 of avocado biomass, equal to 1097.5 kg h−1 over a nameplate 8760 h y−1, and generates avocado oil, biochar, pulp without fat, chlorophyll-rich extract, and treated peel. The techno-economic analysis adopts an effective operating time of 8000 h y−1, about 91% availability. This corresponds to a throughput near 8780 t y−1. The main operations include feedstock conditioning, pulp extraction, dehydration, solvent extraction, oil purification, chlorophyll recovery from peels, and thermochemical conversion of seeds. The harmonized process boundary and scenario framework used in this study are summarized in Figure 1.
Figure 1.
Limited cradle-to-biorefinery-gate system boundary and scenario framework. (a) Cradle-to-biorefinery-gate boundary, process lanes, products, allocation basis, and exclusions. (b) scenarios S0 (baseline), S1 (green chemistry), S2 (heat integration), and S3 (water integration).
Mass and energy balances from the published reference process were used as the starting point for all optimized scenarios. The base process was simulated under steady-state conditions in Aspen Plus, and equipment sizing, utility requirements, and material flows were preserved unless explicitly modified by the optimization strategy. This rule was adopted to ensure that scenario differences reflect the targeted optimization levers rather than changes in plant scale, product slate, or production basis [8,9].
All optimized configurations were therefore treated as alternative routes derived from S0, not as unrelated standalone processes. The same nominal processing capacity, main product, and co-product portfolio were retained for S1, S2, and S3 (Table 1). This structure supports direct comparison of physical inventory changes, economic indicators, and environmental impacts under one harmonized functional unit.
Table 1.
Scenario definition and controlled comparison rules.
The reference biorefinery is located conceptually in the Northern Colombia context used in the source studies, which is relevant because regional electricity, biomass availability, and wastewater-management assumptions affect the interpretation of both LCA and TEA results [4,7,8].
2.2. Optimization Scenarios
Green chemistry scenario (S1). The green chemistry scenario was developed to reduce the environmental, health, and safety burdens associated with solvent use in avocado oil extraction. Solvent extraction is widely used for avocado oil recovery because it can provide high extraction efficiency and product yield; however, conventional extraction systems frequently rely on petroleum-derived solvents such as hexane, which raise concerns related to volatility, flammability, occupational exposure, ecotoxicity, and upstream fossil dependence [15,16,17].
A solvent-substitution assessment was conducted using extraction performance, toxicity, environmental profile, safety, availability, and industrial applicability as screening criteria. Candidate solvents included ethyl acetate, petroleum ether, ethanol, and isopropanol. Isopropanol was selected as the preferred replacement for hexane, with a reported extraction efficiency of approximately 98% relative to hexane. Because a dedicated bio-based isopropanol dataset was unavailable, S1 was modeled with market isopropanol as a conservative proxy; the scenario therefore represents an isopropanol-substitution route. The ethanol used for chlorophyll extraction is modeled with the Colombian market dataset, dominated by corn-stover ethanol, in all scenarios, so S1 changes only the extraction solvent and not the ethanol source. Nominal production capacity and product yields were kept identical to S0. The substitution was motivated by green chemistry and process safety criteria; the associated with toxicological and occupational safety benefits were not quantified within the selected LCIA category set. The green chemistry scenario comprises only this solvent-related change, with no modification to the reaction, separation, or thermal configuration. Its environmental interpretation is therefore limited to the five reported LCIA categories. S1 is reported as a solvent-substitution case. The extraction and solvent-recovery step is re-evaluated for the isopropanol route, while solvent recovery and losses stay at the reference values. The comparison then isolates the effect of the solvent and ethanol datasets rather than of a re-optimized recovery train.
Heat integration scenario (S2). The heat integration scenario was developed as a process-intensification strategy focused on reducing external heating and cooling requirements. Hot and cold process streams obtained from the Aspen Plus simulation were characterized by supply temperature, target temperature, mass flow rate, and heat-capacity flow rate. Shifted-temperature analysis and energy cascading were then applied following pinch methodology to define minimum external utilities and internal heat-recovery opportunities [10,18,19,20].
The heat-integration analysis identified a pinch temperature of 37 °C and a final heat-exchanger network comprising ten heat exchangers, including seven units above the pinch and three below the pinch. In the scenario inventory, the heat-integration changes affect only the utility flows. Cooling water demand decreases from 9067.00 to 3956.76 kg h−1 (−56%) and refrigerant demand from 67.83 to 23.17 kg h−1 (−66%). Steam decreases from 976.75 to 18.08 kg h−1, in line with the peer-reviewed heat-integrated inventory of the same biorefinery [10]. Natural gas (20.87 kg h−1, about 1012 MJ h−1) is unchanged, and the wastewater and organic-in-water emissions match the baseline (3374.6 and 32.54 kg h−1). S2 therefore differs from S0 only through the utility demand reduced by the heat-exchanger network. Steam is modeled as a purchased utility and natural gas as an on-site fuel, so the two are accounted separately without double counting. These values were retained as the physical basis for evaluating utility-related economic and environmental effects. The complete hot- and cold-stream data (supply and target temperatures and heat-capacity flow rates), the pinch temperature, and the heat-exchanger network are reported in the source heat-integration study [20] and reproduced in Appendix B. That analysis targets an approximately 96% reduction in external cooling and a smaller reduction in external heating, consistent with the limited high-temperature waste heat available for internal recovery. The steam saving arises because internal heat exchange between hot and cold streams supplies part of the heating that the baseline draws from external steam, so less purchased steam and fuel are needed. These values come from process simulation and should be confirmed experimentally or at pilot scale before industrial use.
Water integration scenario (S3). The water integration scenario was designed to minimize freshwater consumption and wastewater generation through internal reuse and recycling of process water streams. The approach follows water pinch and water-network integration principles, in which water sources and sinks are characterized by flow rate and quality constraints and then matched to maximize internal reuse while satisfying process requirements [18,21,22].
Three major water source streams totaling 2419.14 kg h−1 were matched to process water demands of 2778.64 kg h−1. The resulting network yields a minimum freshwater requirement of 359.51 kg h−1, representing an approximately 87% reduction relative to the reference freshwater demand of 2778.65 kg h−1. Wastewater generation decreases from 3374.57 to 284.91 kg h−1, corresponding to an approximately 92% reduction. The water-integrated inventory was incorporated on the baseline configuration without changing production capacity or product outputs, so that S3 differs from S0 only in its water network. S3 is therefore interpreted as a preliminary water-reuse target rather than a fully specified water network. It quantifies the freshwater and wastewater reductions attainable if the identified source streams are matched to process demands. It does not yet resolve the stream-specific quality constraints, the treatment between each source and sink, or the risk of contaminant accumulation. A detailed source-to-sink network with contaminant balances and the associated treatment and pumping requirements is left for dedicated water-network design. Detailed contaminant balances, treatment requirements, and source-to-sink matching would be needed before any industrial implementation. Its cost is expected to be minor relative to the plant total, as discussed in Section 3.4.
2.3. Process Simulation and Life Cycle Inventory
Process simulation and inventory compilation followed the Aspen Plus-based steady-state modeling logic of the reference biorefinery. The same processing platform, operating basis, and product portfolio were retained for S0–S3 unless a scenario explicitly modified solvent selection, utility recovery, or water-network design. Scenario-specific mass and energy balances supplied the foreground inventory for the green chemistry, heat integration, and water integration alternatives, while the published base case and base-case LCA files supplied the reference inventory basis.
The annual operating basis was harmonized to 8760 h y−1 when converting between hourly and annual flows. The techno-economic analysis then applies an effective operating time of 8000 h y−1 (about 91% plant availability) rather than continuous 8760 h y−1 operation, and treats cooling water and refrigerant as recirculating utilities (95% recirculation with a 5% annual make-up) so that circulating flows are not counted as fresh annual consumption. This conversion was used to check consistency between process inventories, LCA inputs, and economic assessment files, including major raw-material, solvent, ethanol, utility, and product-output streams. The product portfolio retained across scenarios includes avocado oil, biochar, treated peel, pulp without fat, and chlorophyll-rich extract. Ethanol is used as a dilute solution; the life cycle inventory is expressed on an active-ethanol basis, and the techno-economic assessment on an as-purchased basis.
The functional unit for inventory normalization was defined as 1 kg of avocado oil at the biorefinery gate. All scenario inventories were cross-checked on hourly, annualized, and functional-unit bases to avoid mixing flow bases in the same comparison. Inventory normalization was treated as the first analytical layer because physical changes in solvent, utility, and water demand explain a substantial part of the subsequent LCIA and TEA differences.
The process-changing flows tracked across scenarios include avocado biomass, freshwater, solvents, ethanol, sodium hypochlorite, air, electricity, cooling water, refrigerant, steam, natural gas, nitrogen, wastewater-related flows, direct emissions, avocado oil, and co-products. Product and co-product outputs were kept consistent with the reference production platform so that scenario comparisons reflect optimization strategy rather than changes in production scale or marketable products.
Before interpretation, all scenario data were consolidated under a single comparison framework covering scenario definitions, physical inventories, deterministic LCIA results, hotspot contributions, TEA indicators, uncertainty outputs, and sensitivity results. This consolidation ensured that all environmental and economic claims were based on the same functional unit, system boundary, allocation rule, production capacity, and foreground inventory basis.
All scenario files were interpreted under a single comparison rule: S1, S2, and S3 are alternative optimized routes derived from S0. Therefore, reductions from the three strategies were not summed into a hypothetical combined scenario unless an explicit re-simulation and economic re-estimation are later performed. This rule is especially important for heat and water integration because utility and water-network changes can alter inventories, costs, and emissions simultaneously.
2.4. Techno-Economic Assessment
The techno-economic assessment was conducted to evaluate the economic feasibility of the reference and optimized avocado oil biorefinery configurations. The assessment follows conventional process-economics methods used in chemical process design and biorefinery evaluation, complemented by sensitivity-oriented decision support for emerging technologies [14,23,24].
The economic comparison is therefore part of the main study scope rather than a supplementary discussion. For S0, economic indicators were extracted from the published thermal-extractive avocado biorefinery paper, including economic potential, the annual cash-flow ratio (CCF, Equation (8)), payback period, ROI, IRR, NPV, and discounted payback period. For S1, S2, and S3, fixed-cost, operating-cost, NPV, sales, and financial-performance indicators were obtained from the scenario-specific economic assessments developed for the optimized configurations.
Capital expenditure was estimated from equipment purchase costs, installation factors, auxiliary facilities, and indirect costs. Equipment sizing was obtained from process simulation results, while additional units associated with heat integration, water reuse, solvent handling, and solvent recovery were incorporated according to the requirements of each scenario. Capital-related indicators reported in the supplied economic files include direct fixed capital investment, indirect fixed capital investment, fixed capital investment, working capital, startup-related items, and total capital investment.
Operating expenditure included annual costs associated with feedstock supply, utilities, solvent consumption and replacement, labor, maintenance and repair, waste treatment and disposal, fixed charges, general expenses, and other operating and administrative items. The main operating-side outputs retained for the manuscript are annual operating cost, direct production cost, total manufacturing cost, and the normalized variable operating cost (NVOC), defined in Equation (5) as the variable operating cost per kilogram of oil.
Economic performance was compared using total capital investment (TCI), annual operating cost (AOC), direct production cost (DPC), NVOC, return on investment (ROI), payback period (PBP), internal rate of return (IRR), net present value (NPV), the annual cash-flow ratio (CCF, Equation (8)), and discounted payback period when available. All indicators were interpreted under identical economic assumptions across scenarios to isolate the economic consequences of green chemistry, heat integration, and water integration. The calculation basis follows the TEA formulation used in the reference avocado biorefinery study and is expressed in Equations (1)–(13) [9].
In Equations (1)–(13), Cc and Ca are the current and reference equipment costs, respectively; Fc and Fa are the current and reference equipment capacities; is the equipment scaling exponent; TAC is total annualized cost; CAPEXann and OPEXann are annualized capital and operating expenditures; SUC is start-up cost; FCI is fixed capital investment; WC is working capital; GE is general expenses; POH is plant overhead; DPC is direct production cost; FCH is fixed charges; VOC is variable operating cost; moil is the avocado-oil production rate; AFC is annualized fixed cost; Cj is the selling price of product j; j is the corresponding yield or conversion factor; VOCn is normalized variable operating cost; mBEP and mmax are the break-even and maximum production rates; mj is the production rate of product j; AOC is annual operating cost; TCI is total capital investment; PT is profit after taxes; CFt is the net cash flow in year t; i is the discount rate; n is the plant lifetime; and T is the first year in which the cumulative discounted cash flow becomes non-negative.
TEA interpretation emphasized cost structure and trade-offs rather than a single profitability ranking. Utility-sensitive effects were expected to be most visible in S2, whereas solvent-related and water-management effects were expected to shape the economic interpretation of S1 and S3. Detailed NPV curves (Figure A1), raw material and utility cost breakdowns (Figure A2 and Figure A3), and supporting economic tables are provided in Appendix B unless they are necessary for the main LCA-TEA trade-off discussion.
2.5. Life Cycle Assessment
2.5.1. Goal and Scope
The life cycle assessment was conducted following the principles and framework established in ISO 14040:2006 and ISO 14044:2006 [25,26]. The methodology was based on the environmental assessment previously developed for the thermal-extractive avocado biorefinery and was extended to compare the optimized configurations under equivalent methodological rules [9].
The goal of this assessment was to compare the environmental performance of the reference thermal-extractive avocado biorefinery and the three optimized configurations based on green chemistry (S1), heat integration (S2), and water integration (S3). The analysis was conducted to quantify environmental benefits and trade-offs associated with each optimization strategy while maintaining equivalent production capacity and product outputs.
The functional unit was defined as 1 kg of refined avocado oil produced at the biorefinery gate. This functional unit provides a consistent basis for comparing all process configurations and links the environmental assessment with the economic assessment, which uses the same production platform and product portfolio.
The LCA was conducted using a limited cradle-to-biorefinery-gate boundary. The boundary included the upstream production of auxiliary chemicals, solvents, fuels, and electricity, utility supply, wastewater treatment, waste management, and the foreground biorefinery operations up to 1 kg of refined avocado oil at the biorefinery gate. Avocado side streams were modeled under a recycled-content/cut-off approach and were therefore burden-free with respect to avocado cultivation and primary fruit production. Collection and handling activities were included only when represented in the foreground inventory, whereas foreground inbound transport of raw materials from farms or processing sites to the biorefinery, product distribution, use phase, end-of-life, labor, and infrastructure were excluded. This exclusion was considered acceptable for the comparative purpose of the study because all scenarios use the same feedstock origin, plant location, functional unit, and production capacity.
The biorefinery was assumed to be located in the Northern Colombia region, consistent with the reference study. This location is relevant for feedstock availability, Colombian electricity modeling, regional utility assumptions, and the waste- and wastewater-management context [4,8,9].
2.5.2. Life Cycle Inventory
Life cycle inventory data for foreground processes were obtained from process simulations developed for the reference and optimized scenarios. These primary data included mass and energy balances, utility requirements, emissions, and material consumption associated with the avocado biorefinery. Each optimization scenario generated a unique inventory reflecting the corresponding reductions or substitutions in solvent, energy, or water consumption.
Background processes, including electricity generation, chemical production, fuel supply chains, and wastewater treatment, were modeled using secondary data from established life cycle inventory databases and literature sources. Background datasets were matched, where possible, to ecoinvent 3.10 datasets under the cut-off model, using Colombian electricity whenever a Colombian market dataset was available and regionally relevant proxies when process-specific datasets were unavailable [27]. All life cycle modeling and Monte Carlo uncertainty simulations were carried out in SimaPro 9.4.0.3. The baseline (S0) inventory and impact results were re-implemented on this common modeling basis so that minor differences from the originally published values reflect this harmonization. Bioethanol was represented with the Colombian market ethanol dataset, which is dominated by corn-stover ethanol in ecoinvent 3.10 and is therefore consistent with a bio-based ethanol supply. The same ethanol dataset is applied to the baseline and to all three optimized scenarios (S0–S3). A dedicated bio-based isopropanol inventory was not available in ecoinvent 3.10, so isopropanol was modelled with the market isopropanol dataset.
The recycled-content approach, also referred to as the cut-off method, was applied for avocado side streams used as feedstock. Consequently, avocado peels, seeds, and other processing residues entering the biorefinery were considered burden-free with respect to avocado cultivation and primary fruit production because those upstream burdens were allocated to the main agricultural product. Only collection, handling, and processing activities associated with the valorization of these side streams were included within the system boundary.
Inventory data were compiled for the optimized alternatives using the categories and units defined in the process inventory (Table 2). The table includes input material flows, utility requirements, main outputs, emissions, and waste-related flows for the green chemistry, heat integration, and water integration cases. A complete baseline-to-optimized inventory comparison, including S0, is provided in Table A2.
Table 2.
Life cycle inventory of optimized avocado oil biorefinery alternatives.
2.5.3. Life Cycle Impact Assessment
Environmental impacts were assessed using a combination of the Environmental Footprint (EF) 3.1 and ReCiPe 2016 life cycle impact assessment methods. Climate change, freshwater eutrophication, marine eutrophication, and water use were quantified using EF 3.1, which was selected due to its alignment with current European Commission recommendations for product environmental footprint studies and its broad applicability to industrial systems [28]. The water-use category corresponds to the EF 3.1 “water use” indicator based on the AWARE (Available WAter REmaining) scarcity model, expressed in cubic meters of world-equivalent deprived water per functional unit and abbreviated hereafter as m3 depriv.
Land use impacts were evaluated using the ReCiPe 2016 methodology because it expresses results in terms of agricultural land occupation, providing an interpretable indicator for agricultural and agro-industrial systems such as avocado biorefineries [29].
These five categories were selected a priori as the environmental dimensions most relevant to agro-industrial biorefineries and most consistently reported in avocado and biomass-valorization life cycle studies [4,5,7,8]. Climate change captures the energy- and steam-intensive drying, extraction, and thermochemical operations that dominate the carbon footprint of these systems; freshwater and marine eutrophication represent the nutrient and wastewater releases that are the characteristic aqueous burdens of agro-processing; water use is a defining resource constraint for avocado processing and the explicit target of the water-integration strategy; and land use, under the applied cut-off model in which avocado cultivation lies outside the system boundary, does not represent on-farm land occupation by the fruit but rather the indirect agricultural and land-transformation burdens embedded in the production of energy, fuels, solvents, and auxiliary chemicals consumed by the biorefinery. This category set is consistent with the indicators emphasized in integrated techno-economic and environmental assessments of biorefineries [11] and provides a decision-relevant, non-redundant basis for comparing the optimization strategies.
2.5.4. Allocation and Interpretation
Allocation was handled through subdivision, following ISO 14044 and ILCD guidance, and consistent with the methodology adopted in the reference avocado biorefinery study [9,26,30]. Multifunctionality was addressed by separating process units and inventories whenever possible to avoid allocation between avocado oil and the co-products generated by the biorefinery, including biochar, treated peel, pulp without fat, and chlorophyll-rich extract. Under subdivision, the process is partitioned physically. Each unit operation and its input and output streams are attributed to the product it generates. Avocado oil then carries only the burdens of the oil-producing train. The co-products, namely biochar, treated peel, pulp without fat, and chlorophyll-rich extract, carry the burdens of their own processing lines, regardless of their economic value. Table A7 reports the economic and mass shares of oil and co-products used in the allocation sensitivity. Under those two methods, pulp without fat receives a non-zero share of the shared burdens, 9.4% by economic allocation and 22.3% by mass. This is exactly what the sensitivity analysis tests against the subdivision base case.
Mass and economic allocation were reserved for sensitivity analysis rather than used as the main comparison basis. This choice preserves the subdivision-first logic of the reference study while allowing the robustness of product-specific conclusions to be tested under alternative allocation assumptions.
The interpretation phase followed ISO 14044 recommendations by evaluating the significance, consistency, and robustness of the environmental results. Percentage variations relative to the reference process were calculated for all selected environmental impact categories. Interpretation focused on identifying the main contributors to environmental impacts, evaluating potential burden shifting, and linking physical inventory changes to LCIA outcomes.
Environmental results were interpreted together with TEA outputs to determine whether improvements in resource efficiency and environmental performance were accompanied by economic benefits or trade-offs. Particular attention was given to the relationship between profitability improvements and environmental impact reductions so that scenario selection would not rely on a single environmental or economic indicator.
2.6. Uncertainty and Sensitivity Analysis
Monte Carlo simulations were performed in SimaPro 9.4.0.3 with 1000 iterations per scenario, propagating input uncertainty from the ecoinvent 3.10 background datasets characterized with the pedigree-matrix approach (lognormal distributions). Uncertainty analysis was compiled from the Monte Carlo exports provided with the scenario LCIA files. For each impact category available in those exports, the mean and the 95% interval (2.5th–97.5th percentiles) were collected. Deterministic differences were then interpreted together with uncertainty intervals so that overlapping ranges were not overstated as robust improvements. Because the background Monte Carlo does not capture foreground process uncertainty, the sensitivity of the results to the dominant foreground parameter, the recovered steam demand of the heat-integration scenario, was examined deterministically by scaling the steam input from its full value down to 20% and tracking the resulting impact scores (Section 3.7); a full paired-Monte-Carlo propagation of foreground parameters with reported exceedance probabilities is identified as future work.
Sensitivity analysis was structured in two complementary layers. First, allocation sensitivity compared subdivision, mass allocation, and economic allocation for the avocado oil product system. Second, economic sensitivity relied on the scenario-specific TEA sensitivity outputs (Figure A4, Figure A5 and Figure A6), NPV analyses, and profitability indicators. This structure links environmental robustness and economic robustness without forcing both dimensions into one unsupported aggregate score.
The integrated evaluation of TEA, LCIA, uncertainty, and sensitivity results was used to identify which optimization strategies are favorable under specific economic, resource-efficiency, and environmental priorities rather than to impose a single universal ranking. Full uncertainty tables, allocation sensitivity results, and TEA sensitivity curves are routed to the appendices to keep the main text focused on decision-relevant findings.
3. Results and Discussion
The results are organized to move from deterministic environmental performance to contribution analysis, burden shifting, techno-economic performance, integrated LCA-TEA trade-offs, and robustness under uncertainty and sensitivity assumptions. Absolute-value figures (deterministic LCIA, hotspot contributions, techno-economic indicators, the LCA-TEA trade-off, and Monte Carlo uncertainty) report all four configurations, whereas the change-relative figures (burden shifting relative to the baseline and allocation sensitivity relative to subdivision) report the three optimized scenarios because the baseline or the subdivision case is itself the reference.
3.1. Deterministic LCIA
For climate change, the baseline configuration (S0) resulted in 3.73 kg CO2 eq kg−1 oil, which is consistent with the order of magnitude reported for the published thermal-extractive avocado biorefinery and remains within the broader range expected for energy-intensive avocado valorization routes rather than field-only avocado supply chains [4,6,7,9]. The green chemistry alternative (S1) increased this score to 4.30 kg CO2 eq kg−1 oil, whereas heat integration (S2) decreased it to 1.65 kg CO2 eq kg−1 oil and water integration (S3) decreased it to 3.47 kg CO2 eq kg−1 oil. Relative to S0, these values correspond to an increase of 15.3% for S1, a reduction of 55.8% for S2, and a reduction of 7.0% for S3. The full deterministic profile for all scenarios is shown in Figure 2.
Figure 2.
Deterministic LCIA results per 1 kg avocado oil (subdivision allocation). (a) climate change. (b) freshwater eutrophication. (c) marine eutrophication. (d) land use. (e) water use. Units are given on each axis.
The improvement in S2 follows the same mechanism emphasized in process-integration studies: when a biorefinery contains drying, extraction, evaporation, or thermochemical steps, reducing external heat demand can lower both fuel-related emissions and several upstream utility burdens [10,18,19]. By contrast, the increase in S1 shows that a safer or more bio-based solvent route is not automatically a lower-impact route. Solvent-extraction assessments for algae, grape pomace, and natural-product biorefineries report the same pattern: upstream solvent production, solvent-to-feed ratio, recovery efficiency, and heat duty can dominate environmental performance even when the solvent is preferable from a toxicity or handling perspective [12,15,16,31].
The eutrophication indicators show a more differentiated response. Freshwater eutrophication remained close to the baseline value for S1 and S2, changing from 6.26 × 10⁻³ kg P eq kg−1 oil in S0 to 6.35 × 10⁻³ and 6.07 × 10⁻³ kg P eq kg−1 oil, respectively. In contrast, S3 decreased freshwater eutrophication to 8.82 × 10⁻⁴ kg P eq kg−1 oil, an 85.9% reduction relative to S0. This behavior is physically coherent with water-network integration: it acts first on freshwater intake, aqueous losses, and wastewater treatment loads, not on the entire process energy system. Marine eutrophication followed a different pattern: S1 increased the score by 11.1%, while S2 and S3 reduced it by 36.6% and 29.3%, respectively.
The remaining categories confirm that the optimization strategies do not act uniformly across the LCIA profile. Land use was similar for S0, S1, and S3, but was substantially lower for S2. Water use increased in S1 and S2 relative to S0, reaching 0.438 and 0.458 m3 deprived kg−1 oil, respectively, whereas S3 decreased it to 0.315 m3 deprived kg−1 oil. Across these categories, S2 gives the clearest deterministic climate benefit, S3 the strongest deterministic water-related benefit within the selected LCIA categories, and S1 requires further solvent-supply optimization before it can be claimed as an environmental improvement. Full deterministic scores and percentage changes relative to S0 for all impact categories are compiled in Table A3.
3.2. Hotspot Analysis
Figure 3 shows the hotspot contribution matrix. The green chemistry scenario changes the hotspot profile mainly through the solvent system rather than through utility reductions. In S1, steam remains the dominant contributor to climate change (64.0%), but the solvent contribution increases to 16.5% for climate change, 16.1% for marine eutrophication, and 41.6% for water use. Comparable solvent-extraction LCA-TEA studies have reported that lipid or polyphenol recovery can shift burdens to solvent manufacture and recovery energy, particularly when extraction is downstream of a biomass-conditioning chain [12,31]. Thus, the S1 hotspot profile is not contradictory: it reflects a change in the chemical supply chain rather than an across-the-board reduction in process demand.
Figure 3.
Hotspot contribution matrix for deterministic LCIA (signed % contribution of each process group). (a) S0. (b) S1. (c) S2. (d) S3. Only dominant contributors (|contribution| ≥ 13%) are labelled.
The heat-integration export shows the opposite mechanism. Wastewater treatment is the leading contributor to freshwater eutrophication (97.6%), marine eutrophication (59.1%), and water use (41.8%), while the steam contribution is markedly reduced relative to S0. Once heat recovery suppresses the steam hotspot, the remaining aqueous and material burdens become more visible. This is a common interpretation issue in optimized biorefineries: removing one dominant energy hotspot can reveal secondary contributors that were previously masked [18,19,32].
Water integration mainly reduces wastewater-related burdens, but it does not remove utility-related hotspots. In S3, wastewater treatment decreases substantially as a contributor to climate change and marine eutrophication, whereas steam becomes proportionally more important, contributing 79.3% to climate change and 72.8% to marine eutrophication. Freshwater eutrophication remains partly wastewater-driven (56.2%), but steam also becomes relevant (34.6%). The hotspot evidence therefore indicates that S3 solves a water-management problem, not a heat-demand problem; a combined heat-and-water integration scenario would be required to test whether both hotspot families can be reduced simultaneously. The dominant-contributor evidence supporting this interpretation is summarized in Table A4.
3.3. Burden Shifting
Figure 4 shows the burden-shifting profile relative to the baseline. The green chemistry scenario shows the clearest burden-shifting pattern. S1 increases climate change by 15.3%, freshwater eutrophication potential by 1.5%, marine eutrophication potential by 11.1%, land use by 0.2%, and water use by 25.2%. This result is aligned with the green-solvent literature, where the environmental outcome depends on solvent origin, recovery efficiency, solvent losses, and energy requirements, and not simply on whether the solvent is labeled renewable or less hazardous [15,16,31]. Therefore, solvent substitution should be interpreted as a process-safety and chemistry improvement that still needs LCA confirmation at the supply-chain level.
Figure 4.
Burden-shifting profile relative to baseline S0 (% change in deterministic LCIA). (a) S1. (b) S2. (c) S3. Green bars indicate impact reduction and orange bars an increase. EP, eutrophication potential.
The heat-integration scenario shows strong improvements in climate change (−55.8%), marine eutrophication potential (−36.6%), and land use (−76.2%), with a smaller reduction in freshwater eutrophication potential (−3.1%). However, water use increases by 31.1%. The result is consistent with pinch-based studies where energy recovery reduces fuel-linked burdens but can leave cooling, wastewater, or water-scarcity indicators unresolved [10,18,19].
The water-integration scenario provides the most balanced deterministic profile among the available categories. S3 reduces climate change (−7.0%), freshwater eutrophication potential (−85.9%), marine eutrophication potential (−29.3%), land use (−4.5%), and water use (−10.0%). The reduction in the water-use indicator (−10.0%) is smaller than the physical freshwater reduction (about −87%) because the AWARE-based water-use indicator aggregates direct and indirect (background) water flows weighted by regional characterization factors and therefore does not scale linearly with foreground freshwater intake. The dominant benefit is therefore not a general reduction of all process burdens by the same mechanism, but a targeted reduction of water- and wastewater-related impacts. This targeted interpretation is important because recent avocado-seed and rural avocado-biorefinery LCAs also show that material, energy, and waste-management assumptions can reverse or amplify scenario conclusions when multifunctionality and uncertainty are considered [4,5,33]. Final scenario ranking is therefore postponed until uncertainty and sensitivity are interpreted.
3.4. TEA Results
Figure 5 compares the techno-economic indicators. Operating-cost behavior differs strongly among scenarios. Annual operating cost remains close to the baseline for S1 and S3, at 5.27 and 5.07 million USD y−1, respectively, compared with 5.18 million USD y−1 for S0. In contrast, S2 decreases AOC to 2.62 million USD y−1 and DPC to 1.69 million USD y−1, indicating that reduced utility demand has a larger economic effect than the additional capital requirement. The extra capital relative to the baseline is small, about 5.5% for S2 and 1.7% for S3, while S1 keeps essentially the same capital. In each case the recurring cost changes outweigh this capital difference. The main economic assumptions are a 9.5% discount rate, a 15-year plant life, a 35% tax rate, and an 8000 h y−1 operating time, with equipment costs on a 2014-to-2024 CEPCI basis. For S3, the additional pumping, treatment, disinfection, and monitoring of the water-reuse network are included in the capital and operating costs; their net effect is small, as S3 raises total capital investment by only about 1.7% relative to S0 and keeps annual operating cost within about 2% of the baseline, so the water network is economically minor next to the feedstock- and utility-driven costs of the plant. This is consistent with the economic logic of process integration: heat exchangers increase capital cost, but recurring steam, natural gas, and cooling-service savings can dominate the discounted economics when utilities are major cost drivers [18,23,24].
Figure 5.
Techno-economic comparison of baseline and optimized configurations. (a) TCI, AOC, and DPC. (b) NVOC. (c) ROI and IRR. (d) simple and discounted payback period. All indicators are reported on a harmonized basis for the four configurations. Project NPV values are given in Table 3.
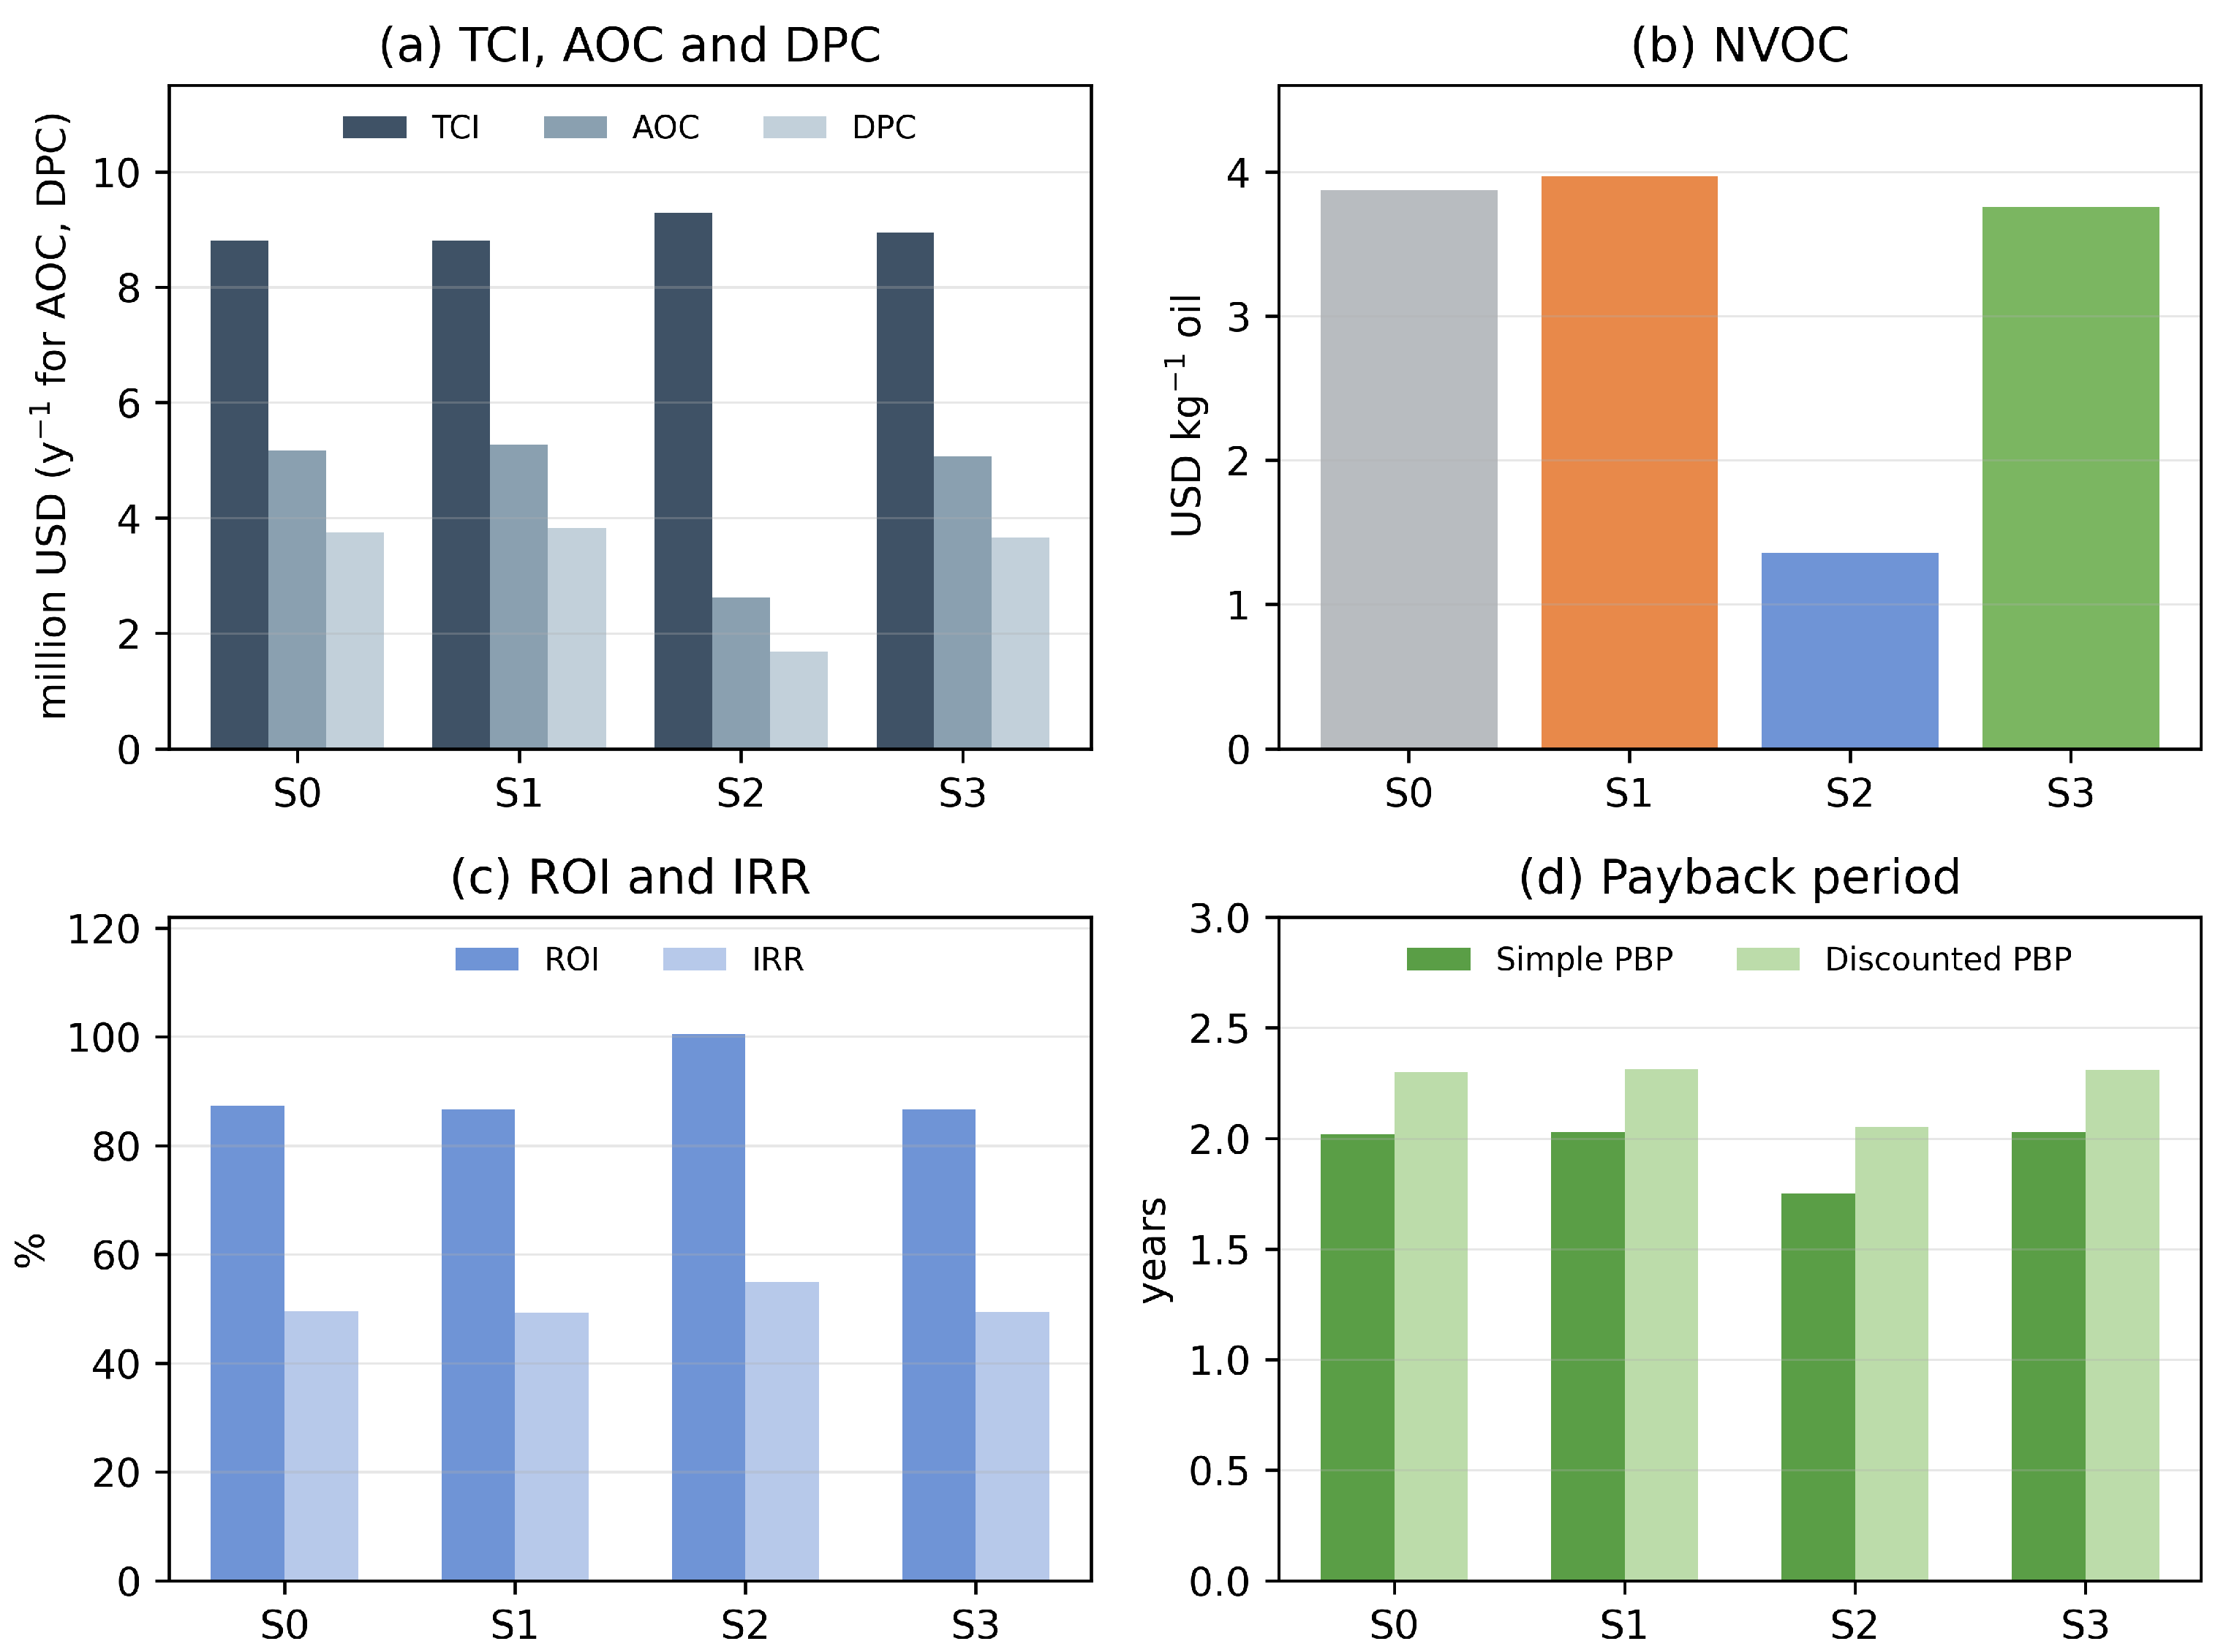
Table 3.
Techno-economic indicators for the baseline and optimized avocado oil biorefinery configurations.
The normalized variable operating cost shows the clearest cost-intensity difference. On the same basis, the baseline value is 3.87 USD kg−1 oil, whereas S1, S2, and S3 show values of 3.97, 1.36, and 3.76 USD kg−1 oil, respectively. S2 therefore has by far the lowest production-cost intensity, whereas S1 and S3 stay close to the baseline. Similar LCA-TEA studies of residue-based extraction systems report that feedstock cost, extraction/recovery efficiency, and utility demand often dominate production cost, which explains why solvent or water-network changes may produce smaller economic gains than heat integration when product yields and revenues are fixed [9,12,31].
Profitability indicators reinforce the same pattern. S2 reaches the highest ROI (100.6%) and IRR (55.0%), while the baseline, S1, and S3 remain clustered around ROI values of 86.6–87.3% and IRR values close to 49%. Payback time is also shorter for S2, with a simple PBP of 1.75 years and a discounted PBP of 2.05 years, compared with approximately 2.02–2.03 years and 2.30–2.31 years for the other configurations. Project NPV follows the same ranking, at 39.8 million USD for S0, 39.4 for S1, and 40.1 for S3, rising to 49.5 for S2, confirming heat integration as the most profitable configuration.
3.5. LCA-TEA Trade-Off
Figure 6 maps the LCA-TEA trade-off. The water-use trade-off is less one-directional. S2 remains economically superior, but it has the highest deterministic water-use score among the four scenarios (0.458 m3 deprived kg−1 oil). S3 occupies a different decision region: it has ROI close to the baseline but lowers both climate change and water use relative to S0. This pattern illustrates why integrated LCA-TEA frameworks recommend keeping economic and environmental indicators visible rather than converting them prematurely into one aggregate score [11,12,13,32].
Figure 6.
Integrated LCA-TEA trade-off. (a) climate change versus ROI. (b) water use versus ROI. Dotted lines mark baseline values. Lower x is lower burden and higher y is higher profitability.
S1 does not improve the integrated trade-off: it combines slightly lower ROI than the baseline with higher climate-change and water-use scores. This does not invalidate green-solvent substitution as a process-safety or regulatory strategy, but it means that the selected replacement route cannot be claimed as an environmental-economic improvement without further solvent-supply optimization or alternative solvent sourcing. The same caution has been raised for solvent-extraction biorefineries, where a technically attractive extraction route may still underperform economically or environmentally if solvent recovery and upstream burdens are unfavorable [12,31].
The trade-off analysis therefore supports a criterion-dependent interpretation. If the decision priority is maximum profitability and climate mitigation, S2 is favored by the current deterministic evidence. If the priority is water-related environmental performance with limited economic disruption, S3 is the more balanced alternative. A universal ranking would be scientifically weaker than this conditional interpretation because the scenarios optimize different mechanisms and the uncertainty analysis still constrains how strongly the deterministic differences can be stated.
3.6. Monte Carlo Uncertainty
Figure 7 shows the Monte Carlo uncertainty. The uncertainty results confirm some deterministic patterns but soften others. In climate change, S1 has a 95% interval of 3.74–4.93 kg CO2 eq kg−1 oil, while S3 ranges from 2.88 to 4.17 kg CO2 eq kg−1 oil, and S2 remains clearly below both at 1.56–2.14 kg CO2 eq kg−1 oil. The S1 and S3 intervals overlap, so the deterministic climate advantage of S3 over S1 should be described as a trend rather than as a statistically robust separation. This is consistent with uncertainty-aware avocado and multi-product biorefinery LCAs, where co-product treatment and inventory variability can alter the apparent separation between scenarios [5,26,33].
Figure 7.
Monte Carlo uncertainty for the four configurations. (a) climate change. (b) freshwater eutrophication. (c) marine eutrophication. (d) land use. Circles show the mean and 95% interval (2.5th–97.5th percentiles) per 1 kg avocado oil. The water-use category is assessed deterministically and is therefore omitted from this figure. Its AWARE-based indicator aggregates water-consuming and water-returning flows whose regionalized characterization factors can be of opposite sign, so for a small net result the propagated distribution does not provide a meaningful coefficient of variation (Section 3.8).
Freshwater and marine eutrophication show stronger separation between S1 and S3. The freshwater eutrophication interval for S3 (0.556–1.599 × 10⁻³ kg P eq kg−1 oil) remains well below the S1 interval (4.285–8.946 × 10⁻³ kg P eq kg−1 oil). Marine eutrophication shows the same direction, with S3 ranging from 1.550 to 2.441 × 10⁻³ kg N eq kg−1 oil and S1 ranging from 2.542 to 3.541 × 10⁻³ kg N eq kg−1 oil. These non-overlapping intervals support the conclusion that water integration provides a robust eutrophication benefit relative to the green-chemistry scenario.
Land use is less discriminating, with the four scenarios overlapping substantially. The water-use category is interpreted deterministically because its AWARE-based indicator does not yield a meaningful probabilistic dispersion for near-zero net results (Section 3.8). The baseline Monte Carlo output for water use shows this clearly. Its mean is about 0.83 m3 world-eq deprived, but the 95% interval runs from −19.2 to +15.9 m3. The AWARE contributions change sign, which inflates the interval and makes the coefficient of variation uninformative. The deterministic values, 0.315 to 0.458 m3 per kg oil, remain well defined. The same behaviour appears in the optimized scenarios. Water use is therefore compared on a deterministic basis, and its probabilistic interval is reported only for reference. Monte Carlo analysis does not erase the deterministic trends but indicates which of them are strong enough to support comparative claims [29,30]. The complete Monte Carlo statistics are reported in Table A8.
3.7. Sensitivity and Robustness
A deterministic foreground sensitivity was run on the steam demand of S2, the parameter that governs its climate benefit. Scaling the steam input to 80%, 60%, 40%, and 20% of its value lowers the climate-change score to about 85%, 71%, 56%, and 41% of the full steam result. The climate advantage of heat integration therefore scales almost linearly with the steam reduction. It stays substantial even under much more conservative steam savings. This shows that the benefit is driven by the recovered steam and is robust across a wide range of foreground assumptions.
Figure 8 shows the allocation sensitivity. For S1 and S3, economic allocation generally increases several product-level impacts relative to subdivision, particularly land use (+72% for S1 and +77% for S3), marine eutrophication (+14% and +31%), and climate change (+14% and +23%). Mass allocation, in contrast, consistently lowers most impact scores relative to subdivision, with reductions of approximately 32–66% depending on category and scenario. These shifts are expected in multi-product biorefineries because high-value co-products and mass-dominant streams distribute burdens differently; comparable avocado and biomass valorization studies identify multifunctionality as one of the main reasons why product-level rankings can change [4,26,30,33].
Figure 8.
Allocation sensitivity relative to subdivision (% change under economic and mass allocation). (a) S1. (b) S2. (c) S3. Positive (green) values indicate higher product-level impact and negative (brown) values a lower one. Colour is clipped at ±150% for readability while printed values report the full change.
The heat-integration scenario is the most allocation-sensitive case. Economic allocation increases land use by 348% and water use by 445% relative to subdivision, while mass allocation also increases those categories by 103% and 114%, respectively. These large shifts indicate that single-allocation results for S2 should be interpreted together with the subdivision base case rather than in isolation.
The robustness analysis supports three practical conclusions. First, the eutrophication benefit of S3 relative to S1 is the most robust environmental finding among the optimized scenarios. Second, the economic advantage of S2 is consistent across the profitability indicators. Third, allocation sensitivity is large enough that subdivision is reported as the base case, and the full mass- and economic-allocation values are provided in Appendix C (Table A9), rather than presenting a single allocation-dependent ranking as definitive.
Placed in the broader biorefinery literature, the results reinforce four recurring design lessons. First, integrated LCA-TEA studies are most useful when they preserve multiple environmental and economic indicators instead of compressing trade-offs into one score [34,35]. Second, residue-based biorefineries with drying, extraction, or thermochemical steps are frequently controlled by energy demand and moisture management; olive, wine, and pineapple-residue case studies report that drying and utility supply can dominate both environmental burdens and economic viability [36,37]. Third, solvent choice should be evaluated at the supply-chain level: citrus-waste extraction studies show that ethanol sourcing and electricity use can dominate the environmental profile of biobased chemical recovery [38]. Finally, these comparisons support the interpretation adopted here: S2 is an energy-and-cost optimization pathway, S3 is a water-and-eutrophication optimization pathway, and S1 is a chemistry-substitution pathway whose environmental success depends on solvent origin, recovery, and harmonized background data.
3.8. Methodological Limitations
Several limitations should be considered when interpreting the results. First, the study uses a limited cradle-to-biorefinery-gate boundary that excludes inbound raw-material transport, product distribution, use phase, end-of-life, labor, and infrastructure. Second, foreground transport is excluded consistently across all scenarios; because the scenarios share the same feedstock origin, plant location, functional unit, and capacity, this exclusion is not expected to affect the relative comparison among S0–S3. Third, some inputs were modeled with proxy datasets, notably market isopropanol for the substituted solvent and an R-134a proxy for the process refrigerant. Fourth, the reported LCIA set (climate change, freshwater and marine eutrophication, water use, and land use) was selected to compare energy-, water-, and eutrophication-related trade-offs; toxicity, ecotoxicity, photochemical ozone formation, particulate matter, ozone depletion, and fossil resource use were outside the reported set, so conclusions on green-solvent safety or toxicity should be interpreted qualitatively. Fifth, the water-use category was interpreted deterministically rather than through Monte Carlo simulation: the AWARE-based scarcity-weighted indicator combines water-consuming and water-returning flows whose regionalized characterization factors can be of opposite sign, so when the net result per functional unit is small, the propagated distribution is governed by these offsetting contributions and the resulting coefficient of variation does not provide a meaningful measure of dispersion; this is a known feature of scarcity-weighted water indicators and does not affect the deterministic water-use comparison. Sixth, the scenarios are based on process simulation and are prospective in nature, so the results should be validated with pilot-scale inventory and economic data. Other foreground parameters could also shift the results, in particular the solvent-recovery efficiency of S1, the attainable water-reuse efficiency of S3, and the equipment costs in the techno-economic comparison. Their combined effect is not propagated probabilistically here and is left for future work. Seventh, the heat-integration inventory of S2 is taken from the peer-reviewed integrated simulation of this biorefinery [10]; the steam reduction it achieves is larger than the reduction targeted by the algebraic pinch analysis alone [20], reflecting additional internal heat reuse in the integrated flowsheet, and the magnitude of the utility saving should be confirmed with a detailed heat-exchanger-network design and pilot data.
3.9. Practical Application and Industrial Feasibility
The three strategies improve different burdens because they act on different parts of the process. Heat integration (S2) lowers climate change and cost. It replaces purchased steam and natural gas with recovered heat, so its benefit scales with the energy intensity of the drying and extraction stages that dominate the baseline. The same mechanism reduces the utility and fuel background processes that carry most of the land-use burden. Water integration (S3) improves only the water and eutrophication categories. It reroutes and reuses water without changing the energy or solvent demand, so its effect stays within the freshwater intake and the wastewater load. Solvent substitution (S1) increases several categories. Per unit of solvent, market isopropanol carries higher upstream fossil and eutrophying burdens than hexane. This penalty is not offset within the reported categories when the solvent flow and recovery stay at baseline values. Heat integration is the most mature option and is readily retrofitted. It needs an added heat-exchanger network and attention to start-up, control, fouling and seasonal operation. Its main barrier is capital and operability rather than technology readiness. Water integration is moderately complex. It needs storage, piping, pumping, disinfection and continuous quality monitoring to avoid the build-up of salts, oils and organics. It is most attractive where freshwater is scarce or effluent discharge is regulated. Solvent substitution is the least ready for deployment. A real green-chemistry benefit would require a verified bio-based isopropanol supply, a redesigned recovery train, and demonstrated oil-quality equivalence.
Because the scenarios are prospective and built on process simulation, the ranking depends on a few foreground assumptions. The advantage of S2 is most sensitive to the heat-recovery fraction achieved in practice and to the added exchanger capital. The benefit of S3 depends on the attainable water-reuse efficiency and on the treatment load set by contaminant limits. The outcome of S1 depends on the solvent-recovery efficiency and on the isopropanol dataset. These parameters carry their own uncertainty, so their influence is examined together with the background uncertainty. Moderate departures from the assumed recovery and reuse efficiencies narrow but do not reverse the climate advantage of S2 or the freshwater-eutrophication advantage of S3. The environmental sign of S1 stays contingent on the solvent supply chain.
4. Conclusions
This study compared a baseline thermal-extractive avocado oil biorefinery with three optimized alternatives. The benefit of each option depended on the process step it changed. Heat integration (S2) delivered the largest climate-change reduction, from 3.73 to 1.65 kg CO2 eq kg−1 oil, together with the strongest economic indicators (ROI 100.6%, IRR 55.0%, simple PBP 1.75 years). S2 thus appears to be the most favorable climate and economic option under the present process-simulation and cost assumptions, conditional on validation of the heat-recovery network at pilot scale. Water integration (S3) targeted a different burden family, cutting freshwater eutrophication by 85.9%, marine eutrophication by 29.3%, water use by 10.0%, and climate change by 7.0%. Its freshwater-eutrophication advantage over S0 and S1 was clear, while the marine-eutrophication benefit was more modest, and the climate-change gain remained a trend. The green-chemistry scenario (S1) improved the solvent-safety rationale but did not reduce the selected LCIA indicators under the proxy dataset used, worsening rather than improving the reported categories. This shows that solvent substitution must be assessed with solvent origin, recovery efficiency, and upstream burdens included rather than assumed beneficial.
These results give criterion-specific recommendations rather than a single best option. Heat integration is the first-priority retrofit when the goal is to lower operating costs and the carbon footprint of an energy-intensive avocado-oil biorefinery. It is worth adopting once the added heat-exchanger network is justified by a validated utility saving. Water integration suits sites where freshwater is scarce or effluent discharge is regulated. It requires a treatment and monitoring scheme that controls contaminant build-up. Solvent substitution should be pursued only with a verified bio-based solvent supply and a redesigned recovery train. In the meantime it is a safety-motivated option whose environmental merit is not yet shown within the reported categories. Combining heat and water integration is the most promising direction for future work, subject to a dedicated re-simulation and cost re-estimation. These recommendations hold within the cradle-to-gate scope, the reported categories and the process-simulation basis and should be revisited with pilot data.
The study provides an uncertainty-aware LCA-TEA framework that supports criterion-specific choices rather than a single ranking. Future work should extend the uncertainty analysis of heat integration, test combined heat and water integration, refine the solvent supply chain data, and validate the routes with pilot-scale inventory and cost data.
Author Contributions
Conceptualization, A.A.-M., S.M. and Á.D.G.-D.; methodology, A.A.-M., S.M. and Á.D.G.-D.; software, A.A.-M. and S.M.; validation, A.A.-M., S.M. and Á.D.G.-D.; formal analysis, A.A.-M. and S.M.; investigation, A.A.-M. and S.M.; resources, A.A.-M. and S.M.; data curation, A.A.-M. and S.M.; writing—original draft preparation, A.A.-M. and S.M.; writing—review and editing, A.A.-M., S.M. and Á.D.G.-D.; visualization, A.A.-M. and S.M.; supervision, A.A.-M., S.M. and Á.D.G.-D. All authors have read and agreed to the published version of the manuscript.
Funding
This research was funded by the Colombian Ministry of Science, Technology and Innovation (MINCIENCIAS) through the projects “Sustainable Use of Avocado (Laurus persea L.) Produced in the Montes de María to obtain Value Added Products under the Biorefinery Concept in the Department of Bolívar” and “Evaluation of the sustainability of a cascade biorefinery topology for the use of Hass avocado seeds cultivated in the Amazon region” (Codes BPIN 2020000100325), and through the program “Desarrollo de un modelo de bioeconomía para la obtención de productos derivados de la semilla de aguacate Hass con aplicabilidad en el sector agrícola y alimentario en el Departamento del Putumayo” (Project 100307, Contract 442-2023, contractual file No. 20232080192200008E).
Institutional Review Board Statement
Not applicable.
Informed Consent Statement
Not applicable.
Data Availability Statement
The data supporting the results are provided within the article and its appendices, which include the full life cycle inventory and deterministic LCIA results (Appendix A), the techno-economic comparison and cost breakdowns (Appendix B), and the Monte Carlo and allocation-sensitivity results (Appendix C). Additional underlying data are available from the corresponding author upon reasonable request.
Acknowledgments
During the preparation of this manuscript, the authors used Claude 4.8 for final language polishing, including typographical, wording, and grammatical revisions. The authors reviewed and edited the output and take full responsibility for the content of this publication.
Conflicts of Interest
The authors declare no conflicts of interest.
Appendix A. Supporting LCA Data
Appendix A provides the detailed inventory, deterministic LCIA, percentage-change, and hotspot evidence tables that support the main-text LCA figures.
Table A1.
Background life cycle inventory datasets. All datasets are from ecoinvent 3.10 under the cut-off system model, matched to the Colombian (CO) context where available. The same background datasets are used across all scenarios.
Table A2.
Full inventory comparison for the baseline and optimized avocado oil biorefinery configurations.
Table A3.
Deterministic LCIA values and percentage changes relative to the baseline configuration. Positive percentages denote an increase and negative percentages a reduction relative to S0.
Table A4.
Hotspot and contribution-analysis evidence used to support the main-text heatmap.
Appendix B. Supporting TEA Data
Appendix B provides the detailed TEA comparison, cost-structure plots, NPV curves, and sensitivity plots supporting the main-text TEA discussion. Scenario-level NPV curves complement the cumulative NPV values reported in the main-text Table 3.
Table A5.
Full techno-economic comparison for the baseline and optimized configurations. All values are recomputed on a single consistent annual cash-flow model (effective operating time 8000 h y−1. Recirculating cooling water and refrigerant). The reference configuration follows [9].
Figure A1.
Cash-flow curves over the plant lifetime, computed from the same annual cash flows used in the NPV calculation. (a) cumulative undiscounted cash flow. (b) cumulative discounted cash flow. The construction years carry the capital, start-up, and working-capital outflows. The point at which each discounted curve crosses zero corresponds to the discounted payback period, and its end-of-life value equals the project NPV reported in Table 3.
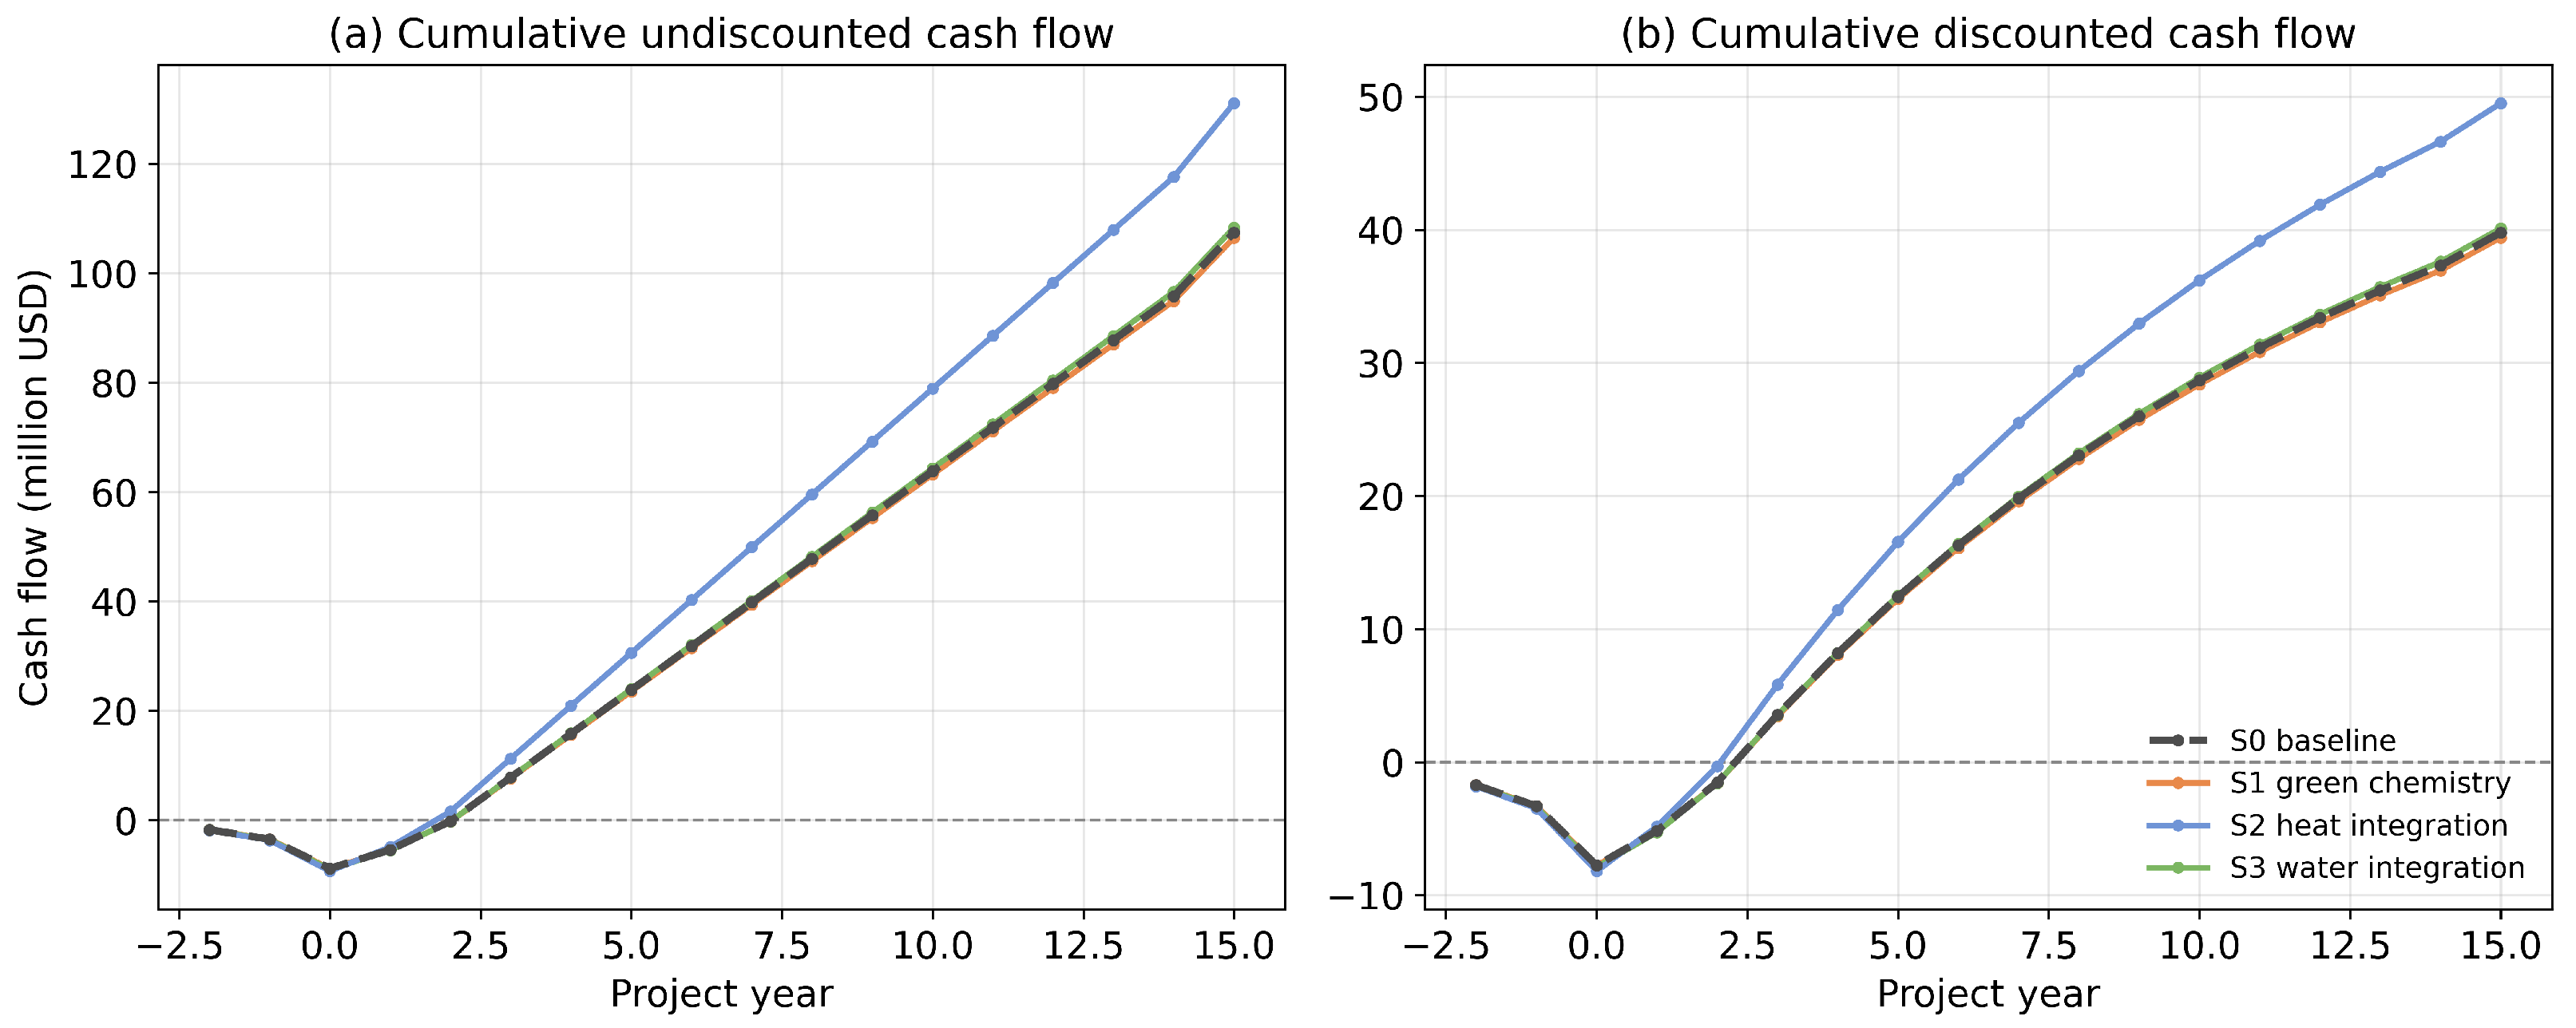
Table A6.
Hot and cold process streams and thermal targets used in the pinch analysis of the heat-integration scenario (S2), reproduced from the source heat-integration study [20]. Stream labels correspond to the Aspen Plus simulation. Pinch temperature 37 °C (hot scale). The synthesized heat-exchanger network comprises ten exchangers (seven above and three below the pinch), targeting an approximately 96% reduction in external cooling and about 14% in external heating.
Figure A2.
Raw-material cost breakdown for S1, S2, and S3 (annual cost contributions).
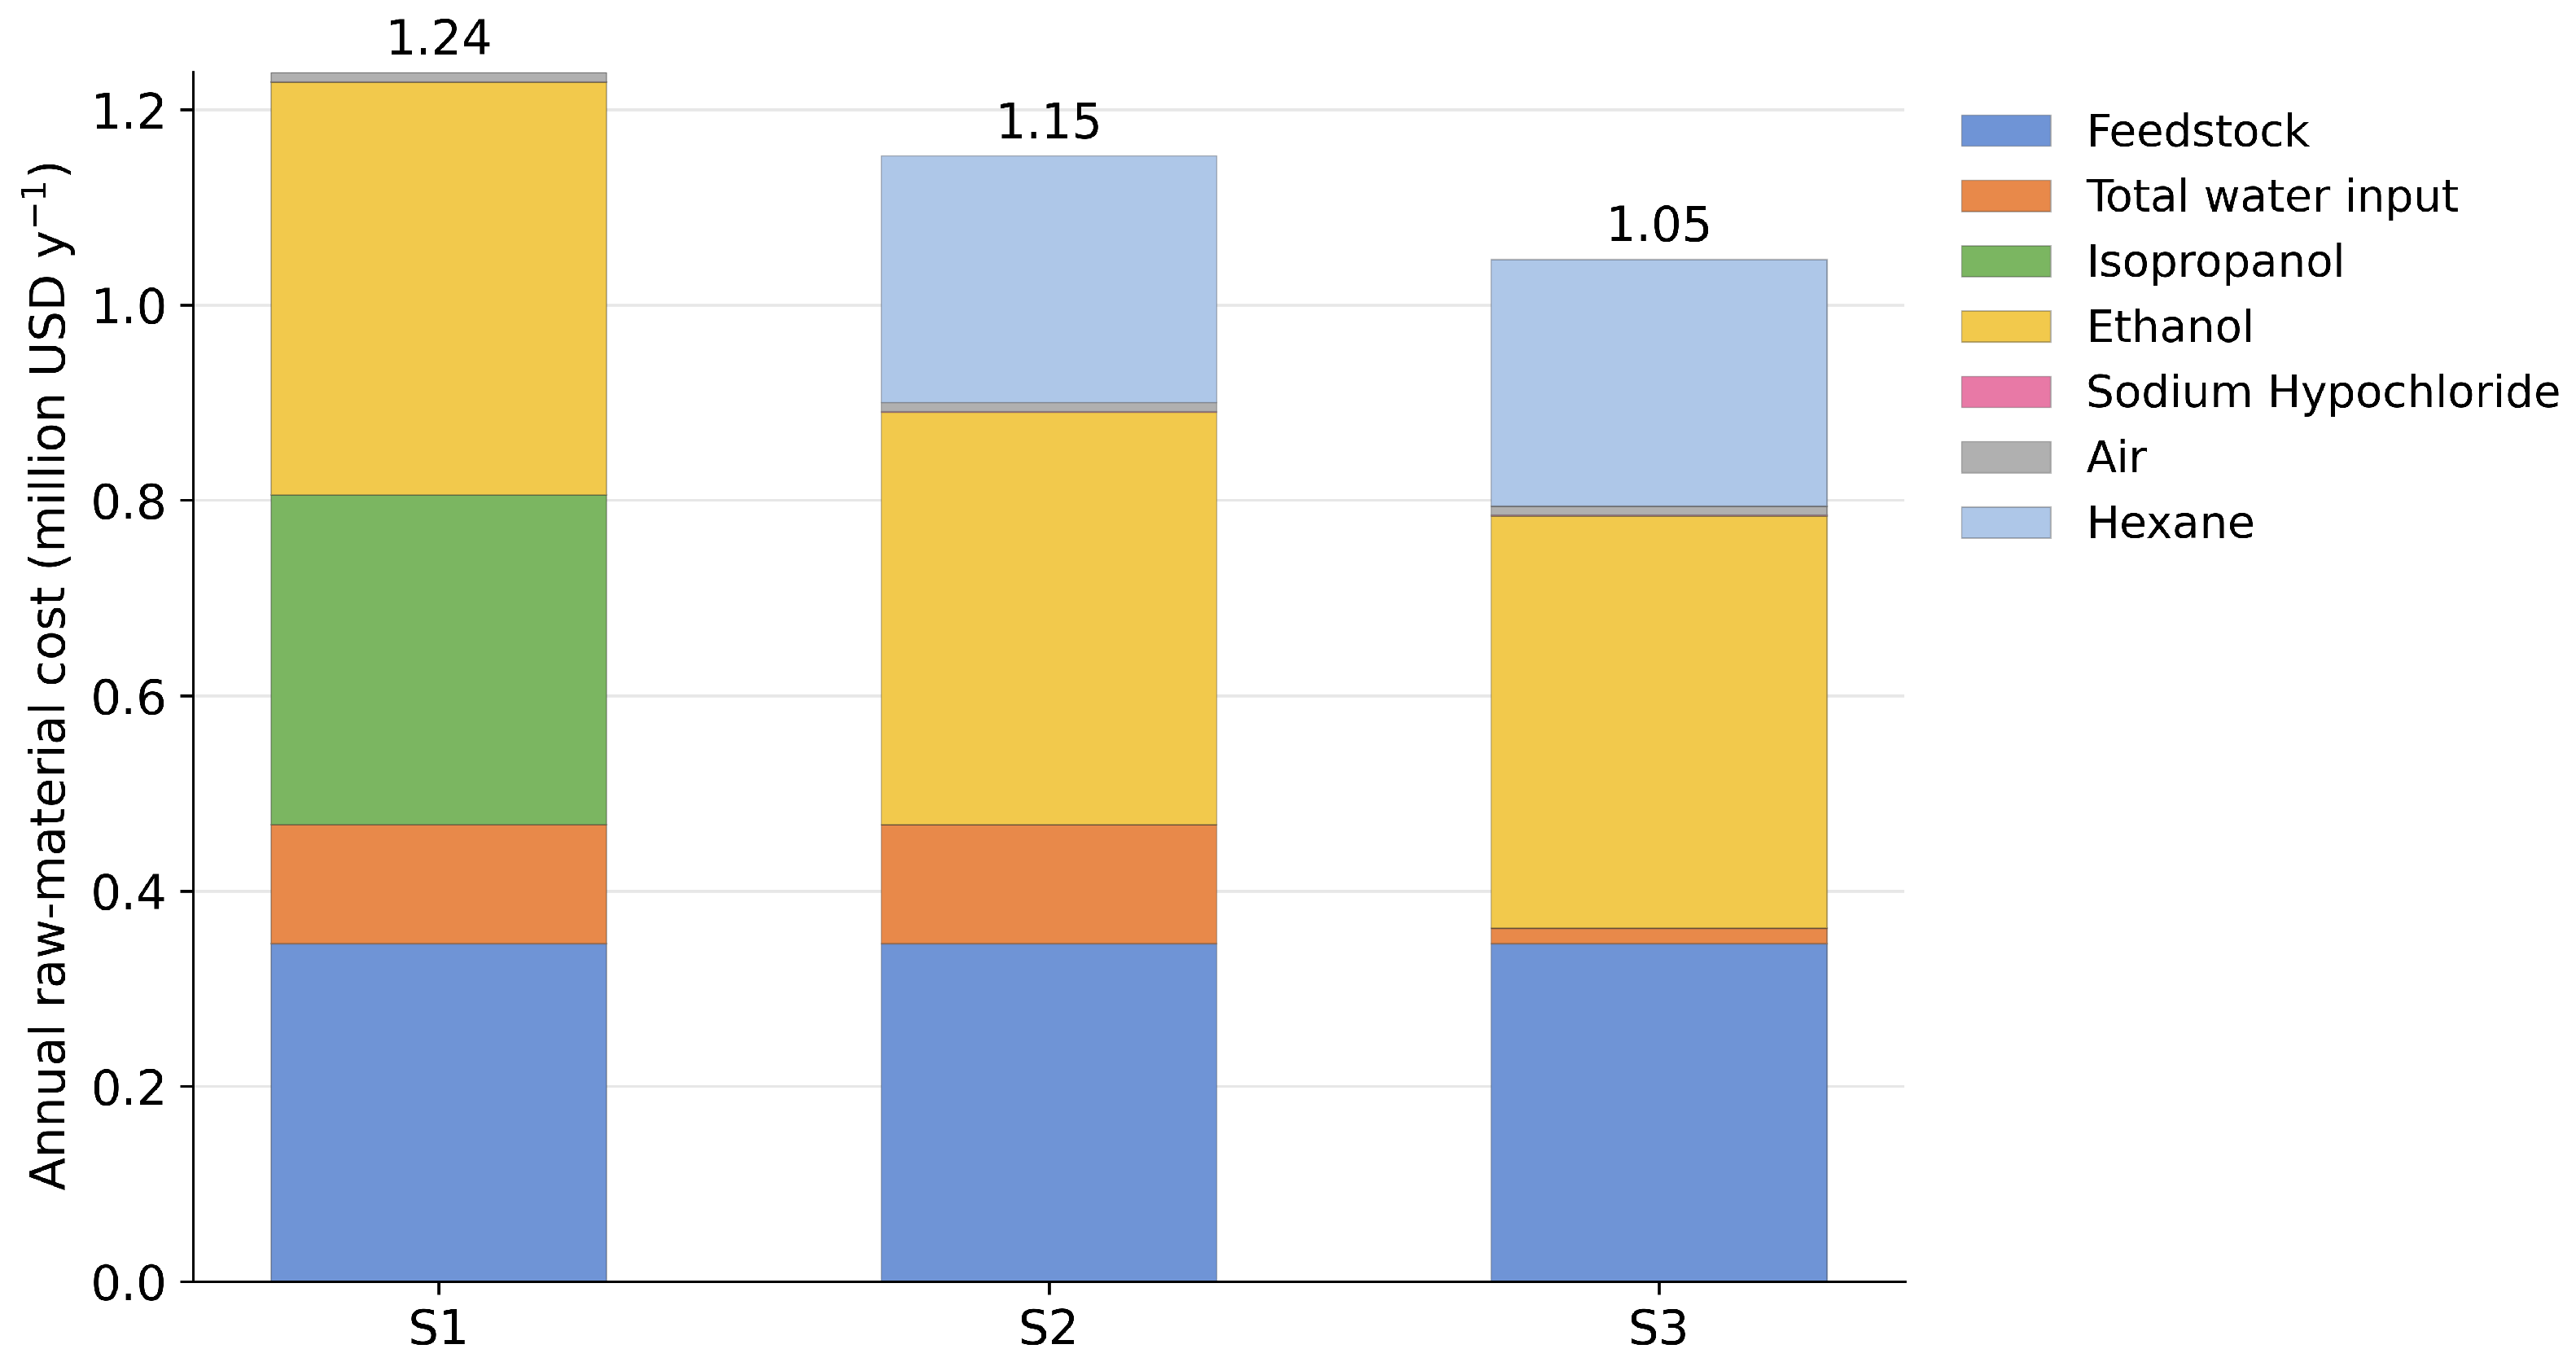
Figure A3.
Utility cost breakdown for S1, S2, and S3 (annual cost contributions).
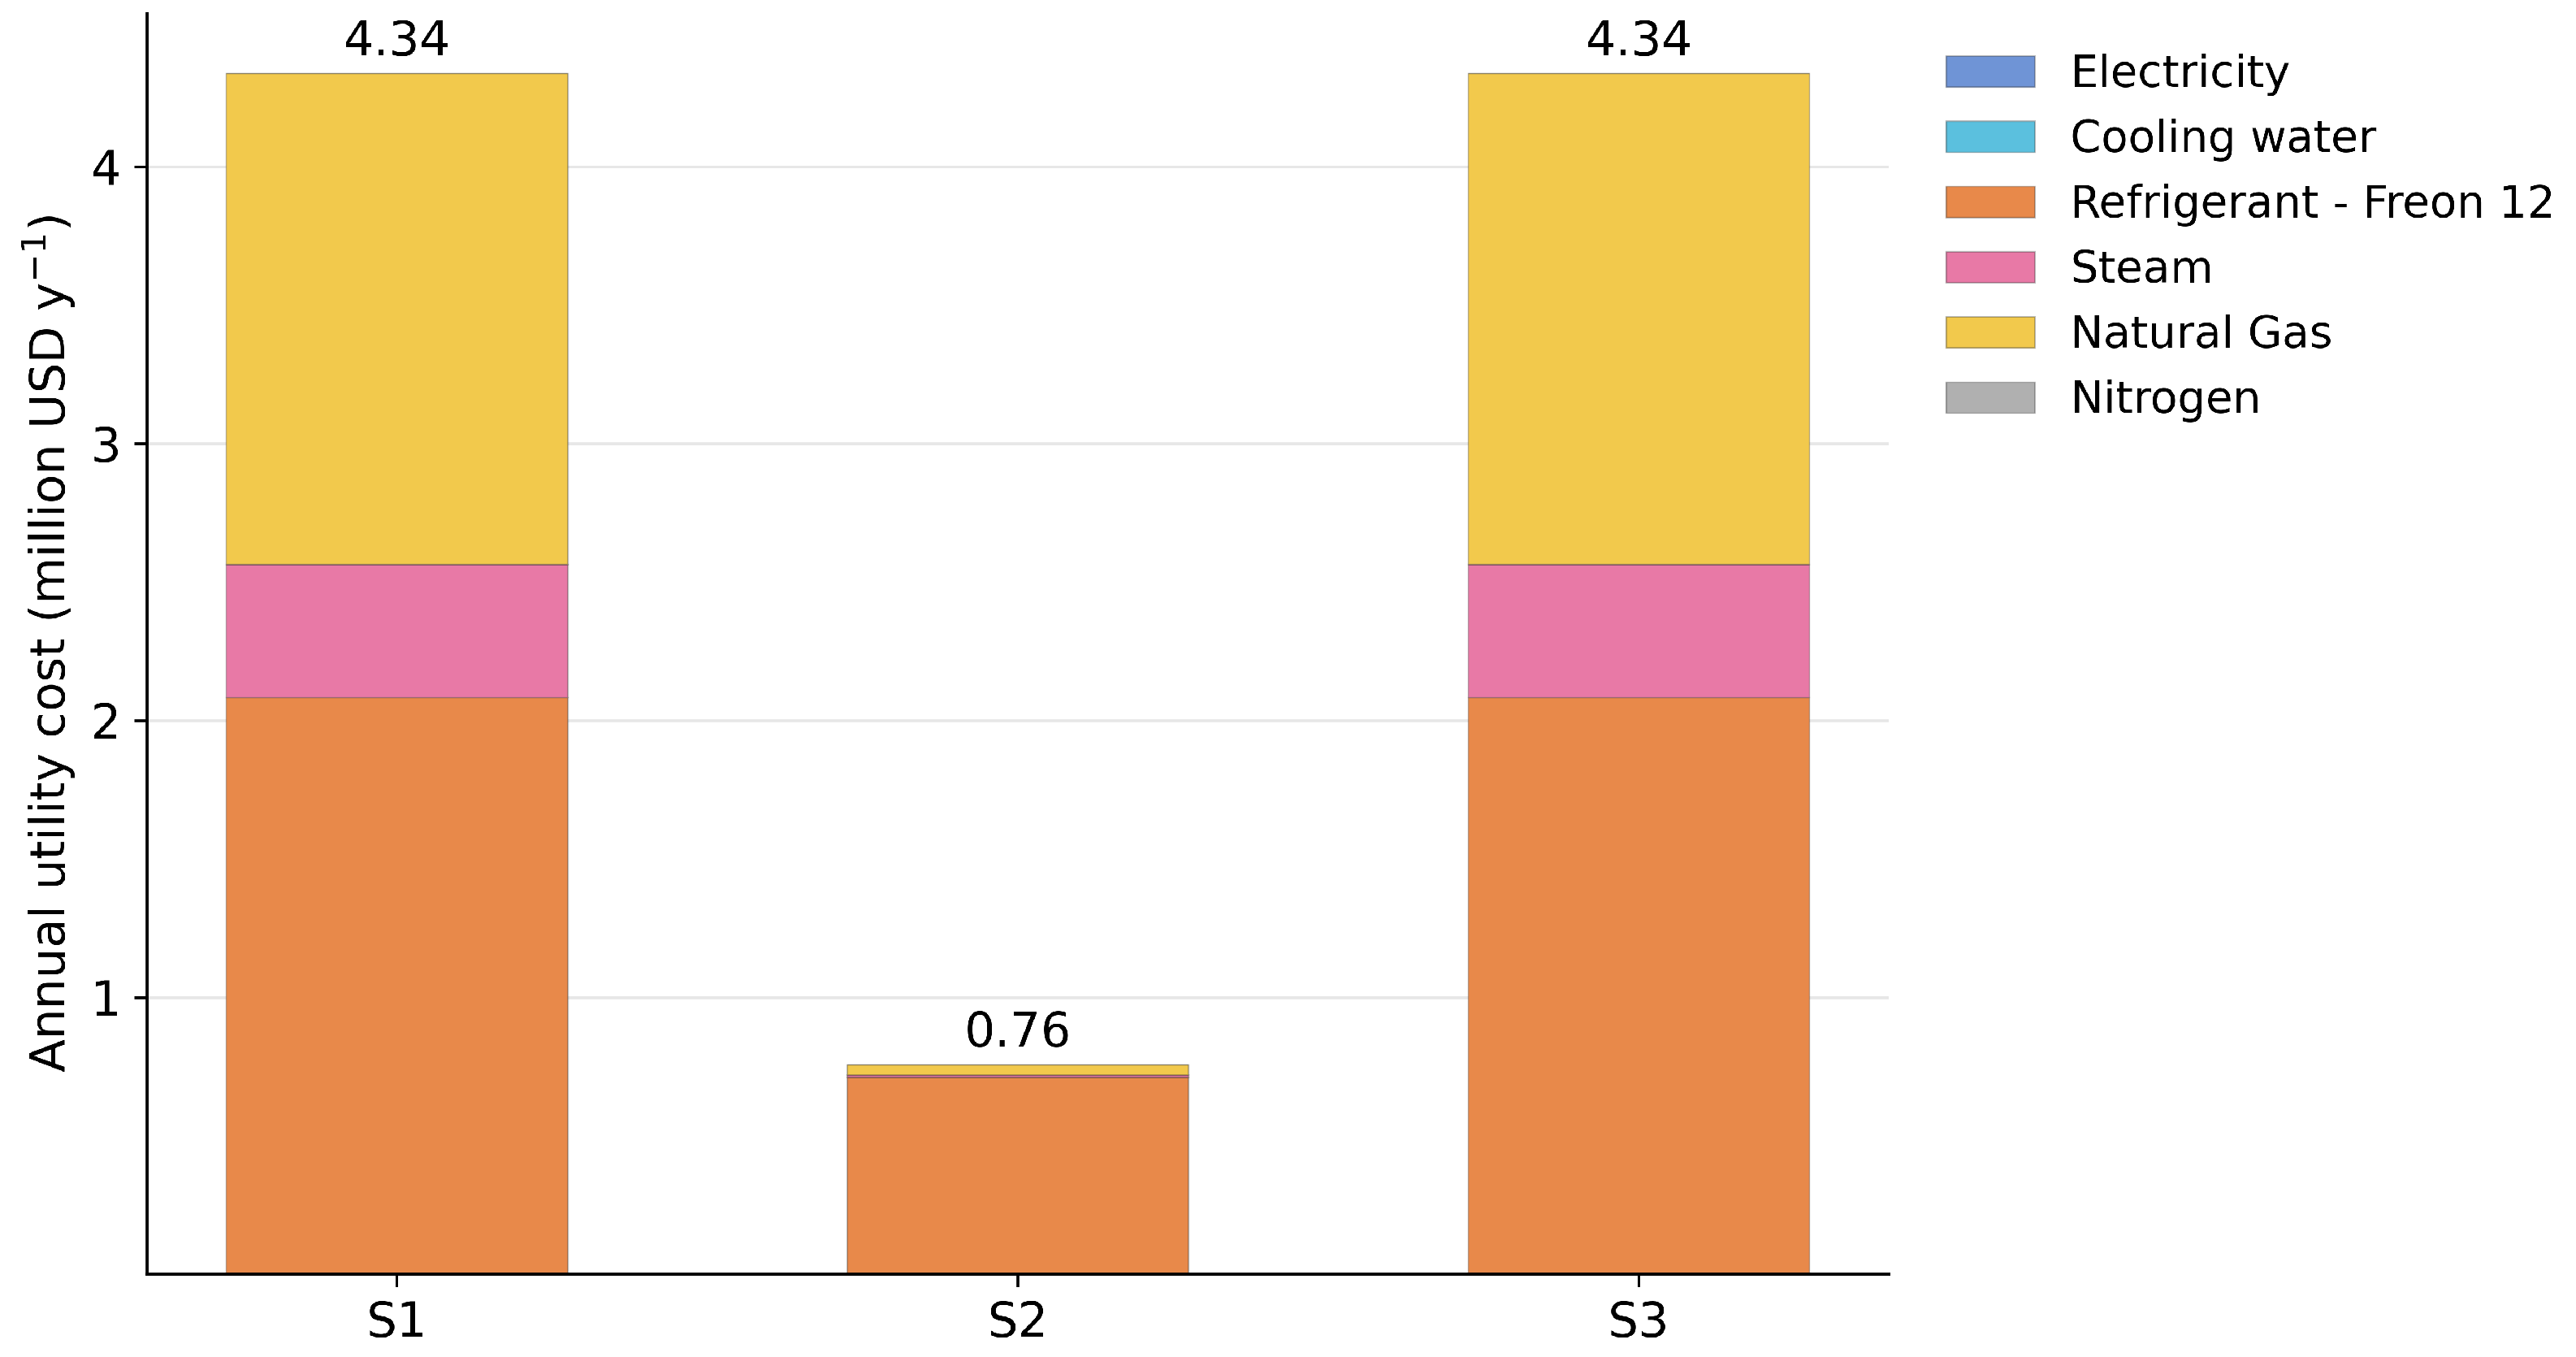
Figure A4.
TEA sensitivity panels for S1 green chemistry. (a) production rate versus revenues and AOC. (b) selling price versus on-stream efficiency. (c) raw-material cost versus profit metrics. (d) NVOC versus ROI, and (e) NVOC versus PBP.
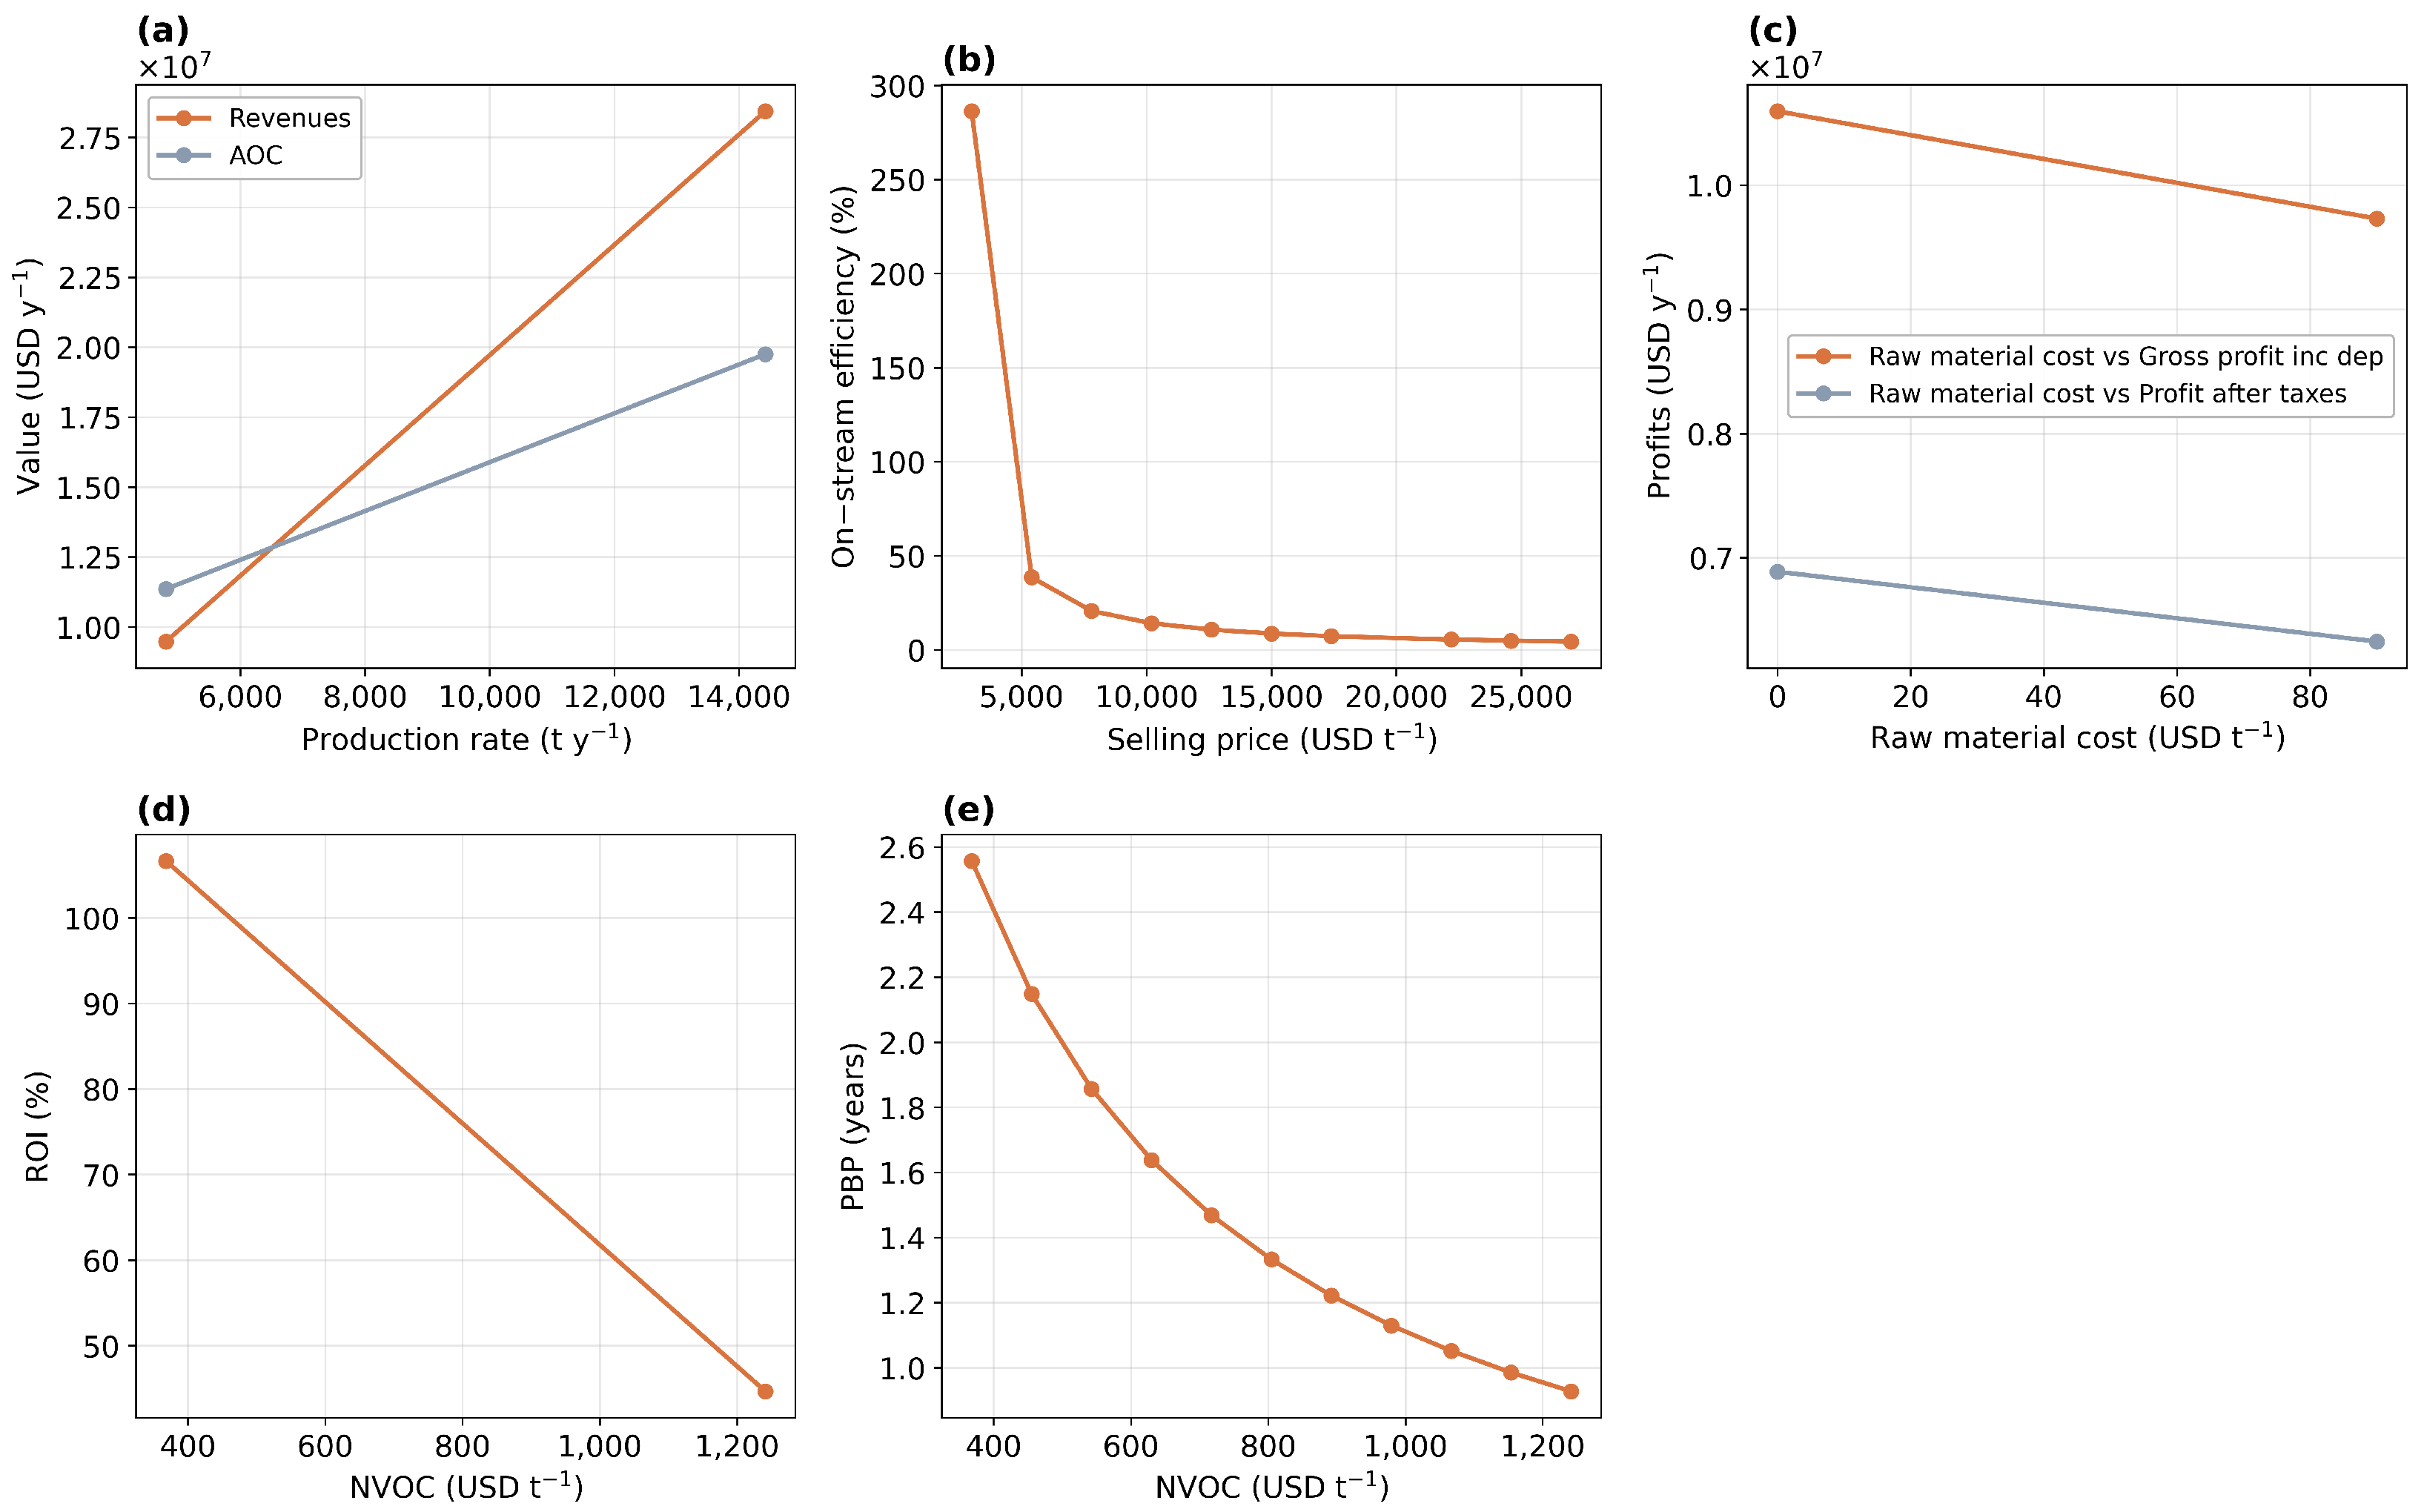
Figure A5.
TEA sensitivity panels for S2 heat integration. (a) production rate versus revenues and AOC. (b) selling price versus on-stream efficiency. (c) raw-material cost versus profit metrics. (d) NVOC versus ROI, and (e) NVOC versus PBP.
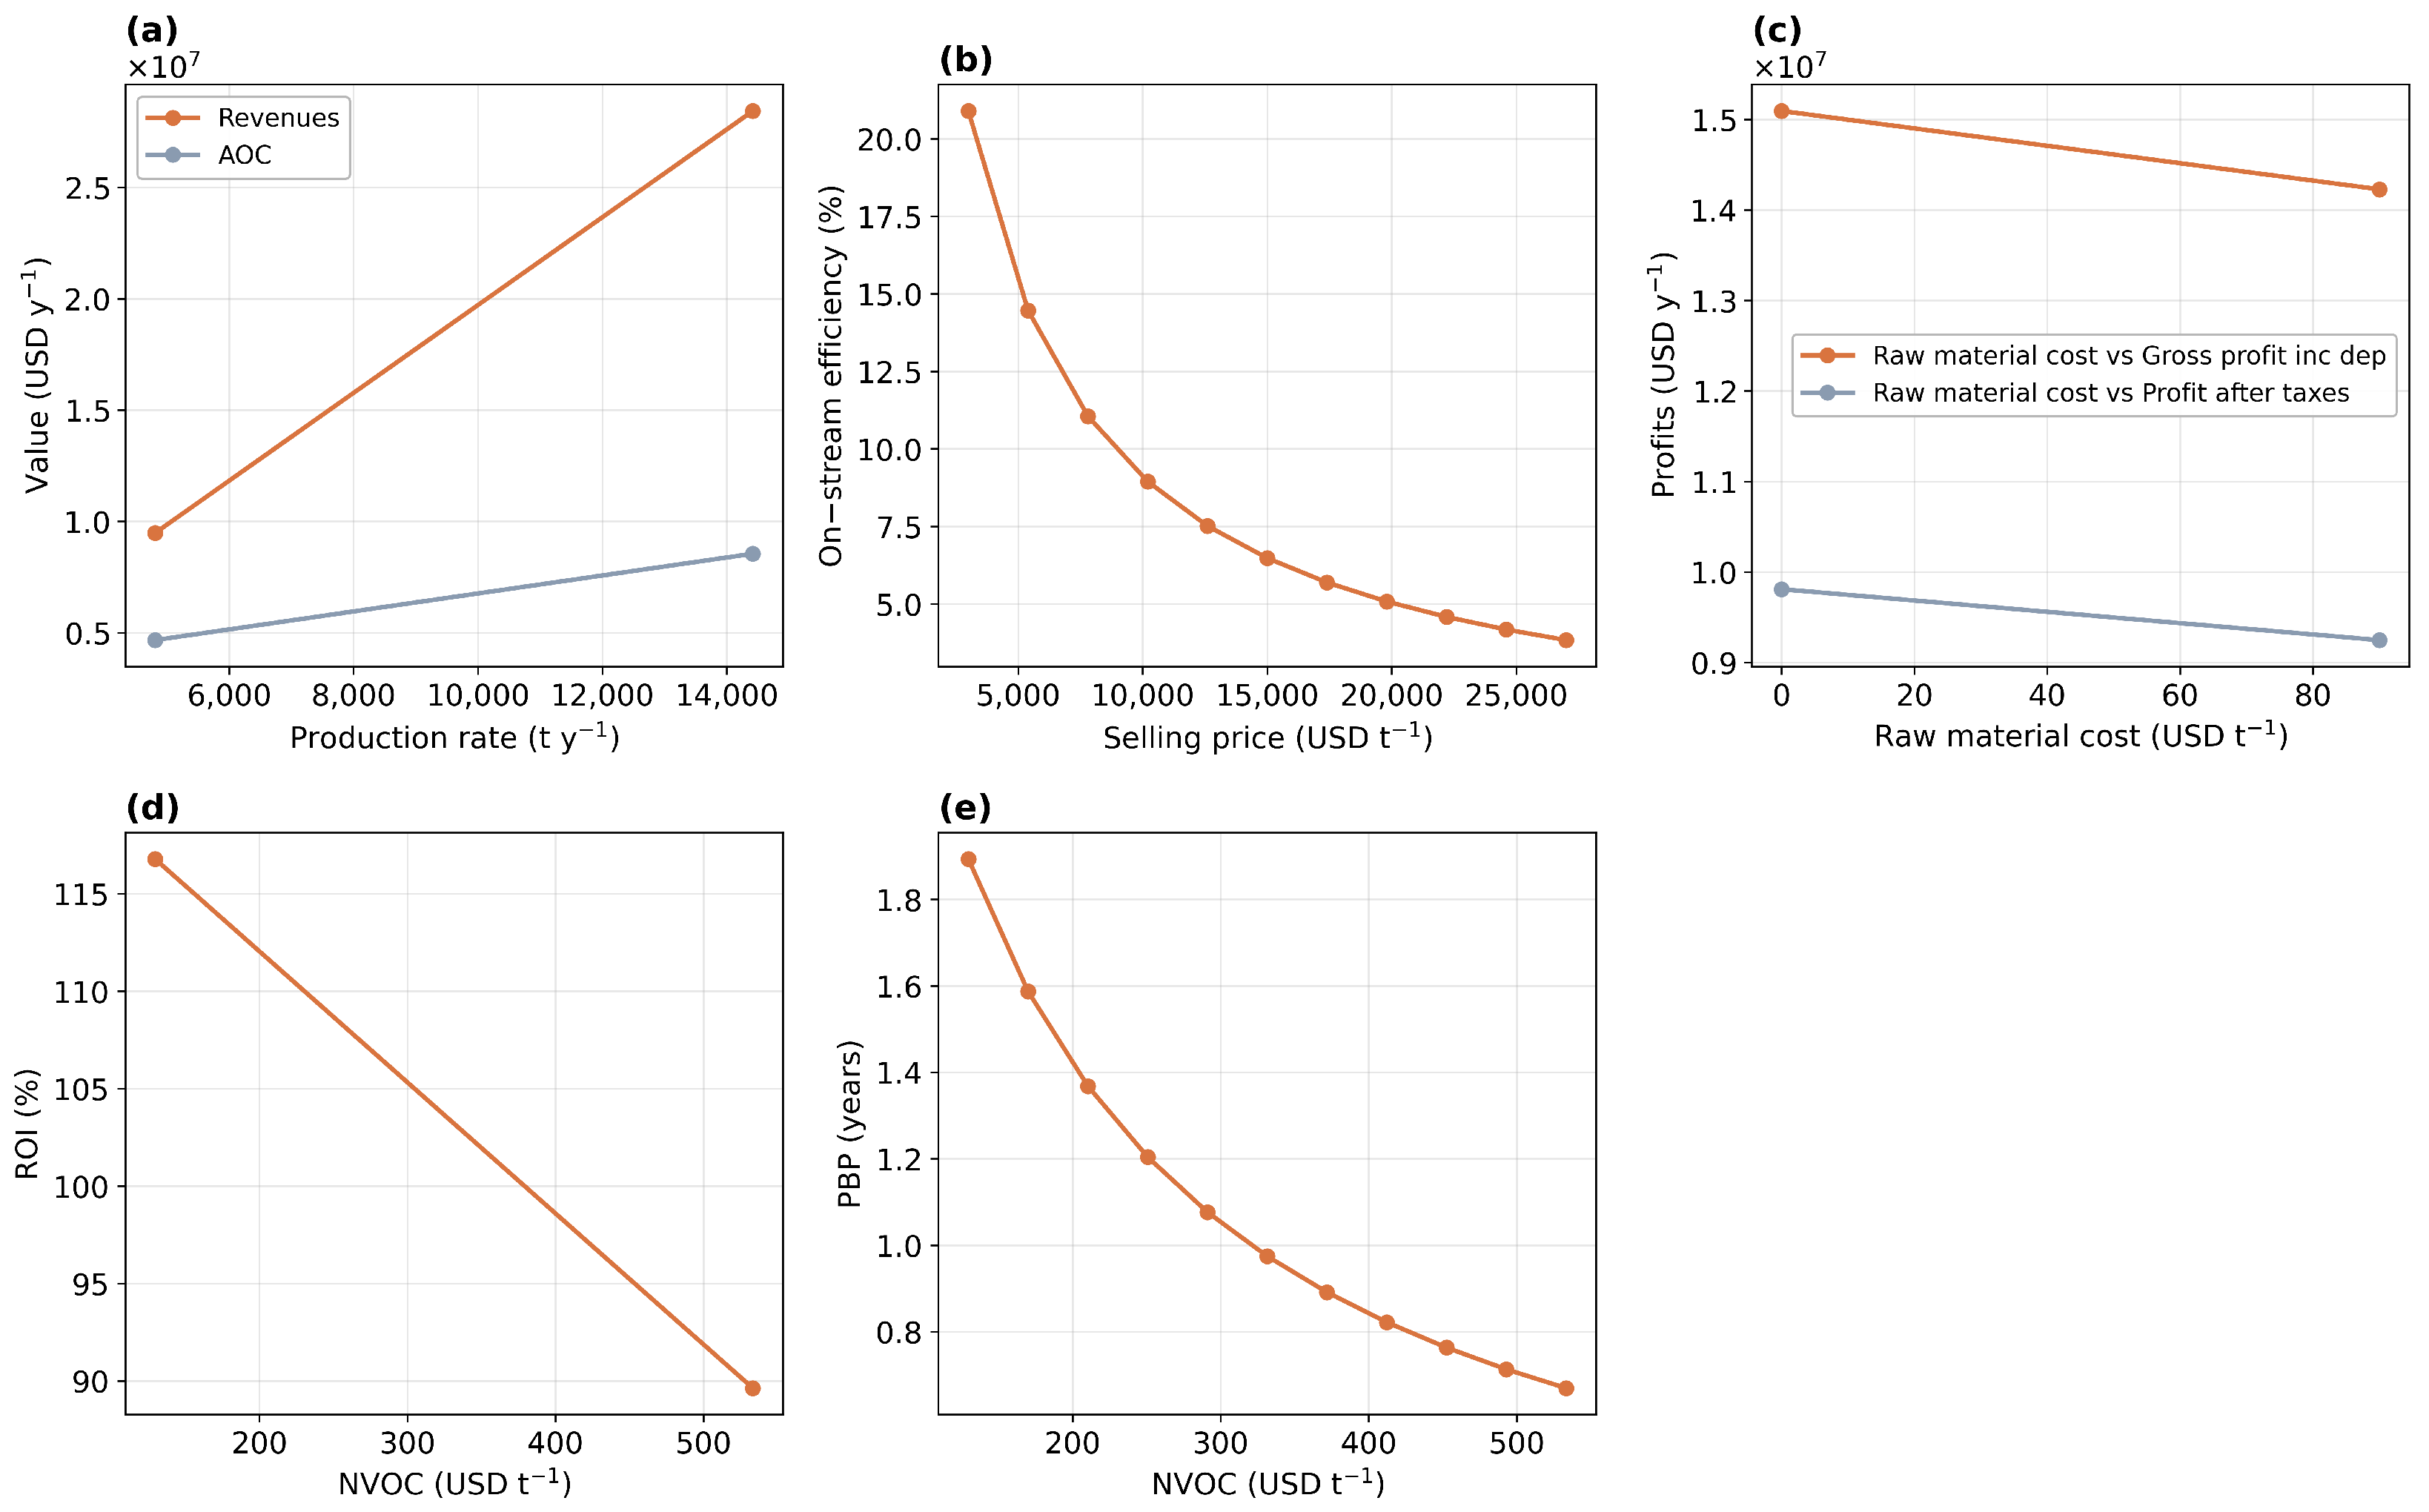
Figure A6.
TEA sensitivity panels for S3 water integration. (a) production rate versus revenues and AOC. (b) selling price versus on-stream efficiency. (c) raw-material cost versus profit metrics. (d) NVOC versus ROI, and (e) NVOC versus PBP.
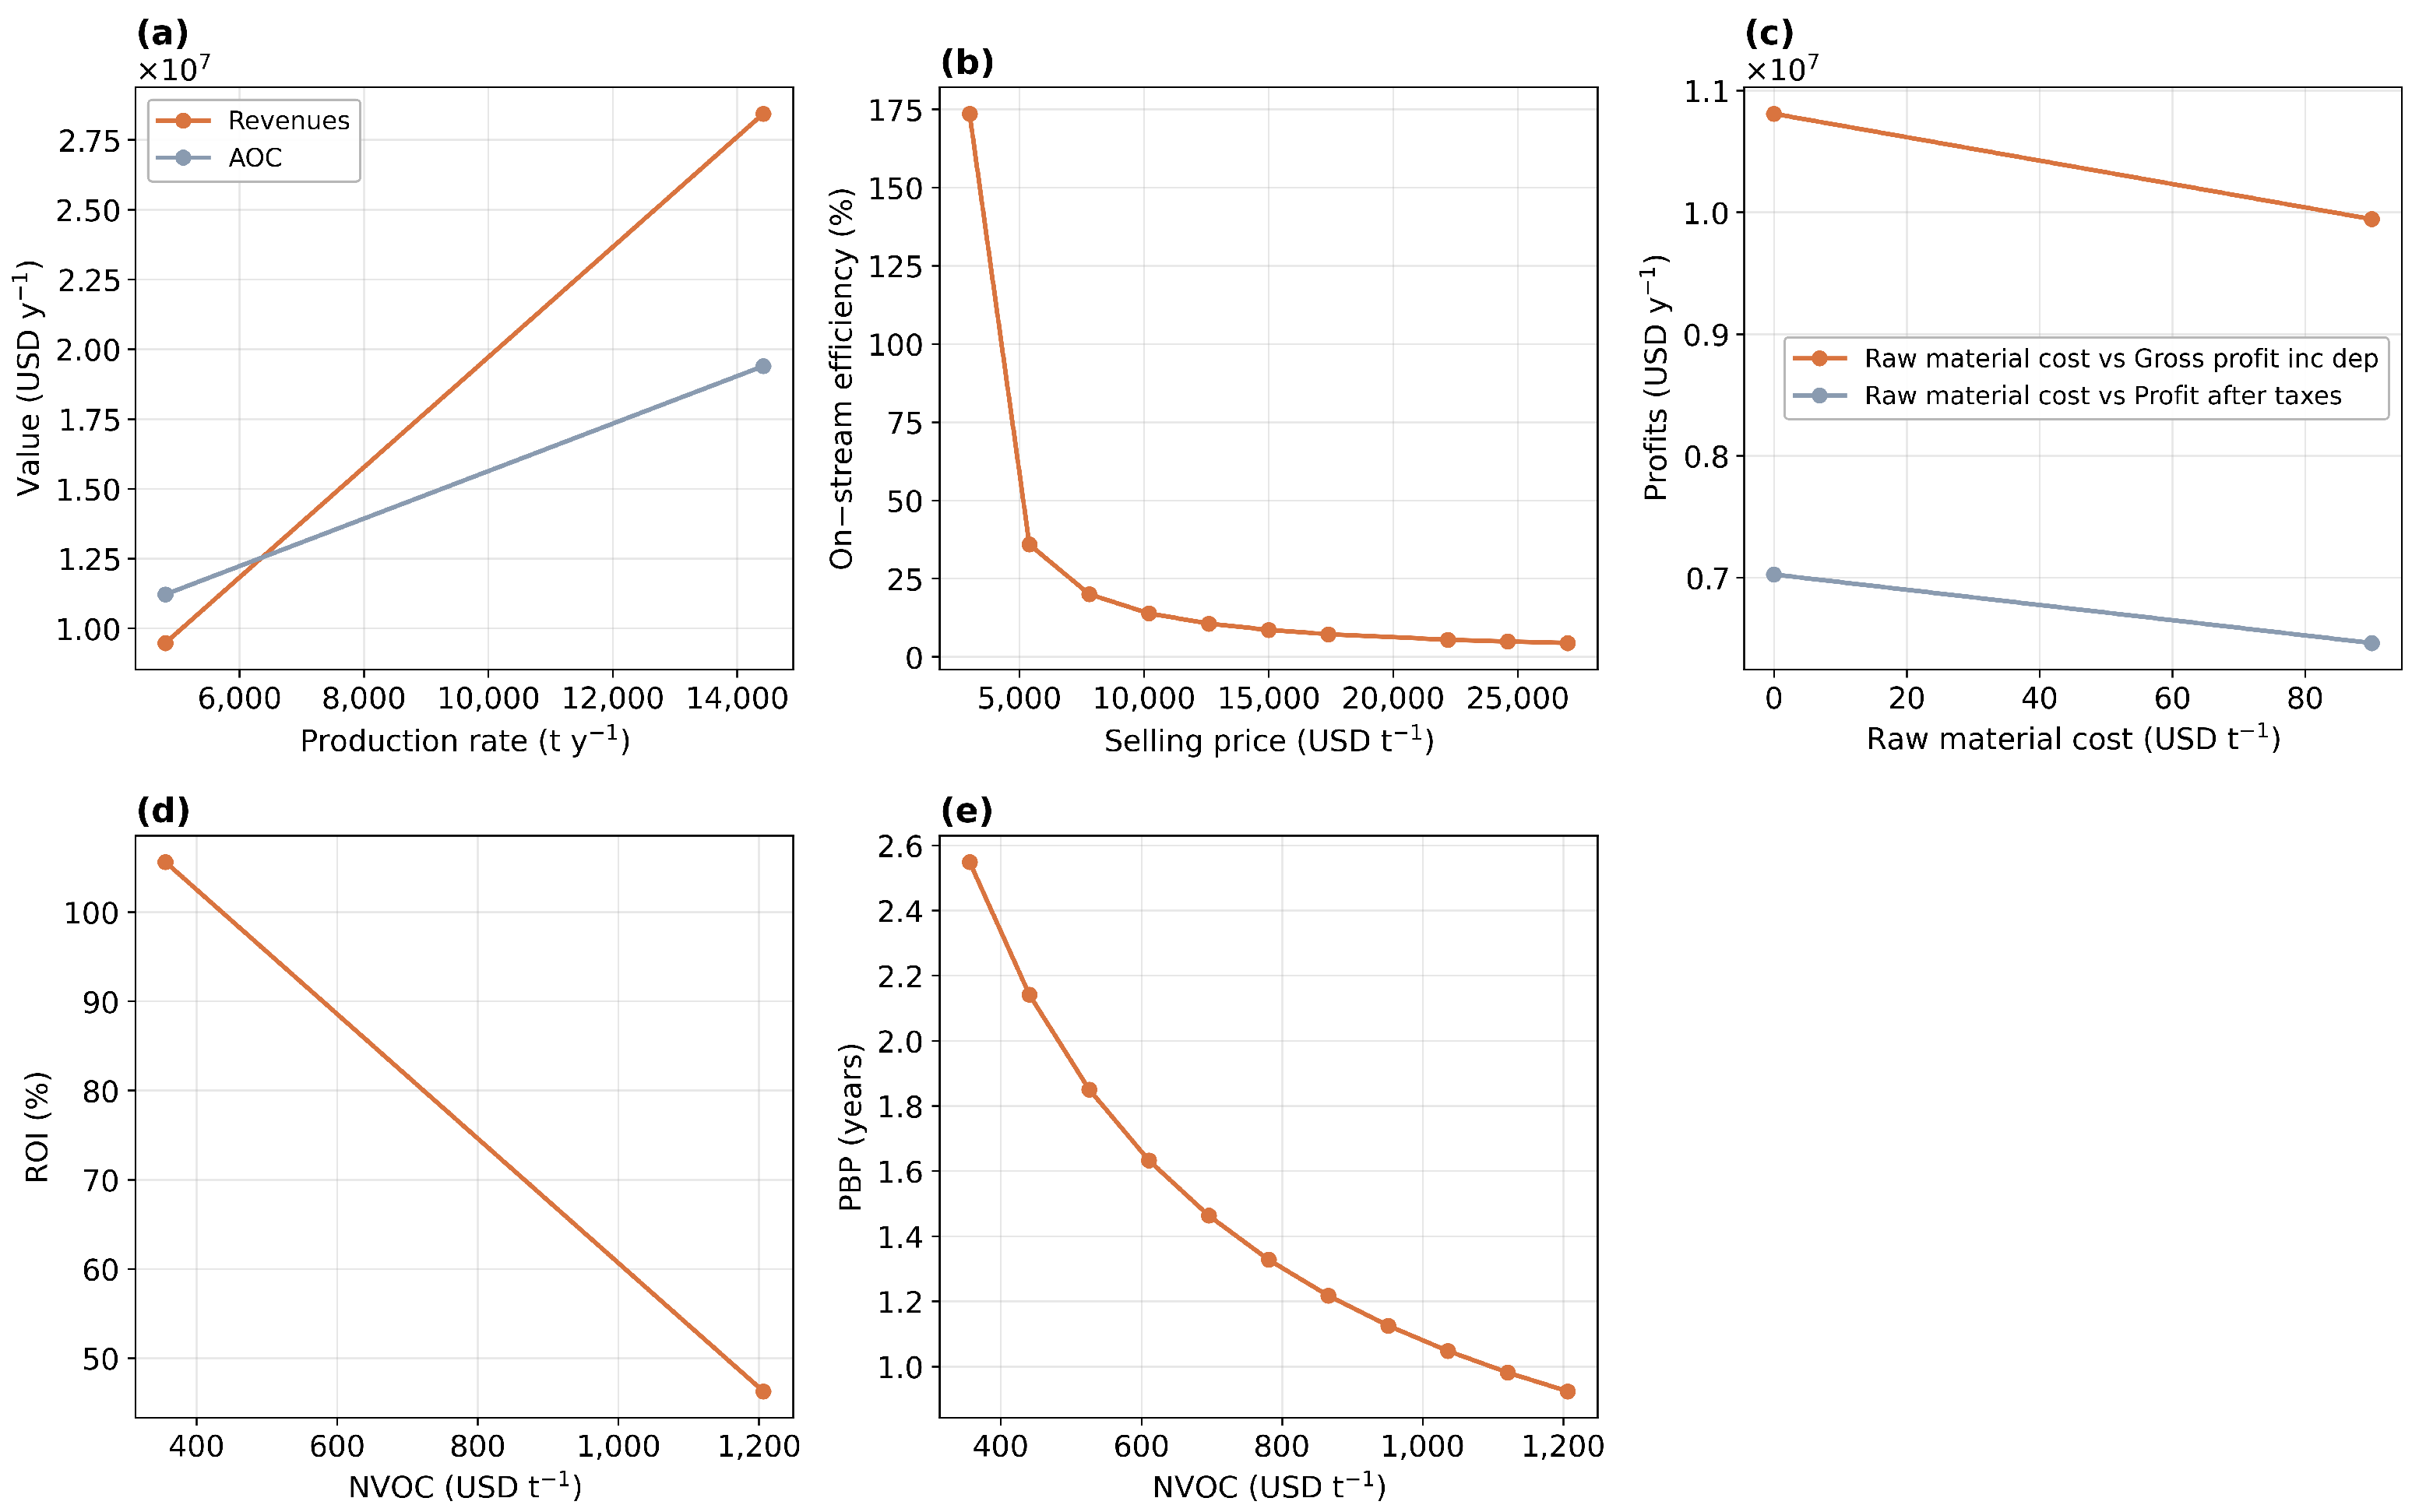
Appendix C. Uncertainty and Sensitivity Tables
Appendix C provides the complete uncertainty and allocation-sensitivity tables supporting the main-text Monte Carlo and robustness figures.
Table A7.
Allocation basis for avocado oil and co-products: product flows, unit prices, market value, and the resulting economic and mass allocation factors used in the allocation sensitivity. The product portfolio and factors are common to all scenarios. Values follow the source biorefinery inventory [9,10].
Table A8.
Monte Carlo uncertainty summary (mean and 95% interval) per 1 kg avocado oil.
Table A9.
Allocation sensitivity summary under economic allocation, mass allocation, and subdivision.
References
- Rodríguez-Martínez, B.; Romaní, A.; Eibes, G.; Garrote, G.; Gullón, B.; del Río, P.G. Potential and prospects for utilization of avocado by-products in integrated biorefineries. Bioresour. Technol. 2022, 364, 128034. [Google Scholar] [CrossRef] [Scilit]
- García-Vargas, M.; Contreras, M.; Castro, E. Avocado-derived biomass as a source of bioenergy and bioproducts. Appl. Sci. 2020, 10, 8195. [Google Scholar] [CrossRef] [Scilit]
- Mora-Sandí, A.; Ramírez-González, A.; Castillo-Henríquez, L.; Lopretti-Correa, M.; Vega-Baudrit, J.R. Persea Americana Agro-Industrial Waste Biorefinery for Sustainable High-Value-Added Products. Polymers 2021, 13, 1727. [Google Scholar] [CrossRef] [Scilit] [PubMed]
- Solarte-Toro, J.C.; Ortiz-Sanchez, M.; Cardona Alzate, C.A. Environmental life cycle assessment (E-LCA) and social impact assessment (SIA) of small-scale biorefineries implemented in rural zones: The avocado (Persea Americana var. Americana) case in Colombia. Environ. Sci. Pollut. Res. 2023, 30, 8790–8808. [Google Scholar] [CrossRef] [Scilit] [PubMed]
- Piedrahita-Rodriguez, S.; Cardona Urrea, S.; Escobar Garcia, D.; Ortiz-Sanchez, M.; Solarte-Toro, J.C.; Cardona Alzate, C.A. Life cycle assessment and potential geolocation of a multi-feedstock biorefinery: Integration of the avocado and plantain value chains in rural zones. Bioresour. Technol. Rep. 2023, 21, 101318. [Google Scholar] [CrossRef] [Scilit]
- Blaauw, S.A.; Broekman, A.; Maina, J.W.; Steyn, W.J.v.d.M.; Haddad, W.A. Life Cycle Assessment of an Avocado: Grown in South Africa-Enjoyed in Europe. Environ. Manag. 2024, 74, 989–1005. [Google Scholar] [CrossRef] [Scilit] [PubMed]
- Valdez-Valdes, S.; Tejeda-Benitez, L.; González-Delgado, Á.D. Assessing the environmental impacts of the valorization of Creole-Antillean avocado via an extractive-based biorefinery in the Montes de María region. Sustainability 2024, 16, 11057. [Google Scholar] [CrossRef] [Scilit]
- García-Maza, S.; Herrera-Rodríguez, T.C.; González-Delgado, Á.D. Process simulation and technical evaluation using water-energy-product (WEP) analysis of an extractive-based biorefinery of Creole-Antillean avocado produced in the Montes de María. Sustainability 2024, 16, 9575. [Google Scholar] [CrossRef] [Scilit]
- Meramo, S.; Herrera-Rodríguez, T.; González-Delgado, Á.D. Economic and environmental hotspots of new thermal-extractive avocado biorefinery. Biomass Bioenergy 2026, 207, 108724. [Google Scholar] [CrossRef] [Scilit]
- Meramo, S.; Herrera-Rodriguez, T.; Gonzalez-Delgado, A.D. Life Cycle Assessment of a Heat-Integrated Thermal-Extractive Avocado Oil Biorefinery. Chem. Eng. Trans. 2026, 125, 307–312. [Google Scholar] [CrossRef]
- Osman, A.I.; Fang, B.; Zhang, Y.; Liu, Y.; Yu, J.; Farghali, M. Life cycle assessment and techno-economic analysis of sustainable bioenergy production: A review. Environ. Chem. Lett. 2024, 22, 1115–1154. [Google Scholar] [CrossRef] [Scilit]
- Croxatto Vega, G.; Sohn, J.; Voogt, J.; Birkved, M.; Olsen, S.I.; Nilsson, A.E. Insights from combining techno-economic and life cycle assessment: A case study of polyphenol extraction from red wine pomace. Resour. Conserv. Recycl. 2021, 167, 105318. [Google Scholar] [CrossRef] [Scilit]
- Dickson, R.; Mancini, E.; Garg, N.; Woodley, J.M.; Gernaey, K.V.; Pinelo, M.; Liu, J.; Mansouri, S.S. Sustainable bio-succinic acid production: Superstructure optimization, techno-economic, and lifecycle assessment. Energy Environ. Sci. 2021, 14, 3542–3558. [Google Scholar] [CrossRef] [Scilit]
- Thomassen, G.; Van Dael, M.; Van Passel, S.; You, F. How to assess the potential of emerging green technologies? Towards a prospective environmental and techno-economic assessment framework. Green Chem. 2019, 21, 4868–4886. [Google Scholar] [CrossRef] [Scilit]
- Chemat, F.; Abert Vian, M.; Ravi, H.K.; Khadhraoui, B.; Hilali, S.; Perino, S. Review of alternative solvents for green extraction of food and natural products: Panorama, principles, applications and prospects. Molecules 2019, 24, 3007. [Google Scholar] [CrossRef] [Scilit] [PubMed]
- Clarke, C.J.; Tu, W.-C.; Levers, O.; Bröhl, A.; Hallett, J.P. Green and sustainable solvents in chemical processes. Chem. Rev. 2018, 118, 747–800. [Google Scholar] [CrossRef] [Scilit] [PubMed]
- Satriana, S.; Supardan, M.D.; Arpi, N.; Wan Mustapha, W.A. Development of Methods Used in the Extraction of Avocado Oil. Eur. J. Lipid Sci. Technol. 2019, 121, 1800210. [Google Scholar] [CrossRef] [Scilit]
- Klemeš, J.J.; Varbanov, P.S.; Walmsley, T.G.; Jia, X. New directions in the implementation of pinch methodology. Renew. Sustain. Energy Rev. 2018, 98, 439–468. [Google Scholar] [CrossRef] [Scilit]
- Vanapalli, K.R.; Bhar, R.; Maity, S.; Dubey, B.K.; Kumar, S.; Kumar, V. Life cycle assessment of fermentative production of lactic acid from bread waste based on process modelling using pinch technology. Sci. Total Environ. 2023, 905, 167051. [Google Scholar] [CrossRef] [Scilit] [PubMed]
- Meramo, S.; Herrera-Rodríguez, T.; González-Delgado, Á.D. Heat Integration of an Avocado Oil Biorefinery Based on the Valorisation of Avocado Side Streams. Chem. Eng. Trans. 2026, 125, 301–306. [Google Scholar] [CrossRef]
- Wang, Y.P.; Smith, R. Wastewater minimisation. Chem. Eng. Sci. 1994, 49, 981–1006. [Google Scholar] [CrossRef] [Scilit]
- Foo, D.C.Y. State-of-the-Art Review of Pinch Analysis Techniques for Water Network Synthesis. Ind. Eng. Chem. Res. 2009, 48, 5125–5159. [Google Scholar] [CrossRef] [Scilit]
- Turton, R.; Shaeiwitz, J.A.; Bhattacharyya, D.; Whiting, W.B. Analysis, Synthesis, and Design of Chemical Processes, 5th ed.; Pearson: Boston, MA, USA, 2018. [Google Scholar]
- Towler, G.; Sinnott, R. Chemical Engineering Design: Principles, Practice and Economics of Plant and Process Design, 3rd ed.; Butterworth-Heinemann: Oxford, UK, 2022. [Google Scholar]
- ISO 14040:2006; Environmental Management-Life Cycle Assessment-Principles and Framework. International Organization for Standardization: Geneva, Switzerland, 2006.
- ISO 14044:2006; Environmental Management-Life Cycle Assessment-Requirements and Guidelines. International Organization for Standardization: Geneva, Switzerland, 2006.
- Wernet, G.; Bauer, C.; Steubing, B.; Reinhard, J.; Moreno-Ruiz, E.; Weidema, B. The ecoinvent database version 3 (part I): Overview and methodology. Int. J. Life Cycle Assess. 2016, 21, 1218–1230. [Google Scholar] [CrossRef] [Scilit]
- European Commission. Commission Recommendation (EU) 2021/2279 of 15 December 2021 on the use of the Environmental Footprint methods to measure and communicate the life cycle environmental performance of products and organisations. Off. J. Eur. Union 2021, L471, 1–396. [Google Scholar]
- Huijbregts, M.A.J.; Steinmann, Z.J.N.; Elshout, P.M.F.; Stam, G.; Verones, F.; Vieira, M.; Zijp, M.; Hollander, A.; van Zelm, R. ReCiPe2016: A harmonised life cycle impact assessment method at midpoint and endpoint level. Int. J. Life Cycle Assess. 2017, 22, 138–147. [Google Scholar] [CrossRef] [Scilit]
- European Commission—Joint Research Centre. International Reference Life Cycle Data System (ILCD) Handbook: General Guide for Life Cycle Assessment—Detailed Guidance; Publications Office of the European Union: Luxembourg, 2010. [Google Scholar]
- Zapata-Boada, S.; Gonzalez Miquel, M.; Jobson, M.; Cuellar-Franca, R. A methodology to evaluate solvent extraction-based processes considering techno-economic and environmental sustainability criteria for biorefinery applications. Ind. Eng. Chem. Res. 2021, 60, 16394–16416. [Google Scholar] [CrossRef] [Scilit]
- Ferdous, J.; Bensebaa, F.; Pelletier, N. Integration of LCA, TEA, process simulation and optimization: A systematic review of current practices and scope to propose a framework for pulse processing pathways. J. Clean. Prod. 2023, 402, 136804. [Google Scholar] [CrossRef] [Scilit]
- García-Vallejo, M.C.; Agudelo Patiño, T.; Poveda-Giraldo, J.A.; Piedrahita-Rodríguez, S.; Cardona Alzate, C.A. Alternatives for the Valorization of Avocado Waste Generated in the Different Links of the Value Chain Based on a Life-Cycle Analysis Approach. Agronomy 2023, 13, 2229. [Google Scholar] [CrossRef] [Scilit]
- Caldeira, C.; Vlysidis, A.; Fiore, G.; De Laurentiis, V.; Vignali, G.; Sala, S. Sustainability of food waste biorefinery: A review on valorisation pathways, techno-economic constraints, and environmental assessment. Bioresour. Technol. 2020, 312, 123575. [Google Scholar] [CrossRef] [Scilit] [PubMed]
- Pérez-Almada, D.; Galán-Martín, A.; Contreras, M.d.M.; Castro, E. Integrated techno-economic and environmental assessment of biorefineries: Review and future research directions. Sustain. Energy Fuels 2023, 7, 3312–3333. [Google Scholar] [CrossRef] [Scilit]
- Ramos, J.S.; Ferreira, A.F. Techno-economic analysis and life cycle assessment of olive and wine industry co-products valorisation. Renew. Sustain. Energy Rev. 2022, 155, 111929. [Google Scholar] [CrossRef] [Scilit]
- Liao, C.Y.; Guan, Y.J.; Bustamante-Román, M. Techno-Economic Analysis and Life Cycle Assessment of Pineapple Leaves Utilization in Costa Rica. Energies 2022, 15, 5784. [Google Scholar] [CrossRef] [Scilit]
- Midolo, G.; Cutuli, G.; Porto, S.M.C.; Ottolina, G.; Paini, J.; Valenti, F. LCA analysis for assessing environmental sustainability of new biobased chemicals by valorising citrus waste. Sci. Rep. 2024, 14, 21418. [Google Scholar] [CrossRef] [Scilit] [PubMed]
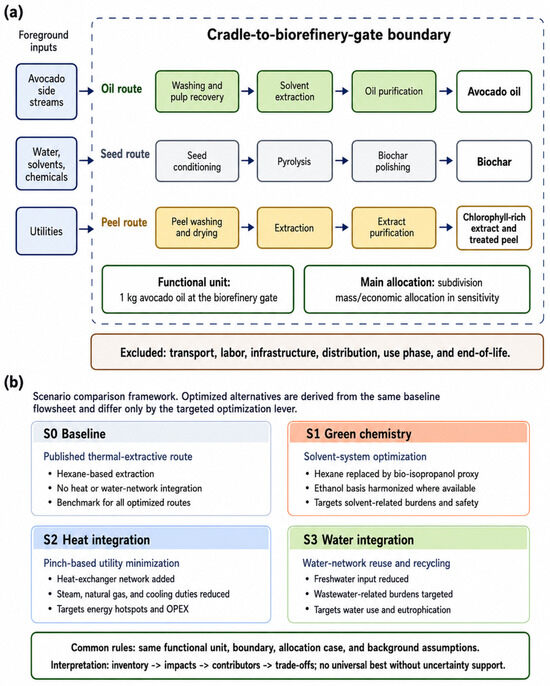
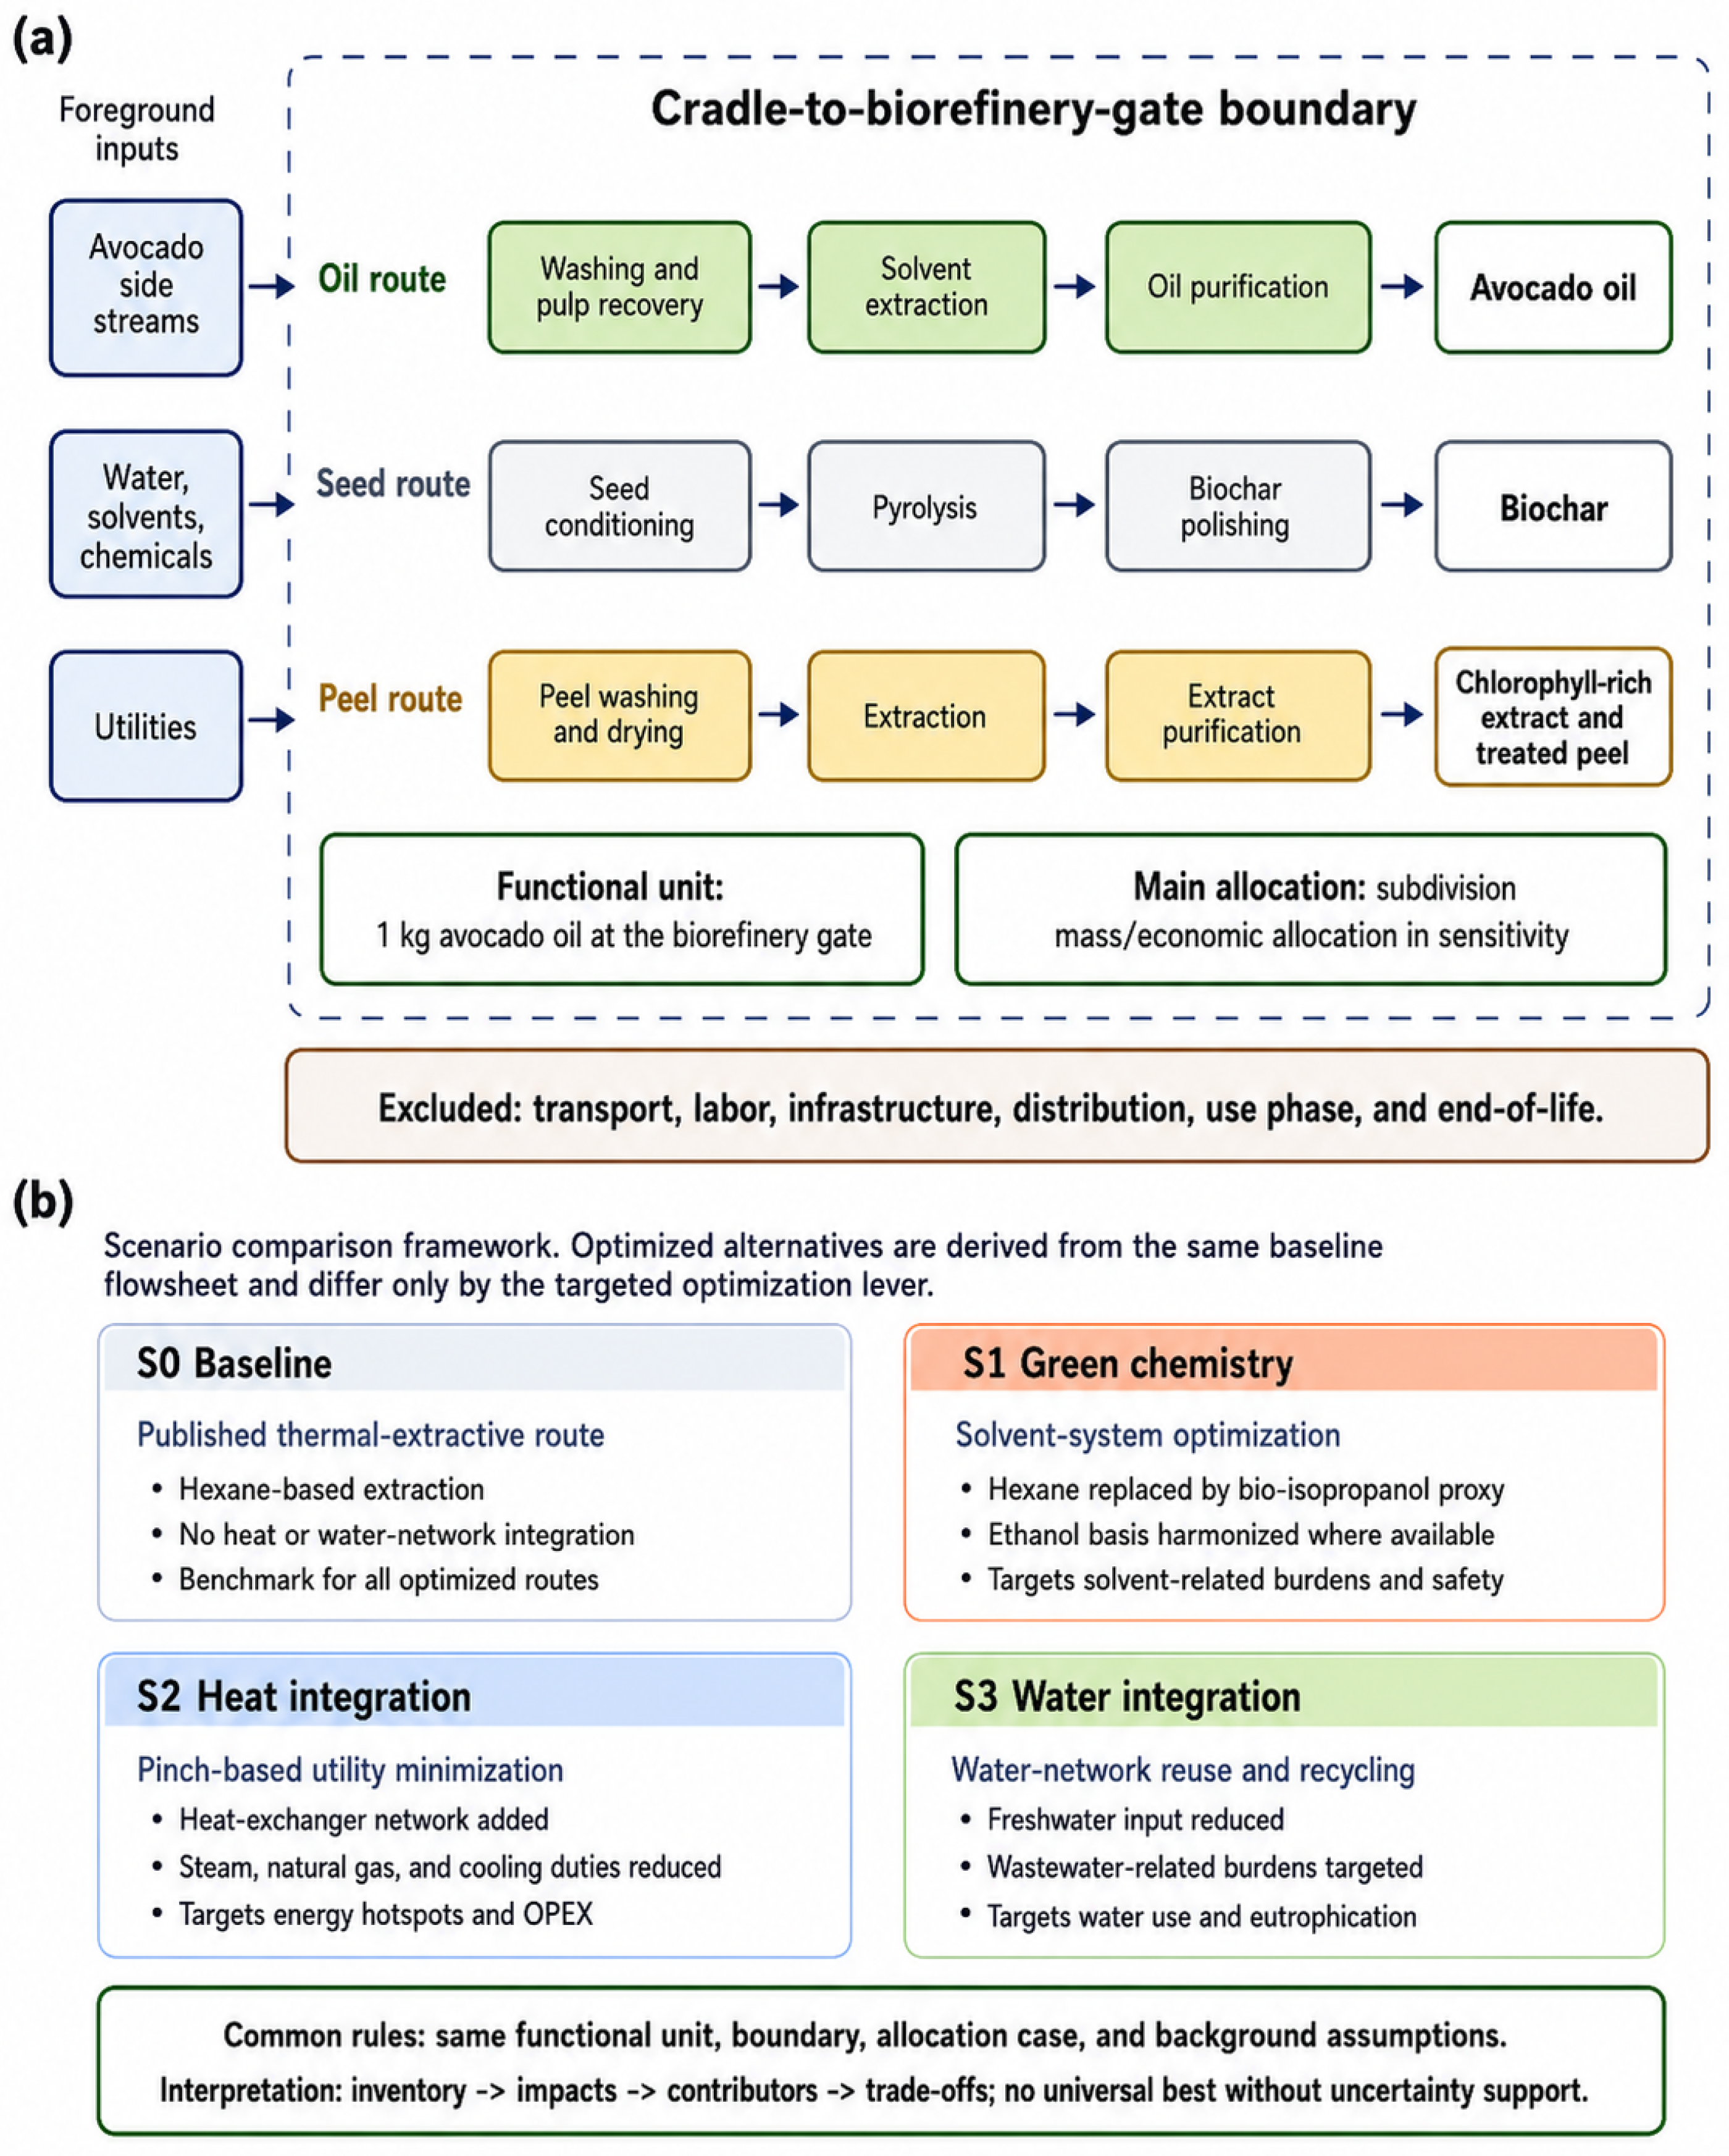
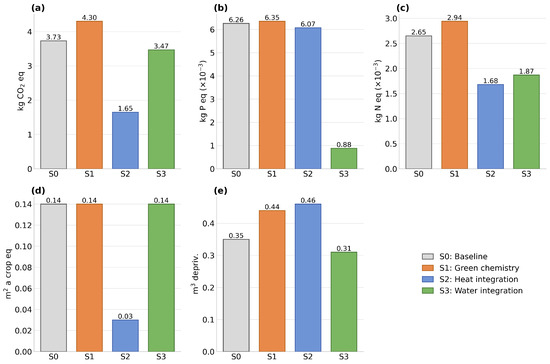
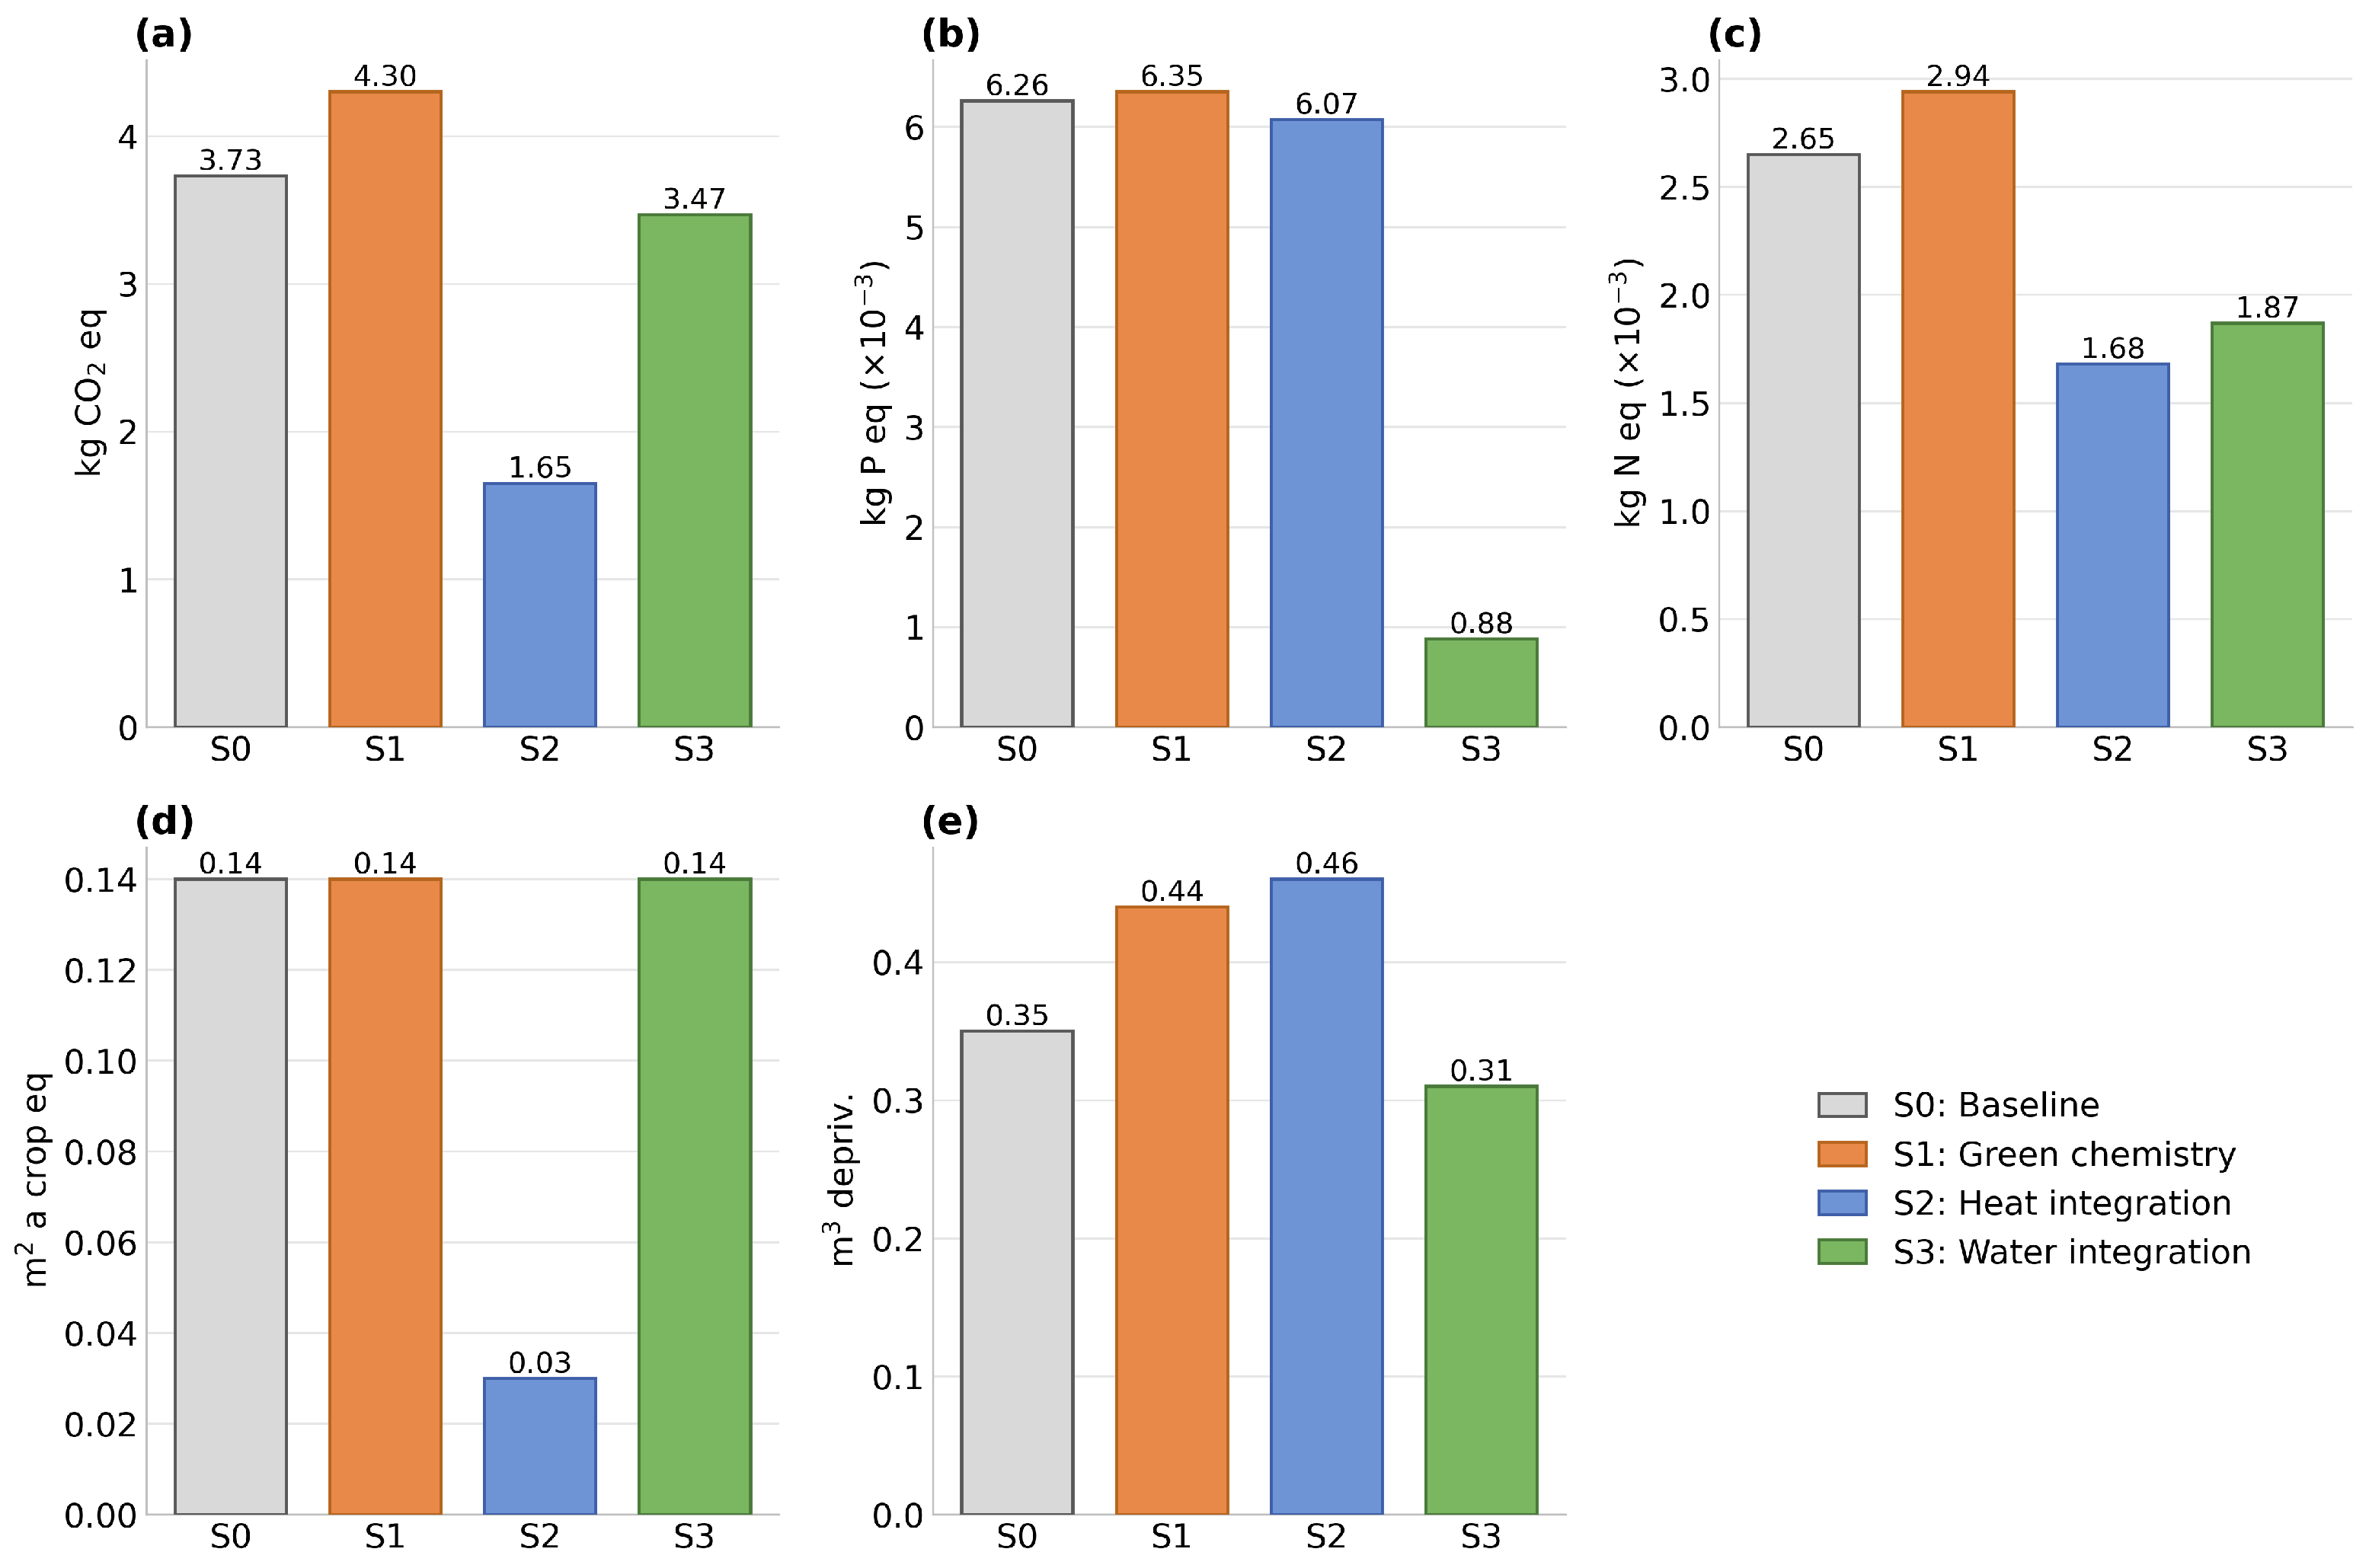
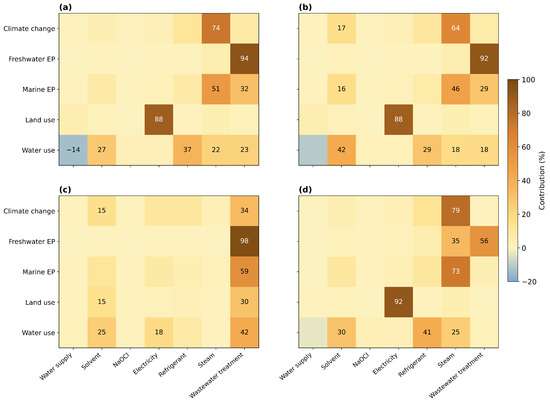
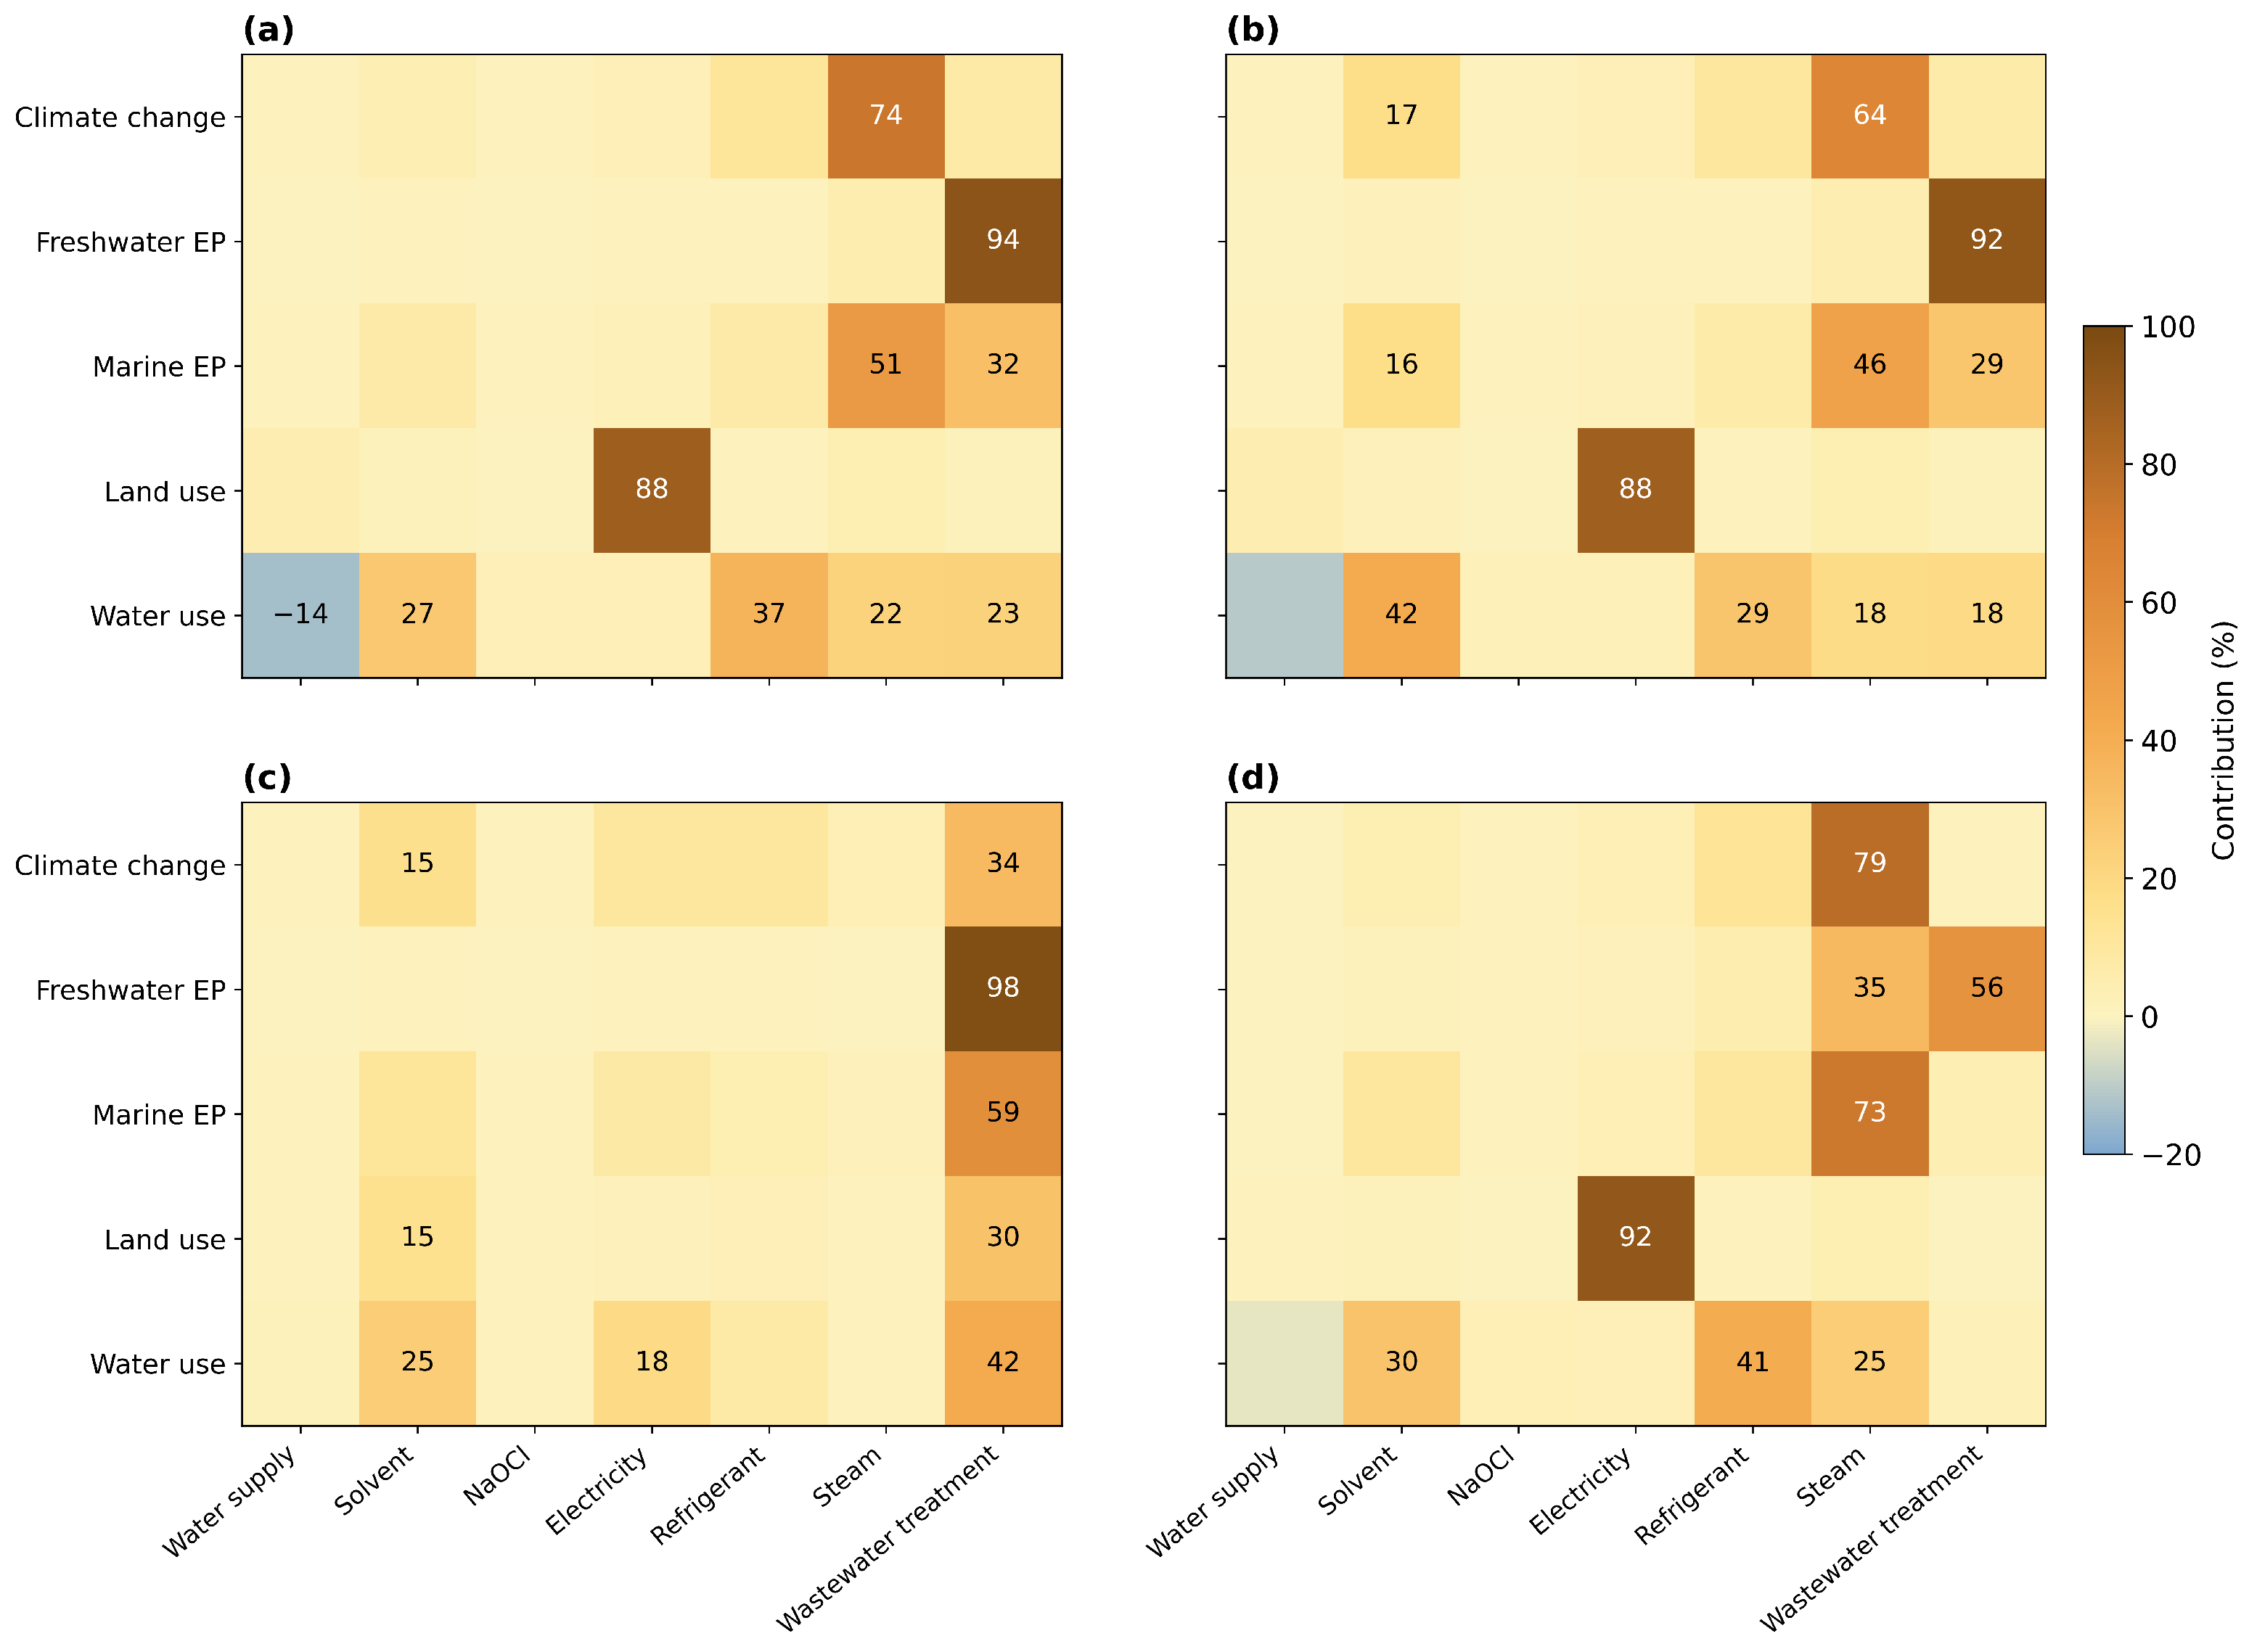
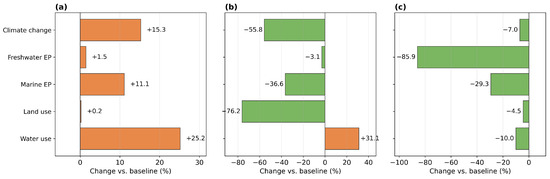
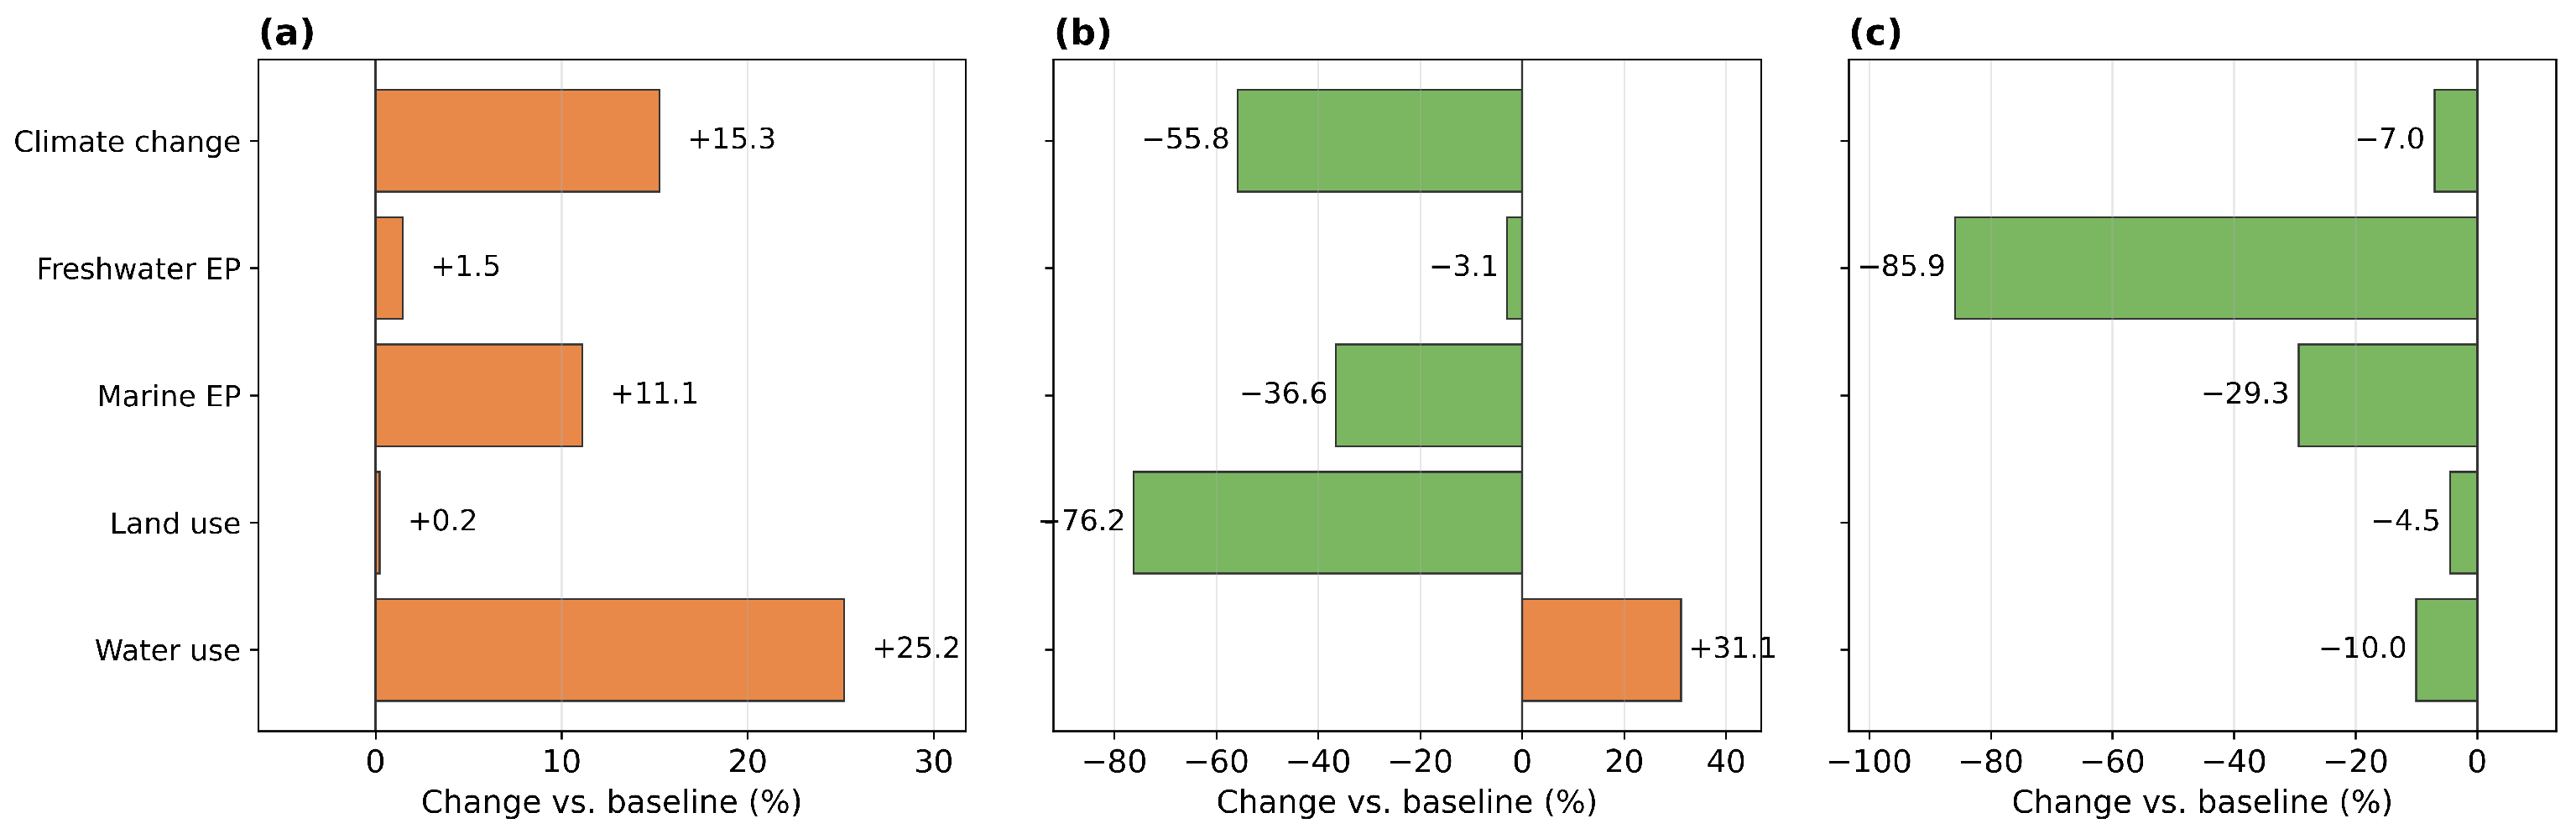
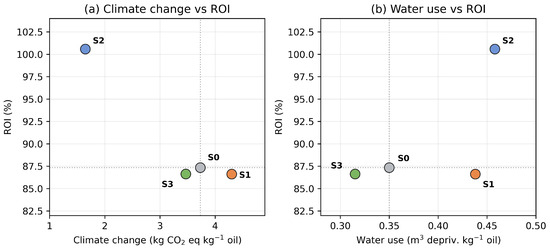
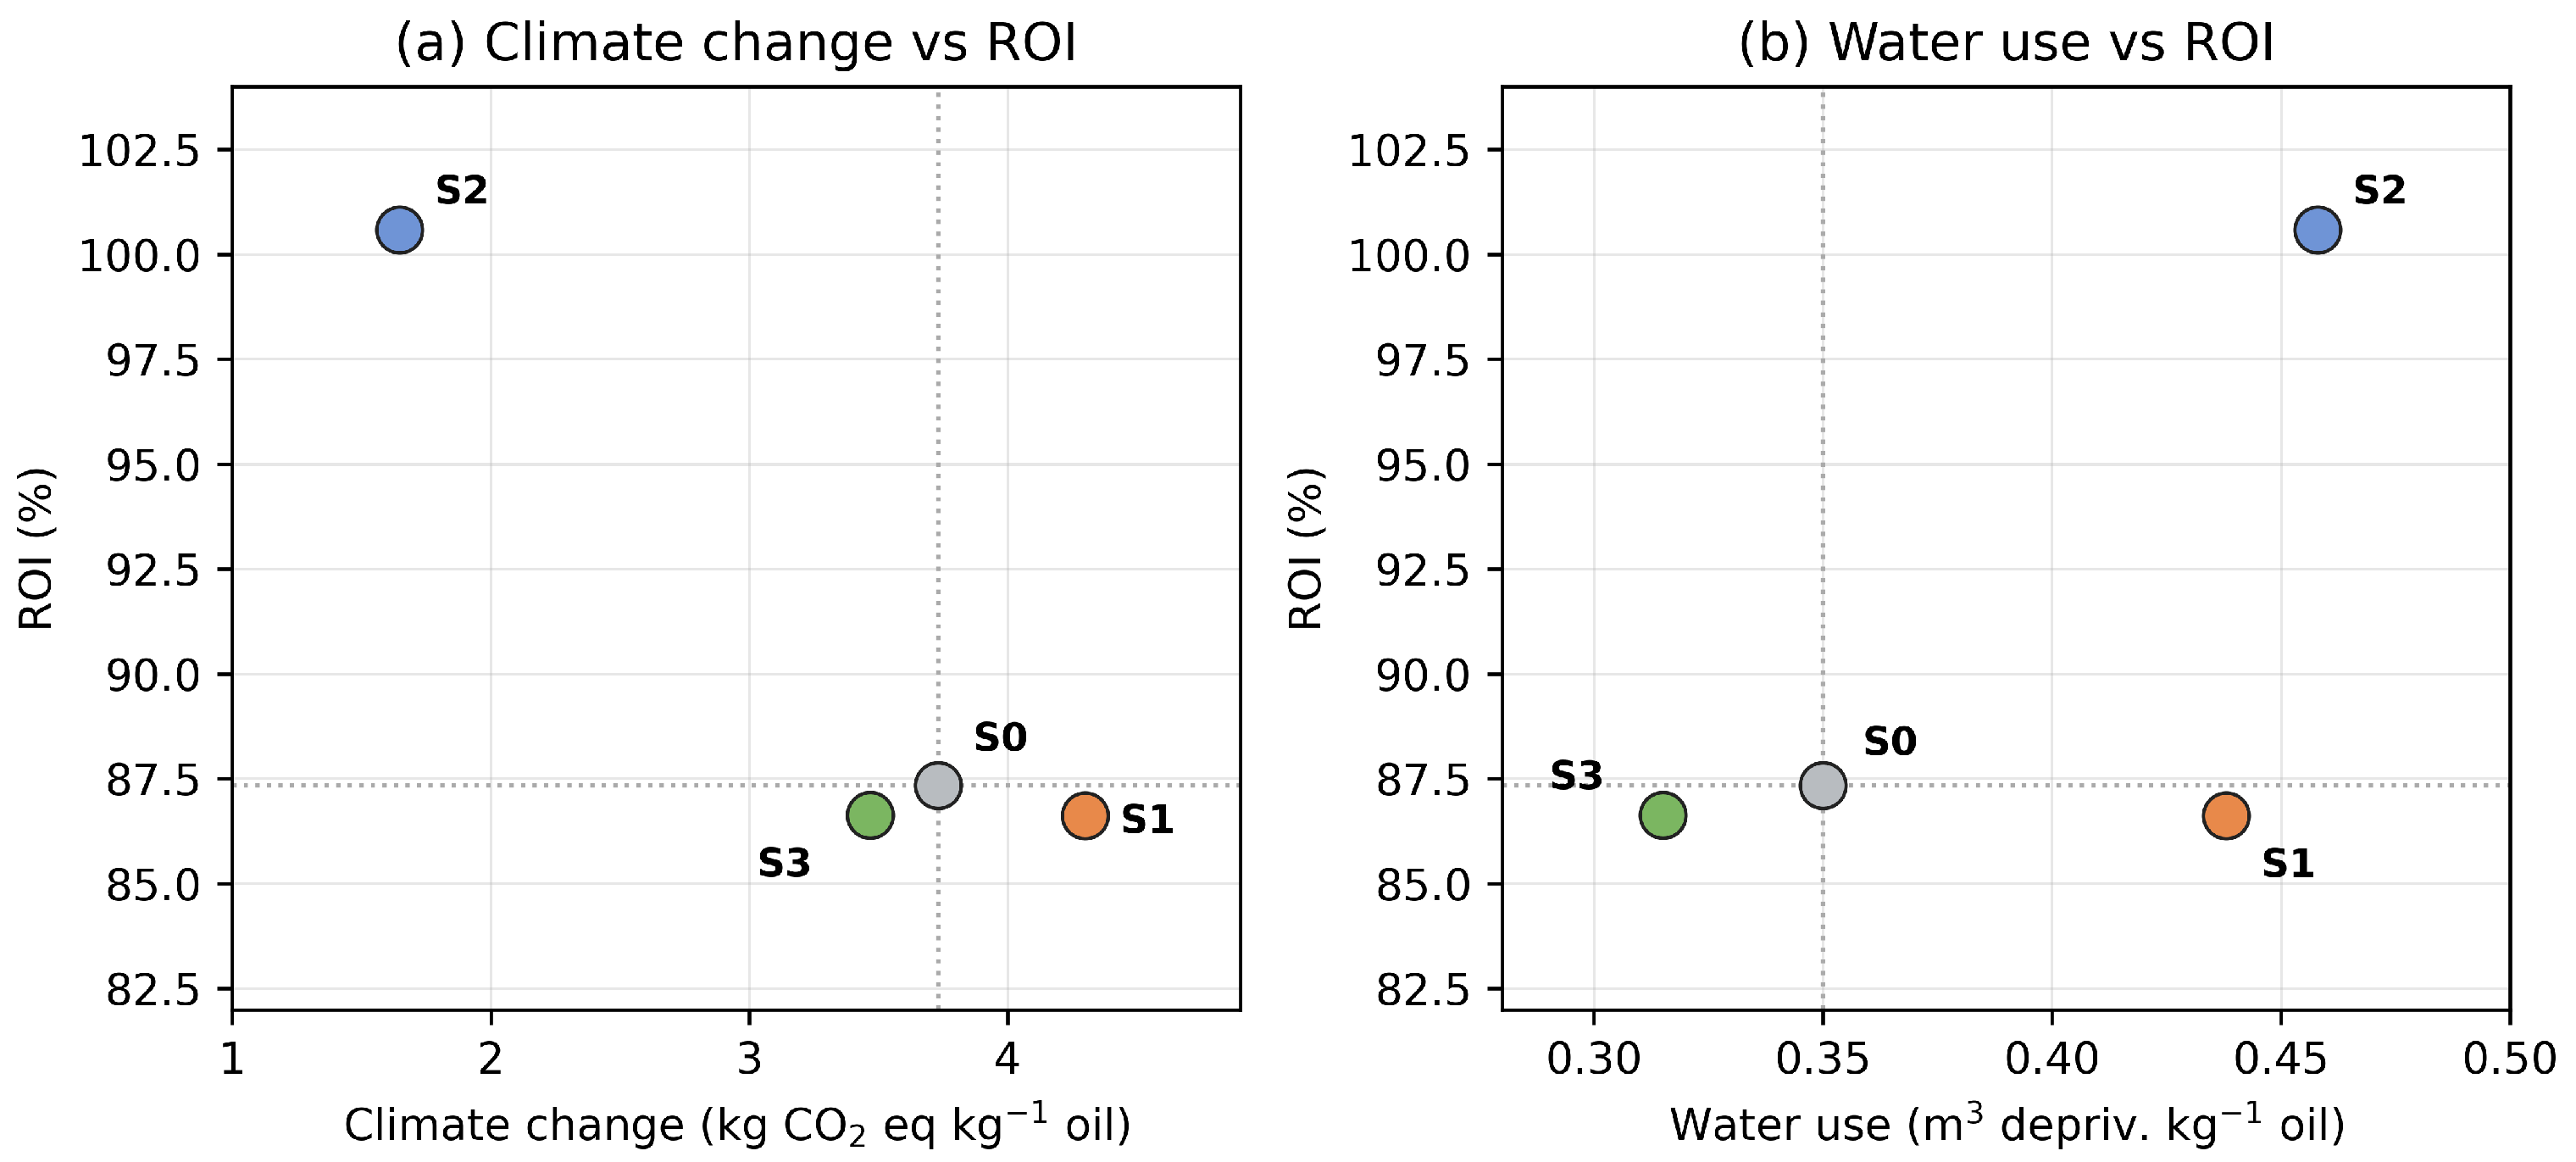
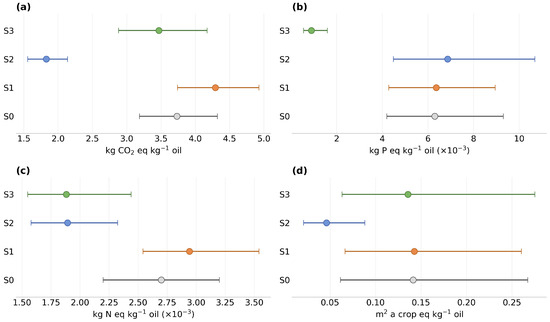
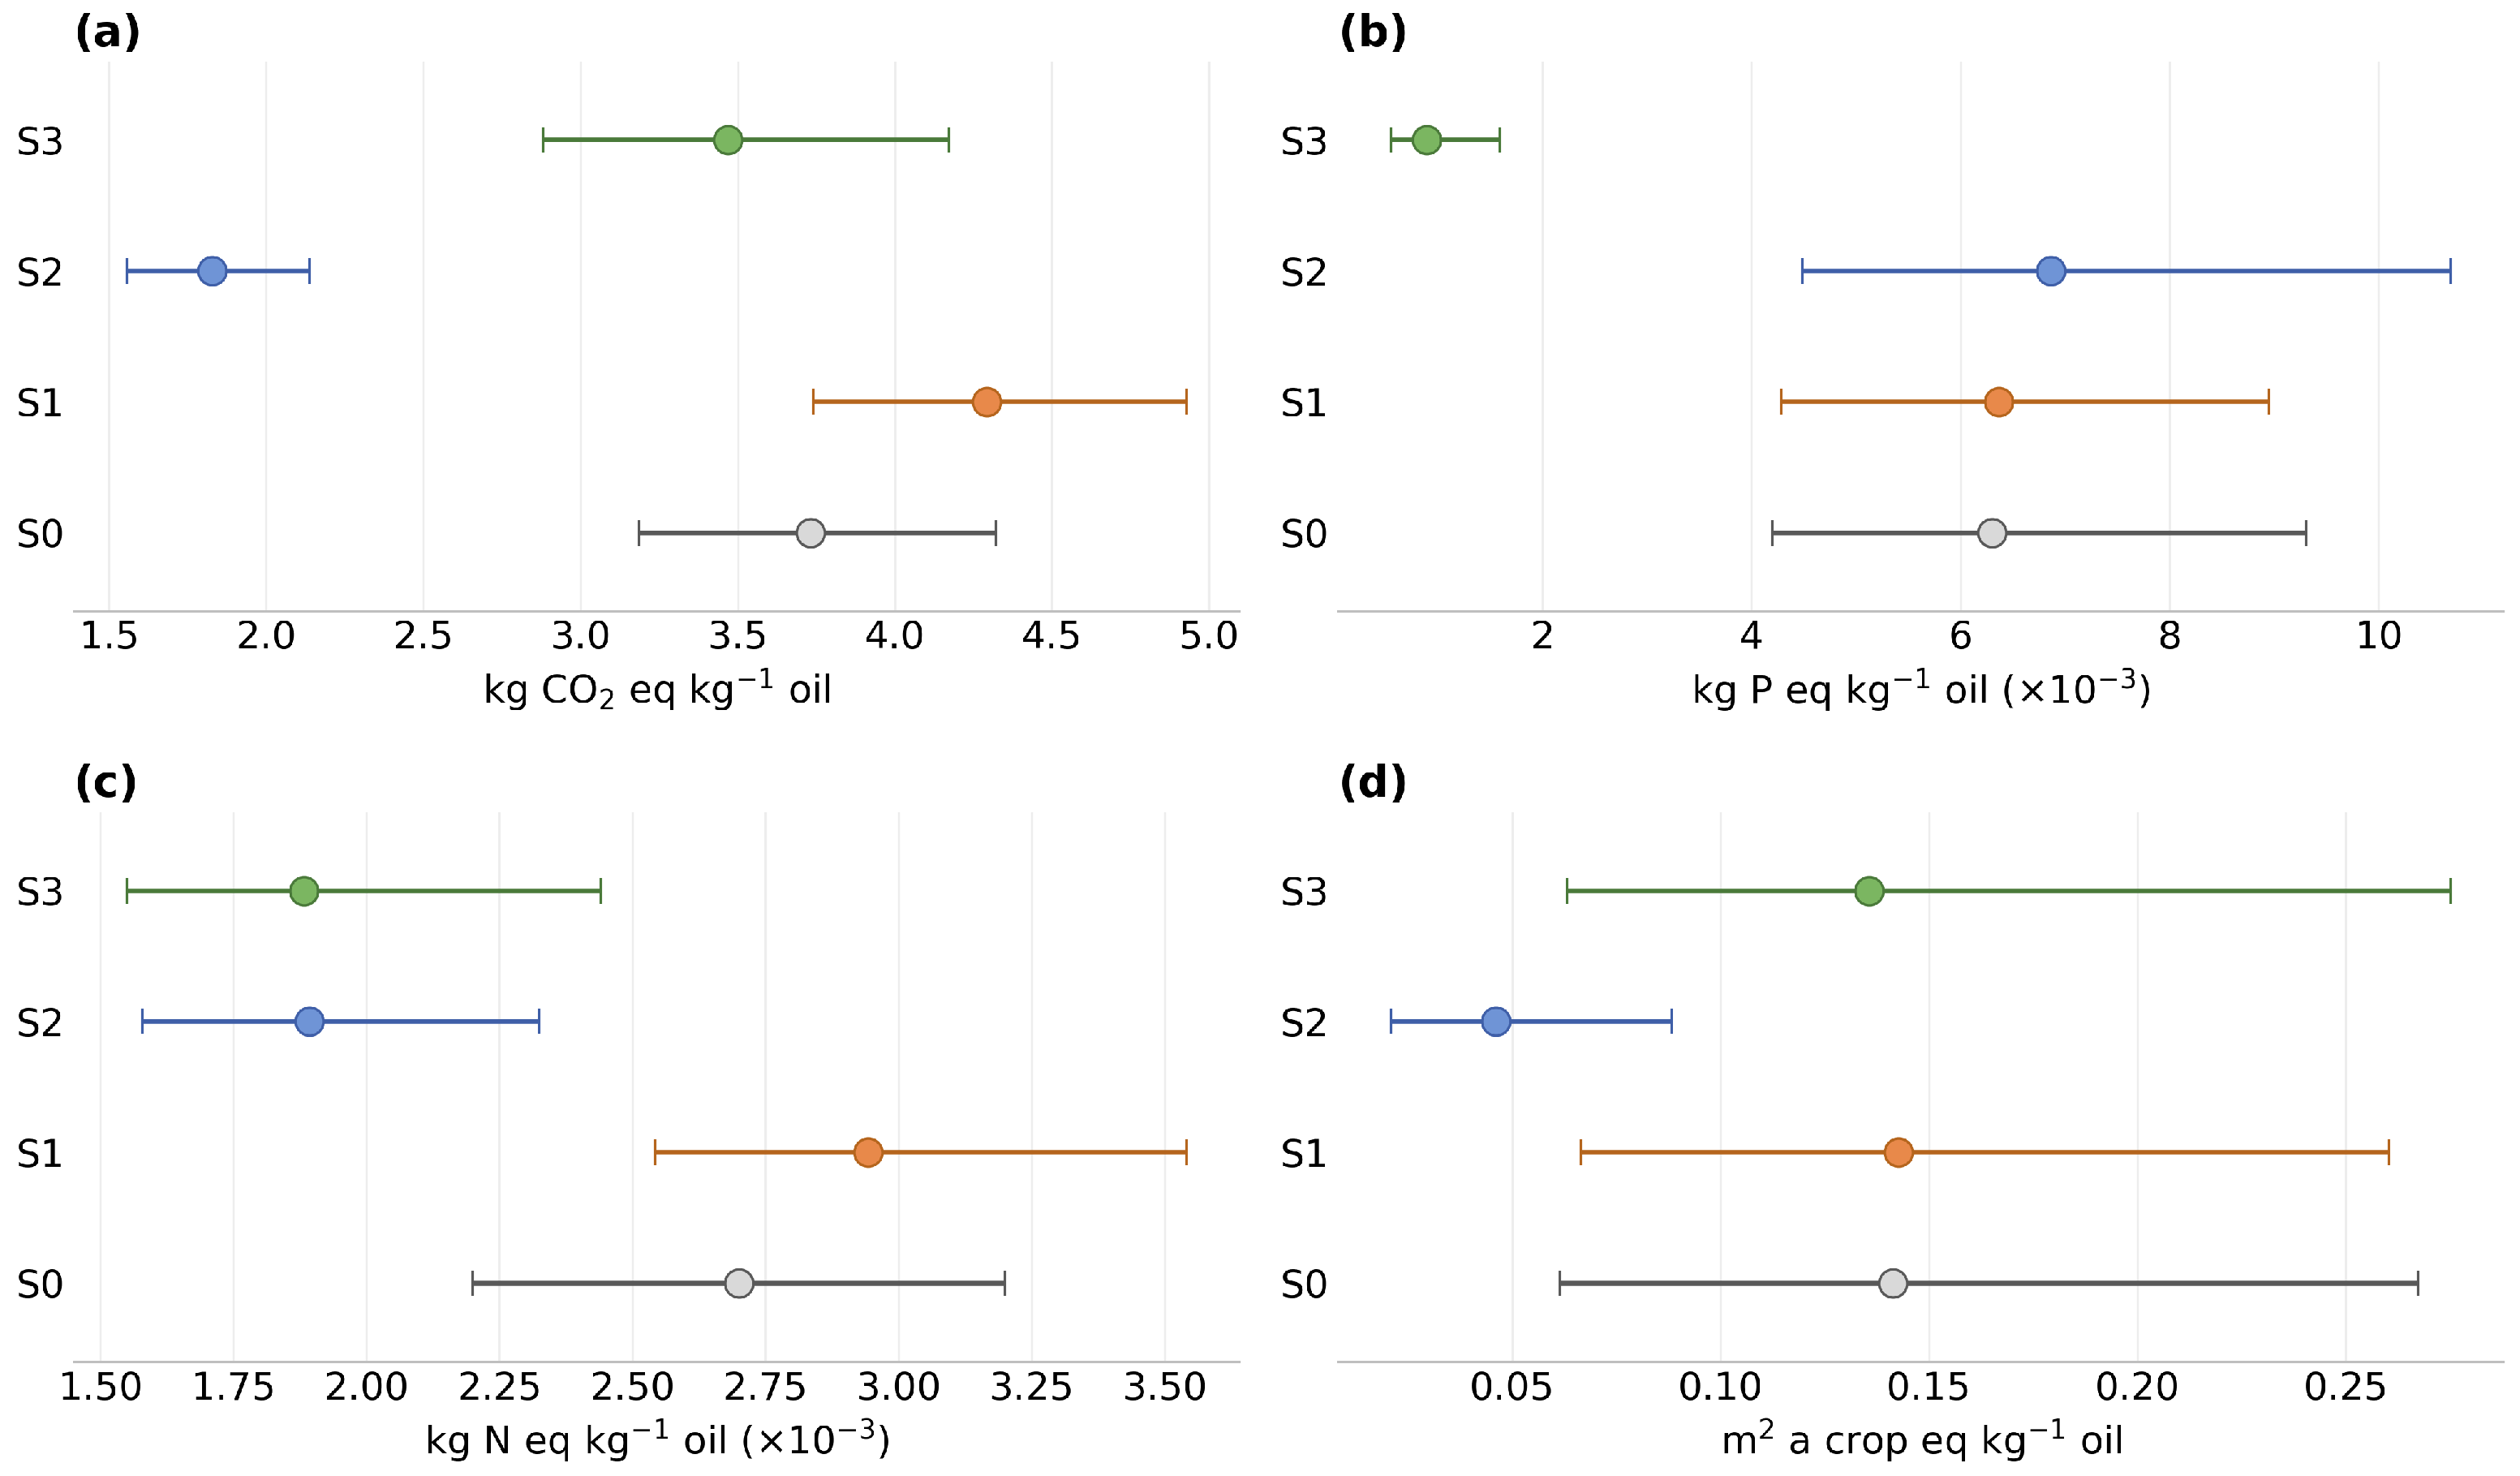
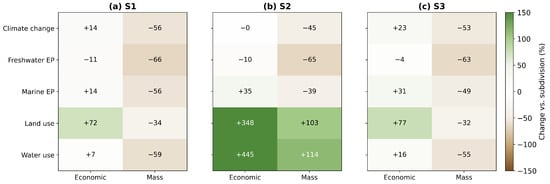
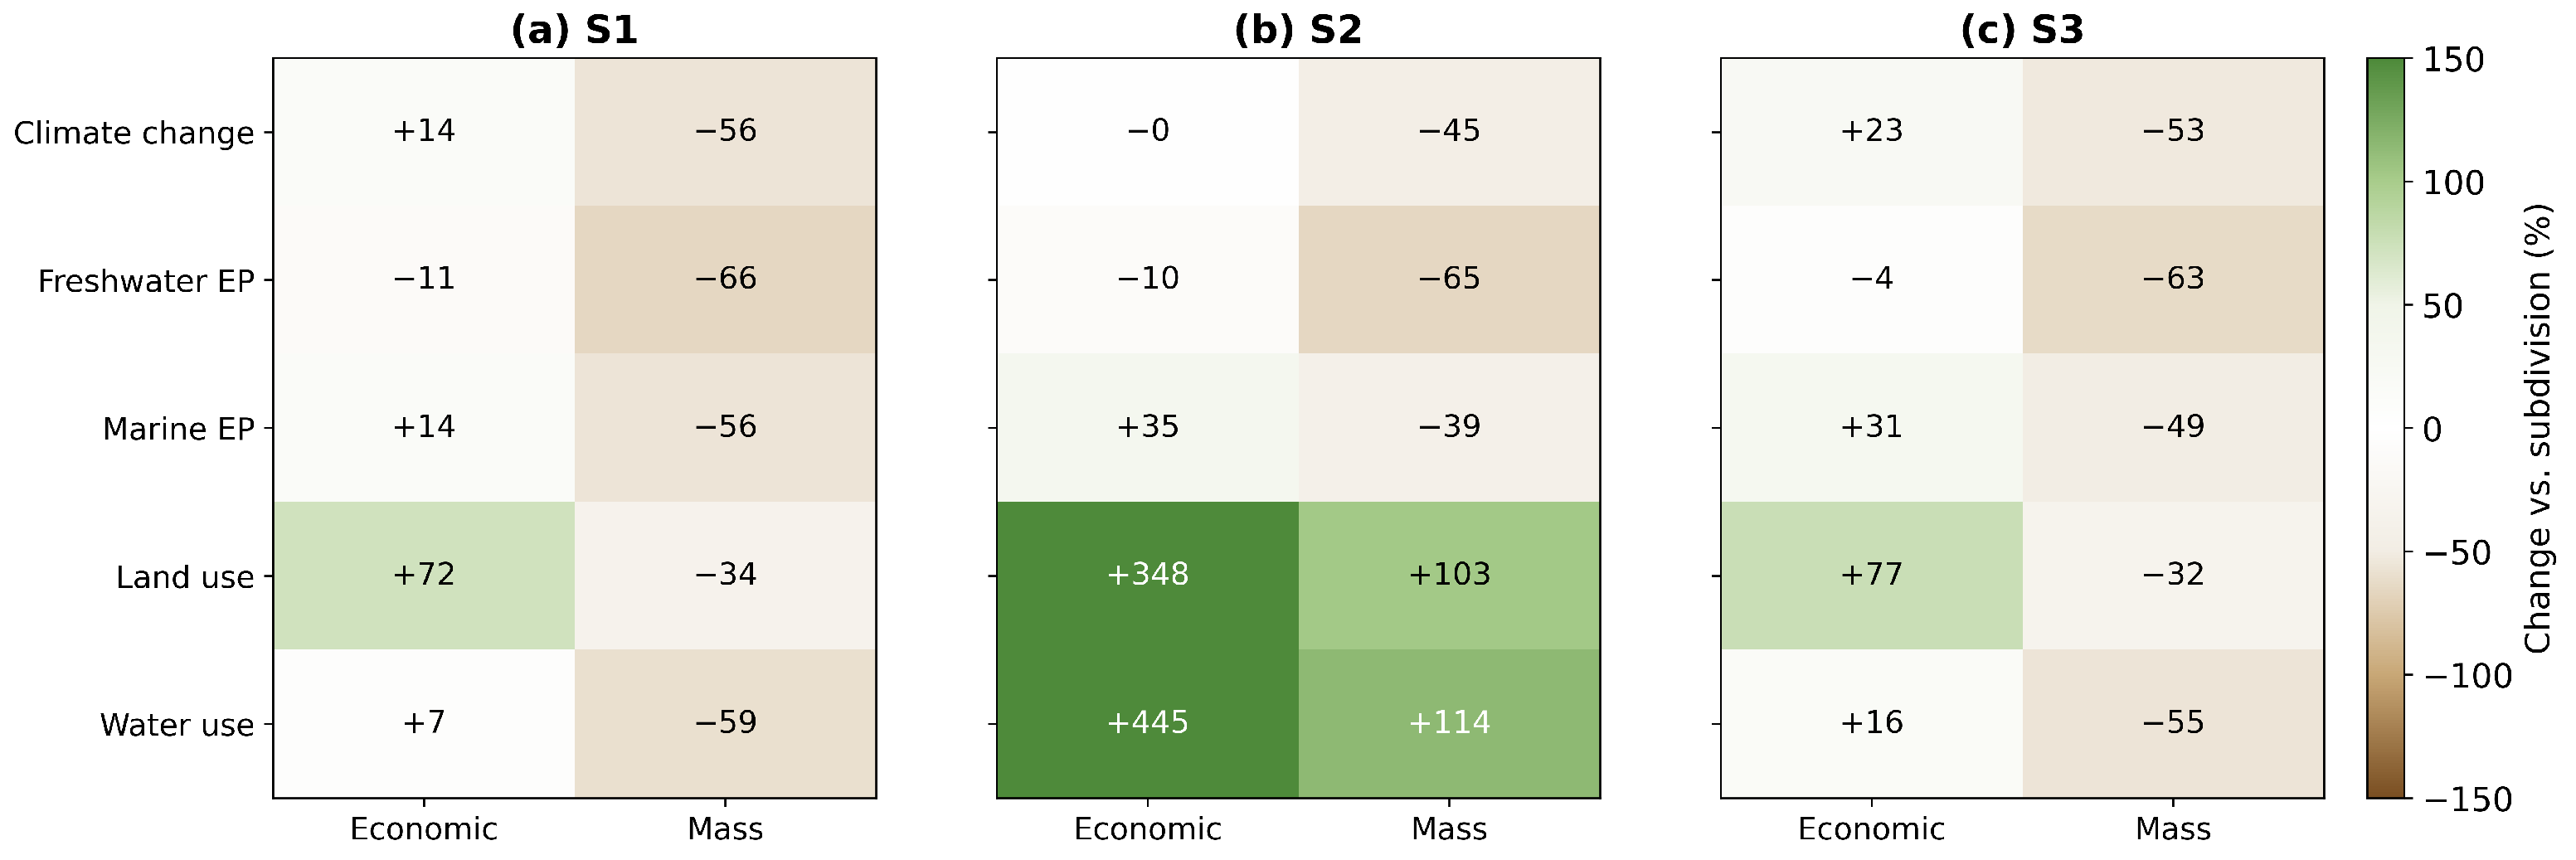

Disclaimer/Publisher’s Note: The statements, opinions and data contained in all publications are solely those of the individual author(s) and contributor(s) and not of MDPI and/or the editor(s). MDPI and/or the editor(s) disclaim responsibility for any injury to people or property resulting from any ideas, methods, instructions or products referred to in the content. |
© 2026 by the authors. Licensee MDPI, Basel, Switzerland. This article is an open access article distributed under the terms and conditions of the Creative Commons Attribution (CC BY) license.