


Abstract
Heavy metal contamination of water poses serious environmental and public health risks due to its persistence, toxicity, and tendency to bioaccumulate. Developing sustainable sorbents capable of removing cadmium under realistic environmental conditions is therefore essential. Hydrochar produced from food waste biomass offers a promising solution, yet the mechanistic relationships among its surface chemistry, mineral composition, and cadmium-binding pathways remain poorly understood. This study investigates hydrochar obtained through controlled hydrothermal carbonization and evaluates its performance in removing Cd2+ from aqueous solutions. Comprehensive characterization using FTIR, SEM–EDS, and XRD was conducted to elucidate functional groups, the porous morphology that facilitates metal binding, and the crystalline phases that influence cadmium sorption. Batch adsorption experiments examined the effects of contact time and initial Cd2+ concentration, while kinetic modeling (pseudo-first-order, pseudo-second-order, and intraparticle diffusion) and isotherm modeling (Langmuir and Freundlich) provided insight into surface complexation, electrostatic interactions, and mineral-assisted binding. Thermodynamic parameters (ΔG°, ΔH°, ΔS°) were evaluated to determine the spontaneity and energetic nature of Cd2+ adsorption. The hydrochar exhibited measurable affinity for cadmium, driven by contributions from hydroxyl, carbonyl, and ether groups, as well as embedded inorganic constituents. Overall, the findings establish structure–function relationships governing cadmium removal and demonstrate hydrochar’s potential as a sustainable material for water treatment and environmental remediation.
1. Introduction
Water pollution remains one of the biggest environmental challenges in the world, caused by increasing industrialization, population growth, and unsustainable waste-management practices [1,2,3]. Aqueous systems are increasingly contaminated with heavy metals, pharmaceutical residues, synthetic dyes, nutrients, and organic micropollutants that persist in the environment and pose severe ecological and human health threats [4,5,6]. Heavy metals such as, Cd, Cr (VI), Cu, Ni, and Pb, are non-biodegradable and bioaccumulate in food chains, leading to neurological, renal, and developmental disorders. Industrial and domestic activities can introduce various contaminants into aquatic environments, including heavy metals [7]. Among these contaminants, cadmium (Cd2+) is of particular concern because of its persistence and potential adverse effects on aquatic ecosystems and human health. Therefore, the development of effective and sustainable materials for Cd2+ removal from contaminated water is of considerable importance. To address these unmet needs, more research is required to better understand the threats posed by emerging contaminants, such as antibiotics, endocrine disruptors, and personal care products, in surface water, groundwater, and drinking water, and to develop novel treatment methods [8,9,10]. Heavy metals are persistent, non-biodegradable pollutants that accumulate in water and biological systems, posing long-term ecological and health risks. Elements such as cadmium, lead, and mercury are especially concerning because even trace concentrations can disrupt essential biochemical processes. Their continuous release from industrial and agricultural activities makes the effective removal of these contaminants from contaminated water a critical environmental priority.
However, traditional water-treatment technologies such as chemical precipitation, ion exchange, membrane filtration, and advanced oxidation processes suffer from several drawbacks, including high operational costs, complex maintenance requirements, the generation of secondary waste, and reduced efficiency at low pollutant concentrations [11]. As a result, there is growing interest in sorbent-based remediation, especially materials derived from renewable resources that offer low cost, environmental compatibility, and a multifunctional sorption mechanism for binding pollutants [6,12,13,14].
The water pollution emergency goes hand in hand with the global food waste problem. Households, markets, restaurants, and agricultural processing generate millions of tons of food waste each year [15]. Improper disposal of food waste contributes to greenhouse gas (GHG) emissions, odor problems, leachate formation, and land-use pressure [16,17]. The chemical value in food waste cannot be fully recovered through conventional management methods such as landfilling, composting, and anaerobic digestion. Hence, converting food waste into functional materials is a promising approach to advancing the circular economy, resource recovery, and environmental protection [18,19].
Hydrothermal carbonization (HTC) has emerged as an efficient thermochemical process for converting wet food waste into a carbon-rich solid with tunable physicochemical properties [20,21]. In contrast to pyrolysis, HTC occurs in water at moderate temperatures (160–260 °C), eliminating the need for energy-intensive drying. The resulting hydrochar is often rich in oxygen-containing functional groups (-OH, -COOH, and -C=O), porous microstructures, and embedded mineral phases originating from the feedstock. These features allow multiple sorption mechanisms, including electrostatic attraction, surface complexation, ion exchange, π–π interactions, hydrogen bonding, and mineral-assisted binding [22,23]. The versatility of hydrochar, its low production cost, and its ability to utilize waste biomass make it an attractive option for sustainable water treatment applications [24,25].
Although there has been growing interest, the mechanistic understanding of hydrochar’s pollutant-removal behavior remains incomplete [26,27]. Numerous studies have reported adsorption capacities without providing a comprehensive explanation of how specific functional groups, mineral phases, surface charge, and/or microstructural features contribute to sorption pathways [28,29,30,31]. Although minerals such as Ca, Fe, K, Mg, Mn, and Si can influence the binding mechanisms of metals, anions, and dyes, interactions between the organic matrix and the inorganic constituents of hydrochar are often overlooked. In addition, there remains a limited understanding of the relationships between hydrochar structure, HTC conditions, and pollutant removal efficiency. Addressing these gaps is vital to optimizing hydrochar design and advancing its application in environmental remediation [32,33].
This study investigates hydrochar derived from food waste and evaluates its performance in removing cadmium from polluted water. It focuses on characterizing hydrochar’s functional groups, mineral phases, and surface properties; identifying dominant sorption pathways through kinetic and isotherm modeling; and establishing mechanistic relationships that explain hydrochar’s environmental performance. By connecting structure to function, this study provides insights needed to improve hydrochar design and promote its use as a sustainable, circular economy material for water treatment.
2. Materials and Methods
The cadmium nitrate tetrahydrate (Cd (NO3)2·4H2O) used in this study was of analytical grade (Sigma-Aldrich, St. Louis, MO, USA) and was dissolved in deionized water to produce a 1000 mg/L cadmium (II) stock solution, which was then diluted to the desired concentrations.
2.1. Feedstock, Hydrochar Production, and Selection of HTC Conditions
Food waste biomass was collected from the Florida A&M University (FAMU) Student Food Pantry and consisted of discarded fruits, vegetables, bread, and cooked starch-based products. All materials were hand-sorted to remove packaging and non-biogenic contaminants, washed with deionized water, and milled prior to hydrothermal carbonization (HTC) to facilitate handling and processing. The diverse composition of food waste provides a representative mixture of lignocellulosic and nutrient-rich materials, and its inherent mineral content corresponds to the ash phases later observed in the hydrochar [27,34].
HTC conditions were initially explored using a design of experiments (DoE) approach, covering temperatures of 180–250 °C and residence times of 2–5 h. To develop a clear mechanistic understanding while maintaining a focused experimental scope, three representative HTC temperatures—180, 215, and 250 °C—were selected at a constant residence time of 2 h. This selection isolates the influence of HTC severity on hydrochar structure and cadmium adsorption while avoiding confounding effects from simultaneous variations in temperature and time. The chosen temperatures correspond to low, intermediate, and high HTC severity, enabling systematic evaluation of how functional groups, mineral phases, surface charge, and thermal stability evolve across the carbonization spectrum.
Hydrothermal carbonization (HTC) was performed in a sealed LABXSCI 100 mL PTFE-lined stainless steel hydrothermal synthesis reactor at controlled temperatures of 180, 215, and 250 °C with a residence time of 2 h. After cooling, the solid hydrochar was separated, washed with deionized water to remove soluble residues, oven-dried at 105 °C for 6 h, and sieved to obtain a uniform particle size for characterization and adsorption experiments [21,35].
2.2. Physicochemical Characterization
2.2.1. Fourier Transform Infrared Spectroscopy (FTIR)
A JASCO FT/IR-6800 spectrometer (JASCO Corporation, Tokyo, Japan) was used to identify surface functional groups responsible for sorption. Spectra were recorded in the range 4000–400 cm−1, and characteristic peaks were assigned to hydroxyl, carbonyl, carboxyl, aromatic, and ether groups [35,36].
2.2.2. X-Ray Diffraction (XRD)
A powder X-ray diffractometer (Panalytical Xpert Pro MPD, copper or molybdenum light source, X’Celerator RTMS detectors), Malvern Panalytical/PANalytical (Netherlands/UK) was used to determine crystalline mineral phases present in the hydrochar. Diffractograms were collected using Cu-Kα radiation, and peaks were matched with standard reference patterns to identify silica, carbonates, oxides, and other mineral constituents [27].
2.2.3. Scanning Electron Microscopy with Energy-Dispersive Spectroscopy (SEM–EDS)
SEM imaging was performed using the JOEL JSM-IT800 SEM-EDS (JEOL Ltd., Tokyo, Japan), at an acceleration voltage of 2–10 kV and an EDAX detector using a microscope with an energy dispersive analytical system to examine surface morphology, porosity, and particle structure [37,38]. EDS analysis provided elemental composition, highlighting inorganic constituents [39,40].
2.3. Batch Adsorption Experiments
Adsorption experiments were performed in batch mode to evaluate hydrochar performance under varying conditions [41]. An amount of 0.05 g of hydrochar was added to 10 mL of pollutant solutions (Cd2+) of defined concentration (5–50 mg/L), which were then agitated at a constant temperature using a shaker at 70 rpm. The effects of pH, contact time, and initial concentration were investigated. After equilibrium, samples were filtered, and residual pollutant concentrations were measured using appropriate analytical methods. Adsorption capacity (qe) and removal efficiency (%) were calculated [35,42].
2.4. Kinetic Modeling
Kinetic behavior was analyzed using the pseudo-first-order (PFO) and pseudo-second-order (PSO) models. Model parameters (k1, k2, qe, calc) were obtained from linearized plots, and goodness of fit (R2) was used to determine the dominant sorption mechanism. The intraparticle diffusion model was also applied to assess the contributions of diffusion [27,43].
2.4.1. Pseudo-First-Order (Lagergren)
The pseudo-first-order model was first postulated by Lagergren, which states that the rate of adsorption of molecules at adsorption sites is proportional to the number of unoccupied adsorption sites and is expressed as [44]:
where and (mg/g) are the adsorption capacities at equilibrium and at time , respectively, and (min−1) is the pseudo-first-order rate constant.
2.4.2. Pseudo-Second-Order
The pseudo-second-order model assumes that chemisorption is the rate-limiting step and is given by [45,46]:
= PSO rate constant (g mg−1 min−1)
2.4.3. Intraparticle Diffusion
2.5. Isotherm Modeling
Equilibrium data were fitted to the Langmuir and the Freundlich isotherm models. Langmuir parameters (qₘ, KL) were used to evaluate monolayer adsorption, while Freundlich constants (KF, n) described surface heterogeneity [27,47].
Langmuir linear form:
Freundlich linear form:
2.6. Thermodynamic Analysis
Thermodynamic parameters were determined from temperature-dependent adsorption experiments. The equilibrium constant (Kc) was used to calculate Gibbs free energy (ΔG°), enthalpy (ΔH°), and entropy (ΔS°) using the van ’t Hoff equation. These parameters were interpreted to determine spontaneity, energetic nature, and interfacial disorder associated with the adsorption process [48,49]. Batch equilibrium tests were conducted at 25, 35, and 45 °C using a thermostatic VWR water bath. The initial solution pH was maintained at 6.0 ± 0.1 using dilute HNO3 or NaOH to ensure a consistent nitrate background electrolyte. Cadmium (II) solutions were prepared from Cd(NO3)2·4H2O, selected for its complete aqueous solubility and stable Cd2+ speciation across the tested temperature range.
For each temperature, 10 mL centrifuge tubes containing 0.05 g of hydrochar and a 5–50 mg/L initial Cd2+ concentration were placed in a beaker filled with water and submerged in the bath to ensure uniform thermal equilibration. The bath temperature was monitored at the beginning and end of each run and remained stable within ±0.5 °C. Samples were equilibrated for the predetermined contact time, removed, filtered, and analyzed for residual Cd2+ concentration using MP-AES.
The equilibrium adsorption capacity (mg g−1) was calculated using:
where and (mg L−1) are the initial and equilibrium Cd2+ concentrations, (L) is the solution volume, and (g) is the mass of adsorbent.
The equilibrium distribution coefficient was defined as:
The standard Gibbs free energy change was calculated from:
where is the universal gas constant (8.314 J mol−1 K−1) and (K) is the absolute temperature.
The enthalpy and entropy changes were obtained from the linearized van ’t Hoff equation:
A plot of versus was constructed, and ΔH° and ΔS° were determined from the slope and intercept, respectively. All thermodynamic parameters were interpreted to assess the spontaneity, heat effects, and changes in disorder associated with Cd2+ adsorption onto the hydrochar surface.
3. Results
3.1. FTIR Analysis
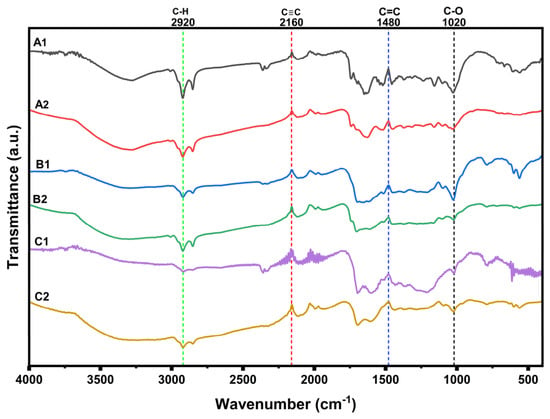
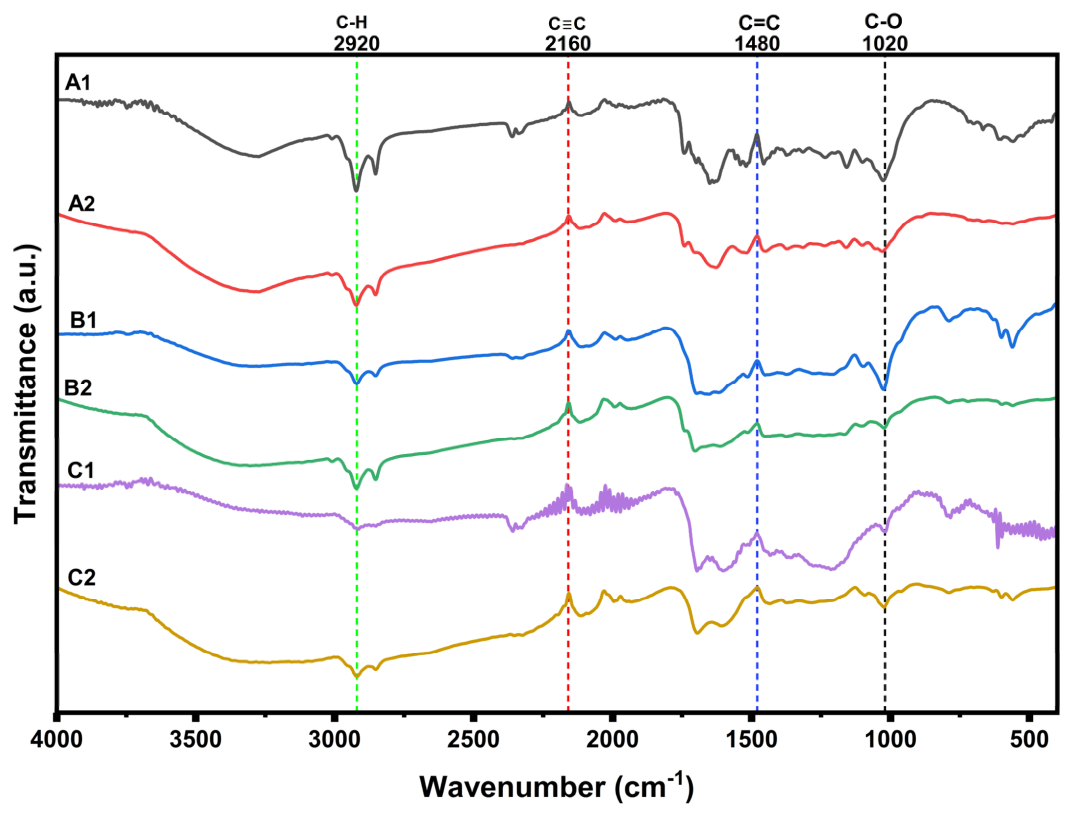
Figure 1 shows the FTIR spectra of hydrochar produced at 180 °C, 215 °C, and 250 °C for 2 h before and after Cd2+ adsorption. All samples exhibited characteristic bands associated with oxygen-containing functional groups and mineral phases originating from the food waste feedstock [50,51].
Figure 1.
Fourier-transform infrared (FTIR) spectra analysis for before and after Cd (II) adsorption. Note: A1 = 180 °C for 2 h, pristine; B1 = 215 °C for 2 h, pristine; C1 = 250 °C for 2 h, pristine; A2 = 180 °C for 2 h, after adsorption; B2 = 215 °C for 2 h, after adsorption; C2 = 250 °C for 2 h, after adsorption.
A broad band near 2920 cm−1 was observed across all hydrochars and corresponds to aliphatic C–H stretching vibrations. This band decreased in intensity as HTC temperature increased, indicating progressive dehydration and aromatization at higher severity. The reduction was most pronounced in the samples carbonized at 250 °C for 2 h, consistent with greater carbonization and loss of labile organic structures [27].
A distinct feature around 2160 cm−1 appeared in all samples and is attributed to C≡C or C=N stretching in conjugated or partially carbonized structures. Its presence suggests the formation of unsaturated carbon domains during HTC. The intensity of this band increased slightly with temperature, reflecting enhanced structural condensation [52].
The region near 1480 cm−1 corresponds to aromatic C=C stretching and asymmetric bending of CH2/CH3 groups. This band became more prominent in samples 180 and 250 °C, indicating increased aromaticity and structural ordering at high hydrothermal carbonization severity. The evolution of this peak aligns with the expected transition from polysaccharide-rich biomass toward more graphitic carbon domains [53,54].
A strong band at 1020 cm−1 was observed in all hydrochars and is associated with C-O stretching in alcohols, phenols, and carboxylates, as well as Si-O vibrations from mineral phases [55,56]. This band is particularly important for cadmium binding because C-O and Si-O groups participate in surface complexation and mineral-assisted sorption. After Cd2+ adsorption, a noticeable decrease in intensity and slight peak shifting occurred in this region for all samples, indicating direct interaction between Cd2+ and oxygen-rich functional groups [57,58].
Comparing spectra before and after adsorption reveals consistent changes across all three hydrochar. The samples produced at 180, 215, and 250 °C showed reductions in transmittance at 1020 cm−1 and 1480 cm−1, suggesting involvement of C-O, C-O-C, and aromatic C=C groups in Cd2+ binding. Minor shifts in the 2920 cm−1 band after adsorption further support the participation of aliphatic structures in surface complexation. The magnitude of these changes was greatest in sample 180 °C, reflecting its higher abundance of reactive oxygen-containing groups relative to the more carbonized samples at 215 and 250 °C.
Overall, the FTIR results demonstrate that the severity of hydrothermal carbonization strongly influences the abundance and reactivity of functional groups relevant to cadmium adsorption [59,60]. Lower-temperature hydrochar retains more hydroxyl, carbonyl, and ether groups, enabling stronger surface complexation, whereas higher-temperature hydrochar exhibits increased aromaticity and mineral-dominated sorption pathways [35,61]. These observations provide a mechanistic foundation for interpreting the adsorption, kinetic, and isotherm behavior discussed in subsequent sections.
3.2. XRD Analysis
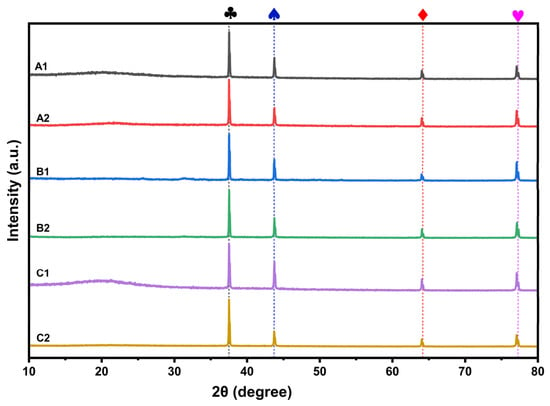
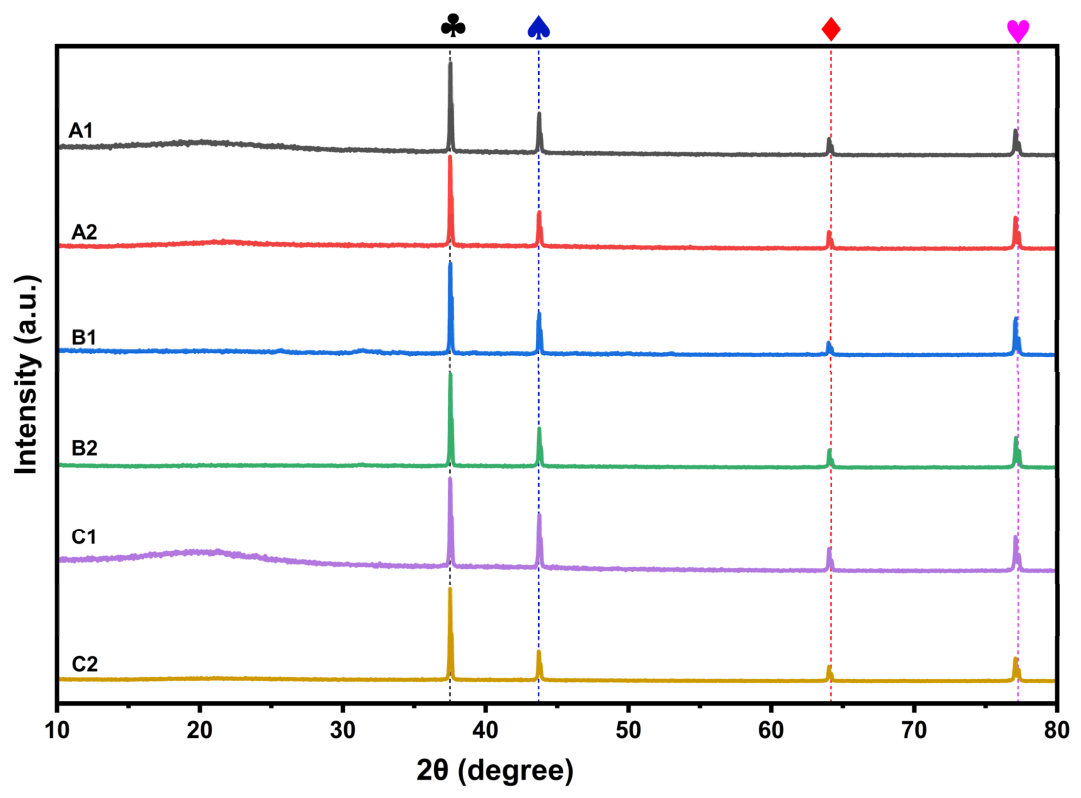
The XRD patterns of hydrochar produced at 180 (A1 and A2), 215 (B1 and B2), and 250 °C (C1 and C2) before and after Cd2+ adsorption are shown in Figure 2. All samples exhibited broad, low-intensity features characteristic of amorphous carbon, along with distinct crystalline peaks originating from mineral phases naturally present in the food waste feedstock. These mineral phases play an important role in cadmium binding via ion exchange, surface complexation, and precipitation.
Figure 2.
XRD spectra of pristine hydrochar and hydrochar after Cd2+ adsorption.
Across all samples, four prominent diffraction peaks were observed at approximately 2θ ≈ 26°, 32°, 36°, and 47°, marked in the figure by the symbols ♣, ♠, ♦, and ♥. These peaks correspond to common inorganic constituents in hydrochar:
♣ ~26°: Quartz (SiO2, JCPDS 46-1045) [62,63];
♠ ~32°: Calcite (CaCO3, JCPDS 05-0586) or related Ca-bearing phases [62,63];
♦ ~36°: Periclase/MgO or mixed Mg-Ca mineral phases [64];
♥ ~47°: Silicate or aluminosilicate structures (Si–O–Al frameworks) [63].
These minerals originate from the ash fraction of food waste and remain stable during carbonization. Their presence is consistent with the FTIR fingerprint region, which showed strong Si–O and metal–O vibrations.
3.2.1. Effect of Hydrothermal [HTC] Severity
The XRD patterns clearly reflect the influence of hydrothermal carbonization on the structural evolution of the hydrochar (Figure 2). Hydrochar produced at 180 °C (A1 and A2) displayed the highest background intensity and the least pronounced crystalline peaks, indicating a larger proportion of amorphous organic matter. As the HTC temperature increased to 215 °C (B1 and B2) and 250 °C (C1 and C2), the crystalline peaks became sharper and more defined. This trend reflects progressive carbonization and increased exposure of mineral phases as organic components decompose [65,66].
The samples at 250 °C exhibited the most distinct mineral peaks, confirming that higher HTC severity enhances the visibility and relative abundance of inorganic constituents. This observation aligns with FTIR results showing reduced organic functional groups and increased mineral-dominated sorption behavior at higher temperatures.
3.2.2. Changes After Cd2+ Adsorption
In Figure 2, comparing before- and after-adsorption spectra A1 vs. A2, B1 vs. B2, and C1 vs. C2 reveals subtle but consistent changes: a light increase in peak intensity at ~32° and ~36°, and minor peak broadening in the 26° quartz region with small shifts in the 47° silicate peak. These changes suggest interaction between Cd2+ and mineral phases through ion exchange with Ca2+, Mg2+, or K+; surface complexation on silicate and aluminosilicate sites; and the formation of Cd-associated mineral complexes (e.g., CdCO3 or Cd-silicate species).
The most noticeable changes occurred in samples A2 (180 °C), indicating stronger mineral–organic synergy at lower HTC severity. In contrast, the C2 samples (250 °C) showed smaller shifts, consistent with their more carbonized structure and mineral-dominated sorption pathways.
3.2.3. Mechanistic Interpretations
The XRD results confirm that food waste-derived hydrochar contains stable mineral phases that contribute significantly to cadmium removal [67,68]. Quartz, calcite, Mg-bearing phases, and silicates provide active sites for ion exchange and surface complexation, complementing the organic functional groups identified by FTIR. Increasing HTC temperature enhances mineral visibility but reduces organic functionality, shifting the sorption mechanism from a functional group-dominated mode (180 °C) to a mineral-assisted mode (250 °C) [69].
These findings support the mechanistic interpretation that cadmium adsorption on hydrochar occurs through a combination of complexation with oxygen-containing groups, electrostatic interactions, mineral-assisted binding, and ion exchange, and that the relative contribution of each pathway depends strongly on HTC severity [60,67,70].
3.3. SEM–EDS Analysis
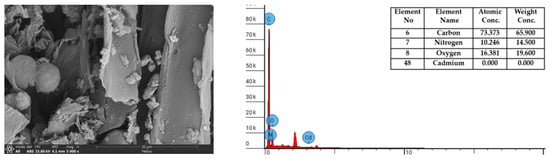
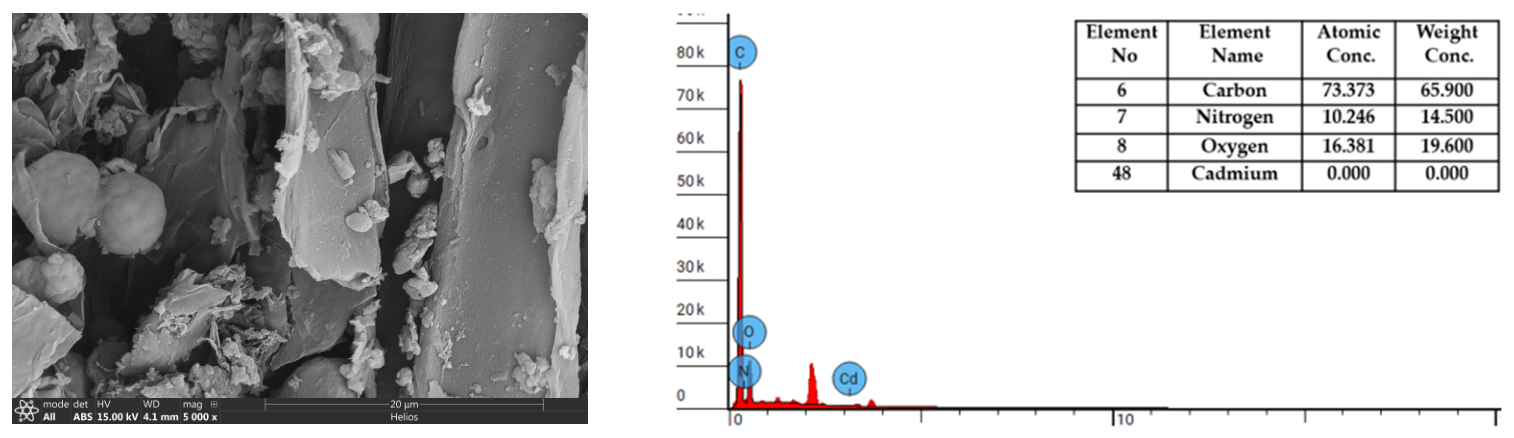
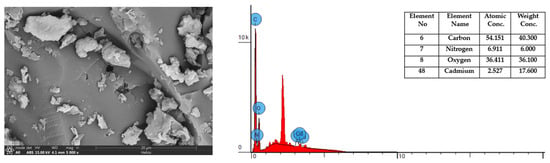
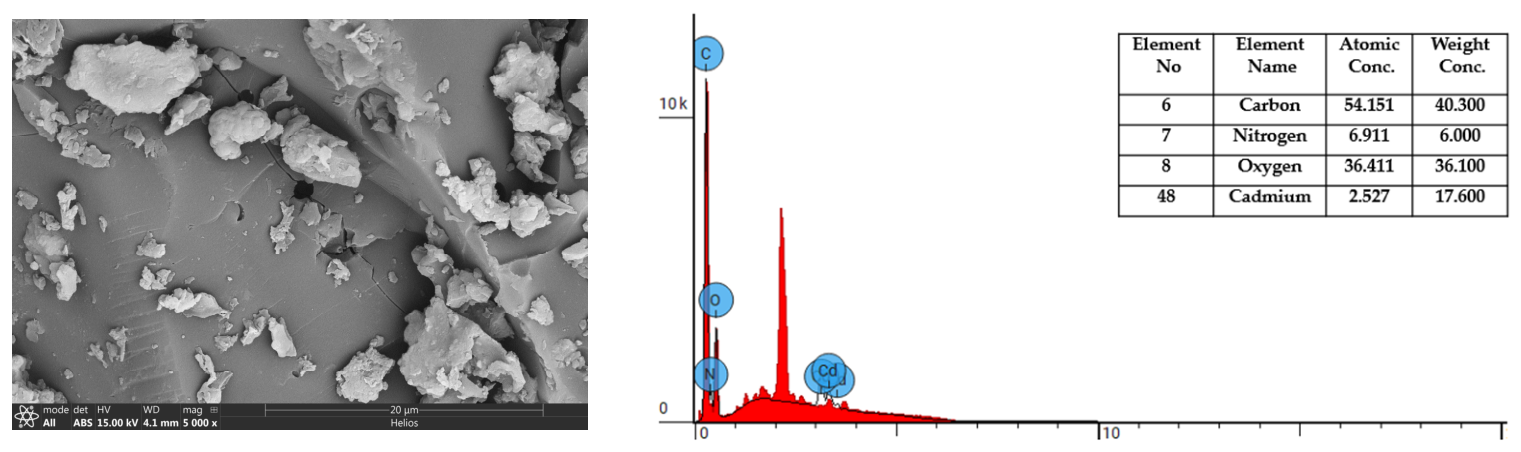
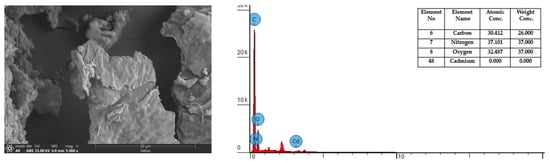
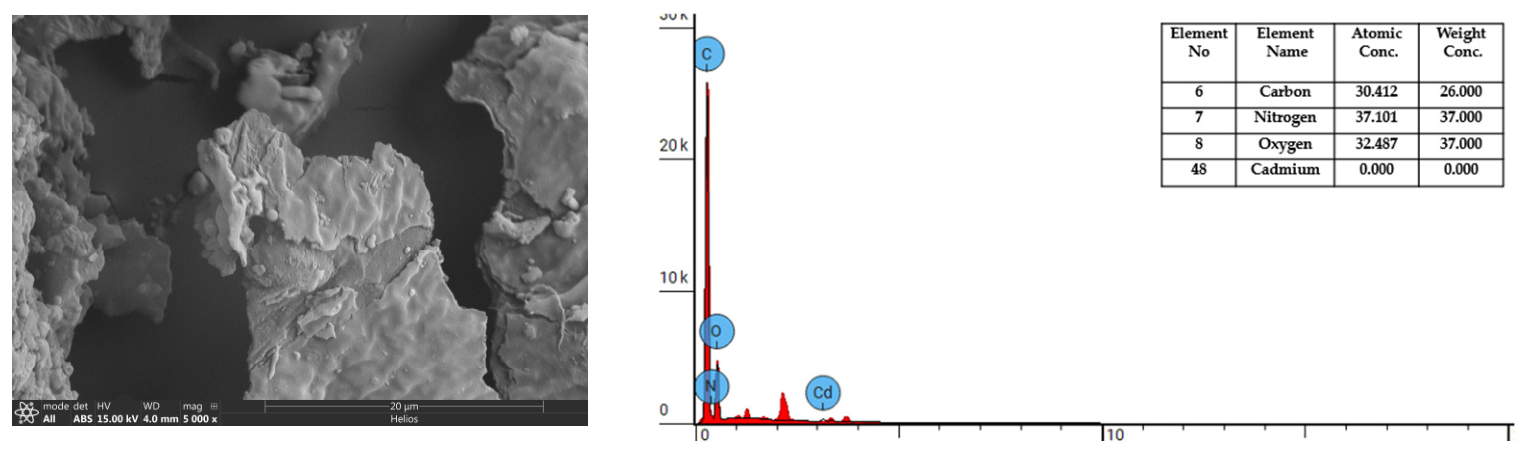
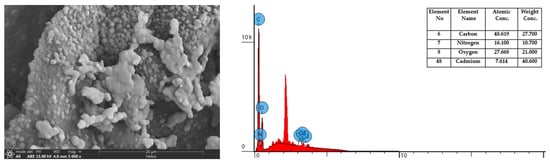
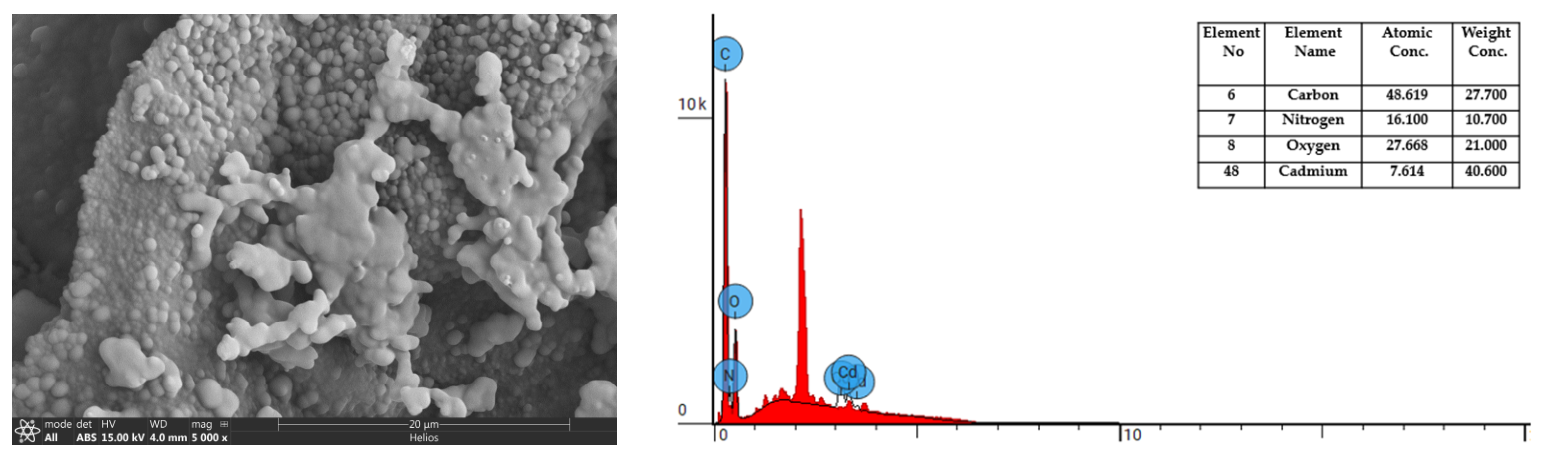
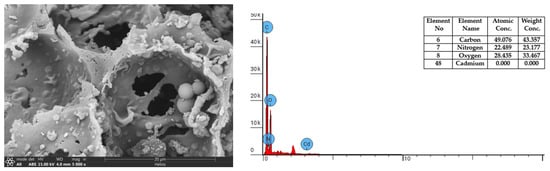
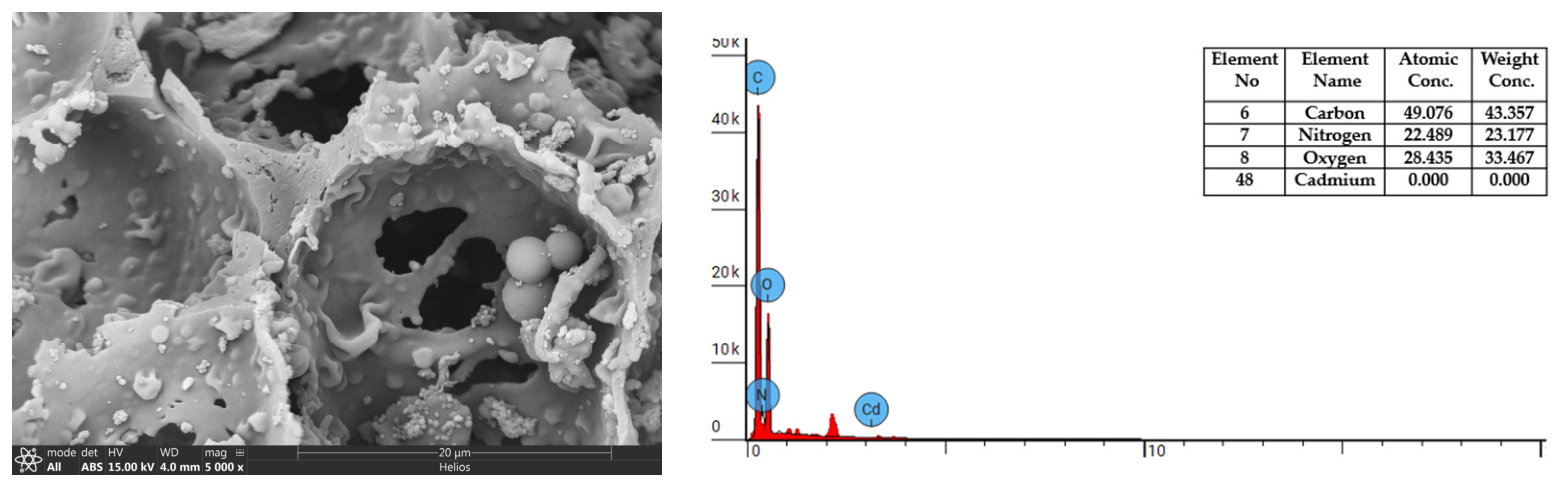
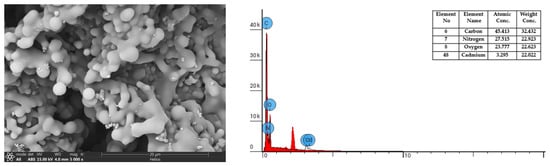
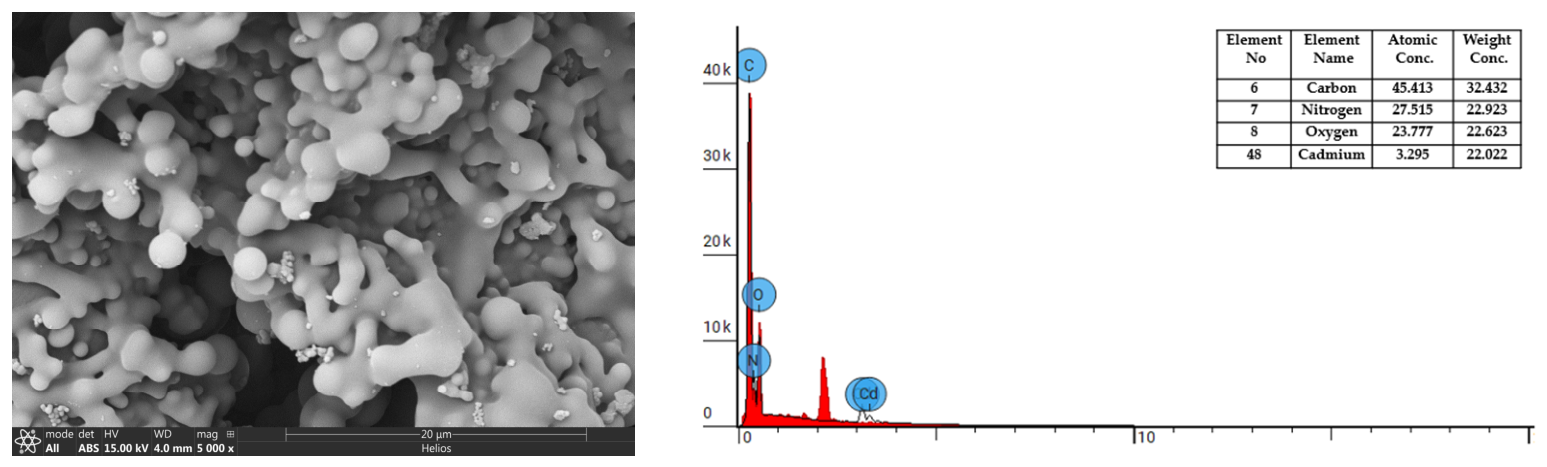
The surface morphology of hydrochar produced at 180 °C (Sample A), 215 °C (Sample B), and 250 °C (Sample C) at a carbonization time of 2 h before and after Cd2+ adsorption was examined using SEM, and their elemental composition was evaluated using EDS (Figure 3, Figure 4, Figure 5, Figure 6, Figure 7 and Figure 8). Clear differences in surface structure and mineral exposure were observed across HTC severity, and distinct changes occurred following cadmium adsorption [71].
Figure 3.
SEM-EDS of Sample A1 before adsorption of Cd2+.
Figure 4.
SEM-EDS of Sample A2 after adsorption of Cd2+.
Figure 5.
SEM-EDS of Sample B1 before adsorption of Cd2+.
Figure 6.
SEM-EDS of Sample B2 after adsorption of Cd2+.
Figure 7.
SEM-EDS of Sample C1 before adsorption of Cd2+.
Figure 8.
SEM-EDS of Sample C2 after adsorption of Cd2+.
3.3.1. Morphology Before Adsorption
Sample A1 (180 °C) exhibited a heterogeneous surface composed of loosely bound particles, fragmented structures, and irregular agglomerates. The surface appeared relatively open, with visible micro-voids and disrupted organic domains [72]. This morphology is characteristic of low-severity HTC, where partial hydrolysis and dehydration produce a reactive, oxygen-rich matrix. This trend is consistent with previously reported work [73,74].
Sample B1 (215 °C) showed a more compact, consolidated structure than Sample A1. The surface contained granular clusters embedded within a denser carbon matrix, indicating increased carbonization and partial collapse of organic structures. The pores were less open, which aligns with what has been reported, and mineral particles were more integrated into the carbon framework [75].
Sample C1 (250 °C) exhibited a distinctly porous, cavity-rich morphology. The surface contained well-defined voids, channels, and spherical mineral inclusions embedded within the carbon matrix. Higher HTC severity promotes aromatization and structural shrinkage, exposing mineral phases and generating rigid pore walls. This morphology aligns with the increased aromaticity observed in FTIR and the sharper mineral peaks seen in XRD [76].
3.3.2. Morphology After Adsorption
After Cd2+ adsorption, all samples showed visible changes in surface texture. Sample A2 exhibited increased particle agglomeration and partial smoothing of surface fragments, suggesting coverage of reactive sites by adsorbed cadmium species. Sample B2 showed more pronounced clustering and filling of micro-voids, consistent with mixed organic–mineral interactions. Sample C2 displayed deposition within pore cavities and slight thickening of pore walls, indicating mineral-assisted adsorption and possible surface precipitation.
The morphological changes were most evident in Sample A2, reflecting its higher abundance of reactive oxygen-containing groups. In contrast, Sample C2 showed more localized deposition associated with mineral phases.
3.4. EDS Elemental Composition
EDS analysis confirmed the presence of carbon, nitrogen, and oxygen in all samples, consistent with the food waste feedstock. Mineral-associated elements (e.g., Ca, Mg, Si) were present but not always labeled in the spectra.
Cadmium was not detected in any of the hydrochar samples prior to adsorption, confirming that the samples contained no native Cd and that all cadmium measured afterward originated solely from the adsorption process. Following exposure to Cd2+, however, all samples showed clear incorporation of the metal, with Sample A (180 °C for 2 h) containing approximately 17.6 wt%, Sample B (215 °C for 2 h) exhibiting the highest uptake at about 40.6 wt%, and Sample C (250 °C for 2 h) incorporating roughly 22.0 wt%. The exceptionally strong cadmium signal in Sample B2 (215 °C for 2 h) reflects the high affinity of its mixed organic–mineral surface produced at intermediate HTC severity, while the substantial uptake in Sample A (180 °C for 2 h) is consistent with its abundance of reactive oxygen-containing functional groups, and the moderate incorporation observed in Sample C (250 °C for 2 h) corresponds to its mineral-dominated sorption pathways.
Across all samples, adsorption was accompanied by a decrease in carbon content, redistribution or reduction of oxygen, variable nitrogen levels depending on HTC severity, and a pronounced increase in cadmium, indicating replacement of surface functional groups by Cd2+, coordination with oxygen-rich sites, and interaction with exposed mineral phases. Collectively, the SEM–EDS results demonstrate that HTC severity strongly governs hydrochar surface morphology and cadmium binding behavior: Sample A (180 °C-2 h) possesses a highly reactive, oxygen-rich surface that favors strong surface complexation; Sample B (215 °C for 2 h) presents a balanced organic–mineral interface enabling the highest uptake through combined complexation and mineral-assisted binding; and Sample C (250 °C for 2 h) exhibits a porous, mineral-exposed structure that promotes mineral-dominated sorption and possible surface precipitation [77,78].
These trends align with FTIR and XRD observations, confirming that cadmium adsorption proceeds through a combination of complexation with hydroxyl, carbonyl, and ether groups, electrostatic interactions, ion exchange with Ca/Mg-bearing minerals, and mineral-assisted surface deposition, with the relative contribution of each mechanism shifting according to HTC severity-lower temperatures favoring organic functional groups and higher temperatures enhancing mineral-based interactions.
3.5. Adsorption Experiment
Preliminary adsorption tests were conducted at pH 4, 5, and 6. Because pH 6 produced the highest Cd2+ uptake without precipitation, all subsequent adsorption experiments were performed at pH 6 [27,35].
Adsorption experiments were conducted at pH 6 using hydrochar carbonized at 180, 215, and 250 °C at a fixed dosage, a fixed adsorption time (2 h), and various initial Cd2+ concentrations to evaluate equilibrium capacity () and removal efficiency.
3.6. Adsorption Behavior
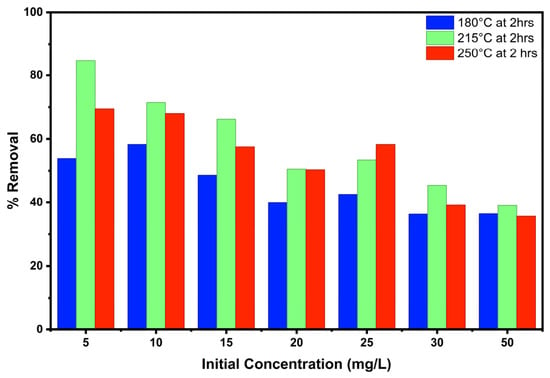
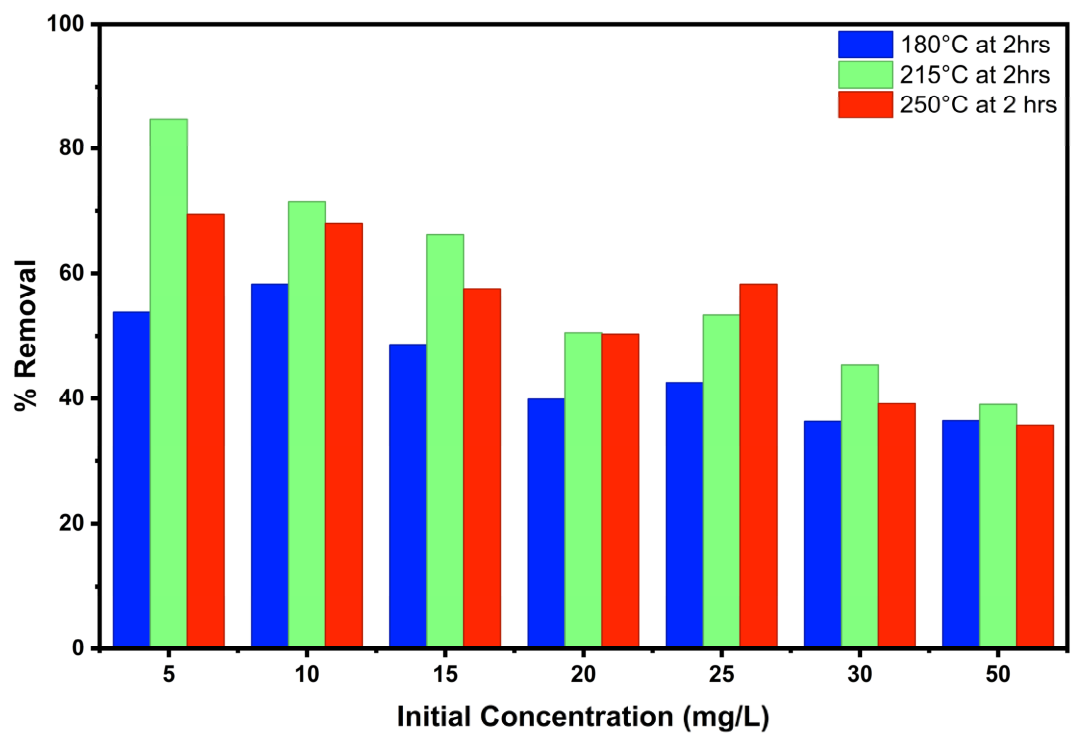
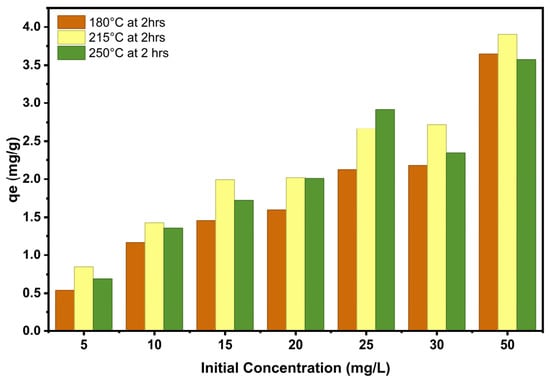
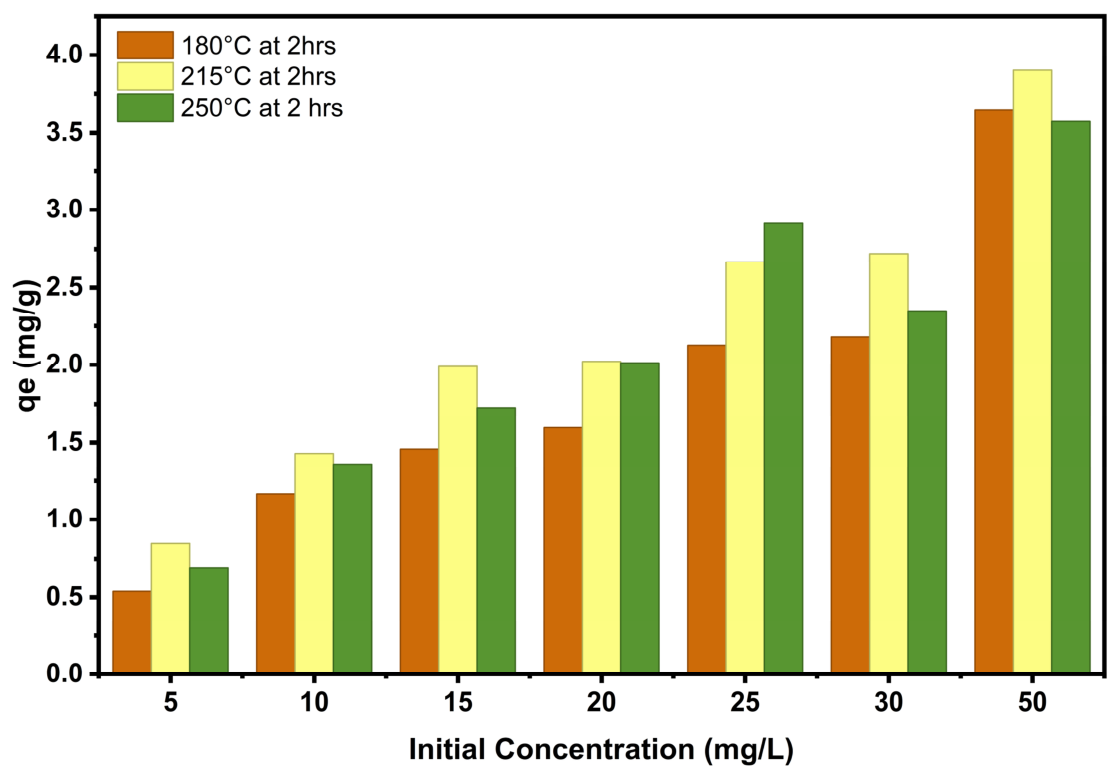
The adsorption behavior of Cd2+ on hydrochar produced at 180 °C for 2 h, 215 °C for 2 h, and 250 °C for 2 h was evaluated at pH 6 using varying initial Cd2+ concentrations. Equilibrium performance was assessed using percentage removal and equilibrium adsorption capacity (). The results are presented in Figure 9 and Figure 10, respectively.
Figure 9.
Effect of initial concentration on the percentage removal of Cd2+ adsorption.
Figure 10.
Effect of initial concentration on adsorption capacity.
3.6.1. Percentage Removal
The percentage removal of Cd2+ decreased with increasing initial concentration for all hydrochars (Figure 9). At low concentrations (5–15 ppm), all samples achieved high removal efficiencies, reflecting an abundance of available adsorption sites relative to the number of Cd2+ ions. As the initial concentration increased, removal efficiency declined due to progressive saturation of active sites [79].
Across the entire concentration range, Sample B (215 °C for 2 h) consistently exhibited the highest removal efficiency, followed by Sample C (250 °C for 2 h) and Sample A (180 °C for 2 h). The superior performance of Sample B is attributed to its balanced surface chemistry, combining abundant oxygen-containing functional groups with exposed mineral phases, as confirmed by FTIR, XRD, and SEM–EDS analyses. Sample A (180 °C for 2 h) showed lower removal at higher concentrations, likely due to limited pore accessibility and rapid site saturation, while Sample C (250 °C for 2 h) displayed intermediate removal, consistent with mineral-assisted adsorption mechanisms.
3.6.2. Equilibrium Adsorption Capacity (qe)
The equilibrium adsorption capacity () increased with initial Cd2+ concentration for all hydrochars (Figure 10). Higher concentrations provide a stronger driving force for mass transfer, enabling more Cd2+ ions to occupy available adsorption sites [80,81]. Sample B (215 °C for 2 h) again demonstrated the highest values across the entire concentration range, followed by Sample C (250 °C for 2 h) and Sample A (180 °C for 2 h).
The enhanced capacity of Sample 215 °C for 2 h to remove Cd2+ reflects its optimal HTC severity, which produces a surface rich in reactive functional groups while maintaining structural consolidation and mineral exposure. Sample A (180 °C for 2 h) exhibited lower capacities due to limited pore development and partial blockage of adsorption sites, whereas Sample C (250 °C for 2 h) showed moderate uptake consistent with its more aromatic, mineral-dominated surface.
3.6.3. Effect of pH
All adsorption experiments were conducted at pH 6, a condition under which Cd2+ remains predominantly in dissolved form and hydrochar surfaces are partially deprotonated. Preliminary tests at pH 4 and pH 5yielded lower adsorption performance due to increased competition between H+ and Cd2+ for active sites. Therefore, pH 6 was selected as the optimal condition for all equilibrium and kinetic studies.
3.6.4. Mechanistic Implications
The combined trends in percentage removal and demonstrate that HTC severity strongly influences Cd2+ uptake [25]. Sample B (215 °C for 2 h) offers the optimal balance of functional groups and mineral phases, resulting in superior adsorption performance. Sample A (180 °C for 2 h) relies primarily on oxygen-rich functional groups, while Sample C (250 °C for 2 h) exhibits mineral-dominated sorption pathways. These observations align with the structural and compositional evidence from FTIR, XRD, and SEM–EDS [82,83].
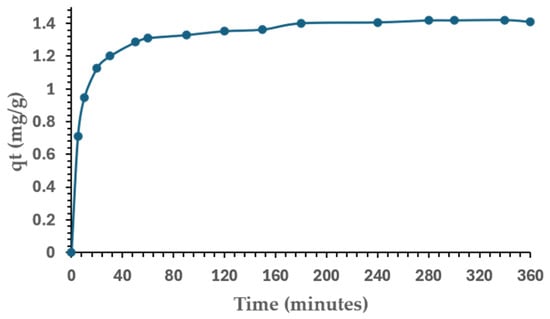
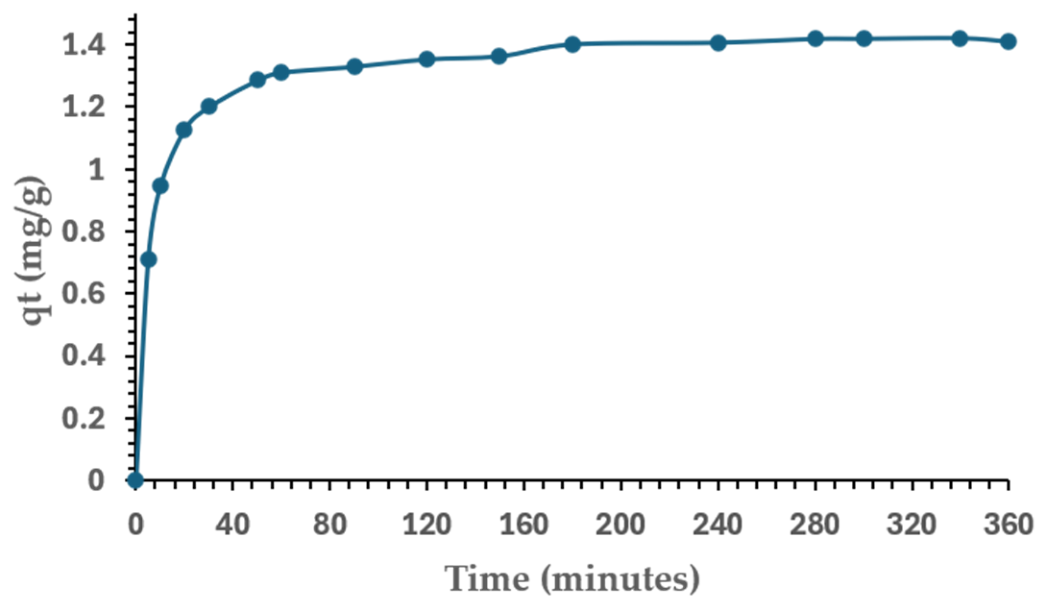
To further elucidate the rate-controlling mechanisms and adsorption pathways, the time-dependent adsorption kinetics were evaluated using Sample B (215 °C for 2 h), as described in Figure 11.
Figure 11.
Time-dependent adsorption capacity (qt) of Cd2+ on hydrochar.
3.7. Adsorption Kinetics
3.7.1. Time-Dependent Adsorption Behavior (qt vs. Time)
The time-dependent adsorption of Cd2+ on hydrochar was evaluated by monitoring the adsorption capacity () over a contact period of 360 min (Figure 11). The adsorption curve shows a characteristic two-stage profile: a rapid initial uptake followed by a slower approach to equilibrium [84].
At the beginning of the adsorption process (0–60 min), increased sharply, indicating fast occupation of readily accessible surface sites. This rapid phase is driven by the abundance of active functional groups and the strong electrostatic attraction between Cd2+ ions and the hydrochar surface. After approximately 60 min, the adsorption rate began to slow, reflecting the progressive saturation of external sites and the increasing importance of diffusion into internal pores.
Equilibrium was reached at around 180–240 min, when approached a plateau near 1.3 mg/g. The gradual leveling of the curve suggests that intraparticle diffusion and pore-filling mechanisms dominate the later stages of adsorption. This behavior is consistent with the structural features observed in SEM images, where hydrochar exhibits both surface irregularities and internal pore networks that influence diffusion pathways [27,85].
The shape of the qt vs. time curve indicates that Cd2+ adsorption on hydrochar involves both surface adsorption and internal diffusion processes. To further elucidate the rate-controlling mechanisms, the experimental data were fitted to pseudo-first-order, pseudo-second-order, and intraparticle diffusion models, as described in the following subsections.
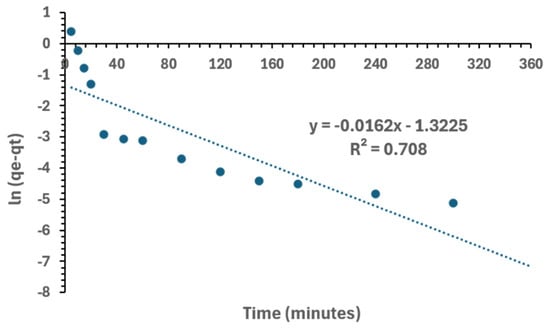
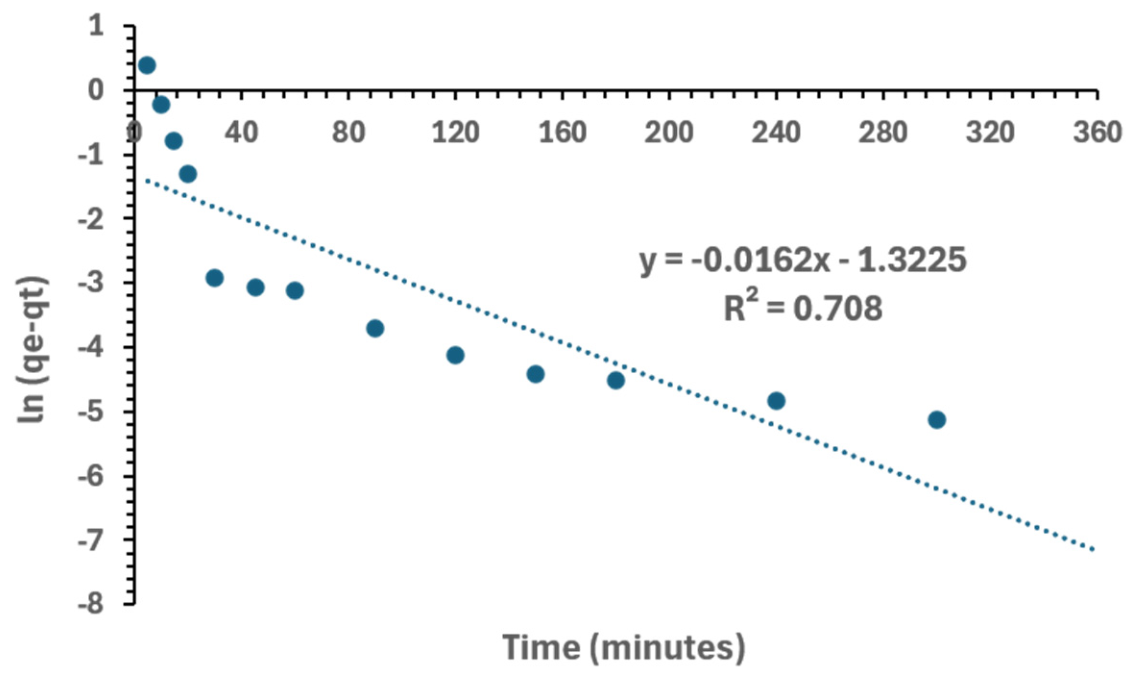
3.7.2. Pseudo-First-Order (PFO) Model
The PFO model was evaluated by plotting versus time (Figure 12). The linear fit yielded a moderate correlation (R2 = 0.708), indicating that the PFO model does not adequately describe the adsorption kinetics. The deviation from linearity and the relatively low R2 value suggest that Cd2+ adsorption is not governed solely by physisorption or diffusion through a boundary layer. Additionally, the calculated from the PFO model differed from the experimental value, further confirming poor applicability.
Figure 12.
Pseudo-first-order kinetic model for Cd2+ adsorption (ln (qe − qt) vs. time).
3.7.3. Pseudo-Second-Order (PSO) Model
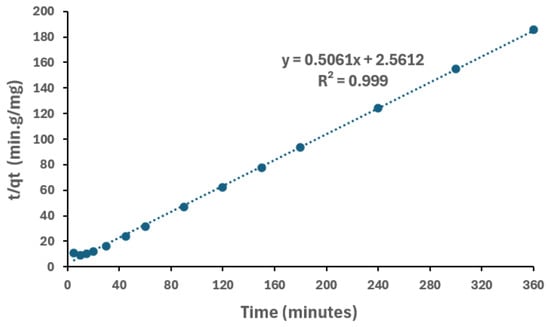
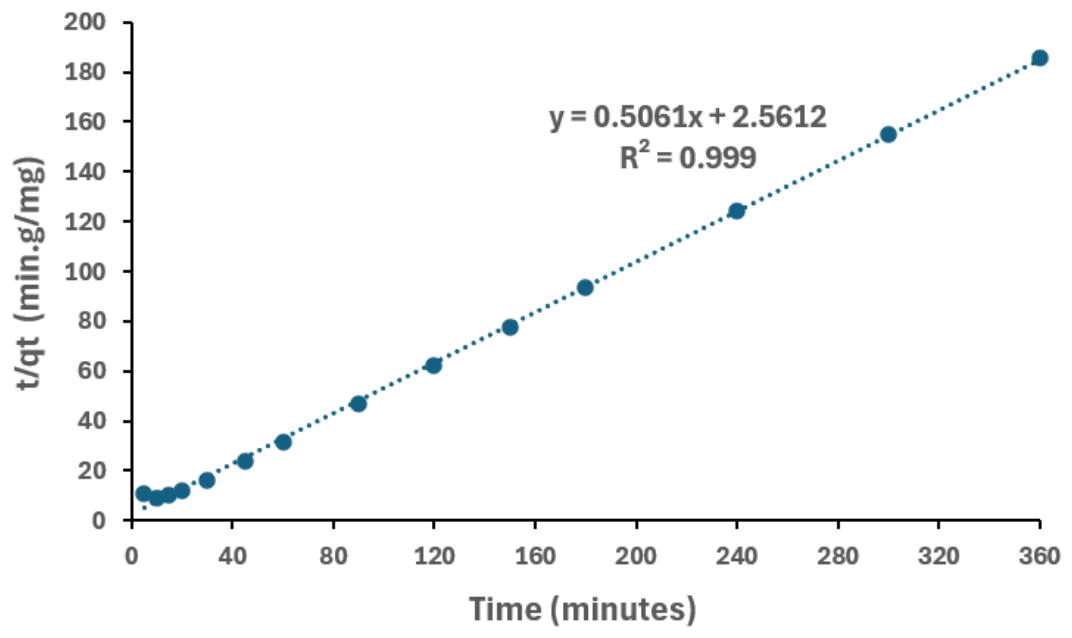
The PSO model was assessed by plotting versus time (Figure 13). The resulting linear fit exhibited an excellent correlation (R2 = 0.999), indicating that the PSO model provides an outstanding description of the adsorption kinetics. The near-perfect linearity suggests that chemisorption is the dominant rate-controlling mechanism, driven by valence forces via electron sharing or exchange between Cd2+ ions and functional groups on the hydrochar surface. The calculated from the PSO model closely matched the experimental value, reinforcing the model’s suitability.
Figure 13.
Pseudo-second-order kinetic model for Cd2+ adsorption (t/qt vs. time).
The strong PSO fit aligns with the structural evidence from FTIR and SEM–EDS, which showed abundant oxygen-containing functional groups and mineral phases capable of forming inner-sphere complexes with Cd2+ [86,87].
3.7.4. Intraparticle Diffusion (IPD) Model
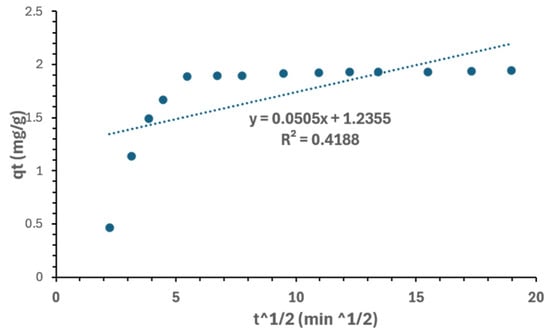
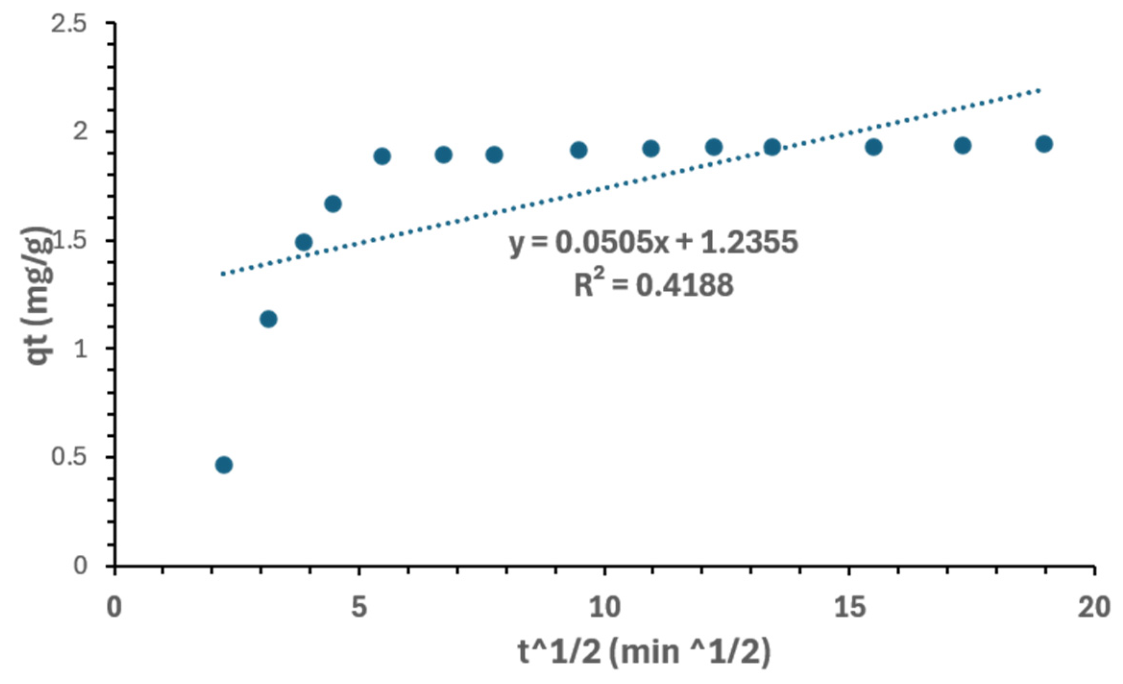
The intraparticle diffusion model was examined by plotting versus (Figure 14). The plot exhibited a linear trend but with a low correlation (R2 = 0.4188), indicating that intraparticle diffusion is not the sole rate-controlling step. The non-zero intercept further confirms the presence of a boundary-layer effect, indicating that adsorption occurs through a combination of surface interactions and internal diffusion.
Figure 14.
Intraparticle diffusion model for Cd2+ adsorption (qt vs. t1ᐟ2).
The initial steep portion of the qt vs. . The curve corresponds to rapid external surface adsorption, while the latter, flatter portion reflects slower diffusion into internal pores. This two-stage behavior is consistent with the pore structure observed in SEM images.
3.7.5. Overall Kinetic Mechanism
The combined kinetic results indicate that Cd2+ adsorption onto the hydrochar follows a pseudo-second-order mechanism, dominated by chemisorption involving functional groups and mineral phases [60]. Intraparticle diffusion contributes to the later stages of adsorption but is not the sole controlling mechanism. The rapid initial uptake, followed by slower diffusion-controlled adsorption, reflects the interplay among surface functional groups, pore structure, and mineral-assisted binding [27,88].
These findings complement the equilibrium adsorption behavior and structural characterization, confirming that HTC-derived hydrochar removes Cd2+ through a combination of surface complexation, mineral interactions, and pore diffusion [60].
3.8. Adsorption Isotherm Modeling
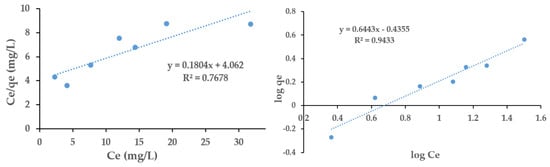
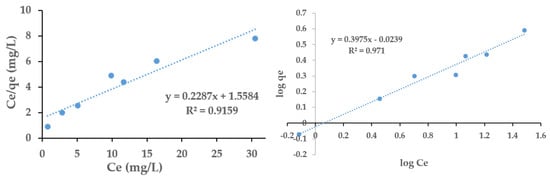
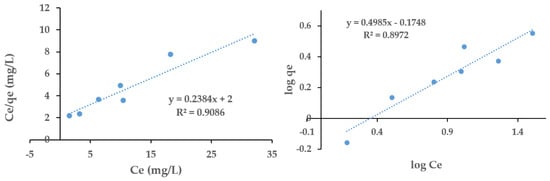
Adsorption isotherms were applied to describe the equilibrium interaction between Cd2+ ions and the hydrochars produced at 180 °C for 2 h (Sample A), at 215 °C for 2 h (Sample B), and at 250 °C for 2 h (Sample C). The equilibrium data were fitted to the Langmuir and the Freundlich models to evaluate monolayer capacity, adsorption intensity, and surface heterogeneity. The corresponding linearized plots are presented in Figure 15, Figure 16 and Figure 17.
Figure 15.
Langmuir isotherm [AL] and the Freundlich isotherm [AF] plots for Sample A.
Figure 16.
Langmuir isotherm [BL] and the Freundlich isotherm [BF] plots for Sample B.
Figure 17.
Langmuir isotherm [CL] and the Freundlich isotherm [CF] plots for Sample C. Note: L = Langmuir, F = Freundlich.
3.8.1. Langmuir Isotherm
The Langmuir model assumes monolayer adsorption on a homogeneous surface with identical sites. The linearized plots of versus yielded good correlations for all samples, with R2 values ranging from 0.768 to 0.916 (Figure 15, Figure 16 and Figure 17).
Figure 15 AL (Sample A) exhibited a Langmuir monolayer capacity () of 5.54 mg/g and a Langmuir constant () of 0.044 L/mg, with a moderate fit (R2 = 0.768). Sample B (Figure 15 BL) showed a slightly lower monolayer capacity (4.37 mg/g) but a significantly higher affinity constant (0.147 L/mg), indicating stronger binding between Cd2+ and the hydrochar surface. Sample C (Figure 15 CL) displayed a monolayer capacity of 4.20 mg/g and a moderate affinity constant (0.119 L/mg), with a strong fit (R2 = 0.9086).
Overall, Sample BL demonstrated the highest Langmuir affinity, suggesting that its surface contains more energetically favorable sites for Cd2+ adsorption, consistent with its superior performance in equilibrium and kinetic studies.
3.8.2. Freundlich Isotherm
The Freundlich model describes adsorption on heterogeneous surfaces that can form multilayer structures (Figure 15 AF, BF, and CF). The linearized plots of versus produced excellent fits for all samples, with R2 values ranging from 0.897 to 0.971.
In Figure 15 AF, Sample A exhibited a Freundlich constant () of 0.37 and an adsorption intensity () of 1.55, indicating moderately favorable adsorption. Sample BF exhibited the highest Freundlich constant (0.95) and the strongest adsorption intensity (n = 2.52), indicating highly favorable adsorption on a heterogeneous surface. Sample CF displayed intermediate Freundlich parameters (, ), suggesting favorable but less intense adsorption compared to Sample BF.
The Freundlich model provided better overall fits for Samples AF and BF, indicating that their surfaces are heterogeneous and contain a distribution of adsorption energies. Sample CF showed comparable fits for both models, suggesting mixed monolayer and heterogeneous adsorption behavior.
3.8.3. Model Comparison and Mechanistic Implications
Across all samples, the Freundlich model yielded higher correlation coefficients than the Langmuir model, particularly for Samples AF and BF. This indicates that Cd2+ adsorption on hydrochar is primarily governed by heterogeneous surface interactions rather than by uniform monolayer coverage. The higher Freundlich intensity values (n > 1) confirm that adsorption is favorable across all samples, with Sample BF showing the strongest affinity and surface heterogeneity.
The Langmuir parameters further support the mechanistic interpretation derived from FTIR, XRD, and SEM–EDS analyses. Sample BF, produced at 215 °C, exhibits the highest affinity constant and strong Freundlich behavior, reflecting its optimal balance of oxygen-containing functional groups and mineral phases. Sample AF shows higher monolayer capacity but weaker affinity, consistent with its more oxygen-rich but less structurally consolidated surface. Sample CF exhibits intermediate behavior, reflecting its more aromatic, mineral-dominated surface.
Overall, the isotherm results confirm that HTC severity strongly influences surface heterogeneity, the distribution of adsorption site energies, and Cd2+ binding strength [89]. Sample B consistently exhibits the most favorable adsorption characteristics, aligning with its superior performance in equilibrium and kinetic studies.
3.9. Thermodynamics Study
Table 1 shows the mean equilibrium concentrations (Ce), adsorption capacities (qe), and associated standard deviations (SD Ce and SD qe) for Cd2+ adsorption onto samples A, B, and C at 25 °C, 35 °C, and 45 °C. Values represent triplicate measurements across all initial concentrations (C0), providing a consolidated dataset for evaluating temperature-dependent adsorption behavior.
Table 1.
Mean equilibrium concentrations (Ce) and standard deviations (SD Ce) for Cd2+ adsorption onto un-engineered hydrochar at 25, 34, and 45 °C.
This data shows that the fraction of Cd2+ adsorption on the hydrochar increases with temperature. The values of both Ce and qe are at a minimum at 35 °C across all initial concentrations, indicating the most favorable conditions for adsorption [85,86]. This indicates greater mobility of Cd2+ ions and stronger interaction energy at 35 °C, along with improved accessibility of surface functional groups. However, at 25 °C, the adsorption performance is much poorer, with higher Ce and lower qe values indicating that the affinity between Cd2+ and the hydrochar surface is lower. The adsorption also decreases at 45 °C, possibly because of more complex desorption or thermal dissociation of surface complexes. The standard deviations for Ce and qe are reproducible, confirming the trends described above: the temperature effects observed in this study are consistent across replicates. In general, the table shows that 35 °C is the best temperature for Cd2+ uptake, and it also indicates the importance of temperature on the adsorption behavior [90,91].
The trends in the observed and thermodynamic parameters, obtained from the equilibrium constants and van ’t Hoff analysis, are similar [92]. The lowest Ce value and the highest qe value at 35 °C correspond to the highest equilibrium constant (Kc = 39.84) and the only negative Gibbs free energy (ΔG° = −9.41 kJ/mol), confirming that adsorption is spontaneous only at this temperature. The Ce value is higher, and the qe value is lower at 25 °C and 45 °C, indicating low Kc values and positive ΔG°, suggesting non-spontaneous adsorption at these temperatures. The endothermic adsorption mechanism is confirmed by the positive enthalpy change (ΔH° = 51.29 kJ/mol) obtained from the three-temperature van ’t Hoff regression, indicating that adsorption improves as temperature increases from 25 to 35 °C. The positive entropy change (ΔS° = 0.158 kJ/mol·K) further suggests increased disorder at the hydrochar–solution interface, consistent with the enhanced uptake observed at 35 °C. Together, the Ce-qe table and thermodynamic parameters provide a coherent and scientifically defensible description of the adsorption mechanism, demonstrating that Cd2+ uptake is both temperature dependent and thermodynamically optimized at 35 °C [48,93].
The thermodynamic parameters for the adsorption of Cd2+ on Samples A, B, and C are presented in Table 2 at temperatures of 25, 35, and 45 °C. It is observed that the adsorption capacity (qe) exhibits a definite temperature dependence, as indicated by the equilibrium data: it is maximum at 35 °C and decreases rapidly at higher and lower temperatures. This trend is observed for the equilibrium constant (Kc), indicating that adsorption strength is greatest at 35 °C. The Gibbs free energy values (ΔG°) indicate that adsorption proceeds spontaneously at 35 °C but becomes unfavorable at 25 and 45 °C. The positive enthalpy change (ΔH° = 51.29 kJ/mol) obtained from the three-temperature van ’t Hoff regression shows that adsorption of Cd2+ to the un-engineered hydrochar is endothermic. The positive value of ΔS° (0.158 kJ/mol·K) indicates an increase in disorder at the solid–solution interface during the adsorption process. These results provide a thorough thermodynamic characterization of the adsorption mechanism and provide a solid basis for comparison with the hydrochar [48,93].
Table 2.
Thermodynamic parameters describing Cd2+ adsorption onto hydrochar at 25 °C, 35 °C, and 45 °C.
The thermodynamic behavior of Cd2+ adsorption on the hydrochar was assessed using equilibrium data collected at 25, 35, and 45 °C. The combined data indicate a specific, non-linear temperature dependence, with the adsorption capacity (qe) being maximum at 35 °C and decreasing at lower and higher temperatures. The relatively high Ce and low qe in comparison with the other hydrochars indicate that the surface of the hydrochar is not as active as needed to effectively bind Cd2+ at 25 °C. The adsorption performance, on the other hand, increases significantly at 35 °C, with a decrease in Ce and an increase in qe. This temperature appears to provide optimal conditions for Cd2+ uptake, which may be attributed to increased Cd2+ mobility, greater accessibility of surface functional groups, and favorable interaction energies between Cd2+ ions and hydrochar surface [49,93].
The adsorption efficiency decreases again at 45 °C, as evidenced by the increase in Ce and the decrease in qe. With increasing temperature, the interaction between Cd2+ and hydrochar is reduced due to decreased adsorption affinity, suggesting that desorption processes or the thermal disruption of surface complexes may be activated, thereby affecting the stability of Cd2+–hydrochar interactions. The equilibrium constants (Kc) also show a similar trend; at 35 °C, the Kc value is very large (−9.41 kJ/mol), whereas at 25 °C and 45 °C, the values are much smaller (9.28 kJ/mol and 7.73 kJ/mol, respectively). This temperature effect on spontaneity highlights the temperature sensitivity of the adsorption mechanism.
Three-temperature van ’t Hoff regression gives a more statistically sound and reliable evaluation of the adsorption energetics than two-temperature calculations. The positive value of the enthalpy change (ΔH° = +51.29 kJ/mol) indicates an endothermic adsorption process of Cd2+ onto the hydrochar. It suggests that the adsorption process is endothermic, which is consistent with partial dehydration of Cd2+ ions, activation of surface functional groups, or structural rearrangements at the interface between the hydrochar and the ions. The positive entropy change shown (ΔS° = +0.158 kJ/mol·K) also indicates that the adsorption process increases the disorder at the solid–solution interface. This entropy gain could be due to the removal of water molecules from the hydration shells and/or to an increase in configurational freedom of the Cd2+ ions as they interact with the heterogeneous surface sites [93].
The thermodynamic parameters indicate that Cd2+ adsorption on the hydrochar is endothermic and entropy-driven, and spontaneous only at an intermediate temperature. At 25 °C, the adsorption process appears to be driven by interactions that are temperature-enhanced but insufficient to trigger it at 45 °C. These results create a solid, scientifically sound thermodynamic profile of hydrochar and provide a solid basis for assessing the potential effects of surface modification on the spontaneity and heat effects of Cd2+ adsorption, as well as on interfacial ordering.
4. Conclusions
This study demonstrates that the hydrothermal carbonization (HTC) temperature exerts a decisive influence on the physicochemical properties, surface functionality, mineral expression, and, ultimately, the cadmium adsorption performance of hydrochar derived from biomass. Increasing HTC severity progressively transformed the hydrochar structure from some oxygen-rich, amorphous carbon matrix at 180 °C (Sample A), to a balanced organic–mineral composite at 215 °C (Sample B), and finally to a more aromatized, mineral-exposed material at 250 °C (Sample C). FTIR analysis confirmed the gradual loss of hydroxyl, carbonyl, and ether groups with increasing temperature, while XRD revealed enhanced mineral crystallinity and structural ordering in the higher-temperature samples. SEM–EDS further showed that all hydrochars were initially free of cadmium, and that Cd2+ uptake after adsorption was strongly dependent on HTC severity, with Sample B exhibiting the highest incorporation due to its optimal combination of reactive functional groups and exposed mineral phases.
Adsorption experiments demonstrated that HTC temperature governs both the affinity and capacity of the hydrochar for Cd2+. Sample B consistently outperformed Samples A and C across equilibrium, kinetic, and isotherm analyses, reflecting its favorable balance of surface chemistry and mineral-assisted binding sites. Langmuir modeling indicated monolayer adsorption with moderate capacities, while Freundlich modeling provided superior fits for Samples A and B, confirming heterogeneous surface interactions and multilayer adsorption behavior. Thermodynamic analysis showed that Cd2+ adsorption was spontaneous and exothermic at lower temperatures, with decreasing spontaneity at higher temperatures, consistent with the observed decline in adsorption affinity from 35 °C to 45 °C. The negative enthalpy and entropy changes further supported a mechanism dominated by surface complexation, ion exchange, and mineral-assisted deposition.
Overall, the results establish that HTC temperature is a critical design parameter for tuning hydrochar structure and optimizing heavy-metal adsorption performance. The intermediate-severity hydrochar (Sample B, 215 °C) achieved the most favorable combination of functional group availability, mineral exposure, and structural stability, resulting in the highest Cd2+ uptake and the strongest adsorption affinity. These findings highlight the potential of HTC-engineered hydrochar as an effective, tunable adsorbent for cadmium removal from aqueous systems and provide a mechanistic foundation for tailoring hydrochar properties through controlled thermal processing.
Author Contributions
Conceptualization, G.C.; methodology, M.E.O.; software, I.A.E. and O.E.O.; validation, G.C.; formal analysis, O.E.O. and E.O.; investigation, E.O.; resources, L.Q. and I.A.E.; data curation, M.E.O.; writing—original draft preparation, M.E.O.; writing—review and editing, M.E.O.; visualization, E.O.; supervision, G.C.; project administration, M.E.O.; funding acquisition, GC. All authors have read and agreed to the published version of the manuscript.
Funding
The research was supported by the National Science Foundation (award Number 2501880) to Florida A&M University, Gang Chen Laboratory.
Data Availability Statement
Original contributions presented in this study are included in the article. Further inquiries can be directed to the corresponding author.
Acknowledgments
Generative AI tools were used only for limited English-language editing. All experimental data, analyses, and tables were generated by the authors. The authors reviewed all AI-assisted content and take full responsibility for the manuscript.
Conflicts of Interest
The authors declare no conflicts of interest.
References
- Tariq, A.; Mushtaq, A. Untreated wastewater reasons and causes: A review of most affected areas and cities. Int. J. Chem. Biochem. Sci. 2023, 23, 121–143. [Google Scholar]
- Saxena, V. Water quality, air pollution, and climate change: Investigating the environmental impacts of industrialization and urbanization. Water Air Soil Pollut. 2025, 236, 73. [Google Scholar] [CrossRef] [Scilit]
- Ojewumi, M.; Alagbe, E.; Abinusawa, A.; John, A.; Taiwo, S.; Bolade, O. Moringa oleifera as natural coagulant in water treatment and production of antifungal soap. IOP Conf. Ser. Earth Environ. Sci. 2021, 655, 012007. [Google Scholar] [CrossRef] [Scilit]
- Vasilachi, I.C.; Asiminicesei, D.M.; Fertu, D.I.; Gavrilescu, M. Occurrence and fate of emerging pollutants in water environment and options for their removal. Water 2021, 13, 181. [Google Scholar] [CrossRef] [Scilit]
- Singh, R.; Harsha Varthan, M.; Rejith Kumar, R.; Rohinth, M.; Tawfeeq Ahmed, Z.; Indumathi, S.; Pusuluru, S.; Punna, S.K.; Velmurugan, K.; Samuel, M. Emerging Pollutants in Soil and Water: Sources, Risks, and Advances in Removal Technologies for Sustainable Management. Environ. Manag. 2025, 75, 3522–3537. [Google Scholar] [CrossRef] [Scilit] [PubMed]
- Ojewumi, M.; Ojewumi, E.; Odunlami, O.; Ubong, P.; Jolayemi, K. Adsorption of Heavy Metals from an Aqueous Solution Using Activated Carbon Prepared from Ripe and Unripe Plantain Peels. J. Sustain. Mater. Process. Manag. 2024, 4, 111–123. [Google Scholar] [CrossRef] [Scilit]
- Alsukaibi, A.K. Various approaches for the detoxification of toxic dyes in wastewater. Processes 2022, 10, 1968. [Google Scholar] [CrossRef] [Scilit]
- Bolong, N.; Ismail, A.; Salim, M.R.; Matsuura, T. A review of the effects of emerging contaminants in wastewater and options for their removal. Desalination 2009, 239, 229–246. [Google Scholar] [CrossRef] [Scilit]
- Richardson, S.D.; Ternes, T.A. Water analysis: Emerging contaminants and current issues. Anal. Chem. 2021, 94, 382–416. [Google Scholar] [CrossRef] [Scilit] [PubMed]
- Singh, S.; Sivaram, N.; Dhanjal, D.S.; Assefa, H.; Singh, J.; Ramamurthy, P.C. Navigating the complexity of emerging contaminants: Sources, impacts, and remediation strategies. J. Indian Inst. Sci. 2024, 104, 519–553. [Google Scholar] [CrossRef] [Scilit]
- Ojewumi, M.E.; Chen, G. Hydrochar production by hydrothermal carbonization: Microwave versus supercritical water treatment. Biomass 2024, 4, 574–598. [Google Scholar] [CrossRef] [Scilit]
- Akhtar, M.S.; Ali, S.; Zaman, W. Innovative adsorbents for pollutant removal: Exploring the latest research and applications. Molecules 2024, 29, 4317. [Google Scholar] [CrossRef] [Scilit] [PubMed]
- Satyam, S.; Patra, S. Innovations and challenges in adsorption-based wastewater remediation: A comprehensive review. Heliyon 2024, 10, e29573. [Google Scholar] [CrossRef] [Scilit] [PubMed]
- Ojewumi, M.; Ehinmowo, A.; Obanla, O.; Durodola, B.; Ezeocha, R. Comparative Analysis on the Bleaching of Crude Palm Oil Using Activated Groundnut Hull, Snail Shell and Rice Husk. Heliyon 2021, 7, e07747. [Google Scholar] [CrossRef] [Scilit] [PubMed]
- Lin, C.S.K.; Pfaltzgraff, L.A.; Herrero-Davila, L.; Mubofu, E.B.; Abderrahim, S.; Clark, J.H.; Koutinas, A.A.; Kopsahelis, N.; Stamatelatou, K.; Dickson, F. Food waste as a valuable resource for the production of chemicals, materials and fuels. Current situation and global perspective. Energy Environ. Sci. 2013, 6, 426–464. [Google Scholar] [CrossRef] [Scilit]
- Khan, M.N.; Sial, T.A.; Ali, A.; Wahid, F. Impact of agricultural wastes on environment and possible management strategies. In Frontier Studies in Soil Science; Springer: Cham, Switzerland, 2024; pp. 79–108. [Google Scholar]
- Ojewumi, M.E.; Chen, G. Microwave-Mediated Hydrothermal Carbonization (MWHTC) of food waste for conversion-ready feedstocks. Biofuels 2025, 16, 775–788. [Google Scholar] [CrossRef] [Scilit]
- Nargotra, P.; Ortizo, R.G.G.; Wang, J.-X.; Tsai, M.-L.; Dong, C.-D.; Sun, P.-P.; Bajaj, B.K.; Kuo, C.-H.; Sharma, V. Enzymes in the bioconversion of food waste into valuable bioproducts: A circular economy perspective. Syst. Microbiol. Biomanuf. 2024, 4, 850–868. [Google Scholar] [CrossRef] [Scilit]
- Pal, P.; Singh, A.K.; Srivastava, R.K.; Rathore, S.S.; Sahoo, U.K.; Subudhi, S.; Sarangi, P.K.; Prus, P. Circular bioeconomy in action: Transforming food wastes into renewable food resources. Foods 2024, 13, 3007. [Google Scholar] [CrossRef] [Scilit] [PubMed]
- Khan, M.A.; Hameed, B.H.; Siddiqui, M.R.; Alothman, Z.A.; Alsohaimi, I.H. Hydrothermal conversion of food waste to carbonaceous solid fuel—A review of recent developments. Foods 2022, 11, 4036. [Google Scholar] [CrossRef] [Scilit] [PubMed]
- Saqib, N.U.; Baroutian, S.; Sarmah, A.K. Physicochemical, structural and combustion characterization of food waste hydrochar obtained by hydrothermal carbonization. Bioresour. Technol. 2018, 266, 357–363. [Google Scholar] [CrossRef] [Scilit] [PubMed]
- Adegoke, H.I.; Adekola, F.A.; Fatoki, O.S.; Ximba, B.J. Sorptive Interaction of Oxyanions with Iron Oxides: A Review. Pol. J. Environ. Stud. 2013, 22, 7–24. [Google Scholar]
- Ghassemi-Golezani, K.; Rahimzadeh, S. Biochar modification and application to improve soil fertility and crop productivity. Agriculture (Pol’nohospodárstvo) 2022, 68, 45–61. [Google Scholar] [CrossRef] [Scilit]
- Escudero-Curiel, S.; Giráldez, A.; Pazos, M.; Sanromán, Á. From waste to resource: Valorization of lignocellulosic agri-food residues through engineered hydrochar and biochar for environmental and clean energy applications—A comprehensive review. Foods 2023, 12, 3646. [Google Scholar] [CrossRef] [Scilit] [PubMed]
- Babeker, T.M.A.; Chen, Q. Heavy metal removal from wastewater by adsorption with hydrochar derived from biomass: Current applications and research trends. Curr. Pollut. Rep. 2021, 7, 54–71. [Google Scholar] [CrossRef] [Scilit]
- Helen La, J.P.A. Role of biochar in the removal of organic and inorganic contaminants from waste gas streams. In BioChar: Applications for Bioremediation of Contaminated Systems; De Gruyter Brill: Berlin, Germany, 2022; p. 89. [Google Scholar]
- Ojewumi, M.E.; Chen, G.; Ojewumi, O.E.; Emmanuel, I.A.; Owojuyigbe, E.; Pimentel, H.M.; Ibeanusi, V.; Badisa, V.L.; Mwashote, B.M. Valorization of Biomass into Functional Hydrochar: Surface Chemistry and Metal-Binding Mechanisms. Biomass 2026, 6, 52. [Google Scholar] [CrossRef] [Scilit]
- Liu, G.; Zheng, H.; Zhai, X.; Wang, Z. Characteristics and mechanisms of microcystin-LR adsorption by giant reed-derived biochars: Role of minerals, pores, and functional groups. J. Clean. Prod. 2018, 176, 463–473. [Google Scholar] [CrossRef] [Scilit]
- Zhao, Q.; Qiu, Y.; Lan, T.; Li, J.; Li, B.; Wu, Z.; Chen, L.; Liu, R.; Zhou, Y.; Wu, W. Comparison of lead adsorption characteristics onto soil-derived particulate organic matter versus humic acid. J. Soils Sediments 2021, 21, 2589–2603. [Google Scholar] [CrossRef] [Scilit]
- Hart, A.; Porbeni, D.W.; Omonmhenle, S.; Peretomode, E. Waste bone char-derived adsorbents: Characteristics, adsorption mechanism and model approach. Environ. Technol. Rev. 2023, 12, 175–204. [Google Scholar] [CrossRef] [Scilit]
- Ojewumi, O.E.; Chen, G.; Ojewumi, M.E. Biochar Production: Toward Safe, Effective, and Sustainable Agriculture. Green 2026, 1, 7. [Google Scholar] [CrossRef] [Scilit]
- Ighalo, J.O.; Akaeme, F.C.; Georgin, J.; de Oliveira, J.S.; Franco, D.S. Biomass hydrochar: A critical review of process chemistry, synthesis methodology, and applications. Sustainability 2025, 17, 1660. [Google Scholar] [CrossRef] [Scilit]
- Padhye, L.P.; Bandala, E.R.; Wijesiri, B.; Goonetilleke, A.; Bolan, N. Hydrochar: A promising step towards achieving a circular economy and sustainable development goals. Front. Chem. Eng. 2022, 4, 867228. [Google Scholar] [CrossRef] [Scilit]
- Ojewumi, M.E.; Chen, G.; Sachith, B.M.; Badisa, V.L.; Mwashote, B.M.; Rathore, R.S.; Ojewumi, O.E.; Odum, B. Sustainable Hydrochar Production from Biomass via Conventional Hydrothermal Carbonization: Optimization, Characterization, and Adsorption Capacity on Cu2+. Sustainability 2026, 18, 4450. [Google Scholar] [CrossRef] [Scilit]
- Pradhan, S.; Singh, S.; Rai, L.C. Characterization of various functional groups present in the capsule of Microcystis and study of their role in biosorption of Fe, Ni and Cr. Bioresour. Technol. 2007, 98, 595–601. [Google Scholar] [CrossRef] [Scilit] [PubMed]
- Zou, G.; She, J.; Peng, S.; Yin, Q.; Liu, H.; Che, Y. Two-dimensional SEM image-based analysis of coal porosity and its pore structure. Int. J. Coal Sci. Technol. 2020, 7, 350. [Google Scholar] [CrossRef] [Scilit]
- Sørensen, H.; Rosenberg, P.; Petersen, H.; Sørensen, L. Char porosity characterisation by scanning electron microscopy and image analysis. Fuel 2000, 79, 1379–1388. [Google Scholar] [CrossRef] [Scilit]
- Clemente, J.S.; Beauchemin, S.; Thibault, Y.; MacKinnon, T.; Smith, D. Differentiating inorganics in biochars produced at commercial scale using principal component analysis. ACS Omega 2018, 3, 6931–6944. [Google Scholar] [CrossRef] [Scilit] [PubMed]
- Ault, A.P.; Peters, T.M.; Sawvel, E.J.; Casuccio, G.S.; Willis, R.D.; Norris, G.A.; Grassian, V.H. Single-particle SEM-EDX analysis of iron-containing coarse particulate matter in an urban environment: Sources and distribution of iron within Cleveland, Ohio. Environ. Sci. Technol. 2012, 46, 4331–4339. [Google Scholar] [CrossRef] [Scilit] [PubMed]
- Xue, Y.; Gao, B.; Yao, Y.; Inyang, M.; Zhang, M.; Zimmerman, A.R.; Ro, K.S. Hydrogen peroxide modification enhances the ability of biochar (hydrochar) produced from hydrothermal carbonization of peanut hull to remove aqueous heavy metals: Batch and column tests. Chem. Eng. J. 2012, 200, 673–680. [Google Scholar] [CrossRef] [Scilit]
- Tran, T.H.; Le, A.H.; Pham, T.H.; Nguyen, D.T.; Chang, S.W.; Chung, W.J.; Nguyen, D.D. Adsorption isotherms and kinetic modeling of methylene blue dye onto a carbonaceous hydrochar adsorbent derived from coffee husk waste. Sci. Total Environ. 2020, 725, 138325. [Google Scholar] [CrossRef] [Scilit] [PubMed]
- Salahshour, R.; Shanbedi, M.; Esmaeili, H. Methylene Blue Dye Removal from Aqueous Media Using Activated Carbon Prepared by Lotus Leaves: Kinetic, Equilibrium and Thermodynamic Study. Acta Chim. Slov. 2021, 68, 363–373. [Google Scholar] [CrossRef] [Scilit]
- Chu, K.H.; Hashim, M.A.; Basirun, A.A. Pseudo-First-Order Kinetics in Water Contaminant Adsorption: A Cautionary Note. Water Air Soil Pollut. 2026, 237, 55. [Google Scholar] [CrossRef] [Scilit]
- Burye, T.; Sebastian, T. Kinetic evaluation of sulfur adsorption on La0.7Sr0.3VO3.86−δ catalyst in methane atmosphere using pseudo-first and pseudo-second-order models. Int. J. Hydrogen Energy 2026, 233, 155070. [Google Scholar] [CrossRef] [Scilit]
- Mabayo, V.; Quimada, N.; Palconite, C.; Alfar, L. Revisiting isotherm and kinetic models in dye adsorption: Assumptions, limitations, and common misinterpretations. Int. J. Environ. Sci. Technol. 2026, 23, 420. [Google Scholar] [CrossRef] [Scilit]
- Saadi, R.; Saadi, Z.; Fazaeli, R.; Fard, N.E. Monolayer and multilayer adsorption isotherm models for sorption from aqueous media. Korean J. Chem. Eng. 2015, 32, 787–799. [Google Scholar] [CrossRef] [Scilit]
- Periyavaram, S.R.; Uppala, L.; Sivaprakash, S.; Reddy, P.H.P. Thermal behaviour of hydrochar derived from hydrothermal carbonization of food waste using leachate as moisture source: Kinetic and thermodynamic analysis. Bioresour. Technol. 2023, 373, 128734. [Google Scholar] [CrossRef] [Scilit] [PubMed]
- Zheng, X.; Chen, W.; Ying, Z.; Huang, J.; Ji, S.; Wang, B. Thermodynamic investigation on gasification performance of sewage sludge-derived hydrochar: Effect of hydrothermal carbonization. Int. J. Hydrogen Energy 2019, 44, 10374–10383. [Google Scholar] [CrossRef] [Scilit]
- Taherymoosavi, S.; Verheyen, V.; Munroe, P.; Joseph, S.; Reynolds, A. Characterization of organic compounds in biochars derived from municipal solid waste. Waste Manag. 2017, 67, 131–142. [Google Scholar] [CrossRef] [Scilit] [PubMed]
- Chen, P.; Yang, R.; Pei, Y.; Yang, Y.; Cheng, J.; He, D.; Huang, Q.; Zhong, H.; Jin, F. Hydrothermal synthesis of similar mineral-sourced humic acid from food waste and the role of protein. Sci. Total Environ. 2022, 828, 154440. [Google Scholar] [CrossRef] [Scilit] [PubMed]
- Demir, Z.; Bozkurt, P.A. Co-pyrolysis of agricultural biomass for potentially functional biochar: Combined influence of both feedstocks and structural characterization. Sci. Rep. 2026, 16, 10947. [Google Scholar] [CrossRef] [Scilit] [PubMed]
- Chen, C.; Sun, K.; Huang, C.; Yang, M.; Fan, M.; Wang, A.; Zhang, G.; Li, B.; Jiang, J.; Xu, W. Investigation on the mechanism of structural reconstruction of biochars derived from lignin and cellulose during graphitization under high temperature. Biochar 2023, 5, 51. [Google Scholar] [CrossRef] [Scilit]
- Müller, M.; Poschmann, M.; Leutzsch, M.; Hetaba, W.; Weyhermüller, T.; Caidi, A.; Radev, I.; Tschulik, K.; Heumann, S. Mechanistic insights into hydrothermal carbon formation: From biomass to pyrolyzed carbons with enhanced interparticle connectivity for energy-related applications. Green Chem. 2026, 28, 9420–9437. [Google Scholar] [CrossRef] [Scilit]
- Dehmani, Y.; Ed-Dra, A.; Zennouhi, O.; Bouymajane, A.; Filali, F.R.; Nassiri, L.; Abouarnadasse, S. Chemical characterization and adsorption of oil mill wastewater on Moroccan clay in order to be used in the agricultural field. Heliyon 2020, 6, e03164. [Google Scholar] [CrossRef] [Scilit] [PubMed]
- Li, X.; Yu, Y.; He, R.; Zhen, Q.; She, D. Mechanistic insights into cadmium removal from environmental waters using silicon-enhanced lignin-derived hydrochar and pyrochar. Sep. Purif. Technol. 2025, 355, 129727. [Google Scholar] [CrossRef] [Scilit]
- Abouelenein, M.G.; Elfattah, M.A.; Safan, N.M.; Abdelfatah, A.T.; El-Shamy, O.A.; Abdeen, M.M. Waste-derived nano-Al2O3-loaded pyranopyrazole composite for high-capacity cadmium and methylene blue removal with mechanistic and DFT validation. Sci. Rep. 2026, 16, 8720. [Google Scholar] [CrossRef] [Scilit] [PubMed]
- Pan, S.; Huang, Y.; Zhou, W.; Ge, F.; Zhu, L. FeC2O4-ball milled biochar for simultaneous removal of cadmium and tetracycline: A strategy coupling oxygen vacancies with carboxyl groups. Colloids Surf. A Physicochem. Eng. Asp. 2026, 738, 139999. [Google Scholar] [CrossRef] [Scilit]
- Liu, Y.; Song, M.; Zhu, Y.; Zhai, Y.; Xing, Y. Hydrochar Production from Co-Hydrothermal Carbonization of Corn Straw and Brewer’s Spent Grain: Nitrogen Behavior and Mechanisms of Cd2+ Adsorption for Environmental Remediation. Biocatal. Agric. Biotechnol. 2026, 73, 104016. [Google Scholar] [CrossRef] [Scilit]
- Han, X.; Wang, Z.; Lu, N.; Tang, J.; Lu, P.; Zhu, K.; Guan, J.; Feike, T. Comprehensive study on the hydrochar for adsorption of Cd (II): Preparation, characterization, and mechanisms. Environ. Sci. Pollut. Res. 2023, 30, 64221–64232. [Google Scholar] [CrossRef] [Scilit] [PubMed]
- Simić, M.; Koprivica, M.; Dimitrijević, J.; Ercegović, M.; Anđić, D.; Fiol, N.; Petrović, J. Valorization of corn processing waste as adsorbents for soil and water remediation: A systematic and comparative review of native biomass, hydrochar, and biochar. Processes 2026, 14, 1376. [Google Scholar] [CrossRef] [Scilit]
- Meftah, N.; Mahboub, M.S. Spectroscopic characterizations of sand dunes minerals of El-Oued (Northeast Algerian Sahara) by FTIR, XRF and XRD analyses. Silicon 2020, 12, 147–153. [Google Scholar] [CrossRef] [Scilit]
- Pydi, H.P.; Sri, M.N.S.; Anusha, P.; Karumuri, S.; Gupta, D. Walnut shell–rice husk hybrid adsorbent for efficient phenol removal: Characterization, kinetics, and neural network prediction. Results Eng. 2025, 28, 107837. [Google Scholar] [CrossRef] [Scilit]
- Valentim, B.; Białecka, B.; Gonçalves, P.A.; Guedes, A.; Guimarães, R.; Cruceru, M.; Całus-Moszko, J.; Popescu, L.G.; Predeanu, G.; Santos, A.C. Undifferentiated inorganics in coal fly ash and bottom ash: Calcispheres, magnesiacalcispheres, and magnesiaspheres. Minerals 2018, 8, 140. [Google Scholar] [CrossRef] [Scilit]
- Kanafin, Y.N.; Turpanova, R.; Beisekova, M.; Poulopoulos, S.G. Sewage Sludge Biochar as a Persulfate Activator for Methylene Blue Degradation. Clean Technol. 2025, 7, 74. [Google Scholar] [CrossRef] [Scilit]
- Raj, R.; Greeshma, S.; Sharaf, S.; Chatterjii, N.S.; Arputharaj, A.; Laly, S.; Asha, K. Valorization of Sargassum wightii through biochar production: Development, characterization, and potential applications. Sci. Rep. 2026, 16, 17055. [Google Scholar] [CrossRef] [Scilit] [PubMed]
- Algethami, J.S.; Alhamami, M.A.; Alqadami, A.A.; Melhi, S.; Seliem, A.F. Adsorptive performance of a new magnetic hydrochar nanocomposite for highly efficient removal of cadmium ions from water: Mechanism, modeling, and reusability studies. Environ. Technol. Innov. 2023, 32, 103404. [Google Scholar] [CrossRef] [Scilit]
- Ge, Q.; Tian, Q.; Wang, S.; Zhang, J.; Hou, R. Highly efficient removal of lead/cadmium by phosphoric acid-modified hydrochar prepared from fresh banana peels: Adsorption mechanisms and environmental application. Langmuir 2022, 38, 15394–15403. [Google Scholar] [CrossRef] [Scilit] [PubMed]
- Ji, L.; Yu, Z.; Cao, Q.; Gui, X.; Fan, X.; Wei, C.; Jiang, F.; Wang, J.; Meng, F.; Li, F. Effect of hydrothermal temperature on the optical properties of hydrochar-derived dissolved organic matter and their interactions with copper (II). Biochar 2024, 6, 64. [Google Scholar] [CrossRef] [Scilit]
- Hua, Y.; Zheng, X.; Xue, L.; Han, L.; He, S.; Mishra, T.; Feng, Y.; Yang, L.; Xing, B. Microbial aging of hydrochar as a way to increase cadmium ion adsorption capacity: Process and mechanism. Bioresour. Technol. 2020, 300, 122708. [Google Scholar] [CrossRef] [Scilit] [PubMed]
- Wang, B.; Shang, C.; Xie, H.; Sun, H.; Zhang, Q.; Xue, L.; Tack, F.M.; Hou, D.; Feng, Y.; Rinklebe, J. Unraveling natural aging-induced properties change of sludge-derived hydrochar and enhanced cadmium sorption site heterogeneity. Biochar 2022, 4, 34. [Google Scholar] [CrossRef] [Scilit]
- Turner, M.J.; McKinnon, J.J.; Jayatilaka, D.; Spackman, M.A. Visualisation and characterisation of voids in crystalline materials. CrystEngComm 2011, 13, 1804–1813. [Google Scholar] [CrossRef] [Scilit]
- Funke, A.; Ziegler, F. Hydrothermal carbonization of biomass: A summary and discussion of chemical mechanisms for process engineering. Biofuels Bioprod. Biorefining 2010, 4, 160–177. [Google Scholar] [CrossRef] [Scilit]
- Sharma, H.B.; Panigrahi, S.; Dubey, B.K. Food waste hydrothermal carbonization: Study on the effects of reaction severities, pelletization and framework development using approaches of the circular economy. Bioresour. Technol. 2021, 333, 125187. [Google Scholar] [CrossRef] [Scilit] [PubMed]
- Bandosz, T.J.; Jagiełło, J.; Putyera, K.; Schwarz, J.A. Pore structure of carbon−mineral nanocomposites and derived carbons obtained by template carbonization. Chem. Mater. 1996, 8, 2023–2029. [Google Scholar] [CrossRef] [Scilit]
- Dun, W.; Guijian, L.; Ruoyu, S.; Xiang, F. Investigation of structural characteristics of thermally metamorphosed coal by FTIR spectroscopy and X-ray diffraction. Energy Fuels 2013, 27, 5823–5830. [Google Scholar] [CrossRef] [Scilit]
- Zhao, L.; Zha, Y.; Miao, W.; Wang, B.; Han, Y.; Tang, J. Regulation of pyrolysis temperature on the structural evolution of maize stover biochar and its mechanism of Cd2+ adsorption. Front. Environ. Sci. 2026, 14, 1815592. [Google Scholar] [CrossRef] [Scilit]
- Lian, F.; Xing, B. Black carbon (biochar) in water/soil environments: Molecular structure, sorption, stability, and potential risk. Environ. Sci. Technol. 2017, 51, 13517–13532. [Google Scholar] [CrossRef] [Scilit] [PubMed]
- Adeida, L.; Benguella, B.; Benamar, M.; Kamel, A.H. Sustainable and eco-friendly removal of 2, 4, 6-tricholorophenol from water using an acid-activated bio-waste/graphene oxide composite. RSC Adv. 2025, 15, 23477–23487. [Google Scholar] [PubMed]
- Butt, T.A.; Abbas, I.; Afzal, M.Y.; Bilal, M.; Al-Naghi, A.A.A.; Iqbal, A.; Saeed, S.; Khan, A.H.A.; Toqeer, M.; Yousaf, S. Magnetic cellulose from Cedrus deodara sawdust for Cd (II) removal: Synthesis, characterization, and adsorption performance. Sci. Rep. 2026, 16, 19216. [Google Scholar] [CrossRef] [Scilit] [PubMed]
- Raheem, S.A.; Mohammed, A.A. Adsorptive Removal of Cd (II) Ions using Core-Shell Polystyrene@ NiFeAl-LDH Nanocomposite: Optimization, Isotherm, and Kinetics Study. Bull. Chem. React. Eng. Catal. 2026, 21, 51–67. [Google Scholar] [CrossRef] [Scilit]
- Juturu, R.; Vinayagam, R.; Murugesan, G.; Selvaraj, R. Mesoporous hydrochar from Acacia falcata leaves by hydrothermal process for hexavalent chromium adsorption. Sci. Rep. 2025, 15, 12670. [Google Scholar] [CrossRef] [Scilit] [PubMed]
- Durak, H.; Yarbay, R.; Atilgan Türkmen, B. Hydrothermal carbonization of biomass for hydrochar production: Mechanisms, process parameters, and sustainable valorization. Processes 2026, 14, 339. [Google Scholar] [CrossRef] [Scilit]
- Gupta, V.K. Equilibrium uptake, sorption dynamics, process development, and column operations for the removal of copper and nickel from aqueous solution and wastewater using activated slag, a low-cost adsorbent. Ind. Eng. Chem. Res. 1998, 37, 192–202. [Google Scholar] [CrossRef] [Scilit]
- Zhang, Q.; Lin, Z.; Cai, Q.; Han, D.; Luo, L.; Fan, M.; Zeng, Q.; Zhao, W. Potassium-salt activation of chestnut tannin-derived hydrochar toward hierarchical porous carbon nanoarchitectonics for aqueous supercapacitors. Biomass Bioenergy 2027, 216, 109705. [Google Scholar] [CrossRef] [Scilit]
- Huang, Y.; Yang, X.; Liu, P.; Chen, X.; Zhu, H.; Wang, C.; Wen, Y.; Shang, Q. Thermally activated serpentine: A dual-function adsorbent for simultaneous heavy metal immobilization and soil pH regulation in acidified agricultural systems. Pedosphere 2026, in press. [Google Scholar] [CrossRef] [Scilit]
- Meng, P.; Zhou, Q.; Zhang, N.; Zhang, L.; Zheng, L. Aqueous-phase fabrication of cellulose-mineral composites with enhanced Cd (II) adsorption and mechanistic insights. Ind. Crops Prod. 2025, 237, 122133. [Google Scholar] [CrossRef] [Scilit]
- Tachibana, A.; Yoshioka, S.; Rocky, M.M.H.; Ni, S.; Ikhsani, I.Y.; Idrus, F.A.; Wong, K.H.; Mashio, A.S.; Hasegawa, H. Diatomite-Assisted Sorption of Humic Acid from Environmental Waters: Kinetics and Interparticle Diffusion in a Highly Porous Material. Chem. Eng. J. Adv. 2026, 27, 101228. [Google Scholar] [CrossRef] [Scilit]
- Singh, H.O.; Vinayagam, R.; Selvaraj, R. Recent Advances in Biomass-Derived Activated Carbon and Biochar for Tetracycline Removal from Water: A Comprehensive Review. ACS Omega 2026, 11, 33305. [Google Scholar] [CrossRef] [Scilit] [PubMed]
- Yilmaz, N. Eco-friendly activated carbon derived from pomegranate peel for amoxicillin removal: Batch adsorption, kinetic modeling, and thermodynamics. Sci. Rep. 2026, 16, 18676. [Google Scholar] [CrossRef] [Scilit] [PubMed]
- Zafar, S.; Khan, M.I.; Khraisheh, M.; Shahida, S.; Javed, T.; Mirza, M.L.; Khalid, N. Use of rice husk as an effective sorbent for the removal of cerium ions from aqueous solution: Kinetic, equilibrium and thermodynamic studies. Desalin. Water Treat. 2019, 150, 124–135. [Google Scholar] [CrossRef] [Scilit]
- Myszka, D.G. Kinetic, equilibrium, and thermodynamic analysis of macromolecular interactions with BIACORE. Methods Enzymol. 2000, 323, 325–340. [Google Scholar] [CrossRef] [Scilit] [PubMed]
- Ma, J.; Luo, H.; Li, Y.; Liu, Z.; Li, D.; Gai, C.; Jiao, W. Pyrolysis kinetics and thermodynamic parameters of the hydrochars derived from co-hydrothermal carbonization of sawdust and sewage sludge using thermogravimetric analysis. Bioresour. Technol. 2019, 282, 133–141. [Google Scholar] [CrossRef] [Scilit] [PubMed]
- Prochowicz, D.; Kornowicz, A.; Lewiński, J. Interactions of native cyclodextrins with metal ions and inorganic nanoparticles: Fertile landscape for chemistry and materials science. Chem. Rev. 2017, 117, 13461–13501, Erratum in Chem. Rev. 2018, 118, 5264. https://doi.org/10.1021/acs.chemrev.8b00224. [Google Scholar] [CrossRef] [Scilit] [PubMed]

Disclaimer/Publisher’s Note: The statements, opinions and data contained in all publications are solely those of the individual author(s) and contributor(s) and not of MDPI and/or the editor(s). MDPI and/or the editor(s) disclaim responsibility for any injury to people or property resulting from any ideas, methods, instructions or products referred to in the content. |
© 2026 by the authors. Licensee MDPI, Basel, Switzerland. This article is an open access article distributed under the terms and conditions of the Creative Commons Attribution (CC BY) license.