


Abstract
Groundwater is one of the basic requirements for life, economic and social developments in the Bazo River catchment, Rift Valley, Southern Ethiopia. In the study area, availability of water is faced with several problems, such as quality issues due to high levels of fluoride in some samples, spring scarcity in the lowlands, unprotected river water used for drinking, and high demand for good quality water. The aim of this study was to investigate the hydrogeochemical characteristics and to evaluate groundwater quality for domestic and irrigation uses. Thirty-four primary groundwater samples were collected from the field and analyzed in the water quality lab of Arba Minch University. Two water quality indices (WQI and EWQI), a variety of irrigation water quality indices, and GIS-based spatial analysis were utilized in this study. Cations were present in the descending order of Na > Ca > Mg > K > Fe, and anions were HCO3− > Cl > SO4 > NO3− > F. Excepting two samples (BH8 and SP3), the water samples were acceptable for drinking. Sodium, TDS, and fluoride levels were over the limit of drinking water in BH8 and SP3. Rock–water interaction, cation exchange, and silicate mineral weathering were the main hydrogeochemical reactions that controlled groundwater composition in the area, based on Gibb’s diagram, chloro-alkaline indices, and major ions ratios. Groundwater facies were identified as Ca.HCO3, Na.HCO3 and mixed Ca-Na/Ca.Mg.Na.HCO3 types using a Piper plot. The water quality index was computed, and its spatial variations were mapped using GIS. About 82.35% of groundwater samples were excellent for drinking use and 94.12% (SAR) of groundwater were acceptable for irrigation. These study results are useful to help develop inclusive strategies and interventions to address groundwater quality aspects in the study area, underlining the significance of managing and monitoring water resources. The findings underscore the need for effective management and monitoring strategies to ensure sustainable groundwater resources in the Bazo River catchment.
1. Introduction
In conjunction with surface water, groundwater resources are an essential natural resource for drinking, irrigation, and industrial development globally [1,2]. Groundwater quality is very important for various purposes [3,4]. Natural factors, including geology, mineral composition, mineral dissolution and precipitation, and climatic conditions, significantly influence groundwater quality on a global scale [5,6]. The interaction of water with rocks can lead to the dissolution of various rock-forming compounds in groundwater [7], triggering natural groundwater quality challenges when mineral levels exceed the standard limit. Human activities such as changes in land use and land cover can affect groundwater quality. Thus, regular monitoring of groundwater resources worldwide is essential to ensure the sustainable cleanliness and safety of water for human use [8,9].
In rural and urban areas of Ethiopia, groundwater plays a key role in safeguarding the community’s water demands [10,11]. In Ethiopia, more than 70% of the community’s life span depends on groundwater, which is a strategic resource across all climatic regions [12]. However, in Ethiopia, access to clean drinking water is among the lowest in sub-Saharan Africa [11,13,14]. Unprotected and contaminated seasonal ponds, rivers, streams, and springs are common in Ethiopia. Moreover, agricultural expansion, rapid urbanization, and industrialization have caused groundwater quality degradation in various areas of Ethiopia [5,15,16].
Globally, scholars have used hydrochemical properties extensively to determine groundwater quality, origin, and evolution [17,18,19]. Similarly, hydrochemical signatures were applied to assess groundwater quality for drinking and irrigation purposes in several regions of Ethiopia [20,21,22,23]. During the investigation, field measurements, laboratory analyses of physicochemical parameters, comparisons with WHO standards, and calculations of water quality indices were used to assess the quality of groundwater for drinking use by the authors. Irrigation water quality indicators were similarly examined in Ethiopia using parameters such as permeability index (PI), residual sodium carbonate (RSC), sodium absorption ratio (SAR), magnesium hazard (MH), and sodium percentage (Na %) [6,16,21,22,23].
Furthermore, ArcGIS has been applied to map spatial variability in groundwater quality and to establish groundwater monitoring networks [6,16]. In addition, the water quality index (WQI) method can provide comprehensive information on water quality to determine whether water is suitable for different uses [24,25]. Furthermore, several researchers have assessed groundwater quality for drinking purposes using the entropy-weighted water quality index (EWQI) method [26]. These two methods, subjective and objective, were used to obtain composite quality values in this study. However, several factors may affect water quality when assessing and ranking water quality status using water quality index methods [17,26].
Prior research in the Rift Valley of Southern Ethiopia highlighted the need for detailed groundwater quality studies to ensure its suitability for a wide range of benefits [5,7,27]. These previous studies also outlined that the decline in groundwater quality in the Southern Rift Valley Lakes Basin (SRVLB), Ethiopia, including the Bazo River catchment, was caused by geological factors (rock composition, volcanic activity, high fluoride levels, and salinity), and anthropogenic factors. For instance, the fluoride concentration is a quality concern in the Bilate River sub-basin [7]. Even though the SRVLB of Ethiopia is one of the locations where groundwater is heavily used for various services [7,16], the quality of the groundwater in various areas of these lake basins has declined due to agricultural expansion, rapid urbanization, and population growth.
The Bazo River catchment, the portion of the Rift Valley in Southern Ethiopia, is an essential geological area where communities depend on GW for drinking water as well as on surface water resources for irrigation in some villages, similarly to the Abaya and Chamo Basins [28]. Still, spring occurrences are lacking for domestic use in the lowland portions, as observed in the field. Although springs are scarce in lowlands, there are several springs in the highlands and escarpments. However, their quality status was hardly documented before this study. The conjugate application of surface water and groundwater for irrigation is uncommon to overcome seasonal variations in the Bazo River catchment. Potable drinking water coverage is insignificant in the lowland areas of the Bazo River catchment. Many communities have been using the unprotected Bazo and Bara Rivers (tributaries) for drinking water due to a lack of spring water in the lowland areas, which may cause health problems in the area. In general, there is a lack of comprehensive information on hydrogeochemical characteristics, overall groundwater quality for irrigation and drinking purposes, and its spatial variation in this catchment. Thus, the purpose of this research was to investigate the hydrogeochemical characteristics and evaluate the groundwater quality using hydrochemical signatures, WQI, entropy-weighted water quality index (EWQI), and a GIS-based spatial analysis tool in the catchment.
The results of this study may help develop sustainable groundwater management plans and provide an overview of the current quality status of groundwater resources in the region. It can provide a scientific basis for designing targeted risk-reduction interventions and for ensuring the sustainable and safe use of groundwater resources in the area. Water well drillers, water supply officers, and decision-makers can use the results of this research when working on community water quality.
2. Materials and Methods
2.1. Description of the Study Area
The study area is located to the south, about 605 km from Addis Ababa. Figure 1 shows the Bazo River catchment, located in the Southern Rift Valley Lakes Basin of Ethiopia. The area covers portions of the Gamo, Gofa, and South Omo zones, including parts of the Kamba, Garda Marta, Zala, Male, and Beto districts (Figure 1). The lowland areas of this catchment are known for drought incidences [29]. The study area is found between 36°37′34″ to 37°18′35″ E longitude and 5°1′35″ to 6°19′41″ N latitude. The catchment area is 2717.4 km2, with a perimeter of 291.5 km. The lowest and the highest elevations of the study area are 681 m and 3548 m, respectively.
Figure 1.
Map of location, drainage and sampling points.
The Bazo River catchment comprises the Bara (Korzha, Bayo and Goymo), Kabanie, Matsinie, Worza, Bolola, Badhikaro, and Gedyndo tributaries, draining from the Kamba and Garda Marta districts. In contrast, the Gonka is the larger tributary draining the Beto district. The Gonka River has many tributaries, including the Lomoto and Bato rivers. These Rivers are the main contributors to the Bazo River during rainy seasons, including portions of the Gamo, South Omo, and Gofa Zones in the South Regional State of Ethiopia. The Korzha watershed drains to the Bazo River basin from the mountain ranges of the Kamba highlands in the Gamo Zone. The Korzha River starts in the south of Mount Guge, the highest peak in the Gamo Zone of South Ethiopia. Gonka starts from the Gofa Zone (Somba and Shengama) highlands. Spring occurrences are the main sources of these rivers in the highlands of the Shangama and Kamba mountain ranges.
2.2. Geology and Hydrogeology of the Area
The Rift Valley Lakes Basin of Ethiopia’s geological formation is distinguished by a complex structure that influences the hydrogeological conditions of southern Ethiopia in general and the Bazo catchment in particular [30]. The basin is composed of alluvial deposits, volcanic rocks, metamorphic rocks (the Konso and Yavello groups), and sedimentary rocks (Amaro red sandstone in the Amaro area). These rock units are essential for groundwater storage and movement [31,32]. Similarly, the igneous rocks, Quaternary deposits, and basement formations (metamorphic rocks) comprise the geology of the Bazo River catchment [29,33,34].
The primary determinants of groundwater composition are geological formations [20,27,30,31]. Several rock types have been distinguished in the Bazo River catchment according to Ethiopian geological survey data, field observations, and the World Geology Shapefile from the USGS website (Figure 2). They include Quaternary deposits, Tertiary igneous/volcanic rocks, Archean metamorphic rocks, and sandstone in some areas [32]. The Quaternary deposits (Q) are mainly alluvial deposits of sand, silt, and clay. They are first-interest zones for groundwater potential. The igneous rocks are granite, rhyolite, ignimbrite, basalt, and tuffaceous and pyroclastic materials in some locations. They are fractured, weathered, and disturbed by tectonic activities. Sandstone was found linked with this rock type on the eastern side of Kamba town [32].
Figure 2.
Simplified geological map modified after [28] and field observation.
The metamorphic rocks in the study area are grouped into three; namely the Archean Konso group (ARk), the Archean Alaghe group (ARI), and the Archean Yavello group (ARy) (Figure 2). The Konso group is located on the southeastern edges of the Bazo River catchment. This group contains hornblende, garnet-pyroxene, pyroxene gneiss, granulite, and migmatite of meta-sedimentary gneisses. The Alaghe group covers ridges in the south-tip and central portions of the research region. They include hornblende gneiss, biotite gneiss, migmatite, and granulite with small meta-sedimentary gneiss. The Yavello group occupies parts of the southwestern and western areas. They are quartz-feldspathic gneiss and granulite. The granite rock (gt1) is found in this area.
The hydrogeology of the Ethiopian Rift Valley Basin is controlled by different lithological units, geomorphology, and climate conditions that may collectively determine the quality of the groundwater resource [33,34]. The geologic features of the rift affect water circulation and the presence of water in the aquifers, and these hydrogeological conditions are essential for understanding GW resources effectively [35]. The fractured flood basalt lithological units are productive for Kamba town’s good spring discharges (3.4 L/s), and it is reliable for piped potable drinking water supply. A sufficient amount of groundwater is stored and produced by Quaternary deposits in the Gofa Basin in the lowlands (in Bato town and its surroundings), and highly weathered and fractured igneous rocks in the highlands such as the Shangama and Kamba ranges. This location is dominated by geologic structures such as faults, joints, and irregular fractures [36]. Conversely, intact or massive rock types have lower groundwater storage, transmissivity, storativity, yields, and hydraulic conductivity. The Quaternary deposit (Q) shows better groundwater availability and good productivity due to its permeability and interconnected porosity [11]. In general, it is believed that fractured and weathered igneous rocks and Quaternary deposits have a high success rate for borehole drilling in southern Ethiopia, including the study area [28,37]. Moreover, these lithological units are very good aquifers for groundwater, as indicated by researchers’ field observations and well completion reports.
The lithological legend on the map: ARY is Archean Yavello group metamorphic rock, ARI is Archean Alaghe group, ARk is Archean Konso group, gt1 is pre-tectonic and syn-tectonic granite, Pjb is flood basalt, and Q is Quaternary undifferentiated alluvial deposits of sand, silt, and clay.
2.3. Data Collection and Analyses
The primary groundwater samples were collected in the field for laboratory analysis using a purposive sampling technique. Polyethylene sampling bottles were used to collect the samples; the water was filled into the bottles, and the bottles were carefully tightened with double-sealed plastic caps. A total of 34 water samples were collected from representative 10 boreholes, 10 shallow wells, and 14 springs across the study area, considering geological formations, land-use conditions, and geographic settings (highland, escarpment, and rift floor). The sampling frequency was twice as often during the dry season (January 2025) and the wet season (April 2025), given the climate context of the southern Rift Valley of Ethiopia. Climatic conditions can influence the concentration of ions and the chemistry of groundwater. When the sampling time is compared with monthly precipitation, January is the dry period, whereas April is the wet season in the study area [38]. Groundwater quality might be altered during these two seasons, so we carried out sampling and studied it. The water sampling protocol was followed during data collection and analysis. Then, hydrochemical parameters were analyzed according to the American Public Health Association in the Arba Minch University (AMU) water quality analysis lab.
The physicochemical parameters, such as temperature, hydrogen ion concentration, electrical conductivity, and total dissolved solids, were measured in situ in the field using a multi-parameter VWR Symphony SP90M5. The concentrations of major ions such as sodium (Na+), potassium (K+), calcium (Ca2+) and magnesium (Mg2+) and the concentrations of the anions sulfate (SO4−2), bicarbonate (HCO3−), chloride (Cl−), nitrate (NO3− as N), and fluoride (F−) were determined in water quality laboratory of Arba Minch University (AMU), Ethiopia.
Sodium (Na+) and potassium (K+) ions were identified using a flame photometer. Using the EDTA titration method, the levels of calcium and magnesium ions were determined. Total hardness (TH) was calculated from the calcium (Ca2+) and magnesium (Mg2+) relationship using Equation (1). The HCl titration approach was used to determine the bicarbonate (HCO3) concentration. The concentration of the chloride (Cl−) ion was determined by argentometric titration. The concentration of the sulfate (SO4) ion was determined using a UV spectrophotometer. The cadmium column reduction technique was used to determine the NO3 ion. The Dr-2800 spectrophotometry method was used to analyze fluoride and iron concentrations.
2.4. Accuracy Checking
The balance of errors for cations and anions was computed to ensure the correctness of hydrochemical analyses. The values of cations and anions were converted to meq/L from mg/L before calculating the ionic balance errors. In this study, all analyzed ionic balance errors were less than <±7% as computed using Equation (2). In general, the preferable limits of the ionic balance error percentage (IBE %) are <±5%, and the acceptable limits are <±10%.
2.5. Parameter Mapping and Data Interpretation
ArcGIS 10.8.2 was used to map spatial data on water quality parameters. On the other hand, the Aquachem 2024 software was used to interpret the water quality data/parameters. Aquachem is software used by hydrogeologists, environmental scientists, and water managers to analyze and interpret hydrochemical data [39], developed by Waterloo Hydrogeology. It provides tools for the management, visualization, and manipulation of hydrochemical datasets, including the Piper and Stiff Diagrams for graphically representing groundwater composition. The software supports statistical analysis, integration with geochemical modeling, and automatic reporting, enabling users to assess groundwater quality, identify pollutant sources, and characterize groundwater [40]. A Piper diagram was applied to identify GW types using ion concentrations of water collected throughout the study region from various sources [7,41]. A box-and-whisker plot was also employed to visually depict the variations of ion concentrations (both cations and anions) of samples within the research region.
2.6. Characterizing Hydrogeochemical Processes
Hydrogeochemical processes in the study area were explained using Excel 2024 software by applying the Gibbs diagram, chloro-alkaline indices, and major ion ratio plots. The major ion ratio plots show the proportional relationships among the main ions dissolved in groundwater. They are crucial techniques for determining the dominant geochemical processes and interpreting changes in water composition [42]. Researchers can ascertain the origin, evolution, and quality of groundwater by examining geochemical processes to better understand the sources of GW’s hydrochemical composition [27].
When rock and water interact, a variety of geochemical processes take place, such as ion exchange, hydrolysis, oxidation-reduction, adsorption/desorption, and dissolution/precipitation [27,34,43,44,45]. Among the many processes that control groundwater chemistry, ion exchange (Na+ and K+ with Ca2+ and Mg2+), evaporation, silicate weathering, and carbonate mineral dissolution are known [26,31,46]. The water quality is influenced by the interaction of GW and aquifer minerals, which is important for determining the origin of GW and the sources of natural contaminants [7,27].
Since its introduction, the Gibbs’ diagram has been widely used to diagnose natural processes: precipitation, rock–water interaction, and evaporation, which control groundwater geochemistry [8,9,17,46,47]. The connection between groundwater chemistry and aquifer lithology is clearly displayed by the Gibbs plot [48]. Hence, the ratios of and as a function of TDS were utilized in this study to illustrate the general mechanisms of groundwater evolution including precipitation, rock–water interaction, and evaporation dominance status.
Furthermore, the occurrence of cation exchange reactions has been examined using the two chloro-alkaline indices (CAI-I and CAI-II) [7,48,49], and the ion exchange in the study area was described using the indices. When Na+ is exchanged for Ca2+ or Mg2+ from the aquifer matrix, both indices should be positive; conversely, when Ca2+ or Mg2+ is exchanged for Na+ from the aquifer matrix, the indices should be negative. The chloro-alkaline indices are given in meq/L and can be computed using Equations (3) and (4), as indicated in previous works [7,23].
Additionally, to gain a deeper understanding of rock–water interactions in the study area, ratio plots of major ions and their correlations with bicarbonate were prepared. When silicate minerals are hydrolyzed, cations like Ca2+, Mg2+, K+, and Na+, as well as the balancing bicarbonate ion, may be released into the groundwater [7,23]. The relation between bicarbonate (HCO3−) and cationic species [Ca2+ + K+ + Mg2+ + Na+] may indicate that the bicarbonate anion primarily balances the cations, which would support the idea that silicate hydrolysis is the most governing hydrochemical process.
Moreover, the source of sodium-releasing minerals in the groundwater was inferred by computing the ratio of sodium ion to chloride ion concentration (Na/Cl). The result can be interpreted as the release of Na+ from a silicate mineral when the Na+ to Cl− ratio is greater than one (Na/Cl > 1) [27,50]. When the sodium-to-chloride ratio is roughly equal to one (Na/Cl ≈ 1), it shows that halite dissolution is the primary source of Na+, whereas a ratio less than one (Na/Cl < 1) suggests that the sodium ion is derived from man-made sources.
2.7. Drinking Water Quality Index
Based on hydrochemical data analysis, the suitability of groundwater for drinking has been evaluated [9,21,51,52,53]. The results were compared and discussed using other scientific findings and WHO drinking water quality standards. To illustrate the spatial variations in groundwater quality in the Bazo River catchment, a quality index was computed, and the cumulative result was mapped. During weight assignment in step 2, two approaches were followed: first, the previous literature was considered; second, the advice and opinions of three senior experts were followed based on the types of ions that may influence human health when consumed at high concentrations. The following six steps have been used to calculate the arithmetic mean water quality index (WQI) for drinking water.
- Step 1: Choosing the parameters.
- Step 2: Weights (Wi) were assigned on a scale of 1 to 5 based on the parameter’s significance for groundwater quality.
- Step 3: The relative weights (RWi) were calculated using Equation (5).where n is the number of parameters, Wi refers to the weight of each parameter, and RWi denotes the relative weight.
- Step 4: The quality rating scale (Qi) was computed using Equation (6), with ion concentration (Ci) in mg/L and the WHO standards (Si) for each parameter in mg/L.
- Step 5: Computing the sub-index (SIi) for each parameter using this Equation.
- Step 6: Sum all sub-indices (SIi) to get composite results of WQI by applying Equation (8).
Here, the water quality index (WQI) was classified as WQI < 50, 50 WQI < 100, 100 WQI < 200, 200 WQI < 300, and WQI > 300, corresponding to excellent, good, poor, extremely poor, and unsuitable for drinking, respectively [9,21].
2.8. Entropy-Weighted Water Quality Index (EWQI)
The EWQI is used to assess groundwater quality because it avoids bias from the researcher during parameter weighting. Several researchers applied this approach to evaluate groundwater quality [46,54]. This method classifies entropy-weighted water quality indices (EWQI) as EWQI < 50, 50 < EWQI < 100, 100 < EWQI < 150, 150 < EWQI < 200, and EWQI > 200, corresponding to excellent, good, poor, extremely poor, and extremely hard for drinking, respectively [46]. Six steps are also followed in this to get the dimensionless quality index.
- Step 1: Parameter selection.
- Step 2: Calculate the ratio of the difference between each value of the parameters and the minimum value of the sample result to the maximum value minus the minimum value of the parameter (Equation (9)) to get Eigenvalue matrix values (Equation (10)).where m is the number of parameters; n is the number of parameters for a sample; yij refers to the parameter value of j for sample i, (yij)max is the maximum value of the parameter in the sample; (yij)mini is the minimum value of the parameter in the sample; and Z denotes the standardized matrix.
- Step 3: Normalizing hydrochemical data (Equation (11)) to get Entropy values using Equation (12).where Pij indicates the ratio of parameter j of sample i, Ej stands for the information entropy of parameter j, and wj denotes the entropy weight of parameter j.
- Step 4: Computing the entropy weight from the entropy values by applying Equation (13).
- Step 5: Calculating quality rating scale (Equation (14)).where Qi is the scale of quality rating, Ci is each sample parameter value; Sj is each parameter permissible limit by WHO (World Health Organization).
- Step 6: Calculating the entropy-weighted water quality index (EWQI) using Equation (15).
2.9. Irrigation Water Quality Parameters
To investigate groundwater quality for irrigation use, indices including the sodium absorption ratio (SAR), residual sodium bicarbonate (RSC), magnesium hazard index (MH), sodium percentage (Na %), and the permeability index (PI) were used. To calculate these indices, each ion concentration was first converted from mg/L to meq/L. Generally, the mineral composition of the soil and plant species determines groundwater quality for irrigation [23,55]. Low productivity may be the result of excessive dissolved ions in irrigation water, which affects plants and agricultural soils chemically and physically.
The sodium adsorption ratio (SAR) is an indicator used to determine whether water is suitable for irrigation or not (SAR) [56]. It evaluates the relative amounts of sodium, calcium, and magnesium ions to determine the sodium hazard in irrigation water using Equation (16) as:
The potential for magnesium adsorption in soils is indicated by the magnesium adsorption ratio (MAR) [57]. This aids in determining the suitability of groundwater for irrigation use. The elevated magnesium levels may adversely affect soil structure and plant growth. When MAR is high, there is a greater chance that the irrigation water may degrade the soil and lower crop yields. MAR is determined by Equation (17).
Sodium content in the water can be evaluated using the sodium percentage (Na %) [57,58]. In relation to other cations, such as calcium and magnesium, it provides information on the relative contribution of sodium. Elevated sodium level in groundwater can negatively impact soil structure, resulting in decreased permeability and heightened vulnerability to erosion. The Na % is computed using Equation (18).
Soil acidity or alkalinity can result due to residual sodium bicarbonate (RSC). In relation to the total of calcium and magnesium ions, RSC indicates the excess or deficiency of bicarbonate ions [59]. An excess of bicarbonate ions, which can cause soil alkalinity and hinder plant growth, is indicated by a positive residual sodium bicarbonate value. Conversely, a negative RSC value shows bicarbonate ion deficiency, which may lead to acidity in the soil. RSC is given in Equation (19).
Permeability is an important irrigation water quality parameter used to assess the impact of long-term agricultural practices on soil hydraulic properties. The value of the permeability index in groundwater can cause soil erosion or dispersion. Permeability index can be calculated as the ratio of sodium to the square root of bicarbonate concentration, divided by the sum of sodium, magnesium, and calcium ion concentrations [60]. PI could be computed using Equation (20):
The United States soil laboratory (USSL) diagram was used to plot sodium absorption ratio versus electrical conductivity (SAR vs. EC) to indicate the alkalinity or salinity hazard status for irrigation water use. The plot of sodium percentage against electrical conductivity is used to show agricultural water quality [61]. Table 1 presents irrigation water standards, and Figure 3 shows the workflow chart for the methodology used in the present study.
Table 1.
Irrigation water quality indices and standards [24,56,57,62].
Figure 3.
Flow chart of hydrogeochemical characteristics and evaluation of groundwater quality.
3. Results and Discussion
3.1. Hydrogeochemistry
The minimum, maximum, average, and standard deviation values of analyzed hydrochemical data are provided in Table 2 below. The temperature ranges from 18–26 °C, with a mean of 21.47 °C in the dry season, whereas in the wet season it ranges from 16–24 °C, with an average of 19.47 °C. The temperature of groundwater reflects the subsurface environmental conditions through which the water flows [23]. In the Bazo River catchment, the pH and electrical conductivity of groundwater are 6.7–7.9 and 100.8–2783 µS/cm in the dry season, and 6.5–7.8 and 96.8–2779 µS/cm in the wet season, respectively. This difference in electrical conductivity is closely linked to the geochemical processes that predominantly control rock–water reactions in the area. Table A1 presents the descriptive statistics (minimum, maximum, and average values) of the analyzed hydrogeochemical parameters for the dry season in the Bazo River catchment.
Table 2.
Results of the analyzed hydrochemical data in the Bazo River catchment.
Total dissolved solids (TDS) in the sampled water ranged from 71.2 to 1948.5 mg/L, with a mean of 377.8 mg/L during the dry season, but during rainy periods it ranged from 67.2 to 1944.5 mg/L (Table 2). Groundwater is classified as freshwater when TDS levels are below 1000 mg/L, brackish when they fall between 1000 and 10,000 mg/L, saline when they range from 10,000 to 100,000 mg/L, and brine when they exceed 100,000 mg/L [7,63]. Based on the suggestion made by [63], thirty-two samples (94.12%) were identified as freshwater (refers to TDS < 1000 mg/L), while only two samples (BH8 and SP3) (5.88%) were categorized as brackish (refers to 1000 < TDS < 10,000 mg/L). Specifically, 27 samples (79.4%) in the fresh water group had TDS levels below 500 mg/L, indicating that groundwater is more suitable for domestic use, and five samples (14.7%) have values between 500 and 1000 mg/L, indicating cautionary use for domestic purposes, specifically for drinking. However, the BH8 and SP3 samples are not recommended for drinking use because the TDS values exceeded the allowable limit.
In the study area, the values of total hardness ranged from 47.5 mg/L (SP2) up to 299.19 mg/L (BH8), with an average of 116.65 in dry time, and 44.87–296.55 mg/L, showing a mean value of 114 mg/L in the wet period (Table 2). Water hardness depends on the concentration of calcium and magnesium ions as CaCO3 in mg/L [43,52]. As a standard, “soft water” has less than 60 mg/L of TH value; “moderately hard water” has 60 to 120 mg/L of TH value; “hard water” refers to the TH value of 120 to 180 mg/L; and “very hard water” has greater than 180 mg/L TH value [43,64]. Accordingly, about 14.71% of groundwater samples were categorized as soft water (TH < 60 mg/L), 50% as moderately hard, 20.59% as hard, and 14.71% as very hard in the Bazo River catchment.
The concentration of sodium ions ranged from 7.1 to 359.9 mg/L. In contrast, the concentration of potassium ions ranged from 0.1 to 38.9 mg/L during dry conditions, and sodium ranged from 6.7 to 359.5 mg/L, while potassium ranged from 0.1 to 38.7 mg/L in the wet conditions in the study area. The potassium concentration was beyond the permissible limit in five samples, specifically Sp3 (14.8 mg/L), SW17 (14.1 mg/L), BH7 (12.5 mg/L), BH8 (38.8 mg/L), and BH9 (14.5 mg/L) in the area. A higher sodium ion concentration may be a good indicator of ion exchange processes in rock-forming minerals.
The calcium ion concentrations ranged from 13.6 to 64.9 mg/L in the dry season and from 13.2 to 64.5 mg/L in the wet season, whereas the magnesium ion concentrations ranged from 1.7 to 53.3 mg/L in dry season and from 1.3 to 52.9 mg/L in the wet season (Table 2). In the research area, major sources of calcium and magnesium minerals are geological formations such as the mafic igneous rocks. In SW8 (53.1 mg/L), the Mg ion concentration exceeded the limit. The iron (Fe) ion concentration ranged from 0 to 0.4 mg/L in the catchment, with the highest value observed in BH8 (0.4 mg/L).
The bicarbonate (HCO3) concentration ranged from 81.8 to 1467.02 mg/L, with a mean of 298.92 mg/L (Table 2). The source of HCO3 in the groundwater of the study area may differ, as per earlier researchers, including weathering of silicate minerals and soil carbon dioxide uptake [7,27]. In addition to rock-forming minerals, the weathering of silicate minerals and soil carbon dioxide uptake (CO2) are the sources of HCO3 ions in groundwater samples, as illustrated by several researchers in different parts of the world [17,65,66]. Moreover, the following likely geochemical reactions indicate the mechanism of CO2 uptake for the origination/concentration of HCO3 ions and other cations in groundwater, as demonstrated below [27].
The chloride concentration ranged from 0.4 to 38.8 mg/L with a mean of 11.41 mg/L in dry samples, and from 0 to 38.4 mg/L with a mean of 11.01 mg/L in wet samples. Its value increases from the recharge area’s highlands to the rift floor of the discharge area. The SO4−2 varies from 0.7 to 27.6 mg/L. The highest value was 27.6 mg/L (SW8), which may have originated from sulfate-bearing minerals dissolved in the groundwater system of the rift or from the application of chemical fertilizers in the farmland, as the location of this sample is well cultivated. The concentration of nitrate in the samples ranged from 0.6 to 10.1 mg/L during the dry season and from 0.3 to 8 mg/L during the wet season, which is within the permissible level for groundwater for domestic use. In addition to natural sources, alternative sources of nitrate in the GW might include farmland use, animal waste, and human and septic seepage.
The average fluoride (F−) concentration is 0.4 mg/L with values ranging from 0 to 7.2 mg/L (BH8) in both seasons at Kela village in Male district. In addition, the F− is 2.5 mg/L in a sample from Molie spring (SP3) in the lowland of Gogale village. In BH8 and SP3, the fluoride concentration exceeds the permissible limit of 1.5 mg/L for domestic use [67]. Therefore, in these two locations, the fluoride concentration was hazardous to health, but in other samples, the fluoride concentration was acceptable in the Bazo River catchment.
In general, fluoride and nitrate are the two common natural and anthropogenic contaminants in RVLB in Ethiopia [7,68]. The source of the fluoride ion concentration is the geological or natural conditions of the environment, because the area is not an industrialized zone. Leaching of igneous rock is a possible source of fluoride concentration in the main rift of Ethiopia [7,69].
In Figure 4, the box-and-whisker plot shows that sodium (Na+) and bicarbonate (HCO3−) ions are the leading cation and anion, respectively, in the Bazo River catchment. Concentrations of ions in GW samples were presented on the box-and-whisker plot in descending order of cations (Na+ > Ca2+ > Ma2+ > K+ > Fe2+) and anions (HCO3− > Cl− > SO42− > NO3− > F−) in mg/L unit (Figure 4).
Figure 4.
Box-and-whisker plot showing variation of chemical composition of groundwater.
3.2. Hydrogeochemical Characteristics
Various geochemical processes occur when rock–water interactions occur in the aquifer system, including precipitation/dissolution, ion exchange, hydrolysis, reduction, and oxidation [7,52,58,70]. The Gibbs diagram is used to distinguish geochemical systems such as rock–water interactions, evaporation, and precipitation processes [7,23,27,71]. Rock–water interactions can be traced from major ion concentration and ratio plots to infer geochemical processes, such as the weathering of rock-forming minerals and ion exchange [7].
As observed in Figure 5a,d, the sampled groundwater falls in the zone of rock–water interaction, showing an essential contribution of the geochemical process (rock–water interaction) for the formation of groundwater chemical composition in the area. The evaporation contribution was seen in the groundwater resource of the lowland parts of the research location. Except for one spring (SP3), all the spring samples were plotted into precipitation dominance in Gibb’s plot, signifying the influence of precipitation in spring water chemistry. Samples indicated the rock–water interaction for the GW composition in the area. Green colors are springs, blue colors are shallow wells, and red colors are boreholes, as presented in Figure 5a–d.
Figure 5.
Gibb’s diagram for Na ion over Na + Ca ion, and Cl ion over Cl + HCO3 ion vs. TDS in dry season (a,b) and wet season (c,d).
Two chloro-alkaline indices: To demonstrate the existence of cation exchange reactions in groundwater, two chloro-alkaline indices were used in this study, as in previous studies [7,31,72]. The cation exchange process shown in Figure 6 involves the exchange of calcium ions with sodium ions from the aquifer materials. Springs and shallow well samples showed less variation in chloro-alkaline indices, scattering within a narrow range. In contrast, samples from boreholes in the Bazo River catchment showed substantial variations in two indices. This difference suggests that groundwater from boreholes has undergone distinct cation exchange, reflecting heterogeneous hydrogeochemical conditions in the aquifers.
Figure 6.
Plots of two chloro-alkaline indices for GW samples from the study area.
As illustrated in Figure 6, the chloro-alkaline indices in the groundwater samples are negative, indicating that cation exchange is an essential process contributing to groundwater chemistry. Chloro-alkaline index one ranges from −0.66 to −1.19, whereas chloro-alkaline index two ranges from −59.54 to −1.58 in the Bazo River catchment, and both have negative values, indicating Ca2+ and Mg2+ ion exchange by Na+ and K+ from the country rock during groundwater flow and long-term rock–water interaction.
Ca2+/Na+ vs. HCO3−/Na+ Plot: To better understand how lithology interacts with water to shape groundwater chemistry, this study used a Ca2+/Na+ vs. HCO3−/Na+ bivariate plot introduced by [9]. As illustrated in Figure 7, the groundwater samples indicated that silicate minerals are the dominant contributors to shaping groundwater composition in the Bazo River catchment, a finding observed in previous works in different basins [20,50,65]. Conversely, the dissolution of Evaporites and carbonate minerals appears to play only a minor role in the study area’s hydrochemical characteristics, consistent with field observations indicating that igneous rocks, predominantly covering the region’s terrain, are the sources of these minerals.
Figure 7.
Plot of sodium normalized calcium versus HCO3 to Na ratio.
Na+ to Cl− ratio Plot: Figure 8 shows the bivariate plots of the major ions for the hydrochemical data. In the Bazo River catchment, cation exchange is an important reaction that influences the groundwater chemical composition. Higher ion concentrations were observed in groundwater samples collected from the rift floor, which may be correlated with cation-exchange processes in the aquifer system. The sodium-to-calcium ratio in groundwater of the rift floor area (1.31–6.4) was greater than that of springs in the highland parts (0.37–1.72) in the study area. Significantly elevated sodium-to-calcium ratios and sodium content indicate increased ion exchange processes, as observed when moving from the highland to the lowland parts of the study area. This is also affected by water residence time in the aquifer.
Figure 8.
Plots of Na ion versus Cl ion (a), Ca ion versus SO4 ion (b), Ca ion + Mg ion versus SO4 ion (c), and (K+ + Na+ + Ca2+ + Mg2+) versus HCO3− (d). The ratio plots of (e). Ca/Ma and (f). Ca + Mg vs. HCO3 + SO4–continued.
More values of the sampled water were plotted away from the halite (1:1 ratio of Na to Cl ions) line, indicating that the dissociation of the halite mineral is not the major geochemical reaction contributing to the concentration of major ions in the GW of the Bazo River catchment (Figure 8a).
Ca2+ vs. SO42− and Ca2+ + Mg2+ vs. SO42 Plots: In Figure 8b,c, it can be observed that almost all samples of groundwater are situated apart from the 1:1 line for Ca2+ versus SO42− and (Ca2+ + Mg2+) against SO42+, showing that dissociation of sulfate is not considered the major controlling mechanism for the composition of groundwater in the study area. If the source were sulfate, both plots would align with a nearly 1:1 ratio line in Figure 8b,c. Based on the evidence presented in the bivariate diagram, the results confirmed that groundwater is not controlled by halite and sulfate dissolution in the Bazo catchment.
Sum of major ions vs. HCO3 plot: The hydrolysis of silicate minerals results in the release of cations such as Ca2+, Mg2+, Na+, and K+, which balance the HCO3 ion in the GW composition [7,31]. Accordingly, Figure 8d shows that more groundwater samples align with the 1:1 line in the plot of (Na+ + K+ + Ca2+ + Mg2+) versus HCO3, indicating that silicate hydrolysis and weathering are the main sources contributing to the hydrochemical composition of the groundwater in the study area. Thus, based on major ion ratios, silicate hydrolysis/weathering was the dominant hydrochemical/geochemical reaction, controlling the groundwater chemical composition in the study area. Still, halite and sulfate dissociation are not the main processes.
Calcium-to-magnesium ratio: The Ca2+/Mg2+ ratio is typically an important indicator of principal geochemical reactions impacting groundwater composition; for instance, the dissolution of dolomite and calcite, as well as silicate mineral weathering [43,73]. When the Ca2+/Mg2+ ratio approximates 1, it indicates dolomite dissolution; a ratio from 1–2 reveals calcite dissolution, and a ratio greater than 2 suggests silicate mineral weathering for the occurrence of magnesium and calcium in the groundwater composition [43,73]. In the Bazo River catchment, the computed Ca2+/Mg2+ ratio is 0.37–14.54, and 29 samples show a ratio greater than 2 (85.29%), indicating that silicate weathering is the source for the calcium and magnesium ions in the groundwater of the study area (Figure 8e).
3.3. Groundwater Types
Differences in the composition of groundwater in chemically identified aquifers are referred to as hydrochemical facies [17,31]. Groundwater types may be influenced by geology, the dissolution of lithological materials, and groundwater flow patterns within the aquifer system. Na controls most water types in acidic and basic igneous terrains, and Ca/Mg ion composition, respectively [30,74]. Ca is a main constituent of several minerals in igneous rocks, particularly as part of minerals of silicates such as amphibole, pyroxene, feldspars, and their groups [5,30,42]. The main origin of calcium and magnesium is mafic volcanic rocks in igneous terrain. Generally, the water type depends on the concentration of major ions. Previously, several researchers classified water types into six zones on the Piper plot across different regions, including Pakistan [66], and a similar grouping is provided in Figure 9 of this study.
Figure 9.
Piper plot to classify water types in Bazo River catchment in dry and wet seasons.
Depending on the major ion concentration, the Piper tri-linear diagram in the Aquachem software classified nine specific groundwater types in the Bazo River catchment as Ca.Mg-HCO3, Ca.Mg.Na-HCO3, Ca.Na-HCO3, Ca.Na.Mg-HCO3, Na.Ca-HCO3, Na.Ca.Mg-HCO3, Na.Mg-HCO3, Na.Mg.Ca-HCO3, and Na-HCO3. The interaction of the GW with the fractured, weathered rocks that are abundant in Ca and sodium/Na-plagioclases governs the generation of Ca-Na-HCO3 water types in the study area, as distinguished in the Bilate Basin previously [7,27]. In general, calcium-ion-dominated water (group 1), mixed Ca.Mg.Na-HCO3 water types (group 3), and sodium-dominant water types (group 6) were the three major water types in the Bazo catchment (Figure 9) in dry and wet seasons. The types of water originated as calcium–magnesium–bicarbonate, then as sodium–calcium–bicarbonate, and then as sodium bicarbonate, as observed in spring data from elevated areas to lowland groundwater systems.
When geochemical conditions are observed, calcium-dominated water types are associated with springs in the highlands. Conversely, sodium-ion-dominated water types are associated with boreholes/springs in lowlands. The lowland areas are composed of Quaternary deposits and felsic igneous rock types. On the legend: BHD is samples of boreholes in dry season, SWD is shallow wells in dry season, and SPD is spring samples in dry season; red circles are boreholes, green square symbols are shallow wells, and blue stars are springs.
3.4. Evaluation of Drinking Water Quality
In this section, the findings of two methods (WQI and EWQI) analysis were presented. The entropy-weighted water evaluation results are described in more detail in the next section (Section 3.5). Table 3 provides the hydrochemical parameters, assigned weights, relative weights, entropy, and entropy weights.
Table 3.
Hydrochemical parameters, weights, relative weights, entropy and its calculated weights.
Detailed statistical outputs for WQI and EWQI are presented below (Table 4 and Table 5). These index methods evaluated composite water quality values for drinking purposes. The principal aim of computing the water quality index (WQI) is to evaluate potable groundwater in light of the holistic influence of various physico-chemical factors [21,43,71]. Thus, the WQI was computed and ranged from 10.86 to 176.88, with an average of 34.97 in the dry season, and 10.068 to 175.36 with an average of 33.86 in the wet season (Table 4). The standard deviations of WQI are 33.39 and 33.23 in dry and wet seasons, respectively (Table 4).
Table 4.
Results of WQI and entropy-weighted water quality indices (EWQI) for dry and wet seasons.
Table 5.
Drinking quality indices values of each sample in the Bazo River catchment (both QWI and EWQI).
Based on the WQI findings, the groundwater samples were categorized into three classes: poor (5.88%), good (11.77%), and excellent (82.35%) GW quality for domestic use (Table 5). The poor (5.88%) water quality class was sampled from borehole (BH8) and lowland spring (SP3) samples. These high ion concentrations were sourced from geochemical processes (rock–water interactions) driven by groundwater circulation, long residence times, and evaporation. Good quality groundwater samples were collected from shallow wells, and their quality was slightly affected by geological formations and the potential for anthropogenic activities, such as fertilizer application. In contrast, springs in the highlands showed excellent quality. In general, Figure 10a indicates a spatial variability map of the groundwater quality index (WQI) results for the dry season.
Figure 10.
Map of spatial variability in groundwater QI (a), and plots of EWQI versus total dissolved solids of water resources (b).
3.5. Entropy-Weighted Water Quality Index Method Result
To further illustrate groundwater quality in the Bazo River catchment, the entropy-weighted water quality index (EWQI) method was applied. This method is an advanced approach to analyzing drinking water quality. This method is objective, eliminating human bias by deriving weights directly from the data [26,46,54]. Fourteen parameters were used in the EWQI method to assess the suitability of water for drinking. In the Bazo River catchment, the results revealed that EWQI values for GW ranged from 10.076 to 265.826 with an average of 39.79 in the dry season, and from 9.38 to 264.287 with an average of 38.66 in the wet season (Table 4).
Most groundwater samples had excellent water quality for drinking use, as 82.35% showed EWQI values below 50 or Rank 1 (Figure 10b). Moreover, four groundwater samples (11.77%) had EWQI values between 50 and 100 in both the dry and wet seasons (Table 5), indicating good water quality (Rank 2). Both classes (Rank 1 and 2) are potable in quality. The two groundwater samples (SP3 and BH8, 5.88%) have very high EWQI values (162.74 in dry and 161.58 in wet for SP3, whereas 264.83 in dry and 264.287 in wet for BH8). Sample SP3 falls in the poor quality class (Rank 4), whereas sample BH8 is under Rank 5 (Extremely poor quality class) (Figure 10b). Therefore, GW samples from those locations are not recommended for drinking. The result of EWQI is similar to the WQI result, except for the samples of SP3 and BH8.
Overall, more groundwater samples were of “excellent” or “good” quality in the Bazo River catchment, as assessed using both WQI and EWQI approaches. A high percentage of the groundwater samples are acceptable for drinking use based on the WQI and EWQI methods, except for two samples (BH8 and SP3). In particular, Na+, TDS, Fe2+, and F− contributed most to the water quality problems in the BH8 and SP3 samples. Accordingly, salinity and fluoride concentration are the main reasons for the groundwater poor zones in the study area.
3.6. Evaluation of Irrigation Water Quality
Irrigation water quality has a direct or indirect influence on soil fertility, crop yield, and environmental safety [6,23,31,75]. Table 6 presents the statistical values (maximum, minimum, average, and standard deviation) for the irrigation water quality parameters. In this study, the irrigation water quality was evaluated using the eight parameters involving magnesium hazard index (MAR), sodium adsorption ratio (SAR), residual sodium carbonate (RSC), sodium percentage (Na %), permeability index (PI), electrical conductivity (EC), chloride concentration (Cl), and total hardness (TH). The parameters were analyzed using hydrochemical data after conversion to milliequivalents per liter and standard equations. The statistical values of the irrigation water quality indices are presented in the following table (Table 6), and the percentage results for each parameter are presented in Table 7, with comparisons to irrigation water standards.
Table 6.
Statistical data of calculated indices of irrigation water in Bazo River catchment.
Table 7.
Equations of indices, standards, water types, and percentage of samples.
3.6.1. Sodium Adsorption Ratio (SAR)
The SAR parameter measures how well soil particles adsorb salts from irrigation water [55]. Therefore, it is a useful indicator for evaluating the risk of plant toxicity from alkali or salt [56]. In the study area, SAR values range from 0.531 to 12.755, with a mean of 3.085 in the dry season and 0.511 to 12.79, with an average of 3.093 (Table 6 above). Most samples (94.12%) have SAR values below 10, indicating a low risk of sodium for agricultural use in the Bazo River catchment. Only 5.88% of the samples were in the good (10–18) category, and no samples were in the doubtful or ineligible ranges for irrigation application. This indicates that groundwater is suitable for irrigation without significant risk to soil permeability. Figure 11a indicates the spatial variability map of SAR in Bazo River catchment.
Figure 11.
Maps of spatial variations for SAR (a) and RSC (b) in Bazo River catchment.
3.6.2. Residual Sodium Bicarbonate (RSC)
Figure 11b shows the spatial variation map of RSC. A high RSC value can cause sodium adsorption in the soil. Water is considered safe when RSC is below 1.25 meq/L; it is marginal when RSC is 1.25 to 2.5 meq/L; and it is not suitable for irrigation use when RSC is above 2.5 meq/L [76]. The RSC values ranged from 0.127 to 18.030 meq/L with an average of 2.92 meq/L during the dry season, and 0.082 to 17.98 meq/L during the wet season, showing 2.87 meq/L in the catchment (Table 6).
The scale values are listed in Table 7 to compare the results of IQWI computation with standards. In the catchment, 44.1% of samples were safe for irrigation application in dry and wet seasons because RSC value is less than 1.25 meq/L, 20.6% of the sampled water is marginal in quality, falling between 1.25 and 2.5 meq/L, and 35.3% of the collected water samples are not suitable (RSC > 2.5 meq/L). This indicates that a significant proportion (35.3%) of the samples exceeds the safe limit, posing a potential alkaline hazard that may lead to soil degradation over time.
3.6.3. The Magnesium Adsorption Ratio (MAR)
The MAR values ranged from 10.29 to 81.77%, with an average of 35.08% in the dry period, but 9.03–81.96%, with an average of 34.17% in the rainy season. As shown in Table 7, 85.3% of the samples showed less than 50% MAR (less alkaline soils), and 14.7% showed greater than 50% MAR, indicating they are more alkaline. This generally indicates that magnesium levels are unlikely to significantly affect soil structure. Figure 12a indicates a spatial variation map of magnesium adsorption ratio (MAR).
Figure 12.
The maps of spatial variations in MAR (a) and sodium % (b) in Bazo River catchment.
3.6.4. Sodium Percentage (Na %)
In the catchment, the Na% is between 19.81% and 73.96%, with a mean of 46.37% during the dry time, whereas 19.35–74.14%, showing an average of 46.62% during the rainy period. Figure 12b shows how sodium percentage varies across the study area. About half of the groundwater samples fall within acceptable limits for irrigation, while 17.66% are considered doubtful (Table 7). No samples were classified as unsuitable for irrigation, although many fall within the moderate category. This suggests that some level of monitoring is needed for GW use in irrigation.
3.6.5. Permeability Index (PI)
The PI results ranged from 67.13% to 121.88% in the dry period, but were 67.29–123.59% in the wet period, with an average of 97.81% in the wet period. About 94.12% (32) of the samples showed excellent values (PI > 75%), and only 5.88% indicated good groundwater quality for irrigation use, indicating ideal water infiltration conditions and minimal long-term soil permeability problems (Table 7). This 94.12% PI excellence indicates a good soil’s capacity for crop production, as it permits the transmission and uptake of water by crops through their root systems. Figure 13a indicates the permeability index map of spatial variation in the Bazo River catchment.
Figure 13.
The spatial variation map of PI (a) and EC (b) in Bazo River catchment.
3.6.6. Electrical Conductivity (EC)
The spatial variation map of EC is shown in Figure 13b. When assessing total salinity and categorizing irrigation water quality, EC can be an important parameter [31,61]. When soil solution pressure is raised by excessive salinity, it can cause drought in the soil [31]. Half of the samples (50%) were good (250–750 µS/cm), 32.4% were rated excellent, and 11.8% were permissible according to the EC index (Table 7).
3.6.7. Total Hardness (TH)
Regarding total hardness for irrigation purposes, 47.06% of water samples were moderately hard, 32.35% were soft, and 20.59% were hard in the study area (Table 7). The absence of very hard water indicates generally acceptable groundwater for irrigation, although hardness levels may require treatment for drinking and industrial use to avoid scaling.
3.6.8. Chloride Concentration
Chloride is categorized into seven groups based on irrigation water supply [77]. Based on the chloride concentrations, 50% of the samples can be categorized as brackish (8.46–28.21 mg/L), 8.82% as very fresh, 14.71% as fresh, 20.59% as fresh brackish, and 5.59% of the samples as brackish salt (Table 7).
3.6.9. USSL Diagram
Figure 14 indicates the hydrochemical data presented on the United States Salinity Laboratory (USSL) plot of two seasons. The result showed that roughly 35.3%, 47.1%, 11.9% and 2.9% of the samples can be categorized into low salinity with low alkalinity hazard (C1S1), medium salinity with low alkalinity hazard (C2S1), high salinity with low alkalinity hazard (C3S1), very high salinity with medium alkalinity (C4S2, only one sample), and very high salinity with high alkalinity (C4S3) classes, respectively. Overall, the groundwater quality assessment for irrigation use showed groundwater with generally favorable characteristics for agricultural use. The green color squares, blue color stars, and red color circles, are symbols of springs, shallow wells, and boreholes samples, respectively.
Figure 14.
Salinity and alkalinity hazards diagram of USSL for irrigation water.
3.7. Discussion
The dominant hydrogeochemical processes in the study area are silicate mineral weathering and ion exchange, driven by geological formations and climatic conditions. The dominance of sodium (Na+) and bicarbonate (HCO3) ions in the groundwater samples ensures the dissolution of silicate minerals, specifically amphiboles and feldspars, in the volcanic bedrocks and Quaternary sediments of the area. This result aligns with previous findings in the Rift Valley Lakes Basin of Ethiopia [7,11]. Gibb’s plot and Na+/Cl− also evidenced a silicate-weathering ratio (>1), which underlines the dissolution of amphiboles and feldspars from the igneous rocks.
Furthermore, cation exchange controls groundwater/water chemistry, especially in the aquifers of lowland area. Negative values of chloro-alkaline indices (CAI-I: −1.8 to −0.12) indicate calcium/magnesium ion adsorption onto clayey minerals and the release of sodium ions into groundwater. This reaction, together with extended residence time in the Quaternary sediments of lowland regions, aggravates salinity, as seen in the semi-arid, drought-prone Konso region of Ethiopia [6]. In general, silicate weathering is the source of cation (Na+, K+, Ca2+, and Mg2+) concentrations in the study area, as observed in the Pungar sub-basin in India [65].
Raised F− (fluoride) in the BH8 (7.2 mg/L) and Sp3 (2.5 mg/L) is correlated with the alkaline pH (7.5 to 7.9) and low calcium (Ca2+ < 30 mg/L), favoring the dissolution of fluorite (CaF2) in the groundwater system. Precipitation of calcite removes calcium ions, shifting the equilibrium to release fluoride ions [11]. That mechanism reflects fluoride concentration zones in the Meki River Basin of the Ethiopian Rift [23], where pyroclastic materials and volcanic ash layers serve as reservoirs for fluoride concentration. Remarkably, the lack of Evaporites (low chloride and sulfate) contrasts with fluoride-rich aquifers in semi-arid regions of India [79], suggesting localized geologic controls.
Sodium bicarbonate (Na-HCO3) water types are associated with felsic rock types, whereas calcium–magnesium–bicarbonate (Ca-Mg-HCO3) water types occur in highland areas and are associated with mafic igneous rocks. This condition aligns with research conducted in the Bilate River Basin of the Ethiopian Rift Valley [7,27], where Na-HCO3 hydrochemical facies are predominant in the lowlands, and Ca (Mg)-HCO3 facies in the highlands and escarpments.
Although 82.35% of water samples meet WHO quality limits, the fluoride contamination in SP3 (2.5 mg/L) and BH8 (7.2 mg/L) reflects levels as high as those in endemic fluorosis zones in the Rift Valley of Ethiopia [20,80]. The fluoride levels in BH8 and SP3 exceed the WHO limit (>1.5 mg/L), which may pose risks of mottled enamel (dental fluorosis) and joint immobilization (skeletal fluorosis). Excessive health impacts affect lowland communities that depend on untreated groundwater, reflecting risks similar to those in Rajasthan, India [79]. The brackish condition of the water was indicated by TDS in BH8 (1946.5 mg/L), likely due to evaporative enrichment in semi-arid lowland regions. That salinity reduces the suitability of water for drinking, aggravating water scarcity in drought-prone areas. Hence, these findings indicate the need for prioritized monitoring in lowlands.
While 94% of water samples show a low sodium hazard (SAR < 10) for irrigation use, 35.3% display higher residual sodium carbonate (RSC > 2.5 meq/L), which risks soil alkalization. Raised RSC reduces nutrient availability and crop yields. This aligns with problems in Xinjiang, China [81], where soil degradation due to RSC reduces crop yields by 15–30%. However, this scenario contrasts with the Arba Minch area of Ethiopia [16], where magnesium-ion-dominated hardness mitigates the influence of RSC.
A higher permeability index (>75%) indicates good water infiltration capacity for irrigation, but magnesium hazard (MAR > 50% in 14.7% of samples) could destroy soil structure in clay-rich soils. This challenge is also present in the Korba Coal field, Central India [81], where blended water use or gypsum (CaSO4) modifications are being promoted to mitigate alkalinity.
Generally, GIS-based spatial analysis revealed a contrast between highland springs (low F−/TDS, Ca.Mg-HCO3 water type) and lowland boreholes (high F−/TDS, Na-HCO3 water type). This contrast reflects geomorphological controls on groundwater recharge: in highlands, fractured basalts; in lowlands, sediment-bound aquifers. The same geospatial trends were observed in the Wera Didjo River Basin, Southern Ethiopia [22], where topographic inclination drives hydrochemical evolution. In addition, similar patterns were documented in the Akaki River catchment, Central Ethiopia [73], highlighting the need for spatially differentiated groundwater resource management. Long-term groundwater monitoring is essential to evaluate climate-driven shifts in water quality status, as drought-prone areas may intensify evaporative TDS and fluoride levels.
4. Conclusions
Groundwater serves as a critical source for drinking, agriculture, and industrial applications. Community demand for high-quality groundwater has increased significantly in the study area. The objective of this study was to evaluate hydrogeochemical characteristics and groundwater quality for domestic and irrigation use using hydrogeochemical data, WQI, EWQI, and IWQI, and comparing them with the WHO quality standards in the Bazo River catchment. These two quality indices (WQI and EWQI) were compared in this study. Hydrogeochemical processes were characterized using various plots and major ion ratio approaches. The analyzed groundwater quality parameters included temperature, EC, pH, TDS, TH, major ions (Na+, K+, Ca2+, Mg2+, Fe2+, Cl−, HCO3−, and SO4−2), and minor ions (nitrate, fluoride, and iron). They were analyzed at the water quality lab of Arba Minch University, Ethiopia. The results of cations and anions in descending order are Na > Ca > Mg > Fe and HCO3 > Cl > SO4 > NO3− > F, respectively.
The dominant hydrogeochemical processes were deduced using Gibbs plots, chloro-alkaline indices, and major ion ratio plots; they include silicate weathering and ion exchange during rock–water interaction. In the Bazo River catchment, water types (hydrochemical facies) were identified and developed into Ca-Mg-HCO3 to Na-HCO3 water types.
A map of the water quality index was generated, showing a composite measure of groundwater quality spatial variation in the Bazo River catchment. Based on WQI findings, the groundwater samples showed a distribution of water quality groups as poor (5.88%), good (11.77%), and excellent (82.35%) for drinking use. In particular, the fluoride concentration in BH8 and SP3 exceeds the WHO drinking water standard (1.5 mg/L). In addition, the iron concentration exceeds the WHO safe limit for drinking water (0.3 mg/L) in BH8. Therefore, the water at those points is not recommended for drinking unless it is treated. The spring supply for drinking use through pipes from the escarpment and highland areas, and the harvesting of rainwater, are recommended in those villages.
The irrigation water quality indices (MAR, SAR, PI, RSC, and Na %) were computed, and the spatial variation of each parameter was mapped. Based on irrigation water quality parameters, 94.12% of the irrigation water quality was excellent (SAR < 10), 44.1% of samples were probably safe for irrigation application (RSC < 1.25 meq/L), 85.3% of the samples showed less alkaline soils (MAR < 50%), about half of the groundwater samples fall within acceptable limits for irrigation (Na % < 20%), and 94.12% of the samples showed excellent values (PI > 75%). The concentrations of chloride (EC) and total TH in the water samples suggest that GW quality is suitable for irrigation practice in the area.
Generally, Na+, TDS, Fe2+, and F− ions contributed most to water quality problems in the BH8 and SP3 samples from the study area, originating from geogenic sources (geological formations and geochemical processes). As a result, potential sources of contaminant chemicals in groundwater were identified, leading to recommendations for water treatment or management strategies. For fluoride-contaminated zones, cost-effective solutions are needed in BH8 and SP3. In higher RSC areas, promoting salt-tolerant crops and applying gypsum are needed to mitigate magnesium-related hazard zones. GIS-based mapping of groundwater quality is important for policy integration to prioritize remediation of lowland aquifers. Organizing zonal water quality standards is recommended by enforcing strict monitoring in lowlands or high-risk zones. For future geochemical analysis, sampling rock types and soil strata is recommended at the locations of BH8 and SP3 to better understand the details. In addition, investigation of fluoride mobilization mechanisms is needed, with consideration of the role of CO2 in silicate weathering.
Author Contributions
A.A.: Data curation, making the conceptual framework, formal analysis, designing methodologies, writing the original draft, and revising the manuscript. S.D.: Administering the project, supervising, validating, editing, writing, and reviewing the draft paper. M.J.: Co-supervising, validating, reviewing, editing, and writing. All authors have read and agreed to the published version of the manuscript.
Funding
No funds were provided by any source other than the Ministry of Education of Ethiopia, which supported only data collection.
Data Availability Statement
Data for this study are available from the authors upon reasonable request.
Acknowledgments
The Ministry of Education and the government of Ethiopia supported data collection financing, and this is highly acknowledged. The researchers would like to express their appreciation to the NMA, MoWE, zonal and regional water bureaus, and organizations for their help in providing the essential data sources.
Conflicts of Interest
The authors declare no conflicts of interest.
Appendix A
Table A1.
Dry season analyzed hydrogeochemical data of the Bazo Rive catchment with their minimum, maximum and average values.
Table A2.
Wet season hydrogeochemical data of the Bazo River catchment with their minimum, maximum and average values.
Table A3.
Average analytical hydrogeochemical data of the Bazo River catchment with their minimum, maximum and average values (used in this study).
References
- Loaiza, J.G.; Bustos-Terrones, Y.; Bustos-Terrones, V.; Monjardín-Armenta, S.A.; Quevedo-Castro, A.; Estrada-Vazquez, R.; Rangel-Peraza, J.G. Evaluation of the Hydrochemical and Water Quality Characteristics of an Aquifer Located in an Urbanized Area. Appl. Sci. 2022, 12, 6879. [Google Scholar] [CrossRef] [Scilit]
- Yıldırım, Ü. Identification of groundwater potential zones using GIS and multi-criteria decision-making techniques: A case study upper coruh river basin (NE Turkey). ISPRS Int. J. Geo-Inf. 2021, 10, 396. [Google Scholar] [CrossRef] [Scilit]
- Chapelle, F.H. Hydrogeology and Geochemistry of Bottled Spring Water in the United States; The Groundwater Project: Guelph, ON, Canada, 2025. [Google Scholar] [CrossRef] [Scilit]
- Bonetto, S.M.R.; Caselle, C.; De Luca, D.A.; Lasagna, M. Groundwater Resources in the Main Ethiopian Rift Valley: An Overview for a Sustainable Development. Sustainability 2021, 13, 1347. [Google Scholar] [CrossRef] [Scilit]
- Tolke, A.A.; Ayenew, T. The Use of Hydrochemical and Environmental Isotopes in Analysis of Hydrogeological Systems of Abaya—Chamo Lakes Basin. J. Spat. Hydrol. 2019, 15. Available online: https://scholarsarchive.byu.edu/josh/vol15/iss1/5/ (accessed on 1 May 2026).
- Abebe, A.; Jothimani, M.; Berhanu, G. Hydrogeochemical Evaluation of Groundwater Quality and Its Applicability for Various Purposes in the Drought-Prone Konso Zone, Rift Valley, Southern Ethiopia. Appl. Environ. Soil Sci. 2024, 2024, 25. [Google Scholar] [CrossRef] [Scilit]
- Haji, M.; Wang, D.; Li, L.; Qin, D.; Guo, Y. Geochemical evolution of Fluoride and implication for F- enrichment in groundwater: Example from the Bilate River Basin of Southern Main Ethiopian Rift. Water 2018, 10, 1799. [Google Scholar] [CrossRef] [Scilit]
- Sena, Y.; Loh, A.; Awinbire, B.; Manu, E.; Aliou, A. Assessment of groundwater quality and the main controls on its hydrochemistry in some Voltaian and basement aquifers, northern Ghana. Groundw. Sustain. Dev. 2020, 10, 100296. [Google Scholar] [CrossRef] [Scilit]
- Tian, J.; Wang, Z.; Daskalopoulou, K.; Zhang, M.; Huo, Y.; Cao, Y.; Yang, J.; Liu, W.; Liu, J.; Xu, S. Hydrochemical characteristics, driving factors and health risk of fluoride in groundwater from the northwestern Ordos Basin, China. Geosci. Front. 2025, 16, 102123. [Google Scholar] [CrossRef] [Scilit]
- Alemayehu, T.; Ayenew, T.; Kebede, S. Hydrogeochemical and lake level changes in the Ethiopian Rift. J. Hydrol. 2006, 316, 290–300. [Google Scholar] [CrossRef] [Scilit]
- Kebede, S. Groundwater in Ethiopia, Features, Numbers, and Opportunities; Springer Science & Business Media: Berlin/Heidelberg, Germany, 2013. [Google Scholar] [CrossRef] [Scilit]
- Mengistu, T.D.; Chung, I.M.; Chang, S.W.; Yifru, B.A.; Kim, M.G.; Lee, J.; Ware, H.H.; Kim, I.H. Challenges and Prospects of Advancing Groundwater Research in Ethiopian Aquifers: A Review. Sustainability 2021, 13, 11500. [Google Scholar] [CrossRef] [Scilit]
- Fito, J.; Bultossa, G.; Kloos, H. Physicochemical and heavy metal constituents of the groundwater quality in Haramaya Woreda, Oromia Regional State, Ethiopia. Int. J. Energy Water Resour. 2019, 3, 23–32. [Google Scholar] [CrossRef] [Scilit]
- Lapworth, D.J.; Nkhuwa, D.C.W.; Okotto-Okotto, J.; Pedley, S.; Stuart, M.E.; Tijani, M.N.; Wright, J. Urban groundwater quality in sub Saharan Africa: Current status and implications for water security and public health. Hydrogeol. J. 2017, 25, 1093–1110. [Google Scholar] [CrossRef] [Scilit] [PubMed]
- Kahsay, G.H.; Gebreyohannes, T.; Tesema, F.W.; Emabye, T.G. Evaluation of Groundwater Quality and Suitability for Drinking and Irrigation Purposes Using Hydrochemical Approach: The Case of Raya Valley, Northern Ethiopia. Momona Ethiop. J. Sci. 2019, 11, 70. [Google Scholar] [CrossRef] [Scilit]
- Tesseme, T.A.; Gopalakrishnan, G. Evaluation of groundwater quality for drinking and irrigation purposes using GIS—Based water quality index in urban area of Abaya-Chemo sub—Basin of Great Rift Valley, Ethiopia. Appl. Water Sci. 2021, 11, 148. [Google Scholar] [CrossRef] [Scilit]
- Yang, Q.; Li, Z.; Ma, H.; Wang, L.; Martín, J.D. Identification of the hydrogeochemical processes and assessment of groundwater quality using classic integrated geochemical methods in the Southeastern part of Ordos basin, China. Environ. Pollut. 2016, 218, 879–888. [Google Scholar] [CrossRef] [Scilit] [PubMed]
- Rao, G.T.; Rao, V.V.S.G.; Sarma, V.S.; Dhakate, R.; Surinaidu, L.; Mahesh, J.; Ramesh, G. Hydrogeochemical parameters for assessment of groundwater quality in a Ghataprabha river sub-basin. Int. J. Environ. Sci. Technol. 2012, 9, 297–310. [Google Scholar] [CrossRef] [Scilit]
- Kanagaraj, G.; Elango, L. Hydrogeochemical processes and impact of tanning industries on groundwater quality in Ambur, Vellore district, Tamil Nadu. Environ. Sci. Pollut. Res. 2016, 23, 24364–24383. [Google Scholar] [CrossRef] [Scilit] [PubMed]
- Rango, T.; Bianchini, G.; Beccaluva, L.; Ayenew, T.; Colombani, N. Hydrogeochemical study in the Main Ethiopian Rift: New insights to the source and enrichment mechanism of fluoride. Environ. Geol. 2009, 58, 109–118. [Google Scholar] [CrossRef] [Scilit]
- Arota, A.; Atlabachew, A.; Abebe, A.; Jothimani, M. Groundwater quality mapping for drinking and irrigation purposes using statistical, hydrochemical facies, and water quality indices in Tercha District, Dawuro Zone, Southern Ethiopia. J. Degrad. Min. Lands Manag. 2022, 9, 3367–3377. [Google Scholar] [CrossRef] [Scilit]
- Zeleke, F.; Abebe, A.; Gunalan, J. Groundwater quality assessment and hydrochemical characteristics in Wera Didjo, Southern Ethiopia. J. Degrad. Min. Lands Manag. 2022, 9, 3499–3509. [Google Scholar] [CrossRef] [Scilit]
- Mesele, Y.; Mechal, A. Hydrochemical characterization and quality assessment of groundwater in Meki River Basin, Ethiopian Rift. Sustain. Water Resour. Manag. 2020, 6, 117. [Google Scholar] [CrossRef] [Scilit]
- Bhatt, A.G.; Kumar, A.; Trivedi, P.R. Integration of multivariate statistics and water quality indices to evaluate groundwater quality and its suitability in middle Gangetic floodplain, Bihar. SN Appl. Sci. 2021, 3, 426. [Google Scholar] [CrossRef] [Scilit]
- Noshadi, M.; Ghafourian, A. Groundwater quality analysis using multivariate statistical techniques (case study: Fars province, Iran). Environ. Monit. Assess. 2016, 188, 419. [Google Scholar] [CrossRef] [Scilit] [PubMed]
- Tang, N.; Chen, M.; Zhou, M.; Xie, Z.; Liu, W.; Huang, X. Hydrochemical Characteristics and Drinking Water Quality Assessment of Phreatic Groundwater in the Northwest of the Sichuan Basin, SW China. Water 2025, 17, 1074. [Google Scholar] [CrossRef] [Scilit]
- Haji, M.; Qin, D.; Guo, Y.; Li, L.; Wang, D.; Karuppannan, S.; Shube, H. Origin and geochemical evolution of groundwater in the Abaya Chamo basin of the Main Ethiopian Rift: Application of multi-tracer approaches. Hydrogeol. J. 2021, 29, 1219–1238. [Google Scholar] [CrossRef] [Scilit]
- JICA. The Study on Groundwater Resources Assessment in the Rift Valley Lakes Basin in the Federal Democratic Republic of Ethiopia. Final Report; Japan International Cooperation: Tokyo, Japan; Ministry of Water & Energy: Addis Ababa, Ethiopia, 2012.
- Tolba, A.A.; Hatiye, S.D.; Jothimani, M. Identification of groundwater potential zones in drought prone Bazo River catchment, Southern Ethiopia using GIS, AHP and FR techniques. Discov. Appl. Sci. 2026, 8, 738. [Google Scholar] [CrossRef] [Scilit]
- Ayenew, T. Major Ions Composition of the Groundwater and Surface Water Systems and Their Geological and Geochemical Controls in the Ethiopian Volcanic Terrain. J. Sci. 2005, 28, 171–188. [Google Scholar] [CrossRef] [Scilit]
- Mahaqi, A.; Moheghi, M.M.; Mehiqi, M.; Moheghy, A. Hydrogeochemical characteristics and groundwater quality assessment for drinking and irrigation purposes in the Mazari—Sharif. Appl. Water Sci. 2018, 8, 133. [Google Scholar] [CrossRef] [Scilit]
- Verner, K.; Megerssa, L.; Buriánek, D. Geology, Soil Environment and Hydrogeology of the Gamo Zone, Ethiopia. Explanatory Notes to the Thematic Geoscientific Maps at a 1:100,000 Scale; Czech Geological Survey: Parague, Czech Republic, 2023.
- Mechal, A.; Birk, S.; Dietzel, M.; Leis, A.; Winkler, G.; Mogessie, A.; Kebede, S. Groundwater flow dynamics in the complex aquifer system of Gidabo River Basin (Ethiopian Rift): A multi-proxy approach. Hydrogeol. J. 2016, 25, 519–538. [Google Scholar] [CrossRef] [Scilit]
- Furi, W.; Razack, M.; Abiye, T.A.; Kebede, S.; Legesse, D. Hydrochemical characterization of complex volcanic aquifers in a continental rifted zone: The Middle Awash basin, Ethiopia. Hydrogeol. J. 2012, 20, 385–400. [Google Scholar] [CrossRef] [Scilit]
- Molla, D.D.; Tegaye, T.A.; Fletcher, C.G. Simulated surface and shallow groundwater resources in the Abaya-Chamo Lake basin, Ethiopia using a spatially-distributed water balance model. J. Hydrol. Reg. Stud. 2019, 24, 100615. [Google Scholar] [CrossRef] [Scilit]
- Boccaletti, M.; Bonini, M.; Mazzuoli, R.; Abebe, B.; Piccardi, L.; Tortorici, L. Quatemary oblique extensional tectonics in the Ethiopian Rift (Horn of Africa). Tectonophysics 1998, 287, 97–116. [Google Scholar] [CrossRef] [Scilit]
- Hulluka, T.A.; Balcha, S.K.; Yohannes, B.; Bantider, A.; Negatu, A. Review: Groundwater research in the Ethiopian Rift Valley Lakes region. J. Water 2021, 5, 819568. [Google Scholar] [CrossRef] [Scilit]
- Belay, A.; Demissie, T.; Recha, J.; Oludhe, C.; Osano, P.; Olaka, L.; Solomon, D.; Berhane, Z. Analysis of Climate Variability and Trends in Southern Ethiopia. Climate 2021, 9, 96. [Google Scholar] [CrossRef] [Scilit]
- Lukas, C.; Waterloo, H. AquaChem V.4.0 User’s Manual: Water Quality Data Analysis, Plotting, and Modeling; Waterloo Hydrogeologic, Inc.: Waterloo, ON, Canada, 2003; Available online: https://www.waterloohydrogeologic.com (accessed on 1 May 2026).
- Parkhurst, B.D.L.; Appelo, C. User’s Guide to PHREEQC (Version 2): A Computer Program for Speciation, and Inverse Geochemical Calculations; U.S. Geological Survey: Denver, CO, USA, 1999. [CrossRef] [Scilit]
- Piper, A.M. A Graphic Procedure in the Geochemical Interpretation of Water-Analyses. Eos Trans. Am. Geophys. Union 1944, 25, 914–928. [Google Scholar] [CrossRef] [Scilit]
- Ayenew, T.; Demlie, M.; Wohnlich, S. Hydrogeological framework and occurrence of groundwater in the Ethiopian aquifers. J. Afr. Earth Sci. 2008, 52, 97–113. [Google Scholar] [CrossRef] [Scilit]
- Ataklti, B.; Tesema, F.W.; Hagos, E.; Berhe, B.A. Hydrogeochemical characterization and appraisal of groundwater suitability for drinking purposes using water quality index (WQI) in Aksum town and surrounding areas, Tigray. Water Supply 2025, 25, 1176–1193. [Google Scholar] [CrossRef] [Scilit]
- BHallouche, B.; Marok, A.; Benaabidate, L.; Berrahal, Y.; Hadji, F. Geochemical and qualitative assessment of groundwater of the High Mekerra watershed, NW Algeria. Environ. Earth Sci. 2017, 76, 340. [Google Scholar] [CrossRef] [Scilit]
- Reyes-Toscano, C.A.; Alfaro-Cuevas-Villanueva, R.; Cortés-Martínez, R.; Morton-Bermea, O.; Hernández-Álvarez, E.; Buenrostro-Delgado, O.; Ávila-Olivera, J.A.Á. Hydrogeochemical Characteristics and Assessment of Drinking Water Quality in the Urban Area of Zamora, Mexico. Water 2020, 12, 556. [Google Scholar] [CrossRef] [Scilit]
- Chen, J.; Huang, Q.; Lin, Y.; Fang, Y.; Qian, H.; Liu, R.; Ma, H. Hydrogeochemical Characteristics and Quality Assessment of Groundwater in an Irrigated Region, Northwest China. Water 2019, 11, 96. [Google Scholar] [CrossRef] [Scilit]
- Ahmad, A.Y.; Al-Ghouti, M.A.; Khraisheh, M.; Zouari, N. Hydrogeochemical characterization and quality evaluation of groundwater suitability for domestic and agricultural uses in the state of Qatar. Groundw. Sustain. Dev. 2020, 11, 100467. [Google Scholar] [CrossRef] [Scilit]
- Marandi, A.; Shand, P. Groundwater chemistry and the Gibbs Diagram. Appl. Geochem. 2018, 97, 209–212. [Google Scholar] [CrossRef] [Scilit]
- Ndoye, S.; Fontaine, C.; Gaye, C.B.; Razack, M. Groundwater Quality and Suitability for Different Uses in the Saloum Area of Senegal. Water 2018, 10, 1837. [Google Scholar] [CrossRef] [Scilit]
- Meybeck, M. Global chemical weathering of surficial rocks estimated from river dissolved loads. Am. J. Sience 1987, 287, 401–428. [Google Scholar] [CrossRef] [Scilit]
- Horton, R.K. An index number system for rating water quality. J. Water Pollut. Control Fed. 1965, 373, 303–306. [Google Scholar]
- ADemelash, A.; Atlabachew, A.; Jothimani, M.; Abebe, A. Hydrogeochemical Characterization and Appraisal of Groundwater Quality in Yisr River Catchment, Blue Nile River Basin, Ethiopia, by Using the GIS, WQI, and Statistical Techniques. J. Chem. 2023, 2023, 8199000. [Google Scholar] [CrossRef] [Scilit]
- Nafyad Serre Kawo, N.S.K.; Shankar Karuppannan, S.K. Groundwater quality assessment using water quality index and GIS technique in Modjo River Basin, central Ethiopia. J. Afr. Earth Sci. 2018, 147, 300–311. [Google Scholar] [CrossRef] [Scilit]
- Wang, Y.; Li, R.; Wu, X.; Yan, Y.; Wei, C.; Luo, M.; Xiao, Y.; Zhang, Y. Evaluation of Groundwater Quality for Drinking and Irrigation Purposes Using GIS-Based IWQI, EWQI and HHR Model. Water 2023, 15, 2233. [Google Scholar] [CrossRef] [Scilit]
- Bhunia, G.S.; Keshavarzi, A.; Shit, P.K.; Omran, E.-S.E.; Bagherzadeh, A. Evaluation of groundwater quality and its suitability for drinking and irrigation using GIS and geostatistics techniques in semiarid region of Neyshabur, Iran. Appl. Water Sci. 2018, 8, 168. [Google Scholar] [CrossRef] [Scilit]
- Badmus, B.S.; Ozebo, V.C.; Idowu, O.A.; Ganiyu, S.A.; Olurin, O.T. Groundwater Assessment of Hand Dug Wells around Open Landfill in Ibadan Metropolis for Domestic and Irrigation Purposes. J. Water Resour. Prot. 2014, 6, 1412–1424. [Google Scholar] [CrossRef]
- Salifu, M.; Aidoo, F.; Hayford, M.S.; Adomako, D.; Asare, E. Evaluating the suitability of groundwater for irrigational purposes in some selected districts of the Upper West region of Ghana. Appl. Water Sci. 2015, 7, 653–662. [Google Scholar] [CrossRef] [Scilit]
- Rezaei, A.; Hassani, H. Hydrogeochemistry study and groundwater quality assessment in the north of Isfahan, Iran. Environ. Geochem. Health 2017, 40, 583–608. [Google Scholar] [CrossRef] [Scilit] [PubMed]
- Belkhiri, L.; Mouni, L.; Tiri, A.; Narany, T.S.; Nouibet, R. Groundwater for Sustainable Development Spatial analysis of groundwater quality using self-organizing maps. Groundw. Sustain. Dev. 2018, 7, 121–132. [Google Scholar] [CrossRef] [Scilit]
- Jalali, M. Hydrogeochemistry of Groundwater and Its Suitability for Drinking and Agricultural Use in Nahavand, Western Iran. Nat. Resour. Res. 2011, 20, 65–73. [Google Scholar] [CrossRef] [Scilit]
- Wilcox, L. The Quality of Water for Irrigation Use; U.S. Department of Agriculture: Washington, DC, USA, 1948.
- Nayak, K.M.; Sahoo, H.K. Hydrogeochemical Evaluation of Mahanga Block, Cuttack District, Odisha, India. J. Geosci. Geomat. 2014, 2, 16–21. [Google Scholar] [CrossRef]
- Freeze, R.; Cherry, J. Ground Water; Prentice-Hall, Inc.: Saddle River, NJ, USA, 1979. [Google Scholar]
- Ham, R.K. Water Quality and Treatment: A Handbook of Community Water Supplies; McGraw-Hill: New York, NY, USA, 1989. [Google Scholar]
- Srinivasamoorthy, K.; Gopinath, M.; Chidambaram, S.; Vasanthavigar, M.; Sarma, V. Hydrochemical characterization and quality appraisal of groundwater from Pungar sub basin, Tamilnadu, India. J. King Saud. Univ. Sci. 2014, 26, 37–52. [Google Scholar] [CrossRef] [Scilit]
- Ghani, J.; Ullah, Z.; Nawab, J.; Iqbal, J.; Waqas, M.; Ali, A.; Almutairi, M.H.; Peluso, I.; Mohamed, H.R.H.; Shah, M. Hydrogeochemical Characterization, and Suitability Assessment of Drinking Groundwater: Application of Geostatistical Approach and Geographic Information System. Front. Environ. Sci. 2022, 10, 874464. [Google Scholar] [CrossRef] [Scilit]
- WHO. Guidelines for Drinking-Water Quality: Fourth Edition Incorporating the First Addendum, 4th ed.; WHO: Geneva, Switzerland, 2017; pp. 1051–1065.
- Abiye, T.A.; Mengistu, H.A.; Demlie, M.B. Review: Groundwater resource potential and status of groundwater resource development in Ethiopia. Hydrogeol. J. 2019, 27, 1051–1065. [Google Scholar] [CrossRef] [Scilit]
- Ghiglieri, G.; Pistis, M.; Abebe, B.; Azagegn, T.; Engidasew, T.A.; Pittalis, D.; Soler, A.; Barbieri, M.; Navarro-Ciurana, D.; Carrey, R.; et al. Three-dimensional hydrostratigraphical modelling supporting the evaluation of fluoride enrichment in groundwater: Lakes basin (Central Ethiopia). J. Hydrol. Reg. Stud. 2020, 32, 100756. [Google Scholar] [CrossRef] [Scilit]
- Sappa, G.; Ergul, S.; Ferranti, F. Geochemical modeling and multivariate statistical evaluation of trace elements in arsenic contaminated groundwater systems of Viterbo Area, (Central Italy). SpringerPlus 2014, 3, 237. [Google Scholar] [CrossRef] [Scilit] [PubMed]
- Onoyima, C.C.; Okpanachi, C.B.; Akoji, J.N. Hydro-geochemical Characterization and Groundwater Quality Assessment of Mariri Aquifer, Kano, Nigeria. J. Agric. Environ. Int. Dev. (JAEID) 2025, 119, 469–486. [Google Scholar] [CrossRef] [Scilit]
- Wang, S.; Xie, Z.; Wang, F.; Zhang, Y.; Wang, W.; Liu, K.; Qi, Z.; Zhao, F.; Zhang, G.; Xiao, Y. Geochemical Characteristics and Quality Appraisal of Groundwater From Huatugou of the Qaidam Basin on the Tibetan Plateau. Front. Earth Sci. 2022, 10, 874881. [Google Scholar] [CrossRef] [Scilit]
- González-Guzmán, R.; Weber, B.; Batista-Cruz, R.Y.; Bernard-Romero, R.; Velasco-Tapia, F.; Rodríguez-López, M.M.; Kretzschmar, T.; Aguilar-Ojeda, J.A.; Almanza-García, C.E. Applied Geochemistry Geochemical and multi-isotopic (δ 18 O, δ D, 87 Sr/86 Sr, 143 Nd/144 Nd) approaches on sources, water-rock interactions, and mixing processes of geothermal waters from a complex intertidal region of the Gulf of California. Appl. Geochem. 2026, 203, 106802. [Google Scholar] [CrossRef] [Scilit]
- Demlie, M.; Wohnlich, S.; Ayenew, T. Major ion hydrochemistry and environmental isotope signatures as a tool in assessing groundwater occurrence and its dynamics in a fractured volcanic aquifer system located within a heavily urbanized catchment, central Ethiopia. J. Hydrol. 2008, 353, 175–188. [Google Scholar] [CrossRef] [Scilit]
- Wu, J.; Sun, Z. Evaluation of Shallow Groundwater Contamination and Associated Human Health Risk in an Alluvial Plain Impacted by Agricultural and Industrial Activities, Mid-west China. Expo. Health 2020, 126, 311–329. [Google Scholar] [CrossRef] [Scilit]
- Richard, L.A. Diagnosis and Improvement of Saline and Alkali Soils; U.S. Department of Agriculture: Washington, DC, USA, 1954. [CrossRef] [Scilit]
- Sawyer, G.; McCartly, D. Chemistry of Sanitary Engineers; McGraw Hill: New York, NY, USA, 1967. [Google Scholar]
- Stuyfzand, P. Nonpoint source of trace element in potable groundwater in Netherland. In Proceedings of the 18th TWSA Water Working; Testing and Research Institute KIWA: Nieuwegein, The Netherlands, 1989. [Google Scholar]
- JPodgorski, J.E.; Labhasetwar, P.; Saha, D.; Berg, M. Prediction modeling and mapping of groundwater fluoride contamination throughout India Prediction modeling and mapping of groundwater fluoride contamination throughout India. Environ. Sci. Technol. 2018, 52, 9889–9898. [Google Scholar] [CrossRef] [Scilit] [PubMed]
- Rango, T.; Vengosh, A.; Jeuland, M.; Tekle-Haimanot, R.; Weinthal, E.; Kravchenko, J.; Paul, C.; McCornick, P. Fluoride exposure from groundwater as re fl ected by urinary fluoride and children’s dental fl uorosis in the Main Ethiopian Rift Valley. Sci. Total Environ. 2014, 496, 188–197. [Google Scholar] [CrossRef] [Scilit] [PubMed]
- Zhou, B.; Yang, L.; Chen, X.; Ye, S.; Peng, Y.; Liang, C. Effect of magnetic water irrigation on the improvement of salinized soil and cotton growth in Xinjiang. Agric. Water Manag. 2021, 248, 106784. [Google Scholar] [CrossRef] [Scilit]
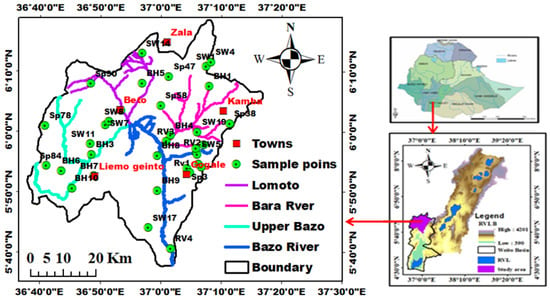
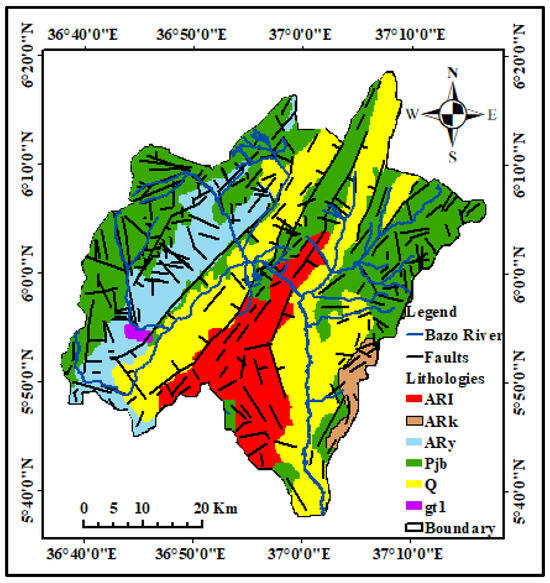
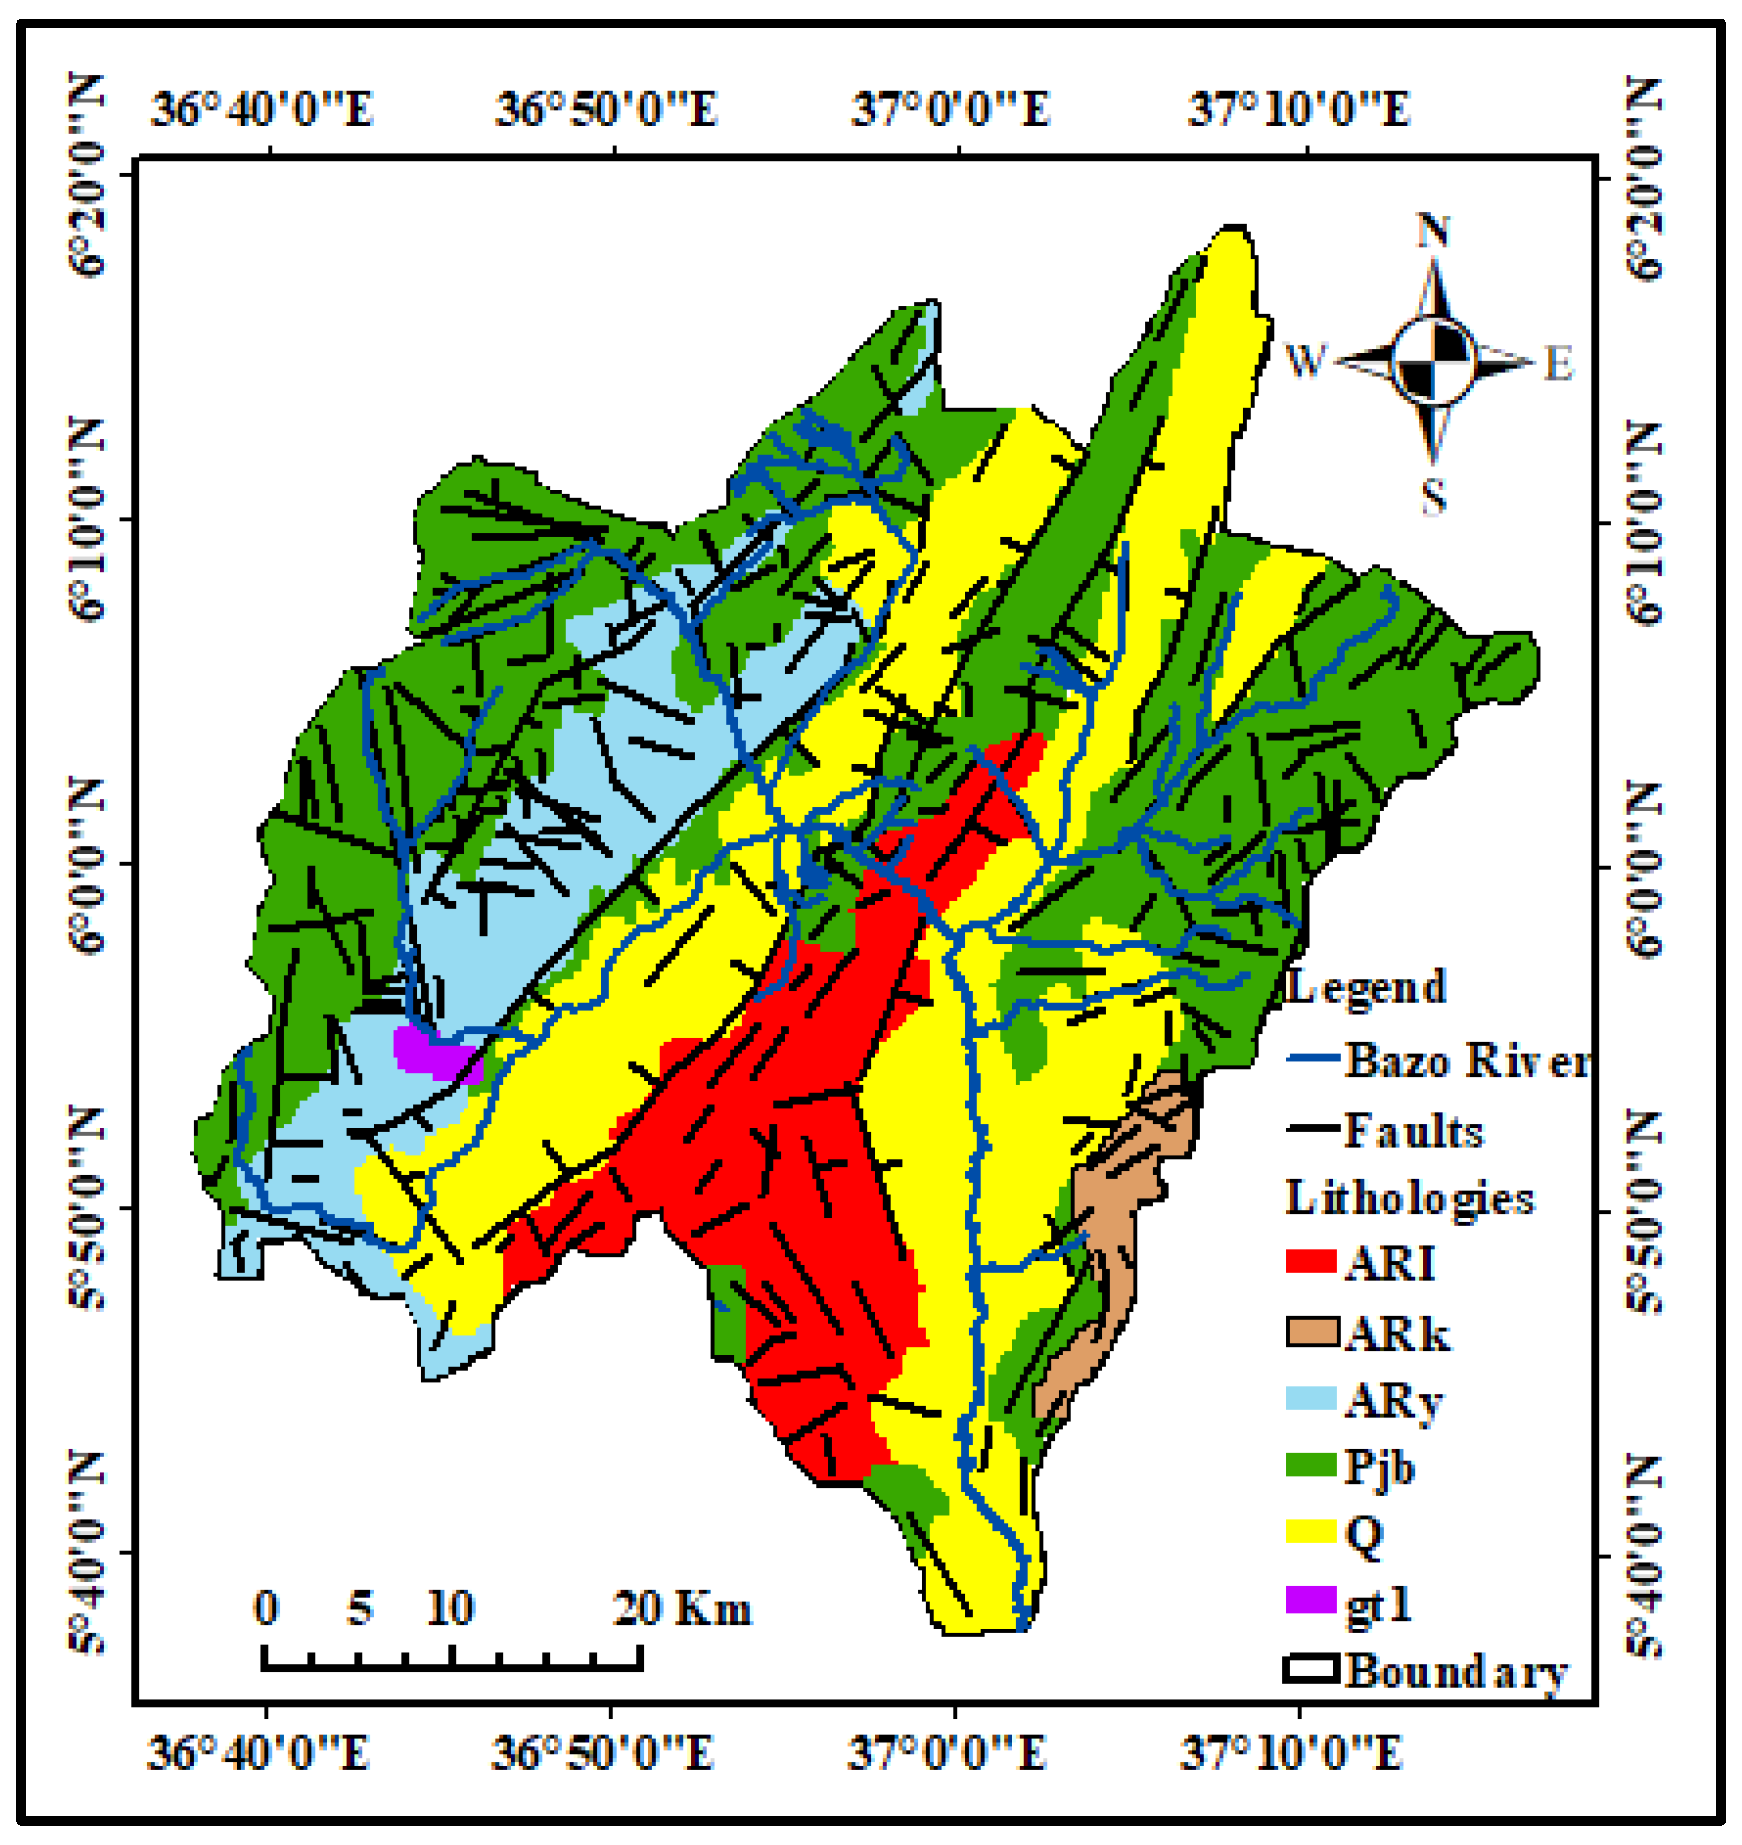
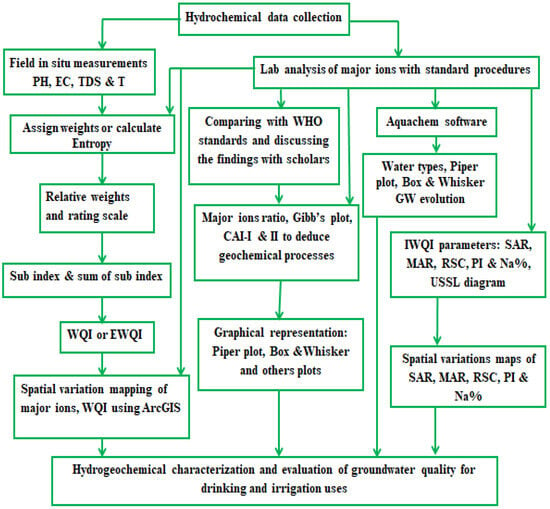
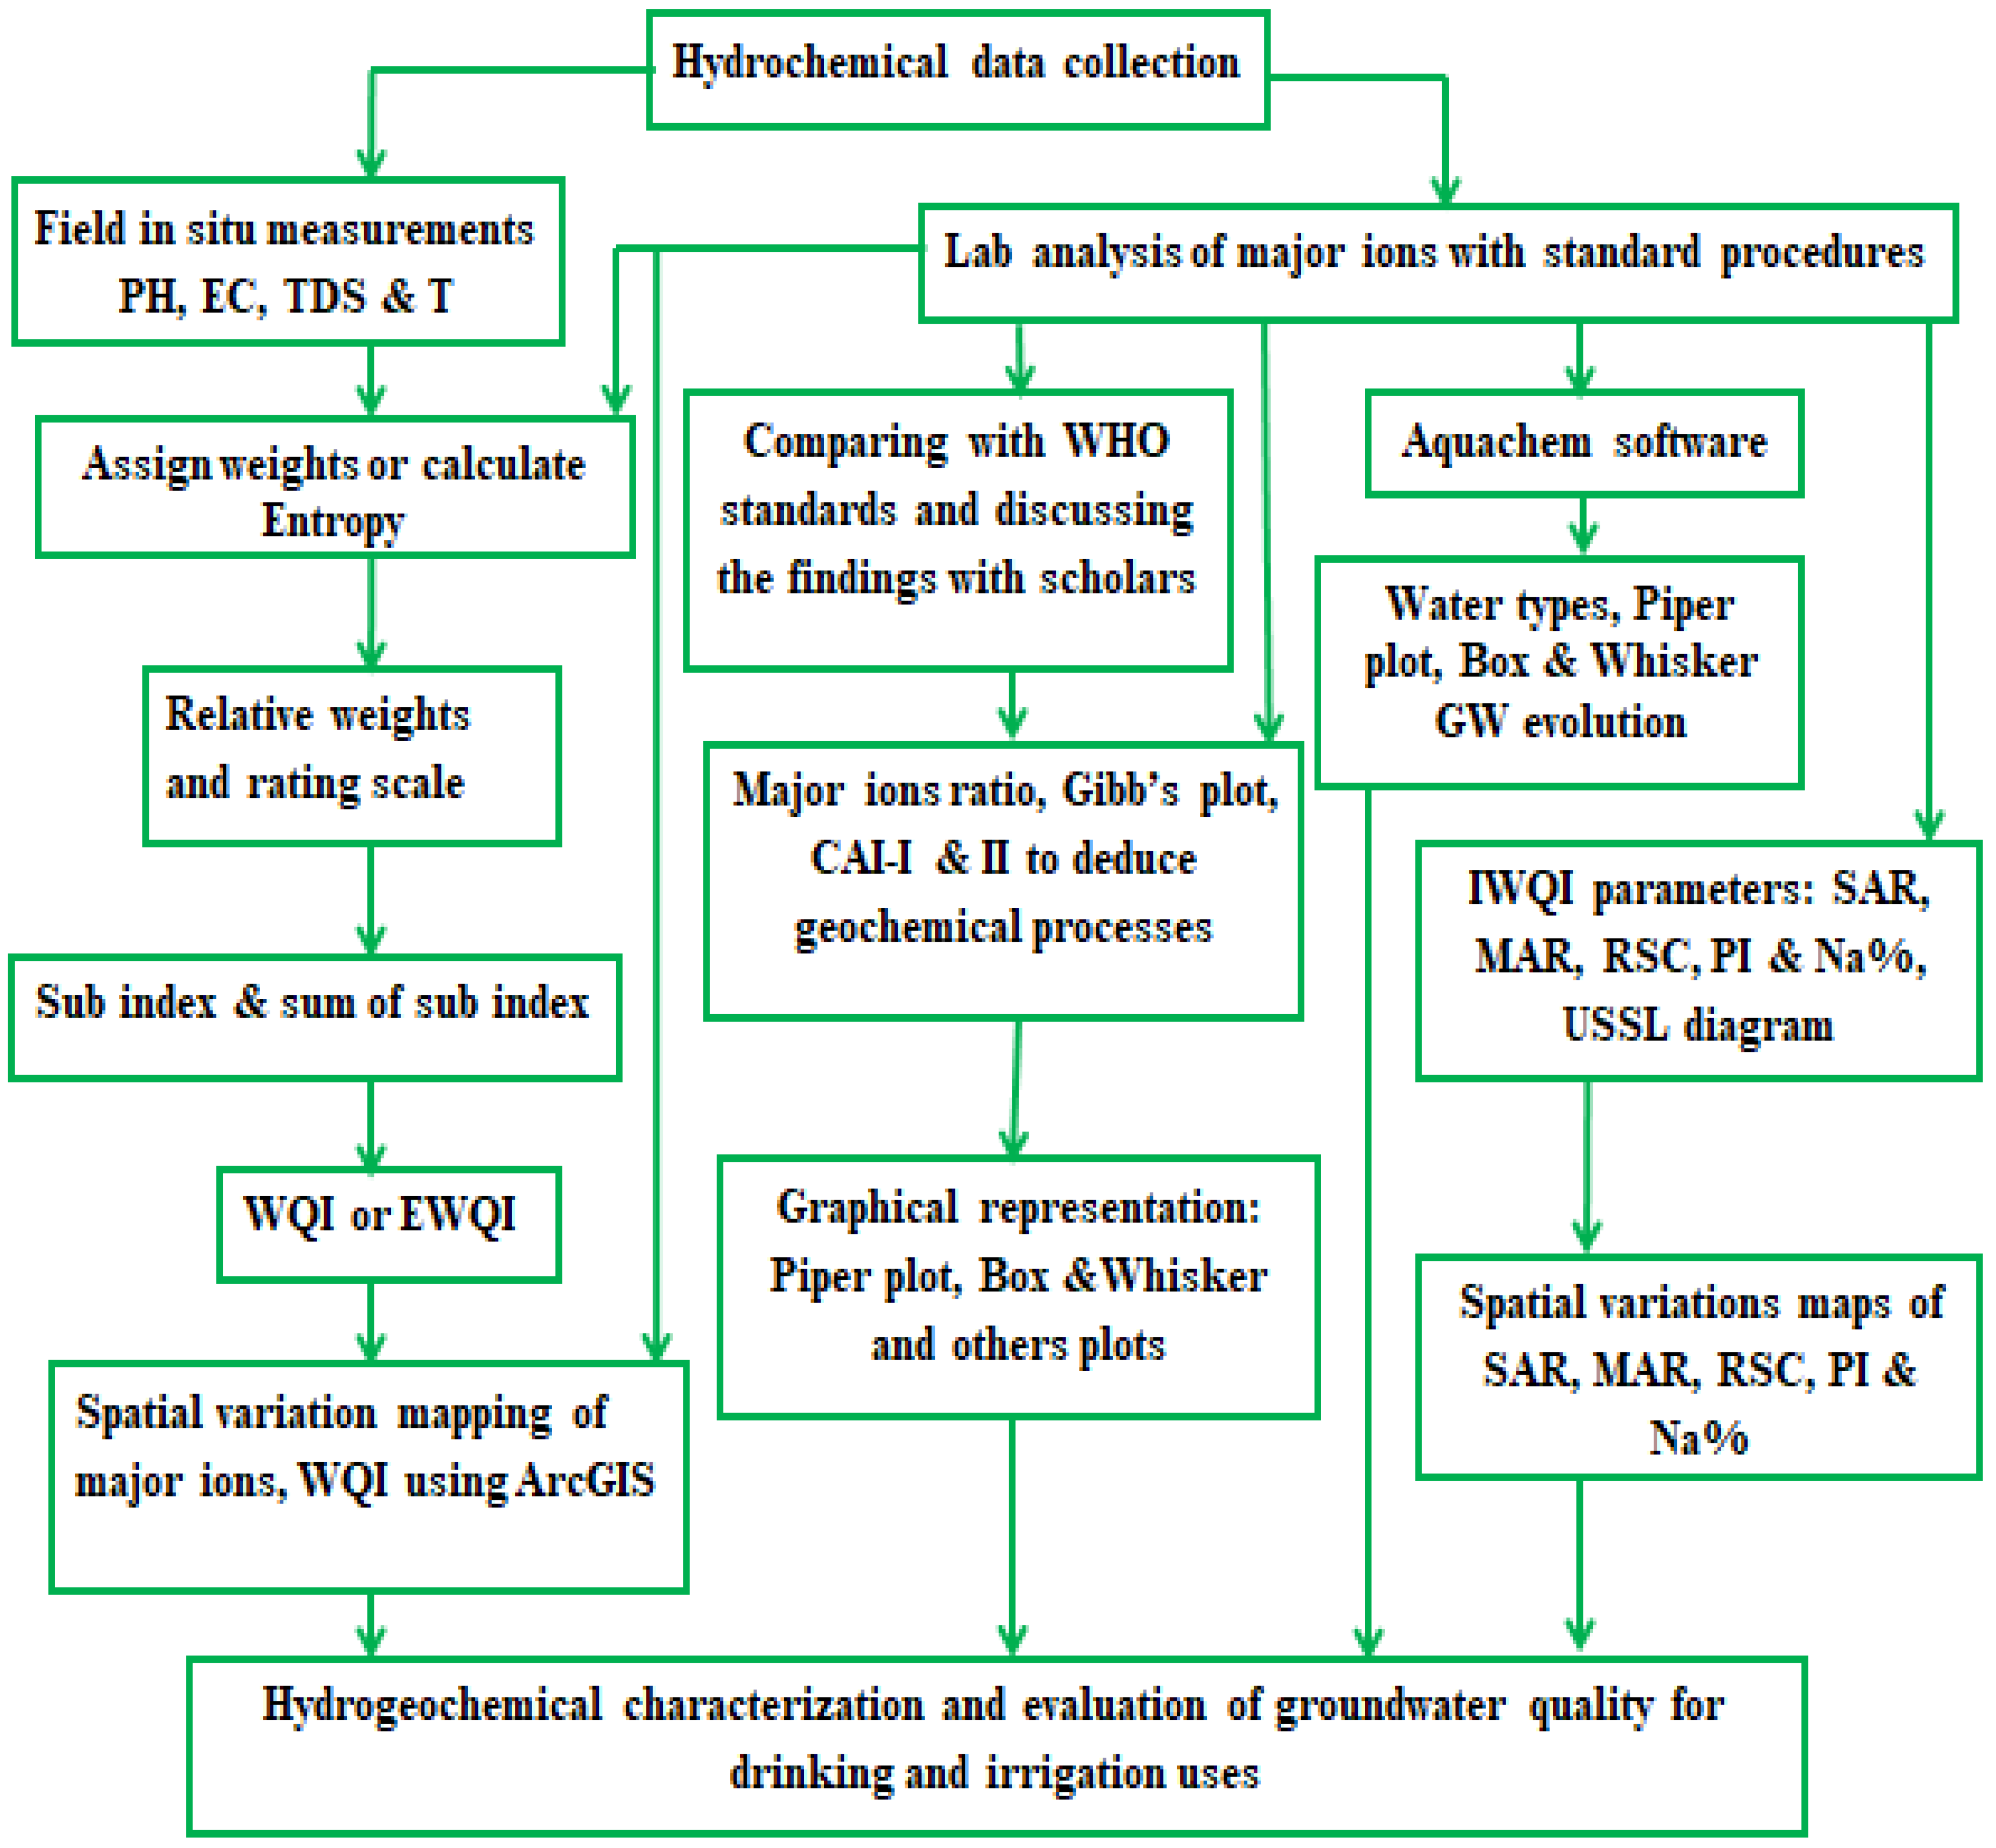
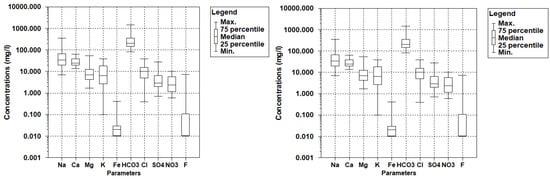
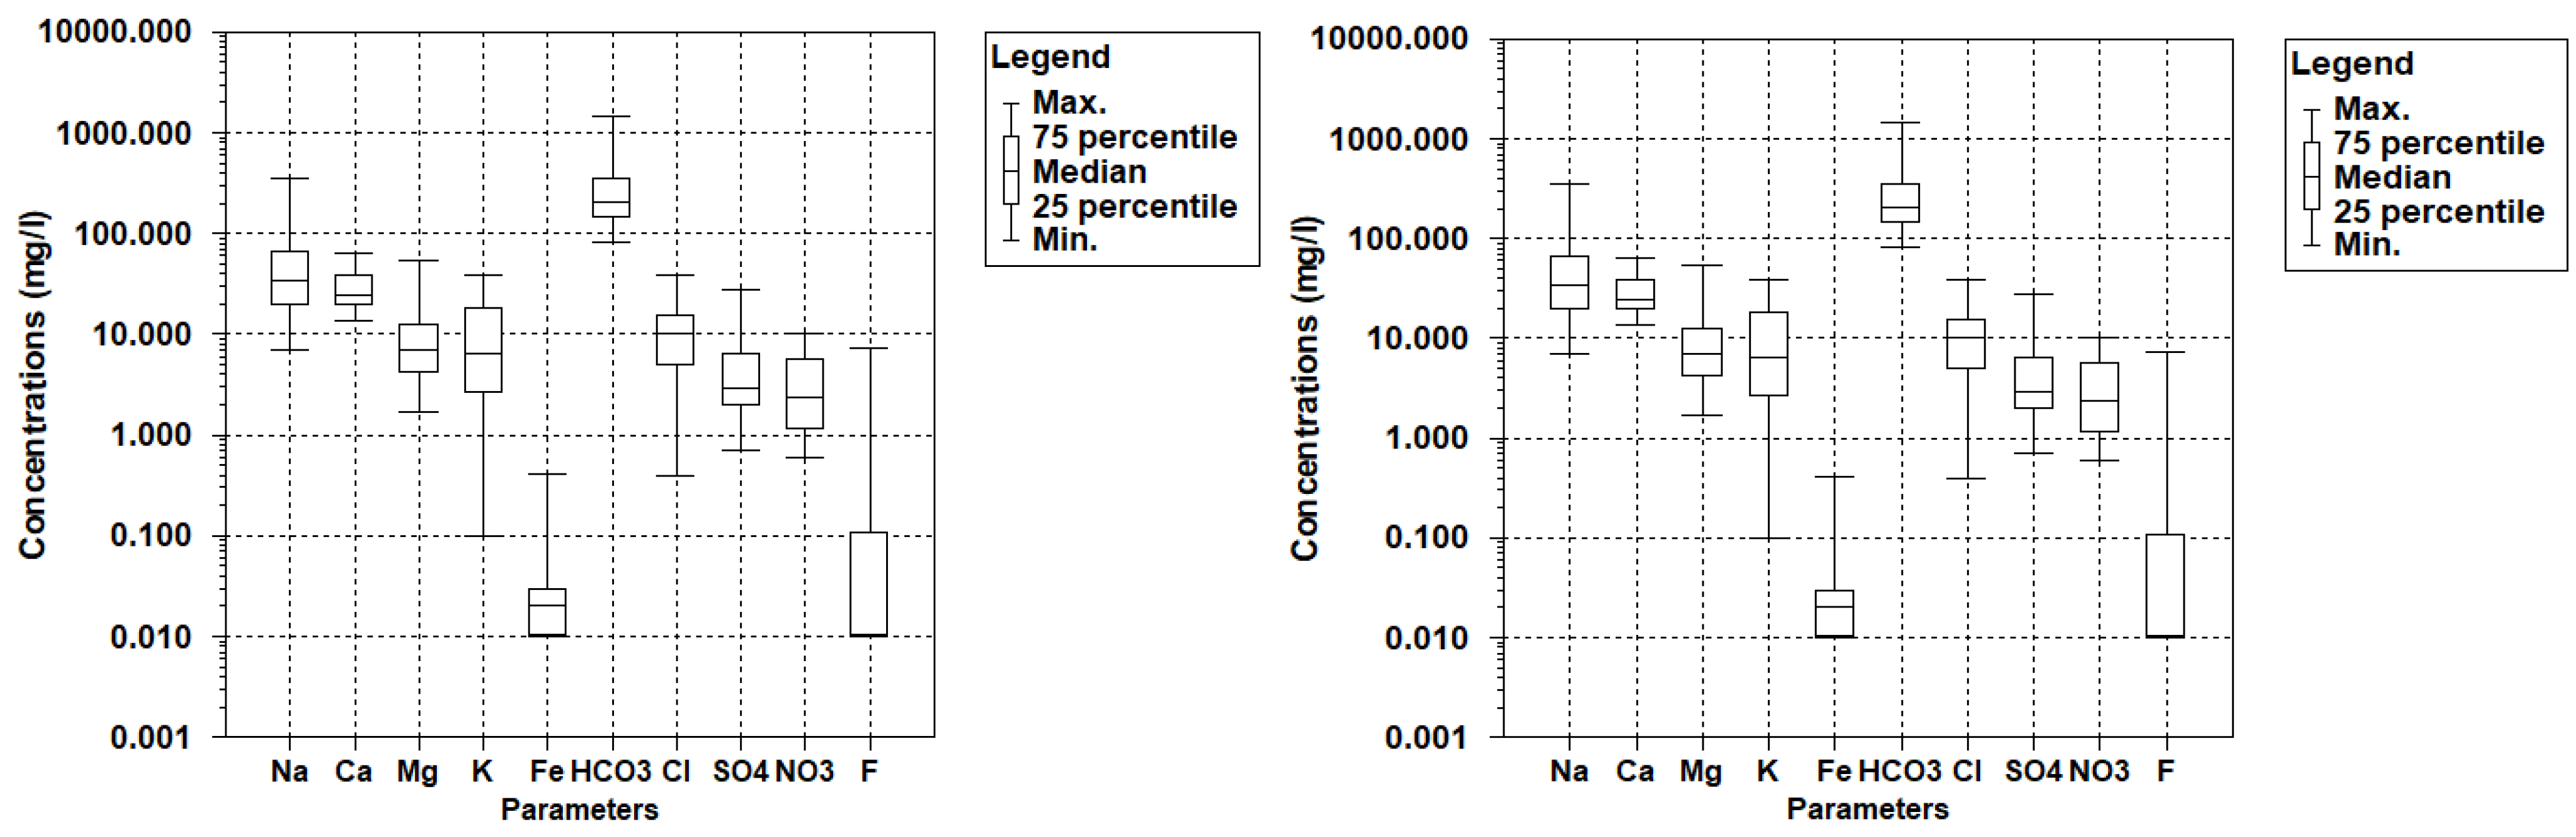
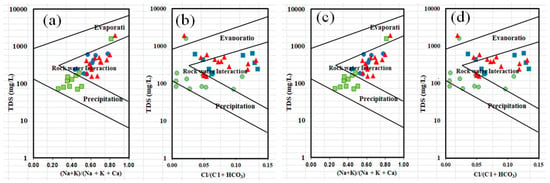
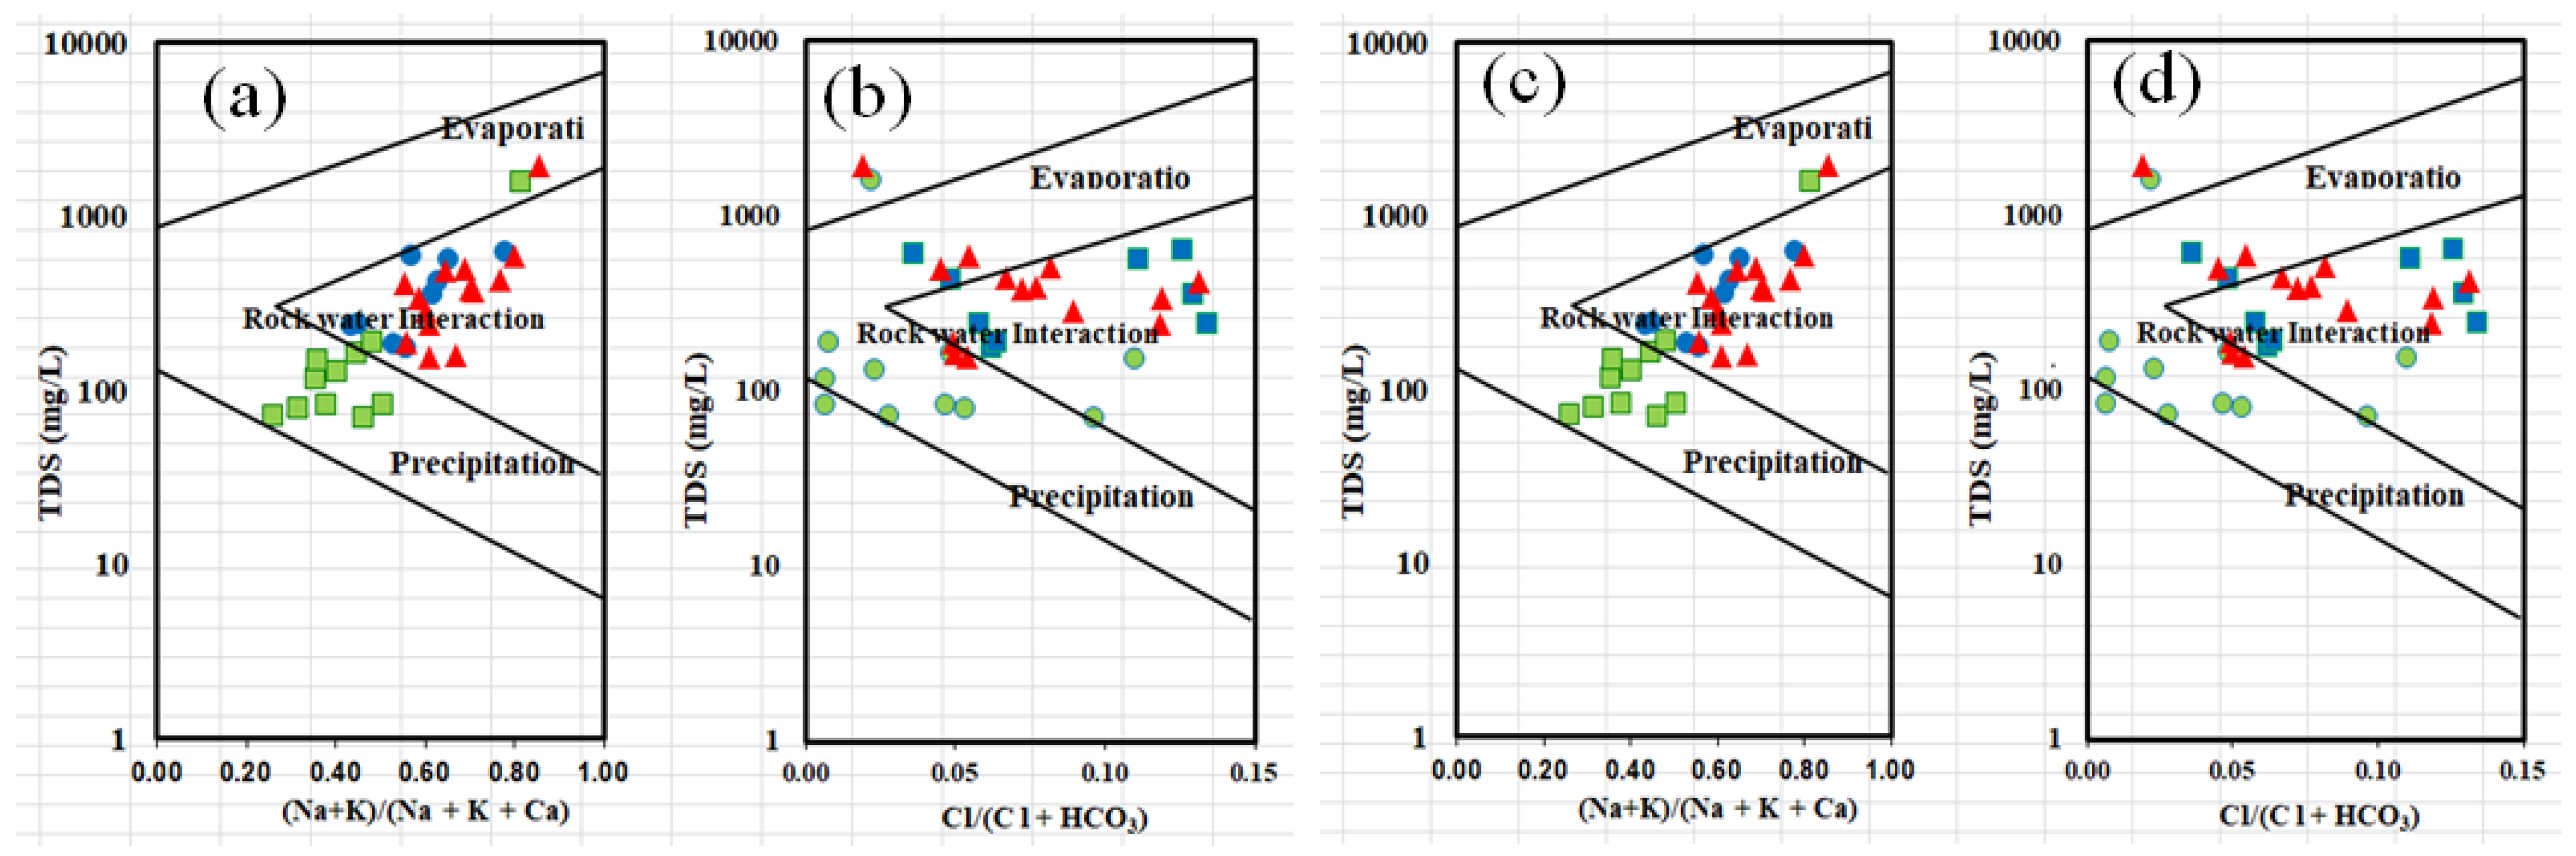
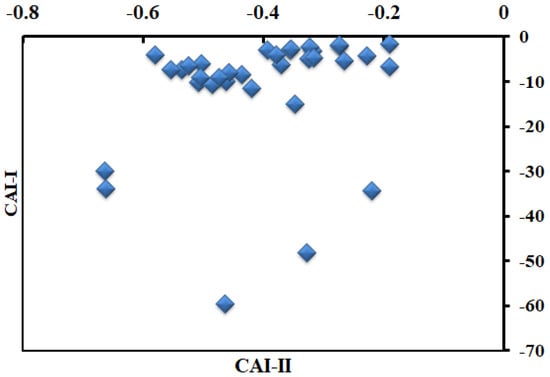
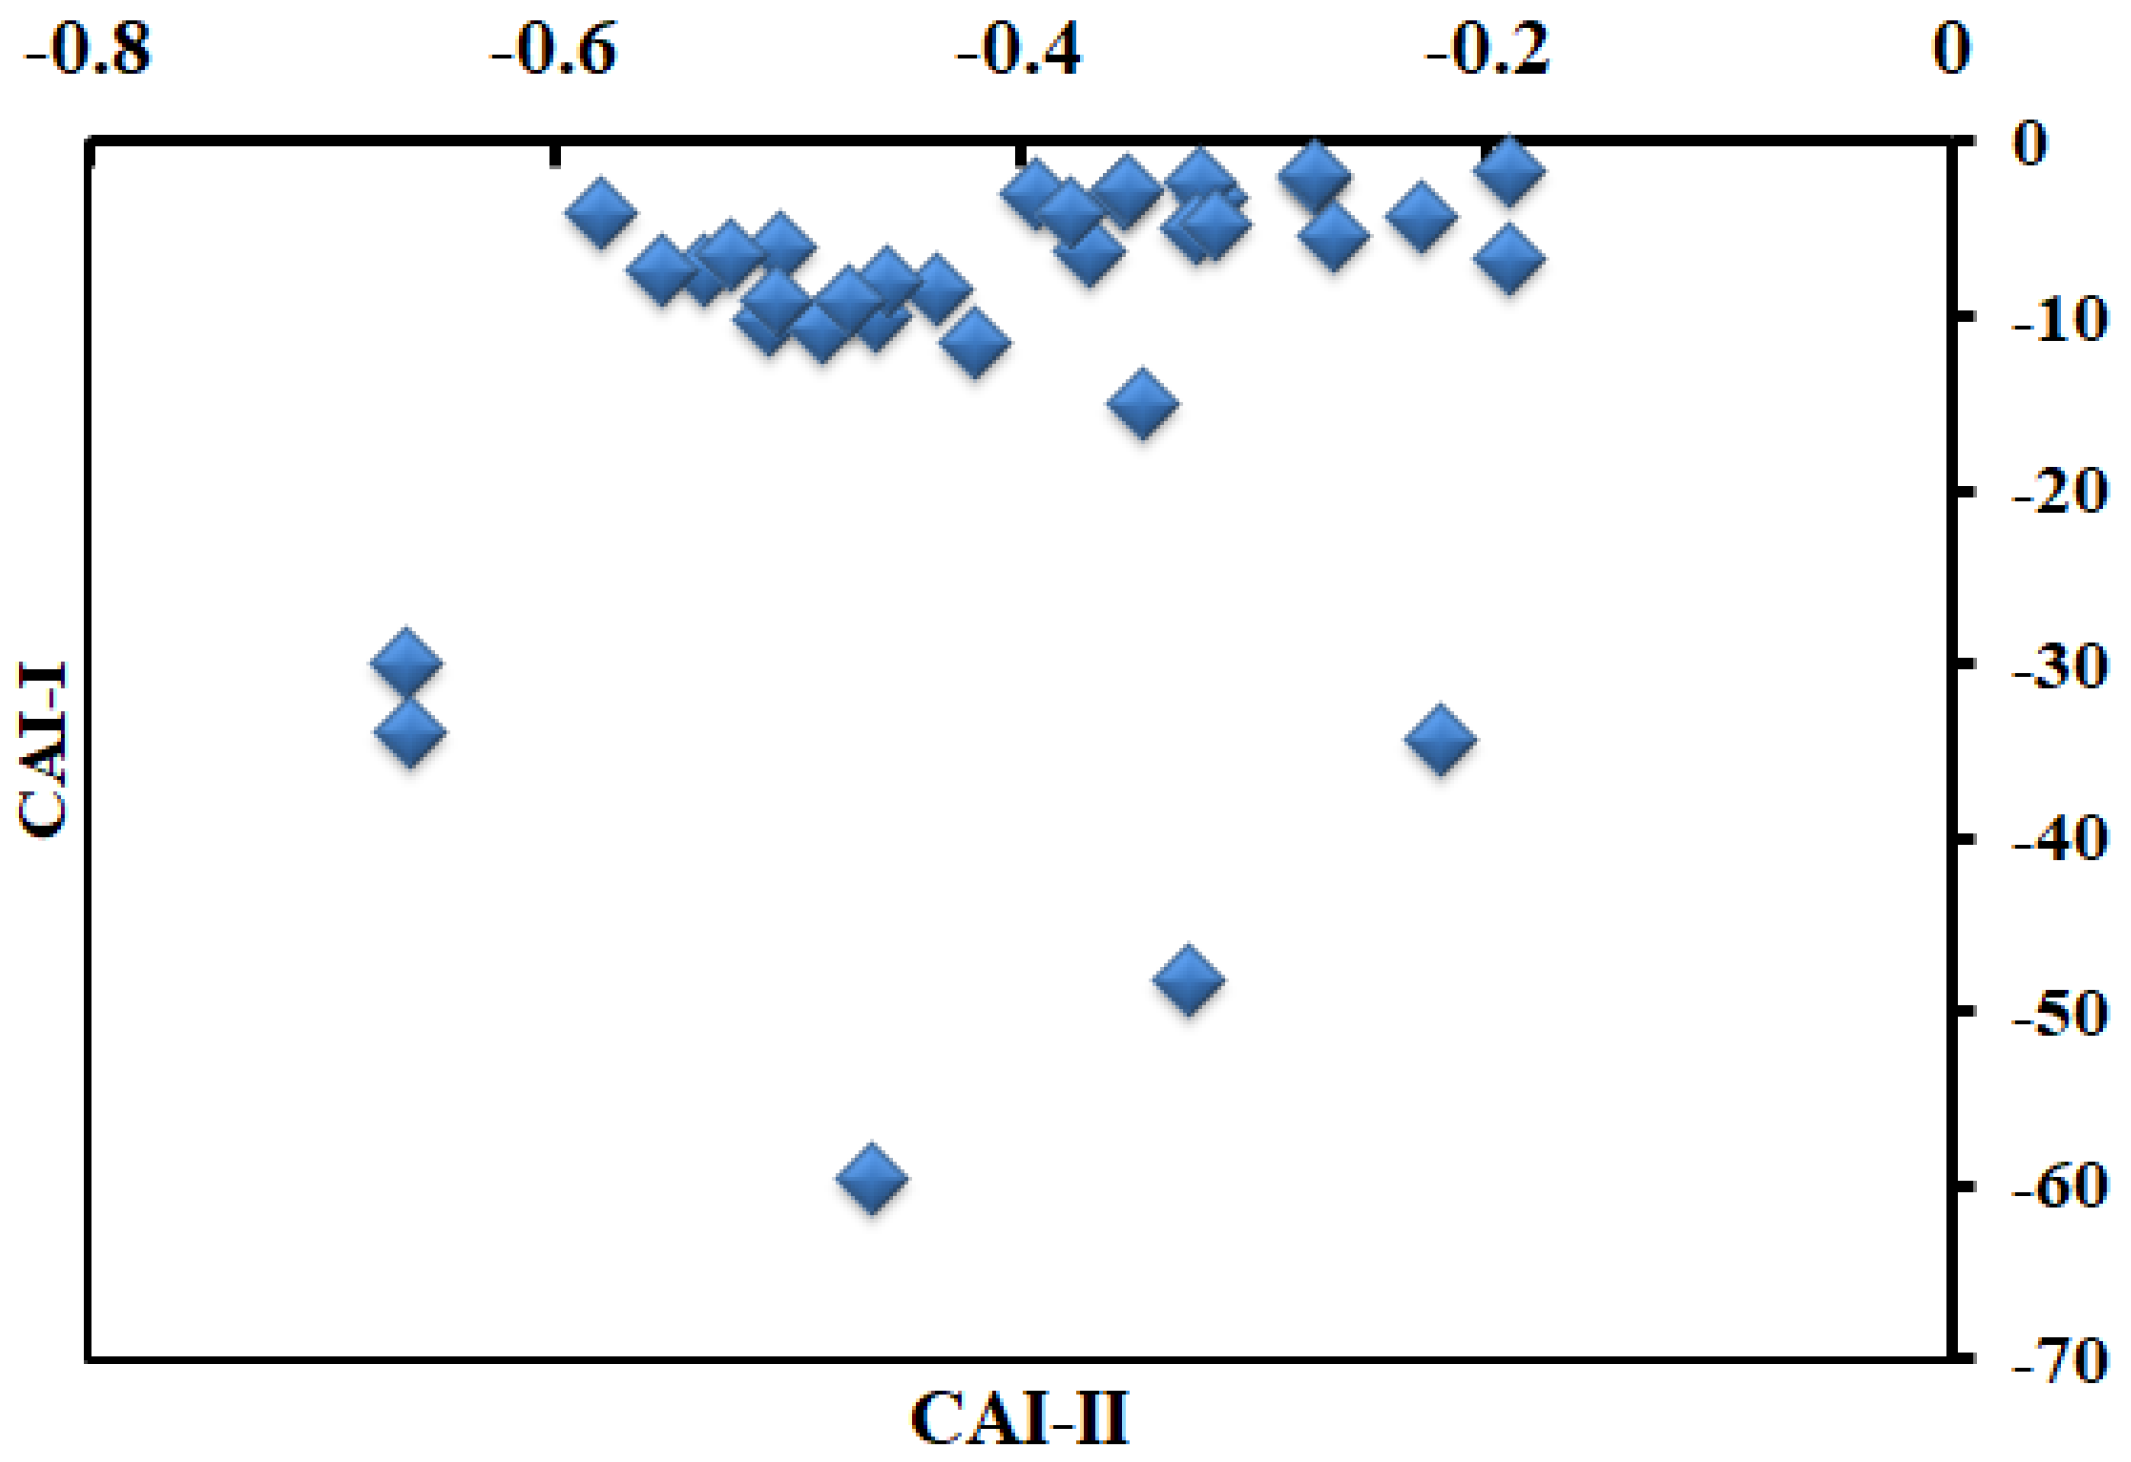
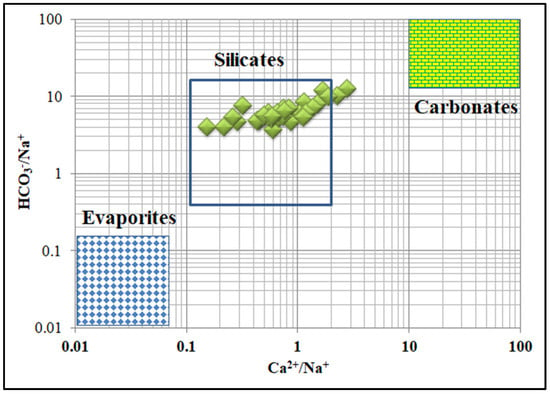
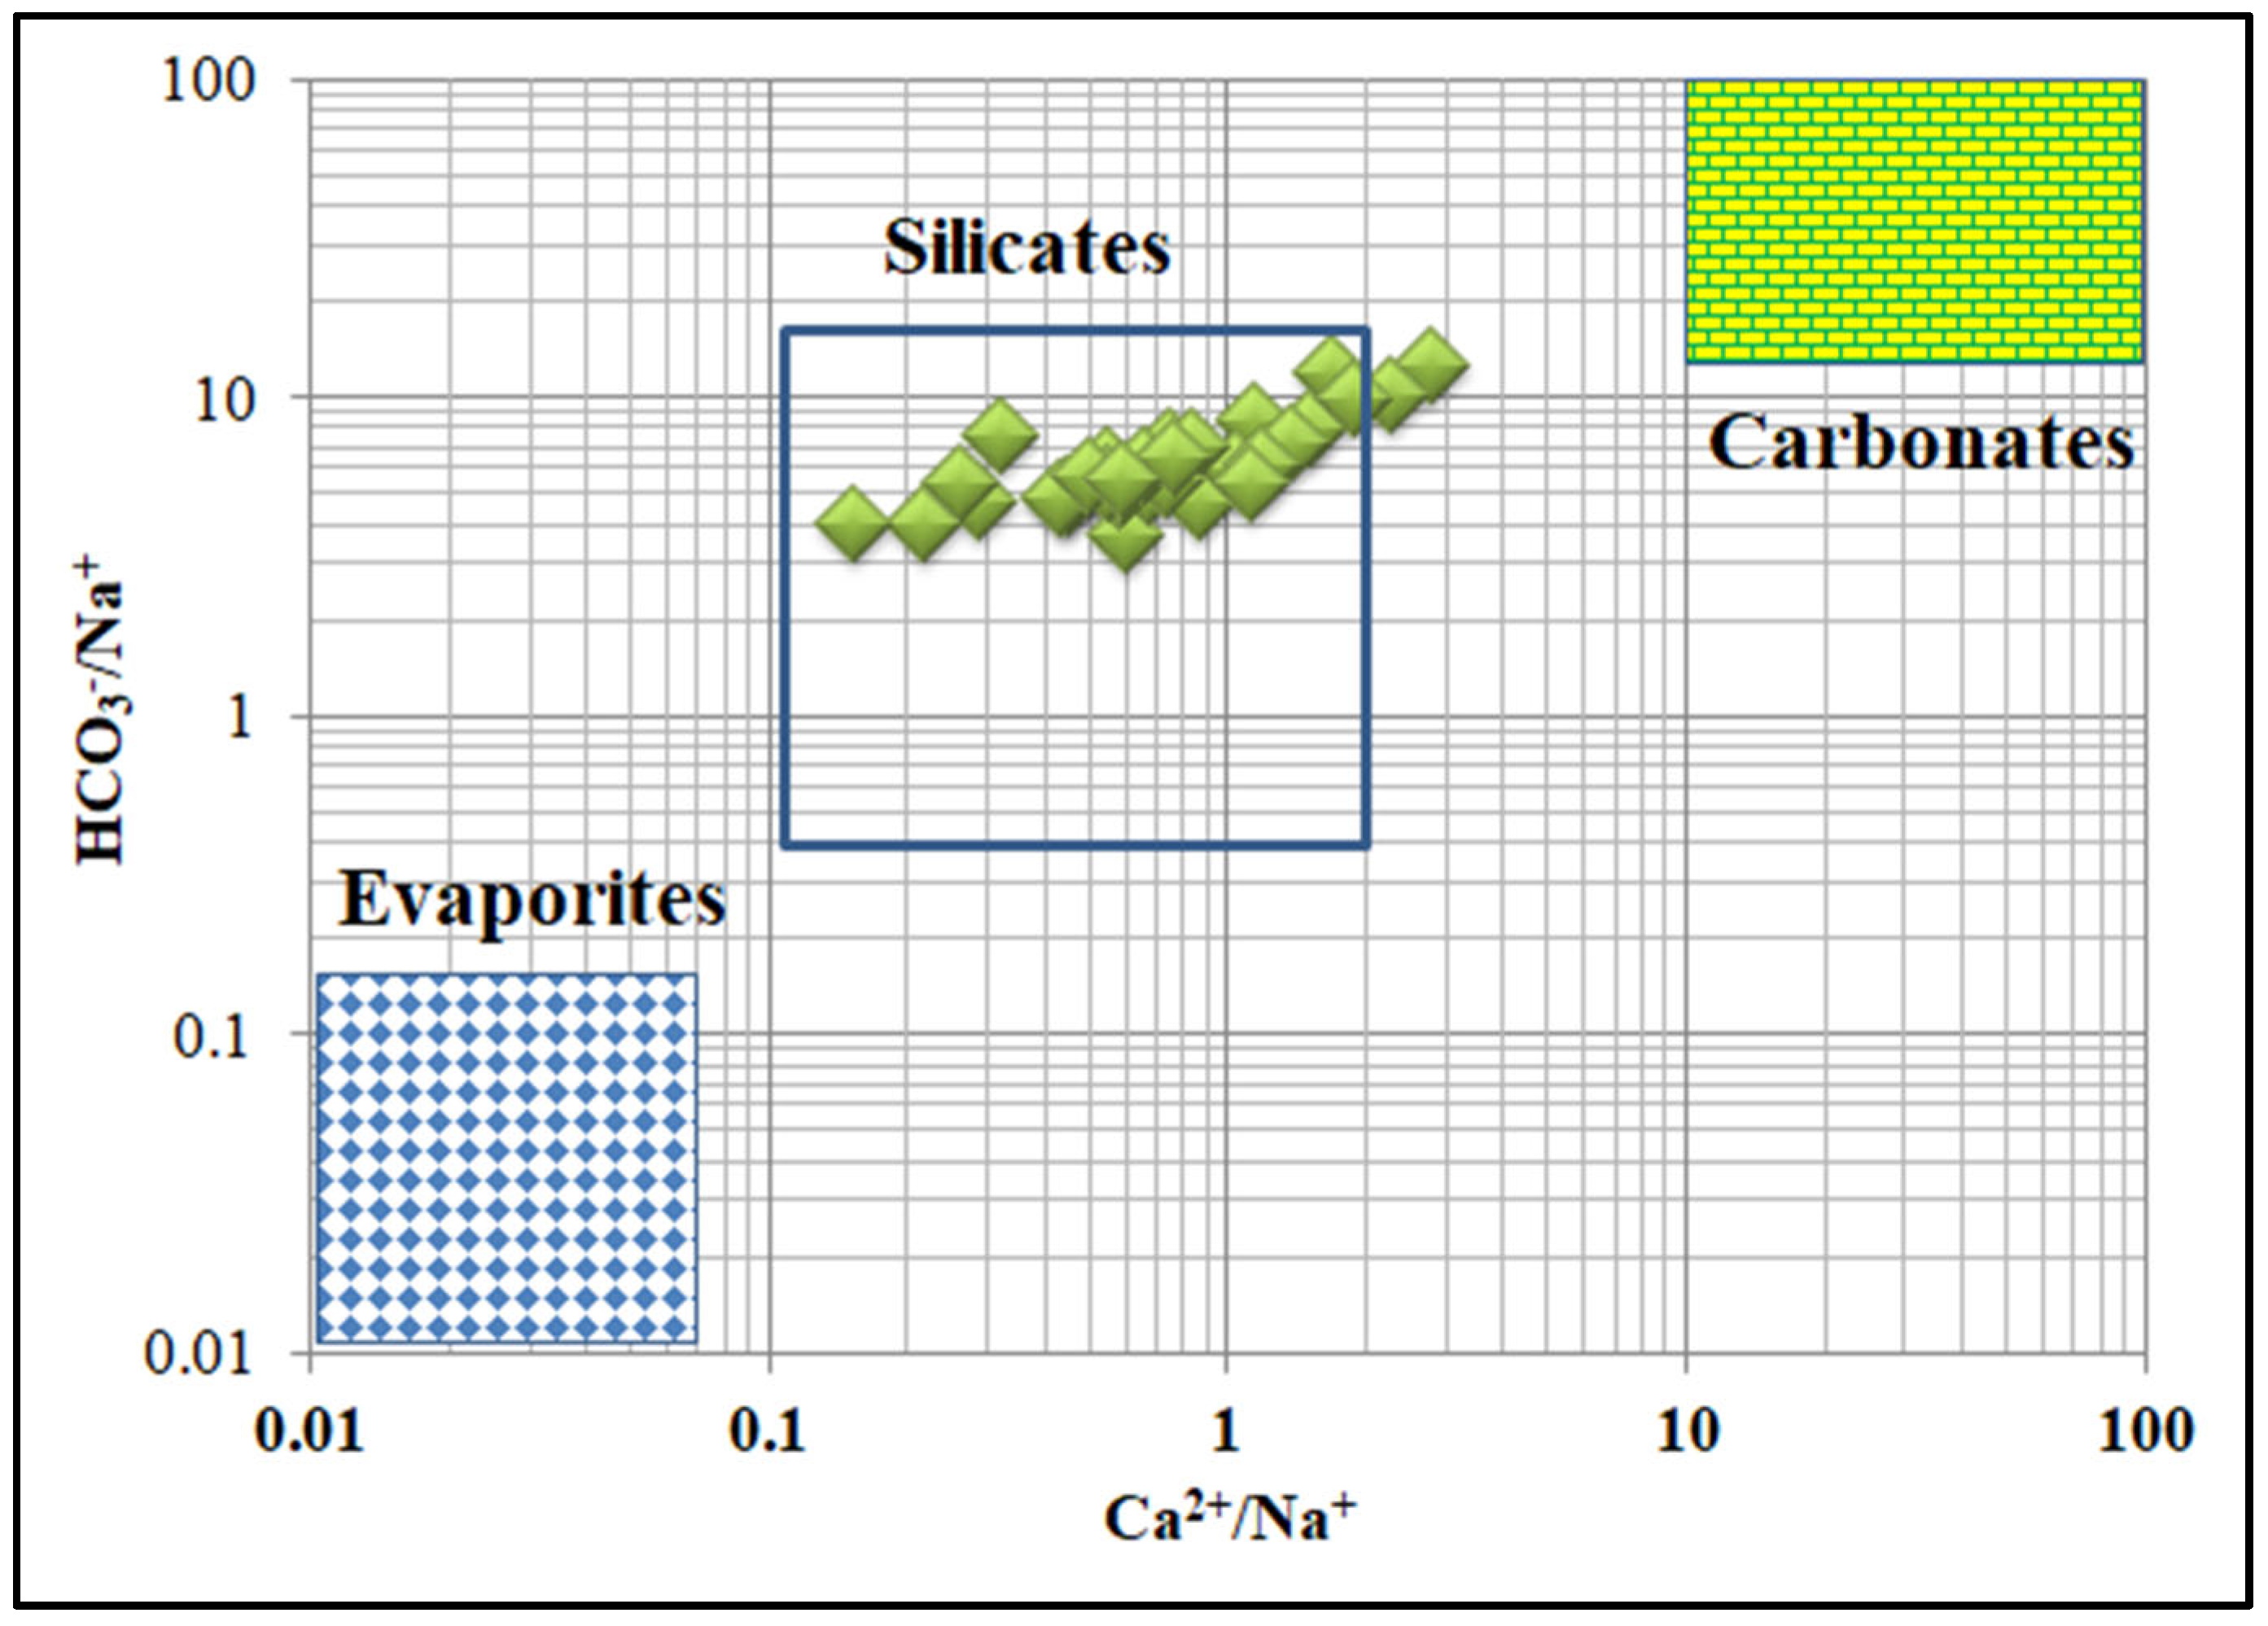
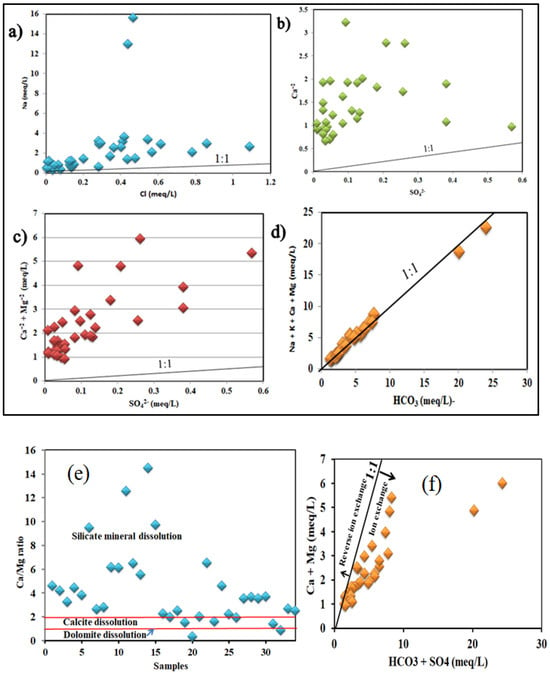
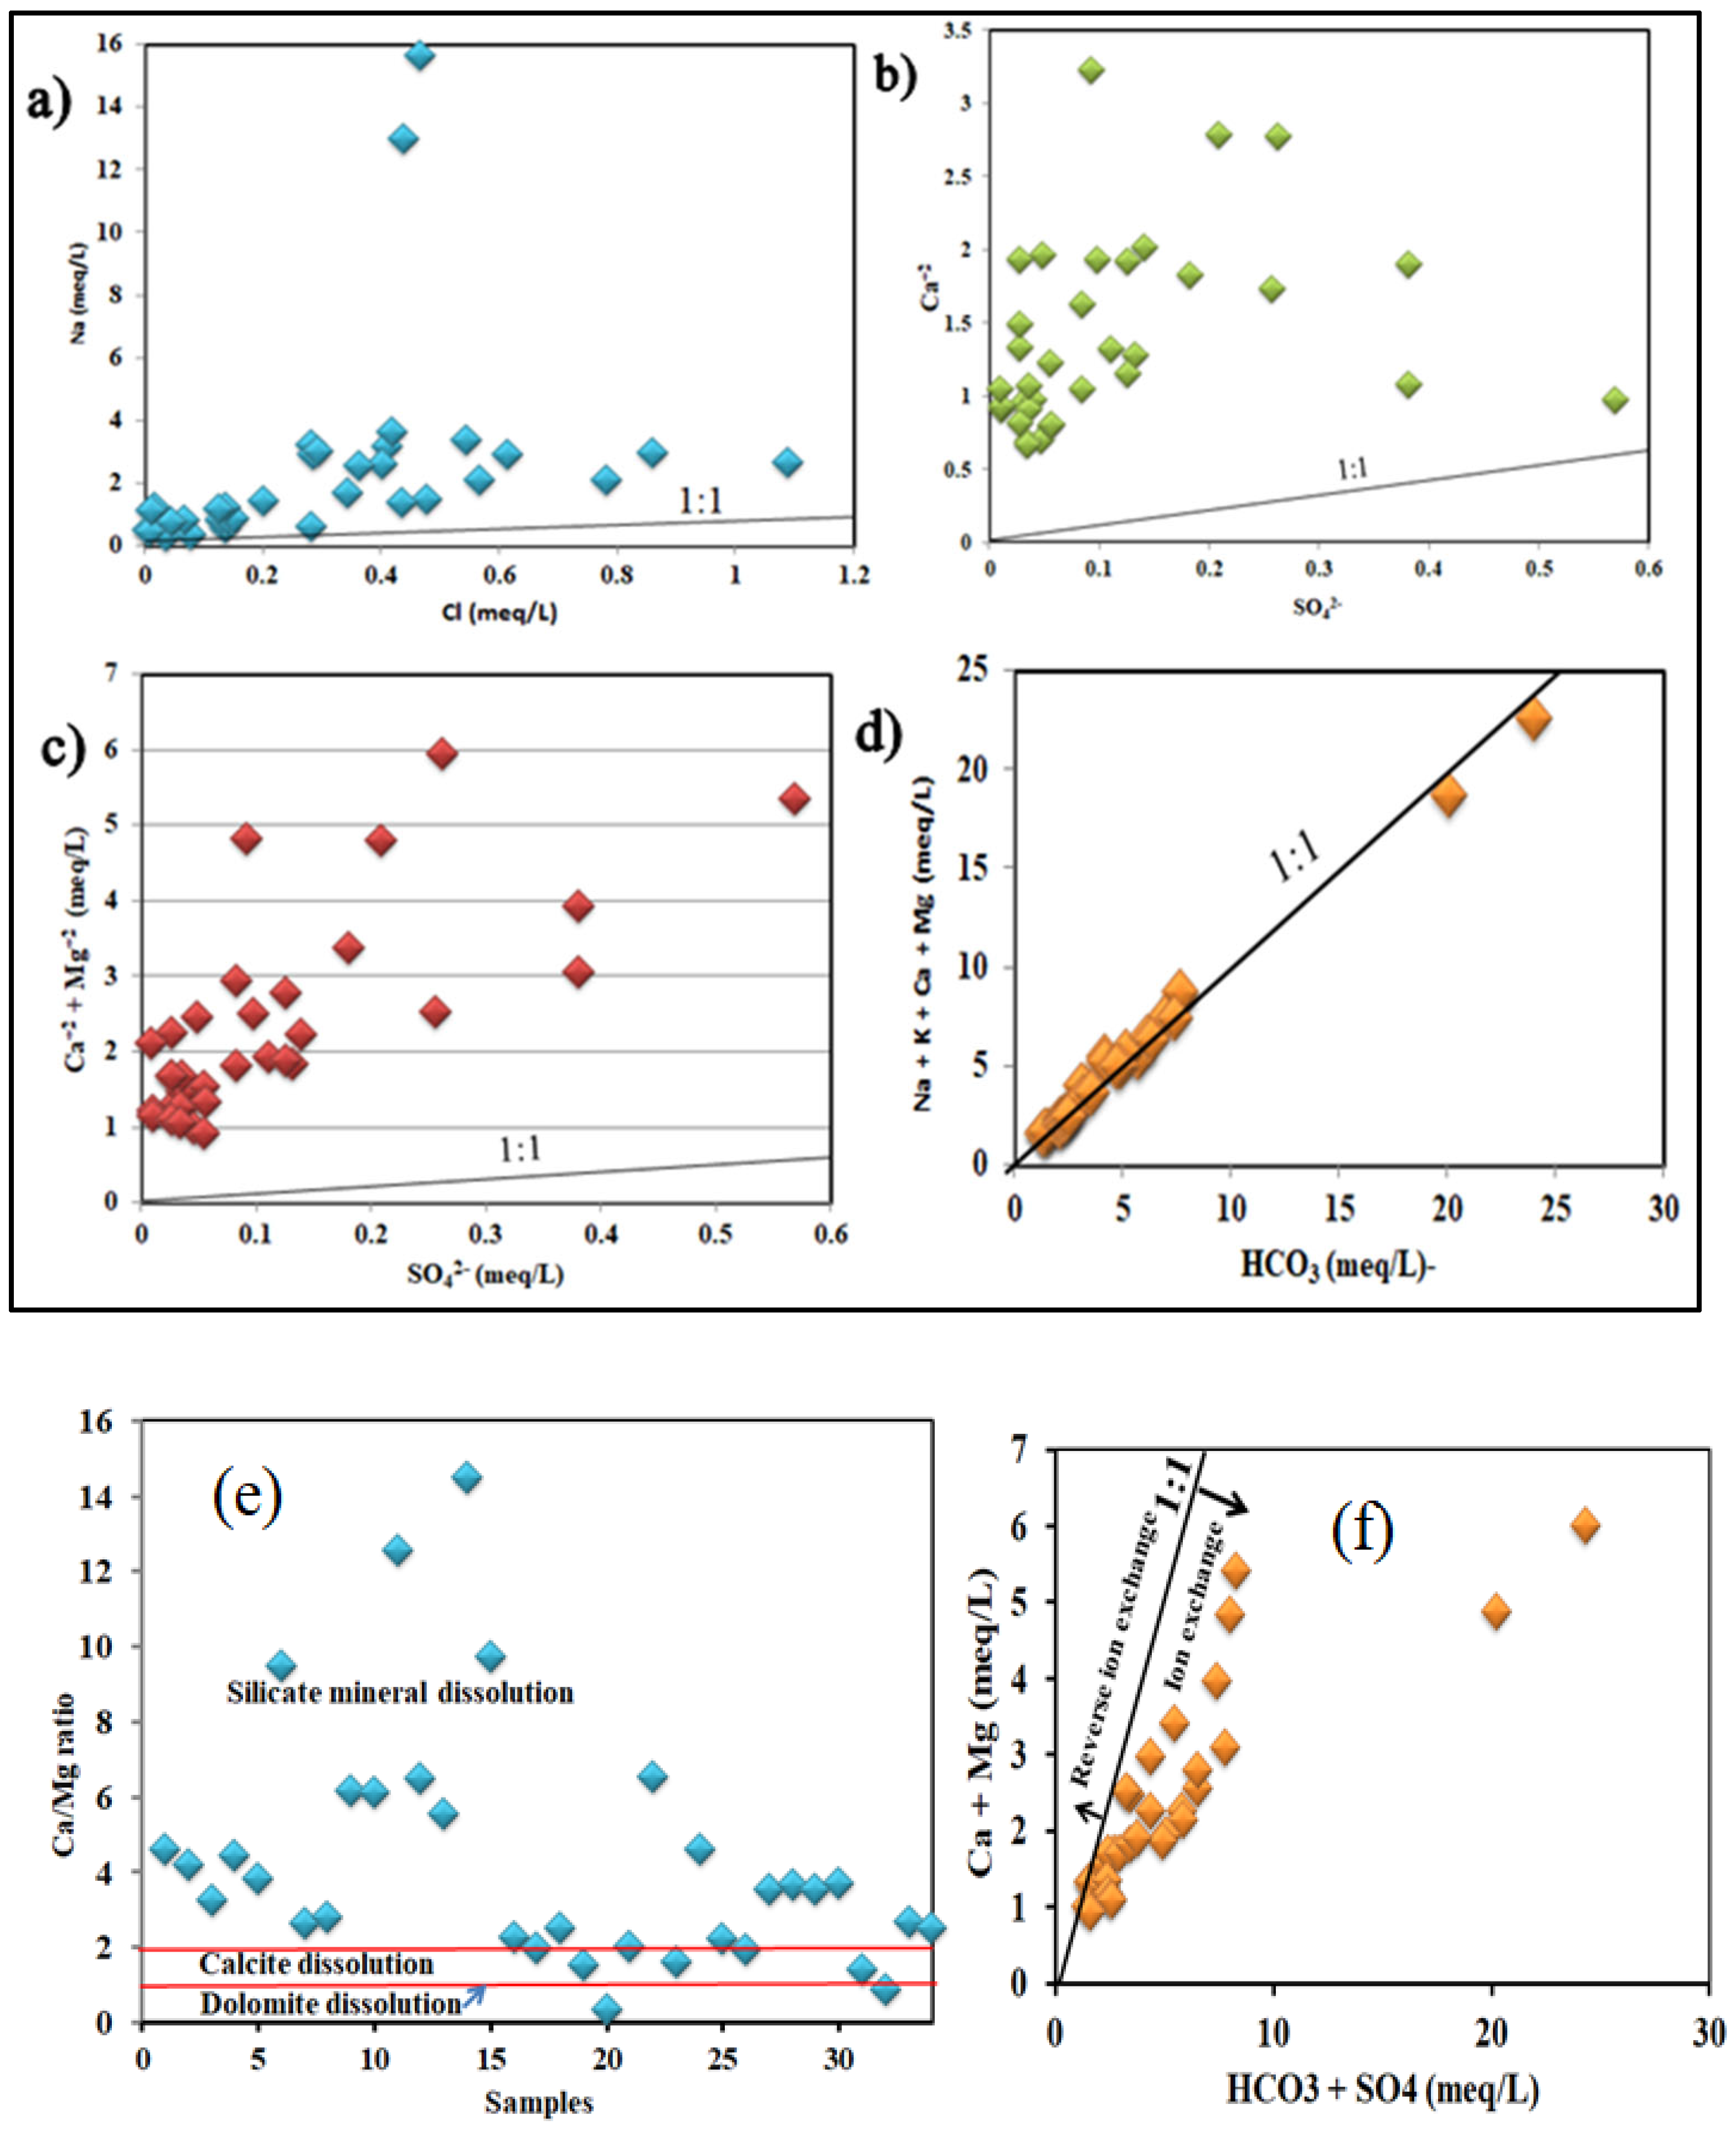
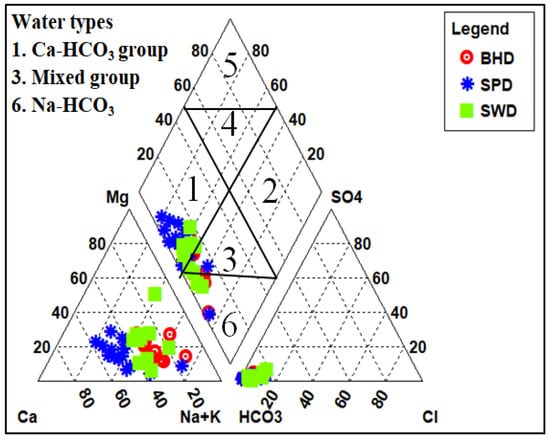
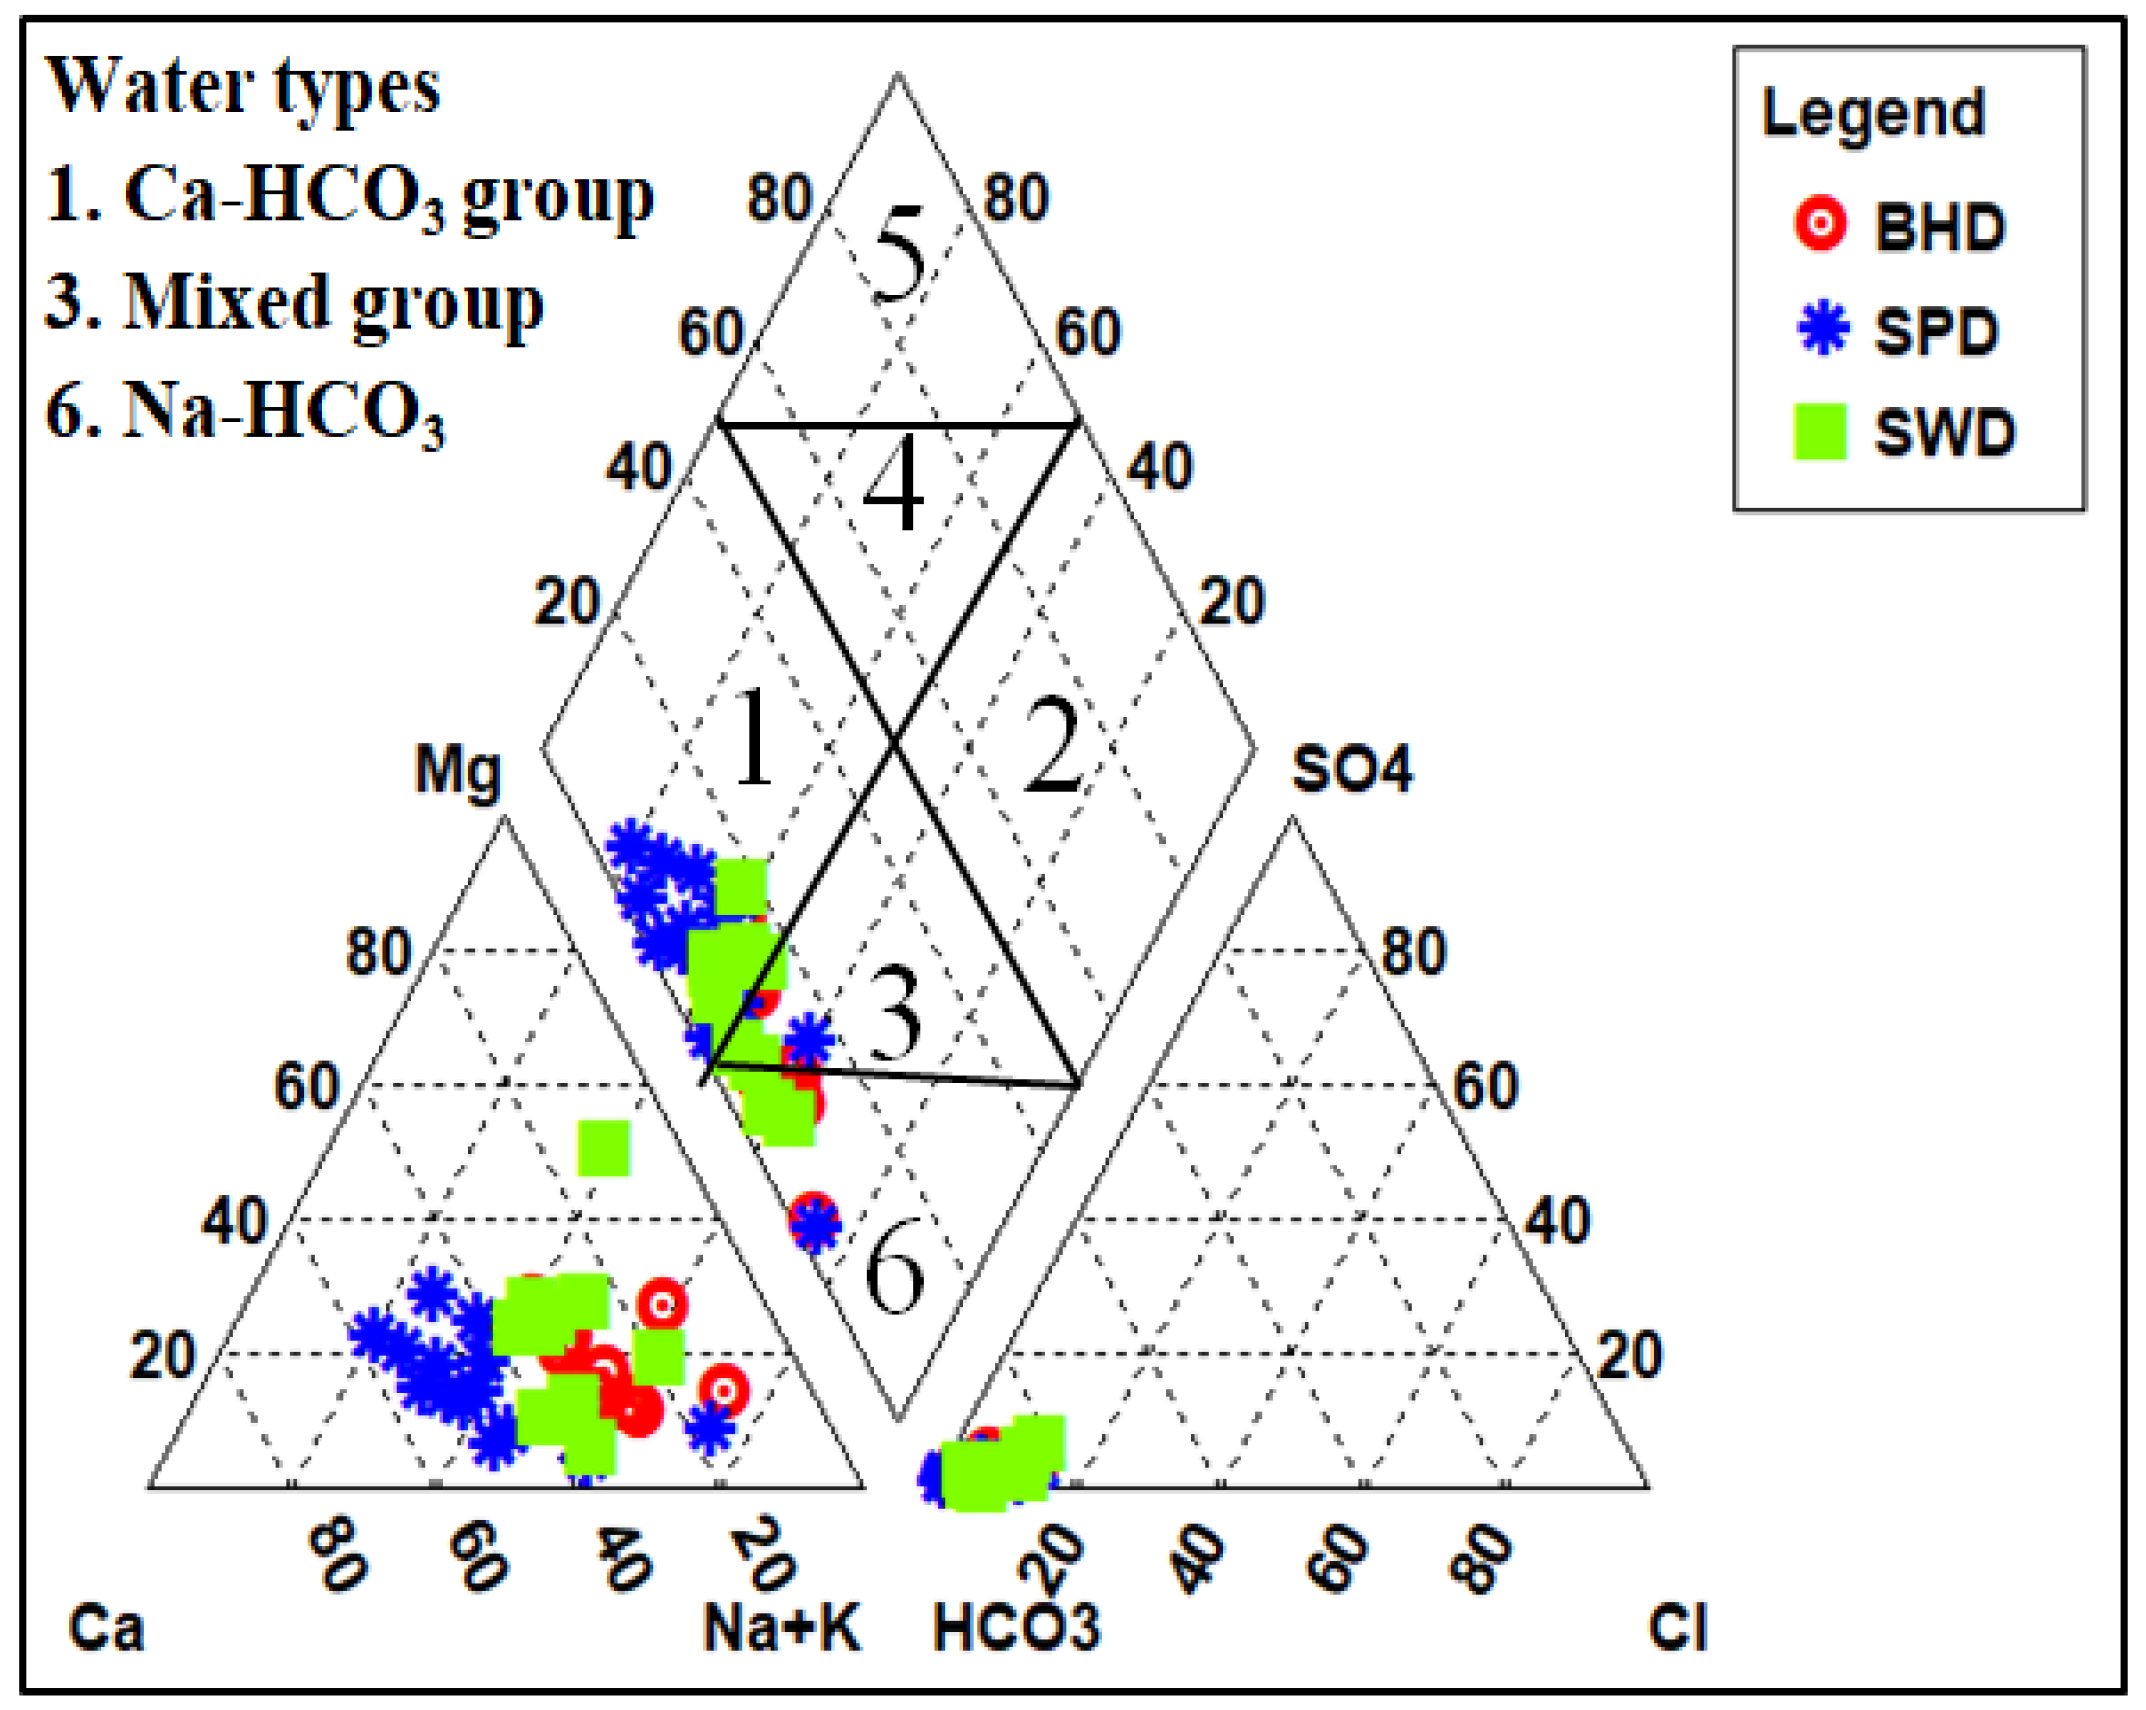
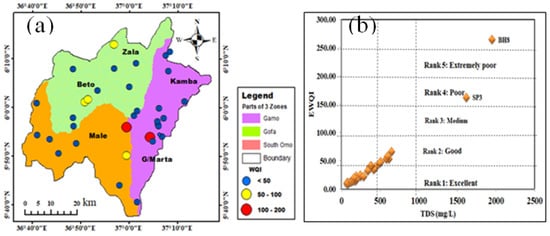
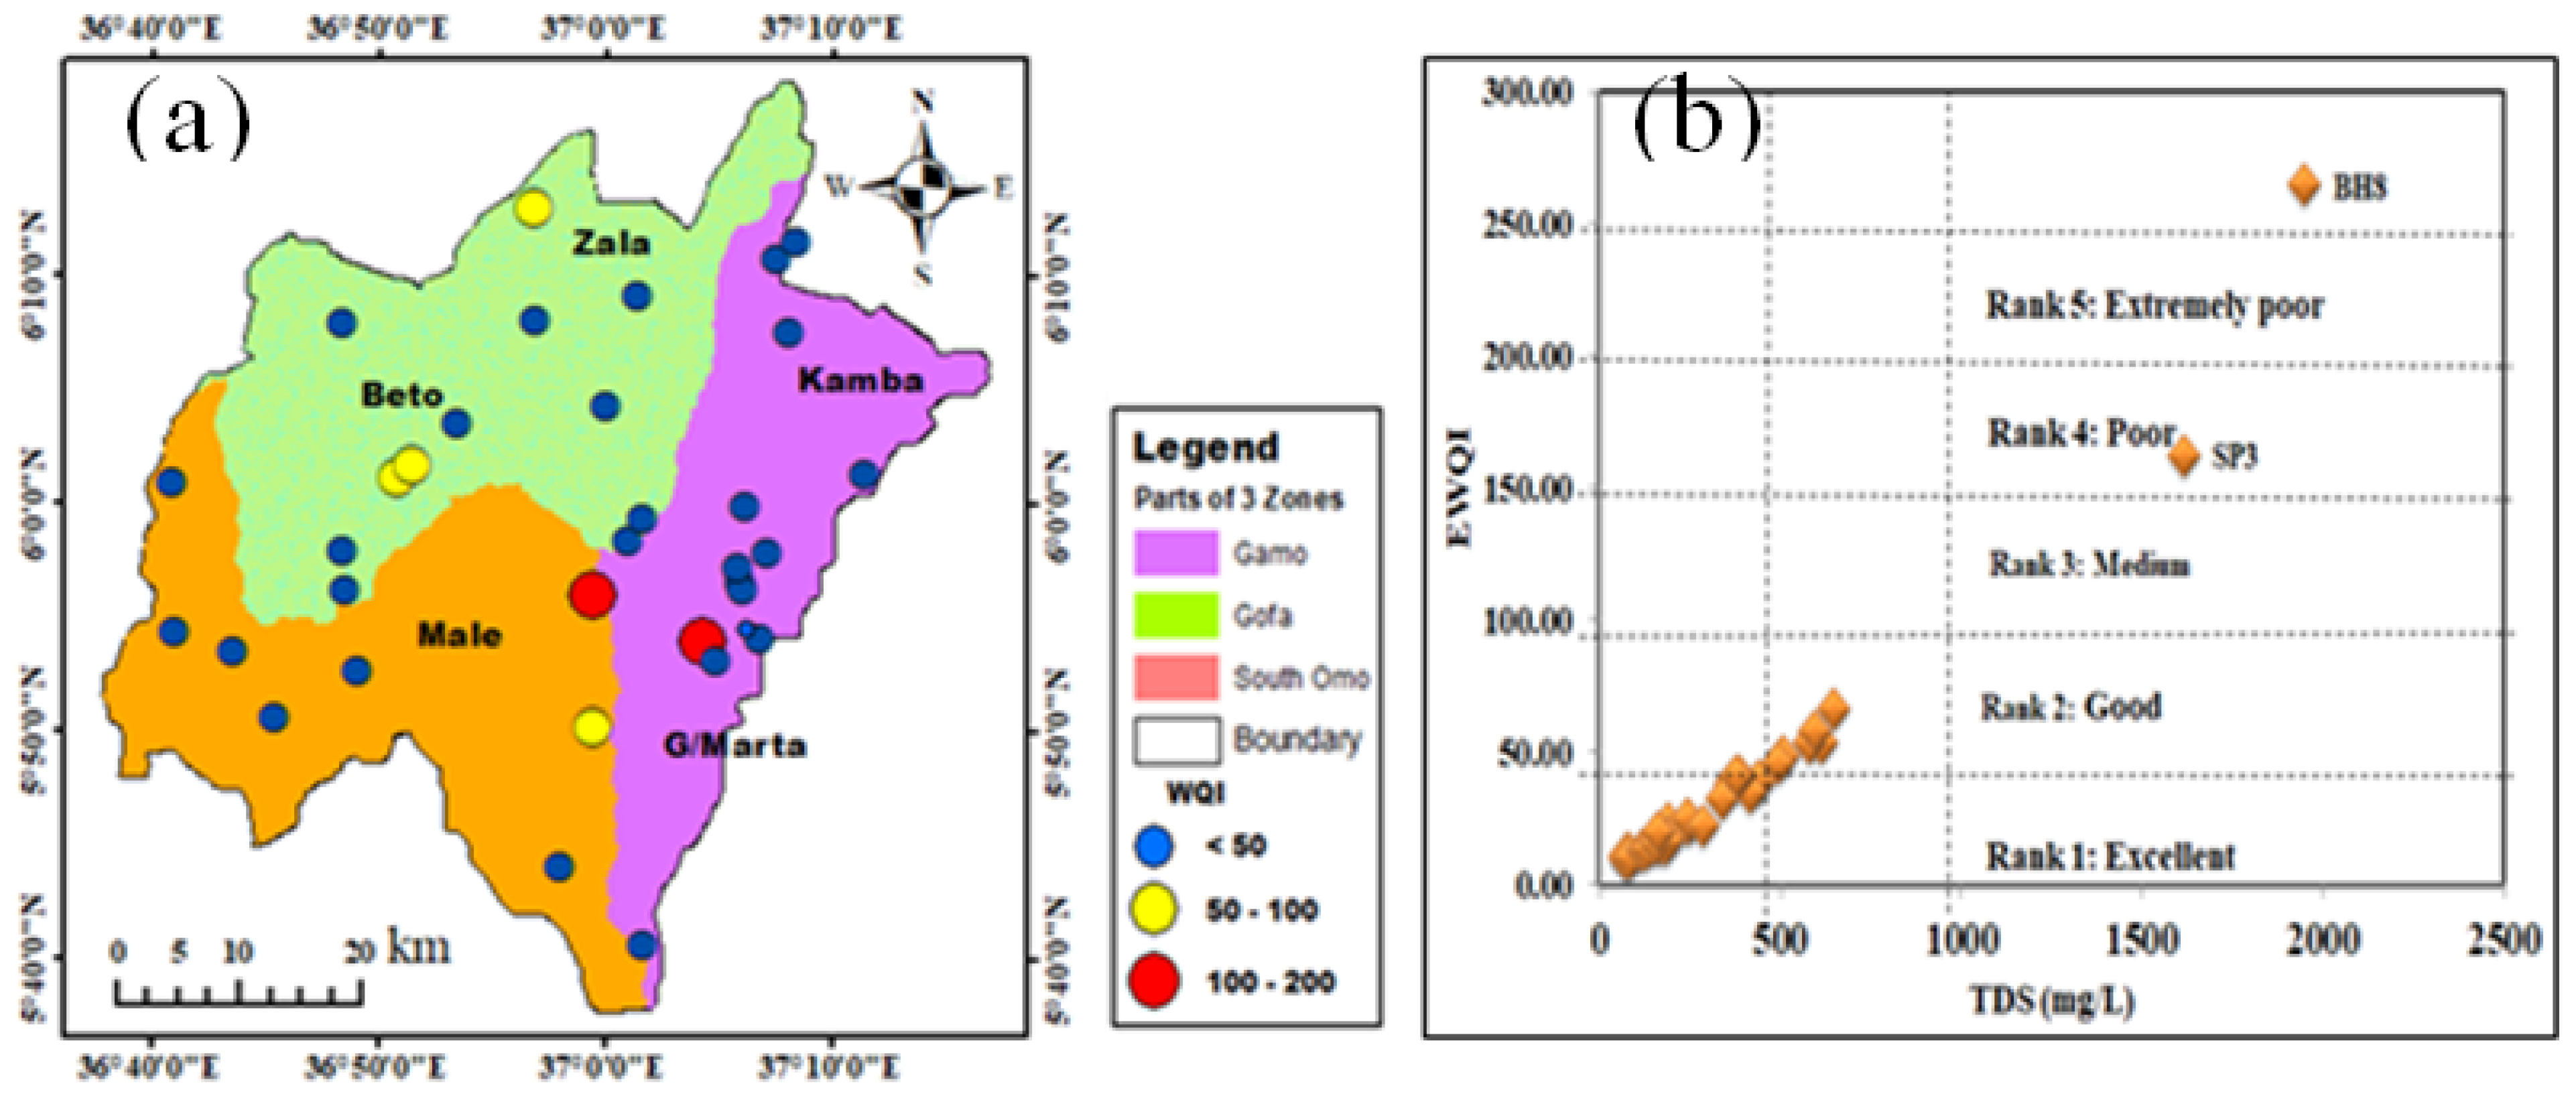
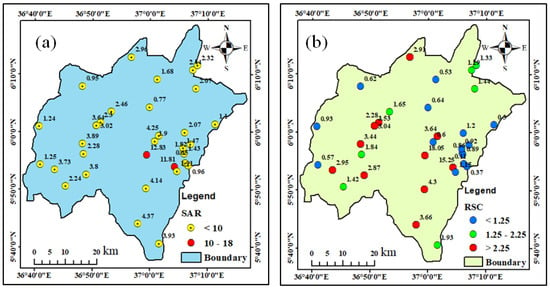
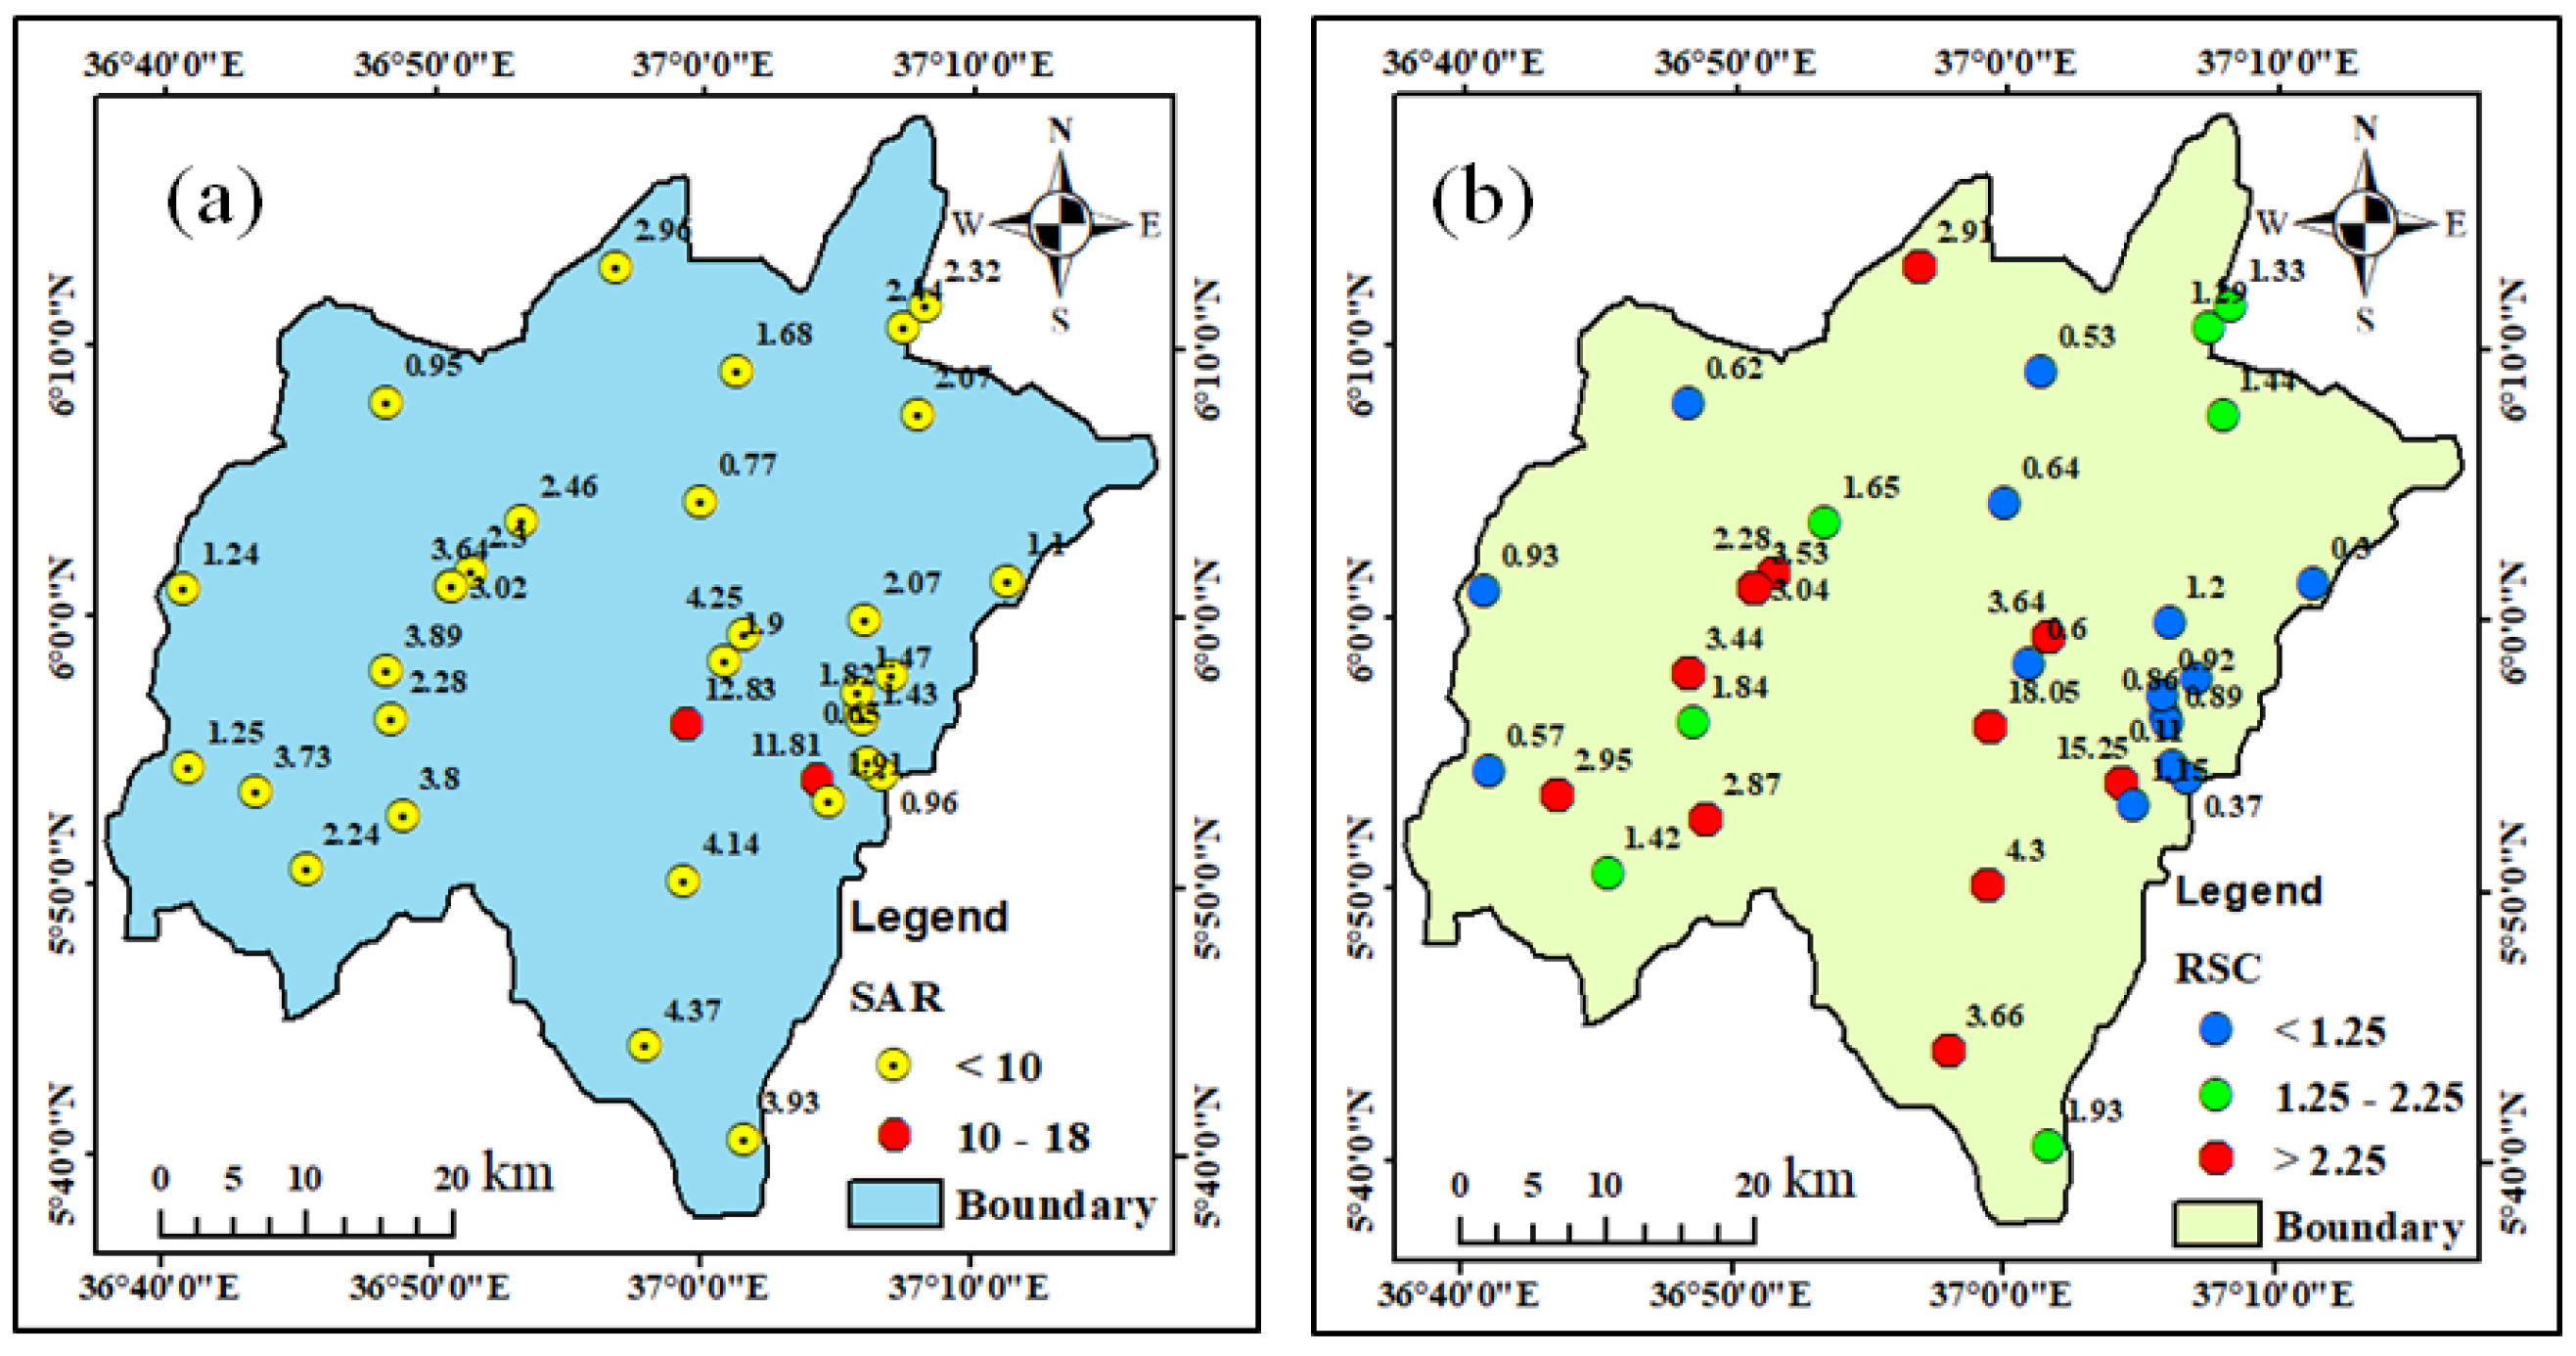
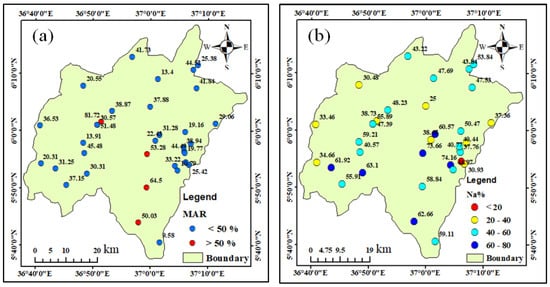
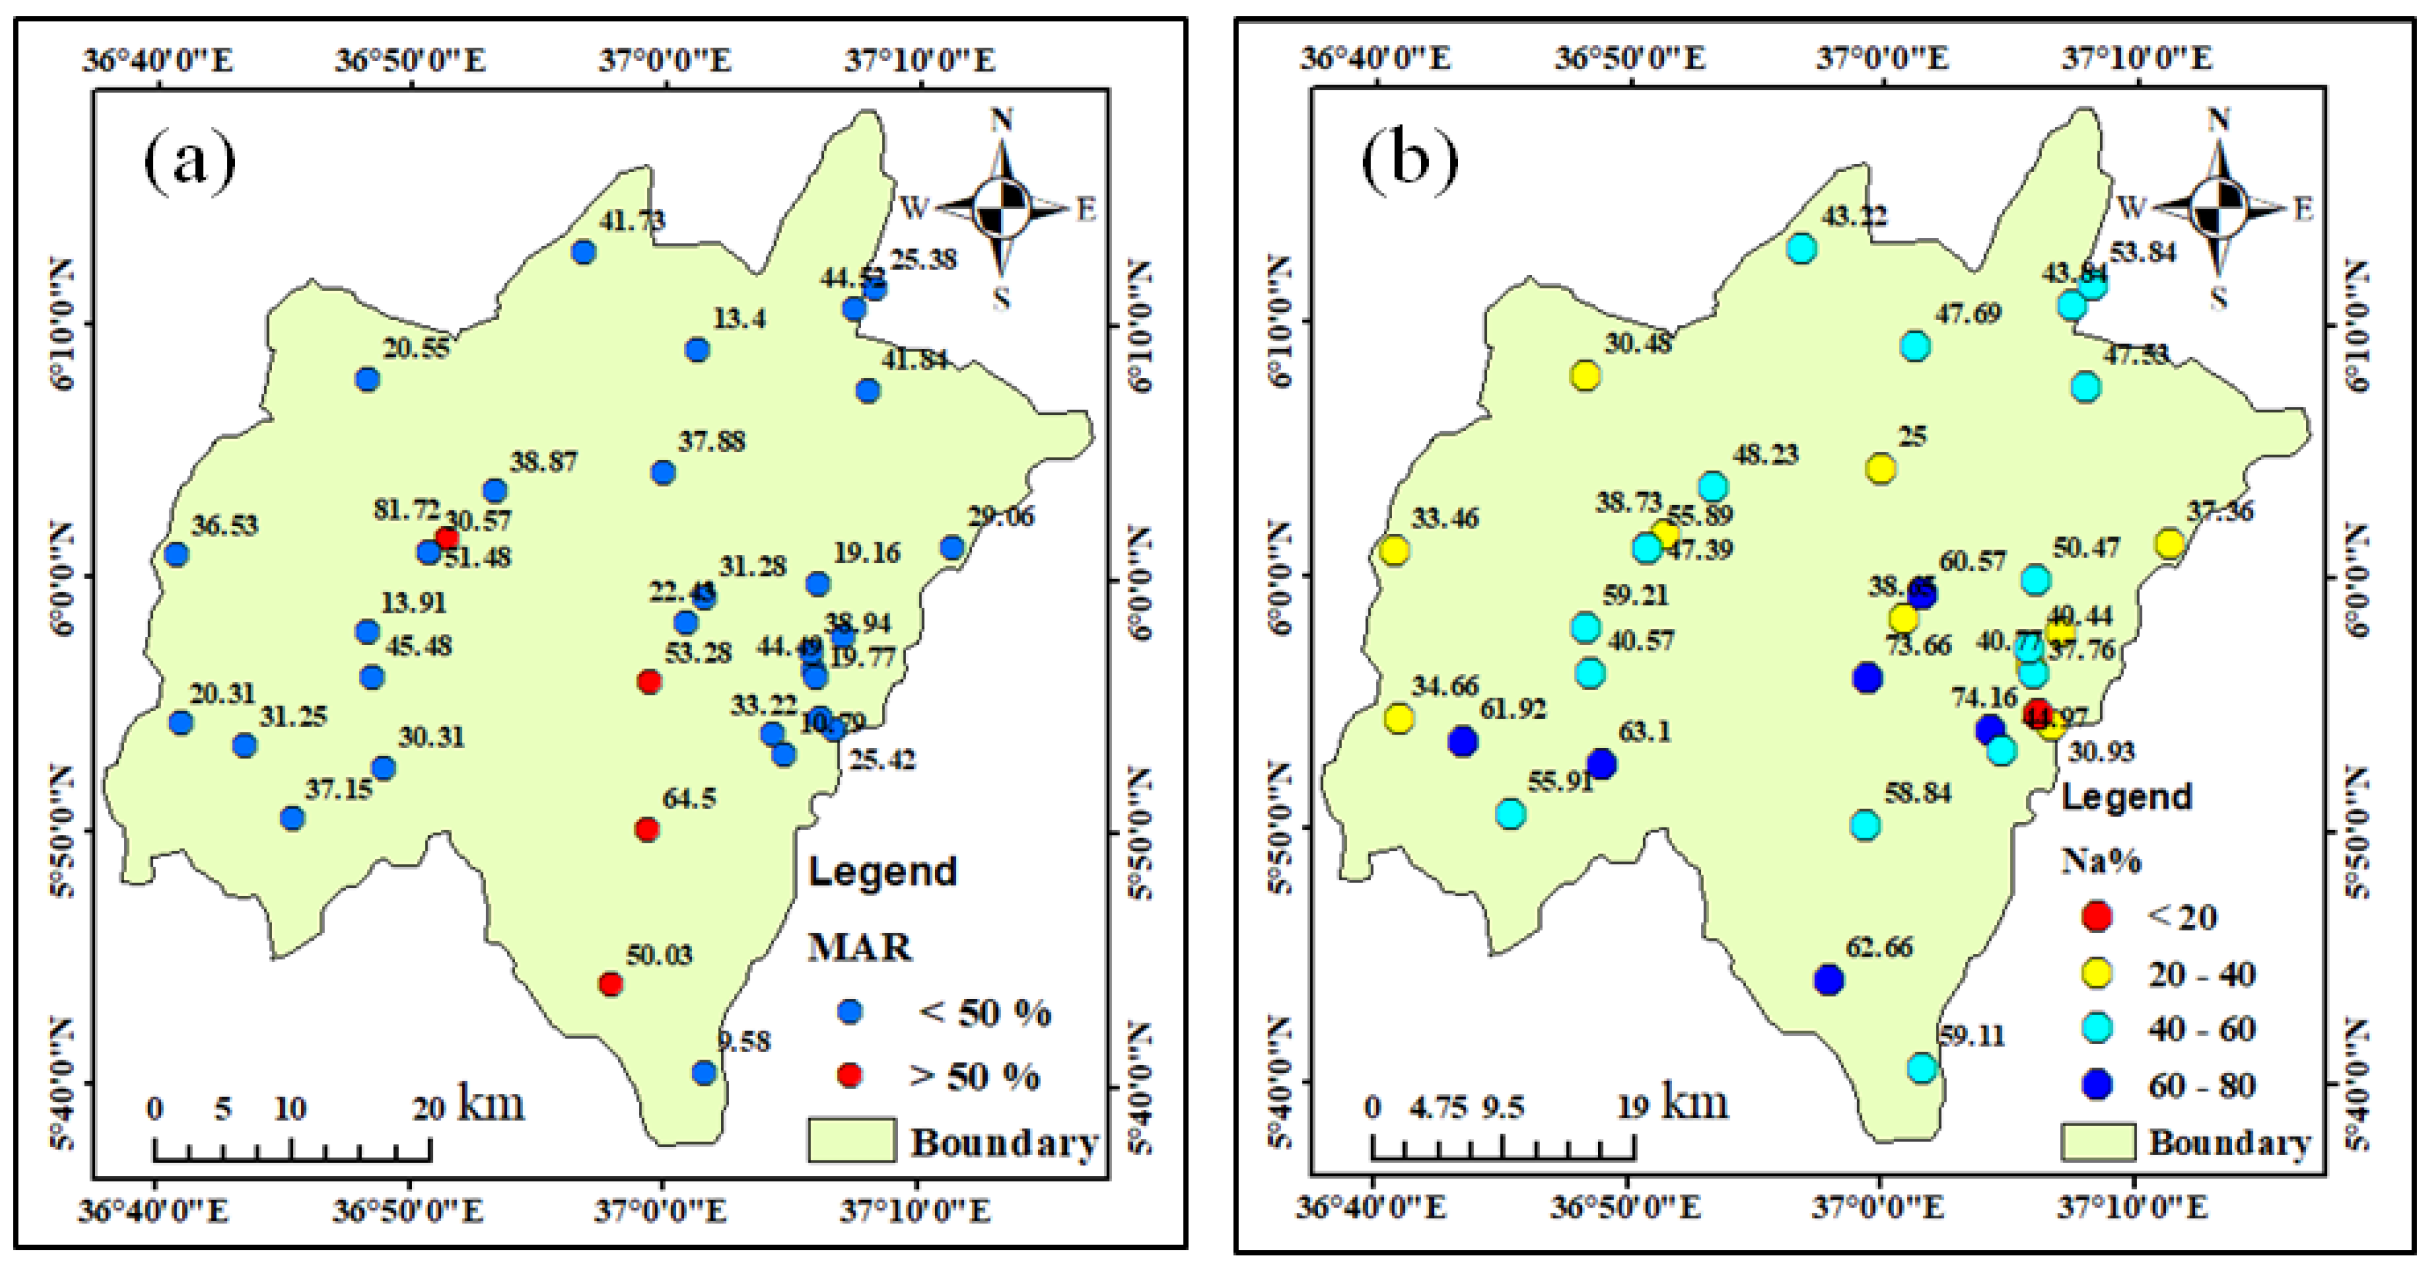
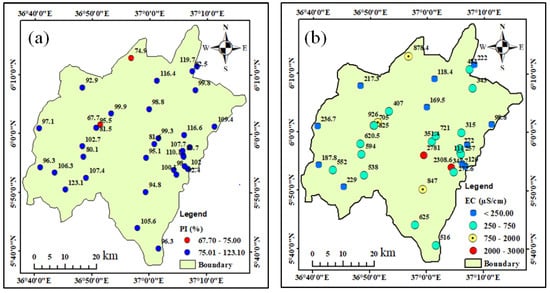
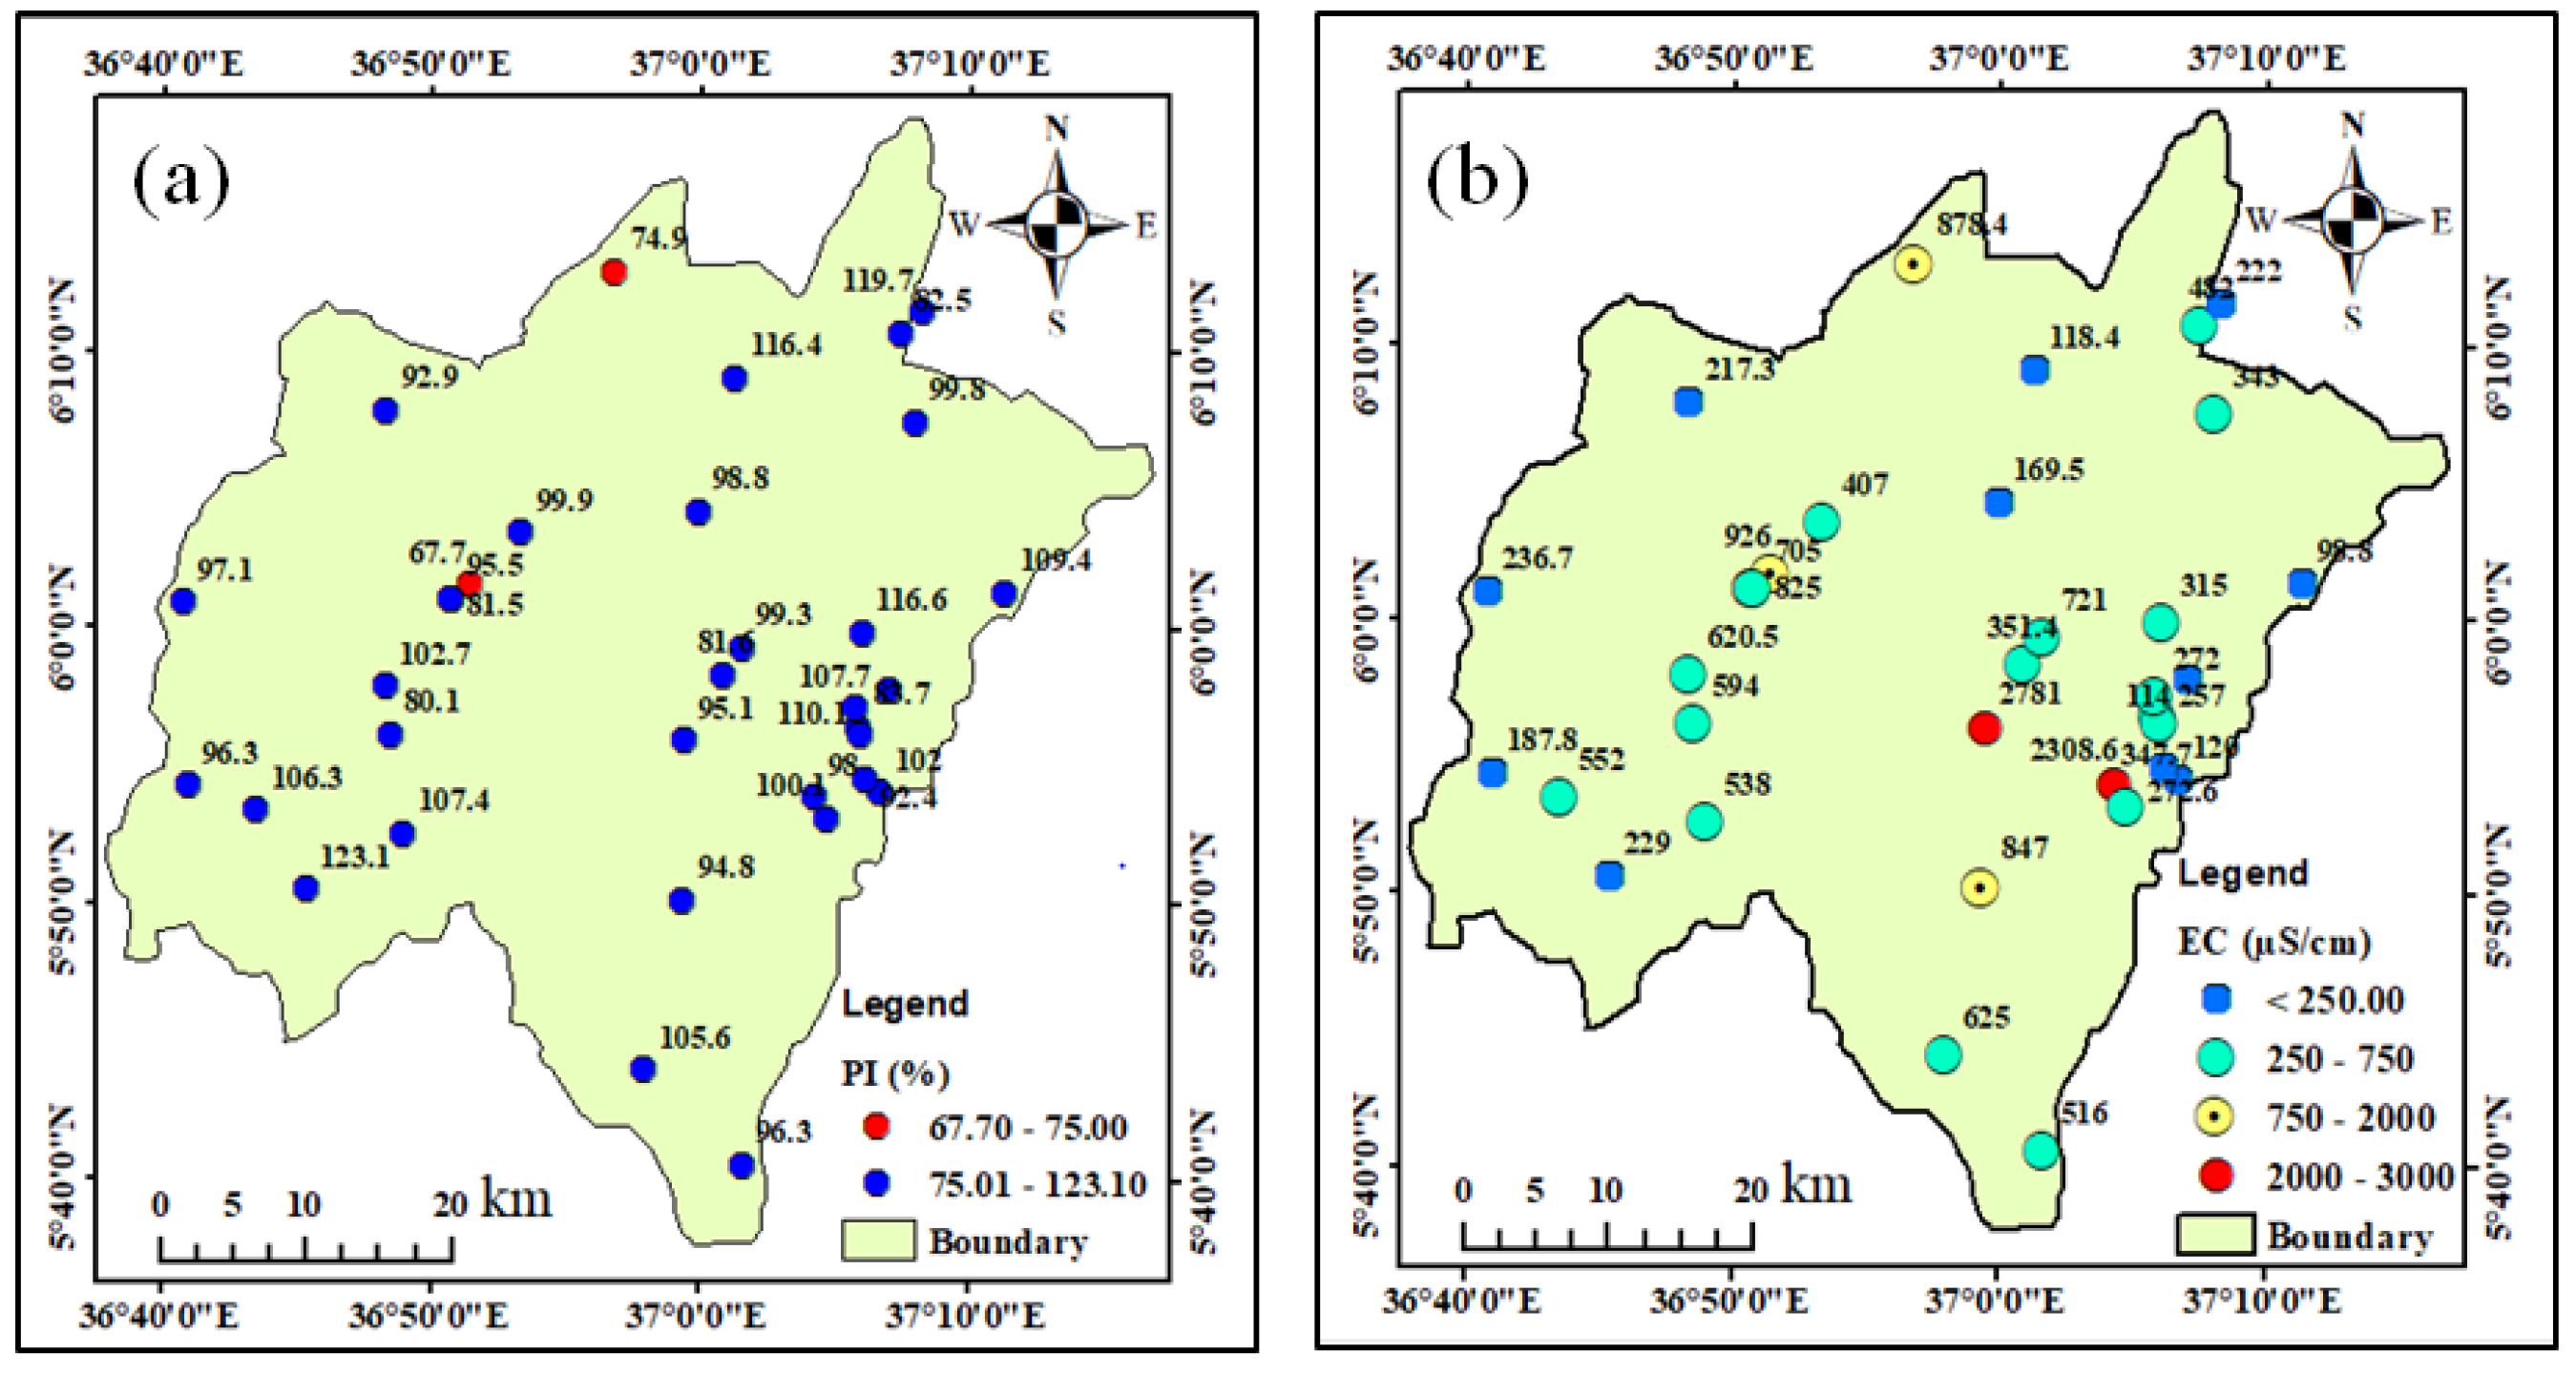
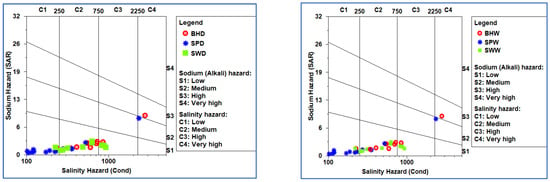
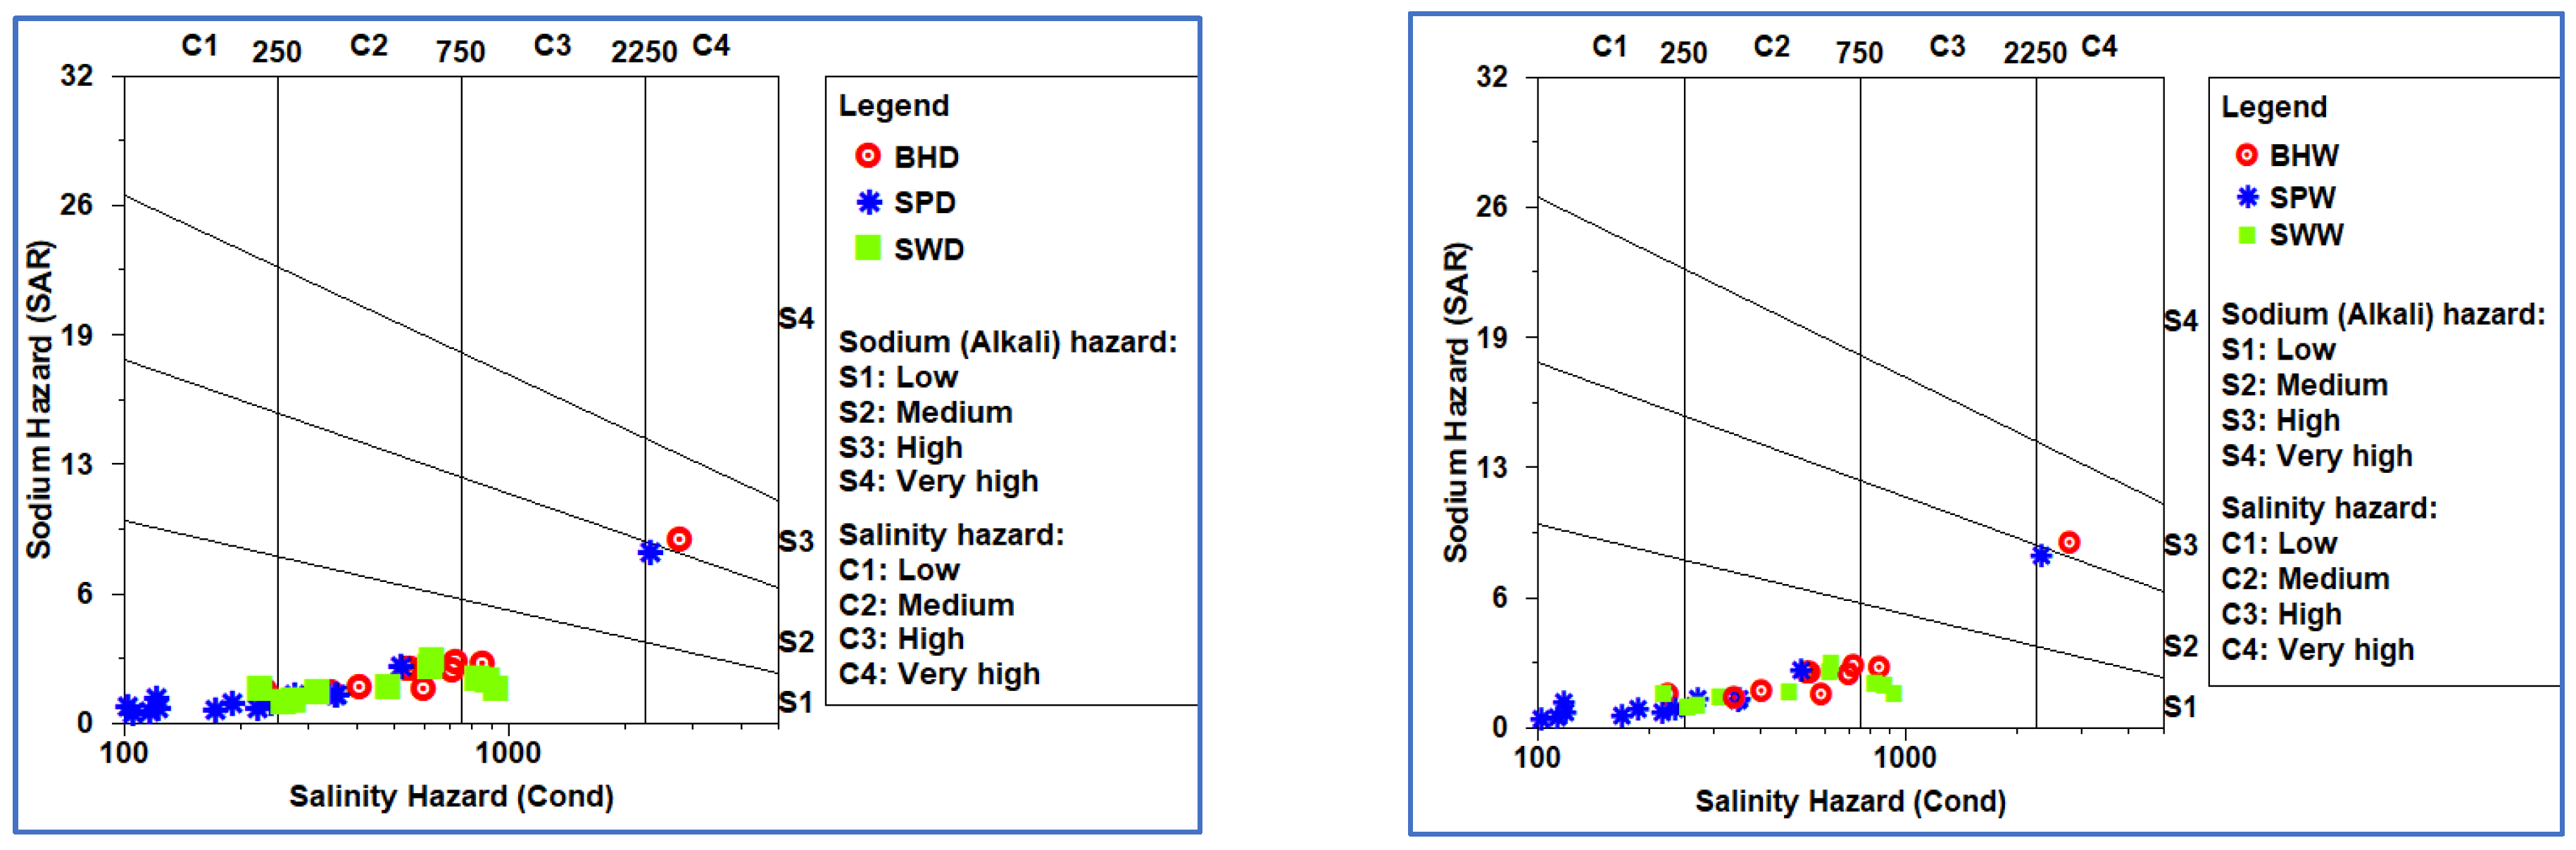

Disclaimer/Publisher’s Note: The statements, opinions and data contained in all publications are solely those of the individual author(s) and contributor(s) and not of MDPI and/or the editor(s). MDPI and/or the editor(s) disclaim responsibility for any injury to people or property resulting from any ideas, methods, instructions or products referred to in the content. |
© 2026 by the authors. Licensee MDPI, Basel, Switzerland. This article is an open access article distributed under the terms and conditions of the Creative Commons Attribution (CC BY) license.