Article

Impact of Injection Strategy and Caprock Morphology on CO2 Storage Efficiency and Safety in the Tazhong Uplift, Tarim Basin, China


1
Laboratory of Energy Carbon Neutrality, School of Electrical Engineering, Xinjiang University, Urumqi 830047, China
2
Ruoqiang Energy Industry Research Institute, Engineering Research Center of Northwest Energy Carbon Neutrality, Ministry of Education, Ruoqiang 841800, China
3
School of Environmental Studies, China University of Geosciences, Wuhan 430074, China
4
Center of New Energy Research, School of Future Technology, Xinjiang University, Urumqi 830047, China
*
Authors to whom correspondence should be addressed.
Geosciences 2026, 16(7), 270; https://doi.org/10.3390/geosciences16070270
Submission received: 27 May 2026 / Revised: 29 June 2026 / Accepted: 4 July 2026 / Published: 5 July 2026
(This article belongs to the Special Issue Advancements in Geological Fluid Flow and Mechanical Properties)

Abstract

In carbon sequestration in saline aquifers, many factors affect multiphase fluid migration and reservoir pressure change. This study developed a high-resolution three-dimensional numerical model to investigate large-scale CO2 geological storage in the Ordovician carbonate aquifer of the Tarim Basin, China. This study focuses on the quantitative prediction of CO2 plume migration, multiphase flow interactions between supercritical CO2 and brine, and formation pressure evolution under coupled injection operations. Injection strategies were compared by constant rate (CR) and variable rate (VR) injection, and two caprock morphology-type selection by placing wells into monocline traps (wells 1/3/5) and anticline traps (wells 2/4) with varying limb dip angles and closure depths. The results demonstrate that both injection speed and caprock morphology strongly control CO2 trapping evolution and storage security. At the end of the 500-year simulation, the dissolved-CO2 migration distance followed the order CR > VR, indicating that, under the studied conditions, VR injection most effectively limited the lateral spread of dissolved CO2 and thereby enhanced dissolved-CO2 immobilization. In addition, CR and VR injection schedules have a subtle impact on long-term pressure change; Across all cases, formation pressure remained below the caprock breakthrough pressure. CR injection promotes the fastest CO2 dissolution and pressure dissipation but yields the weakest long-term immobilization, whereas VR injection trades early dissolution rate for more effective plume containment. This result indicates that injection-strategy selection should be matched to dominant site controlled near-term pressure management versus long-term containment and to the trapping behavior imposed by caprock morphology. This study provides a mechanistically grounded optimization framework linking injection-speed control and caprock morphology to the coupled evolution of pressure-buildup safety and long-term CO2 immobilization, supporting CCUS decision-making in the Tarim Basin.

1. Introduction

Carbon dioxide geological storage serves as a core component of carbon capture and storage (CCS), as well as carbon capture, utilization, and storage (CCUS), and is a vital technical support for carbon neutrality and global temperature control targets.
In recent years, researchers have systematically investigated the main aspects of Carbon Capture and Storage technology, as large-scale global CCS layouts have become a research priority to meet the 2 °C temperature-rise control target. Wei et al. (2021) proposed a global CCS layout scheme compatible with the 2 °C climate goal, evaluated the deployment potential and costs across diverse regions and industries, and provided strategic references for global carbon-neutrality pathways [1]. Page et al. (2020) released the 2020 global CCS status report, which statistically analyzed worldwide operational, under-construction, and planned CCS projects and confirmed the essential role of CCS in achieving net zero emissions [2]. Some studies have focused on CCUS development pathways under China’s carbon neutrality vision. Liu et al. (2022) systematically illustrated a phased large-scale deployment roadmap of China’s CCUS technology by assessing the emissions reduction potential, technical costs, and development stages of various industries [3]. From an institutional perspective, Xu et al. (2021) defined CCUS as a suboptimal option for China’s carbon neutrality; analyzed existing policy, market, and technical barriers; and put forward suggestions for institutional framework improvement [4]. Adu et al. (2019) reviewed the technical status of carbon capture, geological storage, and CO2 enhanced oil recovery in the oil and gas sector and summarized practical cases as well as economic and technical challenges [5].
Site suitability and storage capacity are prerequisites for engineering implementation, with research centered on basin-scale site screening, parameter assessment, and capacity estimation. As a core demonstration area for domestic CCS projects, Lu et al. (2021) constructed a comprehensive evaluation system for favorable CO2 storage zones in the Majiagou Formation of the Ordos Basin by integrating geological, geophysical, and engineering parameters, offering methodologies and practical cases for target site selection [6]. Lu et al. (2022) further analyzed fundamental physical reservoir conditions, including the temperature-pressure regime, rock physical properties, and fluid characteristics, establishing basic data for potential assessment [7]. Zhang et al. (2019) estimated the effective CO2 storage capacity of deep saline aquifers in the Ordos Basin using volumetric and dynamic calculation methods [8]. Ahmadinia et al. (2021) revealed that reservoir boundaries and caprock morphology govern lateral CO2 plume expansion and vertical sealing performance [9]. Wang et al. (2016) and Jing and Yang (2019) demonstrated that the formation dip angle induces asymmetric CO2 migration driven by buoyancy, which reduces storage space utilization efficiency and increases safety hazards [10,11].
For CO2–water–rock interactions, Peter et al. (2022) summarized the experimental and numerical simulation methods for geochemical reactions and clarified the impacts of mineral dissolution and precipitation on reservoir reconstruction and long-term storage safety [12]. Al-Khdheeawi et al. (2021) explored the porosity and permeability evolution of sandstone reservoirs caused by geochemical reactions and verified the long-term transformation effect on the physical properties [13]. Raza et al. (2016) conducted a coupling analysis of the geochemistry and geomechanics and illustrated how mineral alteration affects the structural integrity [14]. Gao et al. (2024) verified that the variable thermophysical properties and phase behaviors of CO2 significantly affect simulation accuracy [15]. Zhao et al. (2015) established a non-isothermal numerical model for CO2 injection into saline aquifers and analyzed the influence of the temperature field influences on the CO2 phase state and injectivity [16]. Jung et al. (2020) revealed good injectivity responses to stepwise injection rates based on thermal–hydromechanical coupling simulations [17].
Carbon dioxide fracturing is a promising reservoir simulation technology. Solid particles in fracturing fluid exhibit complex settling characteristics, which greatly affect construction effects. This study explores particle sedimentation rules, influencing factors and fracture evolution during CO2 fracturing, to provide theoretical support for field application. Al-Khdheeawi et al. (2017, 2018) proved that well configuration, rock wettability, and heterogeneous wetting characteristics alter the CO2 plume distribution and capillary trapping efficiency [18,19]. Umar et al. (2020) identified the regulatory effects of clastic rock wettability on trapping efficiency and storage safety through laboratory tests [20]. Reservoir imperfections including hard cores alter fracture propagation modes and efficiency [21]. Particle properties, reservoir temperature, and pressure further influence proppant settlement and fracturing fluid performance, greatly interfering with fracture quality and CO2 storage stability [22,23].
The leakage risk is a primary safety concern for long-term CO2 storage. Research covers leakage mechanisms, risk assessment approaches, and wellbore integrity analysis, and faults act as the dominant leakage channels. Xu et al. (2022) revealed the migration characteristics, pressure variation, and surrounding rock mechanical responses of supercritical CO2 along faults through laboratory experiments [24]. Xu et al. (2023) found that phase transition triggers internal and external fault strains and may induce microseismic activity, aggravating leakage risks [25]. Xiao et al. (2024) reviewed full-process risk identification, quantitative evaluation, and management strategies for geological carbon storage [26]. White et al. (2020) proposed a risk-based method to delineate review areas, evaluate leakage hazards, and support site supervision and management [27]. Wang et al. (2023) established a probabilistic risk model to calculate the leakage possibility and migration rate of CO2 through fracture zones [28]. Jahanbakhsh et al. (2021) found that long-term CO2-rich brine exposure increases cement-reservoir rock composite permeability by an order of magnitude, reduces its mechanical properties, and leaves porosity nearly unchanged [29]. Pan and Wu (2016) reviewed geomechanical modeling studies focusing on injection-induced stress variation, fault reactivation, and caprock stability [30]. Jung et al. (2018) calculated the maximum allowable injection volume to avoid geomechanical disturbances and provided safety thresholds for field operations [31]. For engineering parameters optimization Bai et al. (2017) proposed a design method for the maximum safe wellhead injection pressure and applied it to the Shenhua demonstration project [32]. Abdelaal et al. (2021) optimized the injection rate and bottom-hole pressure to maximize the storage capacity of saline aquifers [33]. Sokama et al. (2022) verified that temperature changes modify the rheological properties and rock physical features, thereby influencing reservoir injectivity [34]. Hu et al. (2021) optimized the injection well layout for naturally fractured undulating formations to improve storage performance [35].
For Demonstration Projects and Practical Applications, Yamamoto et al. simulated an industrial-scale CO2 injection project in Tokyo Bay, Japan, using a model that injects 1 million tons of CO2 annually through an injection well for 100 years to monitor formation pressure buildup and plume distribution. The results show that after 100 years, the CO2 plume spreads several kilometers, with slight pressure increases observed in shallow confined aquifers. Environmental impacts include a continuous increase in discharge into shallow aquifers [36]. Wang et al. (2021) compared the simulation results of different geological models and provided references for model selection [37]. Li et al. (2021) optimized injection strategies for CO2-enhanced oil recovery and geological sequestration in tight reservoirs [38]. Liu et al. (2020) explored the pore structure evolution of coal seams under varying temperature and pressure conditions, thereby expanding the theoretical basis for coal seam carbon storage [39].
In general, large-scale CO2 geological sequestration projects are essential for China to achieve its carbon peak and neutrality goals as soon as possible. Although CO2 geological storage in saline aquifers has been extensively studied, several gaps motivate this work. Many prior studies often examine injection strategies and caprock structural morphology in isolation. The coupled influence of injection-rate control schemes and caprock geometry on the joint evolution of pressure buildup and CO2 immobilization has rarely been systematically compared. Also, many models study CO2 plume migration patterns in an ideal reservoir condition with a 2D radial mesh, and its lack of a complex geological structure and multi-well, high-resolution 3D quantifications of the trade-off between pressure-buildup safety and dissolution trapping efficiency. In this regard, this study addresses these gaps by integrating injection-strategy comparison, caprock morphology effects, multiphase flow coupling, and long-term pressure–trapping dynamics into a single field-scale predictive framework supporting CCUS deployment in the Tarim Basin.

2. Geological Background

The Tazhong Uplift, a core hydrocarbon enrichment zone located in the central part of China’s Tarim Basin, the country’s largest petroliferous superimposed basin covering approximately 560,000 km2 and surrounded by the Tianshan, Western Kunlun, and Altay Mountains, experienced multi-stage Paleozoic tectonic deformation that shaped its complex structural framework. Forming its embryonic shape in the Late Caledonian period, it developed initial NW-trending thrust faults under compressional stress from the southwestern foreland basin, then finalized its overall configuration in the Late Hercynian, when the subduction of the Altay Orogenic Belt generated near-EW-trending thrust faults in its central and southern regions, bent early NW-trending fault belts into an arc in the central area, and formed a series of NNE-trending strike-slip faults in the north that cut earlier thrust structures into segmented blocks, resulting in a superposed tectonic pattern of intersecting thrust and strike-slip faults. Vertically, it developed a layered structure with marine carbonate rocks from the Upper Cambrian to Devonian as the middle main reservoir layer, overlain by stable Carboniferous to Quaternary terrigenous clastic deposits, and as a long-term stable paleo-uplift with excellent reservoir conditions. It is not only a core production area for oil and gas exploration in the Tarim Basin, but also a key target for current carbon capture and geological storage research in northwest China.
The Ordovician carbonate saline aquifer of the uplift was selected as the study area. Owing to the large amount of oil and gas exploration carried out and scientific research papers published in the region, we have detailed data on the geological structure, sedimentary characteristics, stratigraphic distribution, petro-physical and chemical properties, boreholes, and stratigraphic contours of reservoirs and caprocks. These data make it possible to evaluate the location of the study area, delimit the target area, and build a three-dimensional numerical model based on a fine geological model. Lianglitag Formation Section 3–5 (Lltg 3–5) and the Yingshan Formation (YSZ) were selected as the aquitard and aquifer, respectively, to carry out a large-scale injection CO2 storage simulation study of the carbonate aquifer in the region.

3. Model Design and Research Methods

3.1. Model Generalization and Boundary Condition

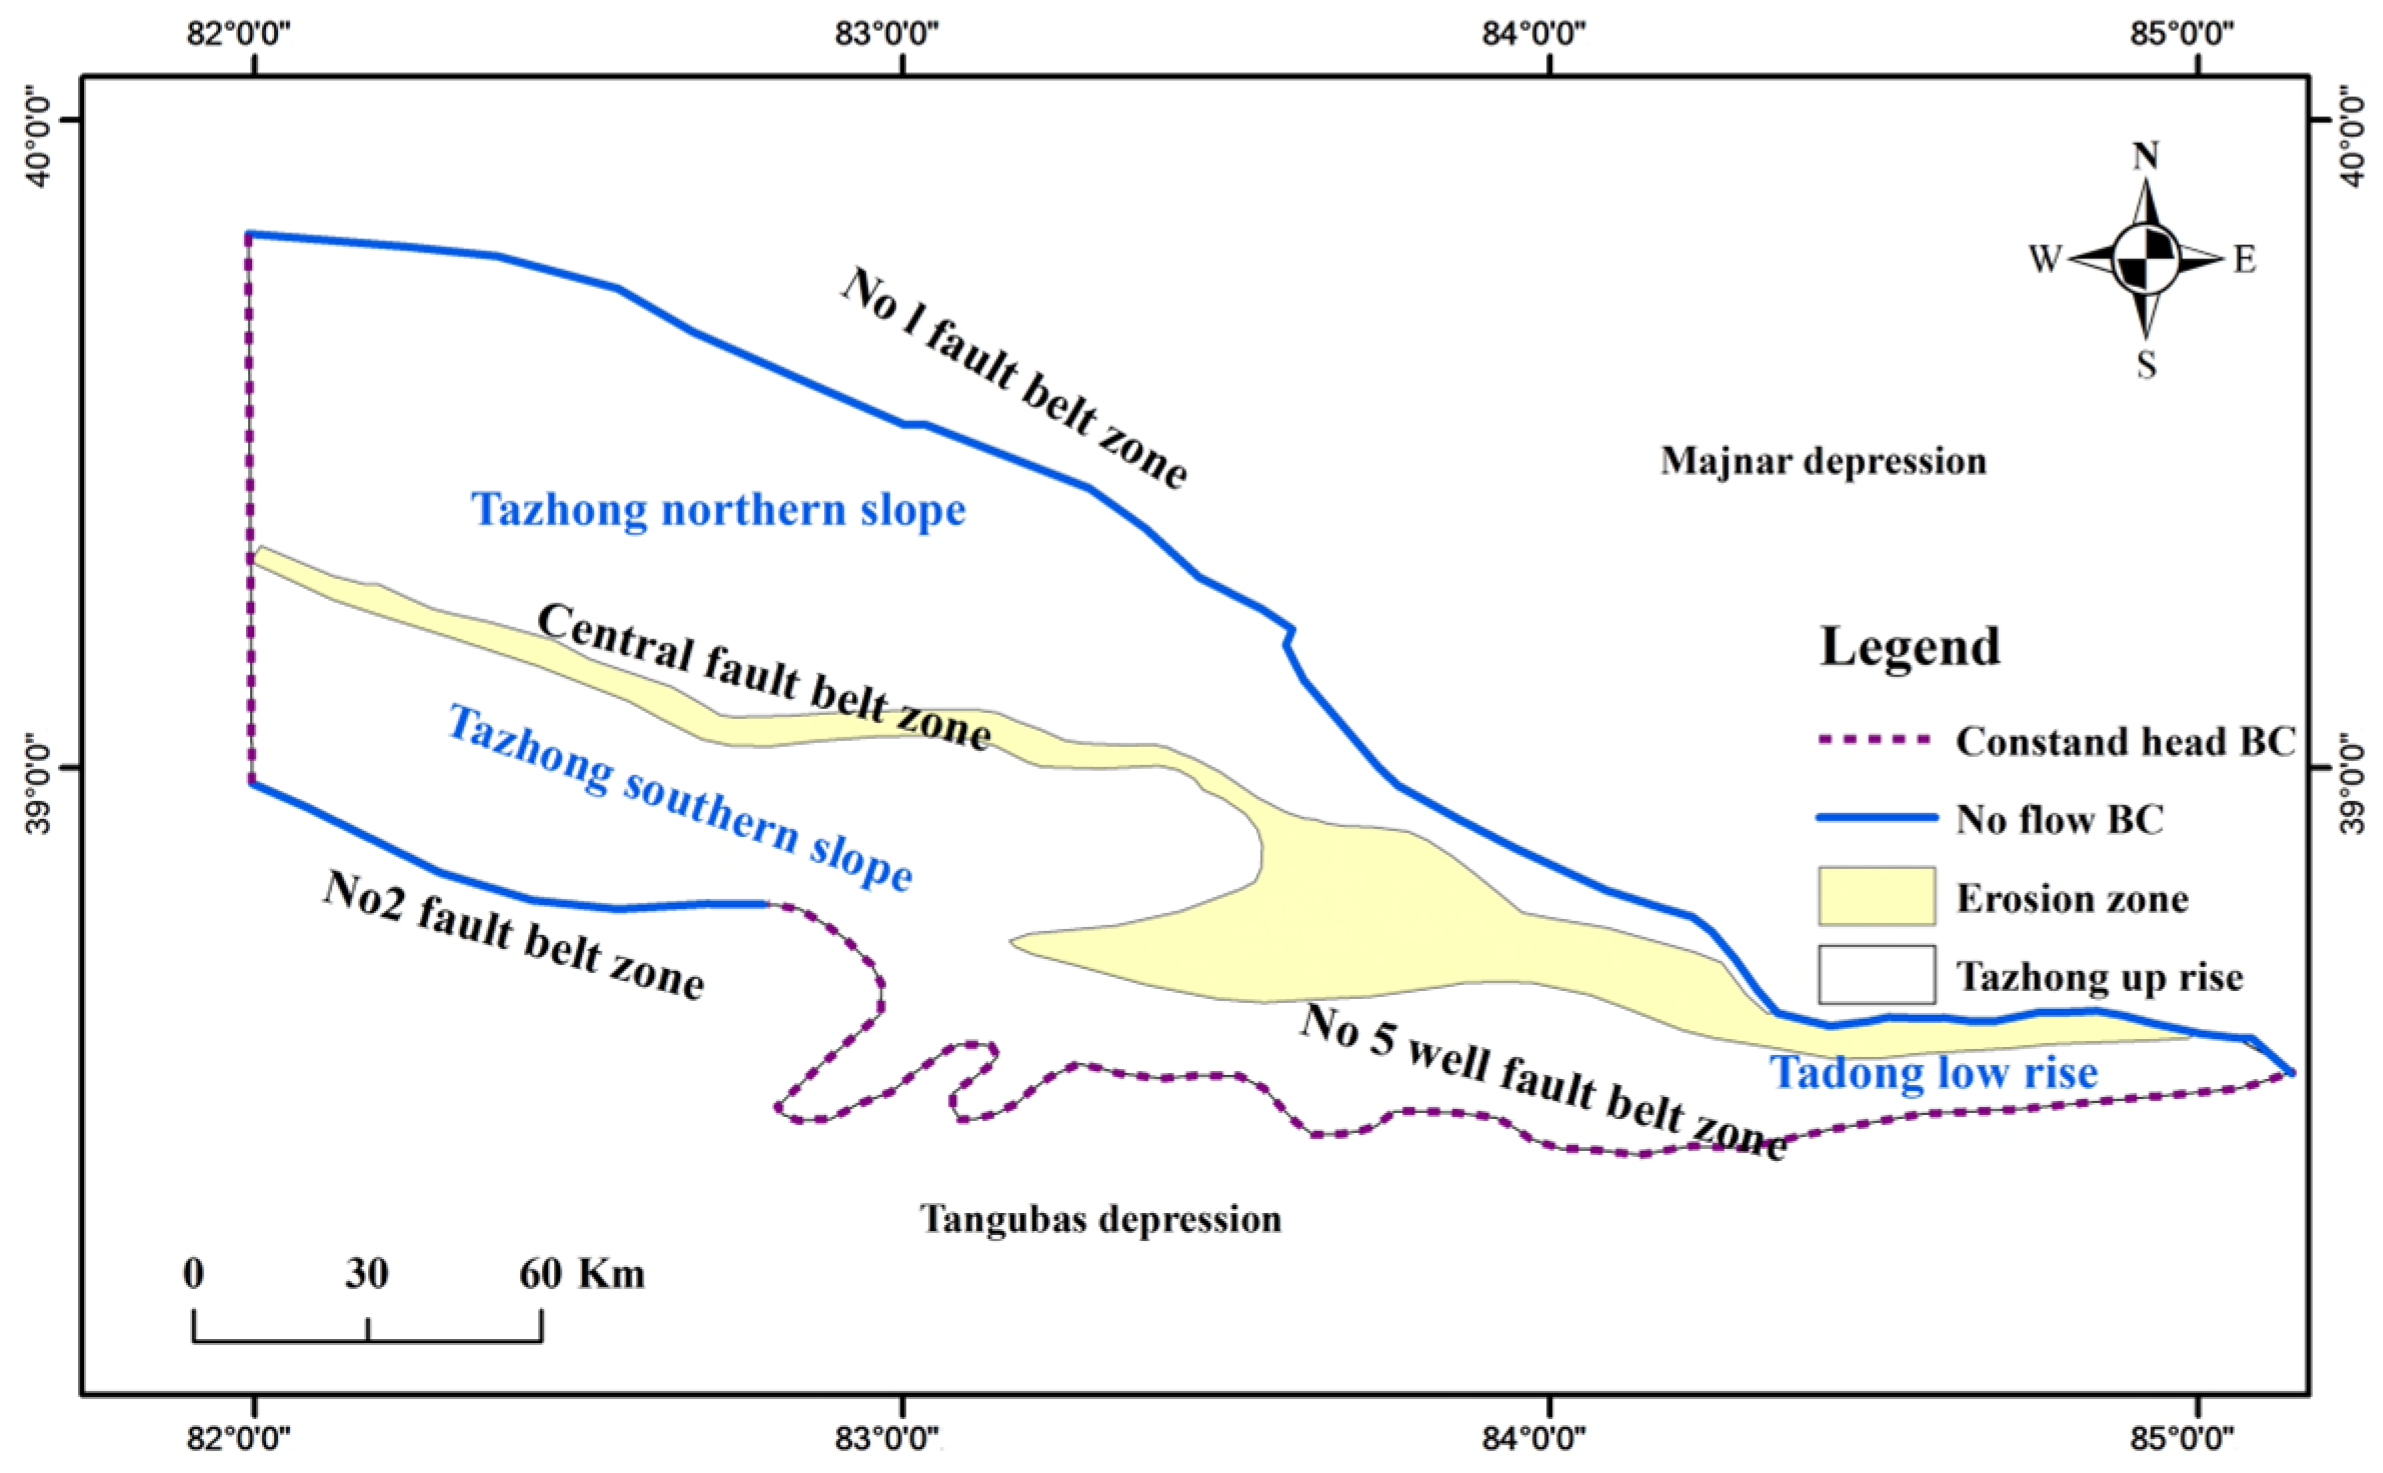
In this study, the carbonate aquifer was generalized as a continuous porous medium. The flow alternation, and renewal of water in deep formations are relatively slow, and the uplift is a large barrage structure surrounded by reverse faults like fault zones 1, 2, and 5. Also, there is significant angular unconformity between the Cambrian–Ordovician strata and the overlying Carboniferous–Devonian–Silurian mudstone cap rock. The reverse faults formed by stratigraphic compression create good physical boundaries around lateral boundaries thus defined as no-flux boundary to generalize the boundary domain (Figure 1). Simultaneously, the model assumes that the formation is at a hydrostatic pressure equilibrium and a constant temperature state. The simulation focused on the movement and distribution of fluids within the reservoirs in the study area. At last, the generalized model domain caprock is the Lltg 3–5 aquitard layer and the reservoir is the YSZ aquifer layer. For computation efficiency, this study ignores the geochemical reactions, secondary porosity, fractures, and faults in the medium.

3.2. Model Grid Design and Initial Conditions

3.2.1. Model Grid Design

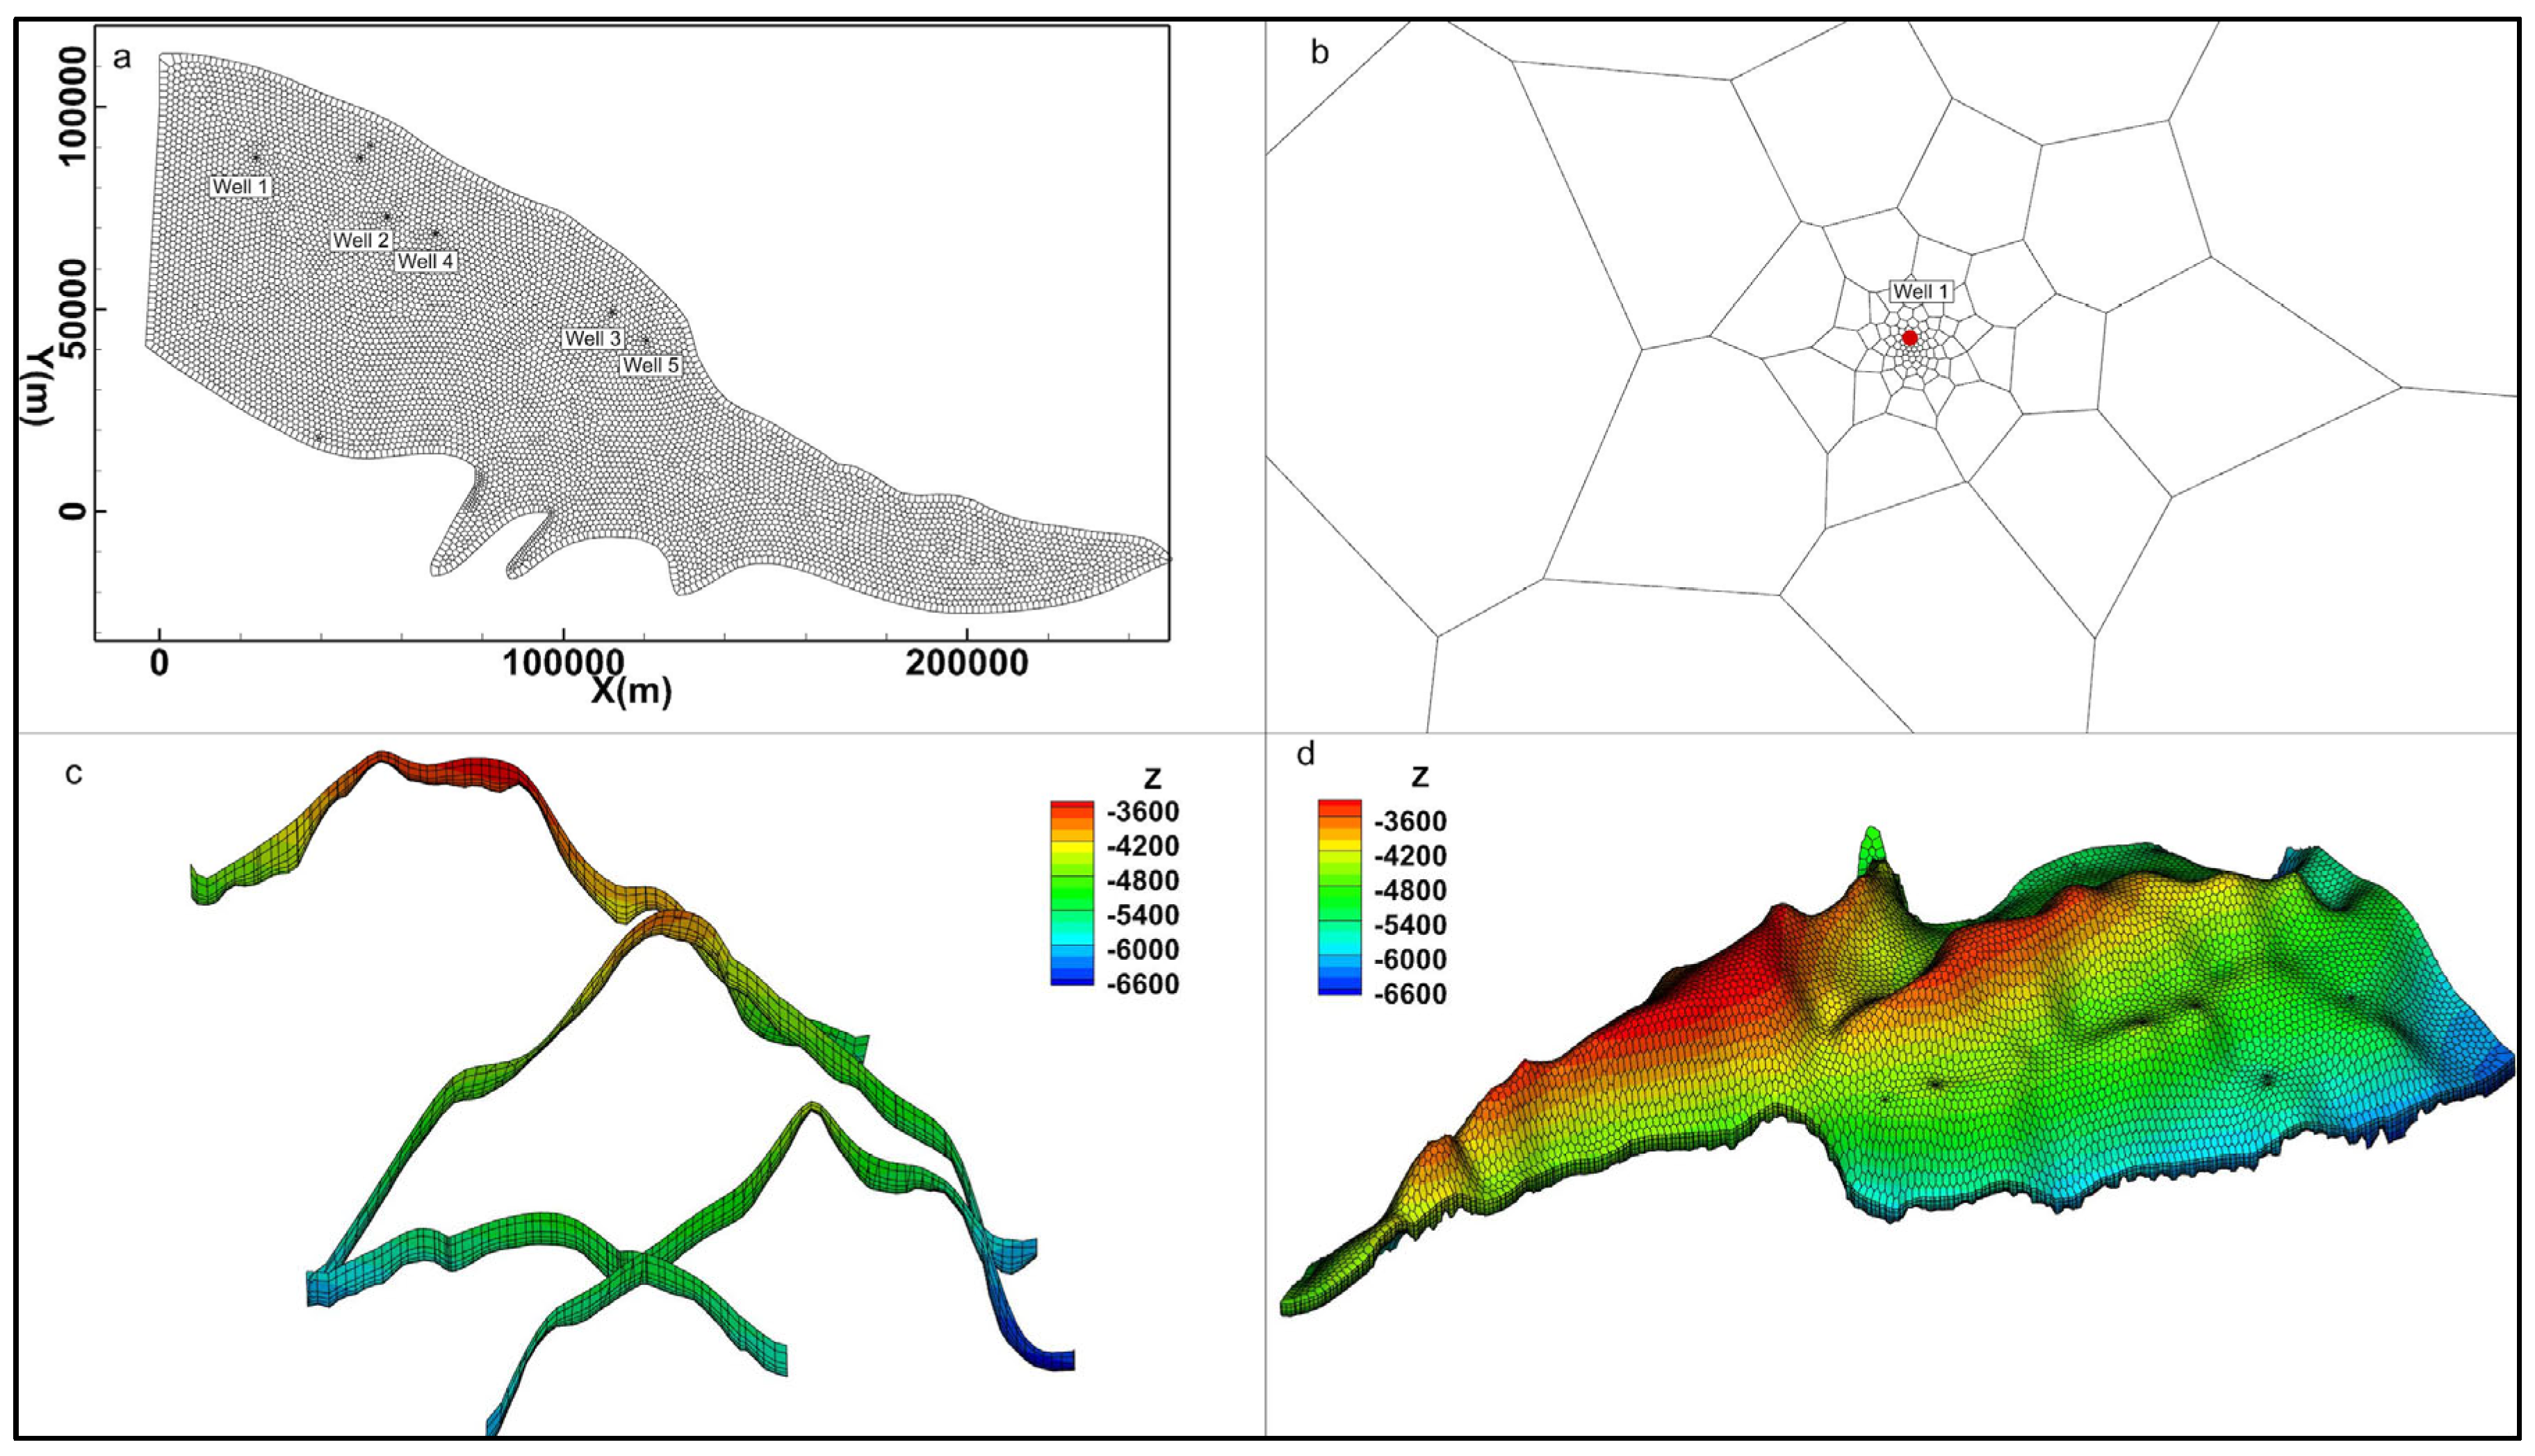
Figure 2a shows the three-dimensional mesh plan view. The injection well discretization is shown in Figure 2b, and the three-dimensional sectional fence is shown in Figure 2c. The three-dimensional display of the three-dimensional grid is shown in Figure 2d. The geological model first used GMS to prepare high-resolution formation elevation data, and the obtained elevation data were imported into IGMESH to discretize the 3d mesh. Each injection well was refined to capture the diffusion details of the CO2 plume around the injection well. The model was divided into eight layers and a total number of 37,544 nodes. The first to third layers are Lltg 3–5 formation caprock, with a total of 9386 nodes. The fourth to eighth layers are the YSZ formation reservoir section, with a total of 28,158 nodes.
With the prepared mesh, the simulation was run by a parallel version of TOUGH2-MP V2.0 on a Linux server with 30 cores, 60 threads, and 200 GB of memory. The model results were plotted using TECPLOT software. The main outcome maps include migration and incremental pressure distribution in gas and liquid CO2 with plane and cross-section views.

3.2.2. Initial Conditions

The initial temperature pressure of the model was assigned according to the geothermal, gradient, and surface temperatures, and it was assumed that the temperature did not change with time throughout the simulation, that is, the constant-temperature simulation. The abnormal pressure of the formation was ignored, and the initial formation pressure was assumed to be in a hydrostatic pressure equilibrium. Assuming that the formation was in the initial water saturation state, the initial CO2 mass fraction in the formation water was 1 × 10⁻⁴. The top boundary was connected to the atmosphere, and the hydraulic field distribution was calculated using gravitational acceleration.
(1) Initial temperature field distribution:
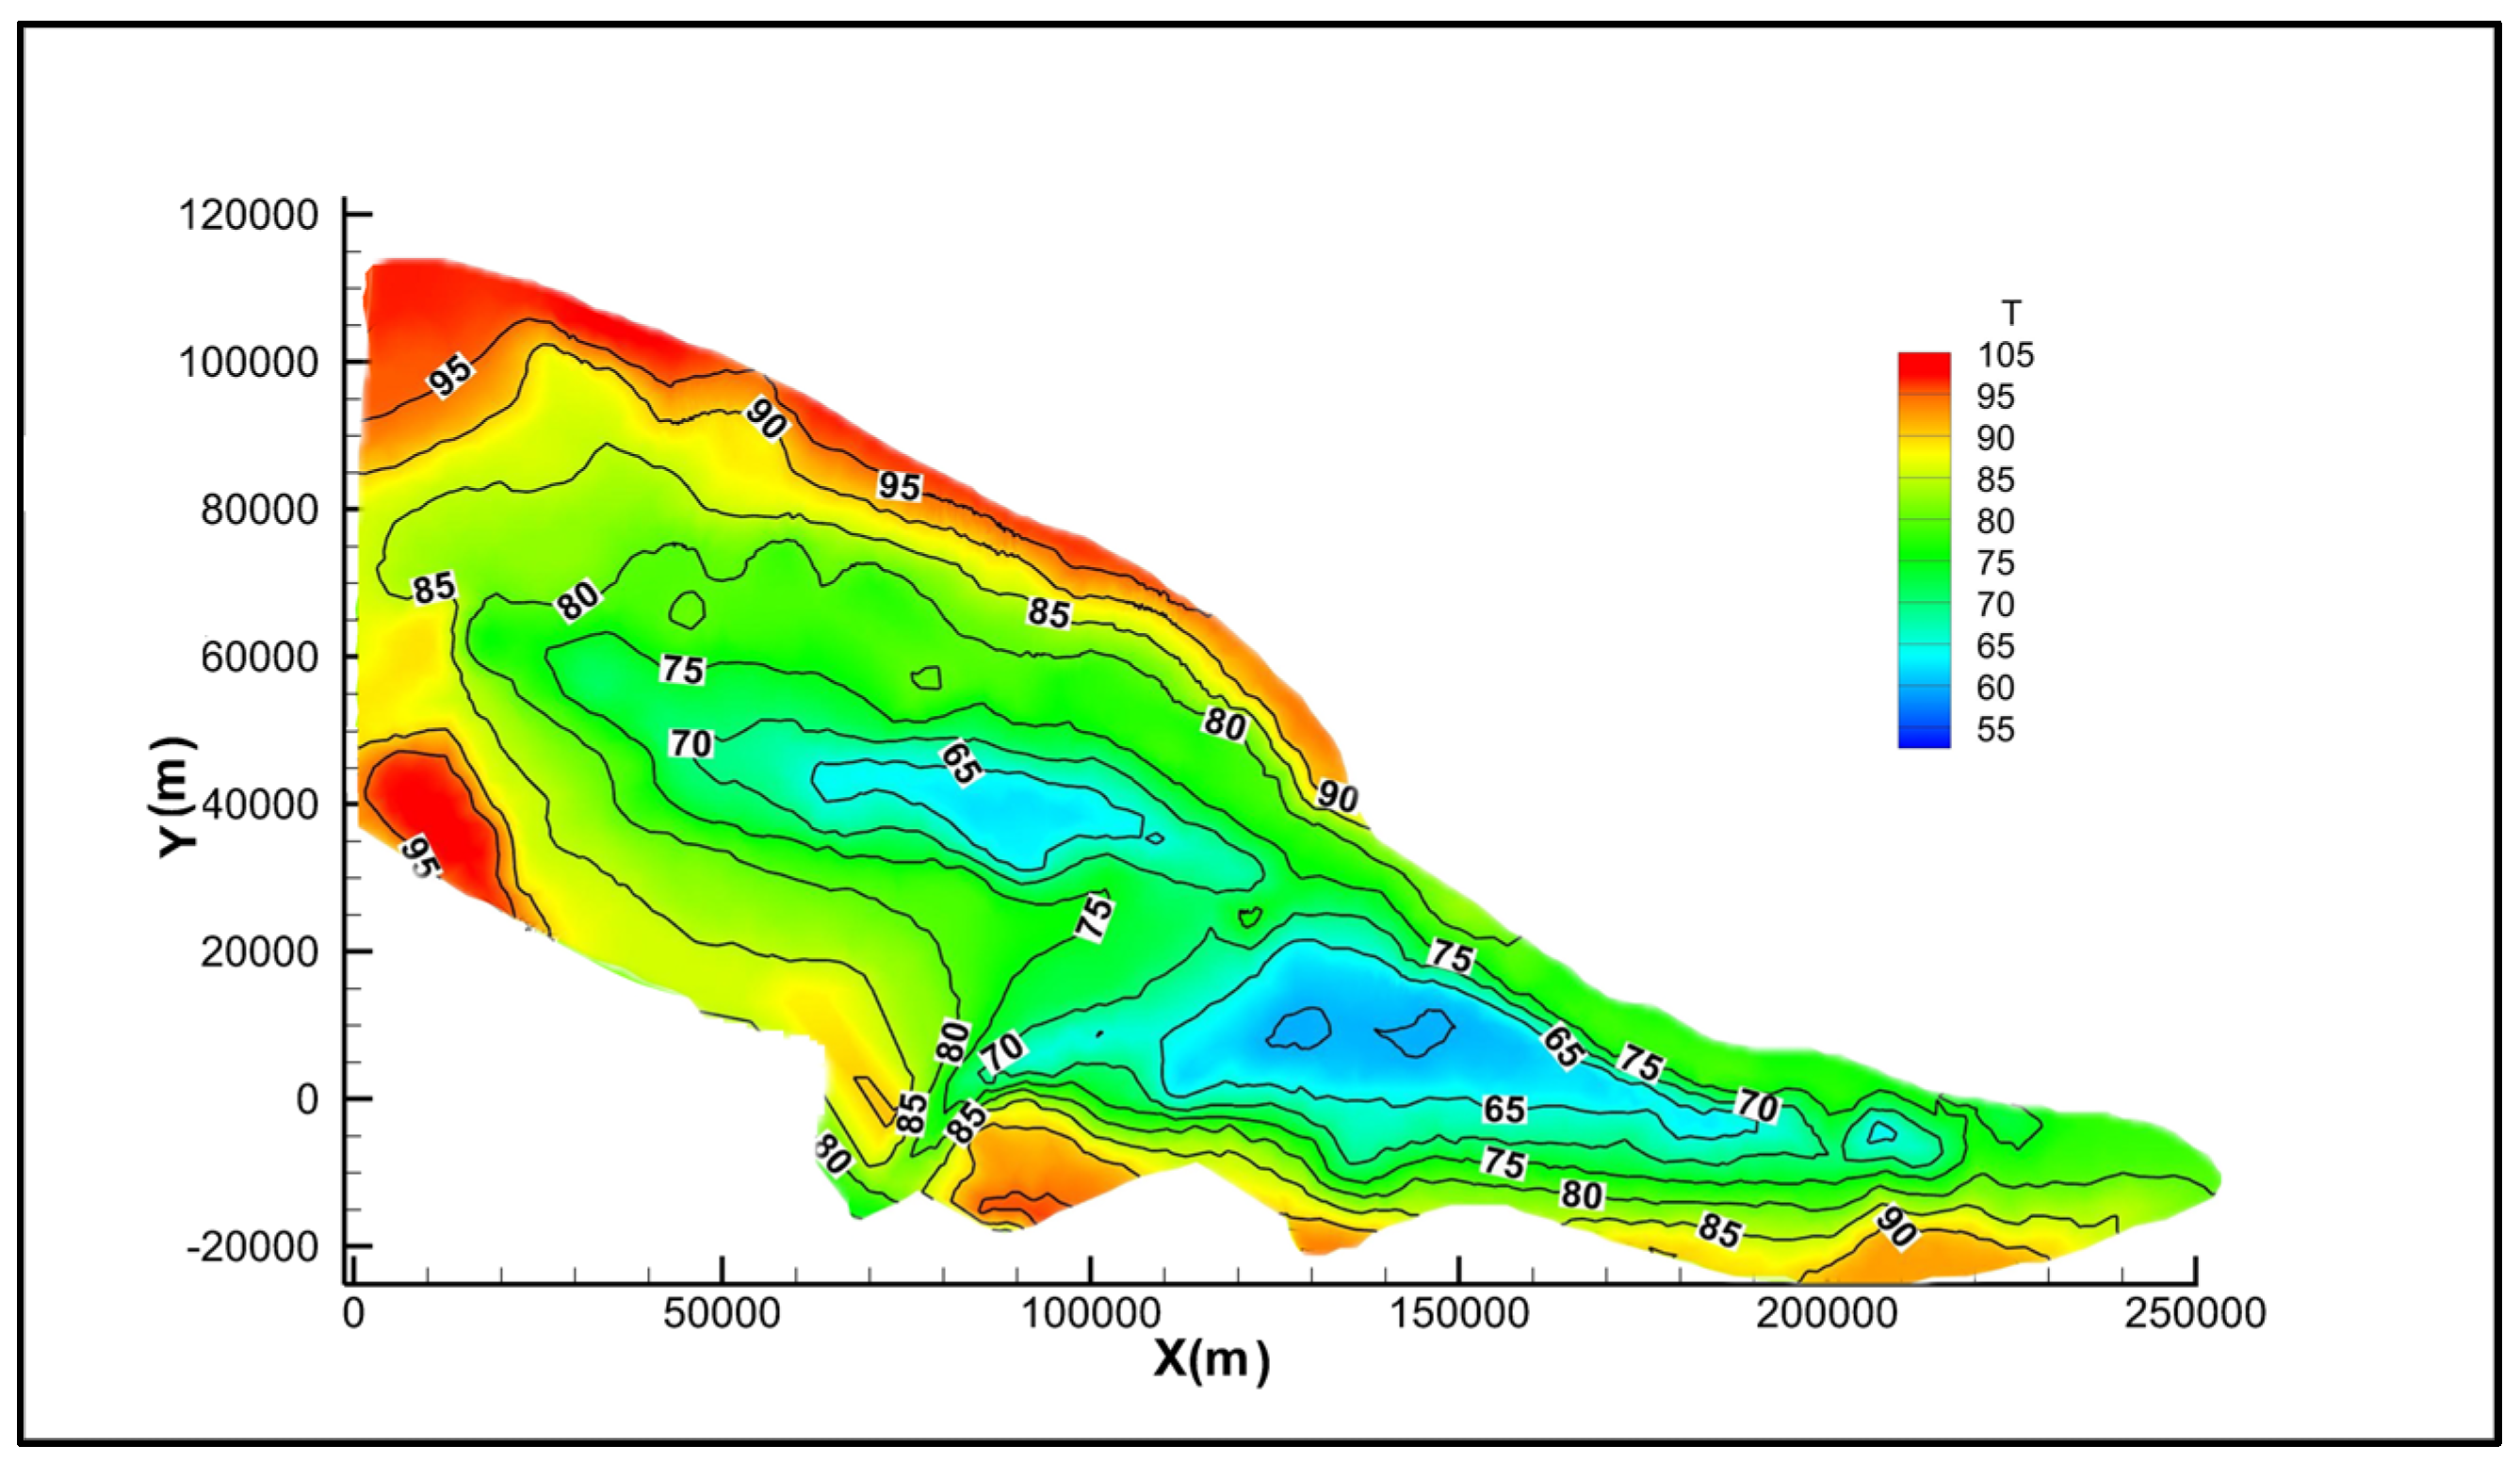
This is a thermostatic simulation that does not consider enthalpy variation. However, because the formation structure is complex, the burial depth of the top and bottom layer elevation varies greatly, and the maximum distance between the top and bottom elevation of the reservoir reaches 4400 m. Therefore, an initial temperature field must be set. This initial temperature field can be calculated using the temperature gradient and buried depth calculation in Equation (1), and entered into the model by modifying the incon file in the initial state input file of the model.
T = Z × a + 14
T is the reservoir temperature in °C; Z is the depth in m; a is the formation temperature gradient; and 14 is the average surface temperature of the study area in °C.
The calculated initial temperature field distribution of the reservoir is shown in Figure 3.
(2) Initial pressure field distribution:
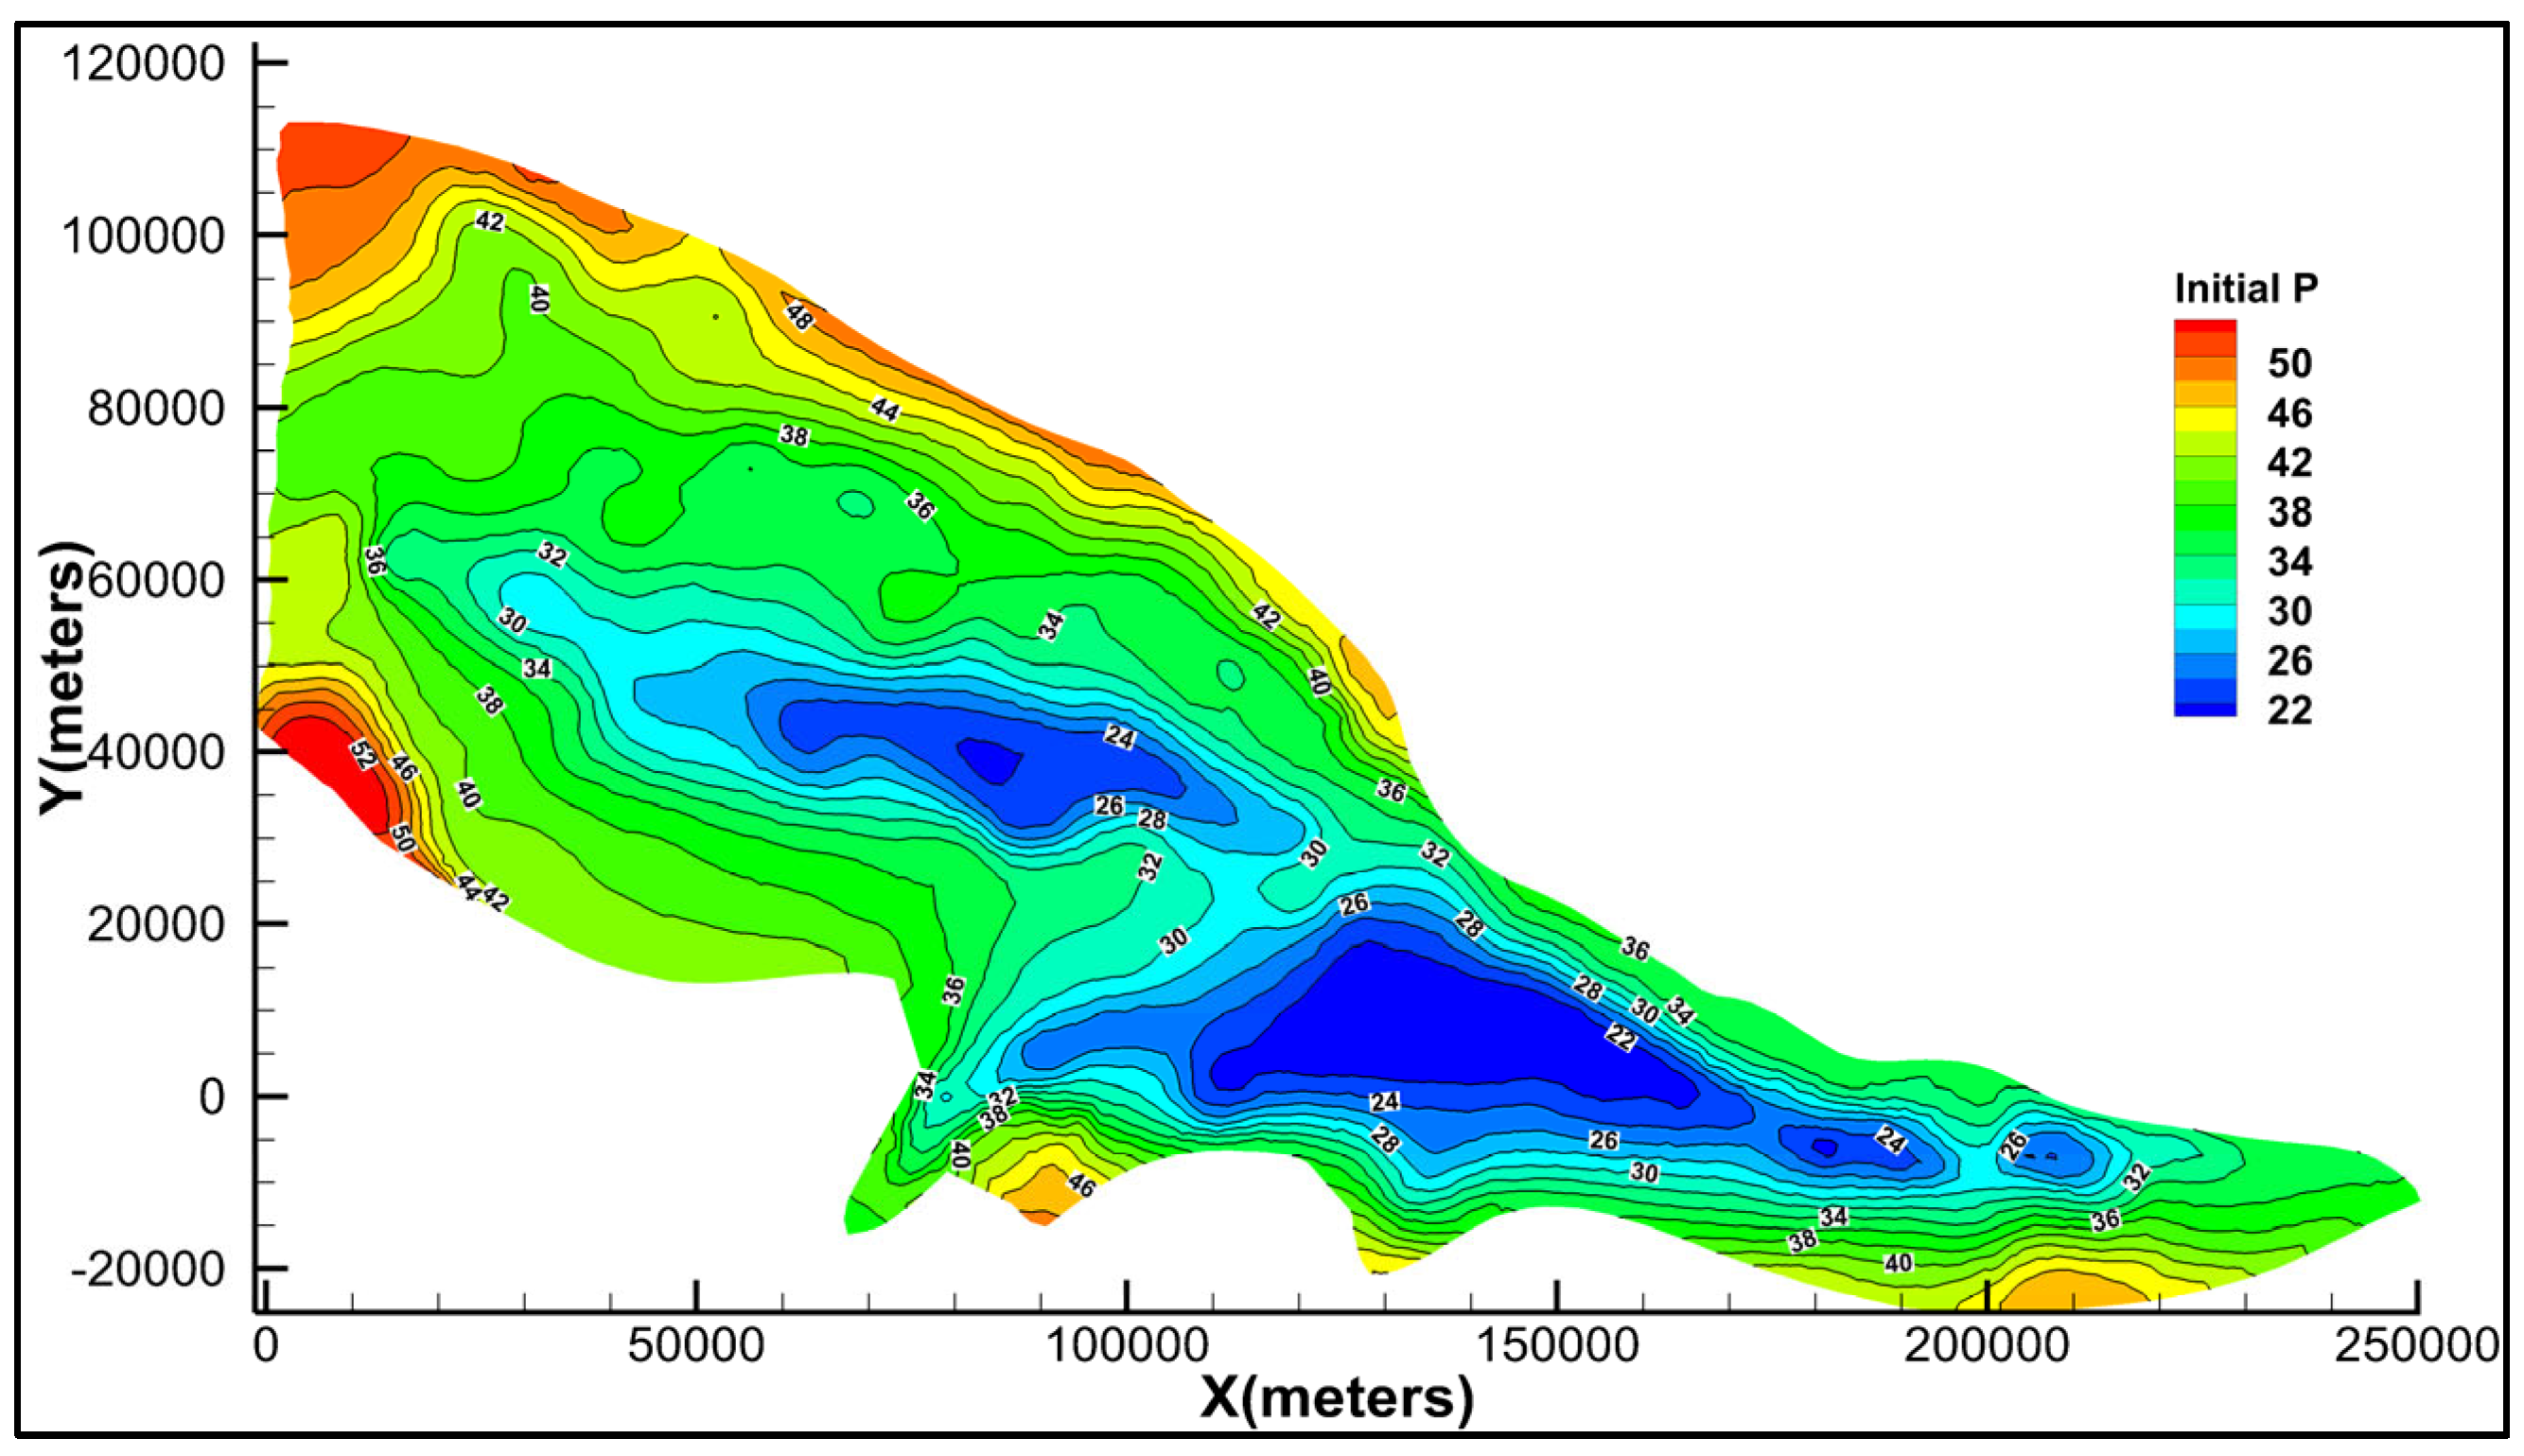
Similarly, in view of the complexity of the formation structure and the large variation in the reservoir burial depth, a fixed pressure head boundary of 22 MPa was set at −2760 m at the highest point of the model, and then the model was operated for 1000 years. The static water balance was obtained by gravity calculations between the boundary of the fixed boundary pressure head and the formation burial depth, and the distribution of the initial pressure field under the condition of stable flow in the study area was obtained, as shown in Figure 4.
It is worth mentioning that the actual formation pressure in the study area reaches 70.8 MPa at the bottom of the Ordovician, which is higher than the upper limit of 60 MPa allowed by the software. Therefore, the initial pressure was adjusted by adjusting the mesh depth to more than 6700 m to ensure calculation convergence. Similarly, the reservoir temperature did not exceed 110 °C. Therefore, to meet the convergence needs of the software, the temperature gradient should be appropriately reduced to ensure the smooth calculation of the model. Also, this study focuses on large-scale pressure propagation and phase equilibrium within the reservoir, the injection rate is moderate, and the reservoir has a high heat capacity, so temperature perturbations are confined to the near-wellbore region with negligible influence on the far field, so the temperature changes are ignored for this part of the work.

3.2.3. Petro-Physical Properties

The physical parameters of the reservoir were calculated using the pore permeability results of the distributed reserves in the collected data. The caprock is based on lithological experience. The formation pore compression ratio was set to 4.5 × 10⁻¹⁰ Pa−1 [40,41]. Other rock property parameters, such as the density, specific heat, and conductivity, were obtained from He et al. [42,43]. Table 1 summarizes the main parameter values.

3.3. Injection Protocol Design

In large-scale CO2 storage engineering applications, different injection speeds and injected structural locations affect super critical CO2 plume migration and multiphase phase change, which in turn causes formation pressure evolution. To study the impact of CO2 injection speed and location, the injection protocols are described below.
CO2 was injected for 50 years, followed by 450 years of post-injection monitoring. The total injected CO2 was 394.2 Mt (78.84 Mt per well). Two injection-operation strategies were compared: CR injection and VR injection. The different injection-speed scenarios are listed in Table 2.
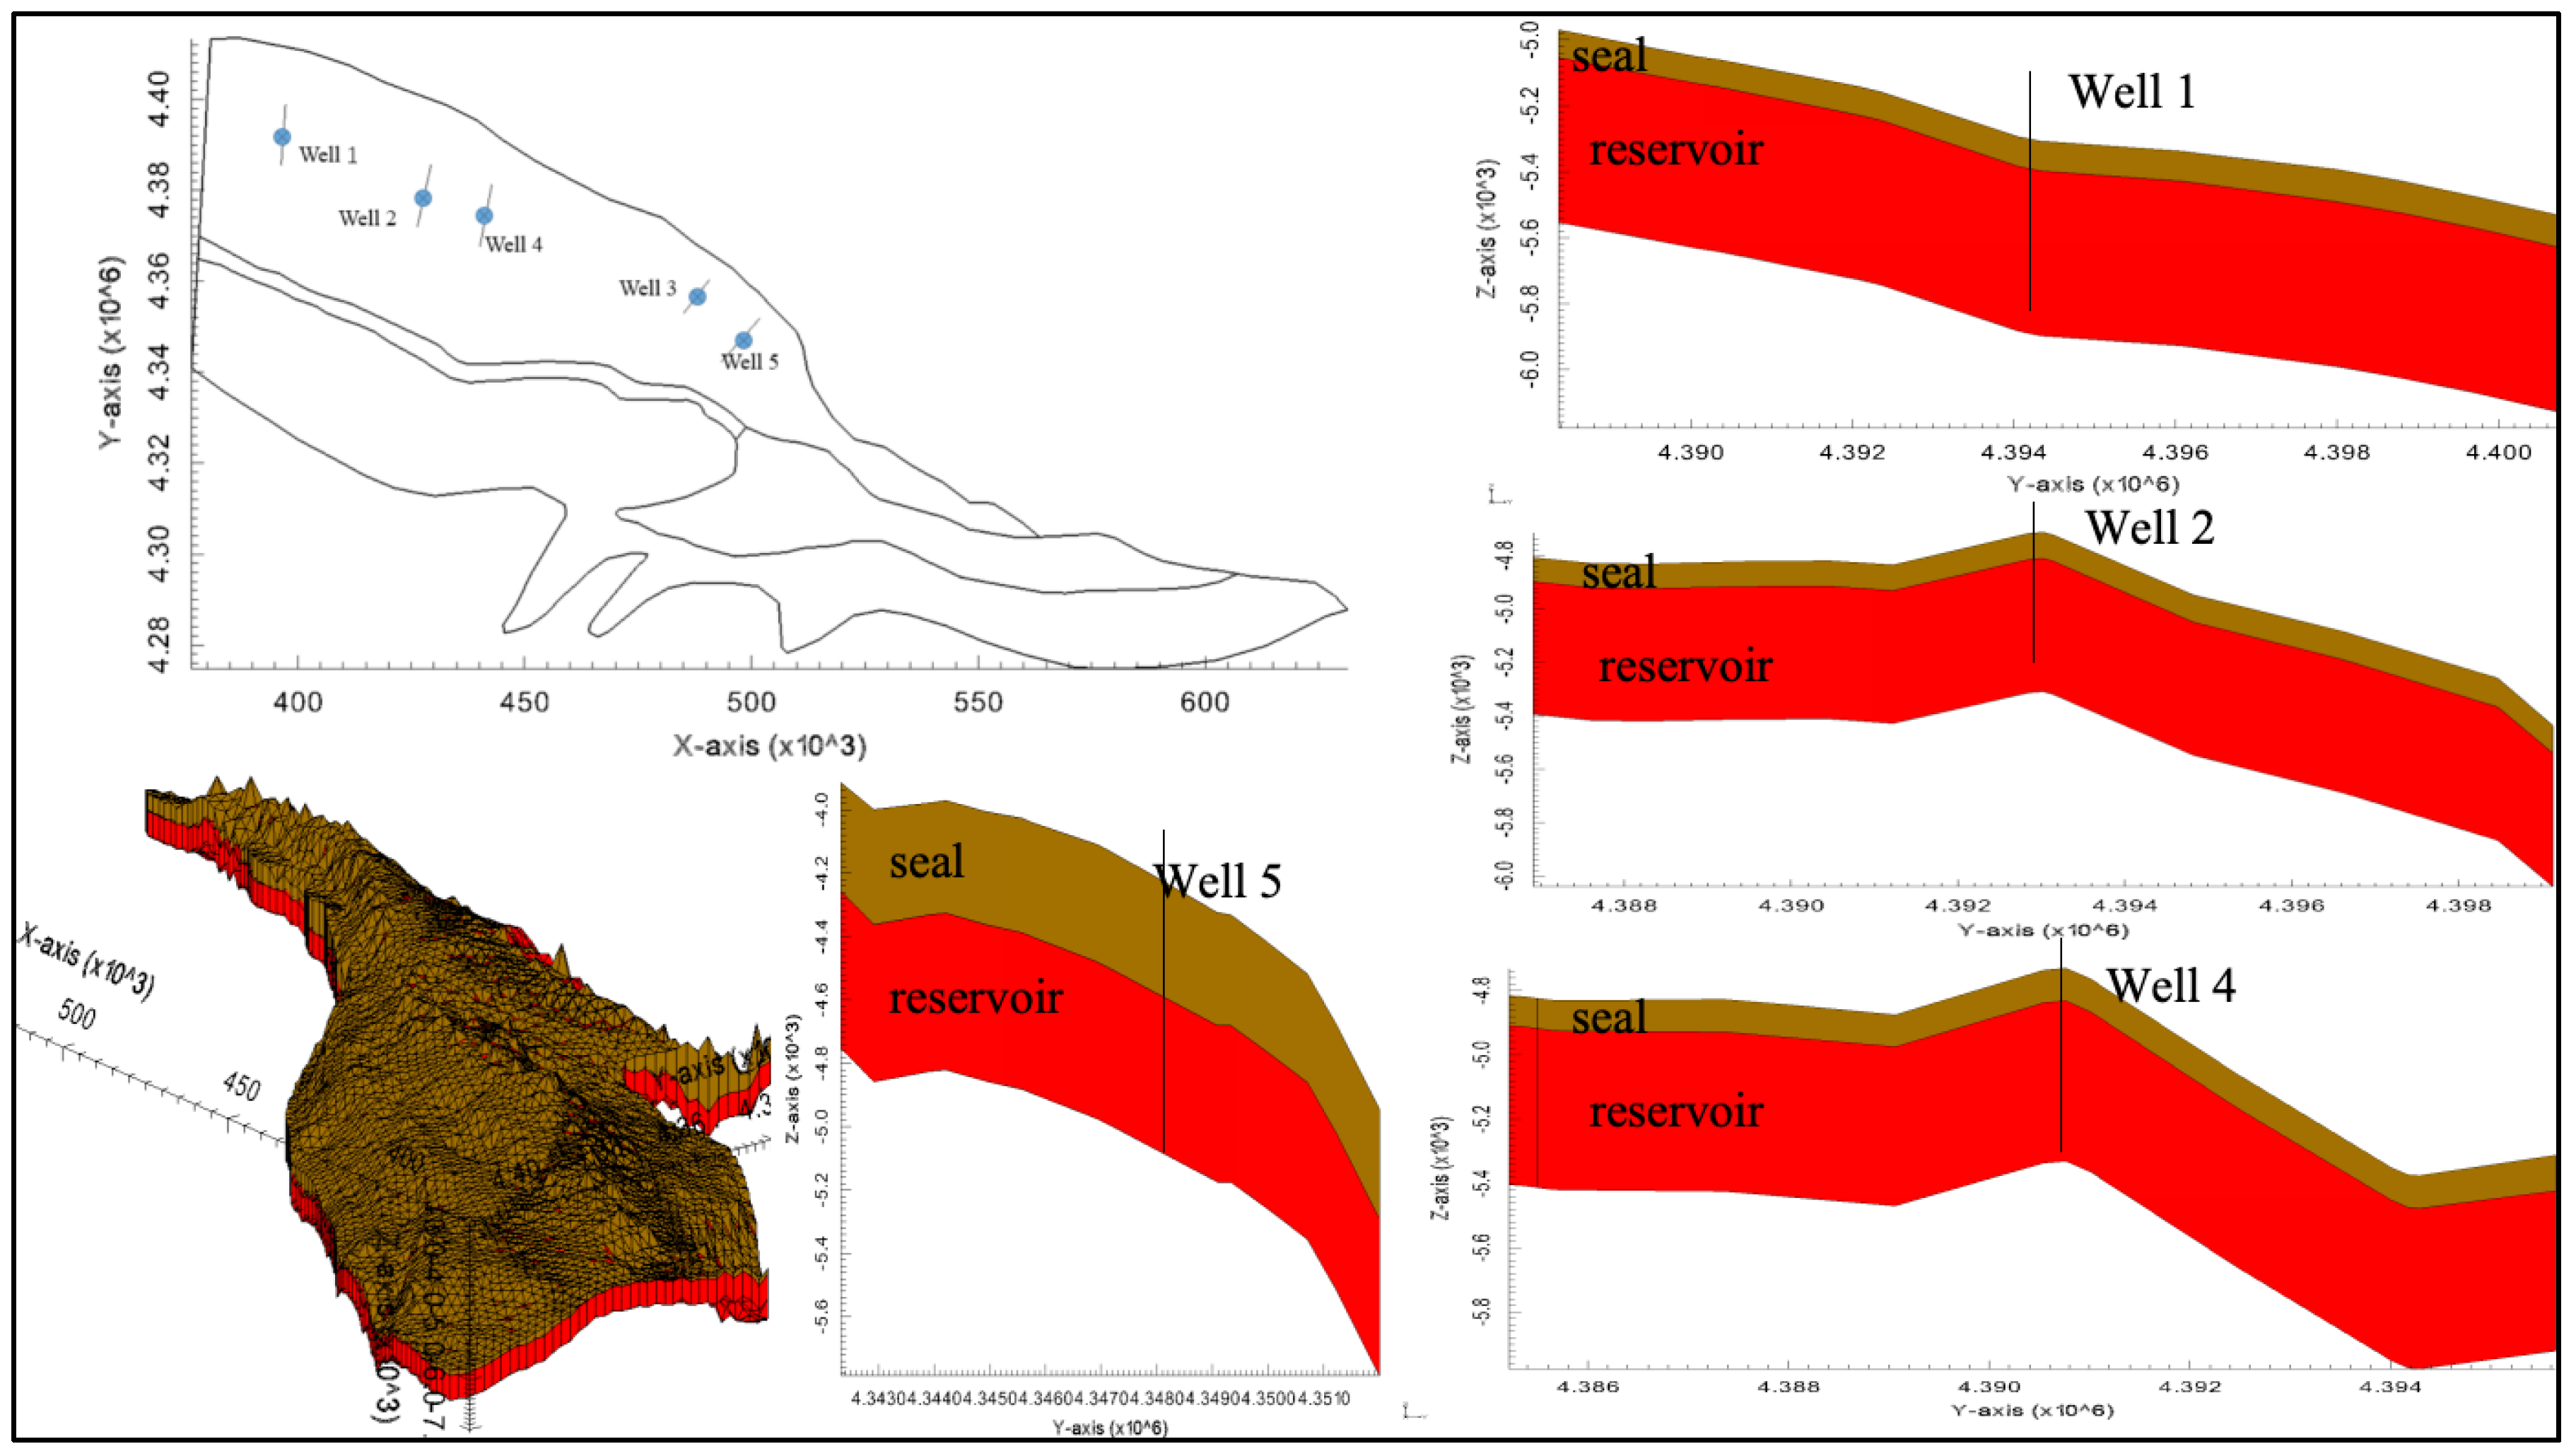
The effect of injection-site caprock morphology was evaluated by placing wells into distinct trap settings, including monocline traps (wells 1/3/5) and anticline traps (wells 2/4) with varying limb dip angles and closure depths (Table 3 and Figure 5).

4. Results and Discussion

According to the two injection sites and the injection velocity comparison program settings, an injection simulation of the cap layer system composed of the YSZ reservoir and the Lltg 3−5 caprock layer was carried out to predict the gas–liquid fluid diffusion and pressure rise. The results and contents of the discussion include different injection speeds and the selection of trapped injection locations in different injection structures, simulating and predicting the distribution of gas and liquid CO2 plumes in the reservoir, the conversion of different storage mechanisms, pressure lifting, and other issues, and the analysis of the potential environmental geological impact.

4.1. Effects of Injections at Different Tectonic Positions on CO2 Plume Transport and Phase Distribution

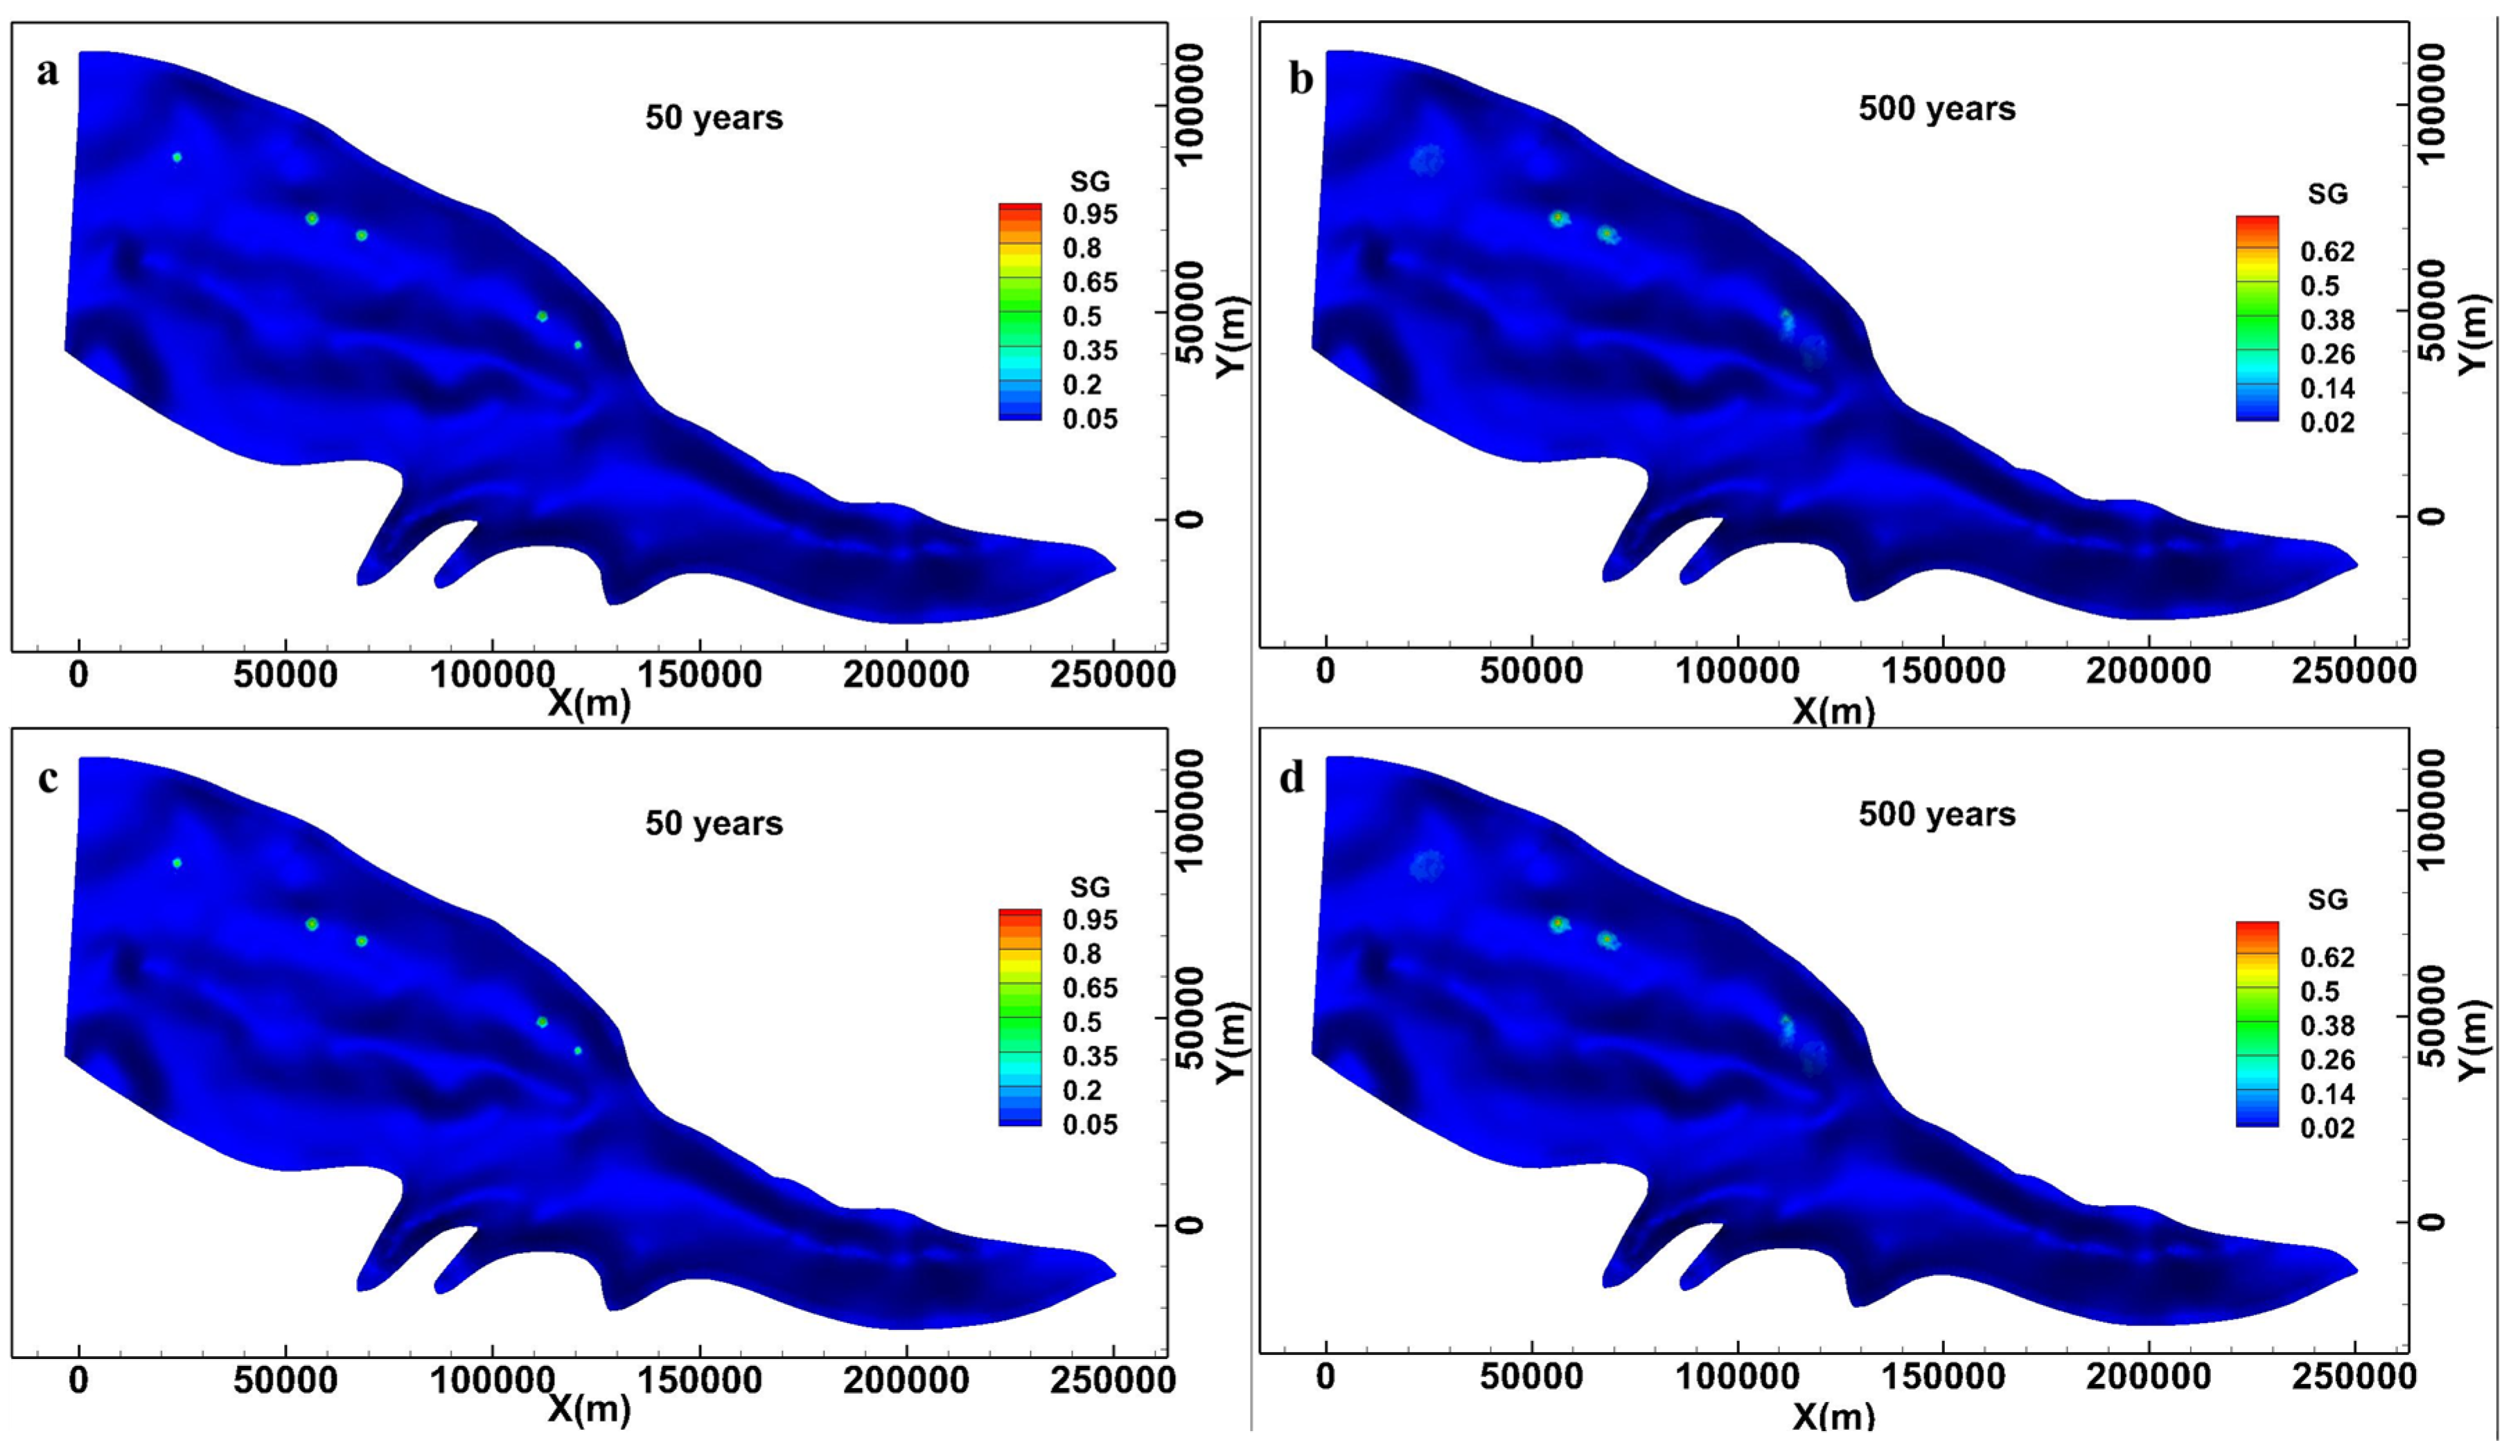
The model was injected with CO2 for 50 years and the fluid was transported for 500 years, and the gas-and-liquid-phase CO2 plume diffusion at different structural positions is shown in Figure 6. Through the comparison of planar results, it can be found that at the time of monocline trap injection, because the contact area with the formation water was larger, gaseous carbon dioxide could be dissolved into the formation water more quickly. In 500 years, gaseous carbon dioxide is almost completely dissolved, while in the case of the anticline trap injection, carbon dioxide is still stored in the gaseous state (Figure 6a,b). The gas–liquid-state carbon dioxide plume moves farther in the monocline trap, and the carbon dioxide diffusion range injected in the anticline trap is relatively small (Figure 6c,d).
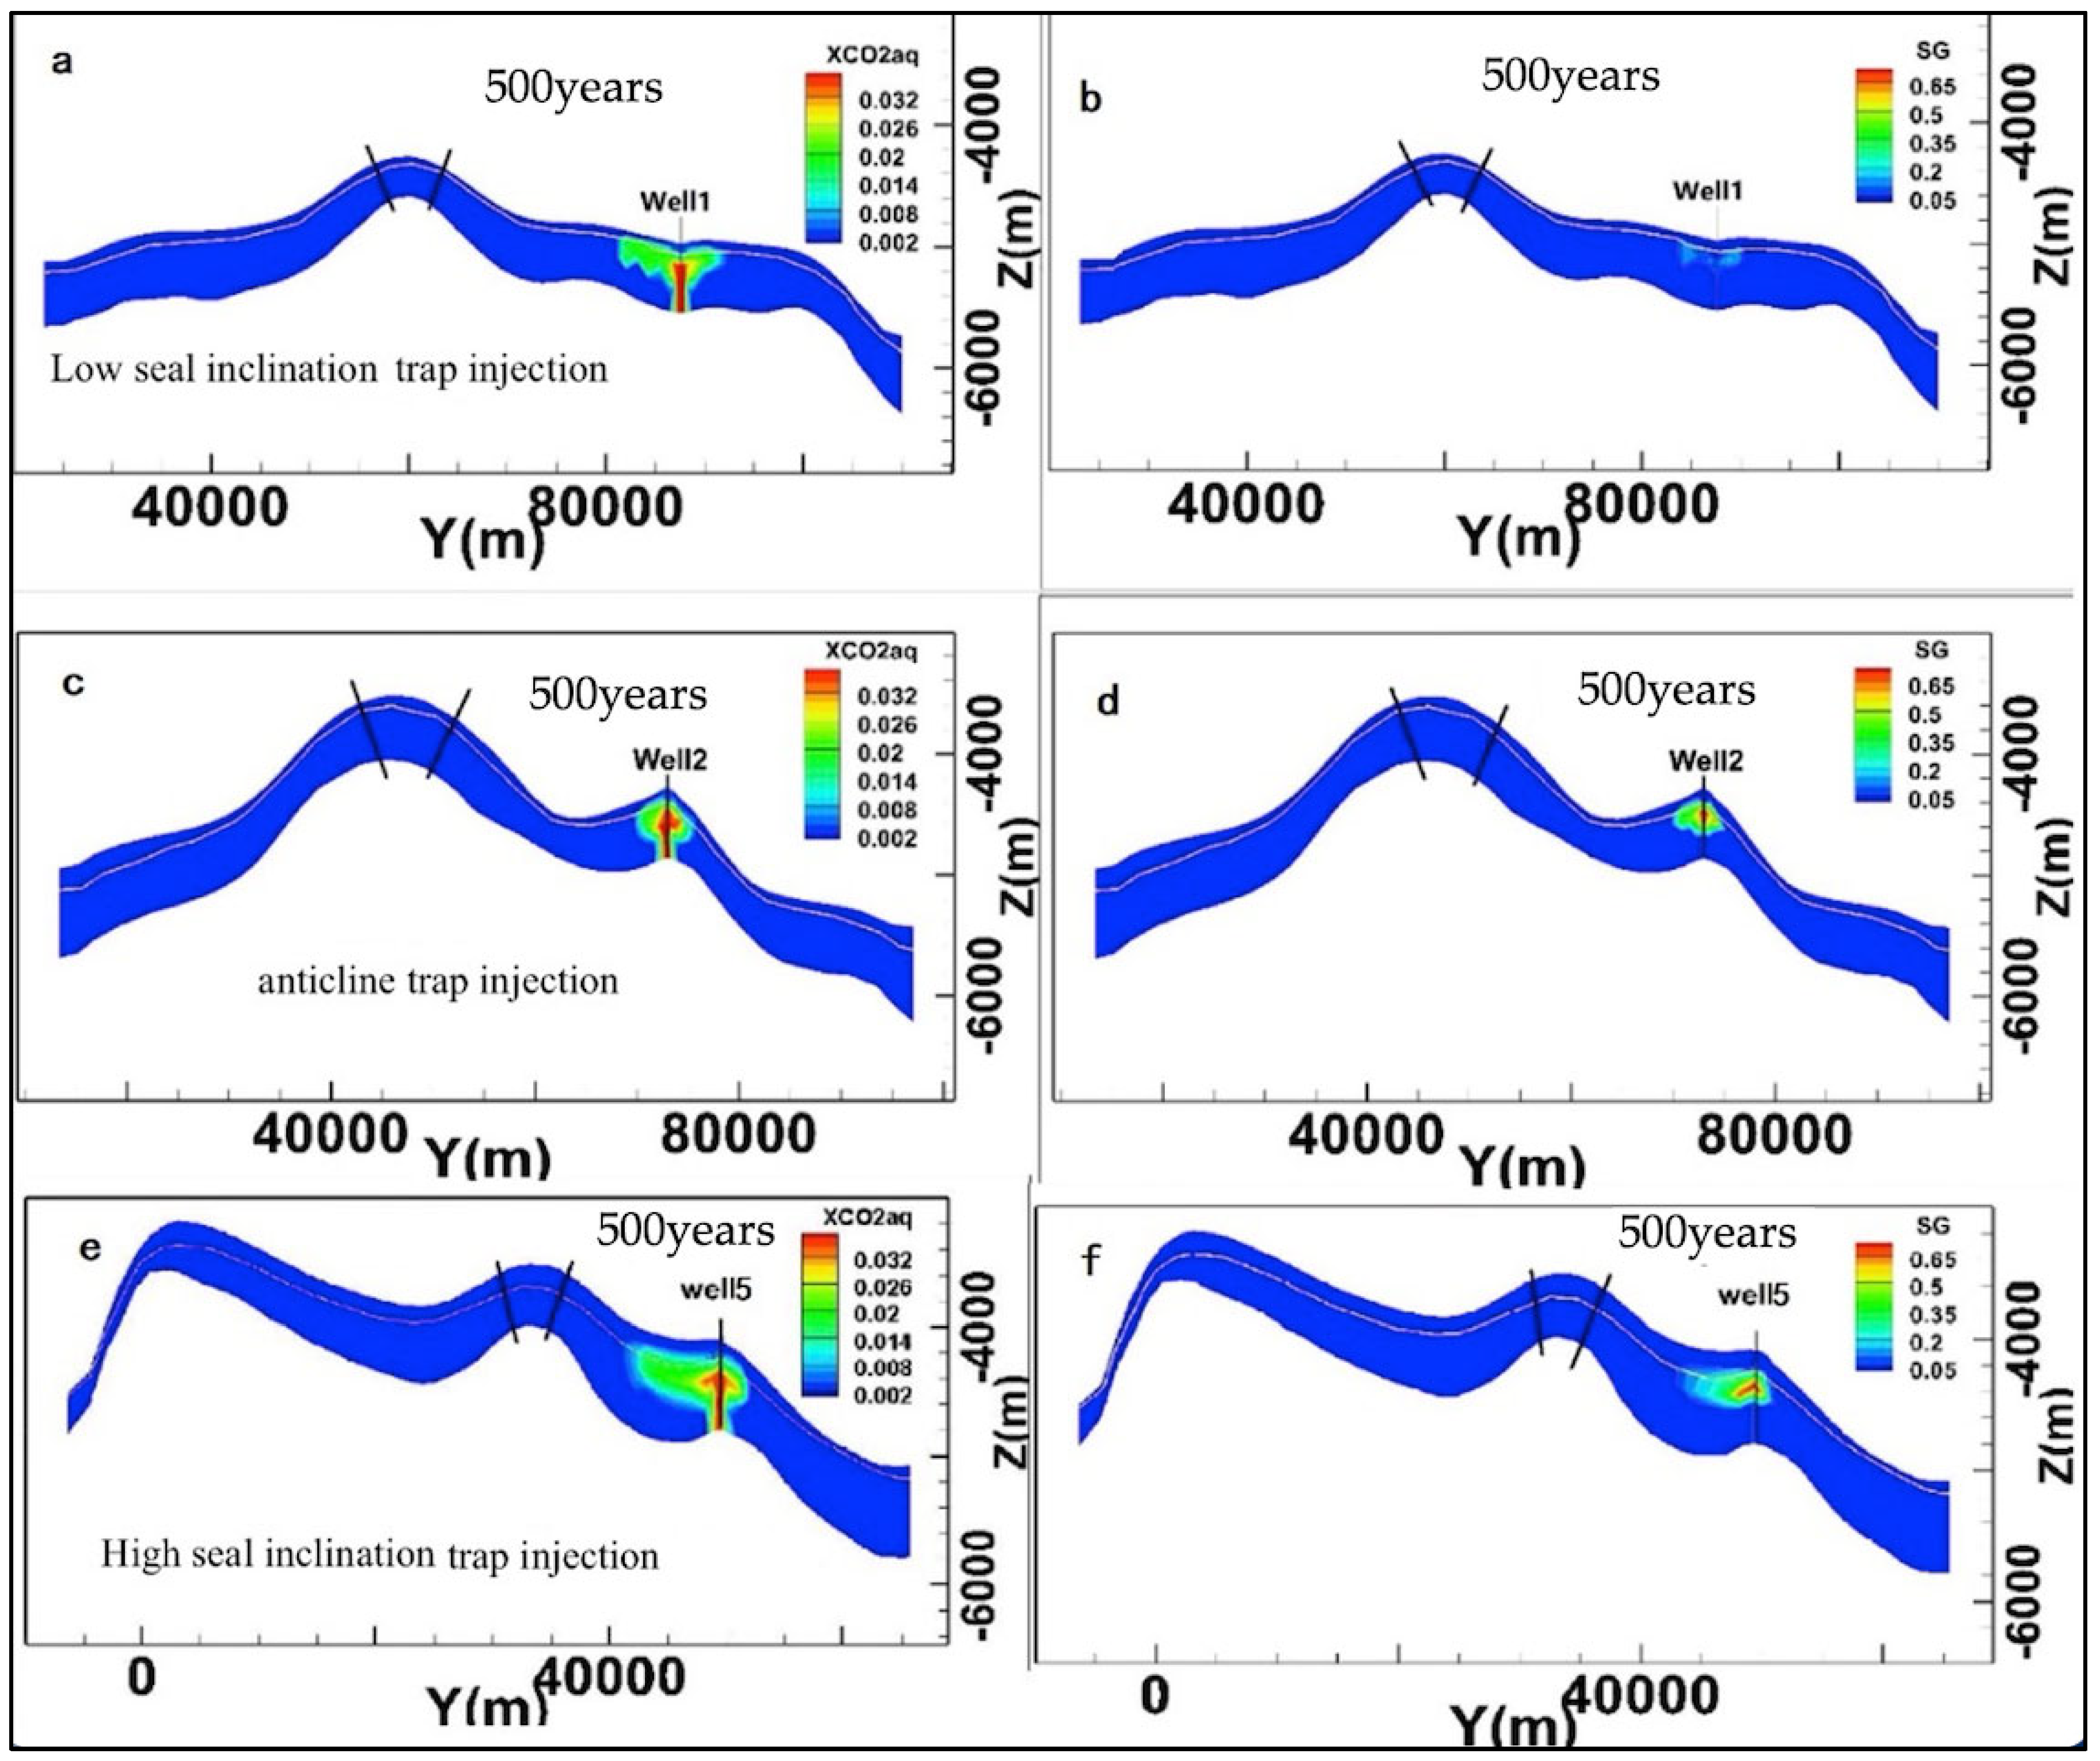
As can be seen from the cross-sectional view of the injection of different configurations shown in Figure 7, injection beneath low-dip caprock monoclines (Figure 7a) is 7757.0 m during the period from the end of injection to 500 years. When selecting the tilt position of the higher caprock dip angle (Figure 7e,f), the farthest diffusion distance in 500 years reached the farthest diffusion distance of 8114.47 m, which remained within the trap range and did not reach the barrier fault in the middle. When the anticline trap was injected (Figure 7c), the dissolved CO2 diffusion distance was controlled at 1883.97 m at 500 years. From the position of the anticline trap closure point in Figure 7c,d, it can be seen that the dissolved CO2 range is basically maintained within the closed range of the anticline trap; however, even if it escapes from the trap boundary, the cut-off will be captured by the monocline trap, so there is basically no trap edge escape.
Comparing wells 1 and 5 in Figure 7, the gaseous carbon dioxide saturation can be found to be related to reservoir gaseous saturation and formation inclination when the model was run for 500 years. The higher the caprock dip angle, the lower the gaseous carbon dioxide saturation in the reservoir, which means that the gaseous carbon dioxide in the reservoir dissolves faster and moves farther.
Figure 8 and Figure 9 show a comparison of the gaseous and liquid CO2 saturation variations in the cross-sectional view of the selection site as the monocline trap of well 1 and the anticline trap of well 2. It can be seen that the distribution range of gaseous CO2 is wider in the case of the monocline trap injection, and the maximum value that can be achieved under gas saturation is very small compared with the anticline trap. In the case of the anticline trap injection, the maximum saturation of carbon dioxide gas in the injection center line is 0.65. According to the distribution of gaseous CO2 saturation, the gas saturation at the closure point of the closed space is basically equal to 0, and it is still trapped within the anticline trap as residual gas within 500 years of injection.

4.2. Effects of Different Injection Speeds on the Transport and Distribution of the CO2 Plume

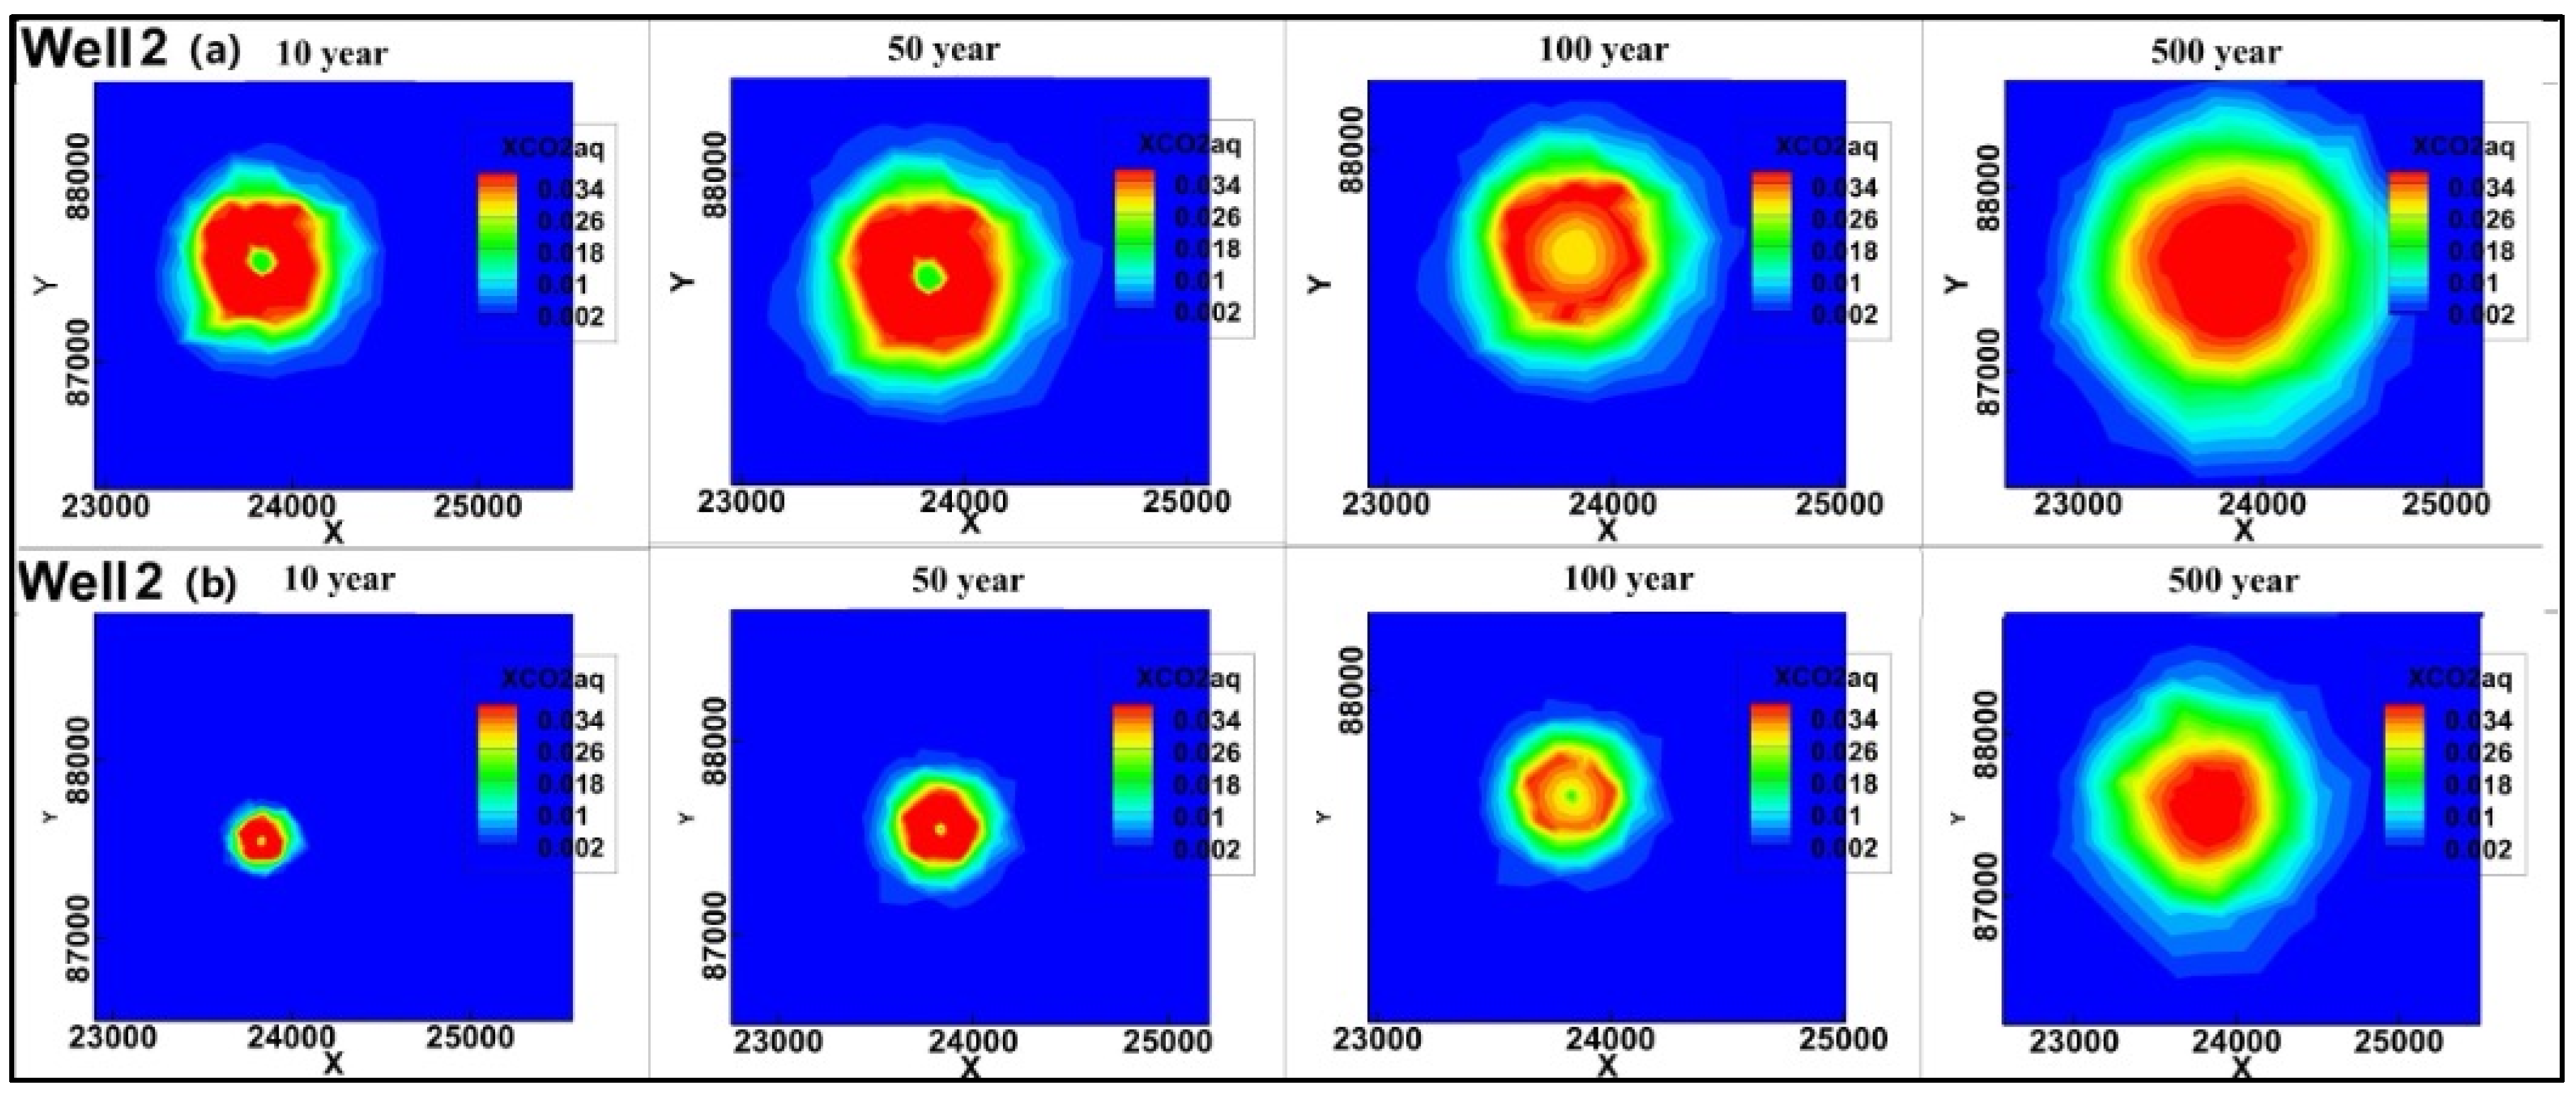
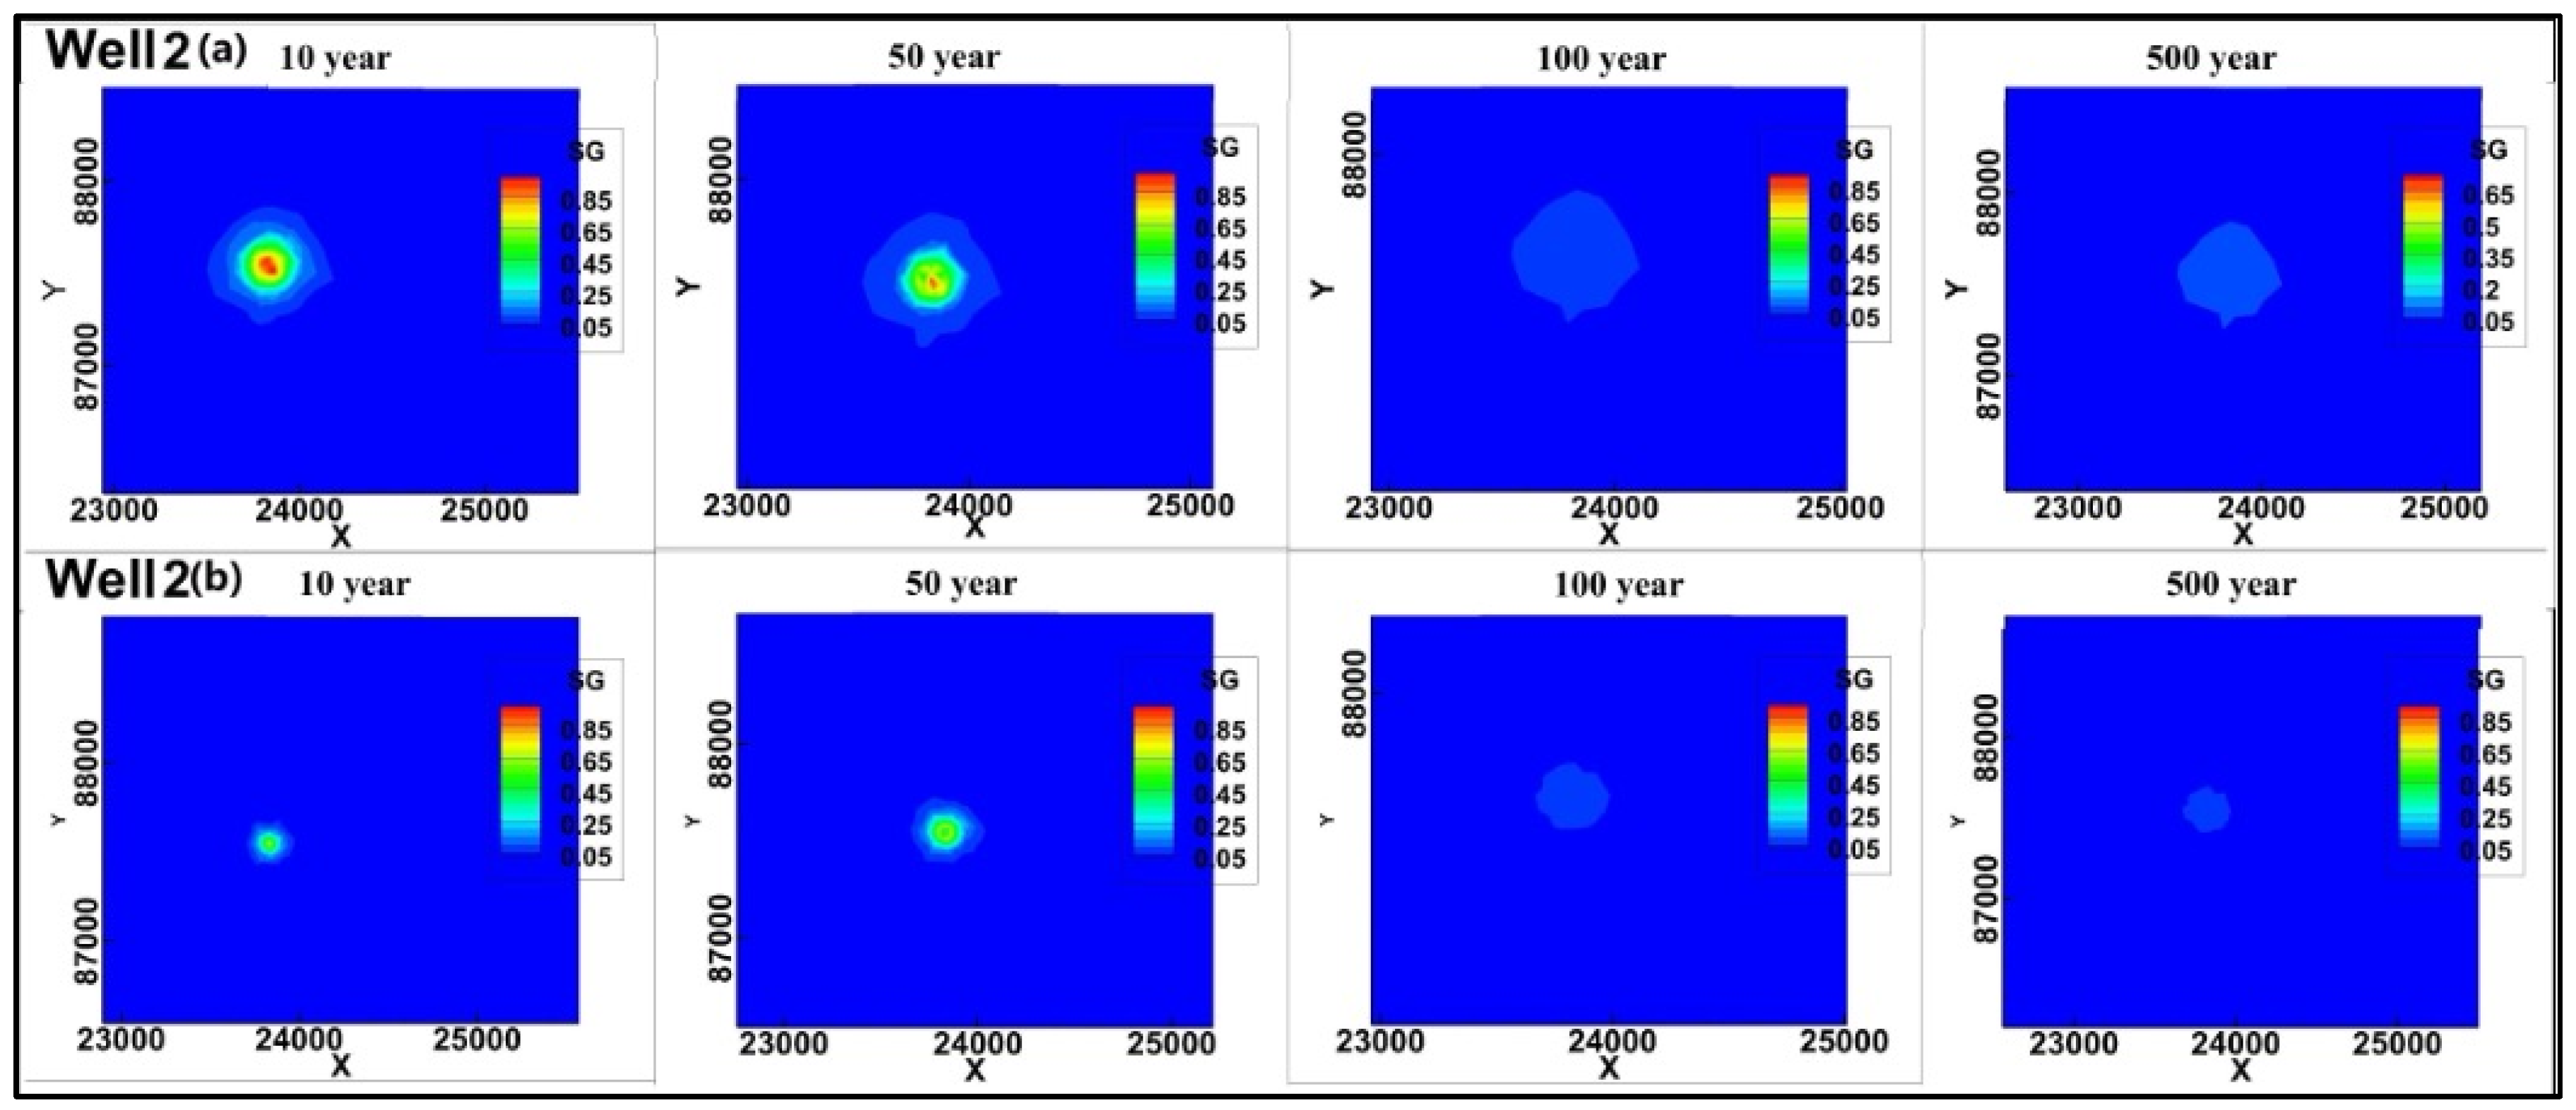
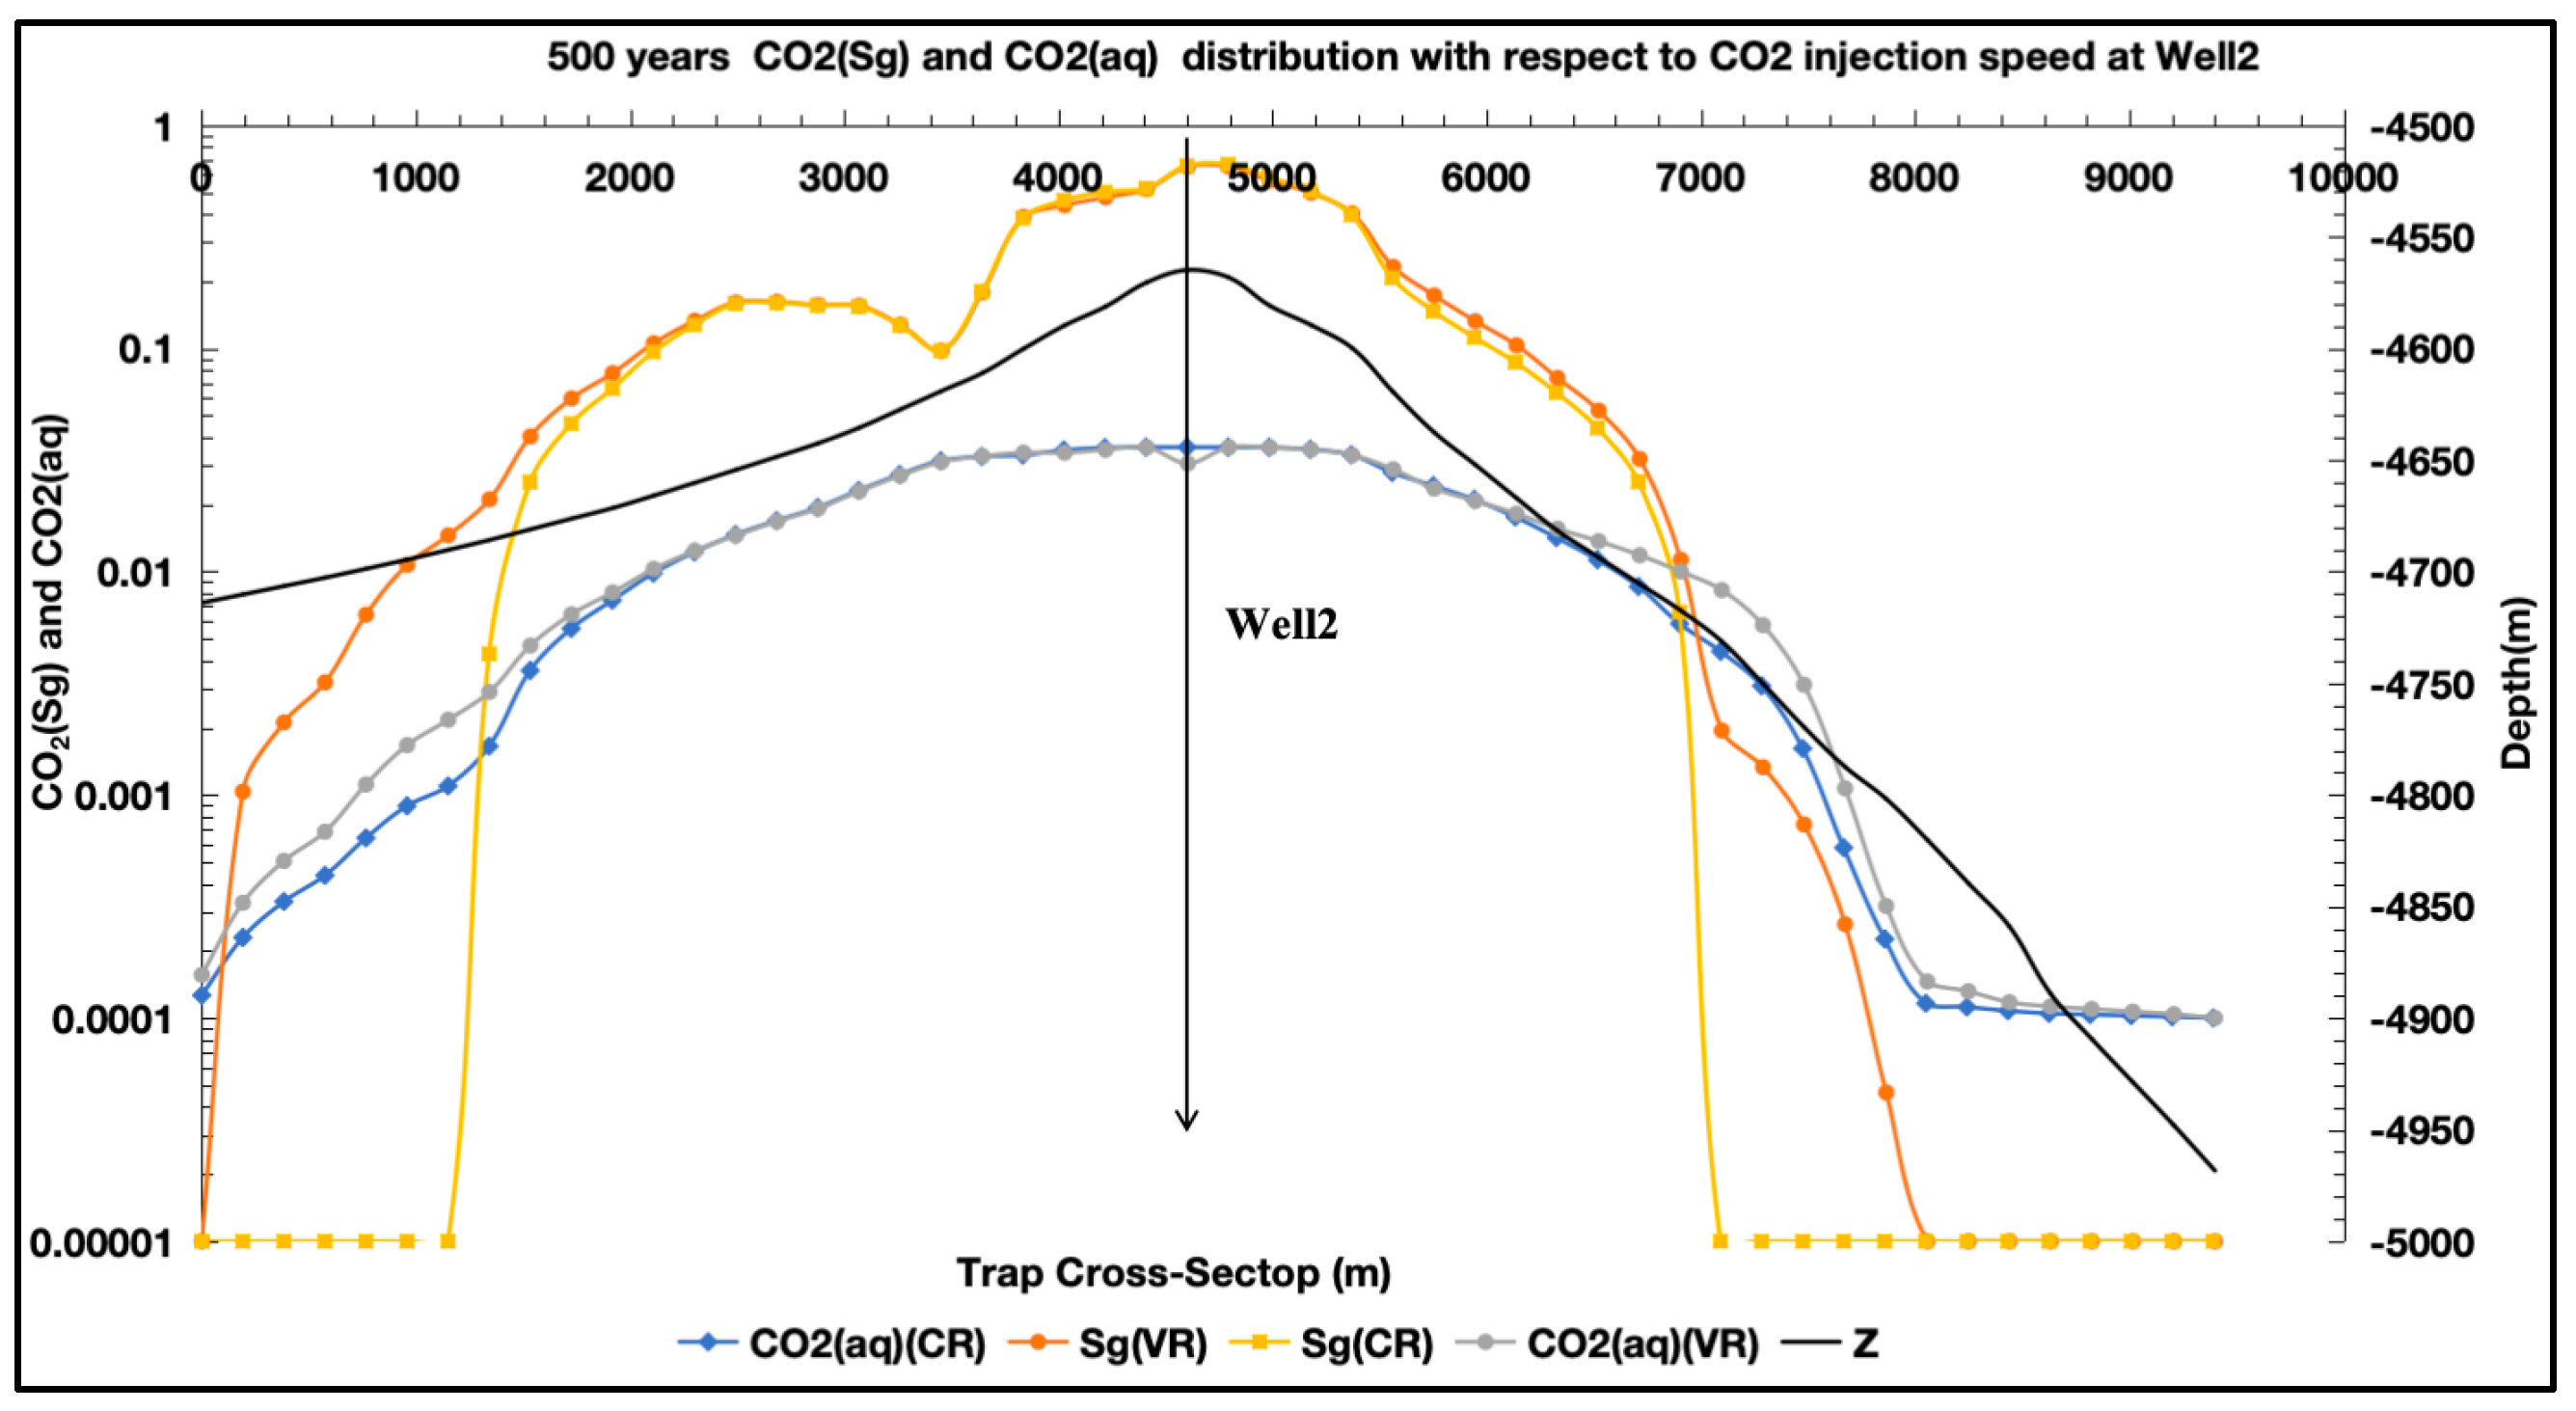
Figure 10 and Figure 11 show the dissolved and gaseous distributions of the well 2 anticline trap for the injection rates of 10, 50, 100, and 500. It can be seen that the dissolved CO2 diffusion distance at well 2 is greater than with the VR injection, at 1882.97 m, and the gas saturation is 0.65. However, the maximum range of dissolved CO2 injected with the VR injection was 1771.22 m (Figure 10). Gas saturation is 0.85. This means that the dissolution rate of CO2 in the lower reservoir at CR was faster than that at the time of VR injection, and the diffusion range was wider (Figure 11).
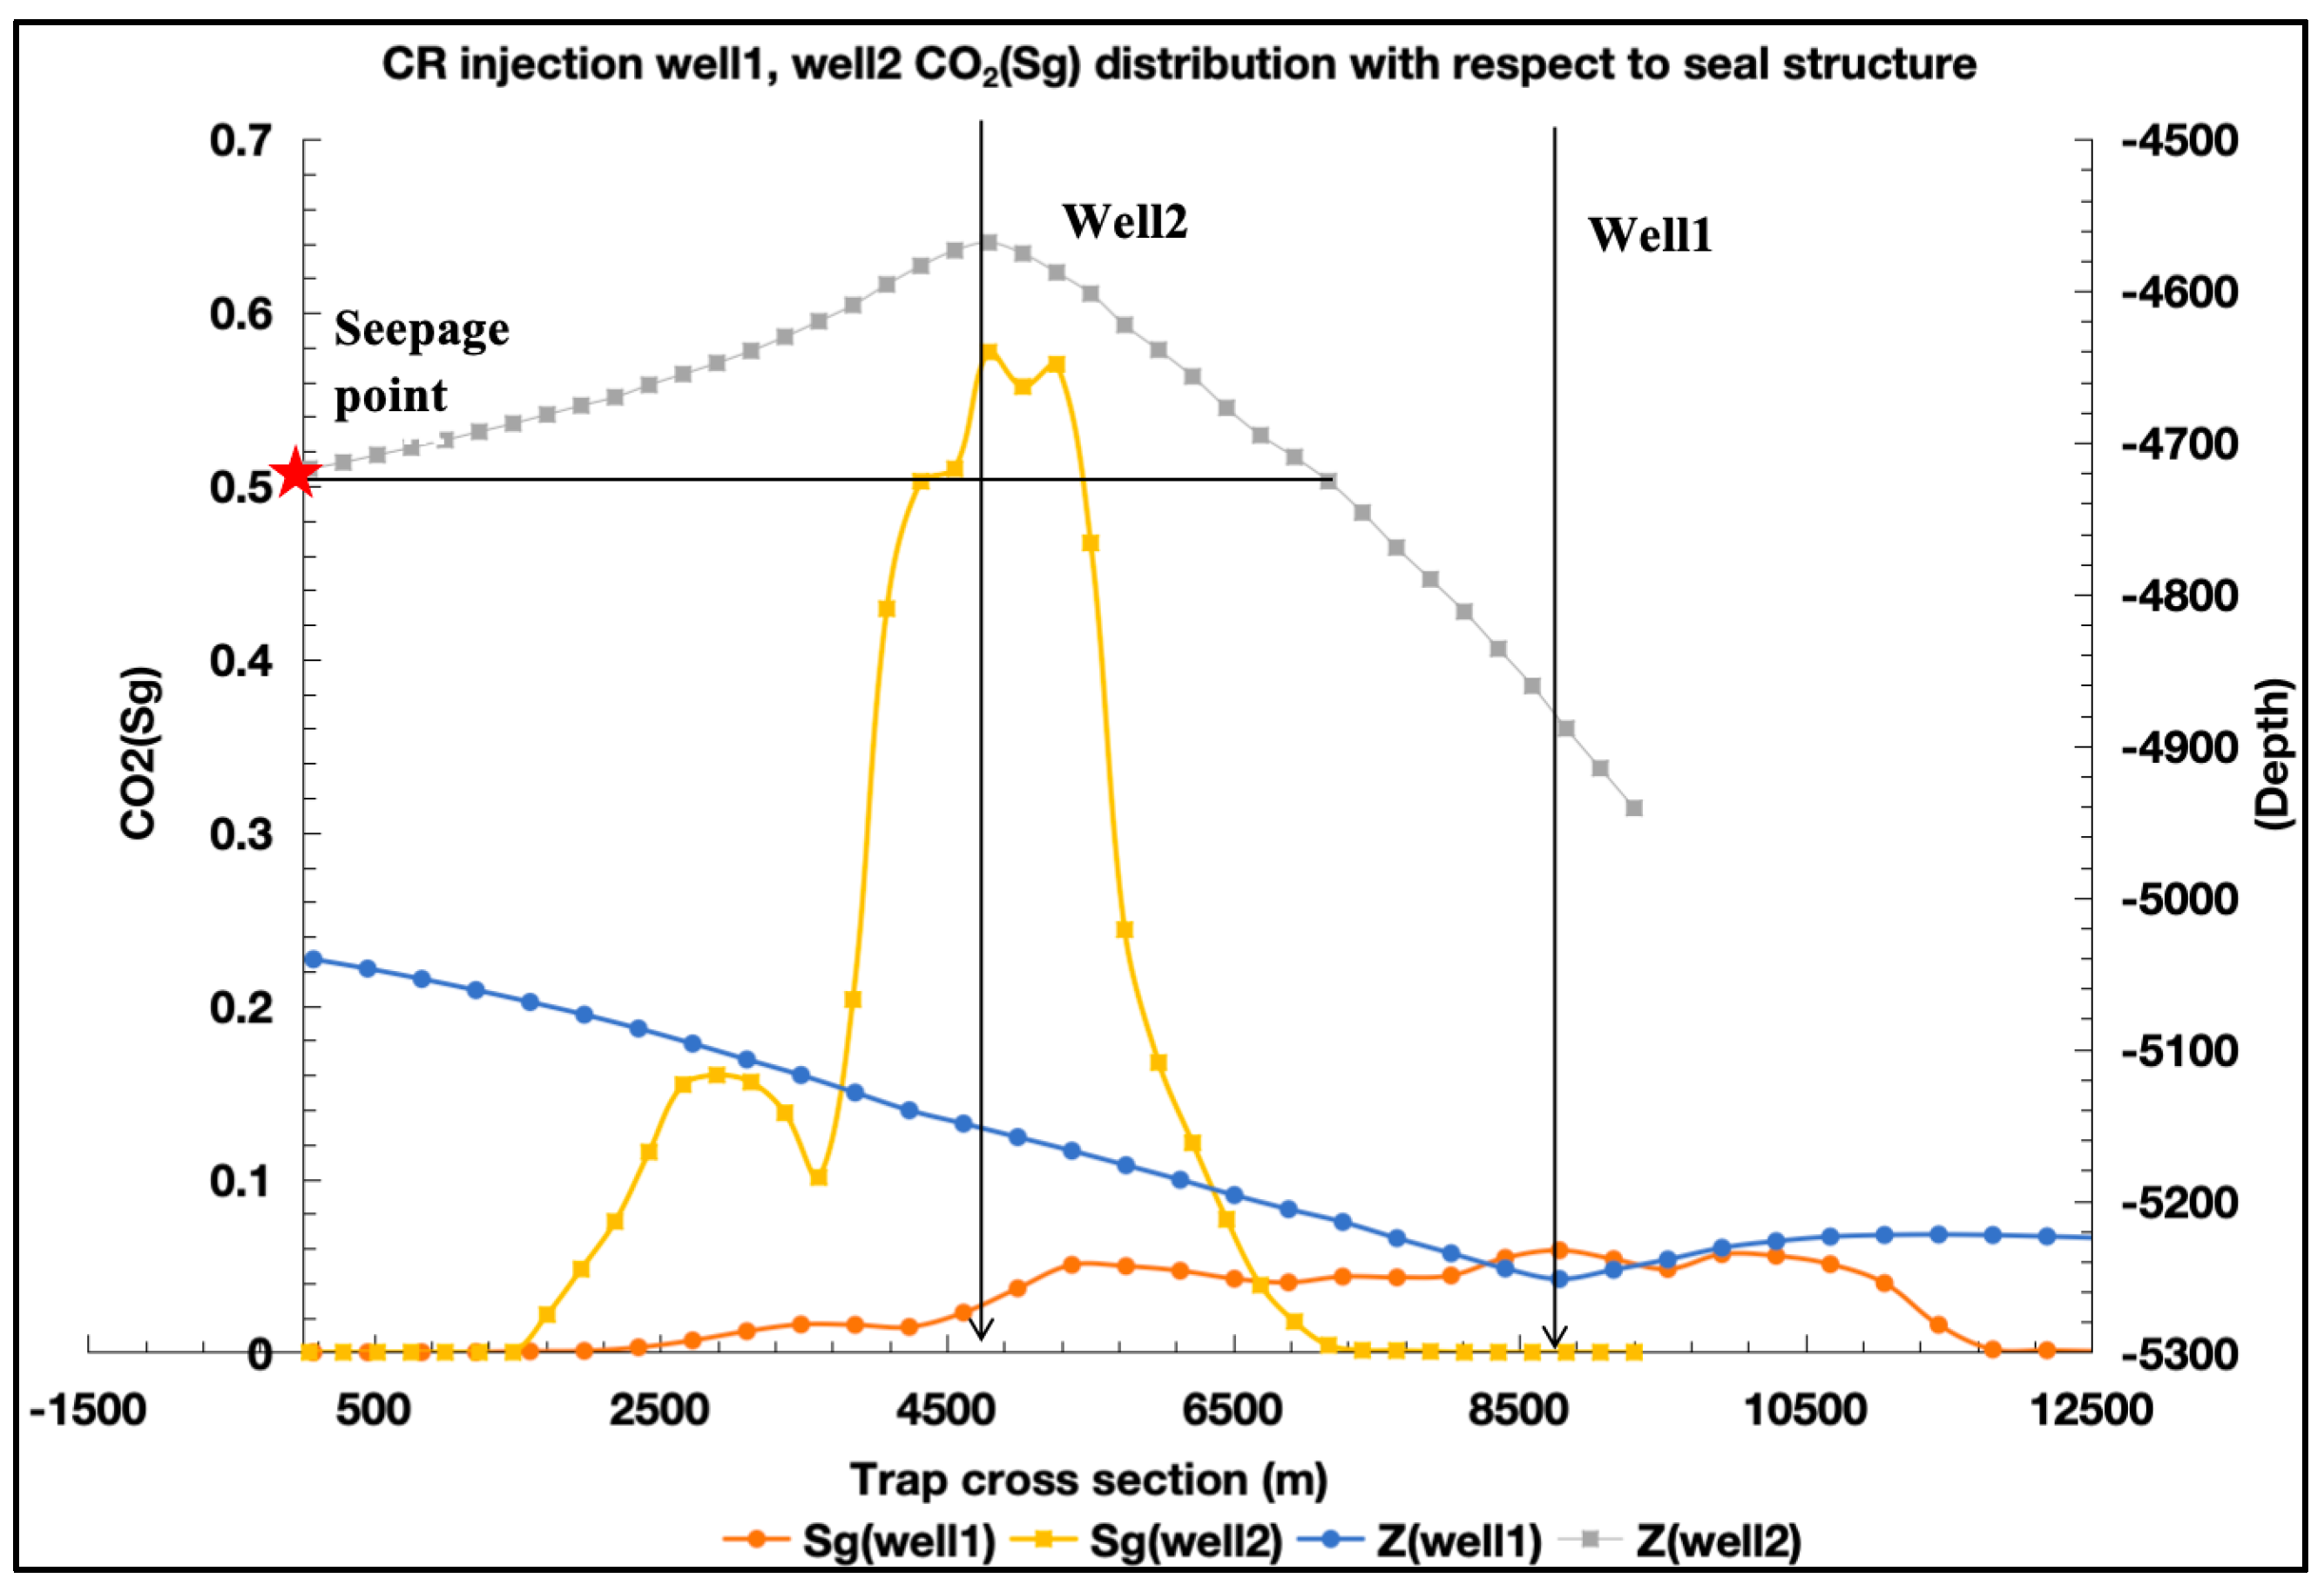
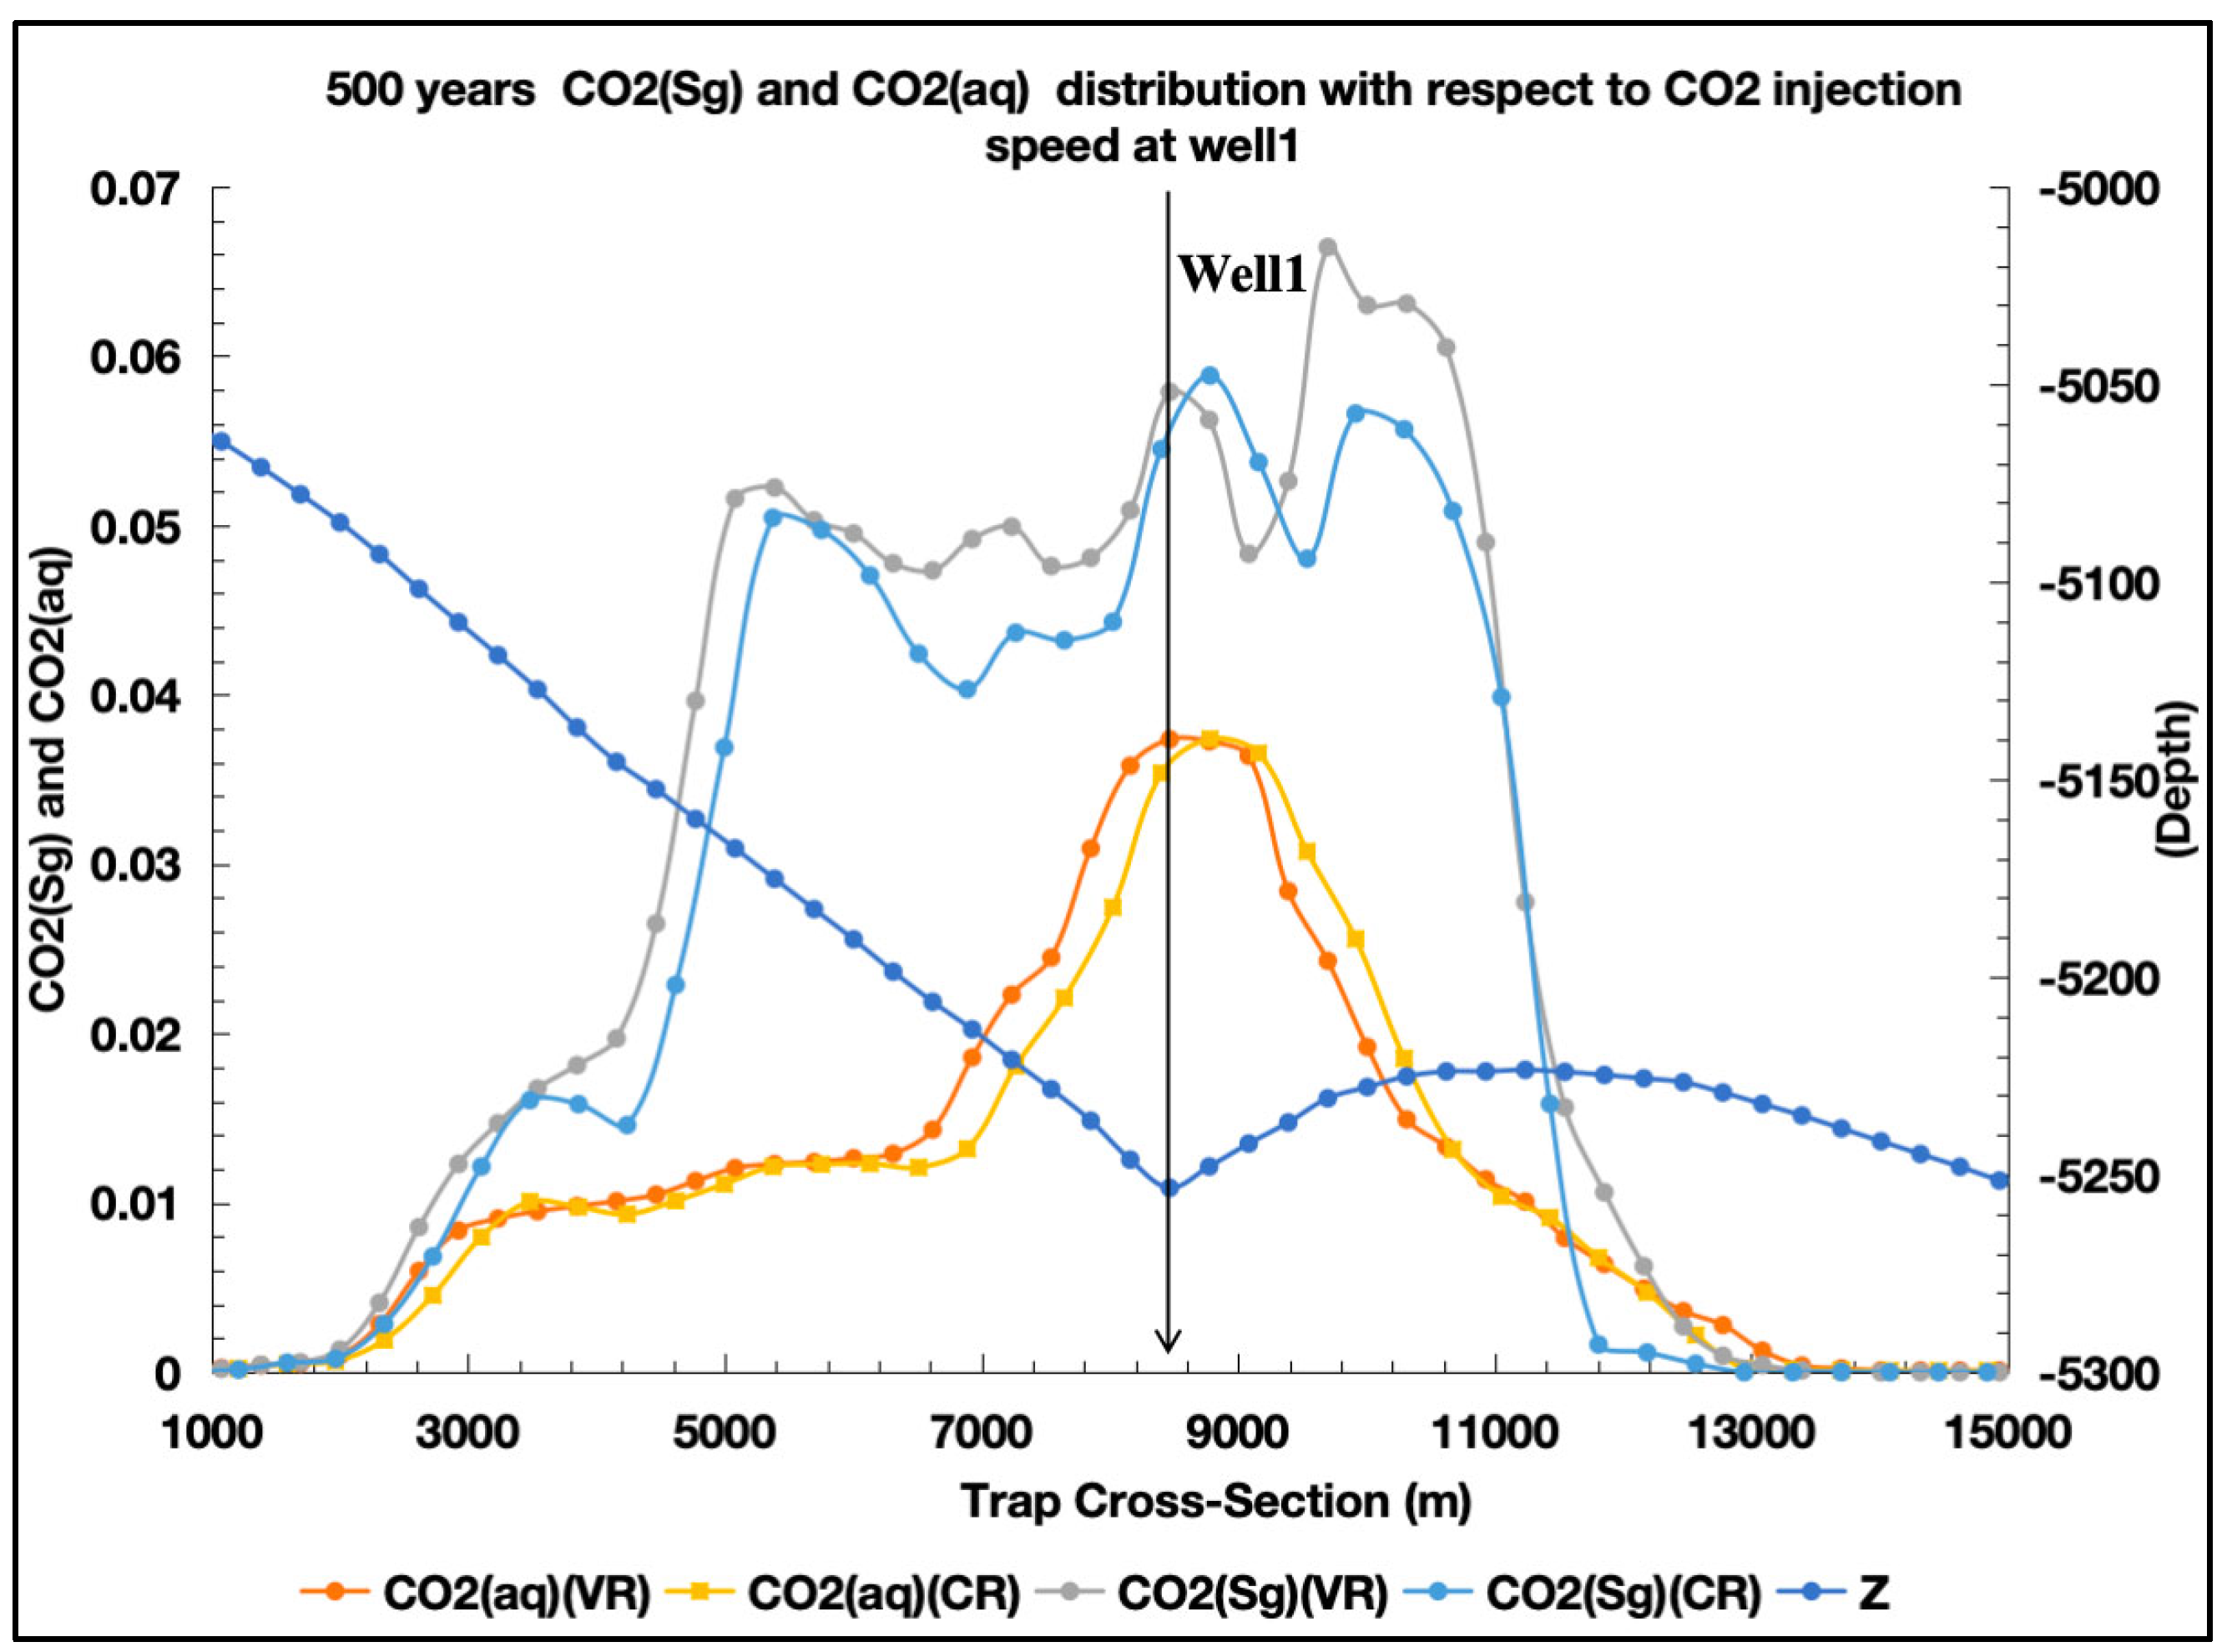
It can be seen from Figure 12 that when selecting the same structure trap (monocline trap) position and injecting at a constant speed and a variable speed, the effect of different injection speeds on the gas–liquid CO2 content distribution under the monocline structure is not significant when well 1 is 500 years old, but the diffusion range of dissolved CO2 when injected at a constant speed is wider than that when injected at a variable speed, while the distribution range of gaseous CO2 is wider under the opposite variable speed. CO2 saturation was higher with variable and constant velocity injections than with variable velocity injections.
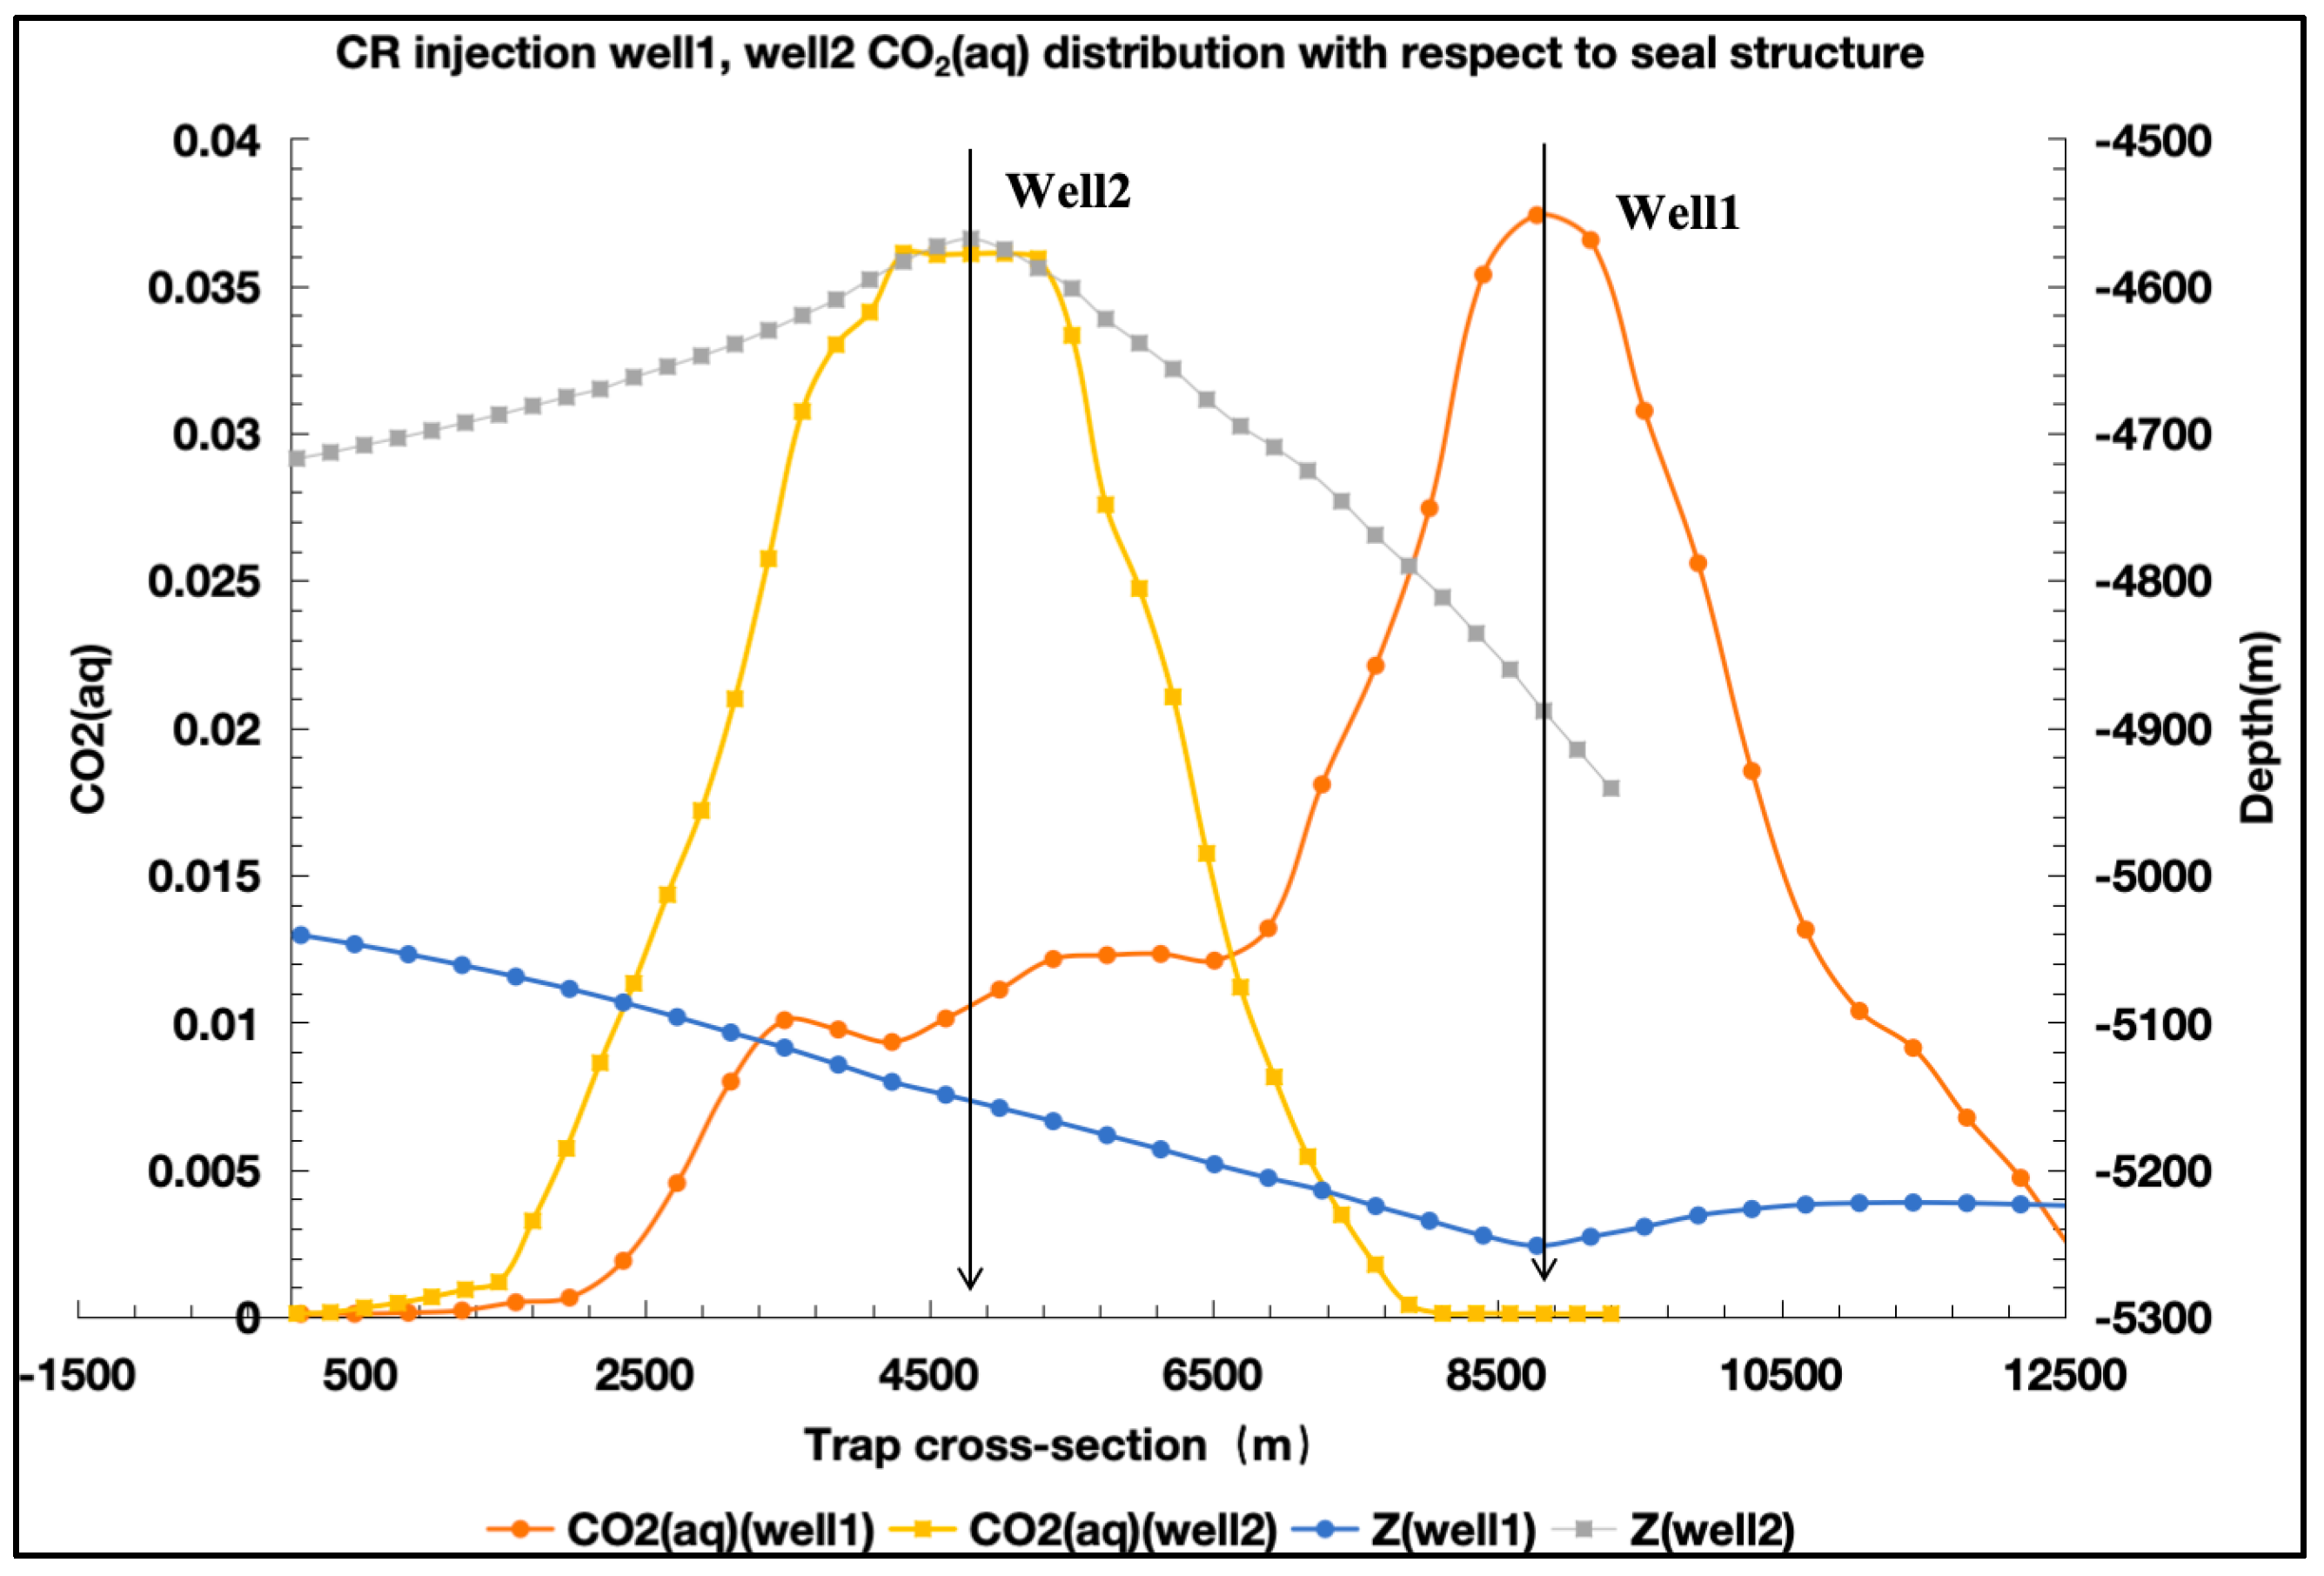
The comparative results of variable speed and constant speed injection in the case of the well 2 anticline trap injection are shown in Figure 13. It can be found that the diffusion range of gaseous CO2 under constant CR injection is smaller than that with the VR injection. The size and diffusion range of the dissolved CO2 in the VR injection case are very similar to those in the CR injection case, but the dissolved CO2 content extends wider, and the diffusion distance is longer in the case of the VR injection in both ranges.
In general, it can be seen that at the end of the 500-year simulation, the dissolved-CO2 migration distance followed the order CR > VR. Under the studied conditions, the VR injection most effectively limited the lateral spread of dissolved CO2 and thereby enhanced dissolved-CO2 immobilization. This behavior is consistent with the established understanding that time-varying injection schedules can promote residual and dissolution trapping by altering the saturation history and the gravity–viscous–capillary balance during plume evolution [44,45].

4.3. CO2 Injection Causes Pressure Buildup and Caprock Stability

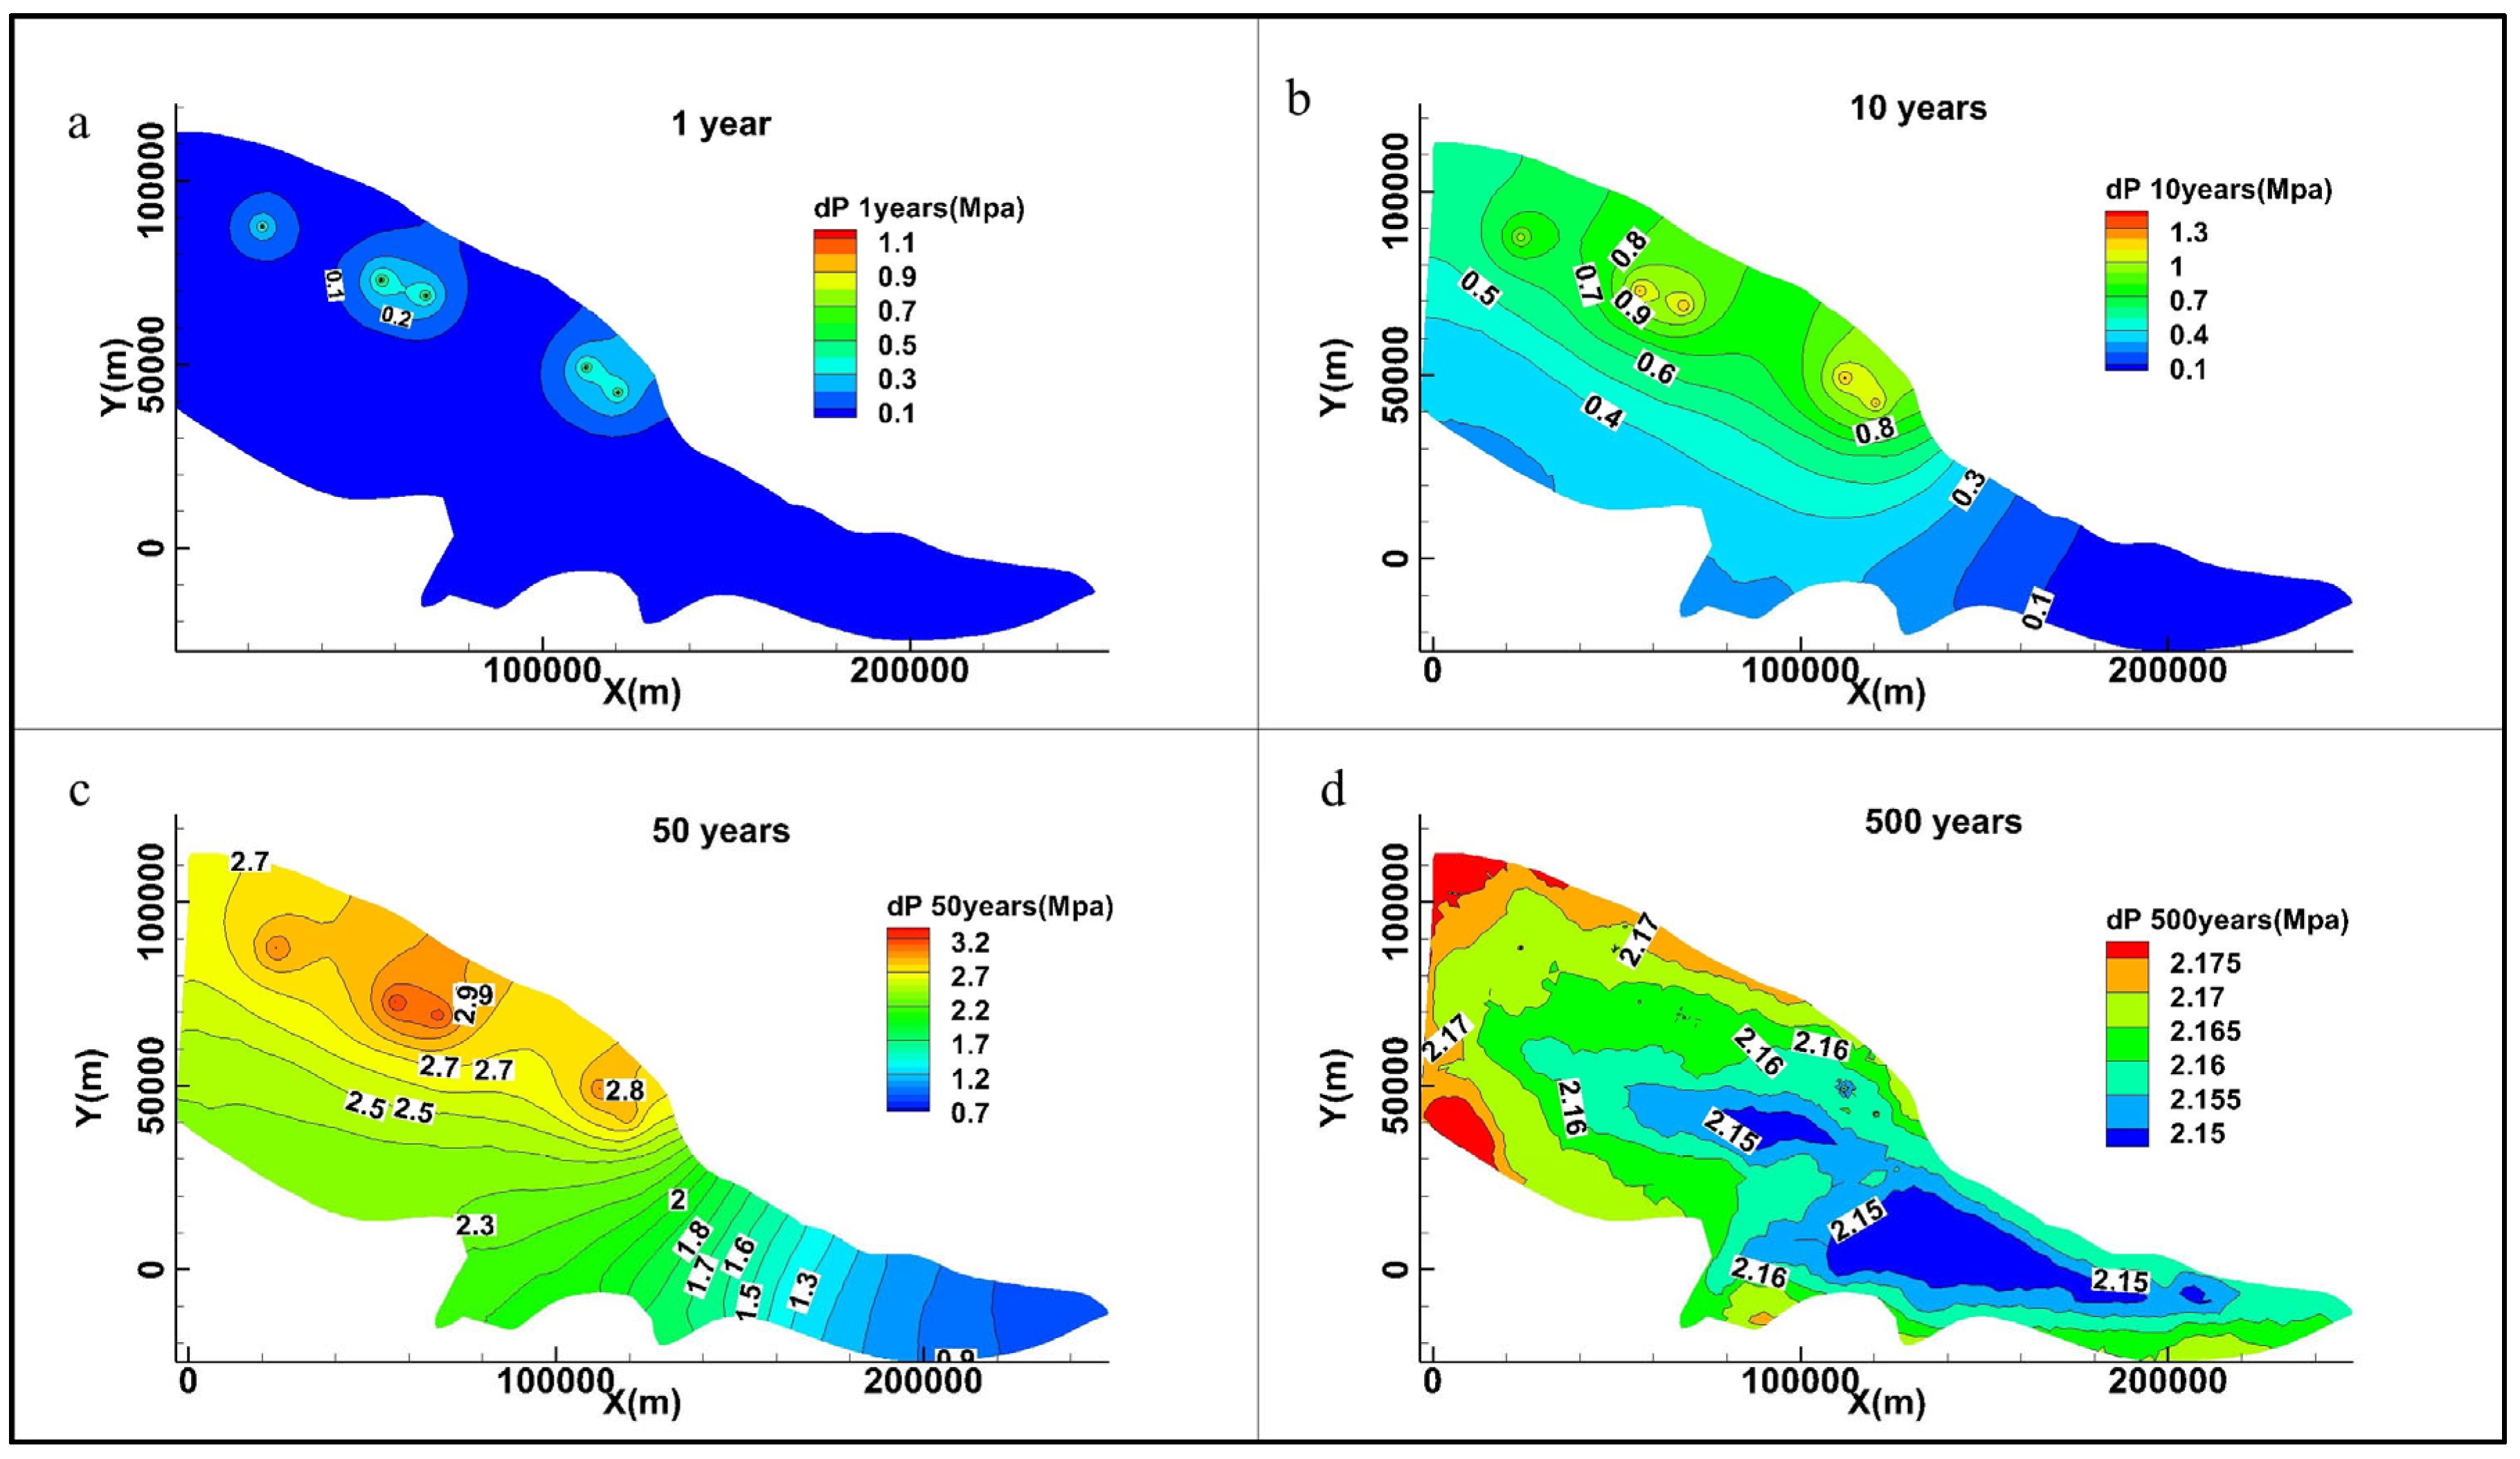
Five wells in the YSZ formation were continuously injected with supercritical CO2 at a constant rate of 50 kg/s. The simulation results of pressure buildup are shown in Figure 14 as pressure increment ΔP (DP, calculated as formation pressure minus initial hydrostatic pressure). As we can see from Figure 14, the pressure increases throughout the reservoir domain over time with the injection well as the epicenter. In the first year, the maximum pressure lift at the injection well position reached 1.1 MPa (Figure 14a), and the pressure lift range was relatively small. By the 10th year, the maximum pressure lift near the injection well reached 1.3 MPa (Figure 14b), and the pressure incremental range extended to the entire uplift range. In year 50, the maximum pressure increment near the injection well reached 3.2 MPa (Figure 14c). After stopping the injection, with the continuous dissolution and outward diffusion of gas CO2, the pressure gradually decreased to an average lifting amount of 2.15 MPa throughout the reservoir in the 500th year (Figure 14d). According to the data, the continuous thickness of the mudstone cover in the 3–5 sections of Lltg 3–5 is generally greater than 5 m, and the minimum breakthrough pressure is generally greater than 5 MPa. The average breakthrough pressure is 14.33 MPa [46], so CO2 can be effectively sealed below the cover without escape at a maximum pressure lift of 3.2 MPa.
According to the injection well position, comparing the pressure lifting effect of wells 2 and 4, it can be seen that when the injection positions of different wells are similar, the pressure lifting range centered on different wells will have a superposition effect, and the formation pressure lifting amount is higher when the positions are the same trap type. Because the injection well is closer to the fault boundary with zero flux, the formation pressure increases faster on the side of the injection well located close to the reservoir boundary.
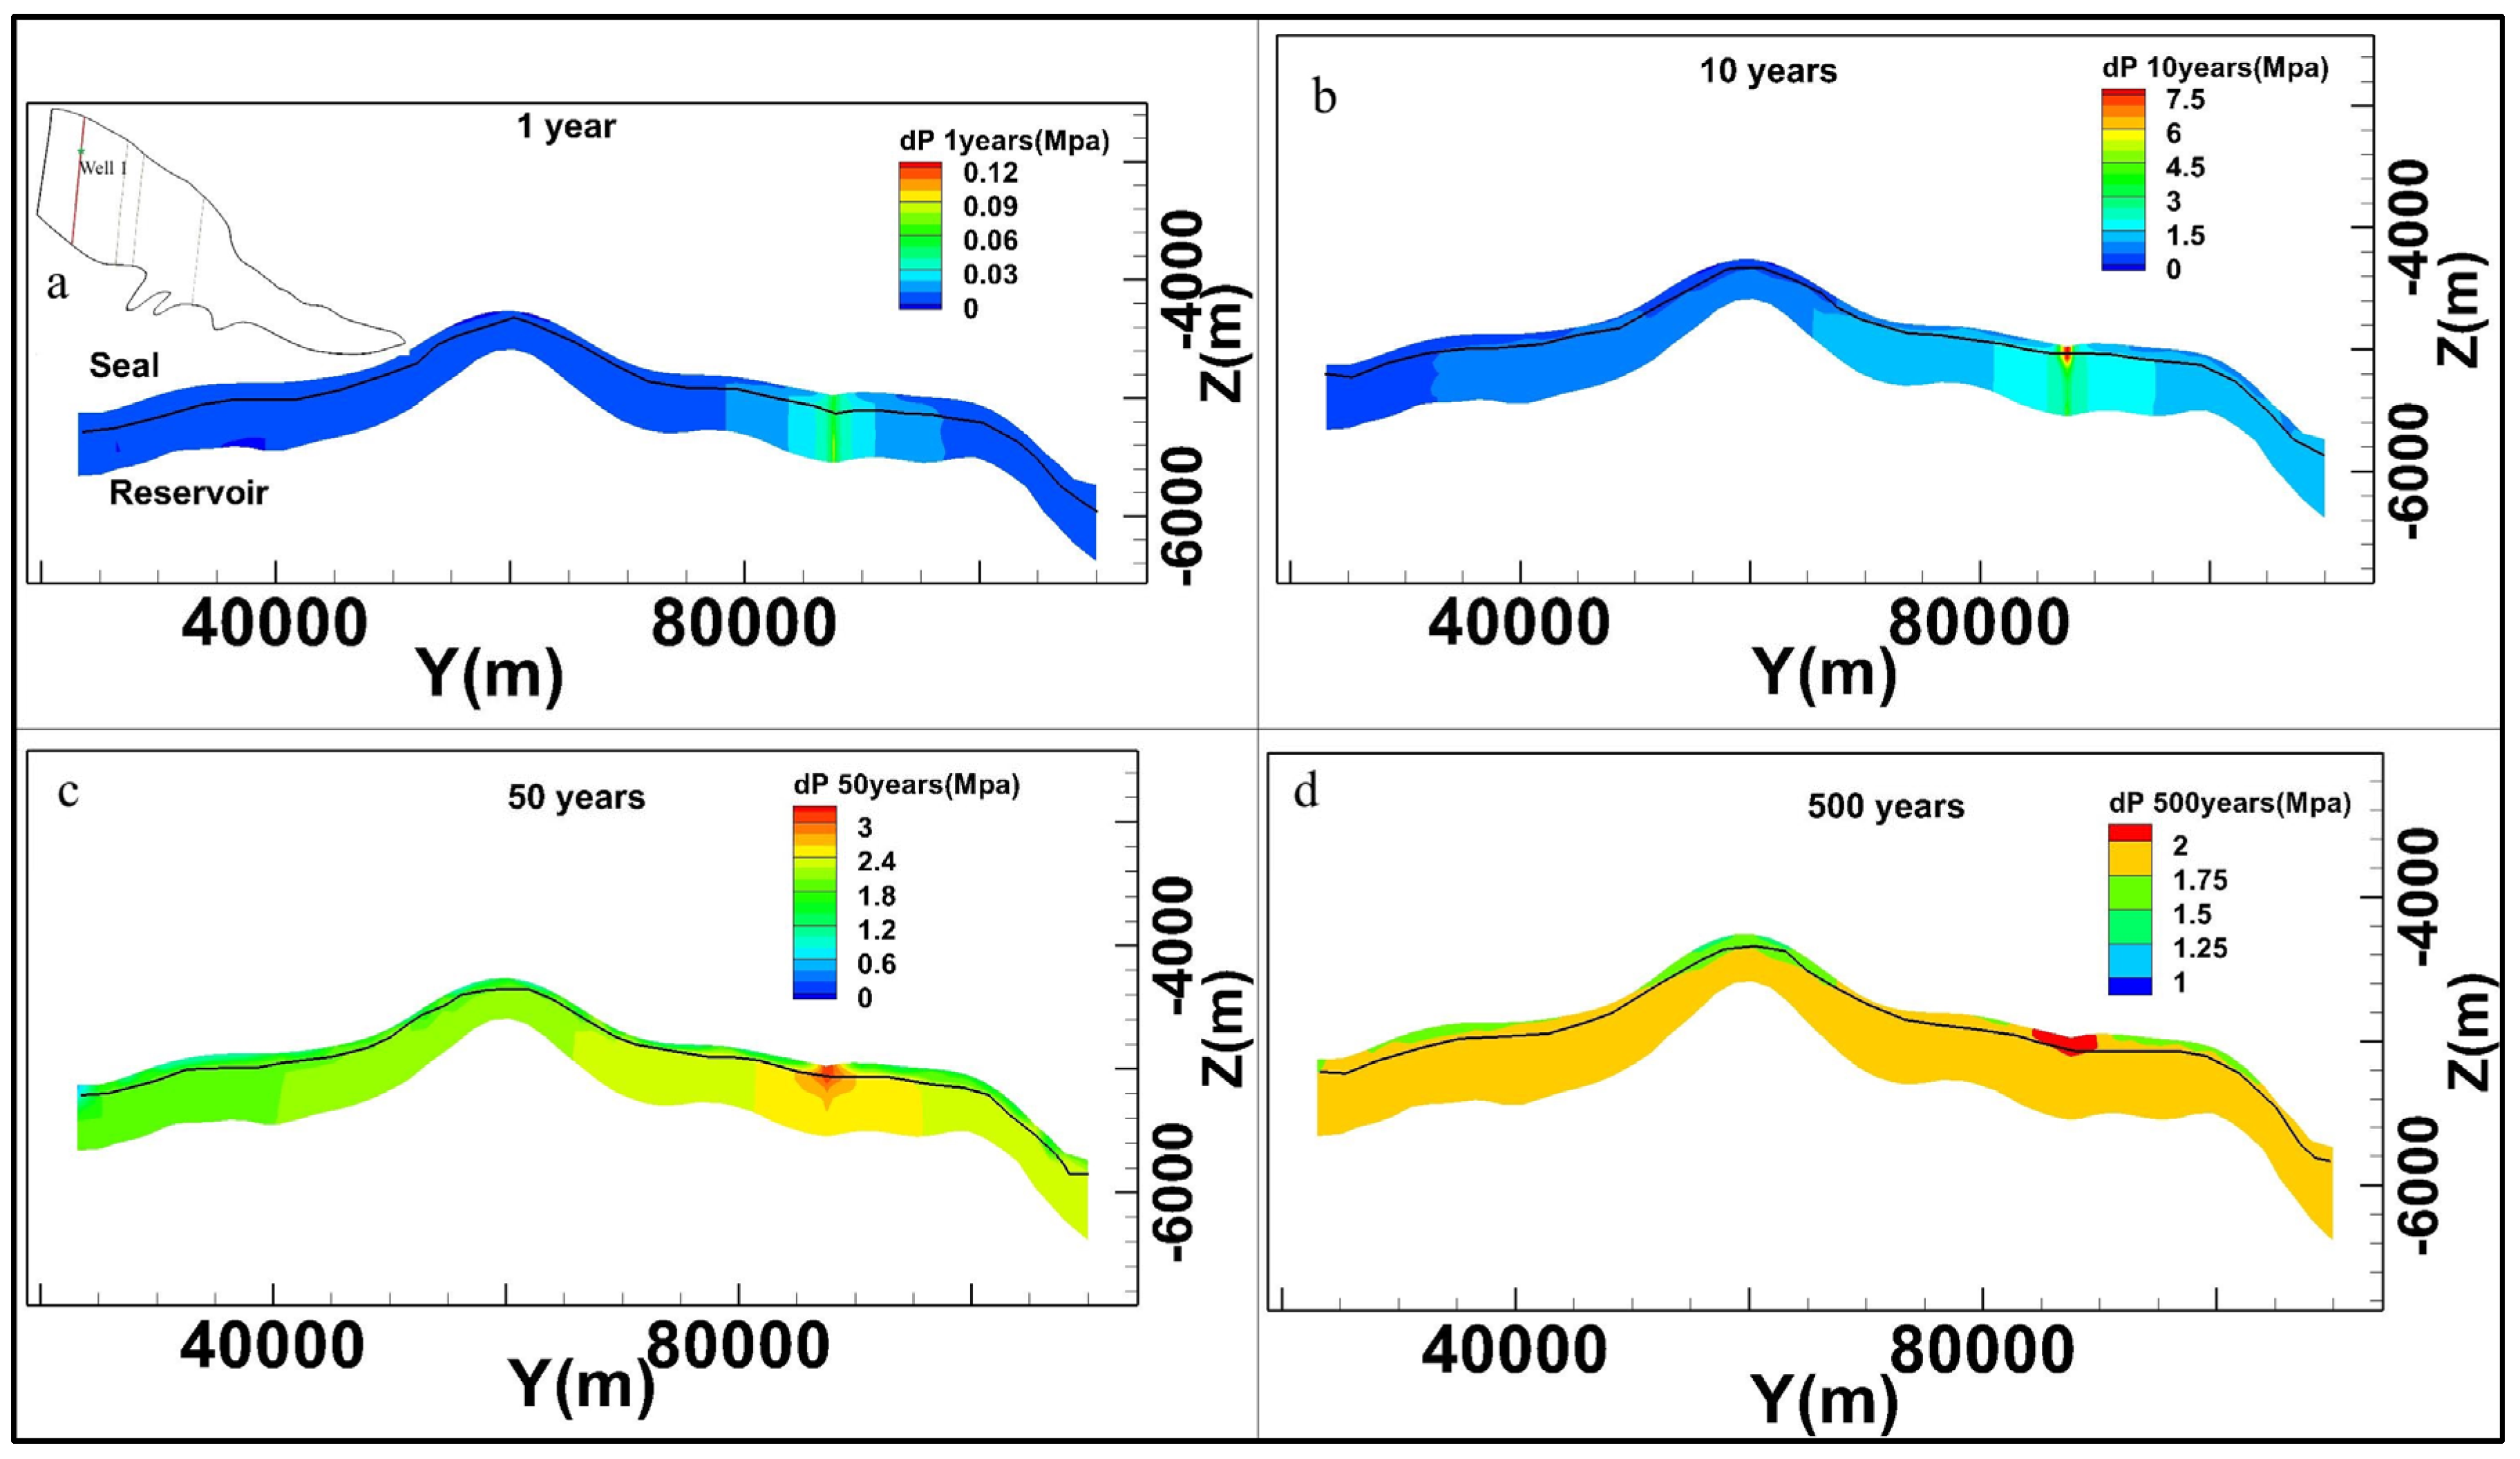
Figure 15 shows the well 1 cross-section pressure lift distribution. It can be seen from the figure that the original formation pressure balance is broken after CO2 injection. The pressure increase in the vertical upper stage was mainly slowly enlarged in an inverted triangular shape, where the pressure peak was at the injection well position at the beginning and moved towards the top of the injection well over time. In year 10 (Figure 15b), as the floating supercritical CO2 accumulated at the bottom of the cap layer, the highest point of pressure rise in the reservoir was concentrated below the cap layer at the top of the injection well. At 50 years (Figure 15c), the highest pressure lift peak reached 3.2 MPa in the case of the well 1 monocline trap injection. At 500 years (Figure 15d), the amount of localized high-pressure lift that began to occur was buffered and distributed to the reservoir, and the total amount decreased with a decrease in the content of gaseous carbon dioxide.

4.4. Effect of Injection of Different Structural Positions and Velocities on Pressure Increase

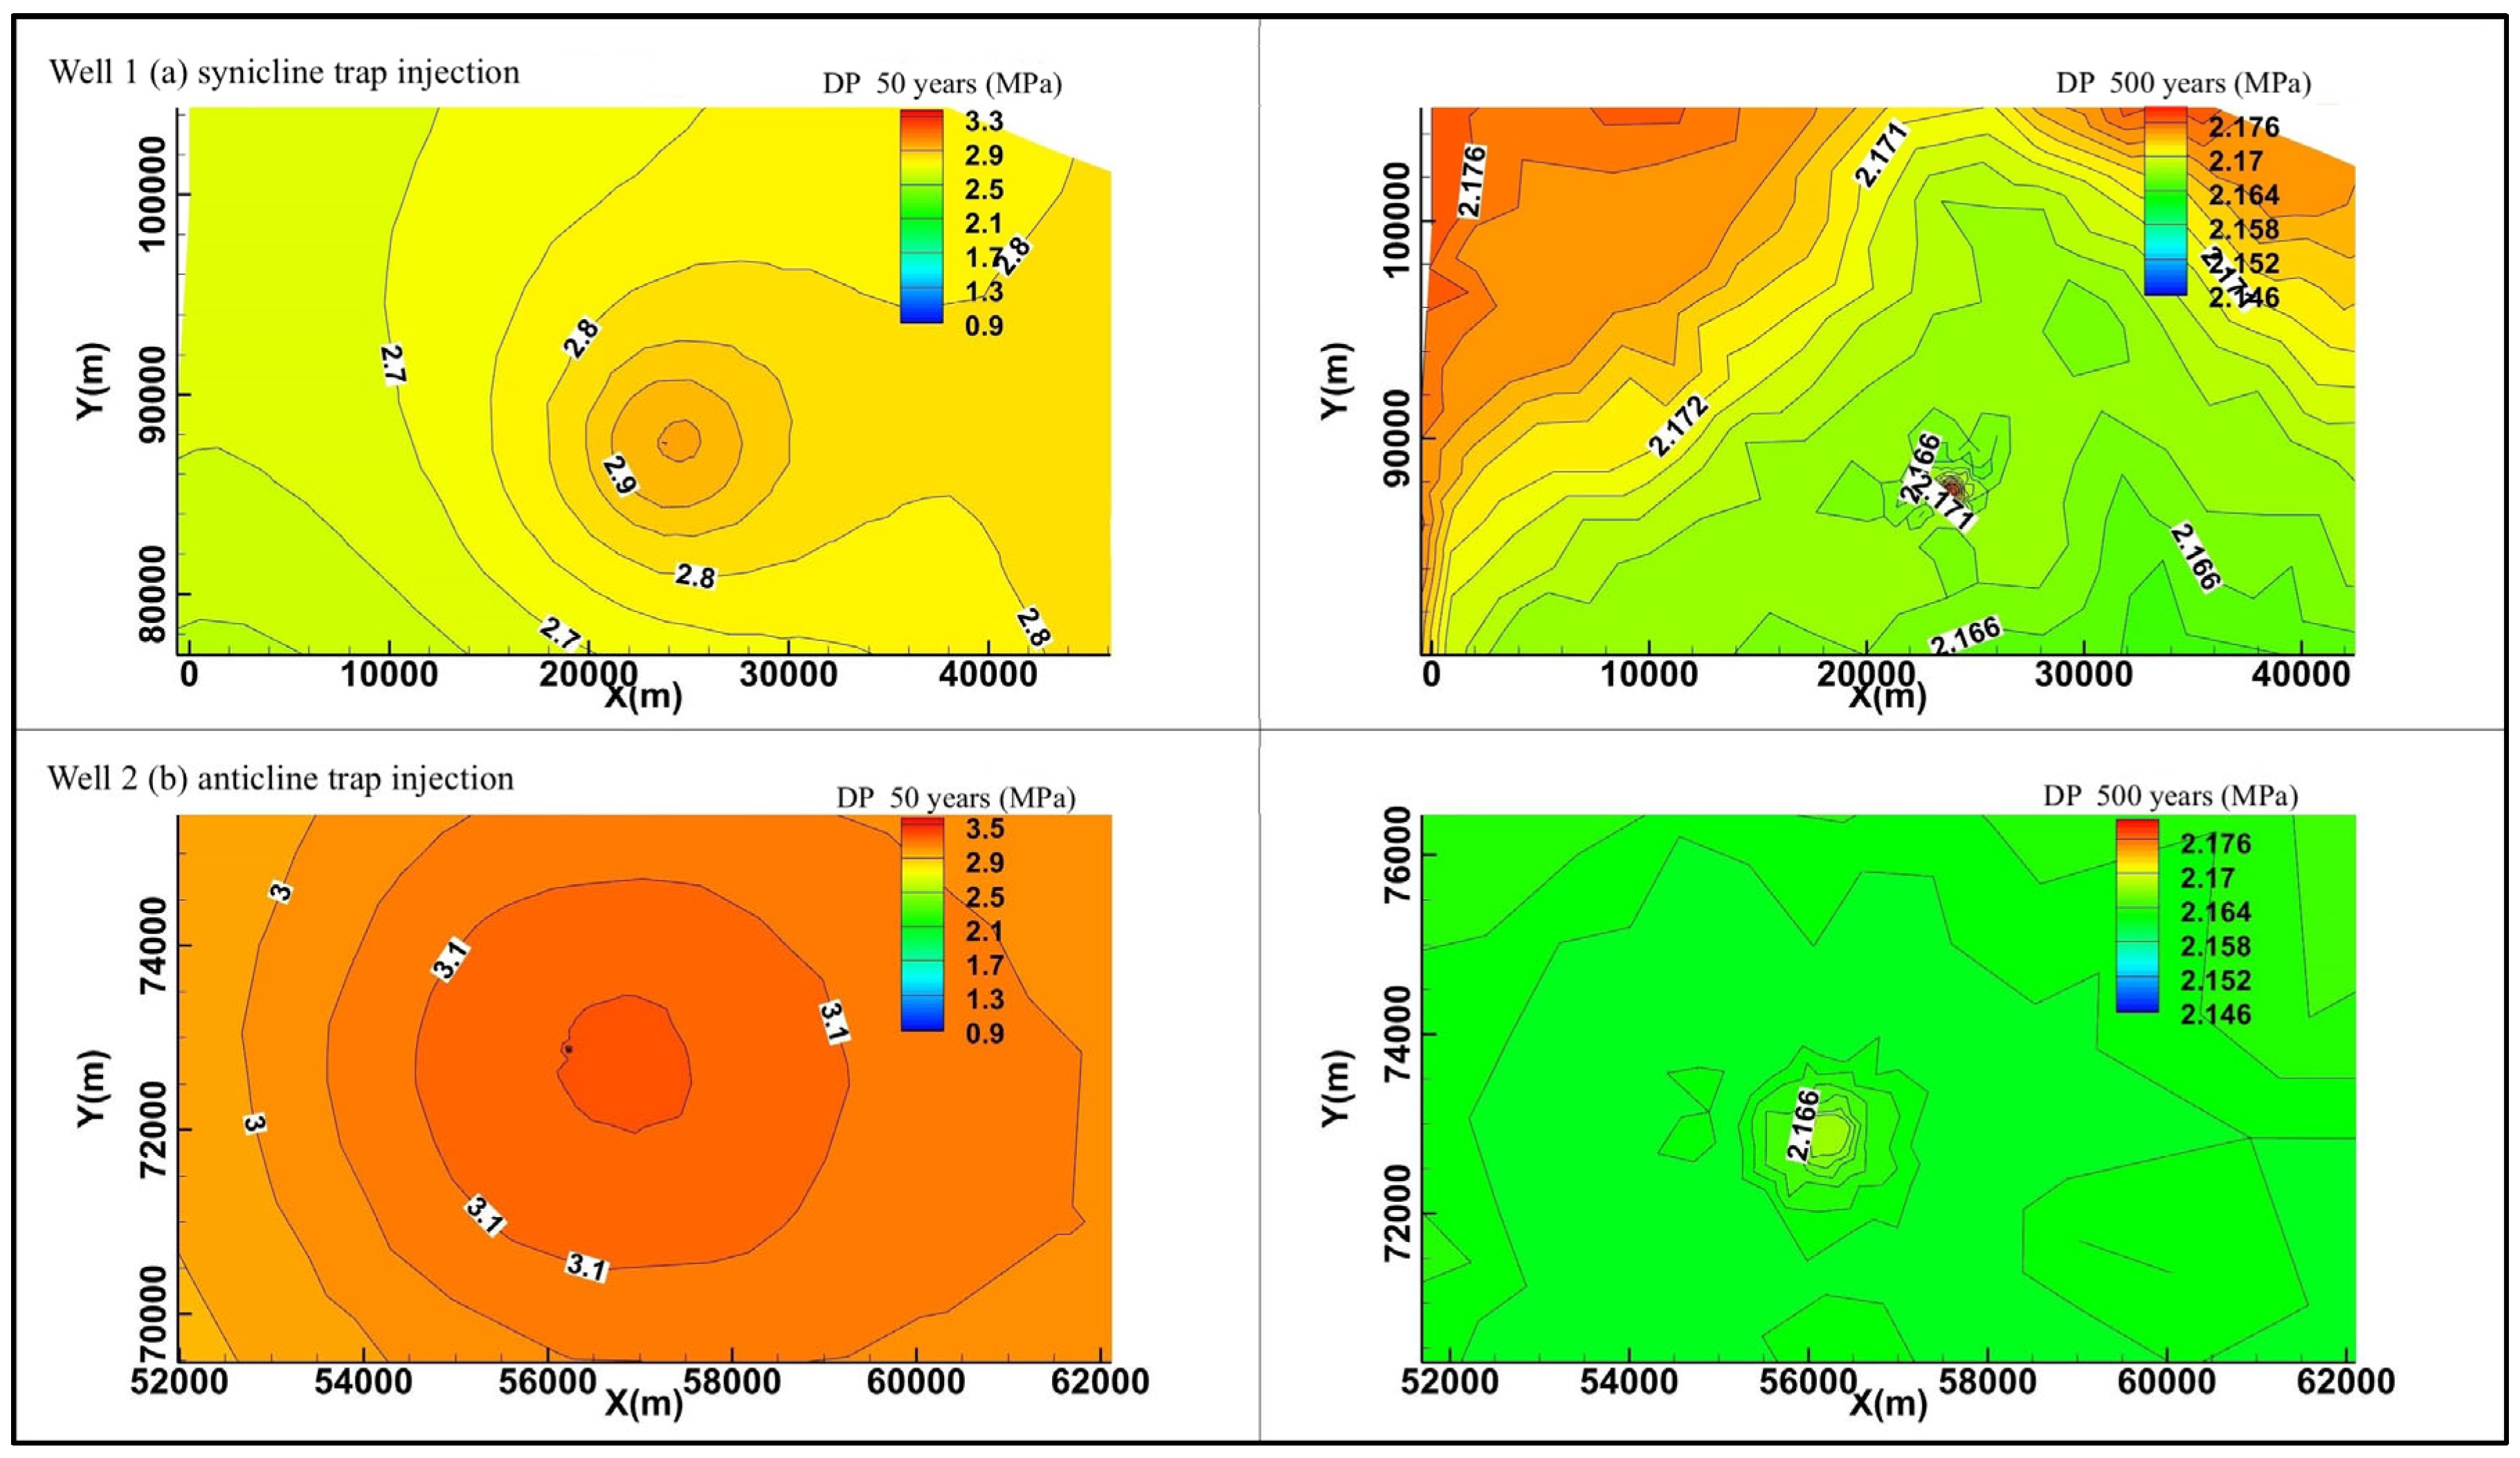
Comparing the effects of the two injection speeds and injection positions on the diffusion of gas–liquid CO2, it is necessary to conduct a comparative analysis at the same scale of the amount of pressure increase caused by different injection methods. Figure 16a,b show the effect of CR injection on the structural trap with the pressure increase, and Figure 17a,b show the impact of VR injection on the pressure increase in different structural traps.
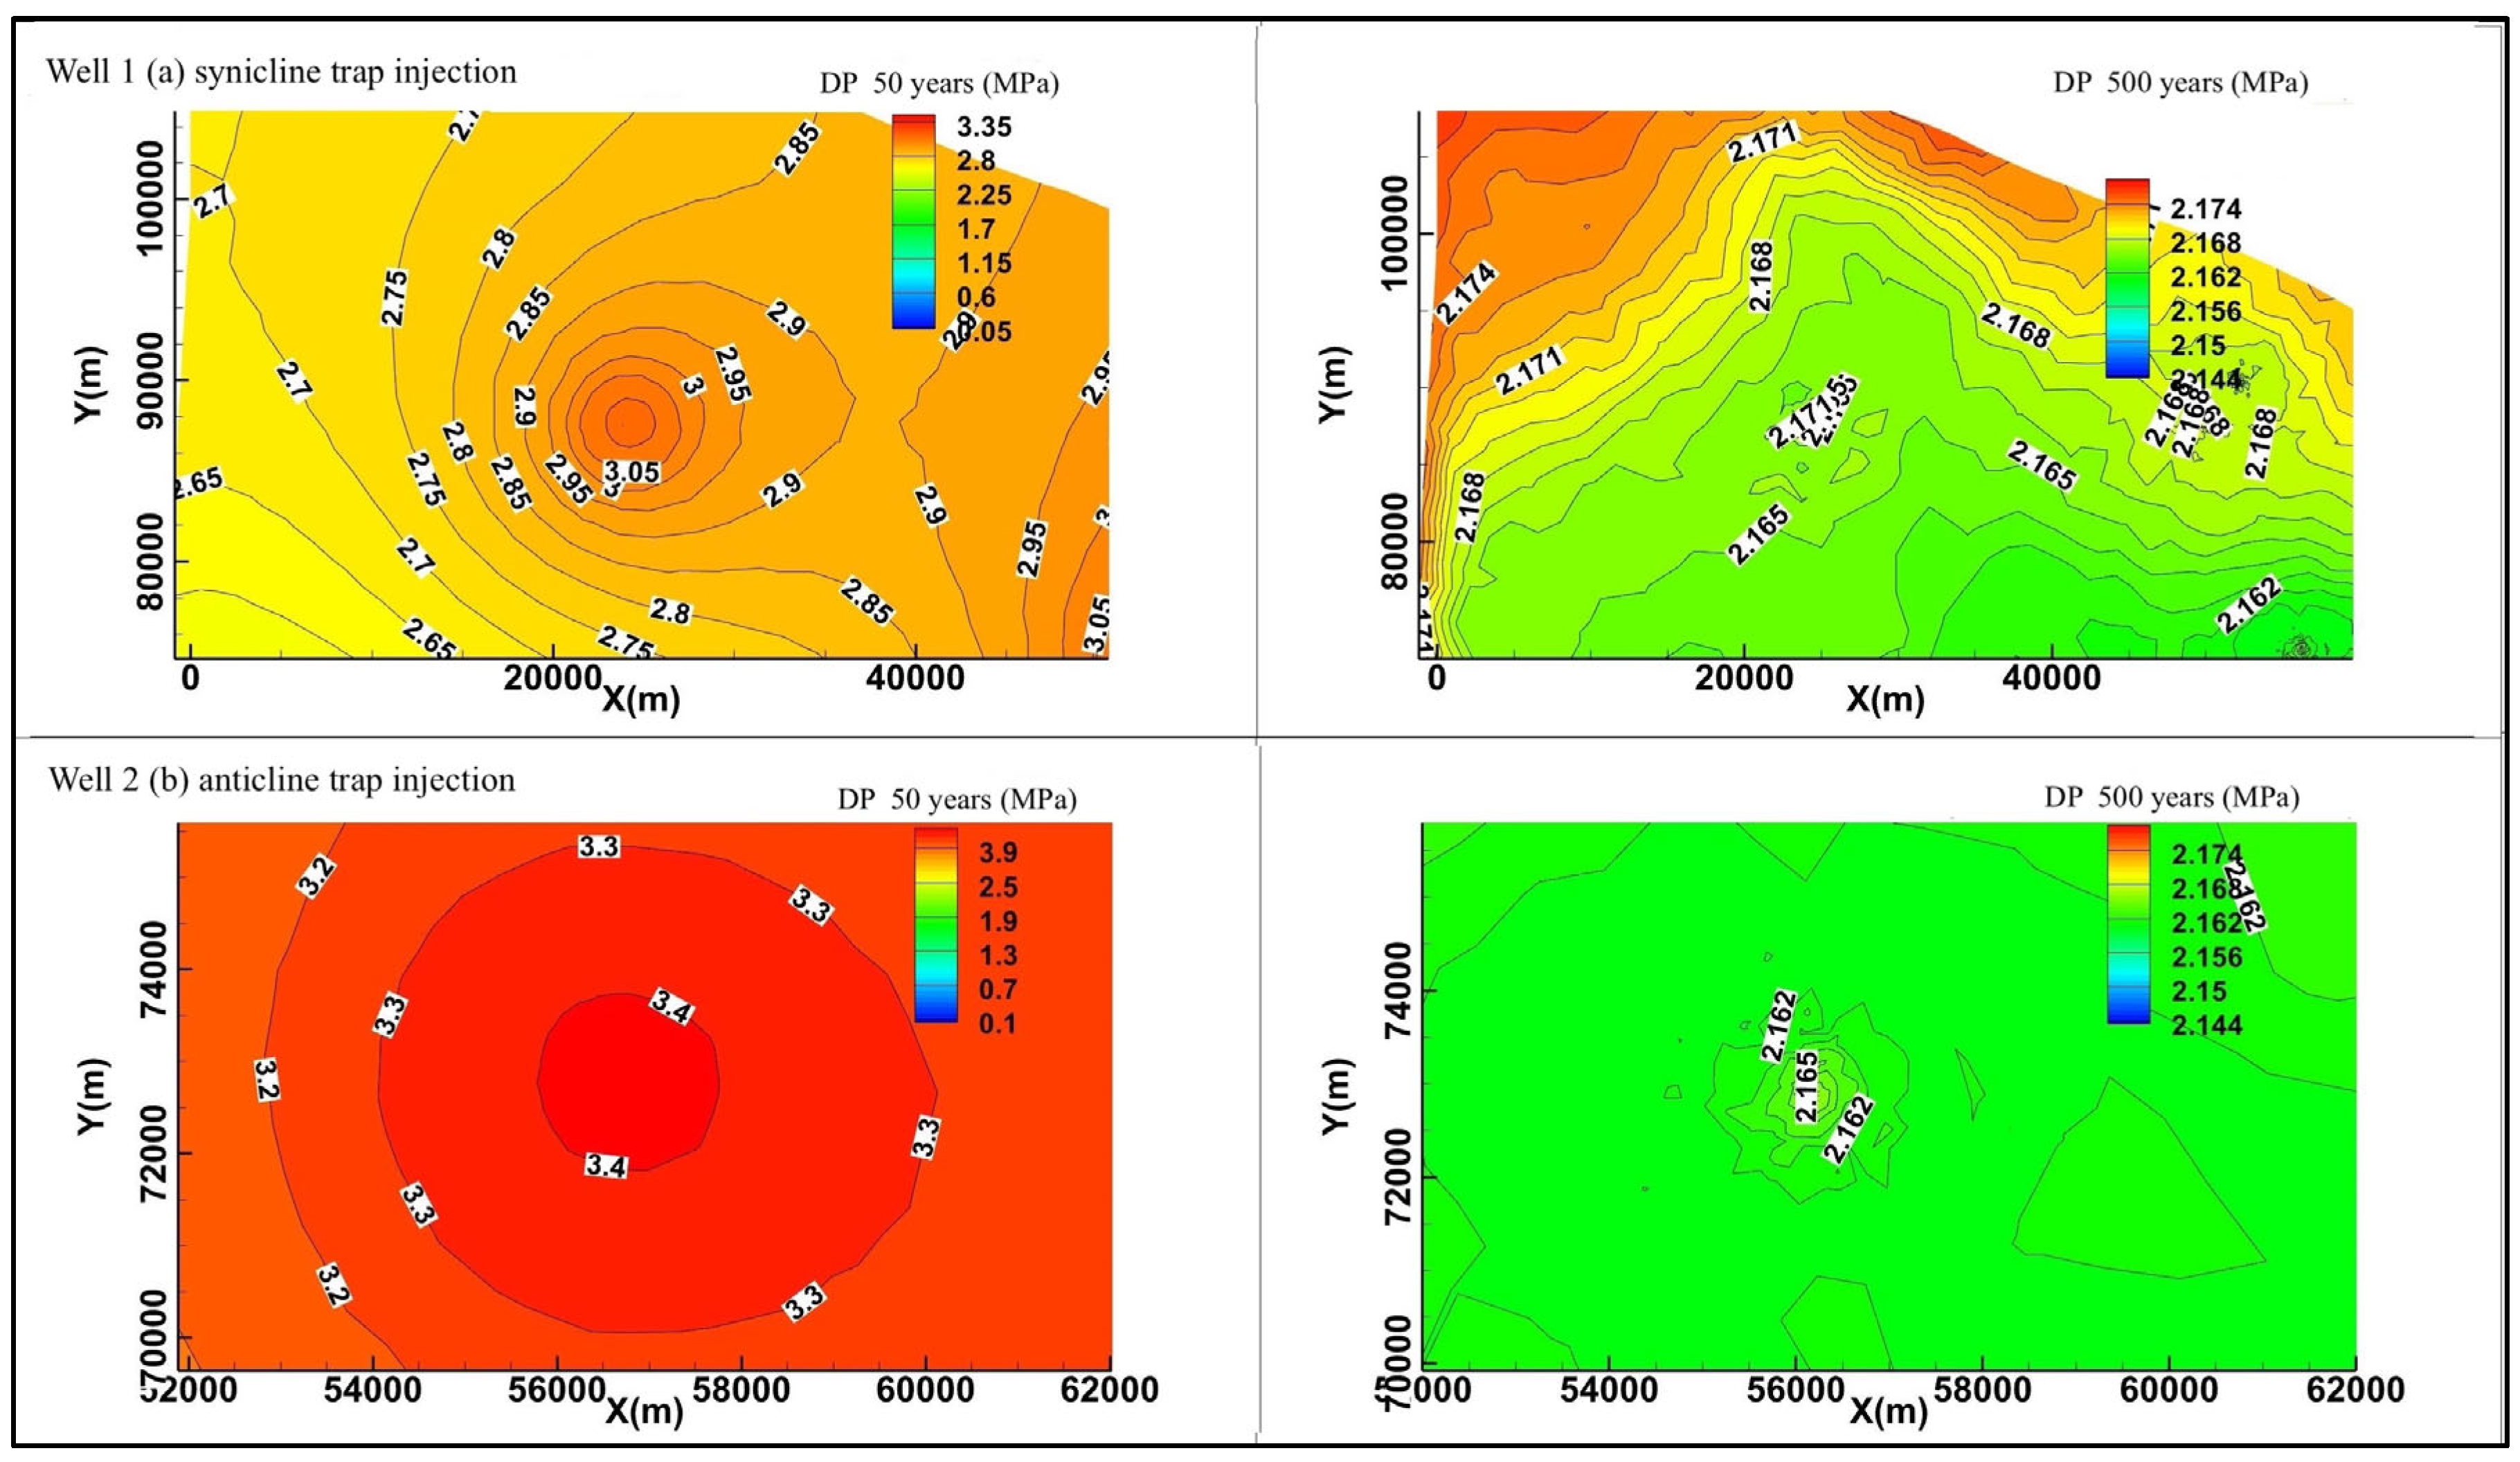
Figure 16a,b show that, under CR speed injection conditions, the pressure lift following well 1 monocline trap injection, which reached 3.30 MPa at 50 years (Figure 16a), is lower than 3.50 MPa at the pressure change in the well 2 anticline trap (Figure 16b). In 500 years, as the pressure dissipates around the well 1 monocline trap, the pressure change is evenly distributed, whereas in well 2, the pressure buildup change is densely concentrated around the injection site.
Figure 17a,b show that, following VR speed injection, it can be seen that the pressure lift following well 1 monocline trap injection reached 3.35 MPa at 50 years (Figure 17a), which is lower than 3.90 MPa following pressure change in the well 2 anticline trap (Figure 17b). In 500 years, the pressure dissipates around the well 1 monocline trap, and the pressure change is evenly distributed, whereas in well 2, the pressure buildup change is densely concentrated around the injection site.
When comparing the different injection cases, it can be observed that when the injection stopped in the 50th year, the maximum pressure buildup change in the CR injection was 0.4 MPa smaller than the VR injection case, which consists of having higher gas saturation under the VR injection case as shown in Figure 11.
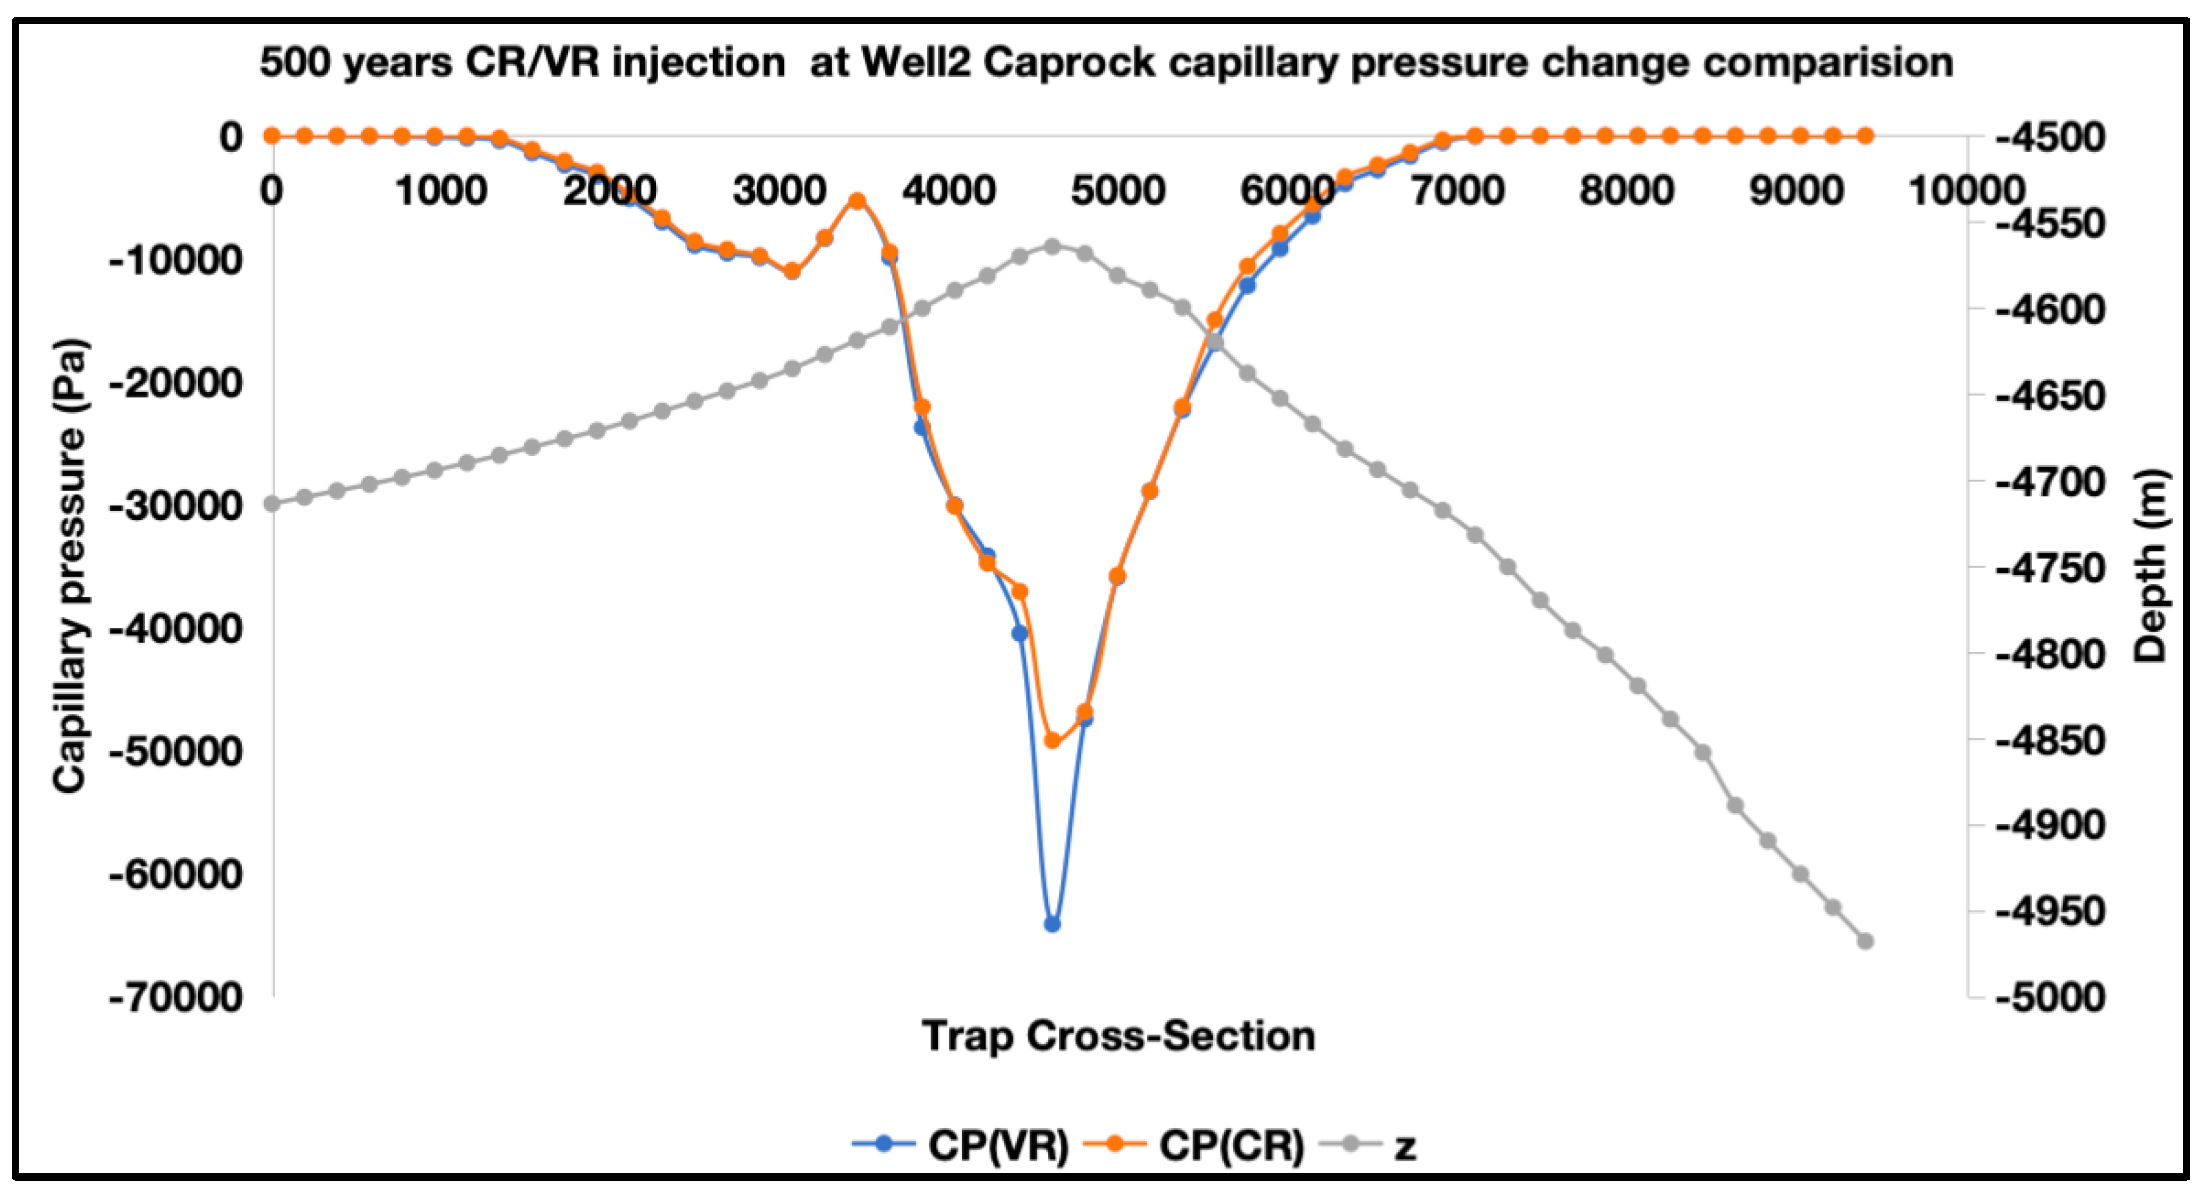
Figure 18 shows the capillary pressure difference at the injection well position for 500 years. It was found that when CR and VR were injected at the well 2 anticline trap, the capillary pressure in the case of VR injection was also lower after 500 years because of lower gas saturation compared to the CV injection. This shows that VR injection improves the stability and integrity of the caprock.
In general, the formation pressure generally remained below the caprock breakthrough pressure in all scenarios. While the CR injection promoted the most rapid CO2 dissolution and pressure relief, it resulted in the least effective long-term immobilization; conversely, the VR injection sacrificed early dissolution efficiency to achieve superior plume containment. This trade-off suggests that injection-strategy selection should be tailored to the dominant site constraint, whether near-term pressure management or long-term containment, and to the trapping behavior governed by caprock morphology.

4.5. Storage Situation of Different Mechanisms of Reservoir CO2 Under Different Injection Methods

Because of the large scale of the simulation model, large number of grids, and short simulation operation calculation time, the mineral storage situation was not considered in this simulation work, focusing on the relationship between the amount of residual gas storage and dissolution storage in the reservoir. To obtain a clear understanding of the total amount of gas–liquid CO2 in the reservoir, a comparative analysis of the gas–liquid CO2 content in the reservoir was conducted. In the case of constant-pressure injection, the change chart of the total amount of CO2 storage in different forms in the formation (Figure 19) can better show the total amount of CO2 storage in the storage cover layer and the storage situation of different forms.
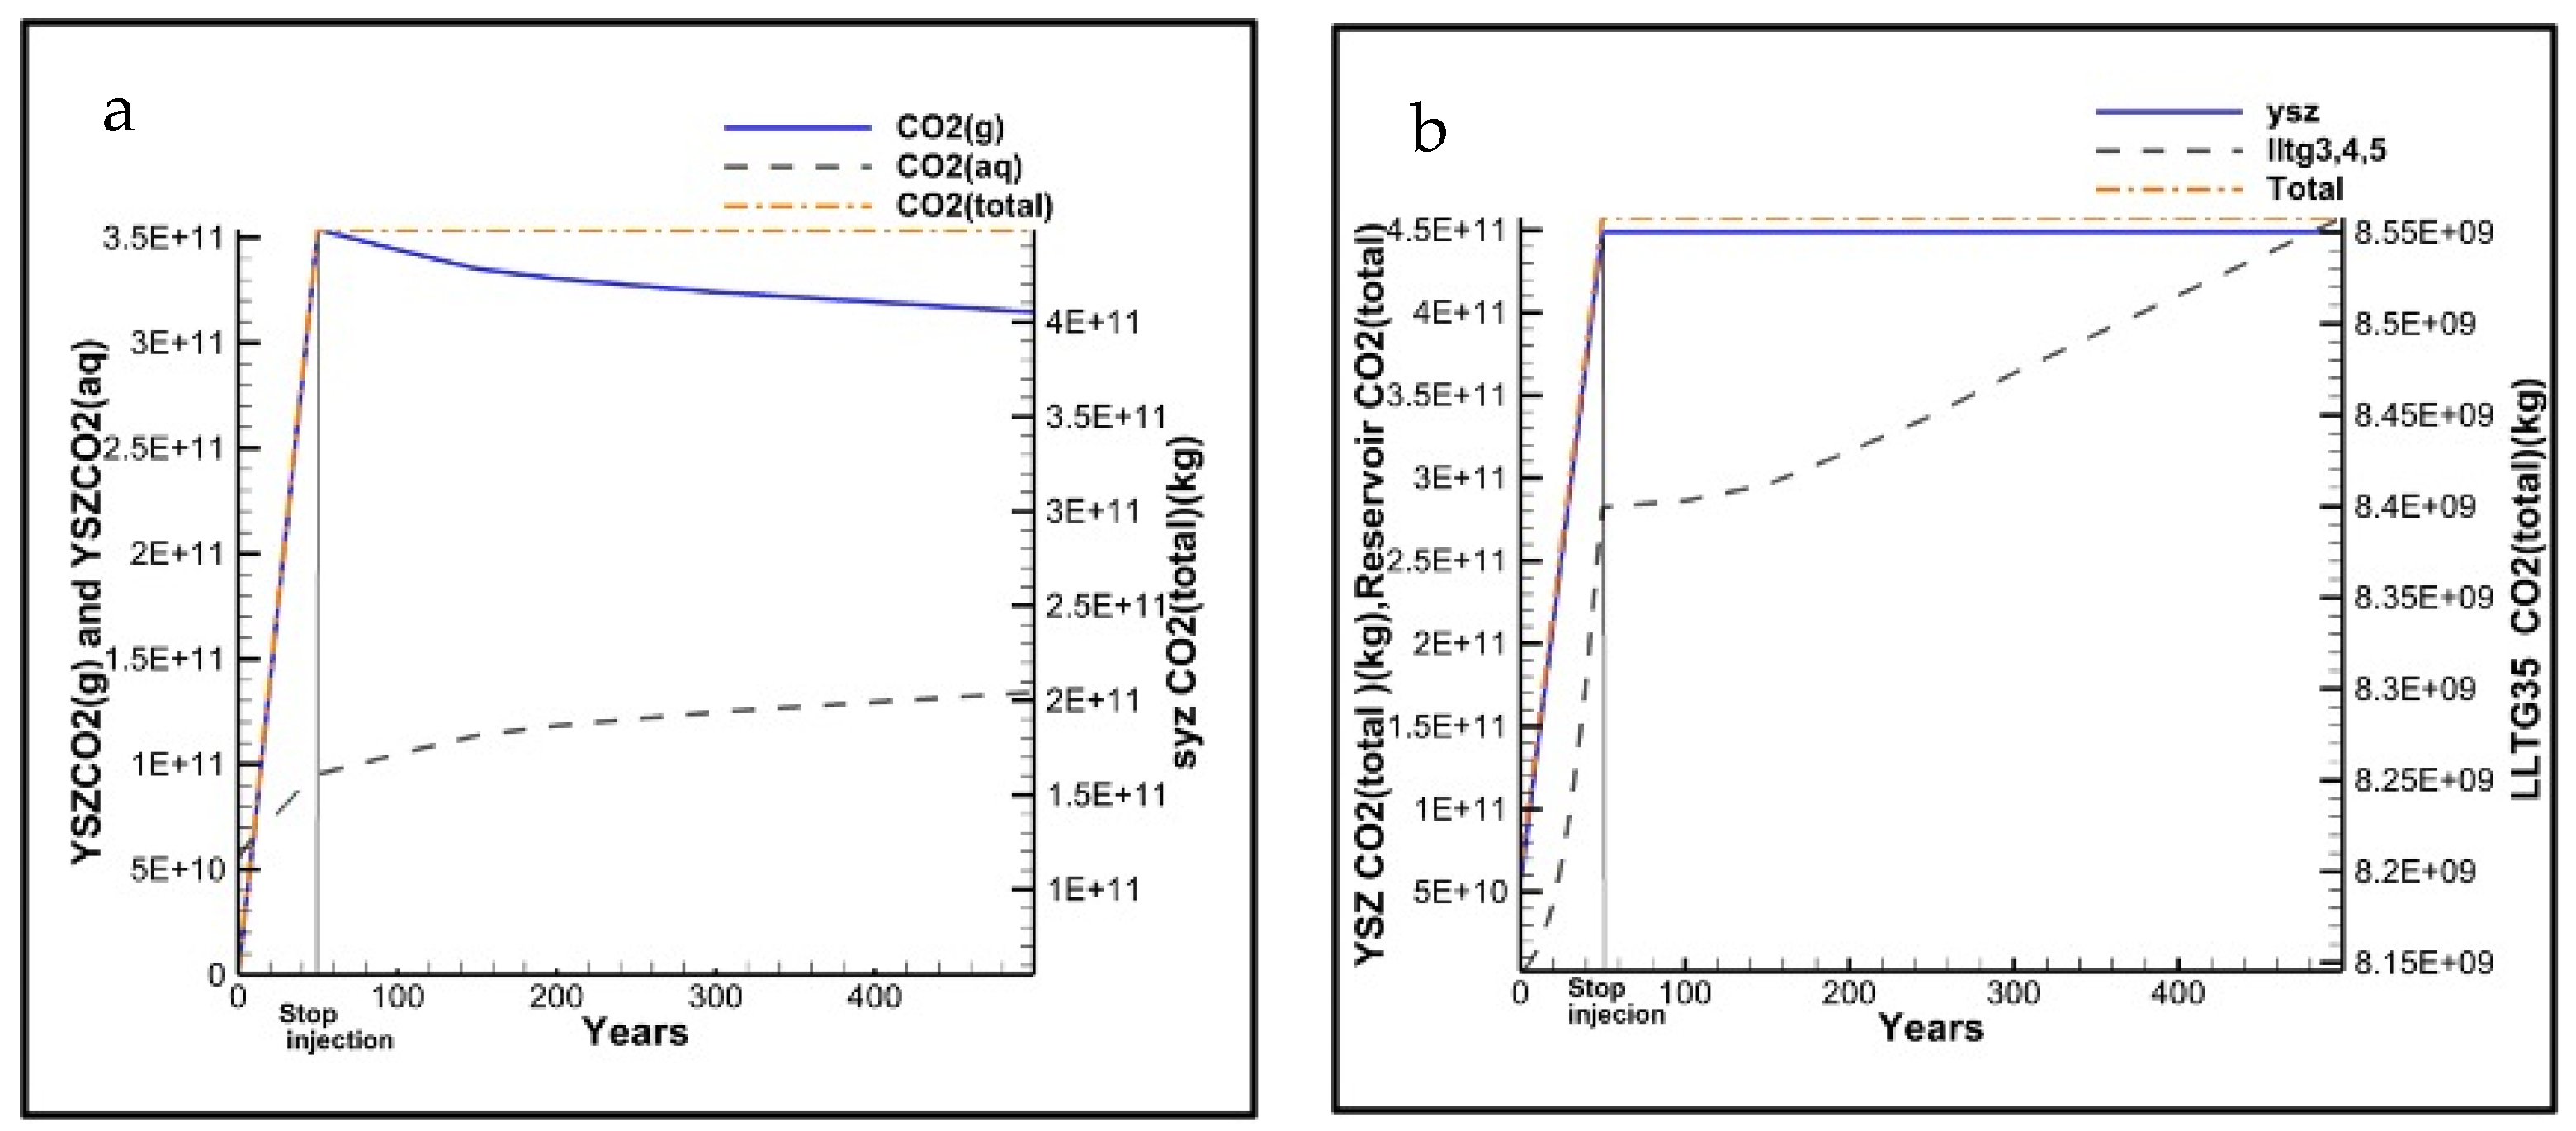
A comparison of the gaseous and dissolved CO2 content and total amount of the YSZ formation reservoir under constant rate injection (Figure 19a) showed that a total of 4.4 × 10⁸ t of CO2 was injected into the reservoir over a period of 50 years. In the 50th year, the gaseous CO2 content reached the highest level, and then, as CO2 dissolved in the formation water, the total amount of gaseous CO2 gradually began to decline, and more gaseous CO2 gradually changed to dissolved CO2 and was sealed.
The results from the gaseous CO2 content diagram of different formations (Figure 19b) show that the gaseous CO2 content in the Lltg 3–5 caprock was 0, indicating that gaseous CO2 was sealed in the YSZ formation reservoir. Until the 500th year, there was no gaseous CO2 in the cap layer, indicating that the storage effect of the Lltg 3–5 caprock layer on gaseous CO2 was significant.
Overall, it can be found that, compared to VR injection, it is easier to achieve a larger amount of dissolved storage under CR injection. Faster dissolution sequestration means faster carbon dioxide dissolution and pressure dissipation, which is the safest long-term method of carbon sequestration.

5. Conclusions

This study simulated large-scale CO2 injection into heterogeneous carbonate reservoirs under complex tectonic conditions, and analyzed the impact of injection strategy and caprock morphology on CO2 migration, formation pressure variation, and formation stability. The derived conclusions are as follows.
Injection strategy controls dissolved-CO2 migration and immobilization. At the end of the 500-year simulation, the dissolved-CO2 migration distance followed the order CR > VR. Under the studied conditions, compared with VR and CR injections, the maximum migration distance of dissolved CO2 at well 2 under VR injection is 111.75 m shorter than CR injection, while VR injection gas saturation is 0.2 higher than CR. In two injection scenarios, VR injection most effectively limited the lateral spread of dissolved CO2 and thereby enhanced dissolved-CO2 immobilization.
Long-term formation pressure is governed mainly by total injected mass and aquifer diffusivity rather than by injection schedule. The CR and VR schedules exerted only a nuanced influence on long-term pressure, and across all cases, formation pressure remained below the caprock breakthrough pressure, indicating that storage integrity was maintained under the operating conditions and reservoir properties considered.
A clear trade-off exists between dissolution efficiency and long-term containment. CR injection promoted the fastest CO2 dissolution and pressure relief but yielded the weakest long-term immobilization owing to its larger plume migration distance, whereas VR injection sacrificed an early dissolution rate in exchange for more effective plume containment. Caprock morphology strongly modulates trapping behavior. Anticline traps (wells 2/4) provided stronger structural confinement of the buoyant CO2 plume than monocline traps (wells 1/3/5), with closure depth and limb dip angle controlling the lateral migration extent and the partitioning among trapping mechanisms.
In general, injection-strategy selection should reflect the dominant site constraint near-term pressure management or long-term containment and the trapping behavior imposed by caprock morphology. CR injection suits projects prioritizing rapid operational-phase pressure relief, while VR injection favors long-term storage security by limiting plume spreading. Overall, this study delivers a mechanistically grounded optimization framework linking injection-speed control and caprock morphology to the coupled evolution of pressure-buildup safety and long-term CO2 immobilization, supporting CCUS decision-making in the Tarim Basin.
This study ignores geochemical reactions and secondary porosity and faults in the medium, which will affect the accuracy of calculations of plume migration distance and pressure change. Future work should incorporate reactive transport and a dual porosity/permeability condition, under which the relative differences among injection strategies may become more pronounced.

Author Contributions

Conceptualization, K.A. and J.C.; methodology, J.C.; software, J.C.; investigation, K.A. and J.C.; resources, J.C. and H.L.; writing—original draft preparation, K.A.; writing—review and editing, J.C. and H.L.; visualization, K.A.; supervision, J.C. and H.L.; project administration, H.L.; funding acquisition, H.L. and K.A. All authors have read and agreed to the published version of the manuscript.

Funding

The authors appreciate the financial support provided by the Xinjiang Uygur Autonomous Region Key R&D Special Project: “Geological Characteristics and Storage Capacity Evaluation of CO2 Saline Aquifers in Xinjiang” (Project No. 2024B01012-1), Xinjiang Tianchi Doctoral Project (CN) (grant No. 5105250180U), and the Postdoctoral Research Program of Electrical Engineering, Xinjiang University (grant No. XJU-DQGCBSHLDZ-2025005).

Data Availability Statement

The data supporting the findings of this study are available from the corresponding authors upon reasonable request.

Acknowledgments

The authors would like to sincerely thank Ning Liu and Rui Rui Zhao for guidance in model creation and calculation with TOUGH2-MP V2.0 software.

Conflicts of Interest

The authors declare no conflicts of interest.

References

  1. Wei, Y.; Kang, J.; Liu, L.; Li, Q.; Wang, P.; Hou, J.; Liang, Q.; Liao, H.; Huang, S.; Yu, B. A proposed global layout of carbon capture and storage in line with a 2 °C climate target. Nat. Clim. Change 2021, 11, 112–118. [Google Scholar] [CrossRef]
  2. Page, B.; Turan, G.; Zapantis, A.; Burrows, J.; Consoli, C.; Erikson, J.; Havercroft, I.; Kearns, D.; Liu, H.; Rassool, D.; et al. The Global Status of CCS 2020: Vital to Achieve Net Zero; Global CCS Institute: Melbourne, Australia, 2020; Available online: https://www.globalccsinstitute.com/wp-content/uploads/2025/08/Global-Status-of-CCS-Report-Jan-28-1-1.pdf (accessed on 31 December 2020).
  3. Liu, G.; Cai, B.; Li, Q.; Zhang, X.; Ouyang, T. China’s pathways of CO2 capture, utilization and storage under carbon neutrality vision 2060. Carbon Manag. 2022, 13, 435–449. [Google Scholar] [CrossRef]
  4. Xu, S.; Dai, S. CCUS as a second-best choice for China’s carbon neutrality: An institutional analysis. Clim. Policy 2021, 21, 927–938. [Google Scholar] [CrossRef]
  5. Adu, E.; Zhang, Y.; Liu, D. Current situation of carbon dioxide capture, storage, and enhanced oil recovery in the oil and gas industry. Can. J. Chem. Eng. 2019, 97, 1048–1076. [Google Scholar] [CrossRef]
  6. Lu, P.; Hao, Y.; Bai, Y.; Liu, W.; Chen, X.; Zheng, H.; Liu, J.; Chen, Y.; Gao, J. Optimal selection of favorable areas for CO2 geological storage in the Majiagou Formation in the Ordos Basin. Int. J. Greenh. Gas Control 2021, 109, 103360. [Google Scholar] [CrossRef]
  7. Lu, P.; Jiao, Z.; Wang, Z.; Nan, Y.; Bai, Y.; Ma, Y. Study on the basic physical conditions of CO2 geologic sequestration reservoir in the Majiagou Formation in the Ordos Basin. Energy Rep. 2022, 8, 482–490. [Google Scholar] [CrossRef]
  8. Zhang, B.; Liang, K.; Wang, W.; Chen, L.; Wang, H. Evaluation of CO2 effective geological storage potential in deep saline aquifers in the Ordos basin. Unconv. Oil Gas 2019, 6, 15–20. [Google Scholar] [CrossRef]
  9. Ahmadinia, M.; Shariatipour, S. A study on the impact of storage boundary and caprock morphology on carbon sequestration in saline aquifers. Greenh. Gases Sci. Technol. 2021, 11, 183–205. [Google Scholar] [CrossRef]
  10. Wang, F.; Jing, J.; Yang, Y.; Liu, H.; Sun, Z.; Xu, T.; Tian, H. Impacts of injection pressure of a dip-angle sloping strata reservoir with low porosity and permeability on CO2 injection amount. Greenh. Gases Sci. Technol. 2017, 7, 92–105. [Google Scholar] [CrossRef]
  11. Jing, J.; Yang, Y.; Tang, Z. Assessing the influence of injection temperature on CO2 storage efficiency and capacity in the sloping formation with fault. Energy 2021, 215, 119097. [Google Scholar] [CrossRef]
  12. Peter, A.; Yang, D.; Eshiet, K.; Sheng, Y. A Review of the Studies on CO2-Brine-Rock Interaction in Geological Storage Process. Geosciences 2022, 12, 168. [Google Scholar] [CrossRef]
  13. Al-Khdheeawi, E.; Mahdi, D.; Ali, M.; Iglauer, S.; Barifcani, A. Reservoir scale porosity-permeability evolution in sandstone due to CO2 geological storage. In Proceedings of the 15th Greenhouse Gas Control Technologies Conference, Abu Dhabi, United Arab Emirates, 15–18 March 2021; pp. 15–18. [Google Scholar] [CrossRef]
  14. Raza, A.; Gholami, R.; Sarmadivaleh, M.; Tarom, N.; Rezaee, R.; Bing, C.; Nagarajan, R.; Hamid, M.; Elochukwu, H. Integrity analysis of CO2 storage sites concerning geochemical-geomechanical interactions in saline aquifers. J. Nat. Gas Sci. Eng. 2016, 36, 224–240. [Google Scholar] [CrossRef]
  15. Gao, X.; Yang, S.; Shen, B.; Wang, J.; Tian, L.; Li, S. Effects of CO2 variable thermophysical properties and phase behavior on CO2 geological storage: A numerical case study. Int. J. Heat Mass Transf. 2024, 221, 125073. [Google Scholar] [CrossRef]
  16. Zhao, R.; Cheng, J. Non-isothermal modeling of CO2 injection into saline aquifers at a low temperature. Environ. Earth Sci. 2015, 73, 5307–5316. [Google Scholar] [CrossRef]
  17. Jung, H.; Espinoza, D.; Hosseini, S. Wellbore injectivity response to step-rate CO2 injection: Coupled thermo-poro-elastic analysis in a vertically heterogeneous formation. Int. J. Greenh. Gas Control 2020, 102, 103156. [Google Scholar] [CrossRef]
  18. Al-Khdheeawi, E.; Vialle, S.; Barifcani, A.; Sarmadivaleh, M.; Iglauer, S. Influence of injection well configuration and rock wettability on CO2 plume behaviour and CO2 trapping capacity in heterogeneous reservoirs. J. Nat. Gas Sci. Eng. 2017, 43, 190–206. [Google Scholar] [CrossRef]
  19. Al-Khdheeawi, E.; Vialle, S.; Barifcani, A.; Sarmadivaleh, M.; Iglauer, S. Effect of wettability heterogeneity and reservoir temperature on CO2 storage efficiency in deep saline aquifers. Int. J. Greenh. Gas Control 2018, 68, 216–229. [Google Scholar] [CrossRef]
  20. Umar, B.; Gholami, R.; Raza, A.; Downey, W.; Sarmadivaleh, M.; Shah, A.; Nayak, P. study on the surface wettability of clastic rocks with potential application for CO2 storage sites. Nat. Resour. Res. 2020, 29, 2051–2061. [Google Scholar] [CrossRef]
  21. Li, Q.; Li, Q.; Wang, F.; Xu, N.; Wang, Y.; Bai, B. Settling behavior and mechanism analysis of kaolinite as a fracture proppant of hydrocarbon reservoirs in CO2 fracturing fluid. Colloids Surf. A Physicochem. Eng. Asp. 2025, 724, 137463. [Google Scholar] [CrossRef]
  22. Li, Q.; You, D.; Li, Q.; Wang, F.; Wang, Y.; Yang, Y. Analysis of Sedimentation Behavior and Influencing Factors of Solid Particles in CO2 Fracturing Fluid. Processes 2025, 13, 4049. [Google Scholar] [CrossRef]
  23. Tahir, M.U.; Guo, S. Preliminary Investigation of Fracture Behavior during Carbon Dioxide Fracturing of Natural Hydrogen Reservoir with Hard-Core Imperfections. Reserv. Sci. 2026, 2, 34–51. [Google Scholar] [CrossRef]
  24. Xu, L.; Li, Q.; Tan, Y.; Li, X. Characterization of carbon dioxide leakage process along faults in the laboratory. J. Rock Mech. Geotech. Eng. 2022, 14, 674–688. [Google Scholar] [CrossRef]
  25. Xu, L.; Li, Q.; Tan, Y.; Li, X.; Chen, B. Phase change-induced internal-external strain of faults during supercritical CO2 leakage. Gondwana Res. 2023, 122, 215–231. [Google Scholar] [CrossRef]
  26. Xiao, T.; Chen, T.; Ma, Z.; Tian, H.; Meguerdijian, S.; Chen, B.; Pawar, R.; Huang, L.; Xu, T.; Cather, M.; et al. A review of risk and uncertainty assessment for geologic carbon storage. Renew. Sustain. Energy Rev. 2024, 189, 113945. [Google Scholar] [CrossRef]
  27. White, S.; Carroll, S.; Chu, S.; Bacon, D.; Pawar, R.; Cumming, L.; Hawkins, J.; Kelley, M.; Demirkanli, I.; Middleton, R.; et al. A risk-based approach to evaluating the Area of Review and leakage risks at CO2 storage sites. Int. J. Greenh. Gas Control 2020, 93, 102884. [Google Scholar] [CrossRef]
  28. Wang, Z.; Li, H.; Liu, S.; Xu, J.; Liu, J.; Wang, X. Risk evaluation of CO2 leakage through fracture zone in geological storage reservoir. Fuel 2023, 342, 127896. [Google Scholar] [CrossRef]
  29. Jahanbakhsh, A.; Liu, Q.; Hadi Mosleh, M.; Agrawal, H.; Farooqui, N.; Buckman, J.; Recasens, M.; Maroto-Valer, M.; Korre, A.; Durucan, S. An Investigation into CO2-Brine-Cement-Reservoir Rock Interactions for Wellbore Integrity in CO2 Geological Storage. Energies 2021, 14, 5033. [Google Scholar] [CrossRef]
  30. Pan, P.; Wu, Z.; Feng, X.; Yan, F. Geomechanical modeling of CO2 geological storage: A review. J. Rock Mech. Geotech. Eng. 2016, 8, 936–947. [Google Scholar] [CrossRef]
  31. Jung, H.; Singh, G.; Espinoza, D.; Wheeler, M. Quantification of a maximum injection volume of CO2 to avert geomechanical perturbations using a compositional fluid flow reservoir simulator. Adv. Water Resour. 2018, 112, 160–169. [Google Scholar] [CrossRef]
  32. Bai, B.; Li, X.; Wu, H.; Wang, Y.; Liu, M. A methodology for designing maximum allowable wellhead pressure for CO2 injection: Application to the Shenhua CCS demonstration project, China. Greenh. Gases Sci. Technol. 2017, 7, 158–181. [Google Scholar] [CrossRef]
  33. Abdelaal, M.; Zeidouni, M.; Duncan, I. Effects of injection well operation conditions on CO2 storage capacity in deep saline aquifers. Greenh. Gases Sci. Technol. 2021, 11, 734–749. [Google Scholar] [CrossRef]
  34. Sokama-Neuyam, Y.; Aggrey, W.; Boakye, P.; Sarkodie, K.; Oduro-Kwarteng, S.; Ursin, J. The effect of temperature on CO2 injectivity in sandstone reservoirs. Sci. Afr. 2022, 15, e01066. [Google Scholar] [CrossRef]
  35. Hu, T.; Xu, T.-F.; Tian, H.-L.; Zhou, B.; Yang, Y.-Z. A study of CO 2 injection well selection in the naturally fractured undulating formation in the Jurong Oilfield, China. Int. J. Greenh. Gas Control 2021, 109, 103377. [Google Scholar] [CrossRef]
  36. Yamamoto, H.; Zhang, K.; Karasaki, K.; Marui, A.; Uehara, H.; Nishikawa, N. Numerical investigation concerning the impact of CO2 geologic storage on regional groundwater flow. Int. J. Greenh. Gas Control 2009, 3, 586–599. [Google Scholar] [CrossRef]
  37. Wang, S.; Wang, Y.; Zheng, Y.; Chang, X.; Li, J.; Zeng, R. Comparison of geological models for the simulation of CO2 migration: A case study in Ordos, China. Greenh. Gases Sci. Technol. 2021, 11, 277–296. [Google Scholar] [CrossRef]
  38. Li, D.; Saraji, S.; Jiao, Z.; Zhang, Y. CO2 injection strategies for enhanced oil recovery and geological sequestration in a tight reservoir: An experimental study. Fuel 2021, 284, 119013. [Google Scholar] [CrossRef]
  39. Liu, C.; Sang, S.; Fan, X.; Zhang, K.; Song, F.; Cui, X.; Wang, H. Influences of pressures and temperatures on pore structures of different rank coals during CO2 geological storage process. Fuel 2020, 259, 116273. [Google Scholar] [CrossRef]
  40. Pruess, K.; Oldenburg, C.M.; Moridis, G.J. TOUGH2 User’s Guide Version 2. Office of Scientific & Technical Information Technical Reports. 1999. Available online: https://escholarship.org/content/qt4df6700h/qt4df6700h.pdf (accessed on 26 May 2026).
  41. Zhang, W.; Li, Y.; Xu, T.; Cheng, H.; Zheng, Y.; Xiong, P. Long-term variations of CO2 trapped in different mechanisms in deep saline formations: A case study of the Songliao Basin, China. Int. J. Greenh. Gas Control 2009, 3, 161–180. [Google Scholar] [CrossRef]
  42. He, S.; Middleton, M.; Tang, Z.H. Characteristics and origin of underpressure system in the Shiwu Fault Depression, south-east Songliao Basin, China. Basin Res. 2000, 12, 147–158. [Google Scholar] [CrossRef]
  43. Zheng, L.; Apps, J.A.; Zhang, Y.; Xu, T.; Birkholzer, J.T. On mobilization of lead and arsenic in groundwater in response to CO2 leakage from deep geological storage. Chem. Geol. 2009, 268, 281–297. [Google Scholar] [CrossRef]
  44. Qi, R.; LaForce, T.C.; Blunt, M.J. Design of carbon dioxide storage in aquifers. Int. J. Greenh. Gas Control 2009, 3, 195–205. [Google Scholar] [CrossRef]
  45. Taku Ide, S.; Jessen, K.; Orr, F.M. Storage of CO2 in saline aquifers: Effects of gravity, viscous, and capillary forces on amount and timing of trapping. Int. J. Greenh. Gas Control 2007, 1, 481–491. [Google Scholar] [CrossRef]
  46. Qian, Y.X.; He, Z.L.; Chen, Q.L.; Li, H.L.; Lu, Q.H.; Cai, X.Y.; You, D.H. Sealing capacity of the Ordovician carbonate rocks in Tazhong area, the Tarim Basin. OIL GAS Geol. 2012, 33, 1–9+18. (In Chinese) [Google Scholar]
Figure 1. Boundary of the study area.
Geosciences 16 00270 g001
Figure 2. Numerical model three−dimensional display ((a) plane display; (b) injection well display; (c) three−dimensional fence grid display; (d) topography display).
Geosciences 16 00270 g002
Figure 3. Initial temperature spatial distribution.
Geosciences 16 00270 g003
Figure 4. Initial static pressure spatial distribution.
Geosciences 16 00270 g004
Figure 5. Cross−sectional profiles of injection wells in distinct structural traps from the geological model.
Geosciences 16 00270 g005
Figure 6. Distribution plan of stratigraphic gas and liquid CO2 in the 50th (a,c) and 500th (b,d) years under constant rate injection.
Geosciences 16 00270 g006
Figure 7. Cross−sectional view of formation gas and liquid CO2 distribution of well 1 (a,b), well 2 (c,d), well 5 (e,f) at 500 years under constant rate injection.
Geosciences 16 00270 g007
Figure 8. Comparison of the influence of the inclination of different cap layers on the distribution of gaseous CO2 at a constant rate of injection for 500 years.
Geosciences 16 00270 g008
Figure 9. Comparison of the effect of the gaseous CO2 distribution of monocline and anticline traps at a constant rate injection for 500 years.
Geosciences 16 00270 g009
Figure 10. Comparison of liquid CO2 distribution in the case of well 2 CR injection (a) and VR injection (b).
Geosciences 16 00270 g010
Figure 11. Comparison of gaseous CO2 diffusion distribution in the case of well 2 CR injection (a) and VR injection (b).
Geosciences 16 00270 g011
Figure 12. Well 1 gas–liquid CO2 distribution and seal topography change at 500 years.
Geosciences 16 00270 g012
Figure 13. Well 2 gas–liquid CO2 distribution and caprock morphology at 500 years.
Geosciences 16 00270 g013
Figure 14. Pressure increases after 1 (a), 10 (b), 50 (c), and 500 (d) years at a constant rate injection.
Geosciences 16 00270 g014
Figure 15. Well 1 injection at 1 (a), 10 (b), 50 (c), and 500 (d) years of pressure lift.
Geosciences 16 00270 g015
Figure 16. Change in pressure buildup at monocline trap well 1 (a) and anticline trap well 2 (b) with CR injection.
Geosciences 16 00270 g016
Figure 17. Change in pressure buildup at monocline trap well 1 (a) and anticline trap well 2 (b) with VR injection.
Geosciences 16 00270 g017
Figure 18. Comparison of capillary pressure under well 2 variable speed and constant speed injection at 500 years.
Geosciences 16 00270 g018
Figure 19. Changes in dissolved and residual gas storage content in the formation under constant rate injection ((a) YSZ storage amount as residual gas yszCO2 (g), dissolved CO2 (aq), and total CO2 (total) and (b) stratigraphic CO2 (total) sequestration).
Geosciences 16 00270 g019
Table 1. Petro-physical parameters.
LayerPorosityKh (10−3 μm2)Kh/Kvα−1 (MPa)β (10−10 Pa−1)SrwSrgm
Caprock0.0010.001100.0064.50.300.050.457
reservoir**105.45 × 10−44.50.20.050.6
Note: Kh is the horizontal permeability; Kh/Kv is the ratio of the horizontal and vertical permeability; α-1 is the characteristic capillary pressure in the van Genuchten function; β is the pore compression rate; Srw is the residual water saturation; Srg is the residual gas saturation; and m is the index of the relative permeability function. * The reservoir porosity and permeability are given from the literature [42,43].
Table 2. Injection speed design.
Injection MethodInjection WellInjection StrategyInjection TimeInject Amount
CR injectionWell 1 Well 2 Well 3 Well 4 Well 550 kg/s50 yearsSingle well: 78.84 Mt
(Total: 394.2 Mt)
VR injection5 kg/s for 5 years, 25 kg/s for 5 years, 40 kg/s for 15 years, 70 kg/s for 25 years
Table 3. Caprock morphology design.
Trap TypeClosure DepthCaprock Dip Angle
Anticline trapWell 4 > Well 2
Monocline trapWell 5 > Well 3 > Well 1
Disclaimer/Publisher’s Note: The statements, opinions and data contained in all publications are solely those of the individual author(s) and contributor(s) and not of MDPI and/or the editor(s). MDPI and/or the editor(s) disclaim responsibility for any injury to people or property resulting from any ideas, methods, instructions or products referred to in the content.