


Abstract
The results of a multiscale study of fault and fracture geometry, distribution, density, and intensity are reported for Mesozoic platform carbonates cropping out along the axial zones of the southern Apennines fold-and-thrust belt, Italy. By integrating field structural observations with digital outcrop analysis, the study focuses on Cretaceous limestone rocks exposed along natural creeks and artificial trails of the Castelsaraceno area, Raparo Mt., southern Italy. There, the limestone beds are bounded by mm- to cm-thick marly–clayey interbeds, forming a well-layered succession made up of a few m-thick bed packages bounded by several cm-thick clayish interlayers. The carbonate multilayer was first affected by thrust tectonics, with the formation of low-angle intra-carbonate thrust faults and fault bend-folding. Then, the multilayer was crosscut by extensional–transtensional high-angle faults, which displaced the previously formed contractional structural elements, and allowed carbonate exhumation from shallow crustal depths. At outcrop scales, thrust-related deformation was solved by low-angle joints and veins, rare high-angle stylolites, and low-angle sheared fractures displaying reverse kinematics. Quantitative analyses of fracture density (P20) and intensity (P21) conducted on selected portions of the thrust fault zones indicate that the low-angle joints and veins attain their highest values in the vicinity of the main slip surfaces, whereas they are almost absent in the surrounding carbonate host rocks. Plio-Quaternary transtensional deformation was solved by NW–SE- and NE–SW striking faults. The latter fault set, nicely exposed along the flanks of the Raganello Creek, was characterized by right-lateral components of slip. Incipient faults, with ca. 1 cm throw, are made up of vertically discontinuous slip surfaces, which crosscut single bed packages and abut against clayish interlayers. The slip surfaces form conjugate geometries, and are associated to high-angle fractures and veins striking NE–SW, dissecting the bed packages. The fault core is virtually absent, whereas the damage zones are very discontinuous along dip. The P20 values computed for the high-angle fractures and veins increase toward the slip surfaces, whereas the P21 values remain nearly constant. These data are interpreted as being due to fault nucleation processes associated with fracture nucleation within the limestone rocks. NE–SW striking small faults displaying throws between 10 and 60 cm are comprised of through-going main slip surfaces crosscutting multiple bed packages, and poorly developed, discontinuous fault cores flanked by m-thick damage zones. The damage zones include sub-parallel high-angle shear fractures, fractures and veins showing a positive correlation between P20 and P21, whose values increase in the vicinity of the main slip surfaces. Such a positive correlation is interpreted as due to fault growth by linkage and coalescence of pre-existing high-angle fractures, and formation of fault-related joints and veins at the extensional quadrants of single shear fractures. Similarly, large-scale NE–SW striking mature faults with throws on the order of tens of meters, made up of a m-thick fault core and 10 s of m-thick damage zones including sub-parallel fractures and veins, also show a positive P20 and P21 correlation. The main outputs of this work are synthesized into a conceptual model illustrating the transition from thrust-related deformation to extensional–transtensional faulting, documenting the evolution of fracture networks from incipient-to-small-to-mature faults.
1. Introduction
Mesozoic carbonate rocks of the southern Apennines were subjected to a multistage tectonic evolution, which resulted in the formation of multiple sets of diffuse, background fractures and of localized, fault-related fractures [1,2,3,4,5,6]. This study focuses on the well-layered Cretaceous platform carbonates cropping out at the Castelsaraceno area of the Raparo Mt., southern Italy. The study area lies along the southern edge of the High Agri Valley, within the axial zone of the southern Apennines fold-and-thrust belt [7], and was first involved in thrust tectonics (Oligo-Miocene), and then dissected during the Plio-Quaternary downfaulting of the belt [8]. Thrust tectonics caused rotation and translation of individual thrust sheets, which included rigid carbonate blocks topped by syn-tectonic terrigenous flysch, and their predominant E–ENE transport direction [8,9,10].
At a smaller scale of observation, within the single thrust sheets, a recent work conducted at Viggiano Mt., flanking the eastern side of the High Agri Valley, documented the presence of multiple back thrusts and anticline folds affecting the Mesozoic platform carbonates [1]. In earlier papers, the same group had assessed the geometrical properties of the individual structural elements associated with the thrusting tectonics and the later Plio-Quaternary downfaulting of the belt, documenting the variations of both fracture density and intensity across the Mesozoic carbonates [4], as well as the high-angle faults dissecting them [3]. However, in this latter contribution, the direct link between the degree of fault maturity and the associated spatial distribution of the cumulative fracture network was not constrained. A further limitation is that previous studies failed to resolve the finite strain architecture of carbonate rock volumes during multiphase tectonic evolution. Consequently, how multiple fractures form and reactivate within these fault zones remains poorly understood.
In view of the above, and building up on the existing knowledge, this work focuses on the analysis of the deformation style of Mesozoic platform carbonate involved in both thrusting and extensional tectonics [2,3,10,11]. Aiming at expanding the current understanding of the geometry and spatial distribution of thrust-related and extension-related fractures in shallow-water carbonates, and in particular the progressive development of specific fracture sets, the present contribution reports the results of integrated field and digital structural analyses of selected carbonate outcrops. The results of both fracture density and intensity values are discussed in light of the published bibliography to shed new light on the time–space evolution of the fracture networks associated to the multistage tectonic evolution of well-layered platform carbonates. This work has applications across several fields, including hydrogeology, geothermal energy, and carbon capture and storage (CCS), particularly in the computation of effective permeability in fractured platform carbonates.
2. Geological Setting
The southern Apennines is an E-verging fold-and-thrust belt (FTB) which formed since the Oligocene due to the continental collision of the African and Eurasian tectonic plates [7]. The FTB includes tectonic units made up of Meso-Cenozoic sedimentary successions originally pertaining to different paleogeographic domains of the Tethys Ocean and of the northwestern margin of the African plate [8]. According to a piggy-back thrust propagation with occasional out-of-sequence thrusting, contractional deformation took place with overthrusting of the deep-sea Ligurian and Sicilide tectonic units onto the Apenninic Platform, and then with the whole tectonic pile overriding the Lagonegro basinal successions [12]. Afterwards, the whole FTB overrode the Apulian Platform along a basal decollement outlined by a tectonic mélange zone, separating the Lagonegro Units at the hanging wall from Lower Pliocene turbidites at the footwall with a predominant thin-skinned deformation style [8].
During the Upper Pliocene, continued crustal shortening led to the formation of deep-seated thrust faults within the Apulian Platform, with a transition from thin- to thick-skinned tectonics [13,14]. Due to this deep-seated deformation, the over-thickened FTB was affected by low-angle normal faulting, which occurred by means of tectonic inversion of the early formed thrust faults generating widespread tectonic elision of the original contraction-related geometries [15,16,17,18]. Subsequently, Lower Pleistocene strike-slip tectonics associated with the lateral extrusion of the Calabrian Arc were followed by downfaulting accommodated by high-angle normal and transtensional faults related to the final stages of the Tyrrhenian Sea opening and the gravitational collapse of the fold-and-thrust belt (FTB) [7,19,20]. Nowadays, the axial portion of the FTB is affected by active, high-angle normal faults producing high magnitude earthquakes such as those that struck the Irpinia [21] and Basilicata areas in the last centuries [22,23,24].
The Castelsaraceno study area is situated along the southern flank of Raparo Mt., a carbonate massif that exposes part of the Meso-Cenozoic Apenninic Platform along the southwestern margin of the High Agri Valley. This valley trends NNW–SSE to WNW–ESE, is ca. 30 km-long and 12 km-wide, and consists of a Quaternary continental basin [5,25] bounded eastward by the SW-dipping East Agri Fault System, EAFS, and westward by the NE-dipping Monti della Maddalena Fault System, MMFS [11,26]. The area was the locus of the devastating 1857 Basilicata earthquake [22] and hosts the largest onshore hydrocarbon field of Western Europe, located within the fractured Apulian carbonates [27]. The Raparo Mt. consists of Apenninic platform carbonates crosscut by high-angle NW–SE- and NE–SW-striking normal faults, which displace ENE-verging thrust faults exposing the underlying Lagonegro tectonic unit [9]. The outcropping stratigraphic succession of the Raparo Mt. includes Cretaceous–Eocene limestone, Miocene Albidona flysch, and Holocene slope debris and alluvial sediments (Figure 1). The Castelsaraceno site is located at the southern edge of the Raparo Mt. There, the Cretaceous limestones overthrust the Triassic Calcari con Selce and Triassic–Jurassic Scisti Silicei Formations, pertaining to the Lagonegro Unit, and are in turn tectonically covered by the clay-rich Liguride units. The present study focuses on the outcrops exposed along the flanks of the Raganello Creek, which trends ca. NW–SE and allows detailed 3D assessment of both the stratigraphic and structural settings of the Cretaceous limestone.
Figure 1.
Geological map of the Raparo Mt., adapted from [28].
3. Methodology
3.1. Field Stratigraphic Logging, Structural Analysis and Mapping
Litho-stratigraphic logging was conducted to assess both the thickness and main lithofacies of the single carbonate beds [29]. Field logging was carried out along vertically persistent sections of the Cretaceous carbonate succession. Both limestone beds and marl–clayish bed interfaces were documented. Structural analysis was conducted on vertical outcrops to measure the attitude of bedding planes, faults, fractures, stylolites, and shear fractures. Faults were recognized by throws greater than a few cm, and the presence of fragmented host rock, fault breccia and cataclasites along slip surfaces. Fractures were identified in the field due to lack of any significant bed offset, and shear fractures when the planar discontinuities solved mm–cm throws but were not associated to any fragmented, brecciated or cataclastic carbonate rocks. Slip surfaces were identified when they crosscut cataclastic rocks and stylolites due to their zig-zag geometry.
The attitude of planes was reported as strike and dip using the Right-Hand-Rule (RHR) convention. The attitude of slickenlines such as abrasive striae was reported as trend and plunge. The data acquired along the surveyed outcrops were then elaborated using the Stereonet v. 11 software [30,31]. At a larger scale, photographs of the sub-vertical cliffs exposed along the Raganello gorge were taken using an iPhone 14 Pro (Apple©) with a 48 MP (megapixel) main camera and 12 MP ultra-wide camera, with telephoto 12 MP (3× optical zoom). Line drawing of both the bedding planes and high-angle shear fractures and fault zone traces were carried out by means of the Adobe Illustrator© software (version 27.3.1). Finally, Open Street© and Google Earth© basemaps were used for large-scale geological mapping of the study area.
3.2. Digital Structural Analysis
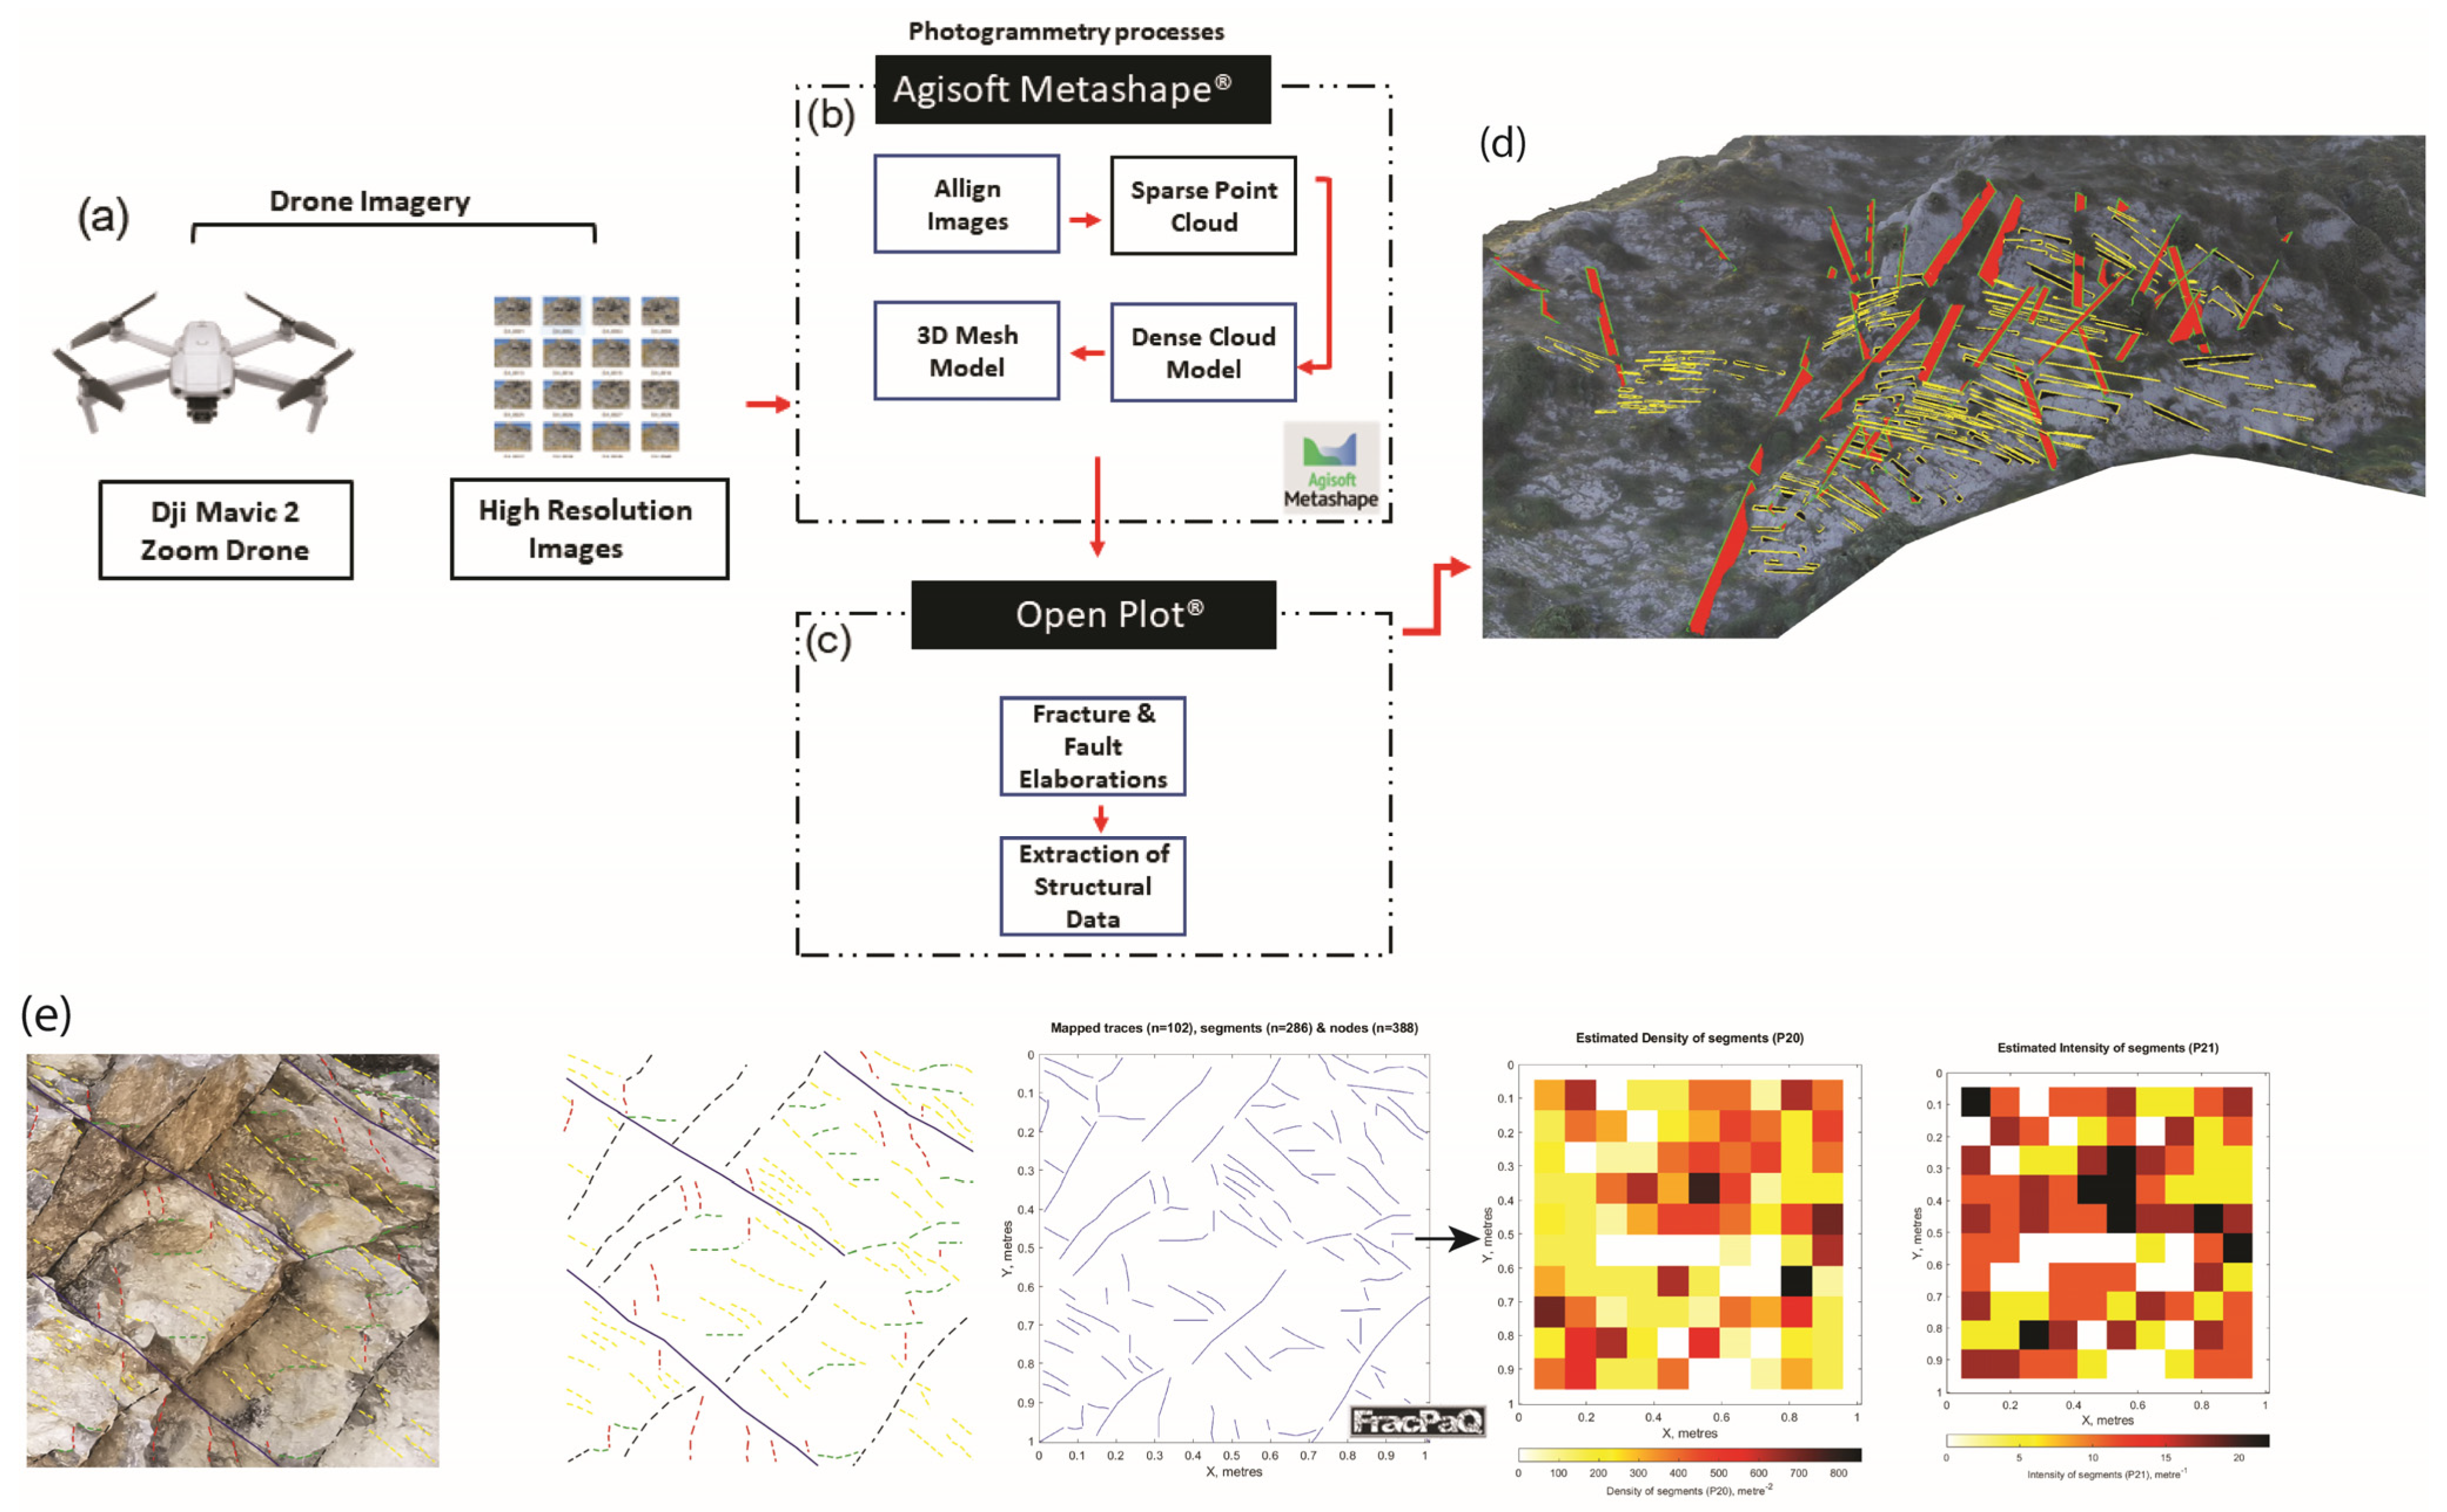
High resolution images were acquired digitally using a DJI Mavic II Zoom drone (Figure 2a) with its stock camera (fixed focal length of 25 mm, ISO −100, diaphragm opening of F/2.8, shutter speed 1/800 to 1/1200 s). The images were collected manually at both orthogonal and oblique (not exceeding 35°) shooting angles, 5–10 m distance from the exposed rock surface. Aimed at achieving models at an optimal resolution, photos were captured with at least 75% overlap and subsequently processed to 3D digital outcrop models using the Agisoft Metashape software Pro (version 2.2) (Figure 2b) [32]. Its workflow is as follows: image alignment and sparse point-cloud generation, followed by dense cloud, mesh, and textured-model reconstruction, with georeferencing achieved directly from the camera GNSS positions rather than from ground control points. Although direct georeferencing yields lower absolute accuracy, it preserves the high relative (internal) accuracy that governs orientation and geometric measurements, which is the accuracy component relevant to structural analysis [33]. Structural data pertaining to small faults (throw < 1 m) and medium faults (throw > 1 m) were elaborated using OpenPlot Pj.(version 2022) [34] and exported as vector graphics files (SVG format; Figure 2c,d).
3.3. Quantitative Fracture Analysis
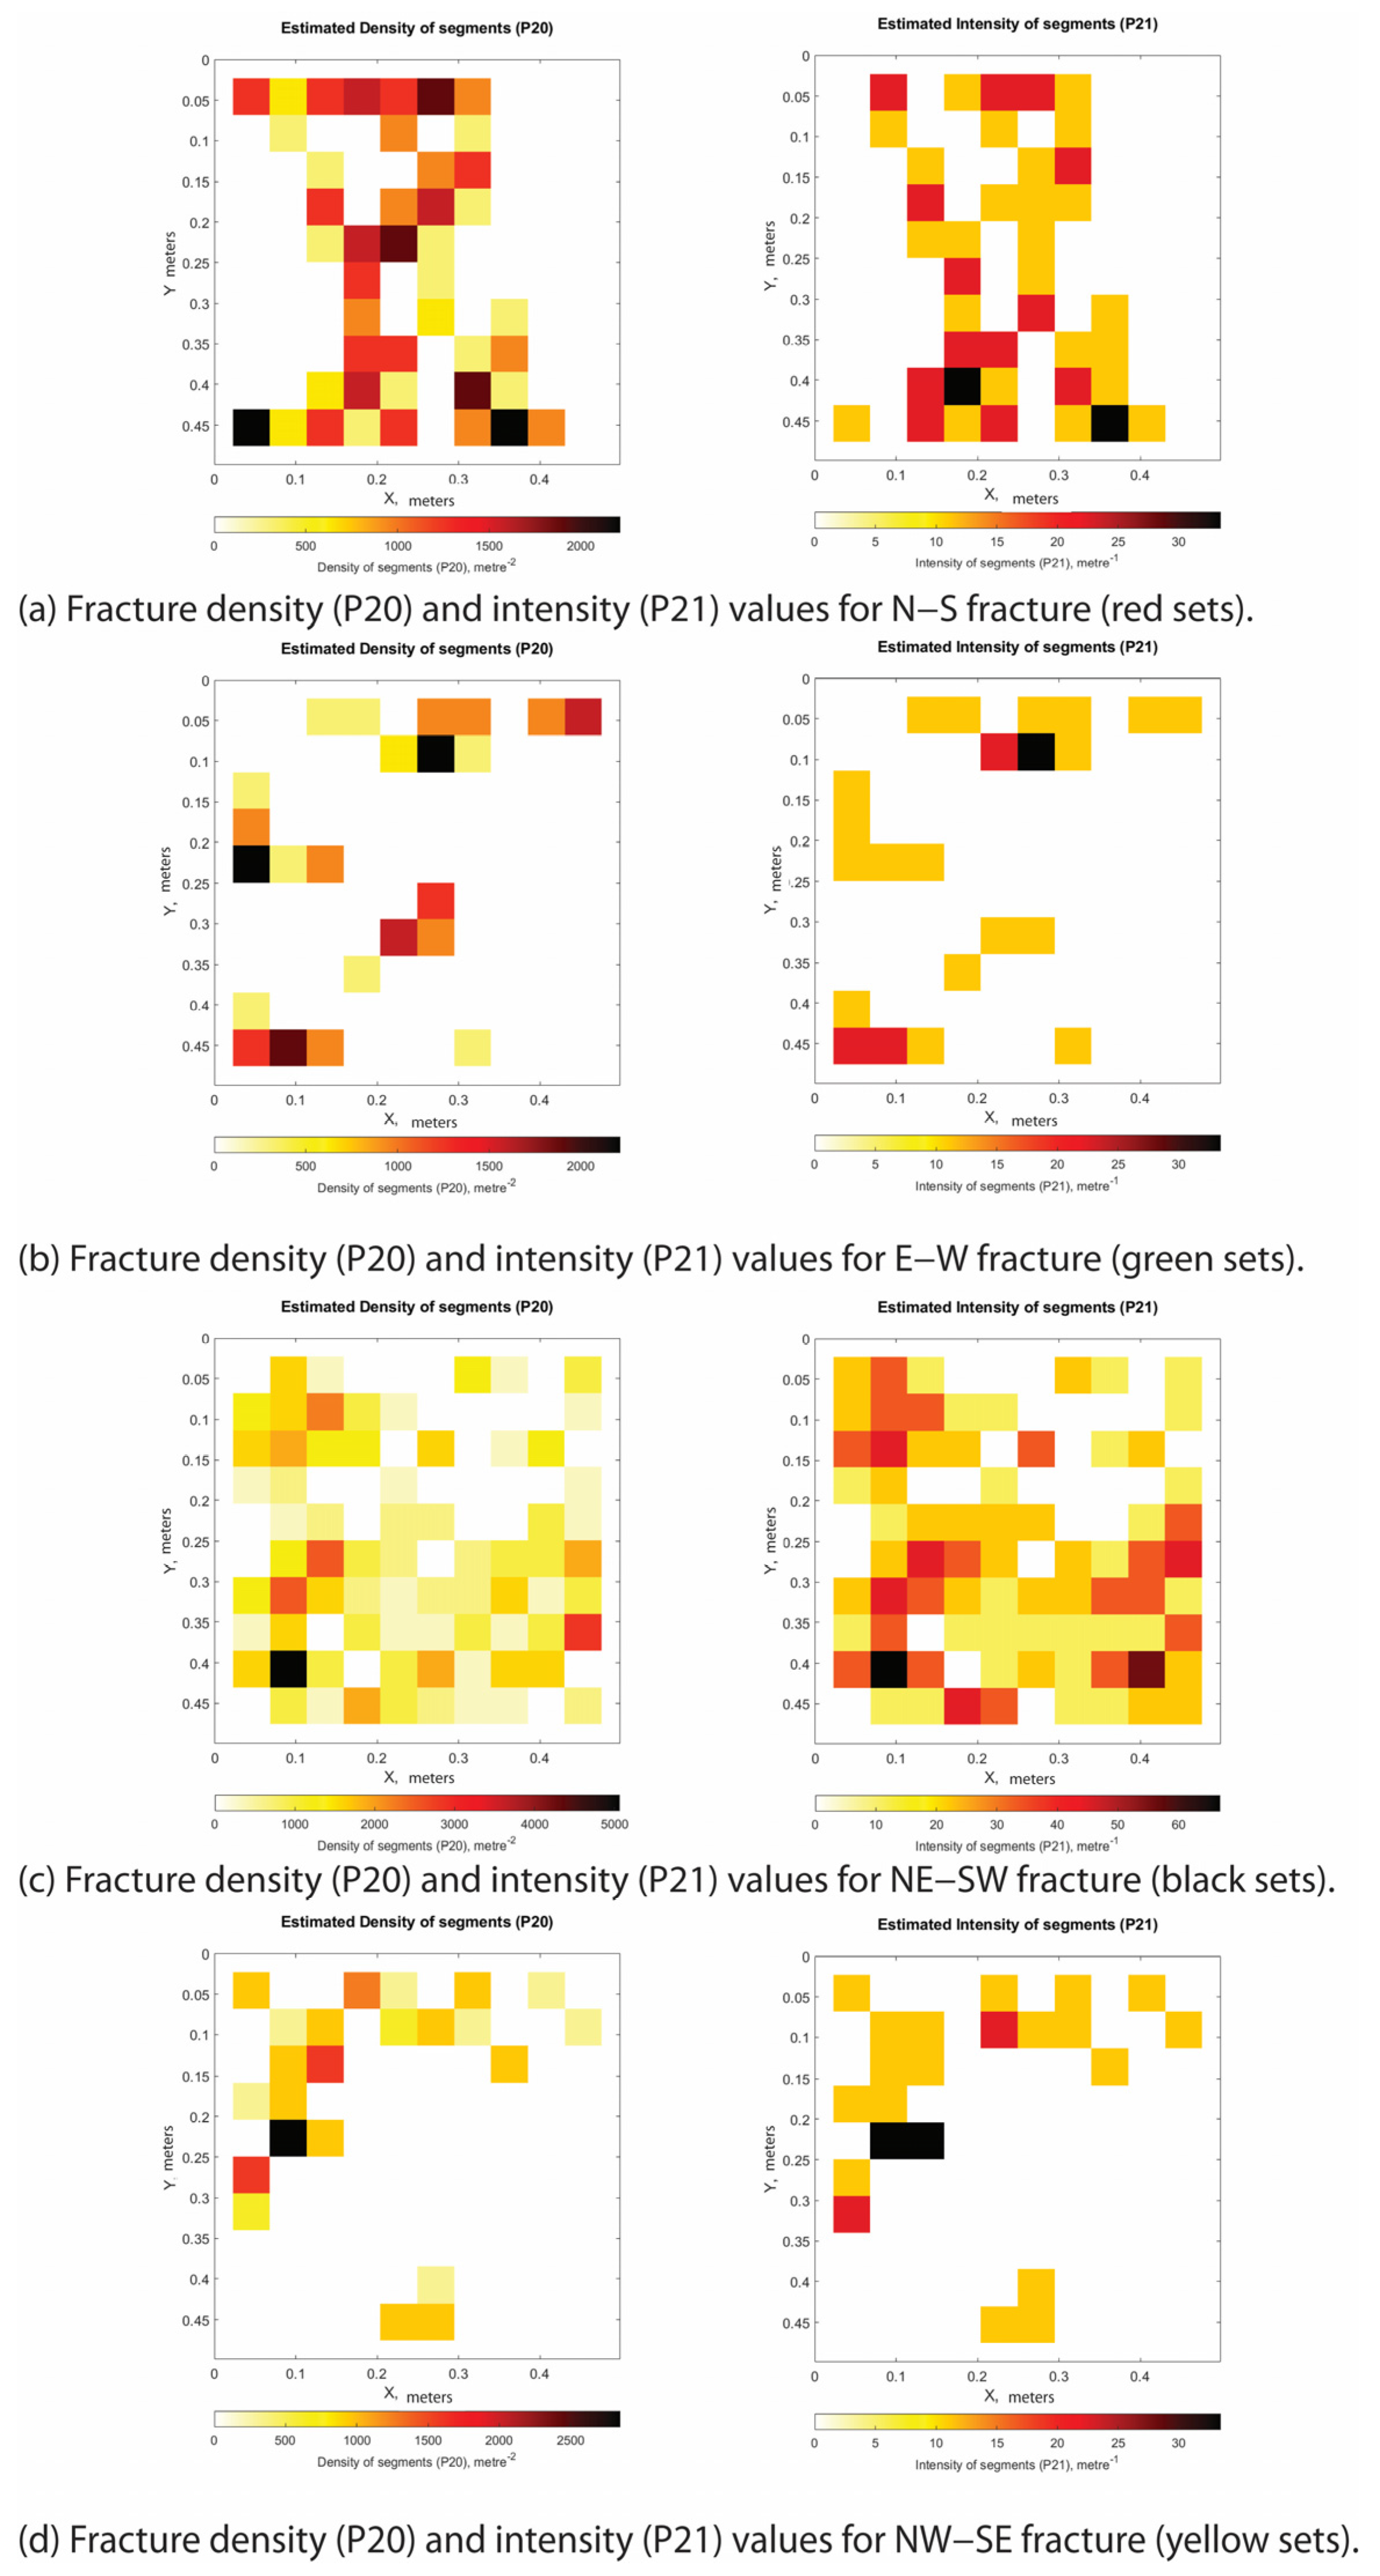
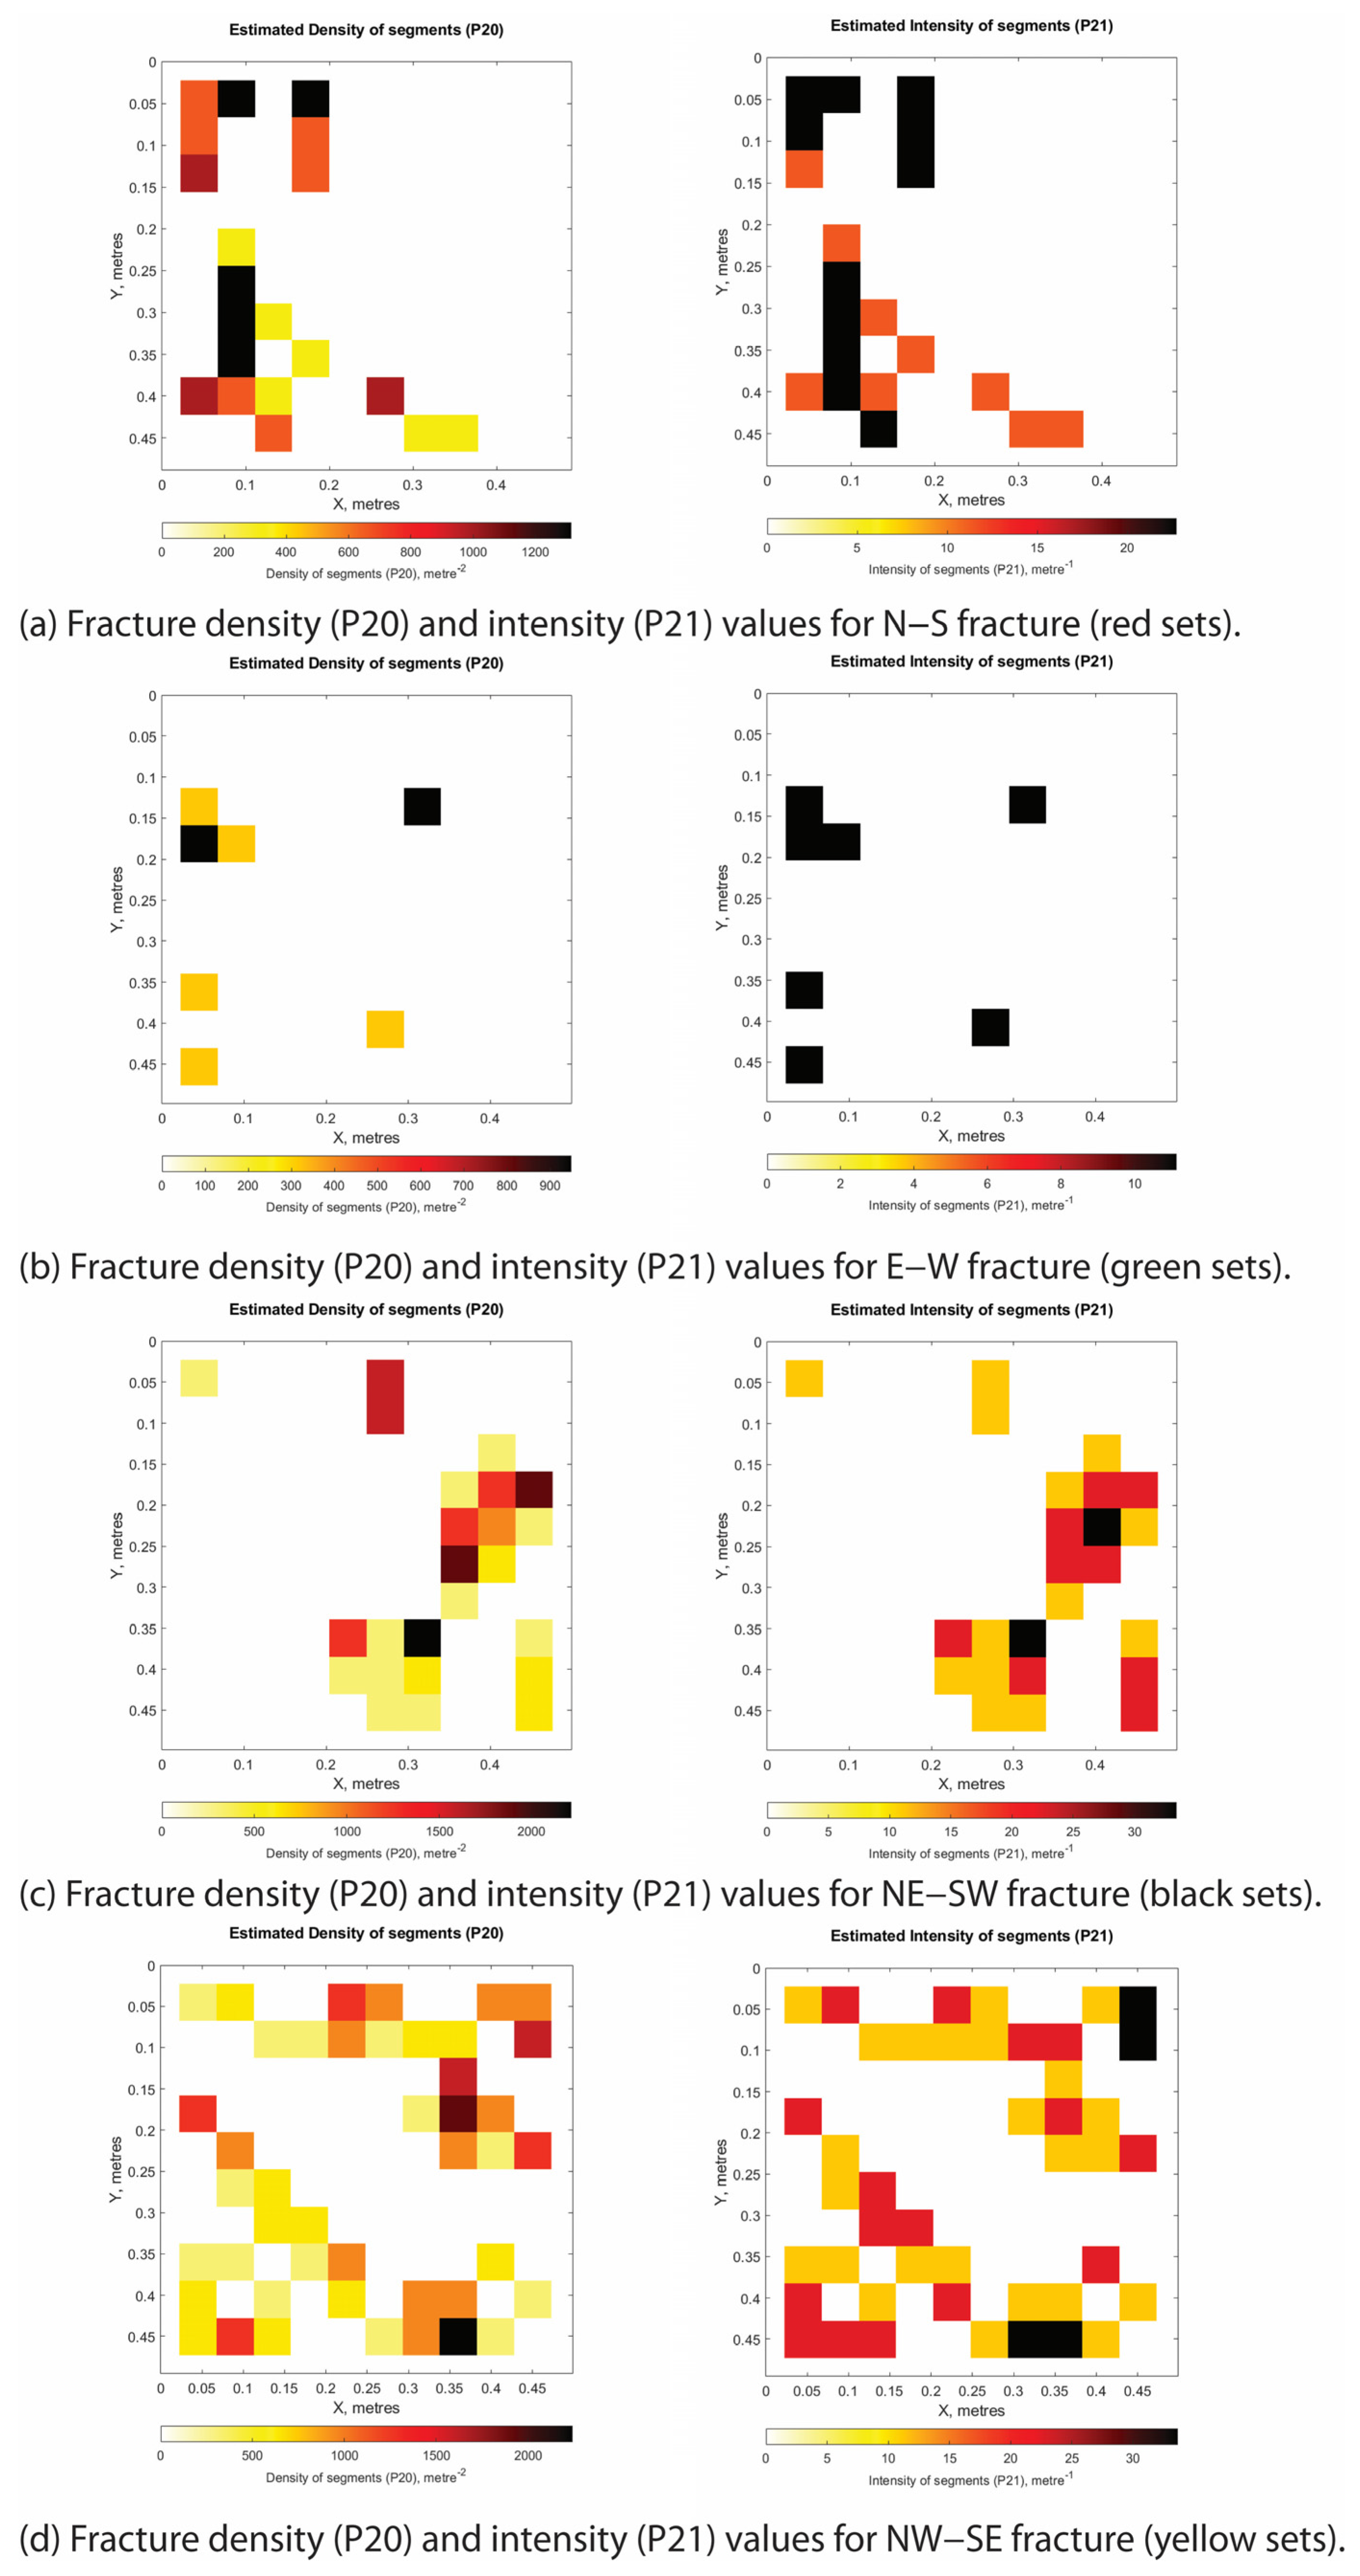
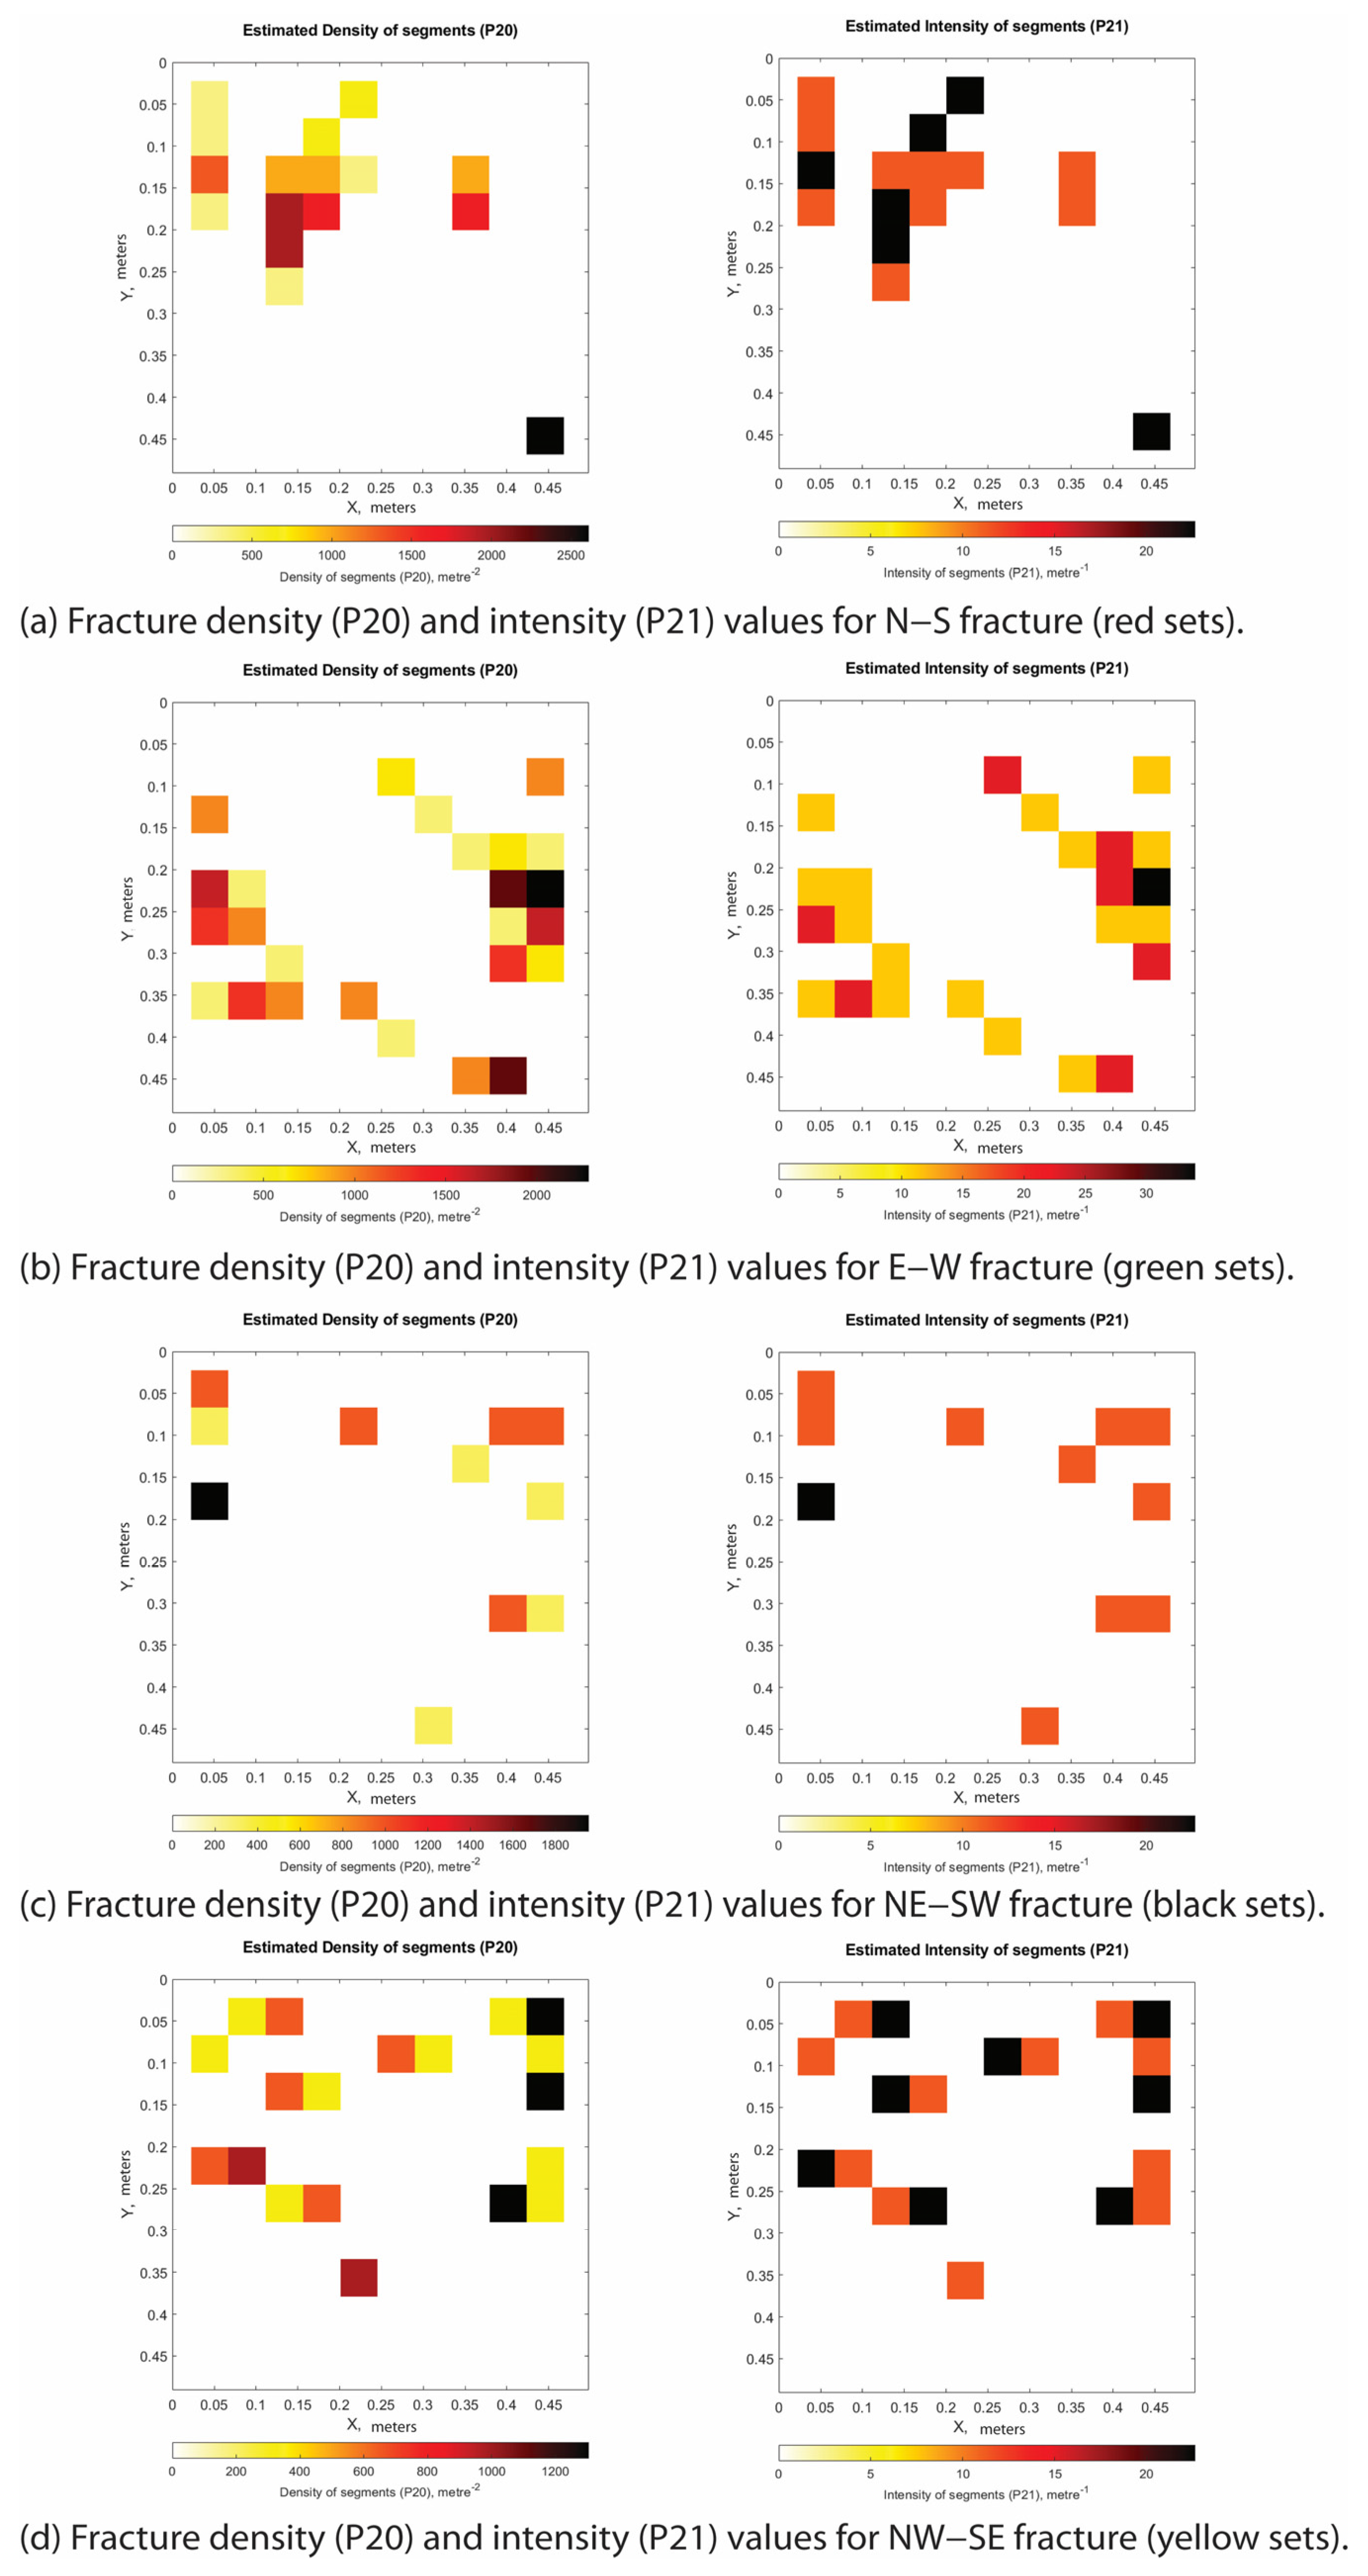
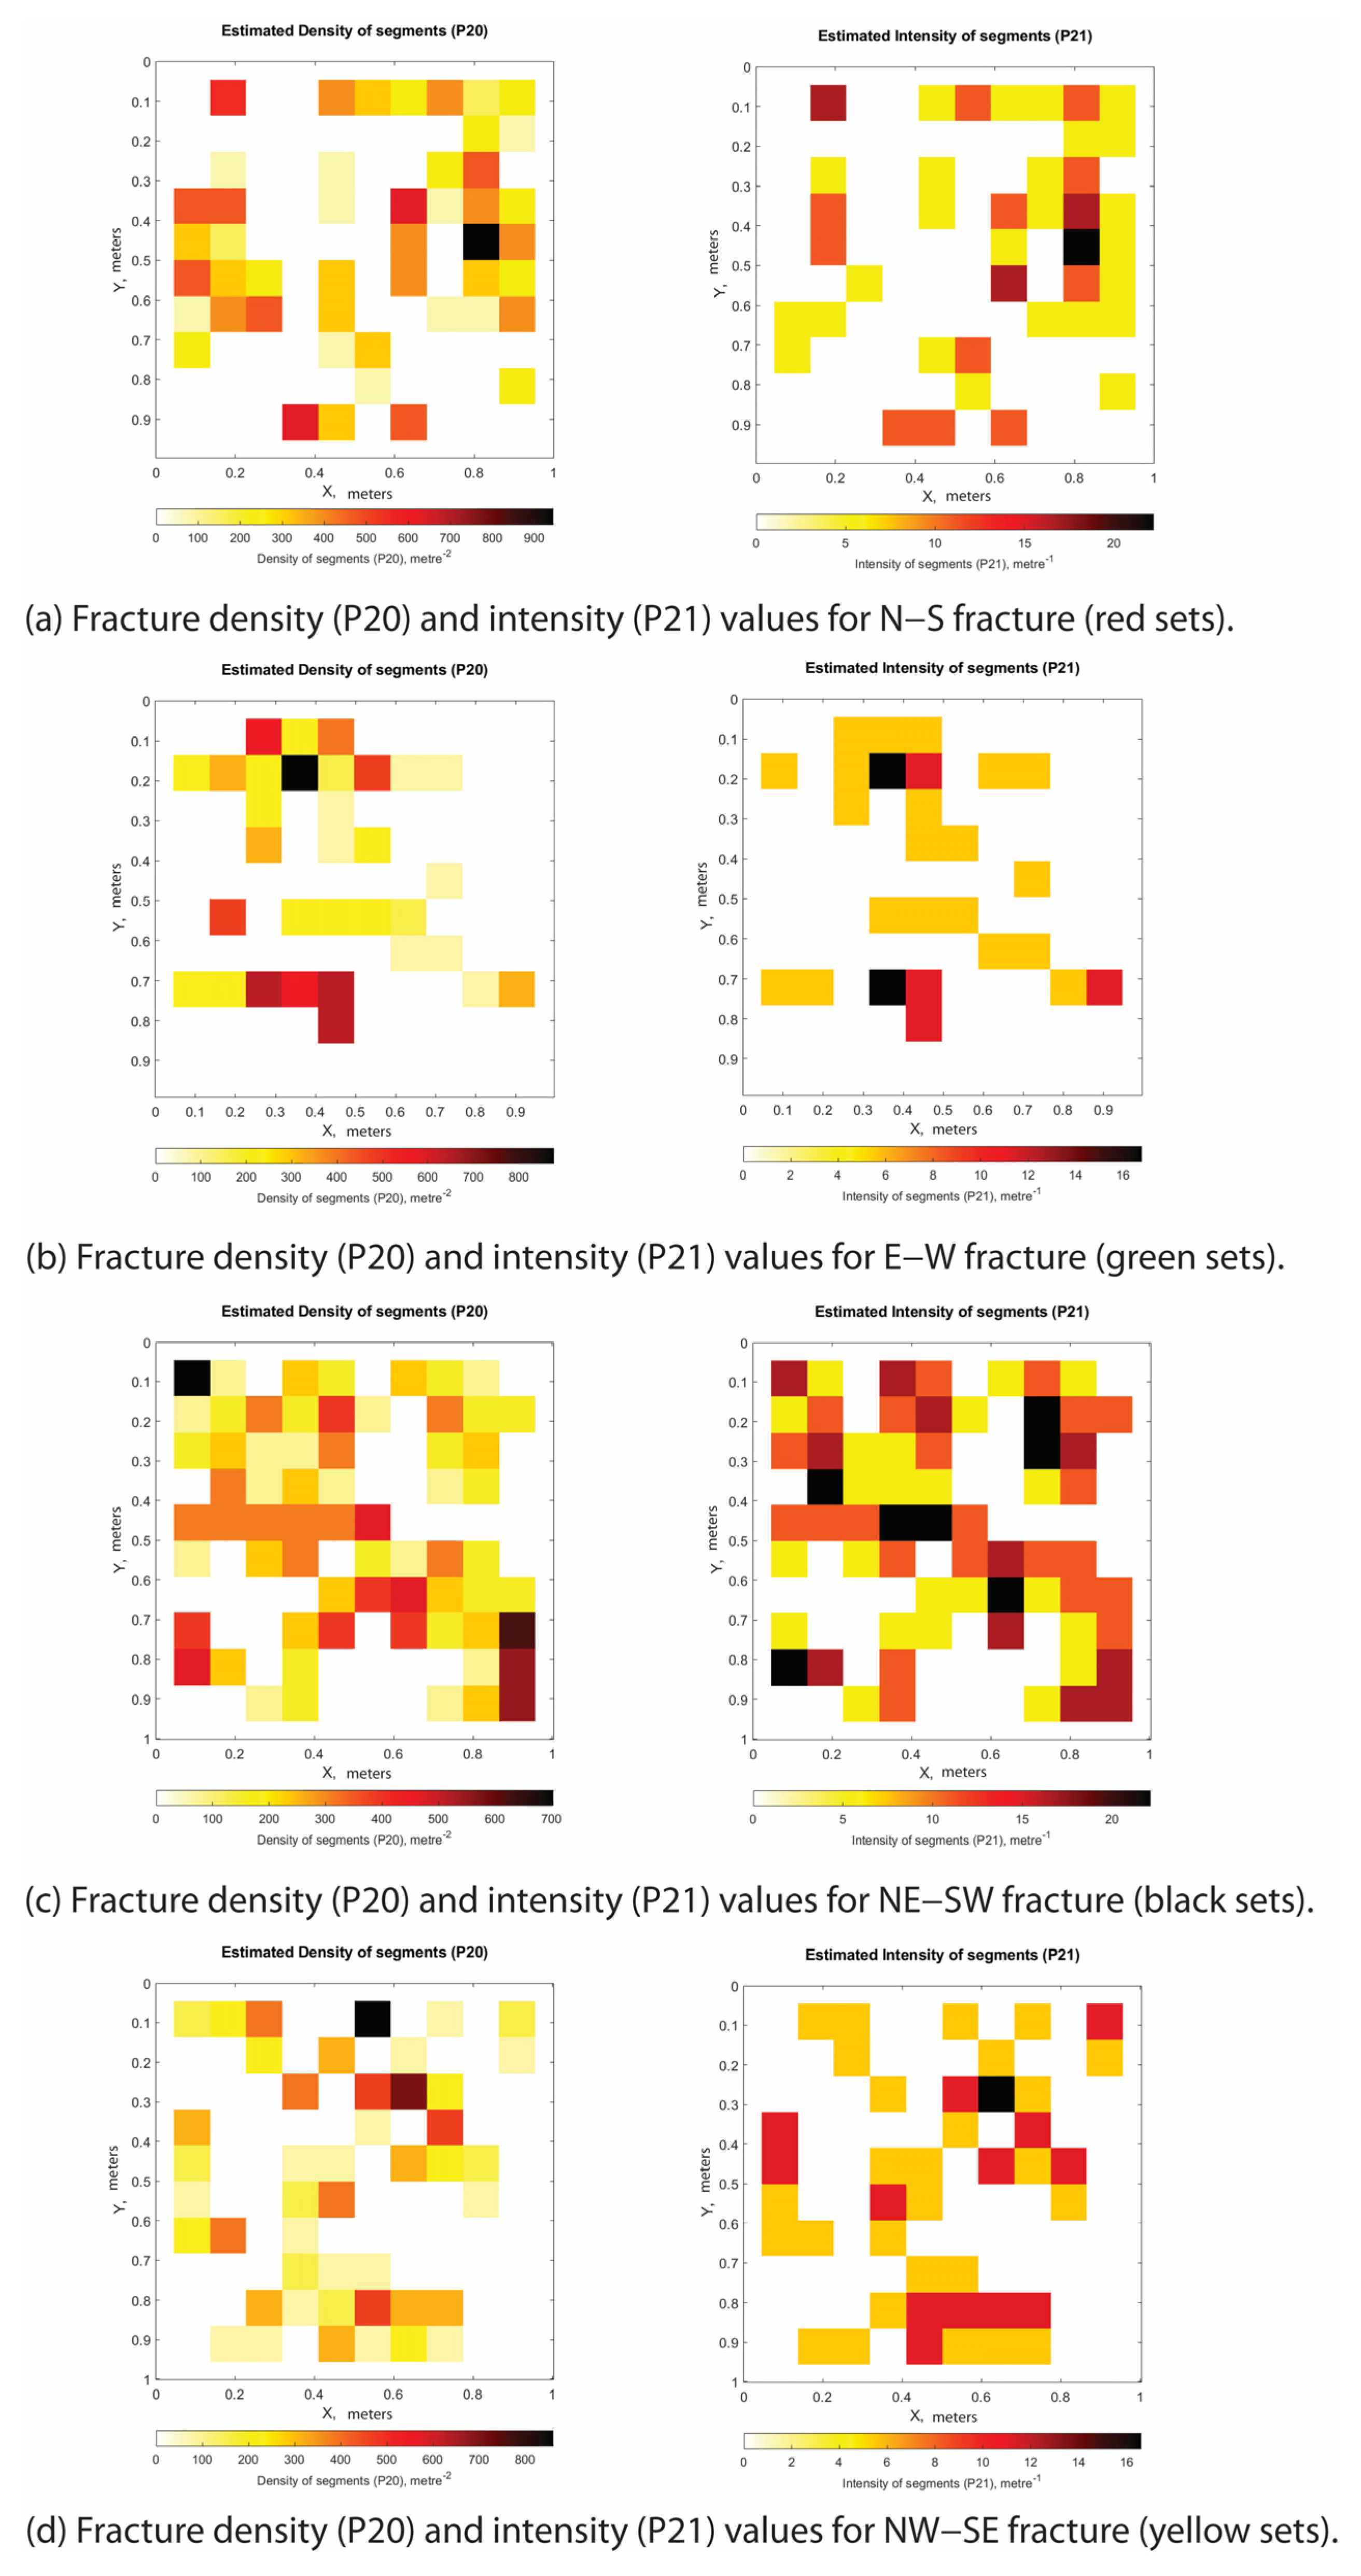
Computation of both the 2D fracture density, P20, and intensity, P21, was performed by means of FracPaQ [35] (Figure 2e). The study outcrops were chosen as representative of fracture networks associated with high-angle extensional–transtensional faults (Stations 1, 3 and 4) and low-angle thrust faults (Station 2). At each station, after qualitative analysis of the fracture geometry, the selected areas of various width (either 1.00 × 1.00 m or 0.5 × 0.5 m) were first analyzed in the field, and then digitally mapped by conducting the line drawing of the fracture traces using Adobe Illustrator. The illustrator files (. SVGs) were then imported into FracPaQ (Figure 2e) for computation of both the P20 and P21 values. Computations were performed for single fracture sets (Appendix A, Appendix B, Appendix C and Appendix D), and for cumulative analysis (see text). In the 2D structural maps, the single fracture sets were distinguished on the basis of a specific color code. Fracture traces were reported as red, yellow, black, and green lines, bedding plane traces as dashed black lines, vein traces as blue lines, and shear fracture and slip surface traces as pink lines.
It should be noted that FracPaQ derives P20 and P21 from fracture traces on a 2D projection of the inherently 2.5D photogrammetric model; methods operating directly on the digital outcrop model, such as DICE [36], reduce but do not fully remove this limitation. As the present analysis uses these parameters for relative comparison between structural positions rather than as absolute volumetric properties, this does not affect the interpretations presented here.
Figure 2.
A schematic diagram showing the workflow for: (a) drone acquisition utilizing an Unmanned Aerial Vehicle (UAV) drone; (b) the 3D digital photogrammetry process; (c) the fracture and fault elaborations/structural data extraction process; (d) the digital image with interpreted structural elements; and (e) the areal fracture density (P20) frequency and fracture intensity (P21) computed using the FracPaQ (version 2.8.0) within MATLABTM (version R2023a) [36].
4. Results
4.1. Field Mapping, Stratigraphic Logging and Structural Analysis
Results of geological mapping of the Castelsaraceno area expand the current knowledge of the local fault array [9,28] revealing previously unreported thrust faults, folded ridges, and transtensional faults (Figure 3a). Specifically, the novelties consist of low-angle NW–SE-striking thrust faults, NW–SE- and E–W-trending fold hinges, and NW–SE-striking transtensional faults (Figure 3a).
Figure 3.
(a) Structural map of the Castelsaraceno area showing the main geological formations and structural elements. Modified from [28]. (b) Raganello creek (Castelsaraceno) Open Street/Google Earth map showing the locations of the studied outcrops/stations.
Focusing on the Cretaceous carbonates, stratigraphic logs A to C (Figure 3b) cover more than a 30 m-thick section of the limestone, including several m-thick bed packages bounded by 5 to 10 cm-thick clayish marl interlayers (Figure 4a). The stratigraphic sections range from −31.6 m to 0. The bed packages are comprised of single beds whose thickness ranges from ca. 40 cm to ca. 65 cm. Their texture ranges from packstone–grainstone at the top to mudstone–wackestone at the bottom (Figure 4a). We note that the single bed packages exposed along the upper portion of the section show the form of an upward sequence, with thick coarse-grained limestone at the bottom and thin fine-grained limestone beds at the top. The studied carbonate succession is topped by 10 s of m-thick, tar-rich, syn-sedimentary carbonate breccia, which extends laterally for a few hundred meters along the surveyed trail of the Raganello Creek. There, hydrocarbons in the form of tar are localized both within clasts and calcite-rich hairline veins (Figure 4b).
Figure 4.
(a) Stratigraphic logs A, B, and C show parts of the studied outcrop and the thickness of the different lithologic units in the Cretaceous carbonates. (b) Syn-sedimentary breccia infiltrated by hydrocarbons (pointed by the red arrows) within (i) tiny hairline veins, and (ii) the rock matrix. Located on latitude N40°09′55″ and longitude E 15°59′17″ (WGS84).
Line drawing of the sub-vertical cliffs exposed along the Castelsaraceno gorge show the presence of folded Cretaceous limestone with ca. NE–SW (Figure 5a) and E–W trending sub-horizontal fold hinges (Figure 5b). The bed packages are truncated by high angle-faults forming cut-off lines, and by low-angle faults forming footwall ramp and hanging wall geometries with the carbonate beds (Figure 5a,c,d). Bed tilting with variations of ca. 20–30° are documented across single high-angle faults (Figure 5e).
Figure 5.
(a) Castelsaraceno gorge–Northern flank. Showing faulted blocks, characterized with the presence of detachment levels. (b) Castelsaraceno gorge–middle ridge, shows large scale ca. E–W trending antiform (yellow) and sub-horizontal hinge. (c) Castelsaraceno gorge–Northern flank. Central portion of the carbonate rocks and fault blocks. (d) Castelsaraceno gorge–southern flank (view from the north). The Central and Western portions illustrate the presence of detachment levels; some of these are related to the Northern flank. (e) Castelsaraceno gorge–southern flank, cemetery cliff.
Field inspection reveals that the footwall ramp geometries are due to thrust faults displacing carbonate beds 255/40 to 230/30 (hanging wall) and 160/25 to 210/20 (footwall) and crosscut by high-angle faults 070/63 and 290/85 (Figure 6a). At site XX (Figure 6b), we observed a hanging wall ramp and a footwall flat. There, the hanging wall ramp geometries are also due to thrust faults, that include a thin layer of fault breccia displacing carbonate beds with attitudes of 030/45 (hanging wall) and 210/10 (footwall), respectively crosscut by fractures 200/65 and 060/75 (Figure 6b). High-angle transtensive faults 070/54 displace carbonate beds 275/7 and include striae ca. 096/35 (Figure 6c). Besides widespread barren fractures and veins, whose geometry and distribution will be reported in the text below, we document the presence of bed-perpendicular tectonic stylolites with an attitude of 350/80 within low-angle carbonate beds (Figure 6d).
Figure 6.
(a) Footwall ramp geometry showing hanging wall strata forming a footwall cut-off. (b) Site XX illustrates a thrust fault with a hanging wall ramp and footwall flat geometry. (c) A fault zone illustrating the presence of a kinematic marker (striae), drag axis, zone and left lateral strike-slip fault in the Castelsaraceno area. (d) A sub-vertical stylolite oriented 350/80, illustrating evidence for contractional tectonics in the Castelsaraceno area.
At a key site YY (Figure 7), we observed a hanging wall flat and a footwall ramp and documented the architecture of this thrust fault displacing the carbonates (Figure 7). There, the western portion of the outcrop shows fault planes 240/18–30 crosscutting carbonate beds forming low-angle cut-offs (Figure 7). The thrust fault bounds the folded carbonates at the footwall, forming syncline and anticline folds separated by a small-scale shear plan within clayish interlayers (Figure 7). On the hanging wall thrust fault block, the carbonate beds are sub-parallel to the fault plane (Figure 7). The eastern portion of the outcrop exhibits two fault planes, 265/38 and 280/42, forming on both sides low-angle cut-offs with the carbonate beds (Figure 7).
Figure 7.
Site YY, an exposed outcrop image showing line drawings with interpretation of thrust-related deformational structures, illustrating a hanging wall flat and a footwall ramp. The red lines represent fault planes, black dashed lines and numbers represent beddings.
The results of digital structural analysis conducted on two photogrammetric models of sub-vertical cliffs are consistent with high-angle fractures and small faults dissecting folded carbonate beds and bed packages. According to the digital plane attitude data gathered after 3D analysis, we first compute the fold axes associated to the folding of the carbonates by first assessing the phi circle and then the pole of these circles. The first model permits us to unravel NW–SE-striking and, subordinately, ca. N–S- and E–W-striking structural elements dissecting gently folded carbonate beds with a computed sub-horizontal fold hinge trending ca. 040 (Figure 8a). The second model shows predominantly NE–SW- and NW–SE-striking high-angle fractures and small faults, with less abundant N–S-striking structures, crosscutting broadly folded beds with a computed sub-horizontal hinge line trending ca. 180° (Figure 8b).
Figure 8.
(a) Fold hinges orientations are dominantly in the NE–SW direction. High angle faults with NW–SE orientation. Folded beds dissected by high angle faults form fault blocks. (b) Fold hinges are dominantly oriented N–S, whereas the high-angle faults dissecting the folded carbonate beds are mostly strike NW–SE.
4.2. Quantitative Fracture Analysis
A detailed analysis of the geometry and distribution of fracture networks crosscutting the carbonate units was conducted at four measurement stations. The selected sites are representative of both contractional and extensional–transtensional deformation regimes. The extensional–transtensional sites were further differentiated according to the amount of displacement accommodated by the associated high-angle faults.
4.2.1. Contractional Deformation
A thrust fault striking and dipping 228/34, approximately sub-parallel to the bedding (222/16 to 213/11), was investigated at Station 2 (latitude 40°09′53″ N, longitude 15°59′22″ E). The fault is exposed along a sub-vertical SE–NW-trending outcrop approximately 12 m long and 3.5 m high (Figure 9). Kinematic indicators, including abrasive striae preserved on the fault surface, are consistent with pure dip-slip reverse movement.
Figure 9.
Station 2 outcrop image showing line drawings with an interpretation of thrust-related deformational structures. Sections A to E showing the values of fracture density (P20) and intensity (P21) computed for specific portions of the outcrop. The stereographic projection of the structural elements shown in the lower right employs the following color code: red (NNE–SSW high-angle fractures), yellow (NW–SE low-angle fractures), green (E–W low-angle shear fractures), and black (NE–SW high-angle shear fractures).
In detail, the western portion of the outcrop exposes the fault footwall, characterized by high-angle ENE–WSW- and N–S striking fractures, as well as low-angle NE–SW-striking fractures (Figure 9). The eastern portion exposes the fault hanging wall, consisting of comparatively less deformed, grain-supported limestones that are only slightly fractured and contain joints and sheared joints.
Quantitative analyses of the fracture geometry, density, and intensity for individual scanlines are reported in Figure 9.
In the Table 1 and Table 2 below, we present the computed cumulative values for the fracture density (P20) and fracture intensity (P21) of the studied sections and the individual fracture sets. The datasets analyzed are listed in Table 1 and Table 2.
Table 1.
Station 2 sections showing the computed cumulative values for fracture density and fracture intensity.
Table 2.
Station 2 sections, fracture sets and computed values for the fracture density and fracture intensity of individual fracture sets.
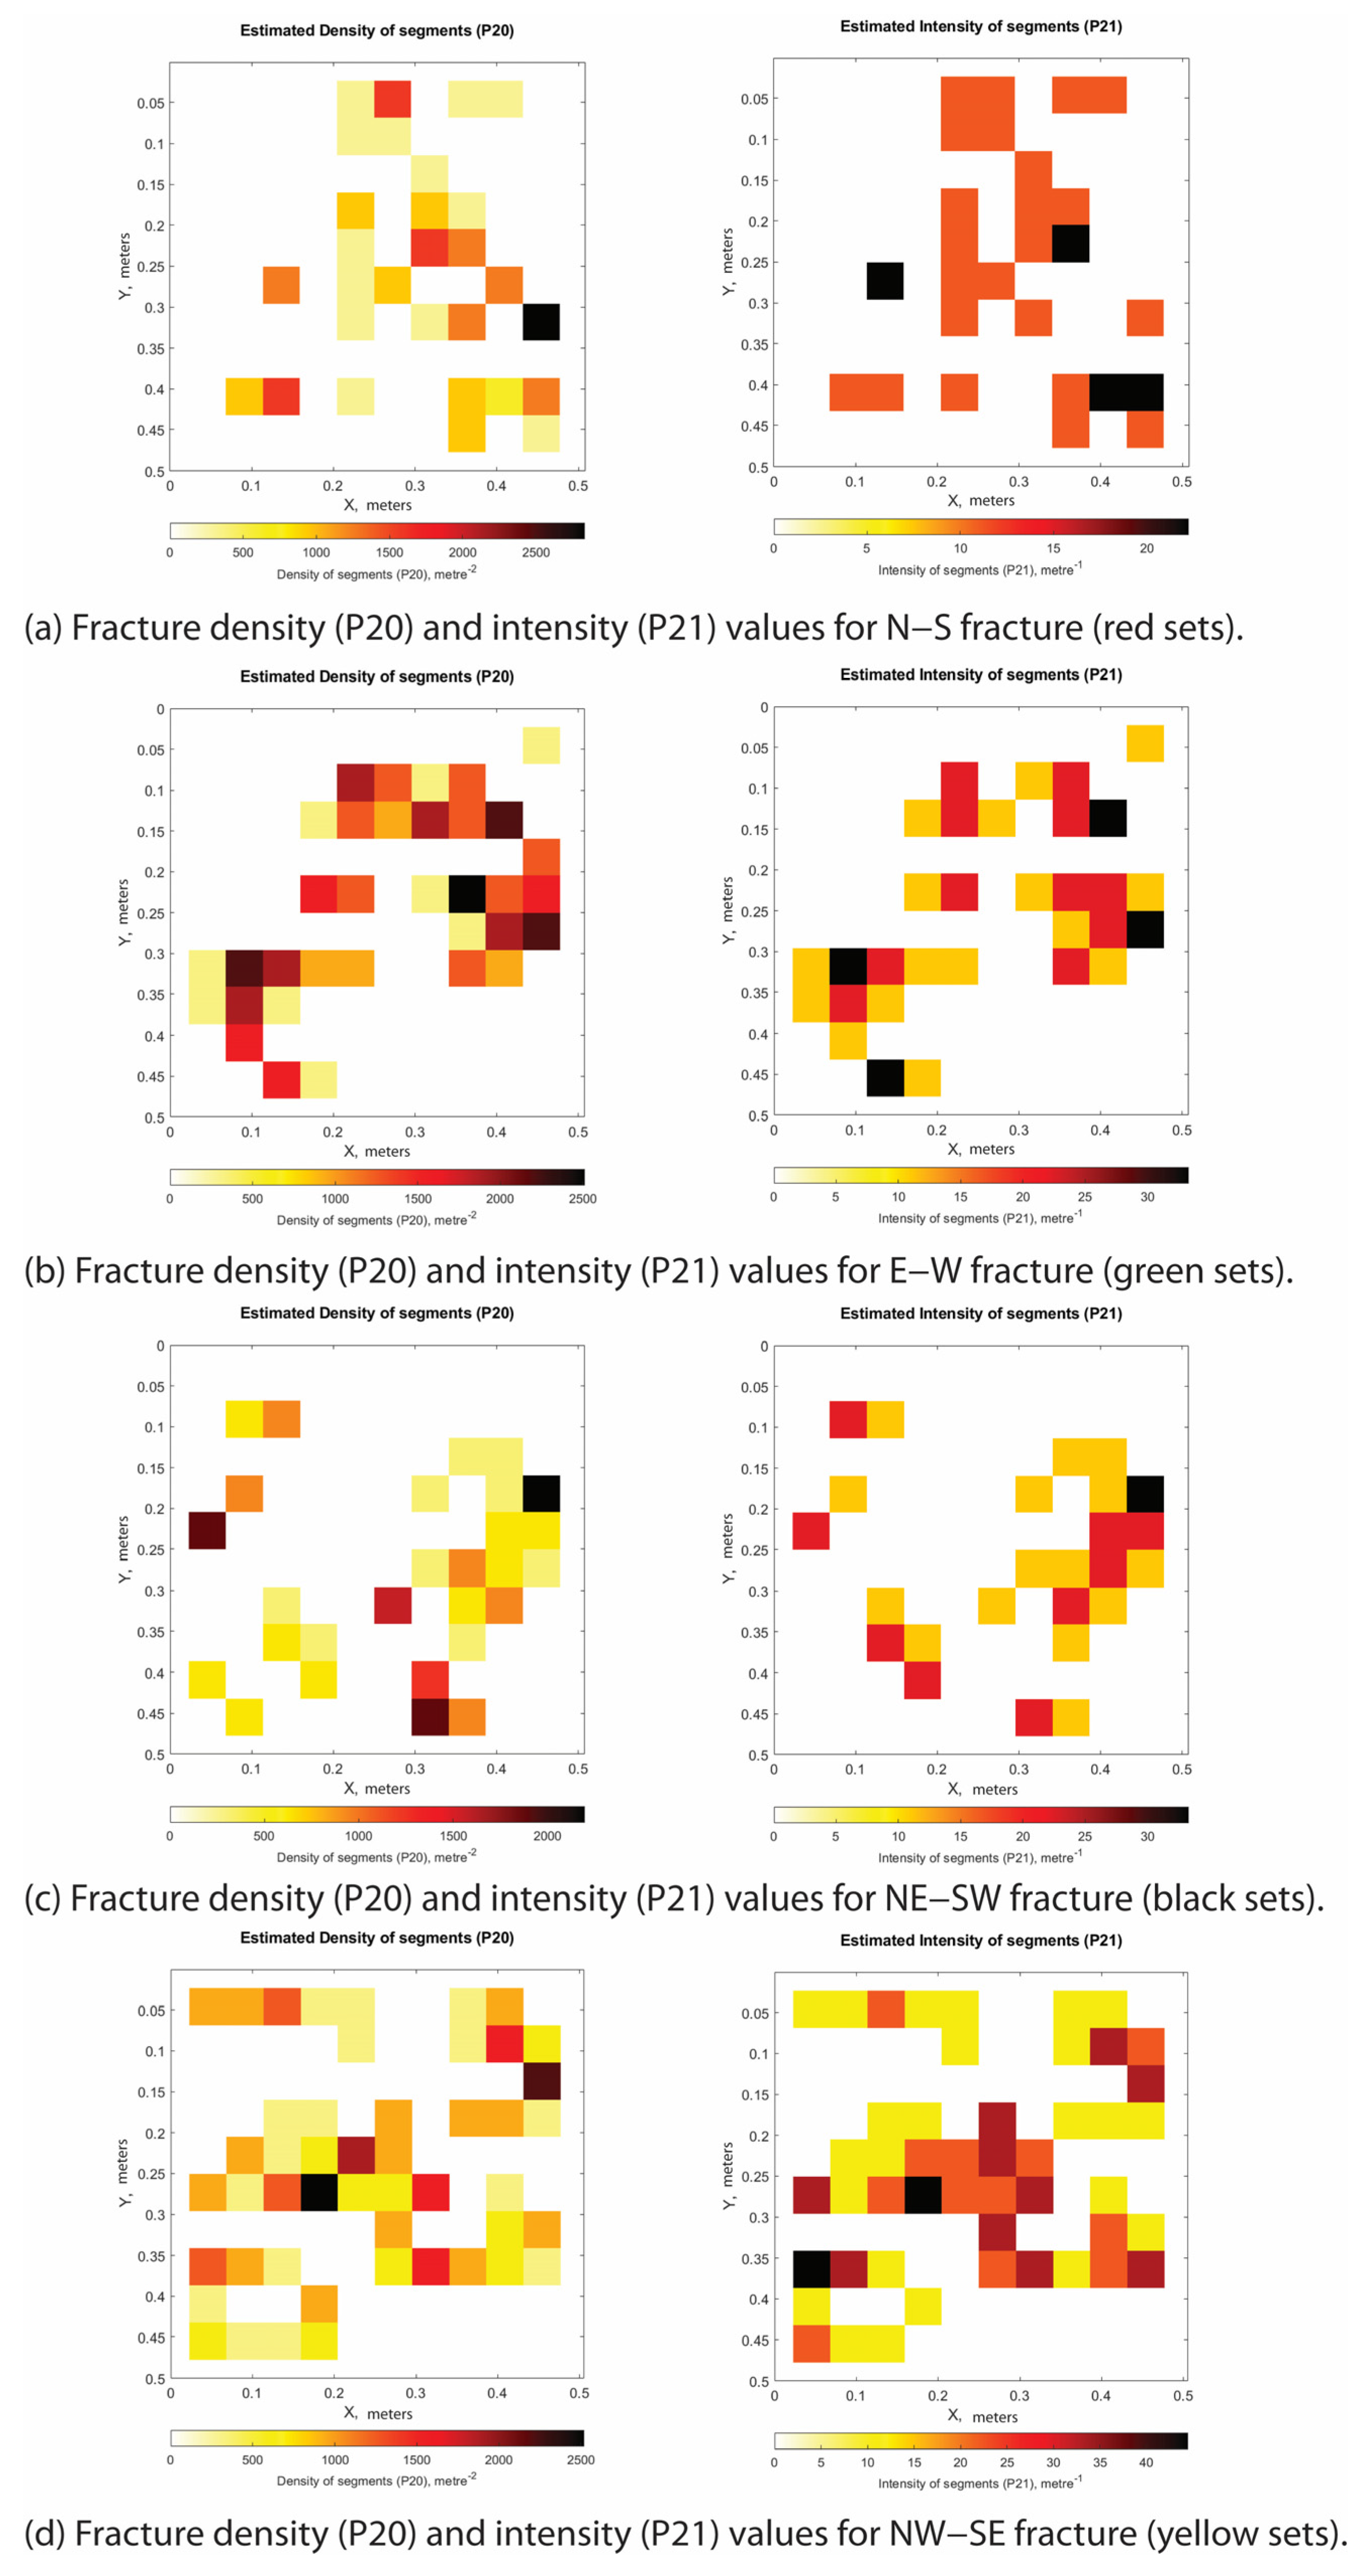
Section A, measuring 0.50 × 0.50 m and being oriented SSE–NNW, is located in the fault footwall block. When all fracture sets are considered together, the fracture density (P20) reaches up to 5000 m−2, and fracture intensity (P21) up to 80 m−1 (Table 1). The P20 and P21 values calculated for the individual fracture sets are presented in Table 2 and reported in Appendix A.1.
Section B, measuring 0.50 × 0.50 m and being oriented SSE–NNW, is located at the fault footwall block. When all fracture sets are considered together, the fracture density, P20, is up to 3000 m−2, and the fracture intensity, P21, up to 60 m−1 (Table 1). The P20 and P21 values computed for the single fracture sets are presented in Table 2, and reported in Appendix A.2.
Section C, measuring 0.50 × 0.50 m and being oriented SSE–NNW, is located at the fault footwall block. When all fracture sets are considered together, the fracture density, P20, is up to 3000 m−2, and the fracture intensity, P21, up to 45 m−1 (Table 1). The P20 and P21 values computed for the single fracture sets are presented in Table 2, and reported in Appendix A.3. There, the sheared fractures (pink) show attitudes of 070/71 and 180/80.
Section D, measuring 0.50 × 0.50 m and being oriented NNW–SSE, is located at the fault hanging wall block. When all fracture sets are considered together, the fracture density, P20, is up to 4000 m−2, and fracture intensity, P21, up to 60 m−1 (Table 1). The P20 and P21 values computed for the single fracture sets are presented in Table 2, and reported in Appendix A.4. There, the main sheared fracture (pink) shows an attitude of 090/32.
Section E, measuring 1.00 × 1.00 m and being oriented NNW–SSE, is located at the fault hanging wall. When all fracture sets are considered together, the fracture density, P20, is up to 900 m−2, and the fracture intensity, P21, up to 25 m−1 (Table 1). The P20 and P21 values computed for the single fracture sets are presented in Table 2, and reported in Appendix A.5. There, the bedding plane (blue) shows a NW–SE strike direction.
4.2.2. Extensional–Transtensional Deformation
Focusing on the structural architecture of NE–SW-striking transtensional faults, we label them as incipient faults (cm-throw), small faults (10 s of cm-throw), and large faults (m-to-10 s of m-throw) in order to document their inner structure and fracture properties.
Incipient Fault
At Station 4 (latitude 40°09′53″ N, longitude 15°59′21″ E), the outcrop strikes ESE–WNW, extends laterally for approximately 7 m, reaches a height of approximately 4.5 m, and exposes a high-angle extensional fault accommodating a throw of about 1 cm (Figure 10). This incipient fault crosscuts carbonate beds striking and dipping between 010/20 and 030/25. To the west, the beds are further dissected by high-angle fractures striking approximately SSE–NNW and NE–SW, as well as by high-angle calcite veins striking N–S to NNE–SSW.
Figure 10.
Station 4 outcrop image showing line drawings with interpretation of transtensional-related deformational structures. Sections A to D showing the values of fracture density (P20) and intensity (P21) computed for single portions of the study outcrop. The stereographic projection of the structural elements shown in the lower right employs the following color code: red (ENE–WSW high-angle fractures), yellow (NW–SE high-angle fractures), green (high-angle random fractures), black (NE–SW high-angle shear fractures), and blue (NNE–SSW high-angle veins).
The central portion of the outcrop exposes slip surfaces 230/75 bearing abrasive striae with a pitch angle of 25°, and slip surfaces 210/55 and 080/55 bearing striae with a pitch angle of 90°. The small-scale graben comprises individual beds that pinch out and are crosscut by N–S striking fractures. Along the eastern portion of the outcrop, beds 030/25 are dissected by high-angle NE–SW striking fractures.
The sections selected for the quantitative assessment of fracture geometry, density, and intensity are reported in Figure 10.
Table 3 and Table 4 show the computed cumulative values for the fracture density (P20) and fracture intensity (P21) of the studied sections and the individual fracture sets. The datasets analyzed are listed in Table 3 and Table 4.
Table 3.
Station 4 sections showing the computed cumulative values for fracture density and fracture intensity.
Table 4.
Station 4 sections, fracture sets and computed values for the fracture density and fracture intensity of individual fracture sets.
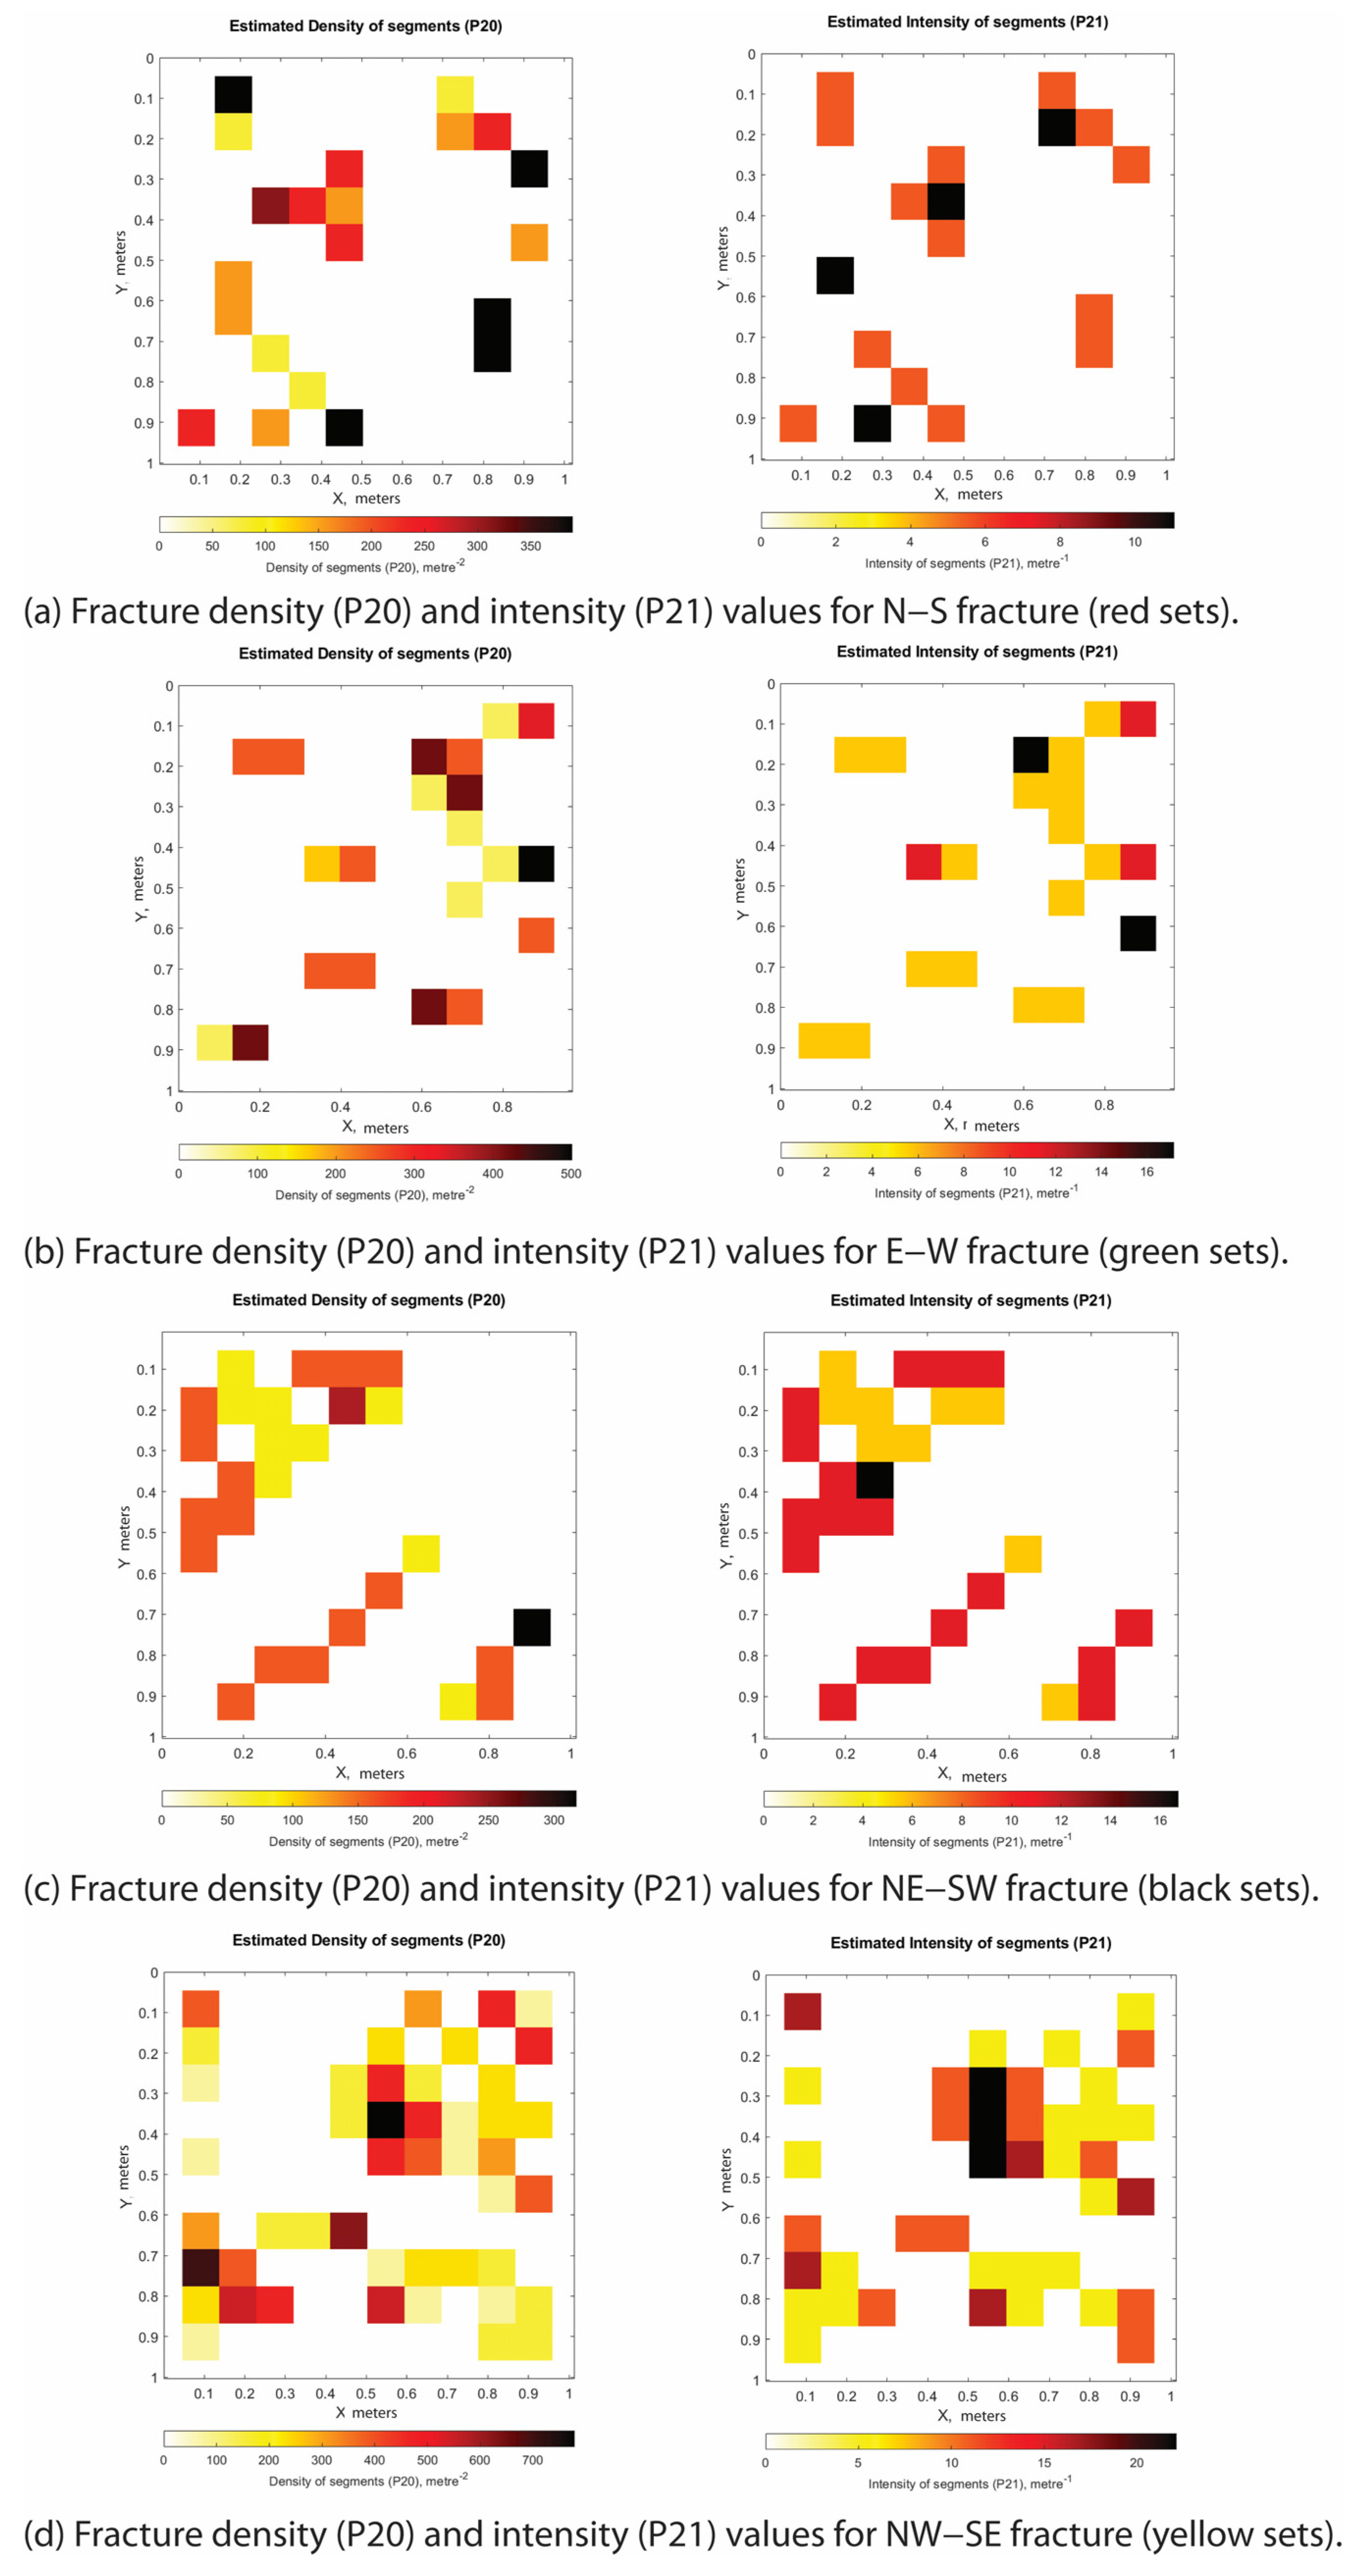
Section A, measuring 0.50 × 0.50 m and being oriented ESE–WNW, is located ca. 50 cm away from the slip surface. When all fracture sets are considered together, the fracture density, P20, is up to 5000 m−2, and the fracture intensity, P21, up to 70 m−1 (Table 3). The P20 and P21 values computed for the single fracture sets are presented in Table 4, and reported in Appendix B.1. There, the slip surfaces (pink) show attitudes of 208/73, 153/52, 310/64 and 360/33.
Section B, measuring 0.50 × 0.50 m and being oriented ESE–WNW, is located close to the main slip surfaces. When all fracture sets are considered together, the fracture density, P20, is up to 3000 m−2, and the fracture intensity, P21, up to 60 m−1 (Table 3). The P20 and P21 values computed for the single fracture sets are presented in Table 4, and reported in Appendix B.2. There, the sheared fractures (pink) have attitudes of 059/75 (synthetic) and 167/60 (antithetic).
Section C, measuring 0.50 × 0.50 m and being oriented ESE–WNW, is located within the structural graben bounded by the slip surfaces. When all fracture sets are considered together, the fracture density, P20, is up to 3000 m−2, and the fracture intensity, P21, up to 70 m−1 (Table 3). The P20 and P21 values computed for the single fracture sets are presented in Table 4, and reported in Appendix B.3. There, the sheared fractures (pink) have attitudes of 028/88, 026/84, 015/65 and 195/29.
Section D, measuring 0.50 × 0.50 m and being oriented ESE–WNW, is located at the fault hanging wall close to the slip surface, and shows three sets of fractures strike ca. ENE–WSW (red), NE–SW (black), and NW–SE (yellow), and random fractures (green). When all fracture sets are considered together, the fracture density, P20, is up to 3500 m−2, and the fracture intensity, P21, up to 70 m−1 (Table 3). The P20 and P21 values computed for the single fracture sets are presented in Table 4 and reported in Appendix B.4. There, the sheared fractures (pink) have attitudes of 040/70, 045/69 and 240/64.
Small Fault
Station 3 (latitude 40°09′55″ N, longitude 15°59′17″ E) consists of a sub-vertical outcrop striking ESE–WNW, approximately 7 m long and 4 m high, exposing vertically persistent slip surfaces 244/78 and 228/66 (Figure 11). These slip surfaces dissect carbonate beds striking and dipping between 095/14 and 090/40 and display throws ranging from 10 cm to 60 cm. Kinematic markers, such as abrasive striae, indicate pure dip-slip extensional movement, with a pitch angle of approximately 90°.
Figure 11.
Station 3 outcrop image showing line drawings with interpretation of transtensional-related deformational structures. Sections A to C showing the values of fracture density (P20) and intensity (P21) computed for single portions of the study outcrop. The stereographic projection of the structural elements shown in the lower right employs the following color code: red (ENE–WSW/N–S high-angle fractures), yellow (NW–SE high-angle fractures), green (E–W low-angle shear fractures), black (NE–SW high-angle shear fractures), and blue (N–S high-angle veins).
The sections selected for the quantitative assessment of fracture geometry, density, and intensity are reported in Figure 11.
Table 5 and Table 6 reports the computed cumulative values for the fracture density (P20) and fracture intensity (P21) of the studied sections and the individual fracture sets. The datasets analyzed are listed in Table 5 and Table 6.
Table 5.
Station 3 sections showing the computed cumulative values for fracture density and fracture intensity.
Table 6.
Station 3 sections, fracture sets and computed values for the fracture density and fracture intensity of individual fracture sets.
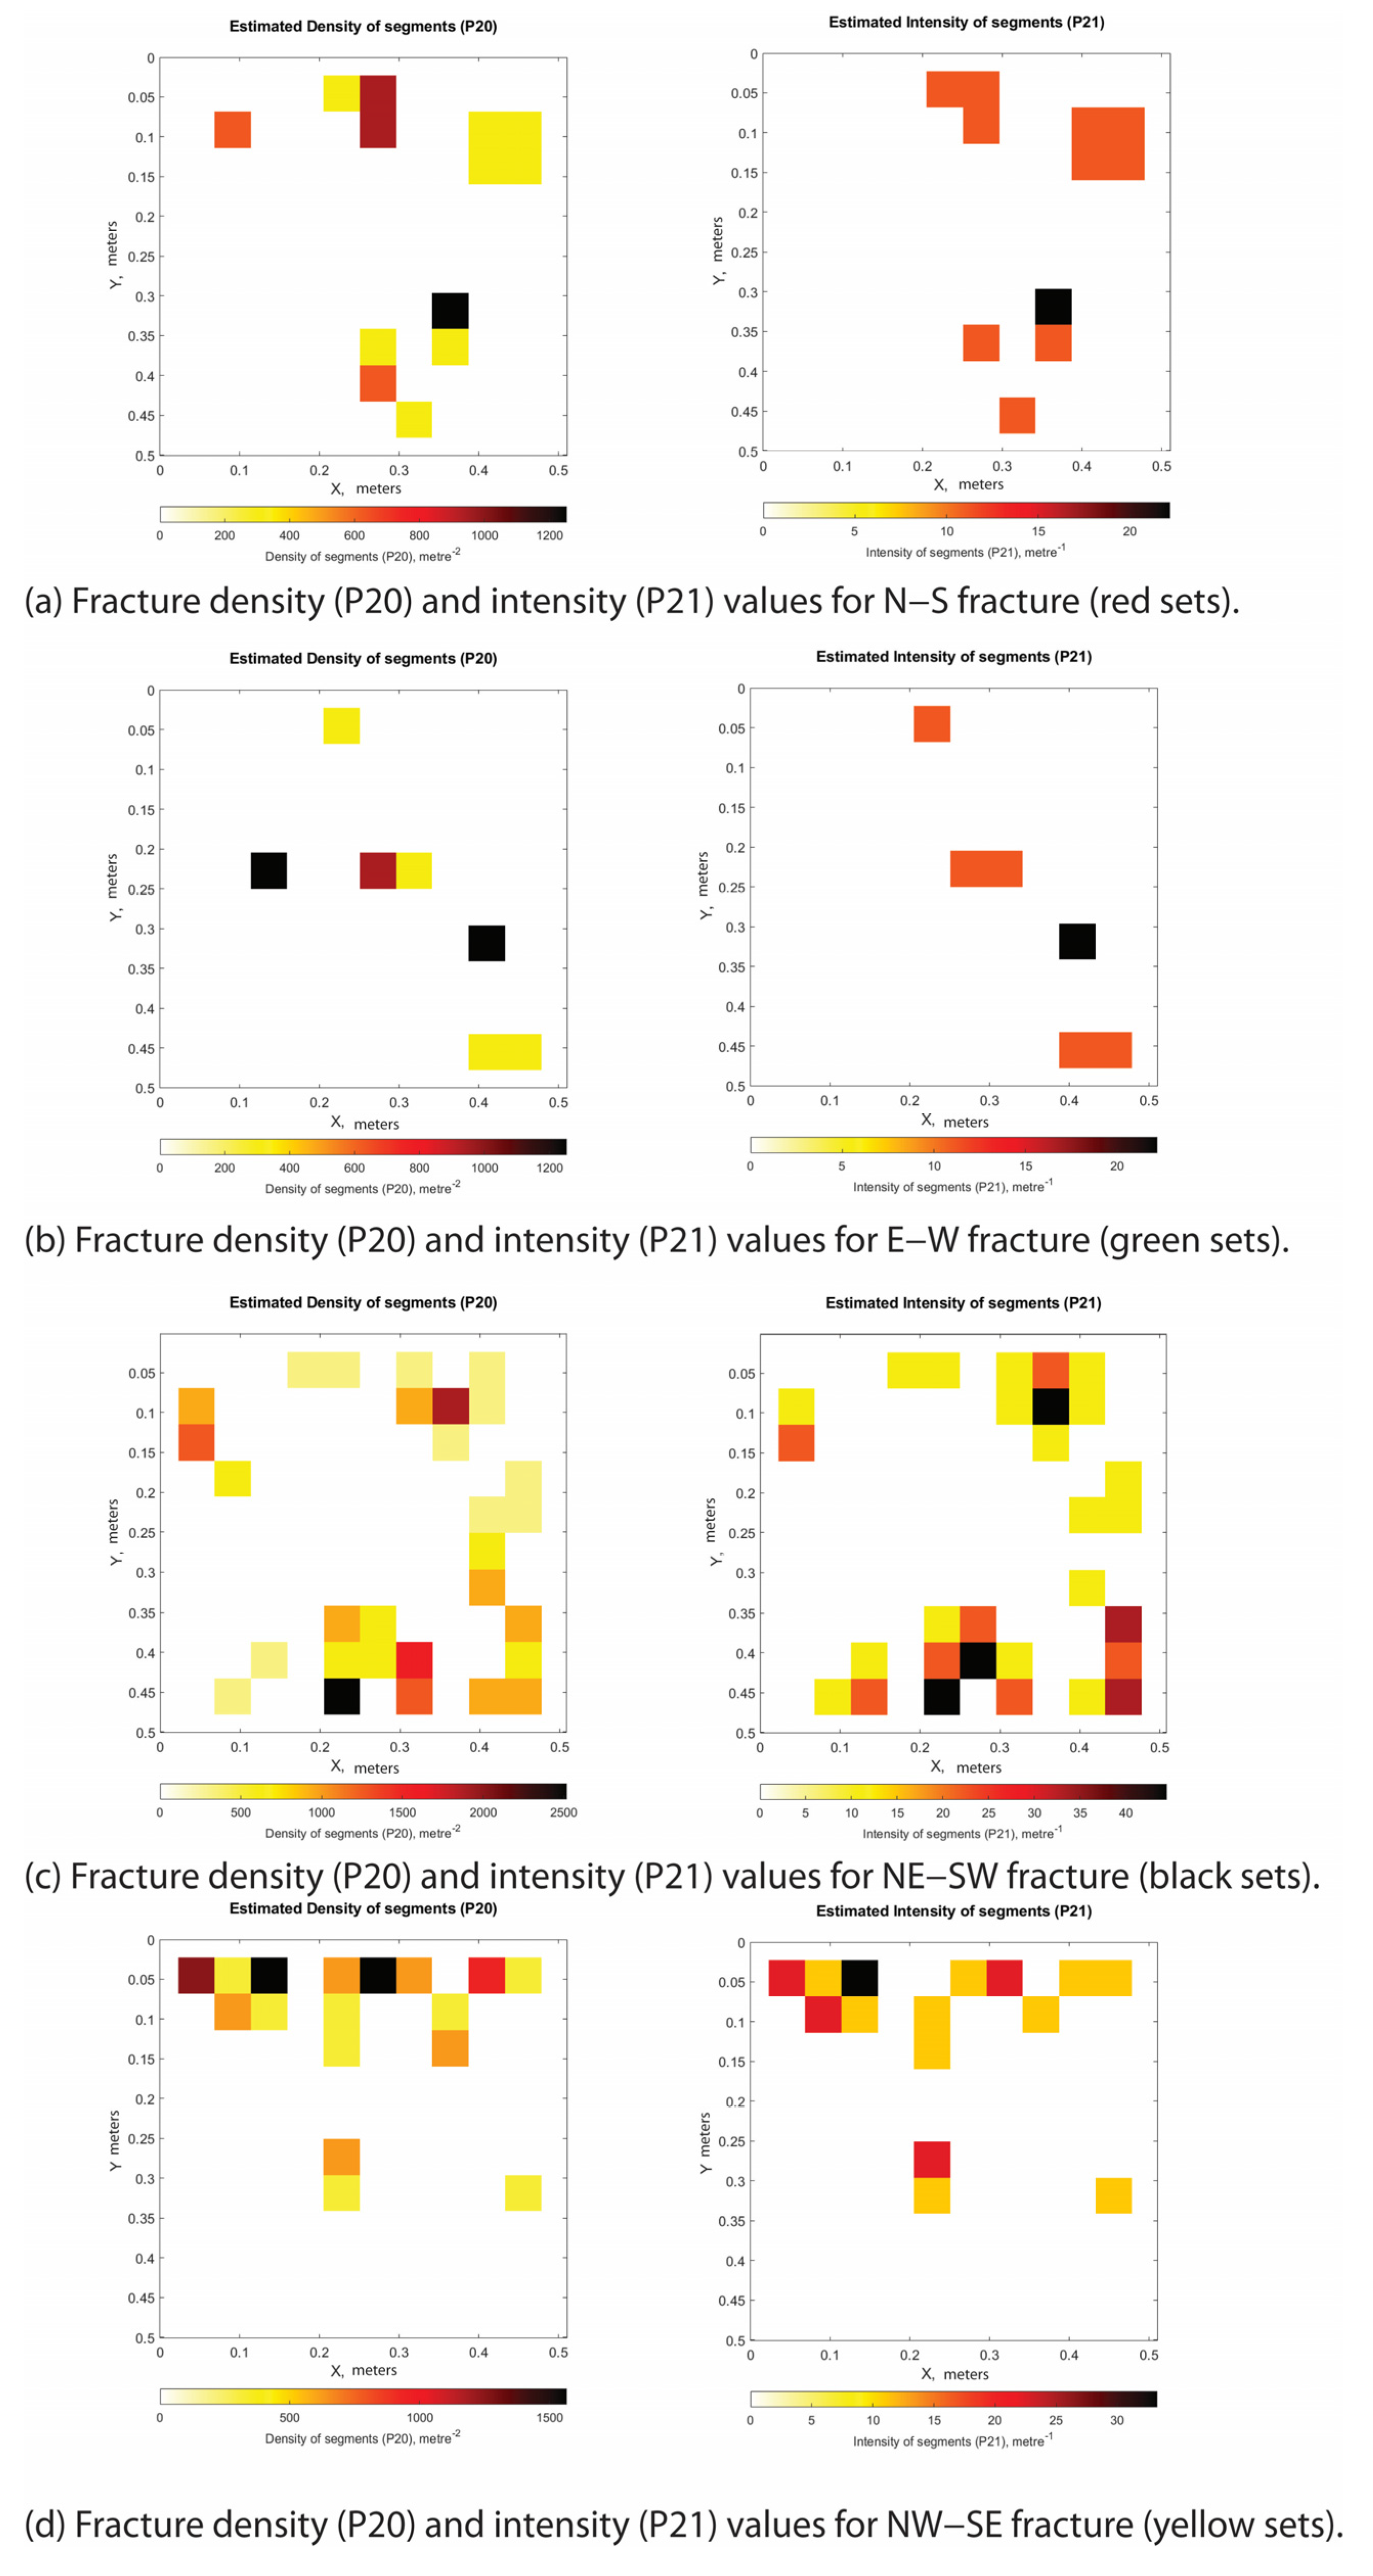
Section A, measuring 1.00 × 1.00 m and being oriented ESE–WNW, is located between the slip surfaces. When all fracture sets are considered together, the fracture density, P20, is up to 2000 m−2, and the fracture intensity, P21, is up to 60 m−1 (Table 5). The P20 and P21 values computed for the single fracture sets are presented in Table 6 and reported in Appendix C.1. There, the sheared fractures (pink) and veins (blue) are also present.
Section B, measuring 1.00 × 1.00 m and being oriented E–W, is located at the fault hanging wall block. When all fracture sets are considered together, the fracture density, P20, is up to 1000 m−2, and the fracture intensity, P21, up to 35 m−1 (Table 5). The P20 and P21 values computed for the single fracture sets are presented in Table 6 and reported in Appendix C.2. There, a sheared fracture (pink) has an attitude of 210/53.
Section C, measuring 1.00 × 1.00 m and being oriented E–W, is located away from the slip surfaces. When all fracture sets are considered together, the fracture density, P20, is up to 1400 m−2, and the fracture intensity, P21, up to 35 m−1 (Table 5). The P20 and P21 values computed for the single fracture sets are presented in Table 6, and reported in Appendix C.3.
Large Fault
At station 1 (latitude 40°09′52″ N, longitude 15°59′22″ E), a vertical outcrop striking SSE–NNW, ca. 8 m long and 4 m high, exposes a portion of a large fault including a main slip surface with abrasive striae showing pronounced right-lateral transtensional kinematics (Figure 12). In fact, the 220/74 main slip surface is characterized by a pitch of 142° and crosscuts a fault core including both cohesive and uncohesive carbonate fault rocks. Cohesive fault rocks show a small amount of matrix, up to ca. 50%. Differently, the uncohesive rocks are made up of fragments in contact with each other, and with angular to sub-angular geometries. The damage zone includes multiple synthetic slip surfaces characterized by varying dip angles. The southeastern fault damage zone is crosscut by high-angle fractures striking NW–SE and N–S, and the northwestern damage zone by high-angle fractures NW–SE, N–S, SSE–NNW, and SSW–NNE. In the latter portion, the carbonate beds show an attitude of 355/10. The single sections studied for a quantitative assessment of fracture geometry, density and intensity are reported in Figure 12.
Figure 12.
Station 1 outcrop image showing line drawings with interpretation of transtensional-related deformational structures. Sections A to D showing the values of fracture density (P20) and intensity (P21) computed for single portions of the study outcrop. The stereographic projection of the structural elements shown in the lower right employs the following color code: red (NNE–SSW/SW–NE high-angle fractures), yellow (NW–SE high-angle fractures), green (E–W low-angle shear fractures), and black (NE–SW high-angle shear fractures).
Table 7 and Table 8 include the computed cumulative values for the fracture density (P20) and fracture intensity (P21) of the studied sections and the individual fracture sets. The datasets analyzed are listed in Table 7 and Table 8.
Table 7.
Station 1 sections showing the computed cumulative values for fracture density and fracture intensity.
Table 8.
Station 1 sections, fracture sets and computed values for the fracture density and fracture intensity of individual fracture sets.
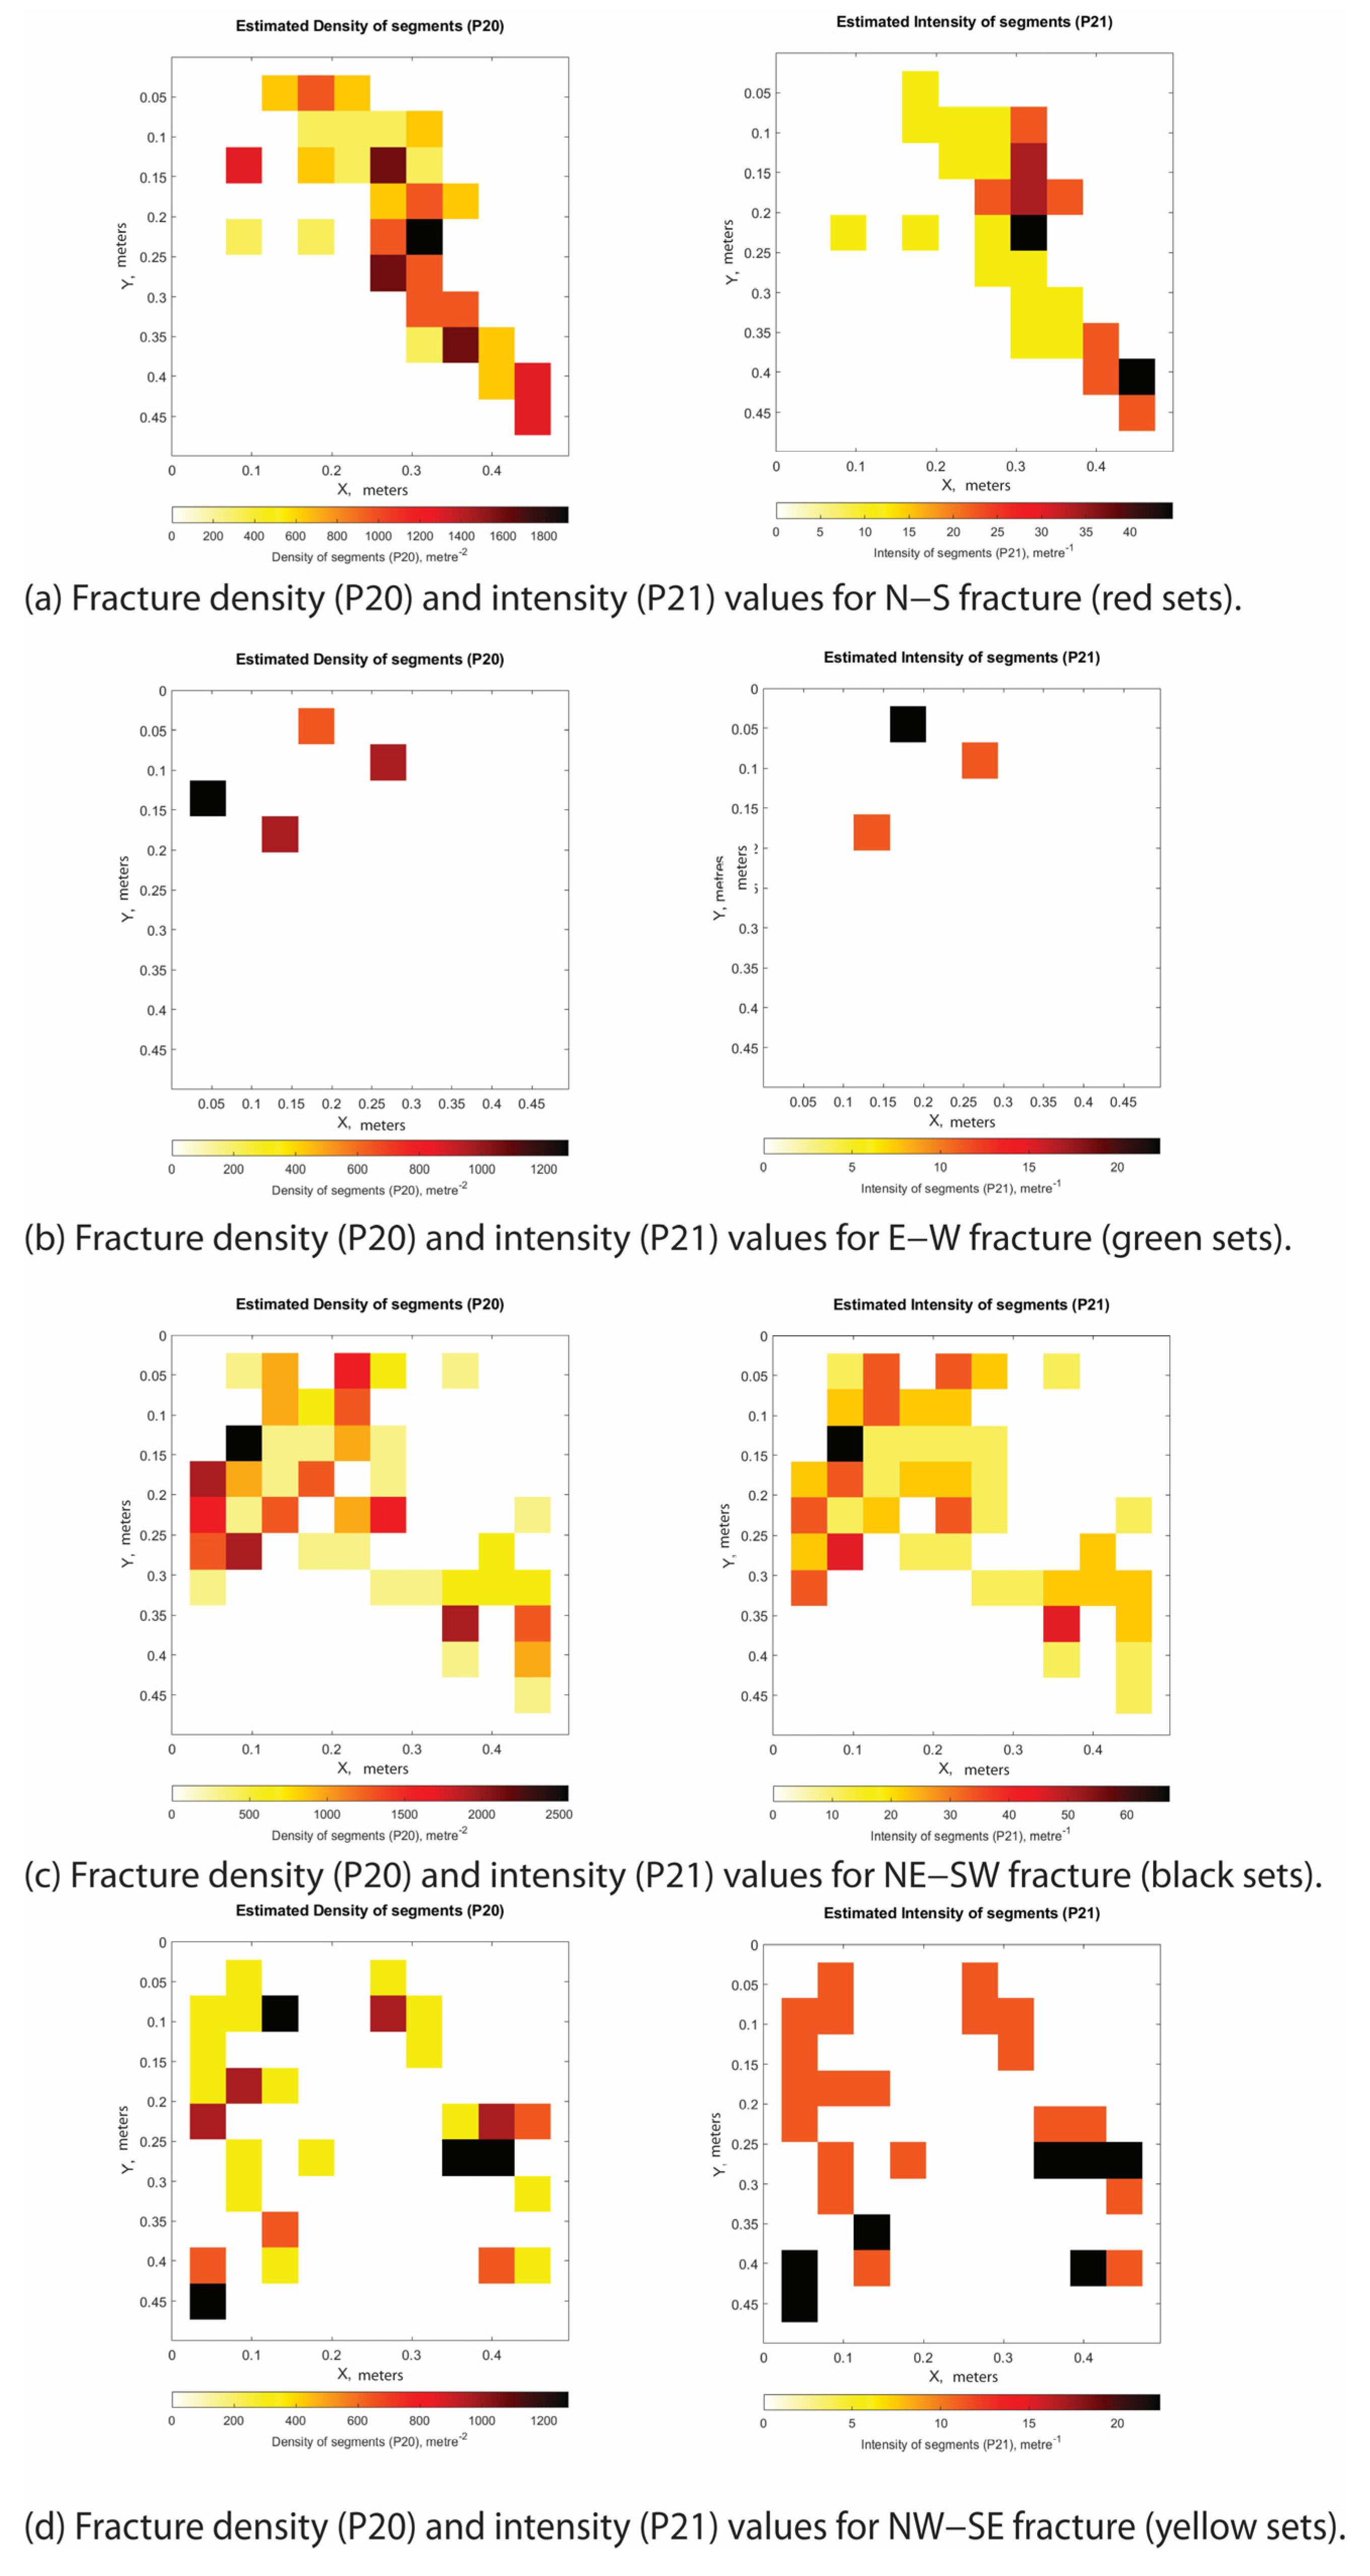
Section A, measuring 1.00 × 1.00 m and being oriented SSE–NNW, is located at the fault footwall block. When all fracture sets are considered together, the fracture density, P20, is up to 2000 m−2, and the fracture intensity, P21, up to 60 m−1 (Table 7). The P20 and P21 values computed for the single fracture sets are presented in Table 8 and reported in Appendix D.1.
Section B, measuring 0.50 × 0.50 m and being oriented SE–NW, is located within the fault core. When all fracture sets are considered together, the fracture density, P20, is up to 5000 m−2, and the fracture intensity, P21, up to 100 m−1 (Table 7). The P20 and P21 values computed for the single fracture sets are presented in Table 8 and reported in Appendix D.2. There, shear fractures (pink) have attitudes of 150/73 and 165/68.
Section C, measuring 1.00 × 1.00 m and being oriented SE–NW, is located in the hanging wall damage zone. When all fracture sets are considered together, the fracture density, P20, is up to 1500 m−2, and the fracture intensity, P21, up to 40 m−1 (Table 7). The P20 and P21 values computed for the single fracture sets are presented in Table 8 and reported in Appendix D.3. There, the shear fractures (pink) have attitudes of 250/30, 010/80 and 135/45.
Section D, measuring 1.00 × 1.00 m and being oriented SE–NW, is located in the hanging wall damage zone, about 3.5 m away from the slip surfaces where bedding is clearly visible. When all fracture sets are considered together, the fracture density, P20, is up to 1200 m−2, and the fracture intensity, P21, up to 35 m−1 (Table 7). The P20 and P21 values computed for the single fracture sets are presented in Table 8 and reported in Appendix D.4.
5. Discussion
The Cretaceous carbonates of the High Agri Valley underwent a polyphase tectonic evolution that generated multiple fracture networks, whose formation and development were affected by the prolonged diagenetic evolution and the progressive modification of the mechanical properties of the host rocks. The following sections discuss the data reported in this work to assess the deformation style and fault structural architecture of the carbonates, as well the geometrical properties and spatial distribution of the outcropping fracture networks.
5.1. Deformation Style and Fault Structural Architecture
5.1.1. Thrusting Deformation
Overall, the aforementioned evidence, together with the large-scale geometries of the carbonate beds documented along the cliff of the Raganello Creek (cf. Figure 5), are consistent with thrusting and a fault-bend folding deformation style [37]. Intra-carbonate thrusting produced anticline and syncline folds within the carbonate beds not parallel to the slip surfaces (cf. Figure 6 and Figure 7) and was recorded by abrasive striation and fault brecciation consistent with top-to-the-south transport directions [38]. At site XX (Figure 6b), the intra-carbonate thrust forms a hanging wall ramp, whereas at site YY (Figure 7), another intra-carbonate thrust displays a footwall ramp structural configuration. At Station 2, we documented an intra-carbonate thrust forming hanging wall and footwall flats (cf. Figure 9) that did not produce any ramp-related geometries within the carbonate beds. Accordingly, the aforementioned evidence enhances the current understanding of thrust tectonics affecting the Apenninic Platform in the High Agri Valley, which involved the rotation and translation of rigid carbonate blocks [8,9,11]. In addition, as already documented at the nearby Viggiano Mt. site [1], the presence of multiple shale-rich interfaces in the study area promoted the development of thrust-related folds along secondary thrust faults displacing the Cretaceous platform carbonates. We note that the aforementioned thrust-related flat and ramp geometries are due to the depositional and diagenetic stratigraphic setting of the carbonate multilayer. Ramps localize along low-angle dipping beds and/or crosscutting multiple carbonate beds, whereas flats occur within the shale-rich interbeds. At a larger scale, a similar thrust-related deformation style has been documented in fractured Mesozoic basinal carbonates of the southern Apennines, particularly at the Monte Caldarosa, Monte Enoc, and Cognone sites within the High Agri Valley Basin [39].
In terms of the fracture assemblage associated with thrusting, the bed-perpendicular stylolites (cf. Figure 6d) are interpreted as due to layer-parallel shortening [40,41,42,43], which is a common mechanism for platform carbonates involved in fold-and-thrust belts [44,45]. Formation of bed-parallel, low-angle to bedding barren fractures and veins is interpreted as due to flexural slip of the carbonates [46]. In this case, the orientation of fractures and veins relative to the thrust faults is consistent with widely accepted models of fault-related folding [47,48] and similar to data documented in platform carbonates of central Italy [49,50].
5.1.2. Extensional–Transtensional Deformation
The high-angle extensional–transtensional faults display predominant NW–SE and NE–SW strike directions (cf. Figure 3a, Figure 4 and Figure 8), closely matching those reported for the Monti della Maddalena Fault System bounding the western margin of the High Agri Valley [5,6,26,51,52], just north of the Raparo Mt. study area.
Focusing on the structural architecture of faults accommodating centimeter-scale throw (incipient faults), these structures comprise joints and sheared joints that are largely compartmentalized within individual carbonate beds (cf. Figure 10). The slip surfaces, which are not vertically persistent, form a conjugate system that crosscuts multiple beds and is characterized by variable dip angles. Fault rock is absent, whereas the damage zone is thin and discontinuous. Within the damage zone, two main sets of high-angle barren fractures striking SSE–NNW and NE–SW, together with high-angle N–S- to NNE–SSW striking veins, dissect the carbonate beds.
The N–S-striking fractures and veins are concentrated within the small-scale graben bounded by the conjugate slip surfaces and are therefore interpreted as fault-related structures. This interpretation is consistent with the minor horizontal displacement component recorded along the extensional slip surfaces [53]. Conversely, the NE–SW-striking slip surfaces are interpreted as resulting from shearing along pre-existing strata-bound fractures, as previously proposed for shallow-water carbonates in central Italy [44] and southern Italy [1,3,54]. The carbonates are also dissected by bed-parallel barren fractures, which are interpreted as inherited structures related to the earlier thrusting tectonics.
Small faults with 10 s of cm throw are characterized by through-going, planar slip surfaces bounded by discontinuous pods of fault rocks flanked by laterally continuous damage zones (Figure 11). Irrespective of the clay-rich interbeds, the along-dip slip surface geometry does not vary across the outcrop. The fault rock is made up of highly fragmented and brecciated carbonates, which mainly localize at the intersections among slip surfaces and carbonate beds. At the mesoscale, smearing of the clayish interfaces along the slip surfaces is not observed. Fractures and veins are mainly sub-parallel to the slip surfaces, showing a ca. NE–SW strike direction. En-echelon fractures striking ca. N–S localize above a ca. NNE–SSW striking extensional shear fracture (cf. Figure 11), consistent with minor horizontal components of slip along the small faults. A similar structural configuration was documented for 10 s of cm throw transtensional faults crosscutting ramp carbonates of central Italy [55] and platform carbonates of southern Italy [2]. There, the high-angle en-echelon fractures localize at the lateral edges of individual slip surfaces. Similar to incipient faults, sub-horizontal barren fractures are interpreted as due to previous thrust tectonics [44].
Large faults exhibiting amount of throws up to 10 s of meters include vertically continuous fault rocks flanked by 10 s of m wide damage zones (Figure 12). The fault rocks consist of both cohesive and uncohesive carbonate rocks. The former rocks are classified as protocataclasites and cataclasites [56], in which the amount of matrix is respectively negligible or up to ca. 50%. The uncohesive rocks consist of fault breccia, in which the fragments are in contact with each other and show angular to sub-angular geometries. The damage zone includes multiple slip surfaces synthetic to the main one and characterized by varying dip angles. The fault damage zone is crosscut by high-angle fractures mainly striking NW–SE and N–S, whose distribution with respect to the single edges of individual slip surfaces is unknown. We note that the hanging wall damage zone still preserves the bedding traces, whereas these traces are no longer visible within the footwall damage zone. Accordingly, we interpret the study outcrop as pertaining to the lower portion of an exhumed fault zone in which dilation localized along the lower extensional quadrant [57].
5.2. Fracture Geometrical Properties and Spatial Distribution
5.2.1. Thrusting-Related Fractures
Across the intra-carbonate thrust fault, the cumulative 2D fracture density (P20) and intensity (P21) attain their highest values within the footwall damage zone (Section A: P20 up to 5000 m−2; P21 up to 80 m−1) and decrease to their lowest values within the hanging wall damage zone (Section E: P20 up to 900 m−2; P21 up to 25 m−1) (Figure 13). Fractures are predominantly concentrated within the fault footwall, as indicated by the high P20 values. Consequently, their spatial distribution does not conform to the commonly reported symmetrical decrease in fracture density away from the main slip surface [58,59,60,61,62,63].
Figure 13.
Conceptual sketch illustrating the thrust fault zone architecture and sections studied for variations in fracture density and intensity. Cumulative plots of the highest P20 and P21 values computed for all sections in Station 2.
Immediately below the main slip surface (Section C, Figure 9), low-angle E–W striking fractures and veins are interpreted as thrust-related structures owing to their low cut-off angles [1]. Furthermore, high-angle NW–SE- and N–S striking fractures occur adjacent to the main slip surface and consistently crosscut the E–W fractures and veins (Figure 9). These structures are therefore interpreted as the result of post-thrusting deformation.
Within the footwall damage zone, the cumulative P20 and P21 attain their highest values in the vicinity of the fault core and show a positive correlation, indicating that the fracture density and intensity increase proportionally (Section A, Figure 9). The high-angle SSW–NNE- and NE–SW-striking fracture sets (Appendix A) are the principal contributors to this relationship and consistently crosscut the low-angle E–W fractures and veins. Accordingly, these fractures are interpreted as the products of post-thrusting shearing along high-angle planes that progressively coalesced through linkage [54,64], while simultaneously promoting the development of new fault-related fractures around their tip lines [50,65].
Away from the main slip surface (Section B, Figure 9), the cumulative P20 and P21 display an inverse relationship. This behavior is primarily controlled by the high-angle NW–SE striking fractures (Appendix A), which substantially increase the computed P20 values while contributing less markedly to P21. These fractures are therefore interpreted as structures that nucleated within the carbonate succession independently of localized shear deformation [1].
Within the hanging wall damage zone, away from the fault core (Sections D and E, Figure 9), the cumulative P20 and P21 show a positive correlation. This relationship is primarily controlled by the high-angle NNE–SSW- and NE–SW striking fracture sets (Figure 9; Appendix A). To explain this correlation, we invoke the same mechanism proposed for the corresponding fracture sets within the footwall damage zone.
In the vicinity of the main slip surface (Section D, Figure 9), clusters of low-angle E–W-striking fractures and veins are interpreted as thrust-related structures [1].
5.2.2. Extensional–Transtensional-Related Fractures
Incipient Fault Zones
Within the investigated fault zone, the slight variations of the cumulative P20 and P21 values (Figure 14) are mainly due to the high-angle ENE–WSW and NE–SW fractures that cluster in the vicinity of the slip surfaces (Appendix B), and to the high-angle NNE–SSW and NE–SW fractures present away from them (Appendix B). According to the low cut-off angles they form with the slip surfaces, we interpret these fractures as due to faulting processes [66,67]. Moreover, the direct proportionality among the cumulative P20 and P21 is associated with their growth by linkage, and localized new fault-related fractures around their tip lines.
Figure 14.
Conceptual sketch illustrating the incipient fault zone and sections studied for variations in fracture density and intensity. Cumulative plots of P20 and P21 for all sections in Station 4.
At the intersections among the conjugate slip surfaces (Figure 14; section C) we document higher P20 and P21 values due to the presence of high-angle ENE–WSW and NNE–SSW fractures and veins (Figure 10; Appendix B). Higher P20 values are consistent with previous works on conjugate faults [68] and zones of fault interaction [69]. In the vicinity of the slip surfaces, both hanging wall and footwall damage zones are characterized by higher P20 and lower P21 values with respect to the fractured volumes around (Figure 14; section D). The P20–P21 inverse correlation is associated with the high-angle ENE–WSW and NE–SW fractures (Figure 10, Appendix B), which are therefore interpreted as due to fractures that enucleated within the carbonates but did not localize around any shear fracture [1].
Small Fault Zone
Within the studied fault zone, the cumulative P20 and P21 attain their highest values at the intersection between the slip surfaces and their lowest values within the hanging wall damage zone (Figure 11). At the intersection zone, the computed values are primarily controlled by the high-angle NE–SW- and ENE–WSW-striking fracture sets (Figure 11; Appendix C). The NE–SW-striking fractures, which are antithetic to the main slip surfaces (Figure 11; Appendix C), are characterized by high P20 and low P21 values, whereas the ENE–WSW-striking fractures exhibit low P20 and high P21 values.
Accordingly, the NE–SW striking fractures are interpreted as the products of fracture nucleation, whereas the ENE–WSW striking fractures are interpreted as the result of fracture growth through the linkage and coalescence of pre-existing fractures [65].
At the hanging wall damage zone, low P20 and high P21 values are documented (Figure 15). There, the NE–SW barren fractures are antithetical to the shear plane and the NW–SE shear fractures synthetic to the shear plane are responsible for the increase in the density values. Specifically, the NE–SW fractures are also associated with an increase in fracture intensity (P21), for which we suggest the growth of shear planes due to the coalescence (linkage) of pre-existing fractures, while the NW–SE shear fractures do not display any significant variation of P21, suggesting their formation as new fault-related structural elements [65]. Away from the slip surfaces, variations in P20 and P21 values (Figure 15; section C) are attributed to the influence of the E–W and N–S fractures and veins (Figure 11; Appendix C). The low-angle E–W fractures are cross-cut by the N–S high angle fractures, for which we suggest the growth of shear planes due to the coalescence (linkage) of pre-existing fractures. Furthermore, the N–S veins show both high- and low-angles of dip. The latter ones are interpreted as due to contractional deformation, whereas the former ones are due to transtension [8].
Figure 15.
Conceptual sketch illustrating the small fault zone and sections studied for variations in fracture density and intensity. Cumulative plots of P20 and P21 for all sections in Station 3.
Large Fault Zone
Within the investigated fault zone, the highest and lowest cumulative P20 and P21 are respectively recorded within the fault core, and at the hanging wall damage zone away from the main slip surface (Figure 16). Within the fault core, the high-angle fractures striking NE–SW and low-angle NW–SE crosscut the low-angle E–W fractures (Figure 12 and Figure 16) and record high P20 and P21 values. Accordingly, we interpret the high-angle NE–SW fractures as syn-kinematic with the fault [70,71], while the low-angle NW–SE fractures are syn-thrusting [44,72]. At the footwall damage zone, we observed high P21 and low P20 (Figure 16; section A). Specifically, the NW–SE and N–S fractures are interpreted as shear fractures due to the coalescence by linkage of pre-existing fractures [65]. Similarly, at the hanging wall damage zone we note a high fracture density (P20) and low fracture intensity (P21) (Figure 16; section C). Specifically, the SW–NE fractures show high P20 values, while the ENE–WSW fractures show low P21 values. The rock volume exhibiting traces of bed interfaces shows low P20 and high P21 values (Figure 16; section D). There, the predominant SW–NE and ENE–WSW fractures are interpreted as shear fractures that grew by the linkage of pre-existing fractures which did not localize any small fracturing around [65].
Figure 16.
Conceptual sketch illustrating the large fault zone and sections studied for variations in fracture density and intensity. Cumulative plots of P20 and P21 for all sections in Station 1.
6. Conclusions
In this study, we integrated field-based and digital outcrop structural analysis to assess the deformation style, fault architecture, and fracture-network properties of the well-layered, faulted Cretaceous platform carbonates exposed in the Castelsaraceno area of the Raparo Mt., southern Italy. By combining qualitative observations with quantitative fracture analysis, we documented that the fracturing processes were due to the superposition of a polyphase tectonic evolution modifying the carbonate mechanical stratigraphy through time. The studied outcrops constitute a representative analogue for contractional and extensional–transtensional deformation that affected the carbonates pertaining to the axial zone of the southern Apennines fold-and-thrust belt. The results have direct implications for the characterization of fracture permeability anisotropy and fluid-flow compartmentalization in structurally analogous reservoirs of the southern Apennines. The main conclusions of the present study are the following:
- Contractional deformation is expressed by a fracture assemblage that comprises bed-perpendicular stylolites produced by layer-parallel shortening, and bed-parallel and low-angle barren fractures and veins attributed to thrusting-related flexural slip of the carbonates. The geometry and distribution of these structures were governed by the mechanically heterogeneous stratigraphy of the carbonate multilayer, whose mechanical properties were progressively modified during contractional deformation.
- Intra-carbonate thrusting accommodated top-to-the-south transport, as recorded by abrasive striations along the main slip surfaces, and produced anticline and syncline folds associated to ramp and flat geometries of the thrust faults consistent with the fault-bend fold model. Hanging wall ramps, footwall ramps, and hanging wall and footwall flat geometries are visible at large scales by means of digital structural analysis of the studied Raganello Creek walls. The location of ramps and flats was governed by the mechanical stratigraphy of the carbonate multilayer. The thrust ramps cut across the competent limestone beds, whereas the flats nucleated and developed within the shale-rich interlayers.
- The studied NE–SW-striking high-angle extensional–transtensional faults were classified by throw variation into incipient (ca. 1 cm or less), small (ca. 10 to 60 cm), and large (up to 10 s of m) structural elements. With increasing throw, the fault zones show a displacement-dependent progression from isolated, vertically compartmentalized slip surfaces crosscutting individual beds (incipient fault), to slip surfaces displacing single bed packages and localizing small pods of fault rocks flanked by laterally continuous damage zones (small fault), to vertically continuous persistent slip surfaces bounding m-thick fault cores made up of cataclastic and brecciated carbonates (large fault).
- Crosscutting relations show that contractional deformation predated extensional–transtensional deformation. Accordingly, two distinct forms of structural inheritance were documented within the extensional–transtensional structures. The sub-horizontal, bed-parallel fractures and veins were interpreted as relicts of previous thrust tectonics, and the NE–SW-striking slip surfaces as due to their nucleation along sheared, pre-existing, strata-bound fractures.
- Across the intra-carbonate thrust, both fracture density (P20) and intensity (P21) values were documented higher within the footwall damage zone and lower within the hanging wall damage zone. The resulting fracture distribution was strongly asymmetric, and did not conform to the symmetrical decrease in fracture density away from the main slip surfaces. Low-angle E–W fractures and veins are interpreted as thrust-related, whereas the crosscutting high-angle NW–SE and N–S sets record post-thrusting deformation.
- In the small and large extensional–transtensional faults, both the P20 and P21 values attained their highest values within the fault cores and damage zones, consistent with established trends. In the incipient faults, which lack fault rock, the highest values occurred at the intersections of conjugate slip surfaces. Across all studied faults, high P20 values with comparatively low P21 values were interpreted as due to fault-related fracture nucleation within the carbonates. High P21 values with low P20 values were interpreted as due to fracture growth and coalescence through the linkage of pre-existing through-going fractures, whereas positive P20–P21 correlations were due to superposition of the linkage of pre-existing fractures, and concurrent formation of new fault-related fractures around tip lines.
Collectively, the results reported in this work documented that mechanical stratigraphy and polyphase tectonic inheritance exerted a primary control on fracture network architecture and heterogeneity within the studied Cretaceous carbonates. However, the present analysis was based on 2D fracture metrics (P20 and P21) derived from outcrop transects; future work should target 3D fracture connectivity and integrate the fracture attribute data documented here into discrete fracture network and permeability models. Finally, this work first reported the presence of tar-rich, hydrocarbon-impregnated syn-sedimentary breccia laterally continuous over hundreds of meters within the outcrop belt. There, hydrocarbon impregnation was found in both clasts and calcite-rich hairline veins. A dedicated sedimentological and mineralogical study is recommended to better assess the modalities of hydrocarbon formation and entrapment within the studied limestone rocks.
Author Contributions
Conceptualization, A.M.K., F.A. and G.P.; methodology, F.A., G.P., E.R., I.B.A. and A.M.K.; software, I.B.A., E.R. and A.M.K.; validation, F.A. and G.P.; formal analysis, A.M.K., F.A., G.P., E.R. and I.B.A.; investigation, A.M.K., E.R., F.A., I.B.A. and G.P.; resources, F.A. and G.P.; data curation, A.M.K., I.B.A., E.R., F.A. and G.P.; writing—original draft preparation, A.M.K., E.R. and F.A.; writing—review and editing, A.M.K., I.B.A., F.A. and G.P.; supervision, F.A. and G.P. All authors have read and agreed to the published version of the manuscript.
Funding
Funding from the Reservoir Characterization Project (www.rechproject.com), and the Geological, Structural and Hydrogeological Study of the Right Side of the High Agri Valley projects.
Data Availability Statement
Data will be made available on request.
Acknowledgments
The first author acknowledges the support received in the field from Canio Manniello and Carmela Emanuela Taddeo, ER the help provided by Fabio Olita with the FracPaq software.
Conflicts of Interest
The author declares no conflict of interest.
Appendix A. Station 2: Thrust Fault Zone
Appendix A.1. Thrust Fault Zone Section A Individual Fracture Sets and Their P20 and P21 Values
Appendix A.2. Thrust Fault Zone Section B Individual Fracture Sets and Their P20 and P21 Values
Appendix A.3. Thrust Fault Zone Section C Individual Fracture Sets and Their P20 and P21 Values
Appendix A.4. Thrust Fault Zone Section D Individual Fracture Sets and Their P20 and P21 Values
Appendix A.5. Thrust Fault Zone Section E Individual Fracture Sets and Their P20 and P21 Values
Appendix B. Station 4: Incipient Fault Zone
Appendix B.1. Incipient Fault Zone Section A Individual Fracture Sets and Their P20 and P21 Values
Appendix B.2. Incipient Fault Zone Section B Individual Fracture Sets and Their P20 and P21 Values
Appendix B.3. Incipient Fault Zone Section C Individual Fracture Sets and Their P20 and P21 Values
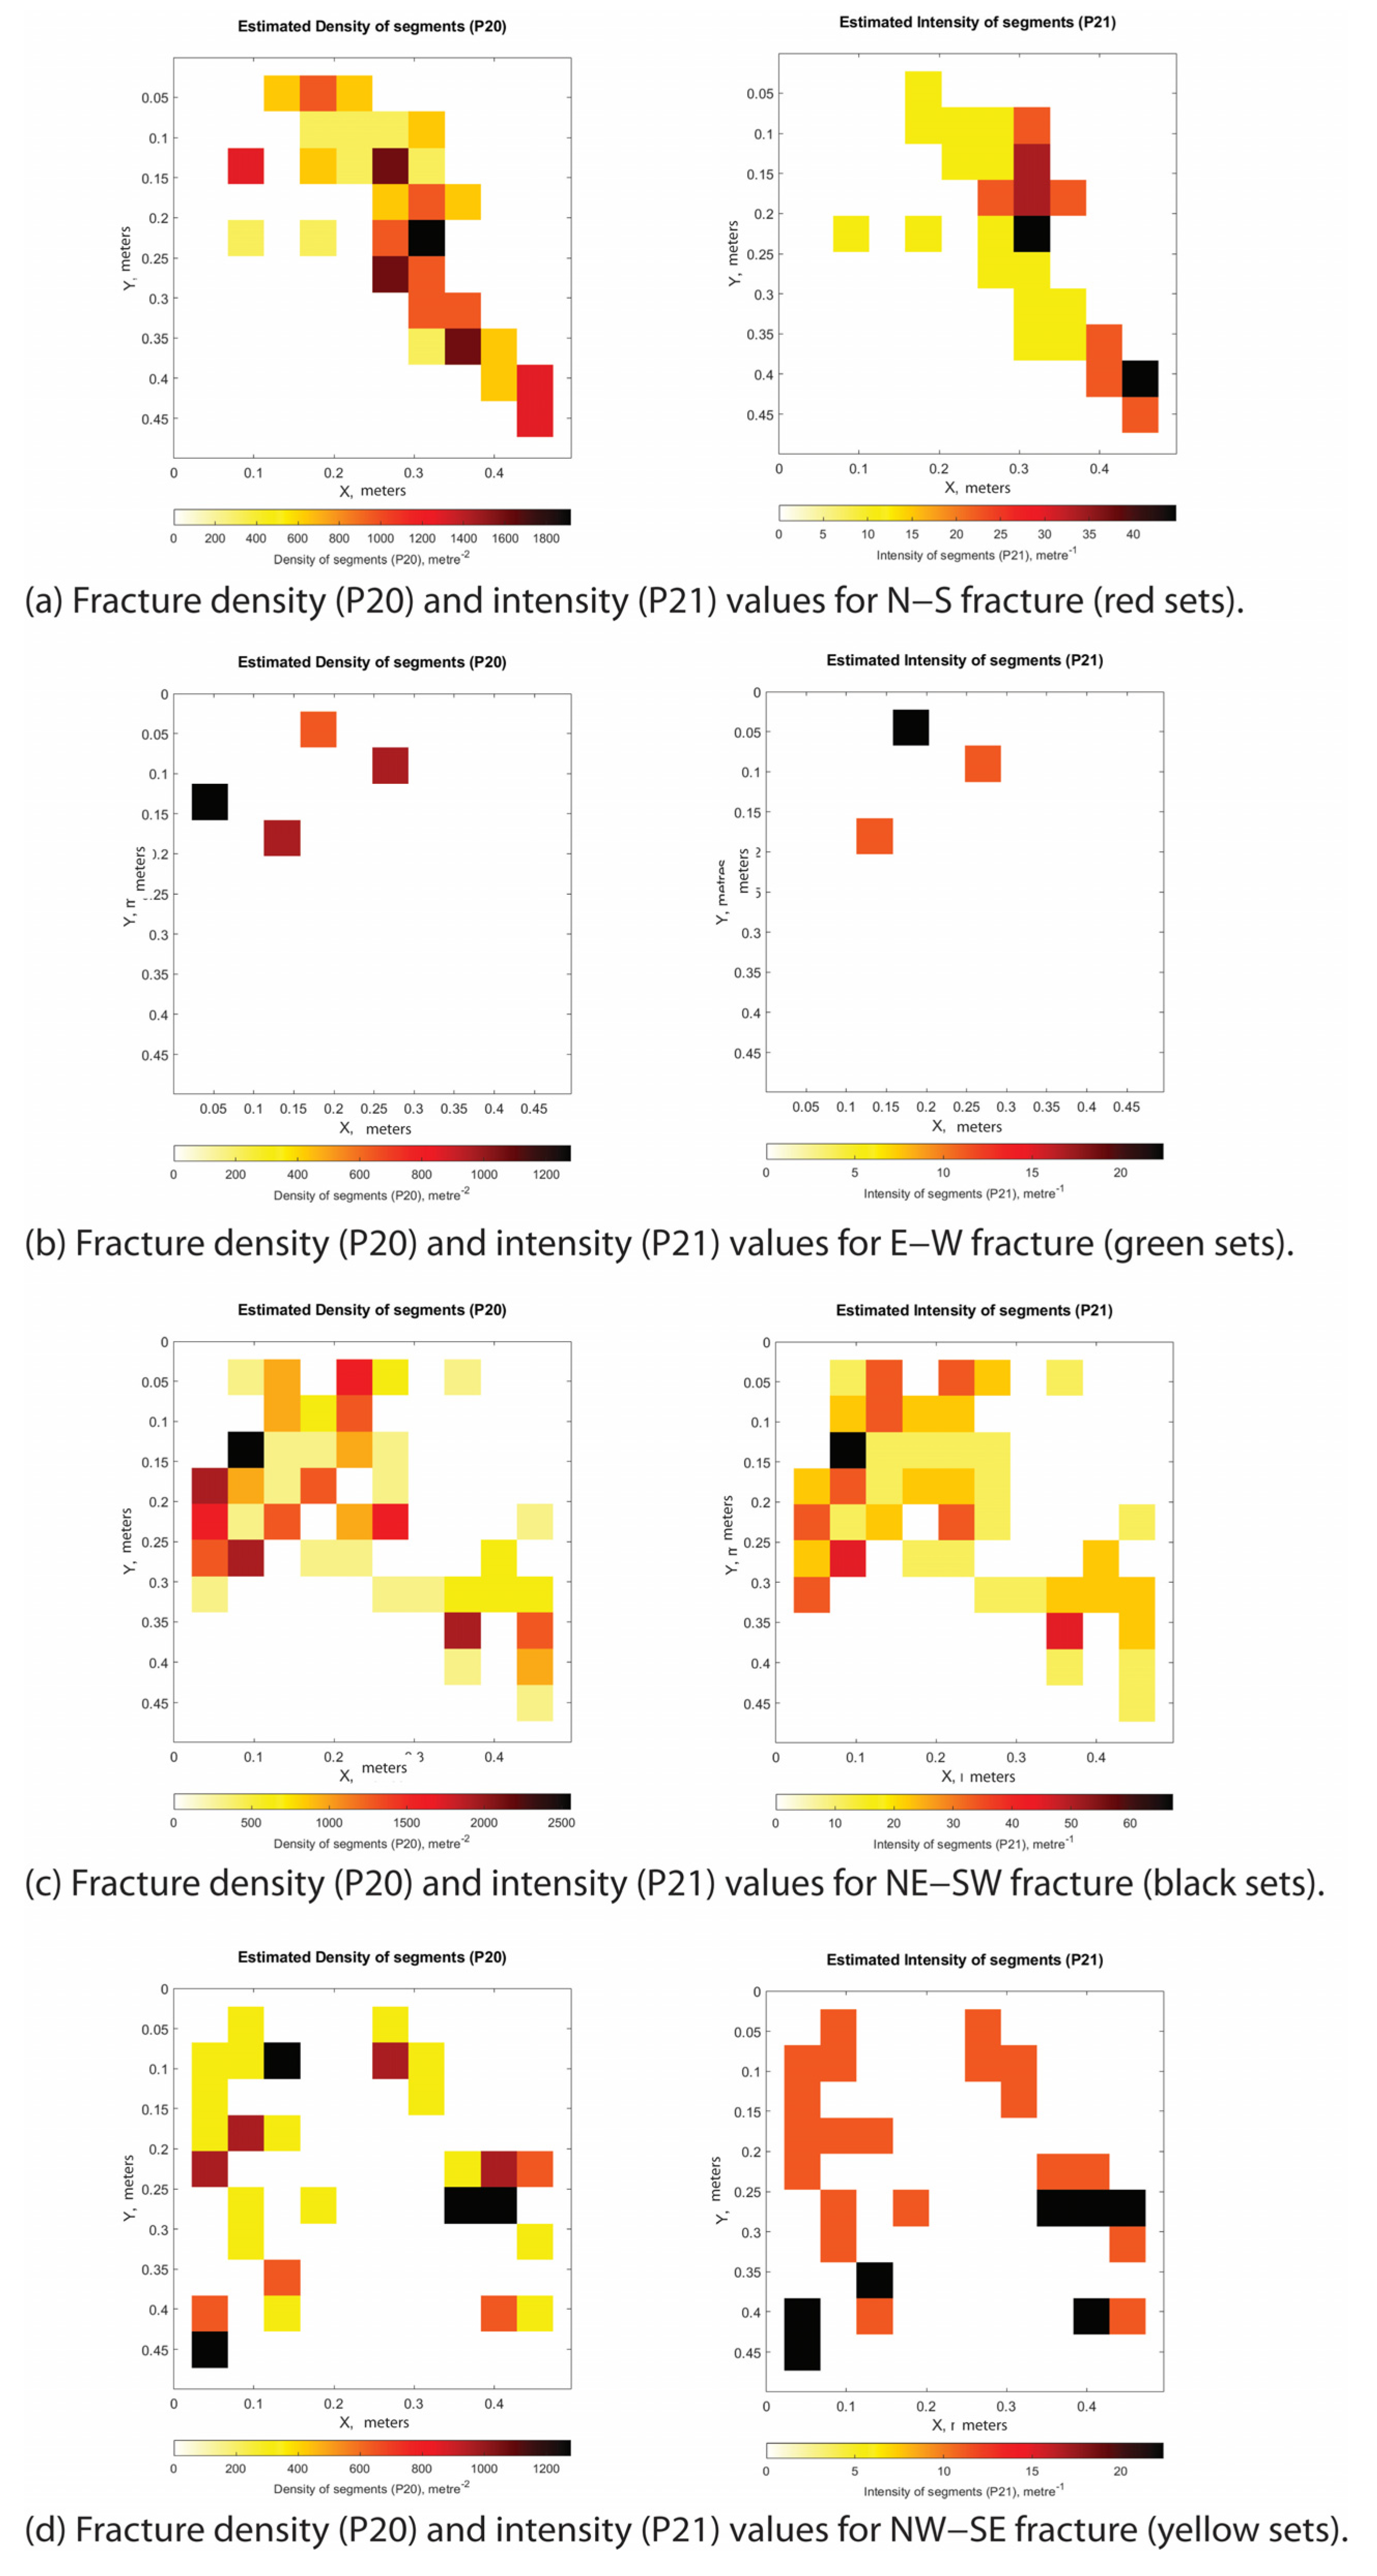
Appendix B.4. Incipient Fault Zone Section D Individual Fracture Sets and Their P20 and P21 Values
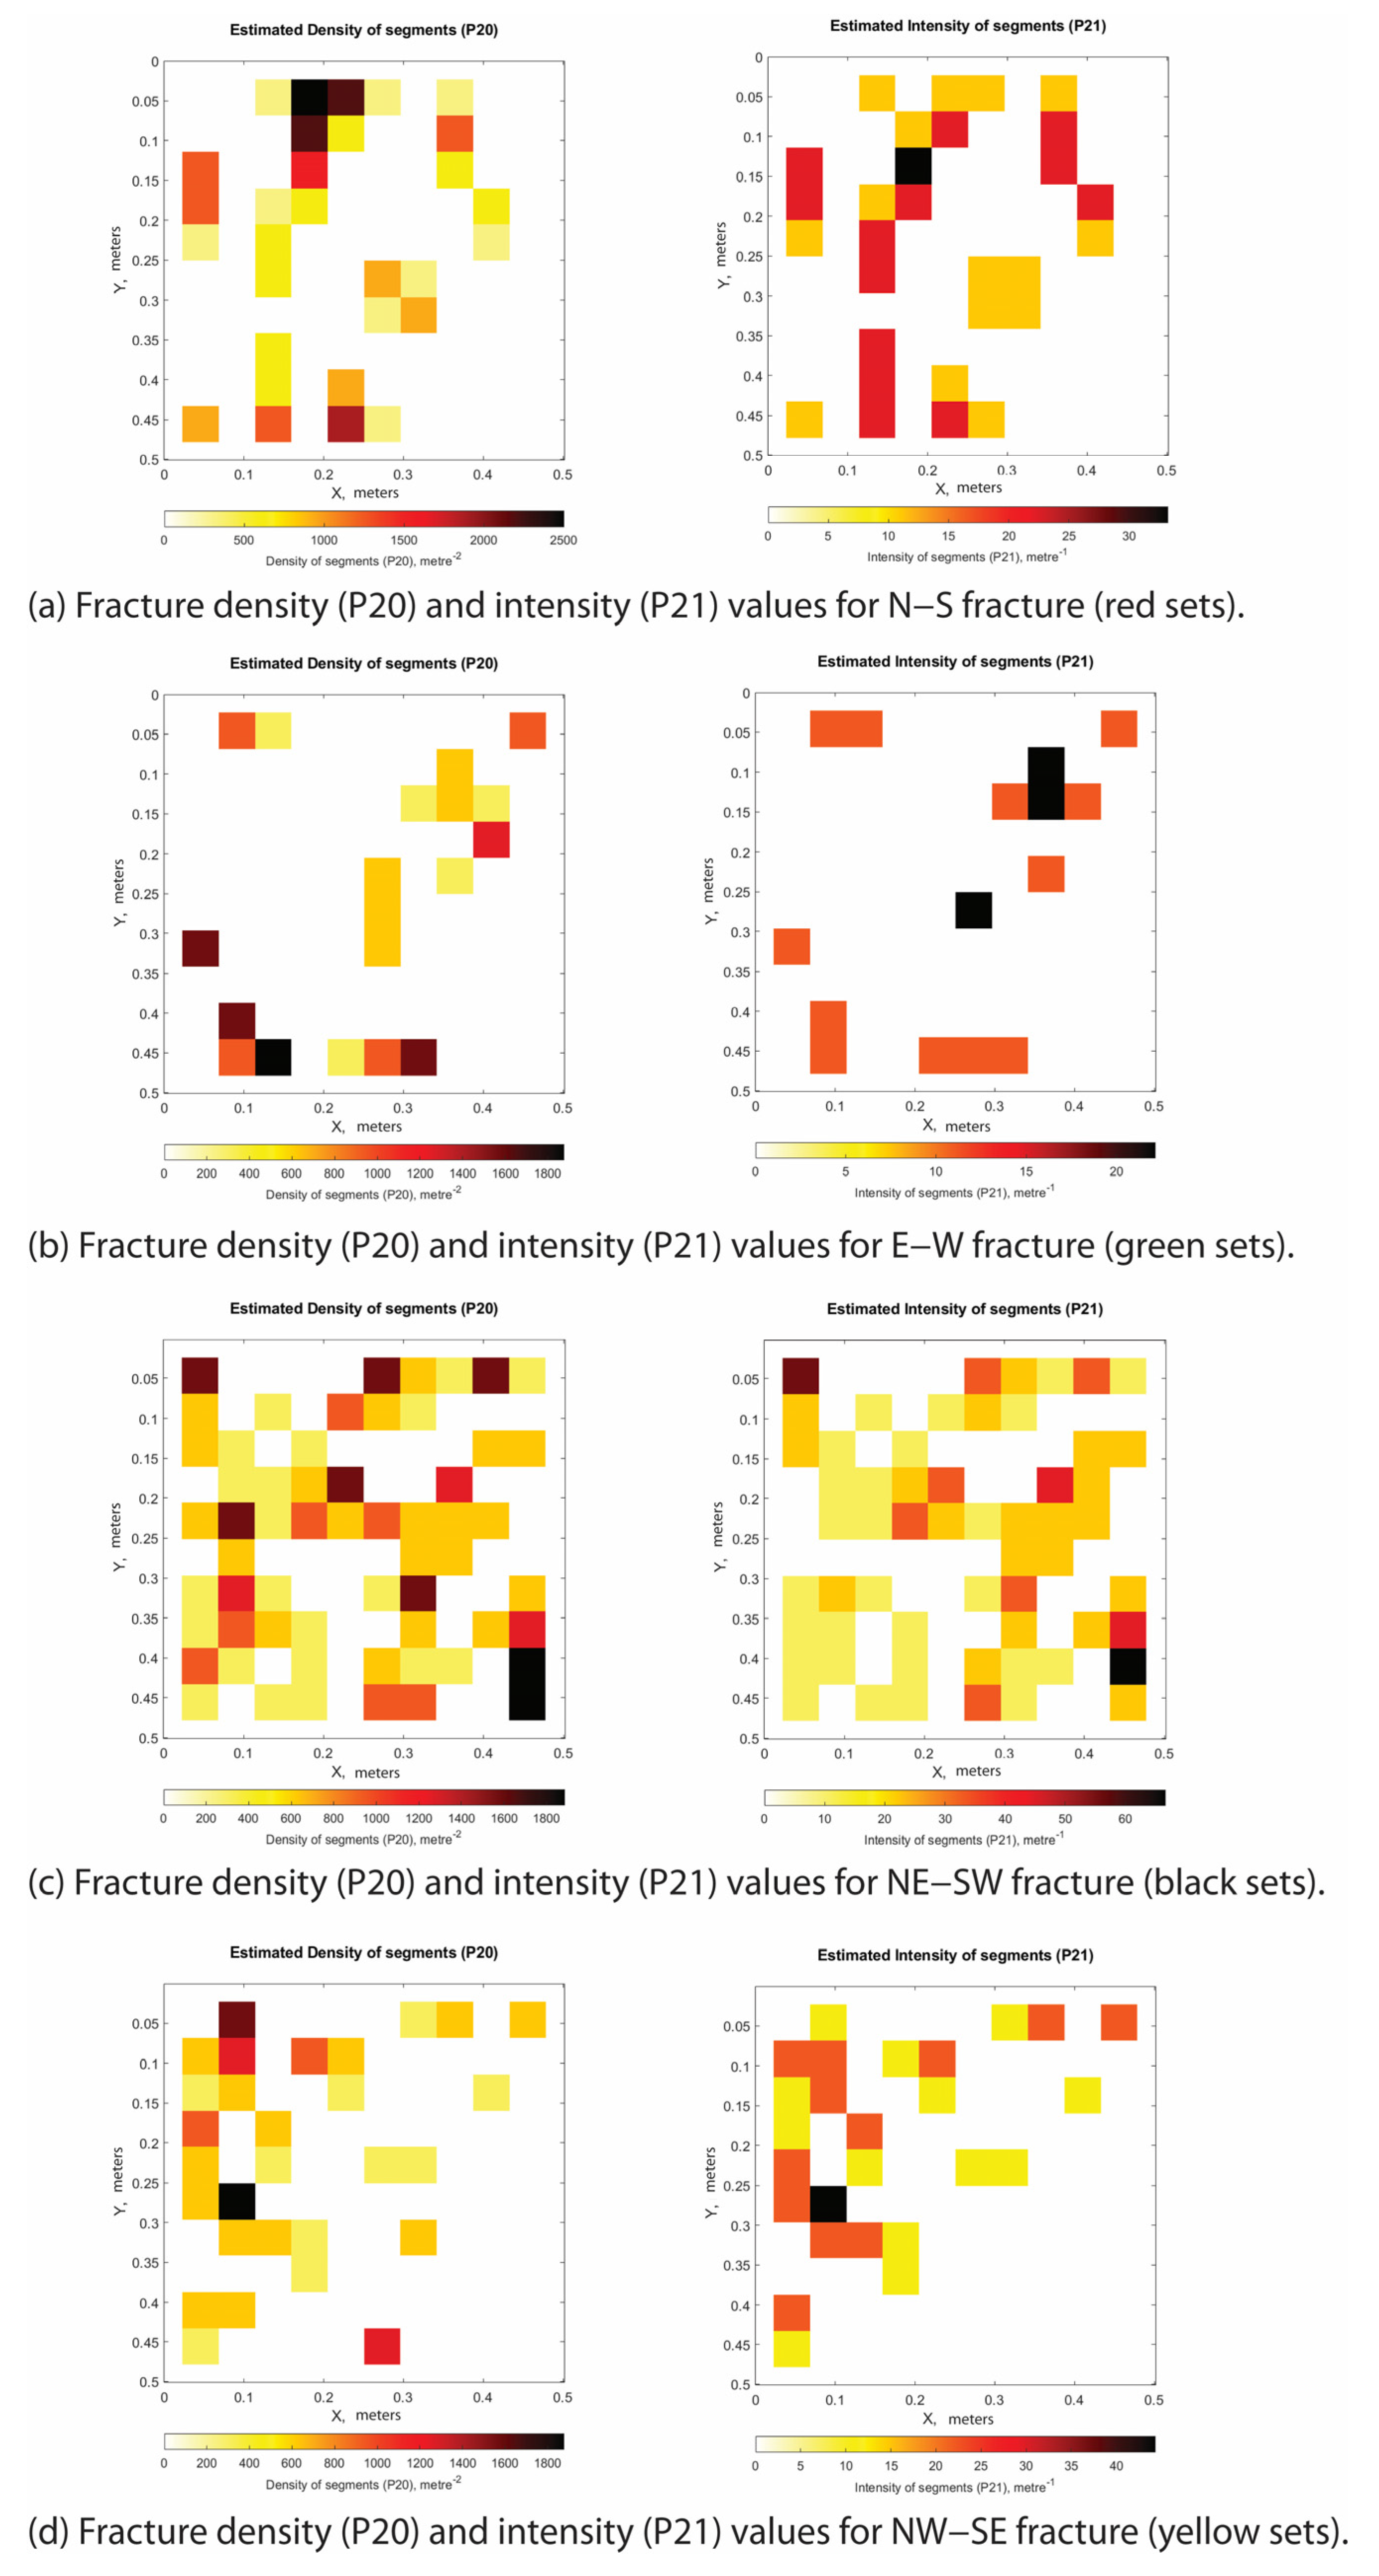
Appendix C. Station 3: Small Fault Zone
Appendix C.1. Small Fault Zone Section A Individual Fracture Sets and Their P20 and P21 Values
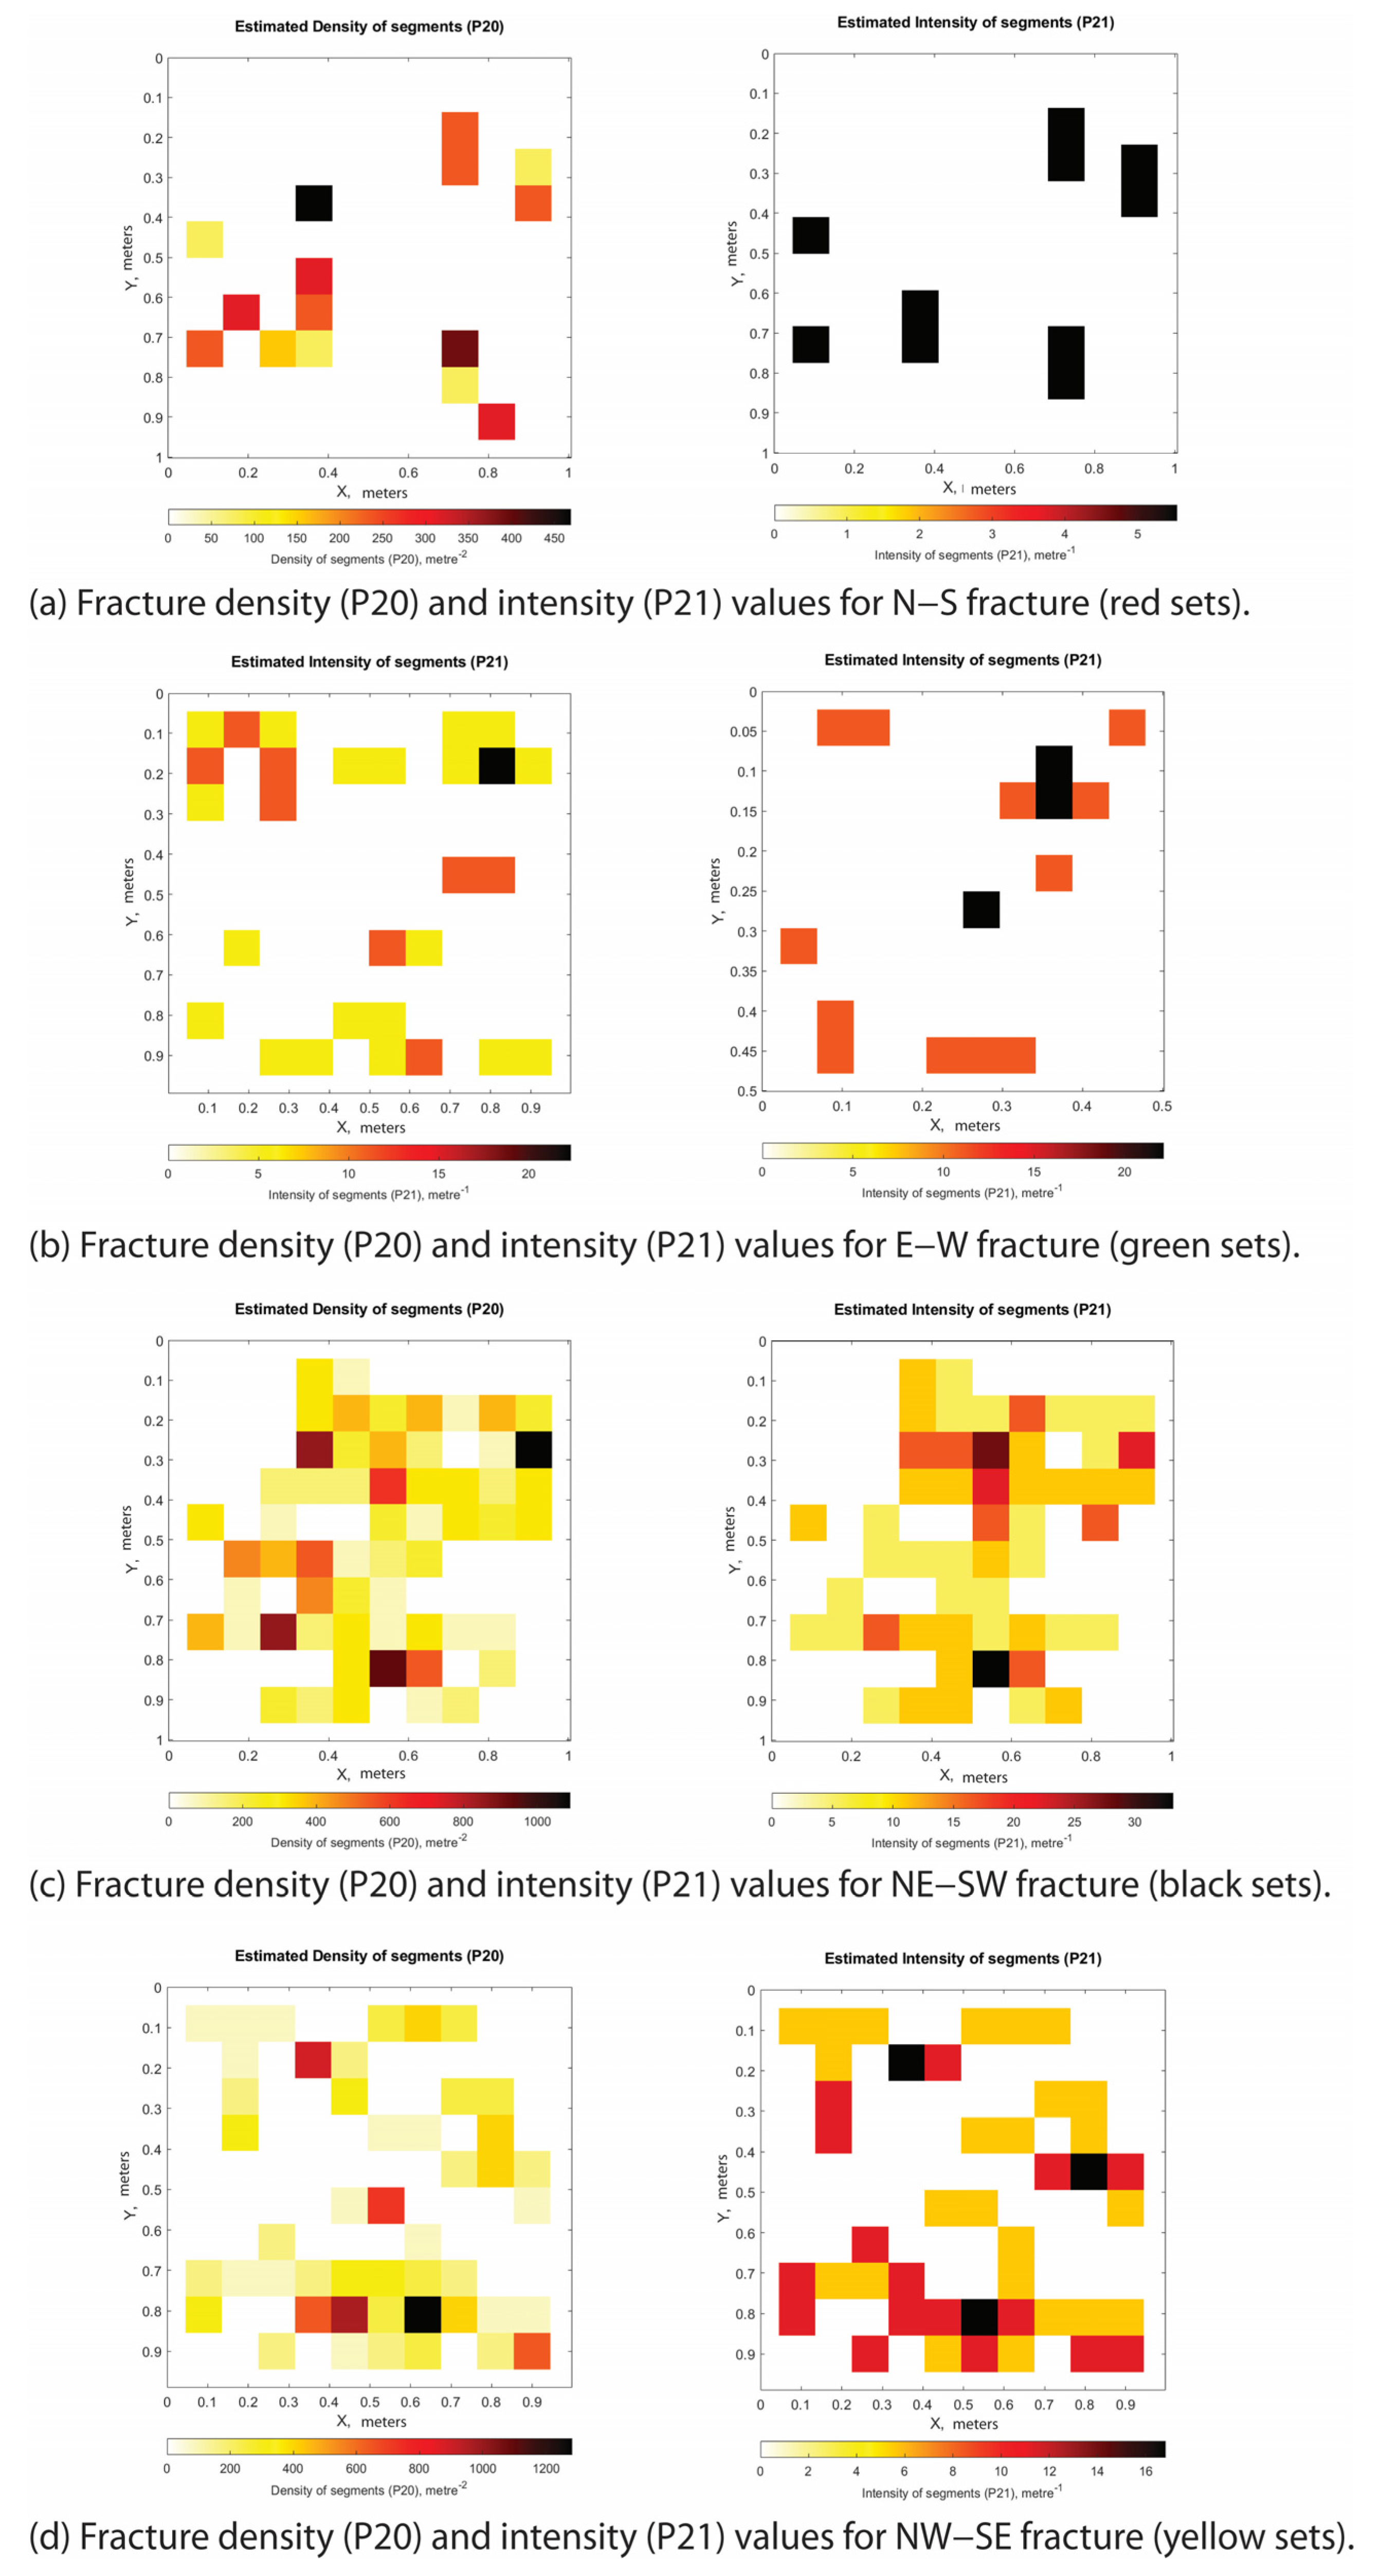
Appendix C.2. Small Fault Zone Section B Individual Fracture Sets and Their P20 and P21 Values
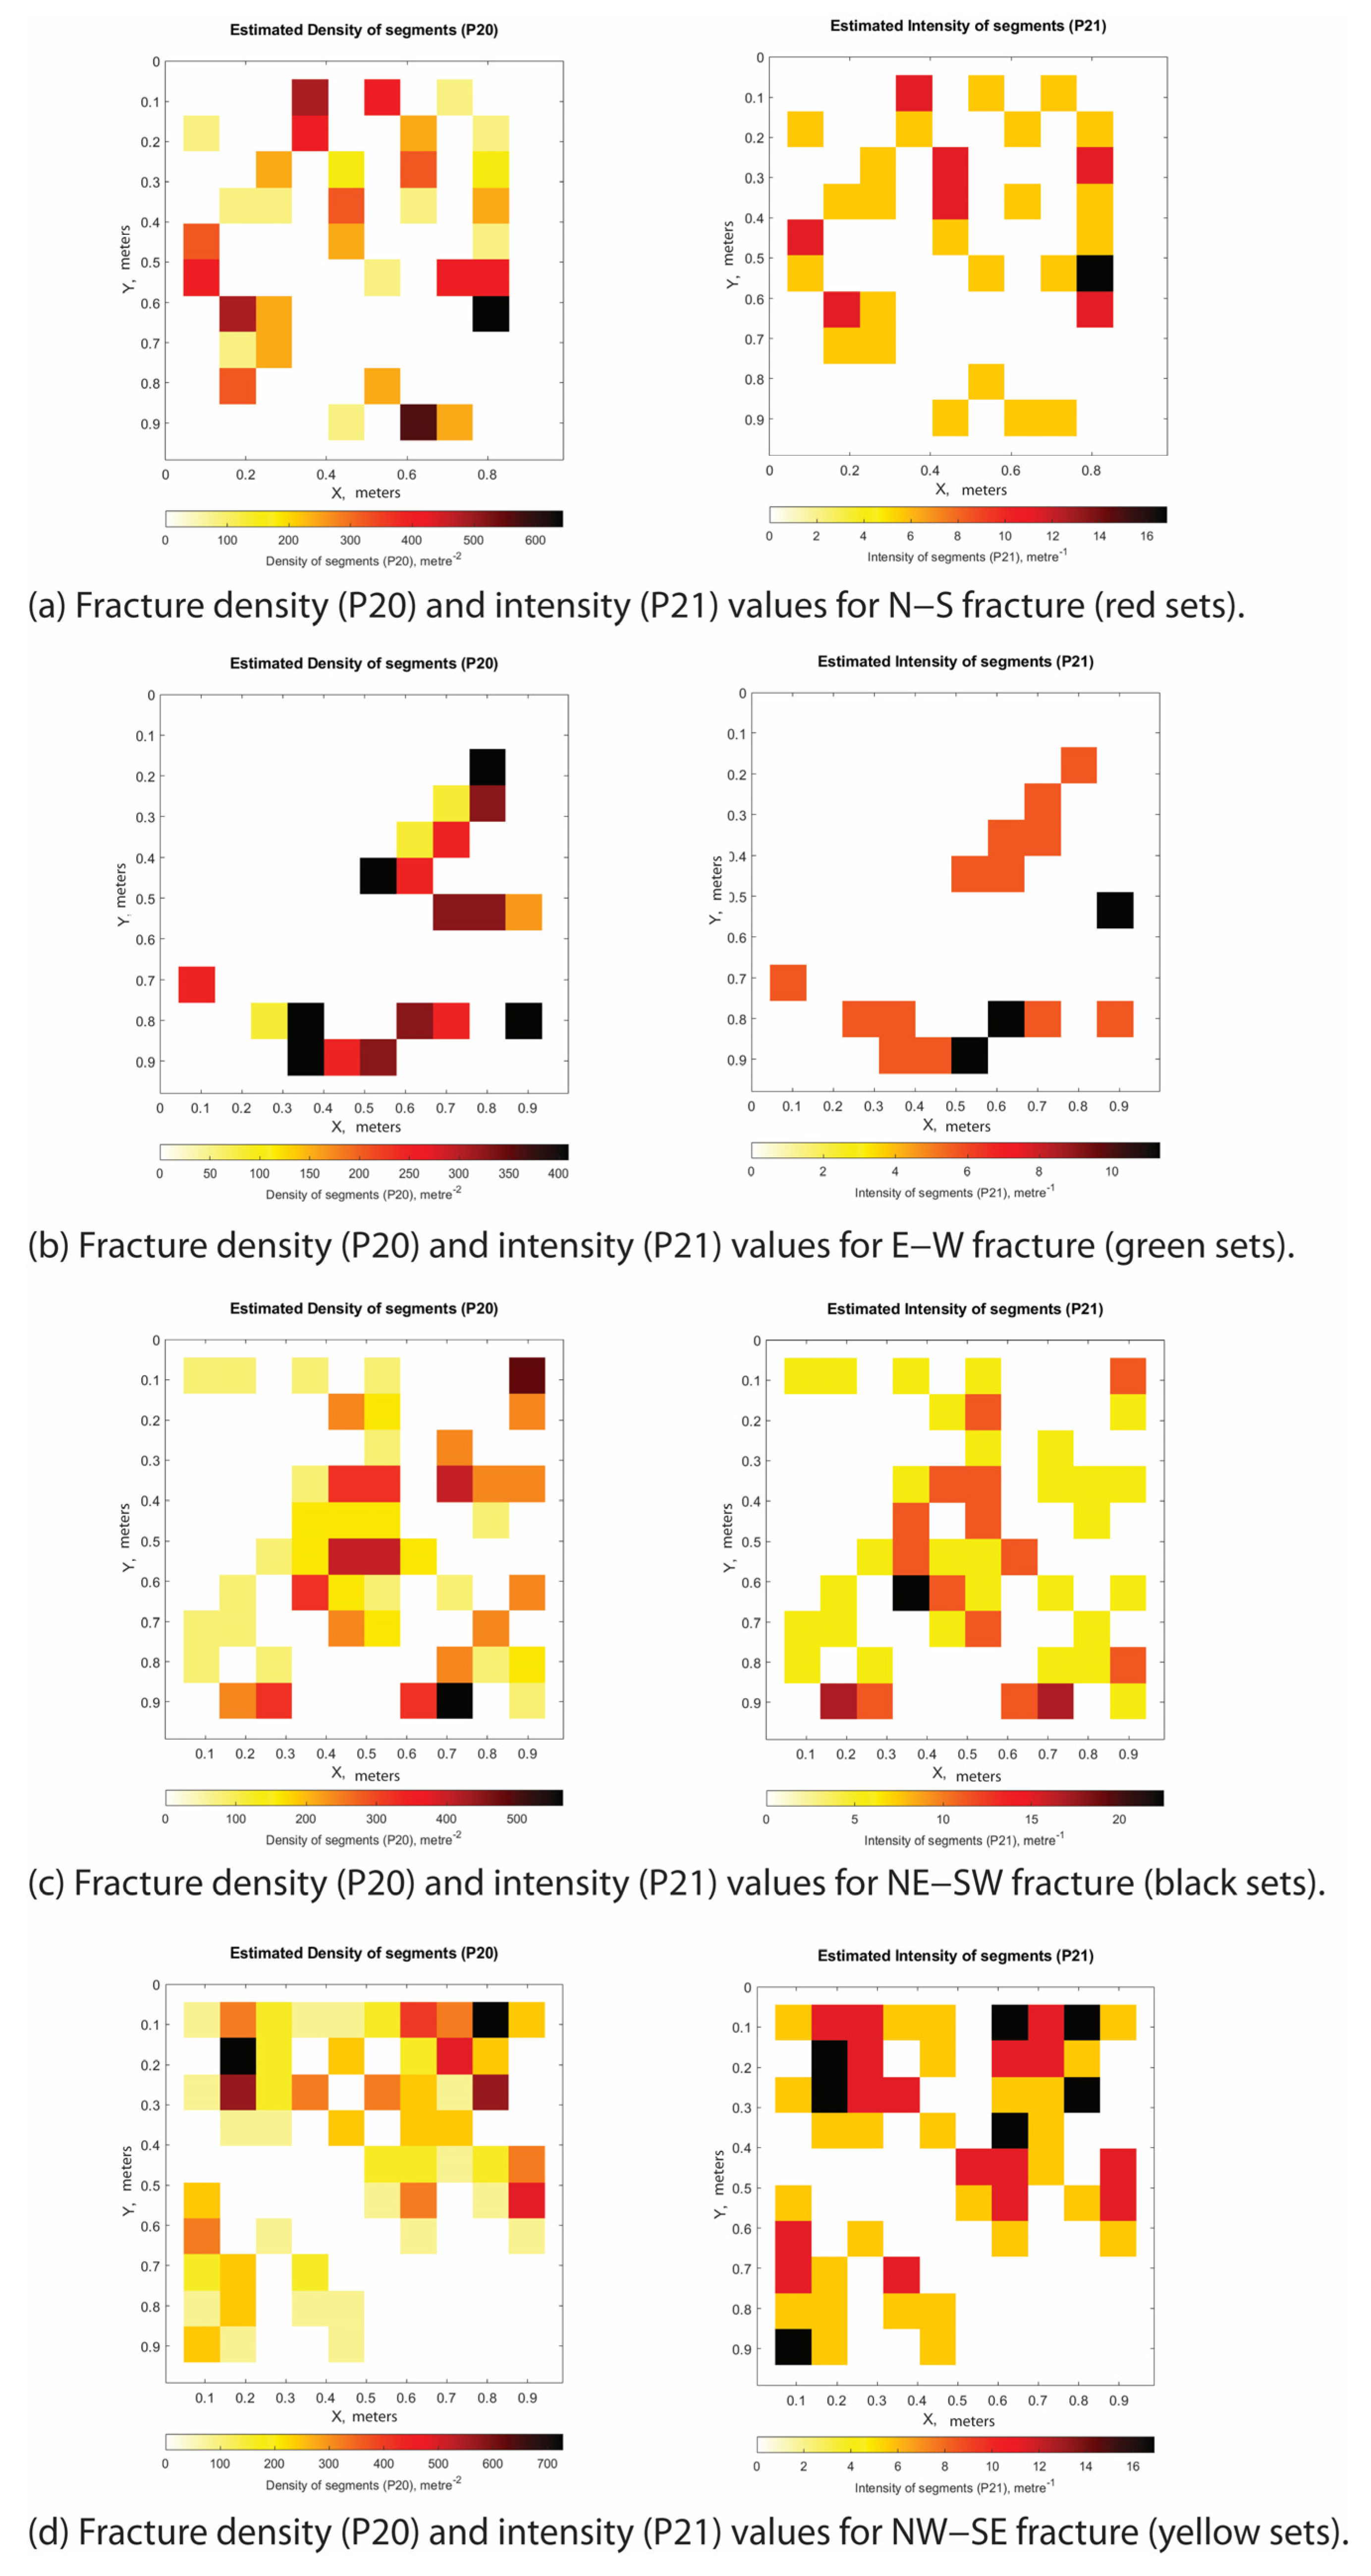
Appendix C.3. Small Fault Zone Section C Individual Fracture Sets and Their P20 and P21 Values
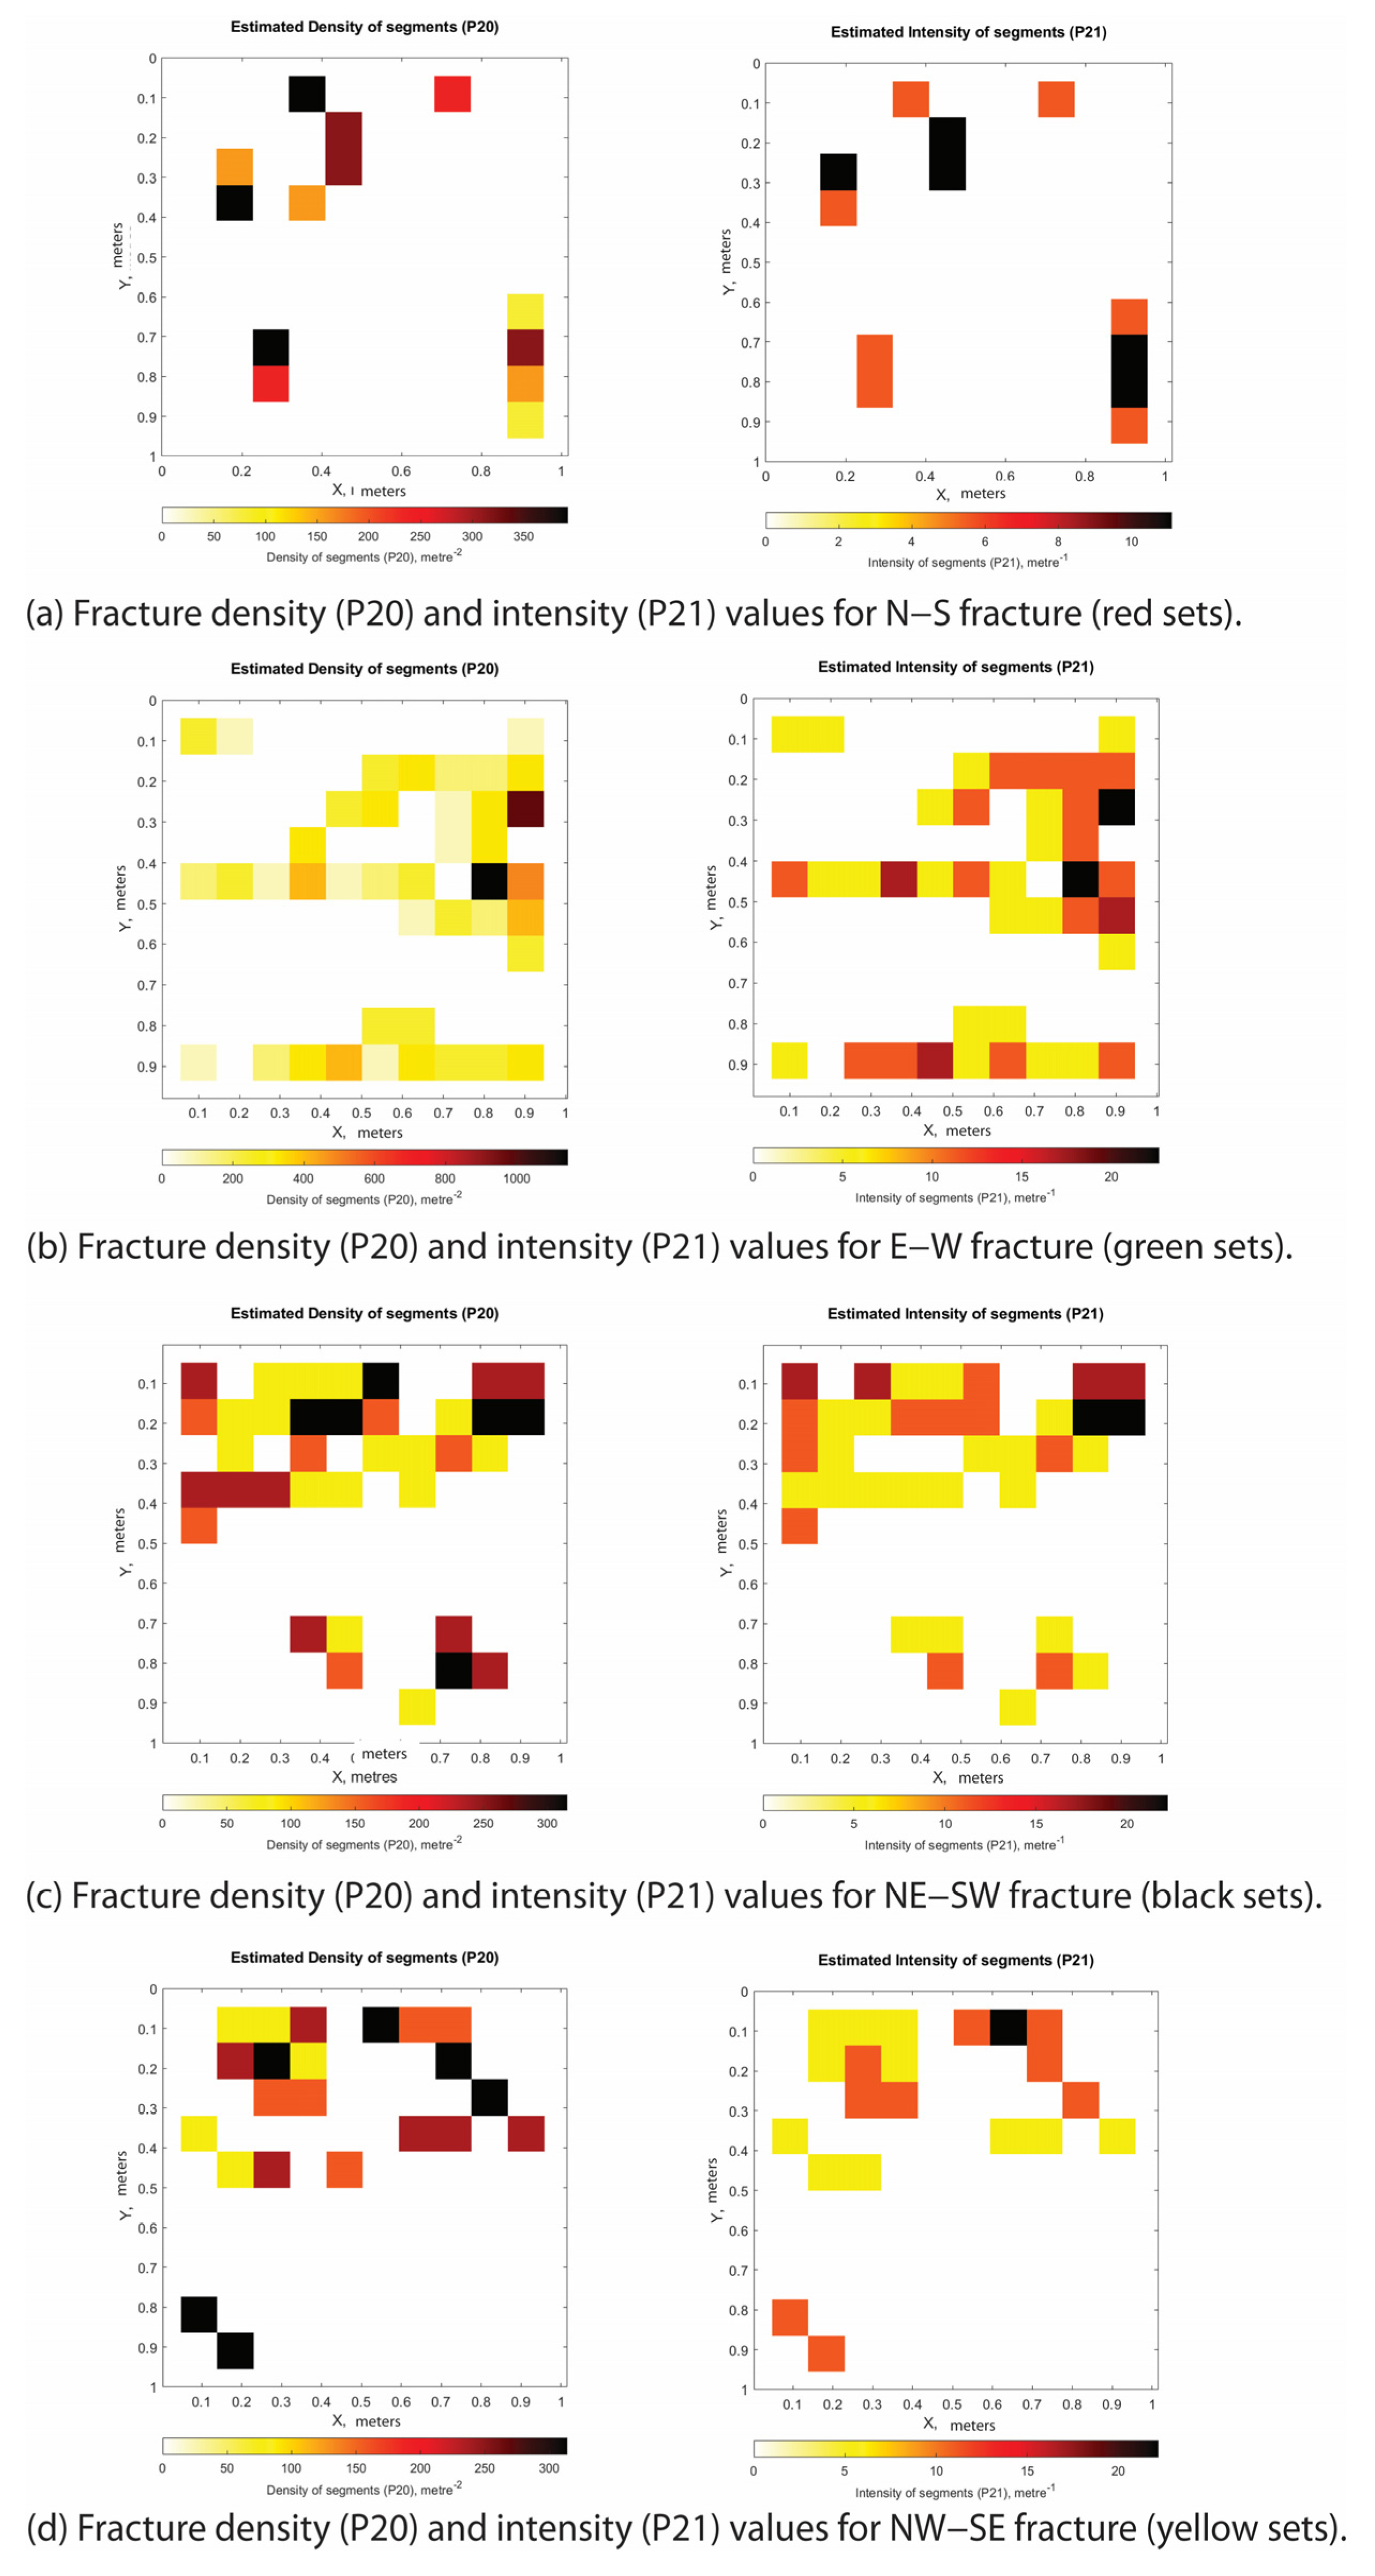
Appendix D. Station 1: Large Fault Zone
Appendix D.1. Large Fault Zone Section A Individual Fracture Sets and Their P20 and P21 Values
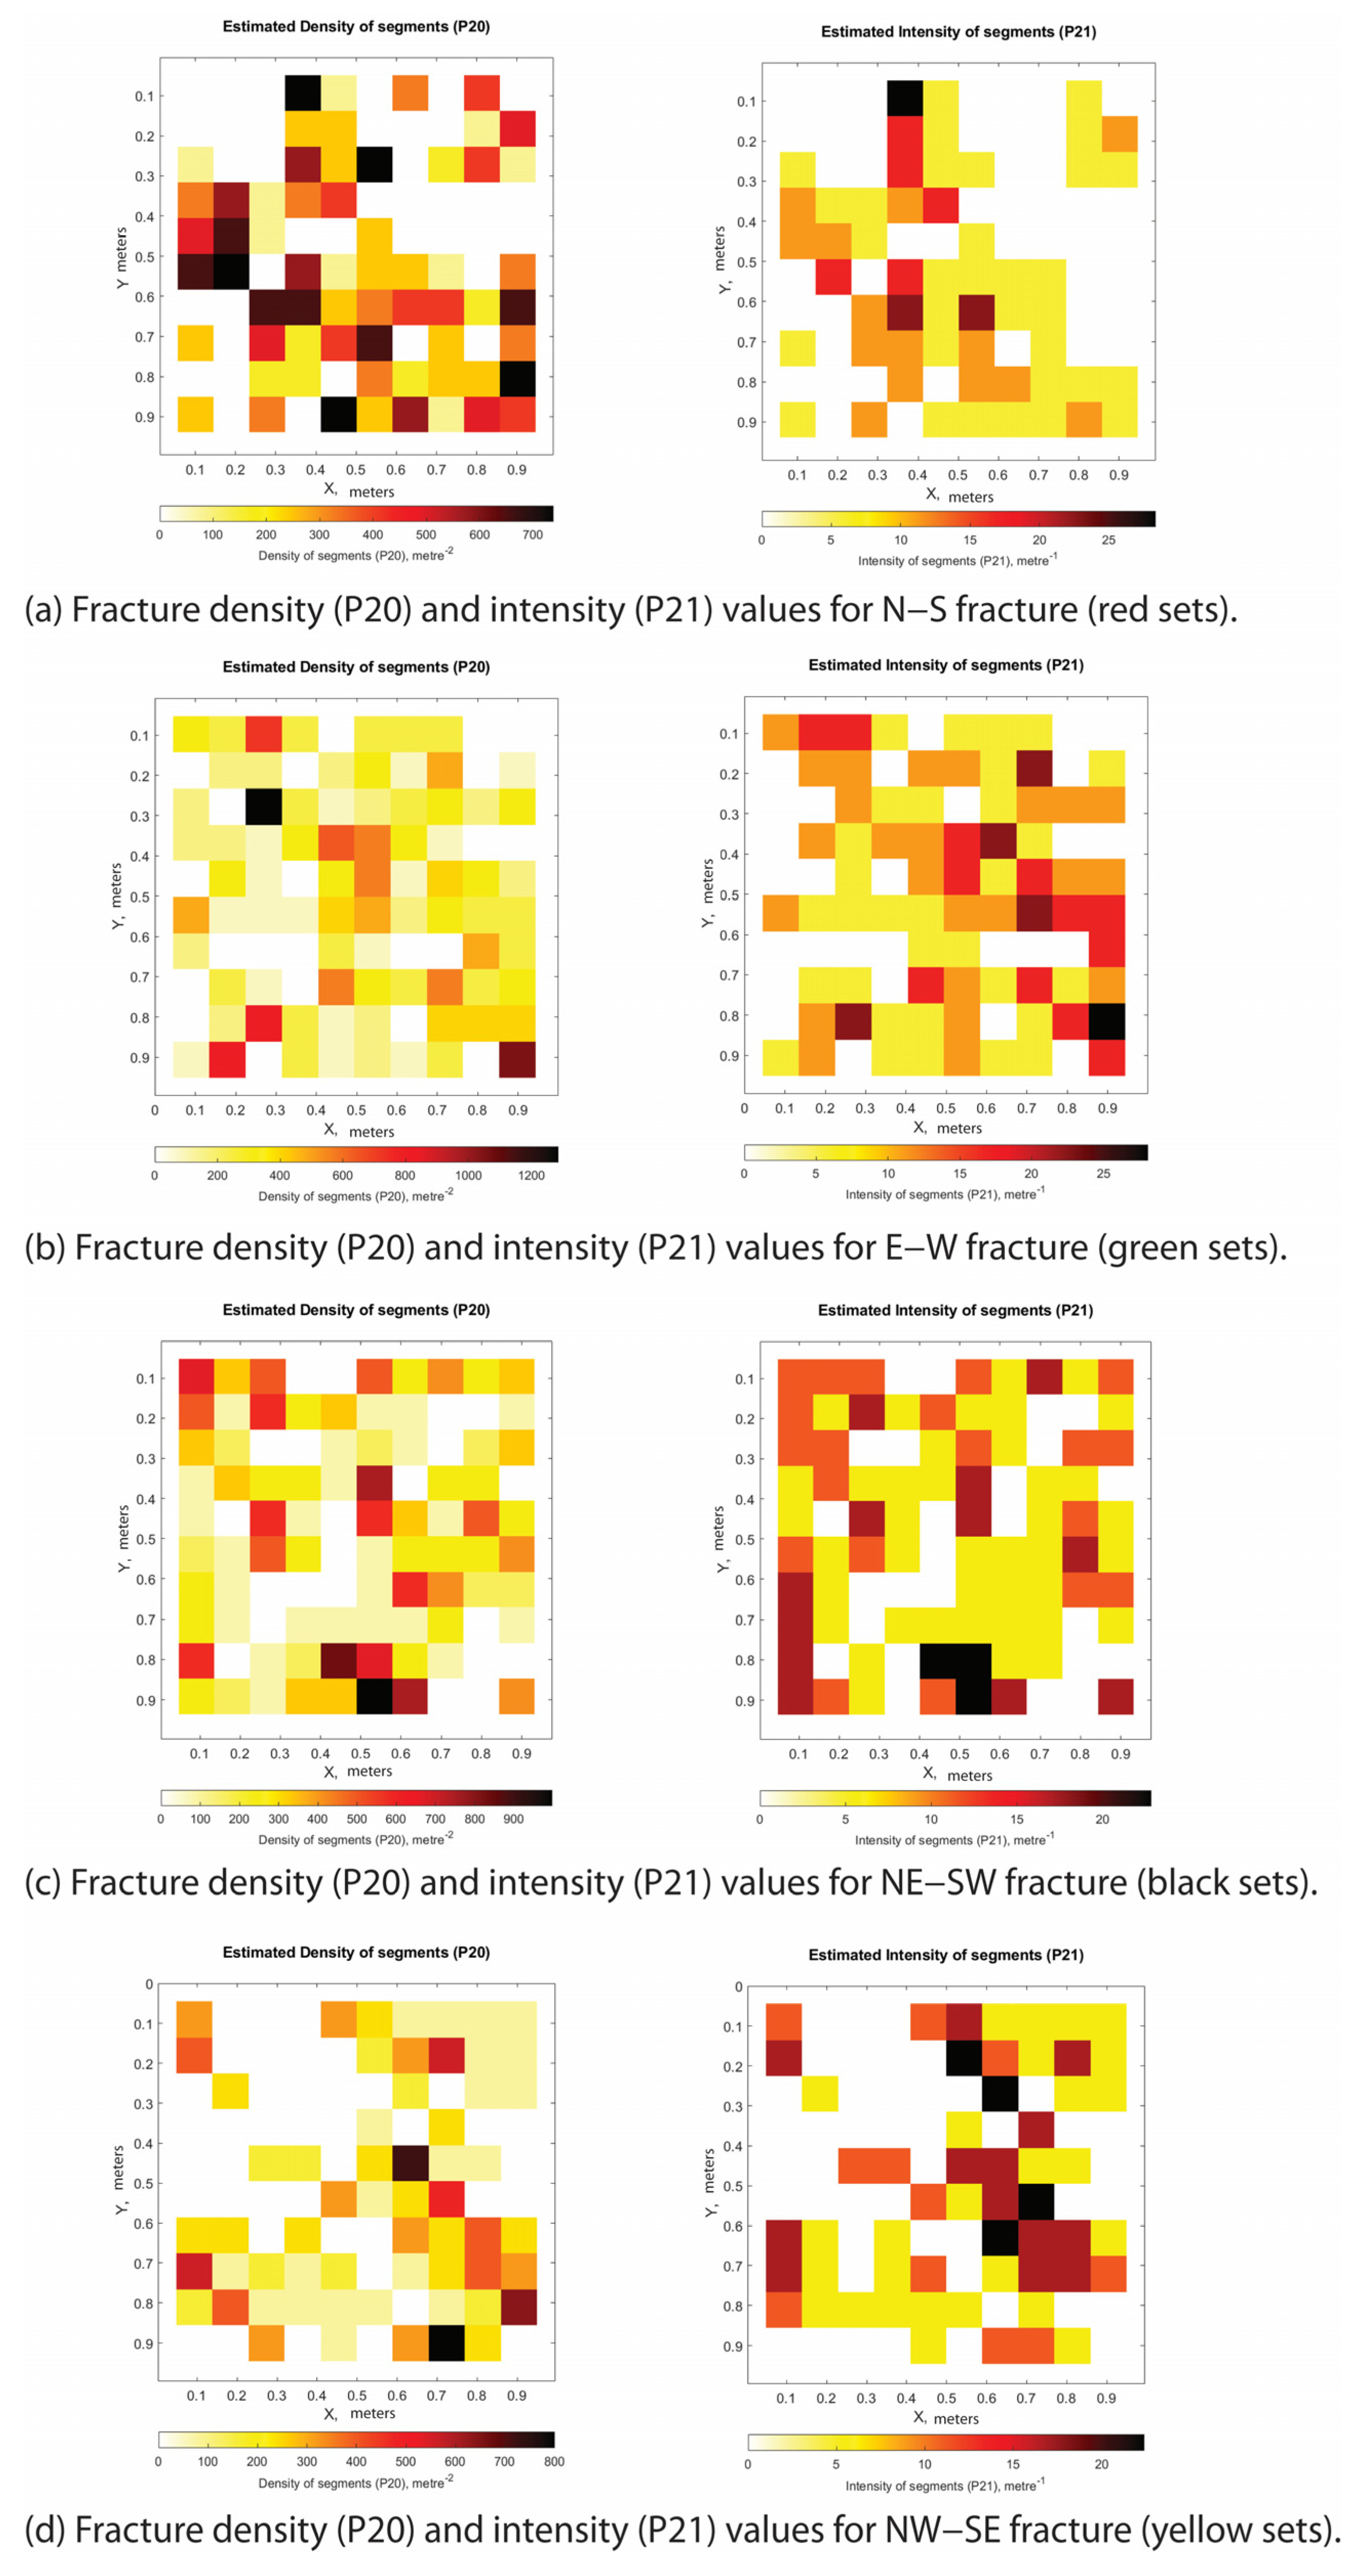
Appendix D.2. Large Fault Zone Section B Individual Fracture Sets and Their P20 and P21 Values
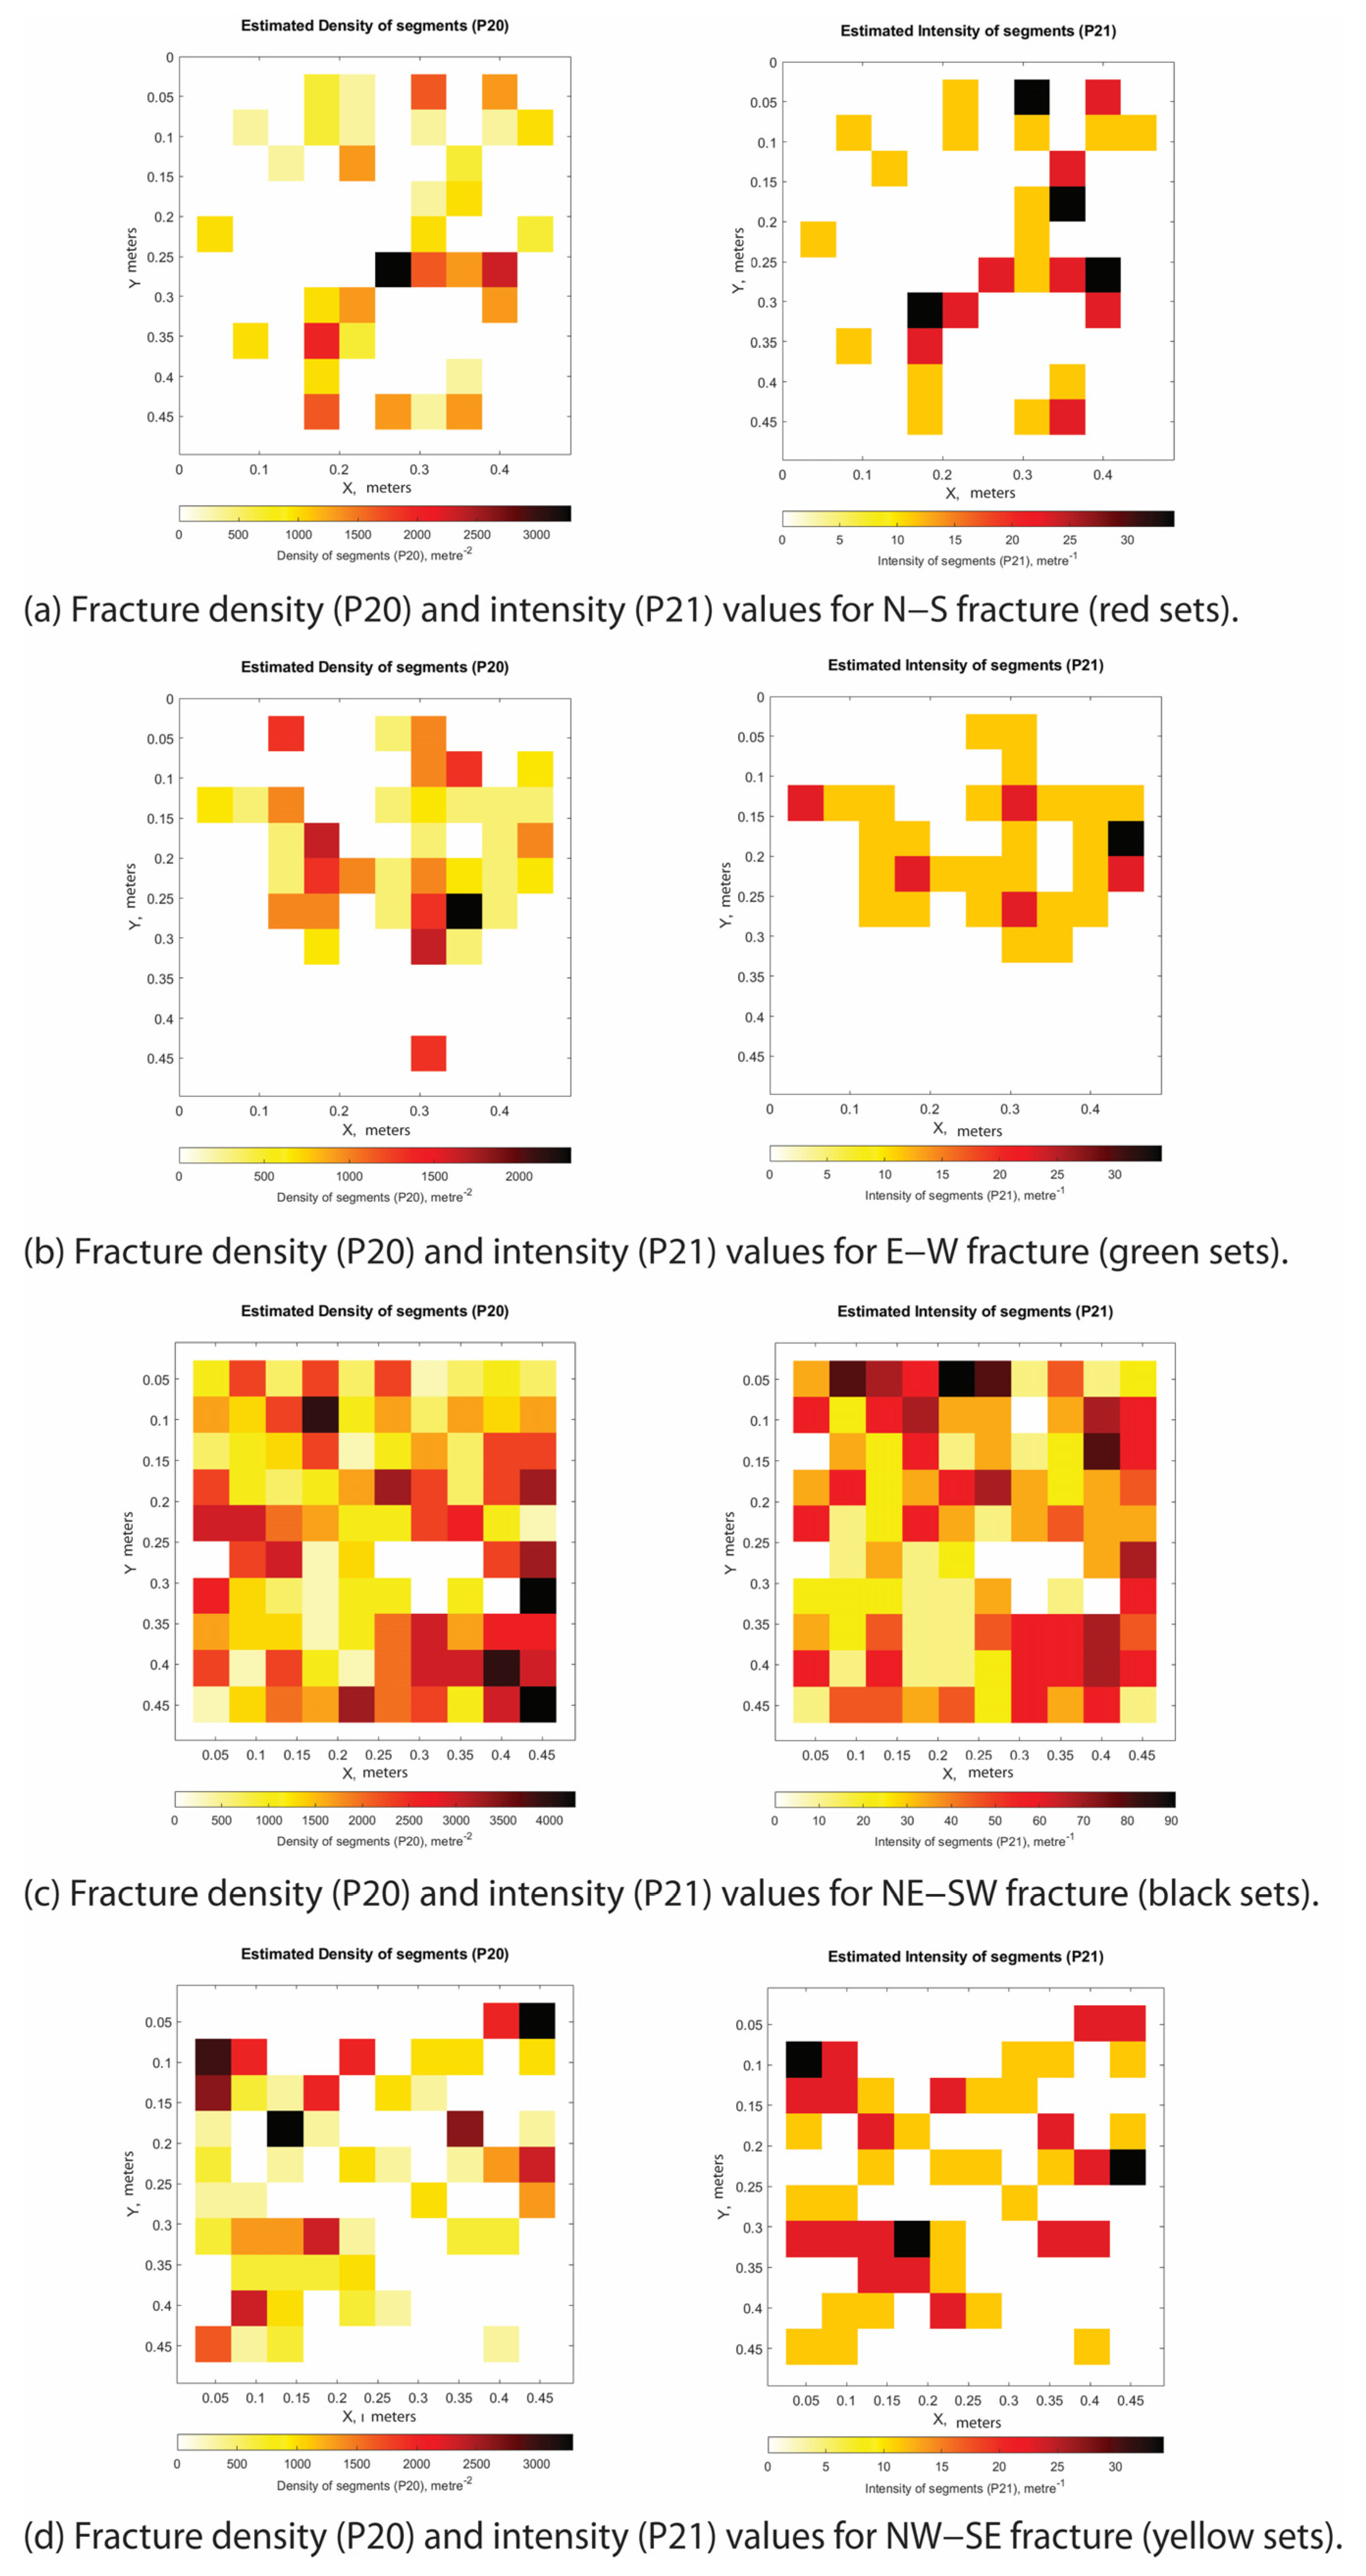
Appendix D.3. Large Fault Zone Section C Individual Fracture Sets and Their P20 and P21 Values
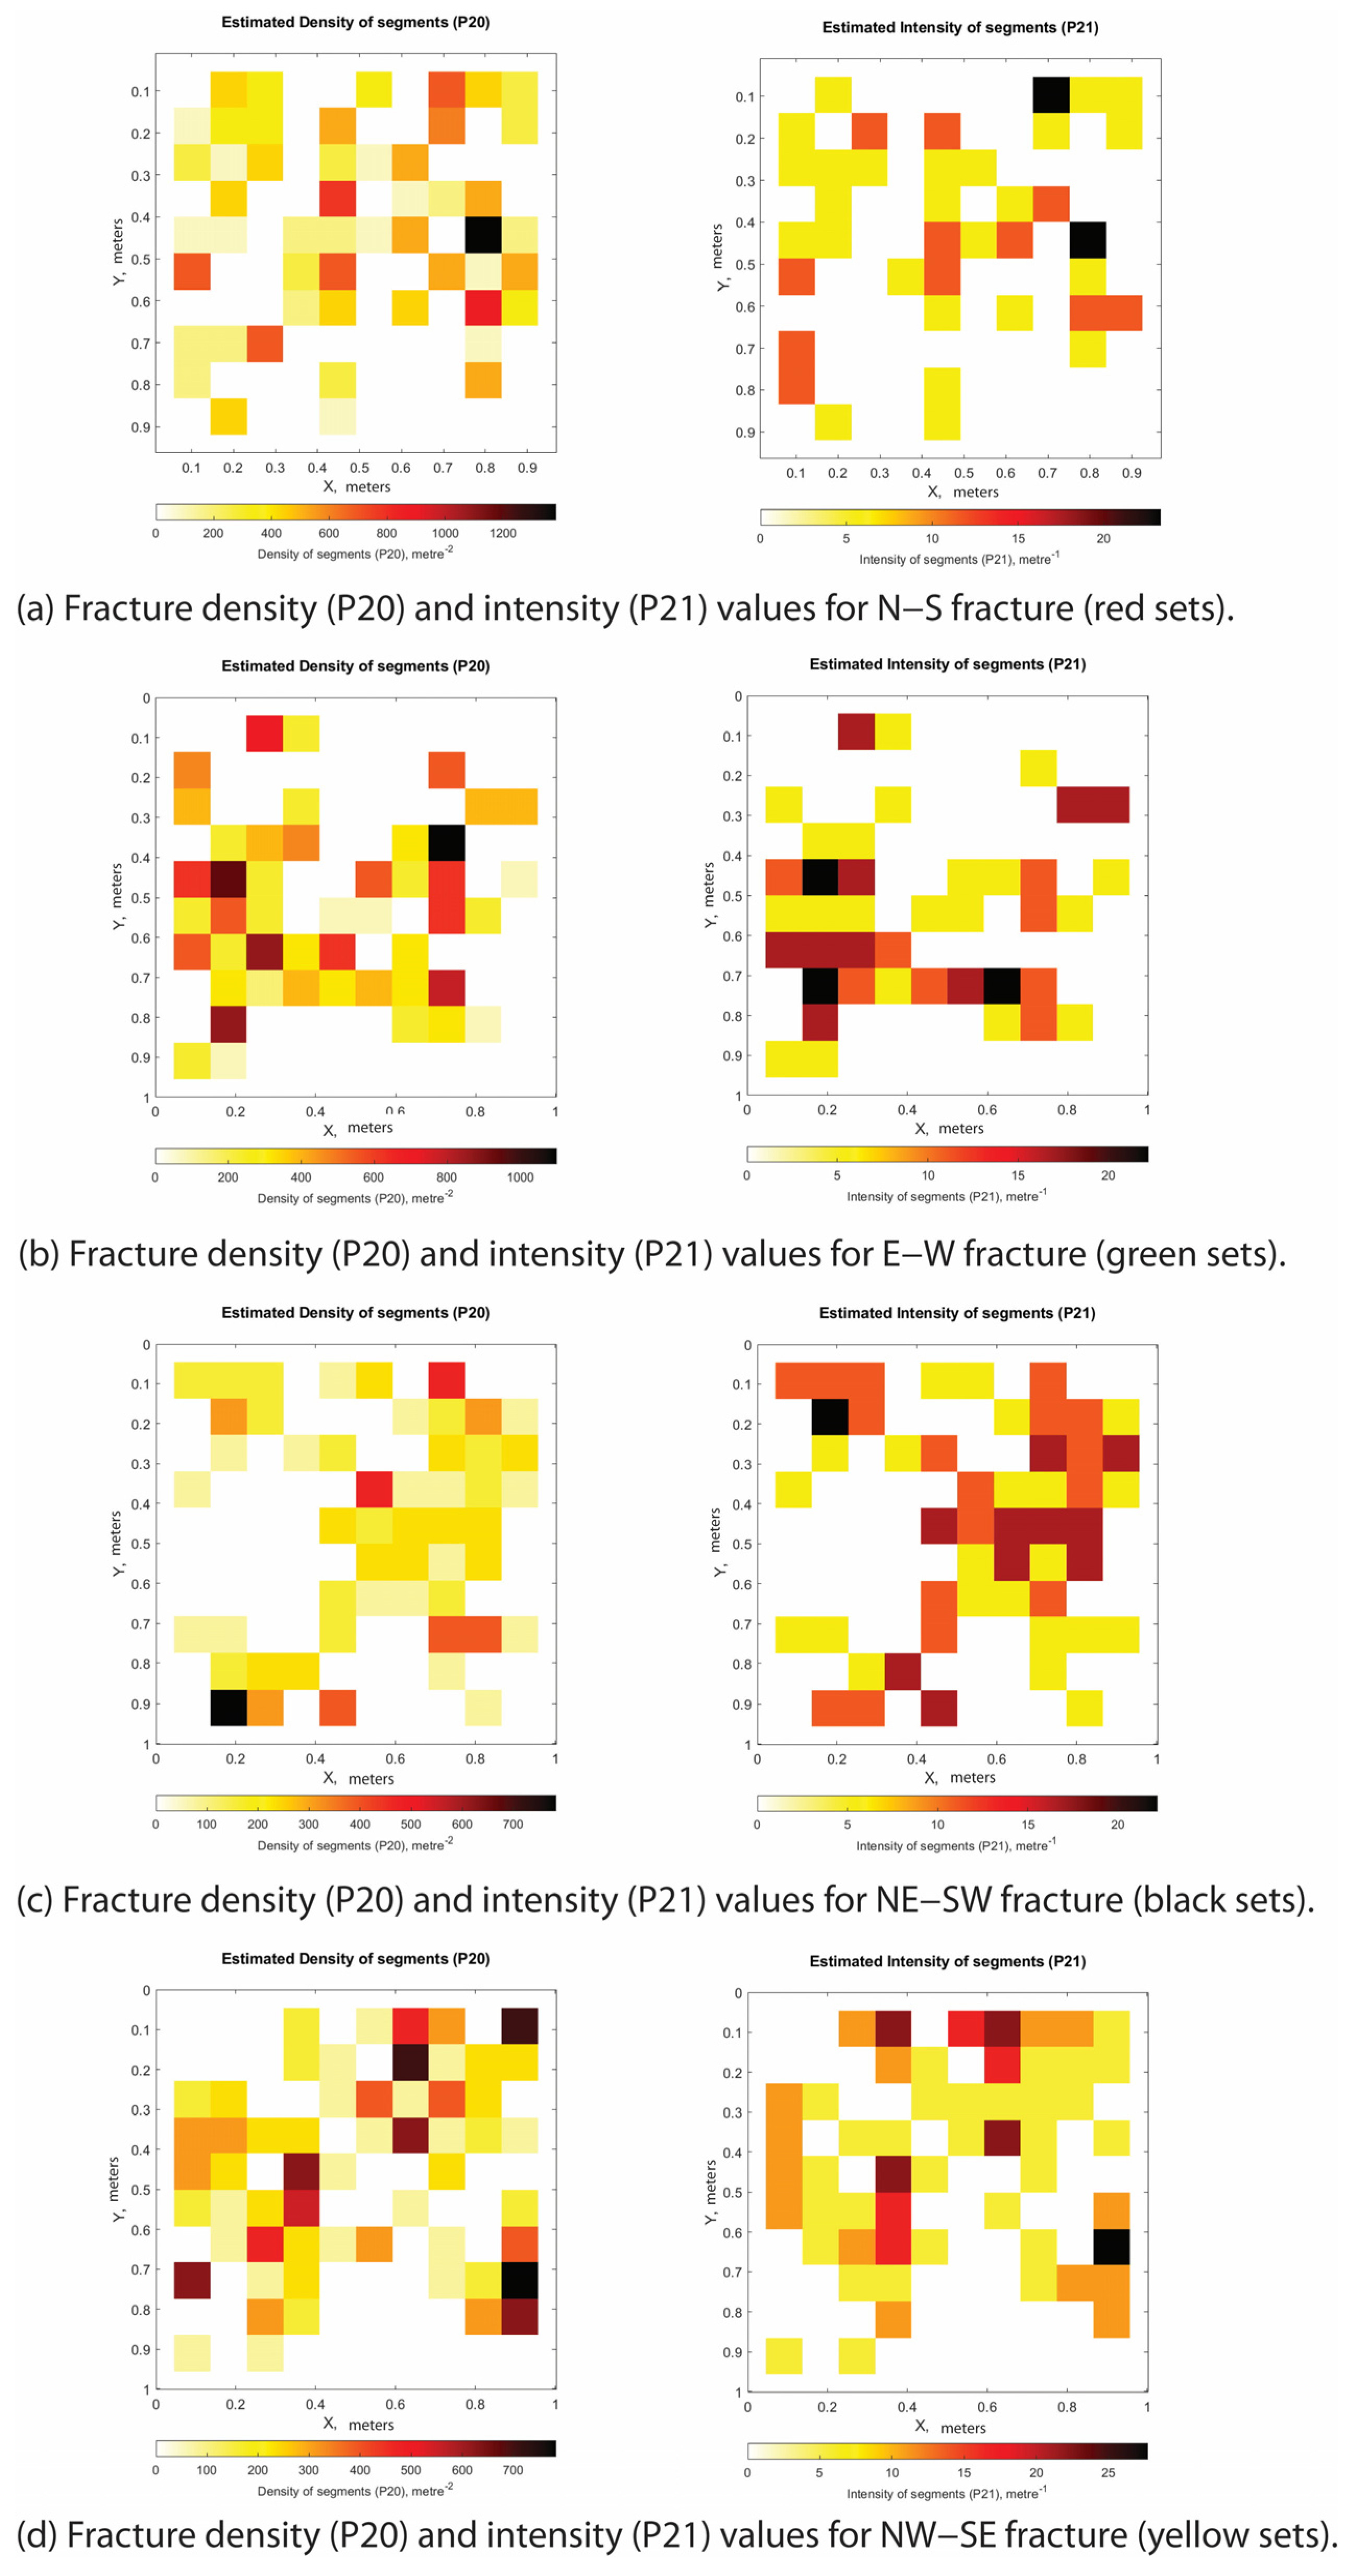
Appendix D.4. Large Fault Zone Section D Individual Fracture Sets and Their P20 and P21 Values
References
- Manniello, C.; Abdallah, I.B.; Prosser, G.; Agosta, F. Pressure solution-assisted diagenesis and thrusting-related deformation of Mesozoic platform carbonates. J. Struct. Geol. 2023, 173, 104906. [Google Scholar] [CrossRef] [Scilit]
- Abdallah, I.B.; Manniello, C.; Prosser, G.; Agosta, F. Multiscale structural analyses of Mesozoic shallow-water carbonates, Viggiano Mt., southern Italy. J. Struct. Geol. 2023, 176, 104978. [Google Scholar] [CrossRef] [Scilit]
- Abdallah, I.B.; Panza, E.; Dastoli, S.; Manniello, C.; Prosser, G.; Agosta, F. Multiscale discrete fracture network modelling of shallow-water carbonates: East Agri Valley Basin, Southern Italy. Mar. Pet. Geol. 2024, 169, 107048. [Google Scholar] [CrossRef] [Scilit]
- Manniello, C.; Agosta, F.; Todaro, S.; Cavalcante, F.; Prosser, G. Fracture stratigraphy of Mesozoic platform carbonates, Agri Valley, southern Italy. Geol. Mag. 2022, 159, 1874–1896. [Google Scholar] [CrossRef] [Scilit]
- Maschio, L.; Ferranti, L.; Burrato, P. Active extension in Val d’Agri area, Southern Apennines, Italy: Implications for the geometry of the seismogenic belt. Geophys. J. Int. 2005, 162, 591–609. [Google Scholar] [CrossRef] [Scilit]
- Cello, G.; Mazzoli, S. Apennine tectonics in southern Italy: A review. J. Geodyn. 1998, 27, 191–211. [Google Scholar] [CrossRef] [Scilit]
- Vezzani, F.A. Geology and Tectonic Evolution of the Central-Southern Apennines, Italy; Geological Society of America: Boulder, CO, USA, 2010; Volume 469, pp. 1–58. [Google Scholar] [CrossRef] [Scilit]
- Patacca, E.; Scandone, P. Geology of the southern Apennines. Boll. Soc. Geol. Ital. 2007, 7, 75–119. [Google Scholar]
- Carbone, S.; Catalano, S.; Lazzari, S.; Lentini, F.; Monaco, C. Presentazione della Carta Geologica del Bacino del Fiume Agri (Basilicata). Mem. Soc. Geol. Ital. 1991, 47, 129–143. [Google Scholar]
- Palladino, G.; Prosser, G.; Olita, F.; Avagliano, D.; Dello Iacovo, B.; Giano, S.I.; Bentivenga, M.; Agosta, F.; Grimaldi, S. Reconstruction of the structural setting of the north-eastern side of the high Agri Valley (Southern Apennines, Italy) based on detailed field mapping. J. Maps 2023, 19, 2257729. [Google Scholar] [CrossRef] [Scilit]
- Schirripa Spagnolo, G.; Agosta, F.; Aldega, L.; Prosser, G.; Smeraglia, L.; Tavani, S.; Looser, N.; Guillong, M.; Bernasconi, S.M.; Billi, A.; et al. Structural architecture and maturity of val d’Agri faults, Italy: Inferences from natural and induced seismicity. J. Struct. Geol. 2024, 180, 105084. [Google Scholar] [CrossRef] [Scilit]
- Bonardi, G.; Amore, F.O.; Ciampo, G.; de Capoa, P.; Miconnet, P.; Perrone, V. Il Complesso Liguride Auct.: Stato delle conoscenze e problemi aperti sulla sua evoluzione pre-appenninica ed i suoi rapporti con l’Arco Calabro. Mem. Soc. Geol. Ital. 1988, 41, 17–35. [Google Scholar]
- Shiner, P.; Beccacini, A.; Mazzoli, S. Thin-skinned versus thick-skinned structural models for Apulian carbonate reservoirs: Constraints from the Val d’Agri Fields, S Apennines, Italy. Mar. Pet. Geol. 2004, 21, 805–827. [Google Scholar] [CrossRef] [Scilit]
- Mazzoli, S.; D’Errico, M.; Aldega, L.; Corrado, S.; Invernizzi, C.; Shiner, P.; Zattin, M. Tectonic burial and “young” (<10 Ma) exhumation in the southern Apennines fold-and-thrust belt (Italy). Geology 2008, 36, 243–246. [Google Scholar] [CrossRef] [Scilit]
- Ferranti, L.; Oldow, J.S.; Sacchi, M. Pre-Quaternary orogen-parallel extension in the Southern Apennine belt, Italy. Tectonophysics 1996, 260, 325–347. [Google Scholar] [CrossRef] [Scilit]
- Bucci, F.; Novellino, R.; Tavarnelli, E.; Prosser, G.; Guzzetti, G.; Cardinali, M.; Gueguen, E.; Guglielmi, P.; Adurno, I. Frontal collapse during thrust propagation in mountain belts: A case study in the Lucanian Apennines, Southern Italy. J. Geol. Soc. 2014, 171, 571–581. [Google Scholar] [CrossRef] [Scilit]
- Mazzoli, S.; Ascione, A.; Buscher, J.T.; Pignalosa, A.; Valente, E.; Zattin, M. Low- angle normal faulting and focused exhumation associated with late Pliocene change in tectonic style in the southern Apennines (Italy). Tectonics 2014, 33, 1802–1818. [Google Scholar] [CrossRef] [Scilit]
- Novellino, R.; Prosser, G.; Spiess, R.; Viti, C.; Agosta, F.; Tavarnelli, E.; Bucci, F. Dynamic weakening along incipient low-angle normal faults in pelagic limestones (Southern Apennines, Italy). J. Geol. Soc. 2015, 172, 283–286. [Google Scholar] [CrossRef] [Scilit]
- Hippolyte, J.C.; Angelier, J.; Barrier, E. Compressional and extensional tectonics in an arc system: Example of the Southern Apennines. J. Struct. Geol. 1995, 17, 1725–1740. [Google Scholar] [CrossRef] [Scilit]
- Noguera, A.M.; Rea, G. Deep structure of the campanian-lucanian arc (southern apennine, Italy). Tectonophysics 2000, 324, 239–265. [Google Scholar] [CrossRef] [Scilit]
- Pantosti, D.; Valensise, G. Faulting mechanism complexity of the November 23, 1980, Campania-Lucania earthquake inferred from surface observations. J. Geophys. Res. 1990, 95, 15319–15341. [Google Scholar] [CrossRef] [Scilit]
- Mallet, R. Great Neapolitan Earthquake of 1857: The First Principles of Observational Seismology, 2 Vols.; Chapman and Hall: London, UK, 1862; pp. 486–494. [Google Scholar]
- Branno, A.; Esposito, E.G.I.; Maturano, A.; Porfido, S.; Rinaldis, V. Studio, su base macrosismica, del terremoto della Basilicata del 16 dicembre 1857. Boll. Soc. Nat. Napoli 1985, 92, 249–338. [Google Scholar]
- CPTI. Catalogo Parametrico dei Terremoti Italiani, INGV. 2022. Available online: http://emidius.mi.ingv.it/CPTI15-DBMI15/ (accessed on 19 July 2024).
- Di Niro, A.; Giano, S.I.; Santangelo, N. Primi dati sull’evoluzione geomorfologica e sedimentaria del bacino dell’alta Val d’Agri (Basilicata). Studi Geol. Camerti Nuova Ser. 1992, 1992, 257–263. [Google Scholar]
- Cello, G.; Gambini, R.; Mazzoli, S.; Read, A.; Tondi, E.; Zucconi, V. Fault zone characteristics and scaling properties of the Val d’Agri Fault system (Southern Apennines, Italy). J. Geodyn. 2000, 29, 293–307. [Google Scholar] [CrossRef] [Scilit]
- Mosca, F.; Wavrek, D.; Jarvie, D. Compositional Grading in the Oil Column—Advances from a Mass Balance and Quantitative Molecular Analysis. In 1st EAGE North African/Mediterranean Petroleum & Geosciences Conference & Exhibition; European Association of Geoscientists & Engineers: Bunnik, The Netherlands, 2003. [Google Scholar] [CrossRef] [Scilit]
- Lentini, F. Carta Geologica del Bacino del Fiume Agri; Regione Basilicata 1991-735 Dipartimento Assetto del Territorio. S.EL.CA.: Firenze, Italy, 1991. [Google Scholar]
- Dunham, R. Classification of carbonate rocks according to depositional textures. In Classification of Carbonate Rocks; Ham, W.E., Ed.; American Association of Petroleum Geologists: Tulsa, OK, USA, 1962; Volume 1, pp. 108–121. [Google Scholar]
- Allmendinger, R.; Cardozo, N.; Fisher, D. Structural Geology Algorithms: Vectors and Tensors; Cambridge University Press: Cambridge, UK, 2012. [Google Scholar] [CrossRef] [Scilit]
- Cardozo, N.; Allmendinger, R.W. Spherical projections with OSXStereonet. Comput. Geosci. 2013, 51, 193–205. [Google Scholar] [CrossRef] [Scilit]
- Agisoft Metashape Professional. 2024. Available online: http://www.agisoft.com/ (accessed on 22 May 2025).
- Corradetti, A.; Seers, T.; Mercuri, M.; Calligaris, C.; Busetti, A.; Zini, L. Benchmarking Different SfM-MVS Photogrammetric and iOS LiDAR Acquisition Methods for the Digital Preservation of a Short-Lived Excavation: A Case Study from an Area of Sinkhole Related Subsidence. Remote Sens. 2022, 14, 5187. [Google Scholar] [CrossRef] [Scilit]
- Tavani, S.; Arbues, P.; Snidero, M.; Carrera, N.; Munoz, J.A. Open Plot Project: An open-source toolkit for 3-D structural data analysis. Solid Earth 2011, 2, 53–63. [Google Scholar] [CrossRef] [Scilit]
- Healy, D.; Rizzo, R.E.; Cornwell, D.G.; Farrell, N.J.C.; Watkins, H.; Timms, N.E.; Gomez-Rivas, E.; Smith, M. FracPaQ: A MATLAB™ toolbox for the quantification of fracture patterns. J. Struct. Geol. 2017, 95, 1–16. [Google Scholar] [CrossRef] [Scilit]
- Menegoni, N.; Giordan, D.; Inama, R.; Perotti, C. DICE: An open-source MATLAB application for quantification and parametrization of digital outcrop model-based fracture datasets. J. Rock Mech. Geotech. Eng. 2023, 15, 1090–1110. [Google Scholar] [CrossRef] [Scilit]
- Suppe, J. Geometry and kinematics of fault-bend folding. Am. J. Sci. 1983, 283, 684–721. [Google Scholar] [CrossRef] [Scilit]
- Doblas, M. Slickenside kinematic indicators. Tectonophysics 1998, 295, 187–197. [Google Scholar] [CrossRef] [Scilit]
- Bucci, F.; Novellino, R.; Guglielmi, P.; Tavarnelli, E. Growth and dissection of a fold and thrust belt: The geological record of the high Agri Valley, Italy. J. Maps 2020, 16, 245–256. [Google Scholar] [CrossRef] [Scilit]
- Nickelsen, R.P. Fossil distortion and penetrative rock deformation in the appalachian plateau, Pennsylvania. J. Geol. 1966, 74, 924–931. [Google Scholar] [CrossRef] [Scilit]
- Engelder, T.; Engelder, R. Fossil distortion and d’ecollement tectonics of the Appalachian Plateau. Geology 1977, 5, 457–460. [Google Scholar] [CrossRef] [Scilit]
- Alvarez, W.; Engelder, T.; Geiser, P.A. Classification of solution cleavage in pelagic limestones. Geology 1978, 6, 263–266. [Google Scholar] [CrossRef] [Scilit]
- Holl, J.E.; Anastasio, D.J. Cleavage development within a foreland fold and thrust belt, southern Pyrenees, Spain. J. Struct. Geol. 1995, 17, 357–369. [Google Scholar] [CrossRef] [Scilit]
- Agosta, F.; Aydin, A. Architecture and deformation mechanism of a basin- bounding normal fault in Mesozoic platform carbonates, central Italy. J. Struct. Geol. 2006, 28, 1445–1467. [Google Scholar] [CrossRef] [Scilit]
- Quinta, A.; Tavani, S. The foreland deformation in the south-western Basque-Cantabrian Belt (Spain). Tectonophysics 2012, 576–577, 4–19. [Google Scholar] [CrossRef] [Scilit]
- Ramsay, J.G. Folding and Fracturing of Rocks; McGraw-Hill: New York, NY, USA, 1967; p. 568. [Google Scholar]
- Stearns, D.W. Certain aspects of fractures in naturally deformed rocks. In Rock Mechanics Seminar; Riecker, R.E., Ed.; Terrestrial Sciences Laboratory: Bedford, MA, USA, 1968; pp. 97–118. [Google Scholar]
- Price, N.J.; Cosgrove, J.W. The Analysis of Geological Structures; Cambridge University Press: Cambridge, UK, 1990. [Google Scholar]
- Graham Wall, B.R.; Girbacea, R.; Mesonjesi, A.; Aydin, A. Evolution of fracture and fault-controlled fluid pathways in carbonates of the Albanides fold-thrust belt. AAPG Bull. 2006, 90, 1227–1249. [Google Scholar] [CrossRef] [Scilit]
- Aydin, A.; Antonellini, M.; Tondi, E.; Agosta, F. Deformation along the leading edge of the Majella thrust sheet in central Italy. J. Struct. Geol. 2010, 32, 1291–1304. [Google Scholar] [CrossRef] [Scilit]
- Cello, G.; Tondi, E.; Micarelli, L.; Mattioni, L. Active tectonics and earthquake sources in the epicentral area of the 1857 Basilicata earthquake (Southern Italy). J. Geodyn. 2003, 36, 37–50. [Google Scholar] [CrossRef] [Scilit]
- Beaubien, S.E.; Schirripa Spagnolo, G.; Ridolfi, R.M.; Aldega, L.; Antoncecchi, I.; Bigi, S.; Billi, A.; Carminati, E. Structural control of gas migration pathways in the hydrocarbon-rich Val d’Agri basin (Southern Apennines, Italy). Mar. Petrol. Geol. 2023, 154, 106339. [Google Scholar] [CrossRef] [Scilit]
- Twiss, R.J.; Moores, E.M. Structural Geology; W.H. Freeman and Company: New York, NY, USA, 1992. [Google Scholar]
- Giuffrida, A.; La Bruna, V.; Castelluccio, P.; Panza, E.; Rustichelli, A.; Tondi, E.; Giorgioni, M.; Agosta, F. Fracture simulation parameters of fractured reservoirs: Analogy with outcropping carbonates of the Inner Apulian Platform, southern Italy. J. Struct. Geol. 2019, 123, 18–41. [Google Scholar] [CrossRef] [Scilit]
- Agosta, F.; Alessandroni, M.; Tondi, E.; Aydin, A. Oblique normal faulting along the northern edge of the Majella Anticline, central Italy: Inferences on hydrocarbon migration and accumulation. J. Struct. Geol. 2009, 31, 674–690. [Google Scholar] [CrossRef] [Scilit]
- Sibson, R.H. Earthquake rupturing as a hydrothermal mmeralising agent. Geology 1987, 15, 701–770. [Google Scholar]
- Berg, S.S.; Skar, T. Controls on damage zone asymmetry of a normal fault zone: Outcrop analysis of a segment of the Moab fault, SE Utah. J. Struct. Geol. 2005, 27, 1803–1822. [Google Scholar] [CrossRef] [Scilit]
- Wilson, J.E.; Chester, J.S.; Chester, F.M.; Brune, J. Microfracture analysis of fault growth and wear processes, Punchbowl Fault, San Andreas system, California. J. Struct. Geol. 2003, 25, 1855–1873. [Google Scholar] [CrossRef] [Scilit]
- Faulkner, D.R.; Mitchell, T.M.; Healy, D.; Heap, M.J. Slip on ‘weak’ faults by the rotation of regional stress in the fracture damage zone. Nature 2006, 444, 922–925. [Google Scholar] [CrossRef] [Scilit] [PubMed]
- Mitchell, T.M.; Faulkner, D.R. The nature and origin of off-fault damage surrounding strike–slip fault zones with a wide range of displacements: A field study from the Atacama fault system, northern Chile. J. Struct. Geol. 2009, 31, 802–816. [Google Scholar] [CrossRef] [Scilit]
- Savage, H.M.; Brodsky, E.E. Collateral damage: Evolution with displacement of fracture distribution and secondary fault strands in fault damage zones. J. Geophys. Res. 2011, 116, B03405. [Google Scholar] [CrossRef] [Scilit]
- Johri, M.; Dunham, E.M.; Zoback, M.D.; Fang, Z. Predicting fault damage zones by modeling dynamic rupture propagation and comparison with field observations. J. Geophys. Res. Solid Earth 2014, 119, 1251–1272. [Google Scholar] [CrossRef] [Scilit]
- Ceccato, A.; Tartaglia, G.; Antonellini, M.; Viola, G. Multiscale lineament analysis and permeability heterogeneity of fractured crystalline basement blocks. Solid Earth 2022, 13, 1431–1453. [Google Scholar] [CrossRef] [Scilit]
- Demurtas, M.; Fondriest, M.; Balsamo, F.; Clemenzi, L.; Storti, F.; Bistacchi, A.; Di Toro, G. Structure of a normal seismogenic fault zone in carbonates: The Vadodi Corno Fault, Campo Imperatore, Central Apennines (Italy). J. Struct. Geol. 2016, 90, 185–206. [Google Scholar] [CrossRef] [Scilit]
- Agosta, F.; Wilson, C.; Aydin, A. The role of mechanical stratigraphy on normal fault growth across a Cretaceous carbonate multi-layer, central Texas (USA). Ital. J. Geosci. 2015, 134, 423–441. [Google Scholar] [CrossRef] [Scilit]
- Pollard, D.D.; Aydin, A. Progress in understanding jointing over the past century. Bull. Geol. Soc. Am. 1988, 100, 1181–1204. [Google Scholar] [CrossRef] [Scilit]
- Caine, J.S.; Evans, J.P.; Forster, C.B. Fault zone architecture and permeability structure. Geology 1996, 24, 1025–1028. [Google Scholar] [CrossRef] [Scilit]
- Bernier, L.; Soliva, R.; Roubinet, D.; Dominguez, S.; Mayolle, S.; Bulliard, M.; Wibberley, C.; Korbar, T. Spatial distribution of permeability in carbonate fault damage zones. J. Struct. Geol. 2025, 194, 105371. [Google Scholar] [CrossRef] [Scilit]
- Camanni, G.; Vinci, F.; Tavani, S.; Ferrandino, V.; Mazzoli, S.; Corradetti, A.; Parente, M.; Iannace, A. Fracture density variations within a reservoir-scale normal fault zone: A case study from shallow-water carbonates of southern Italy. J. Struct. Geol. 2021, 151, 104432. [Google Scholar] [CrossRef] [Scilit]
- Engelder, T.; Geiser, P. On the use of regional joint sets as trajectories of paleostress fields during the development of the Appalachian Plateau, New York. J. Geophys. Res. 1980, 85, 6319–6341. [Google Scholar] [CrossRef] [Scilit]
- Engelder, T.; Peacock, D.C.P. Joint development normal to regional compression during flexural-flow folding: The Lilstock buttress anticline, Somerset, England. J. Struct. Geol. 2001, 23, 259–277. [Google Scholar] [CrossRef] [Scilit]
- Tavani, S.; Storti, F.; Lacombe, O.; Corradetti, A.; Munoz, J.A.; Mazzoli, S. A review of deformation pattern templates in foreland basin systems and fold-and-thrust belts: Implications for the state of stress in the frontal regions of thrust wedges. Earth Sci. Rev. 2015, 141, 82–104. [Google Scholar] [CrossRef] [Scilit]
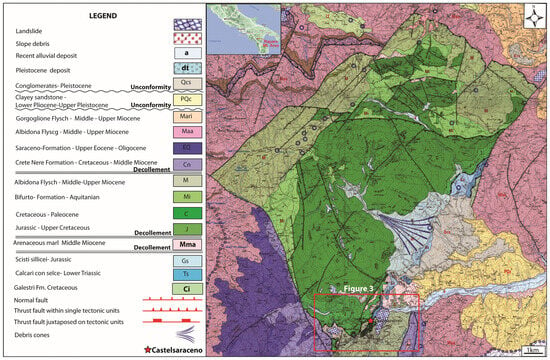
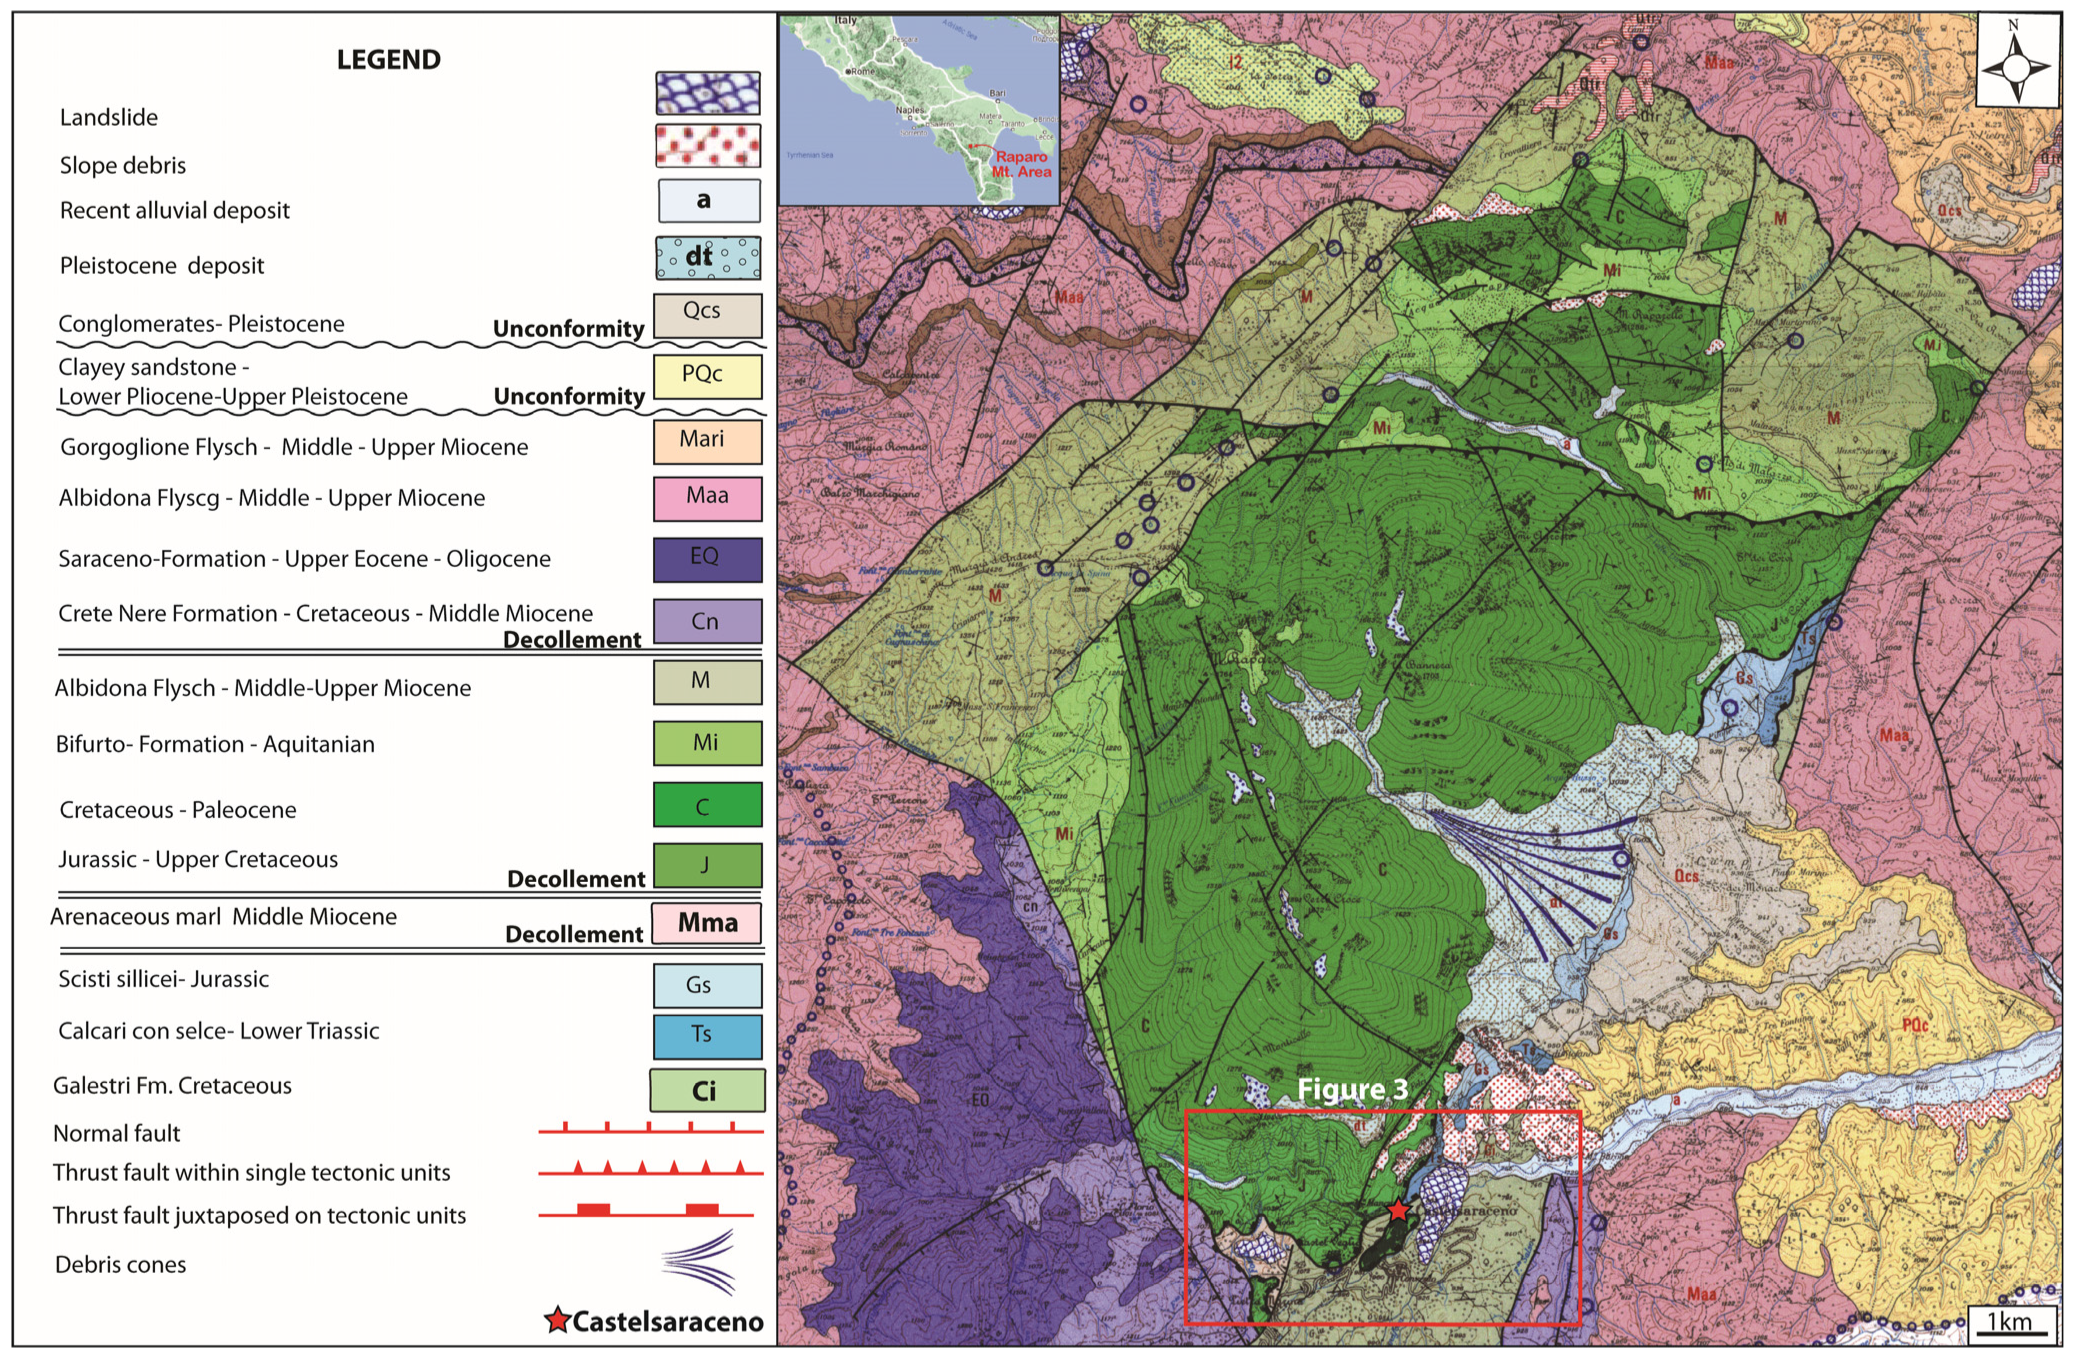
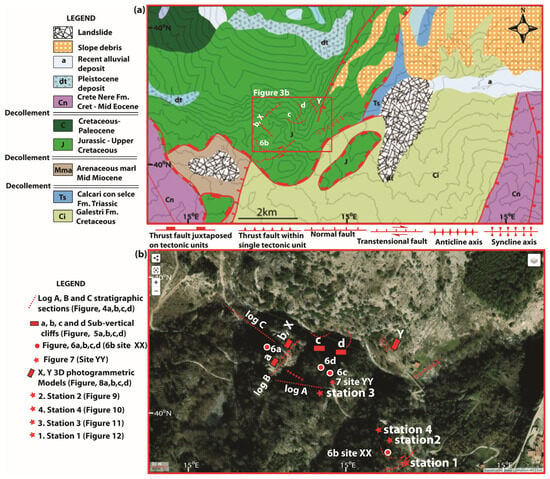
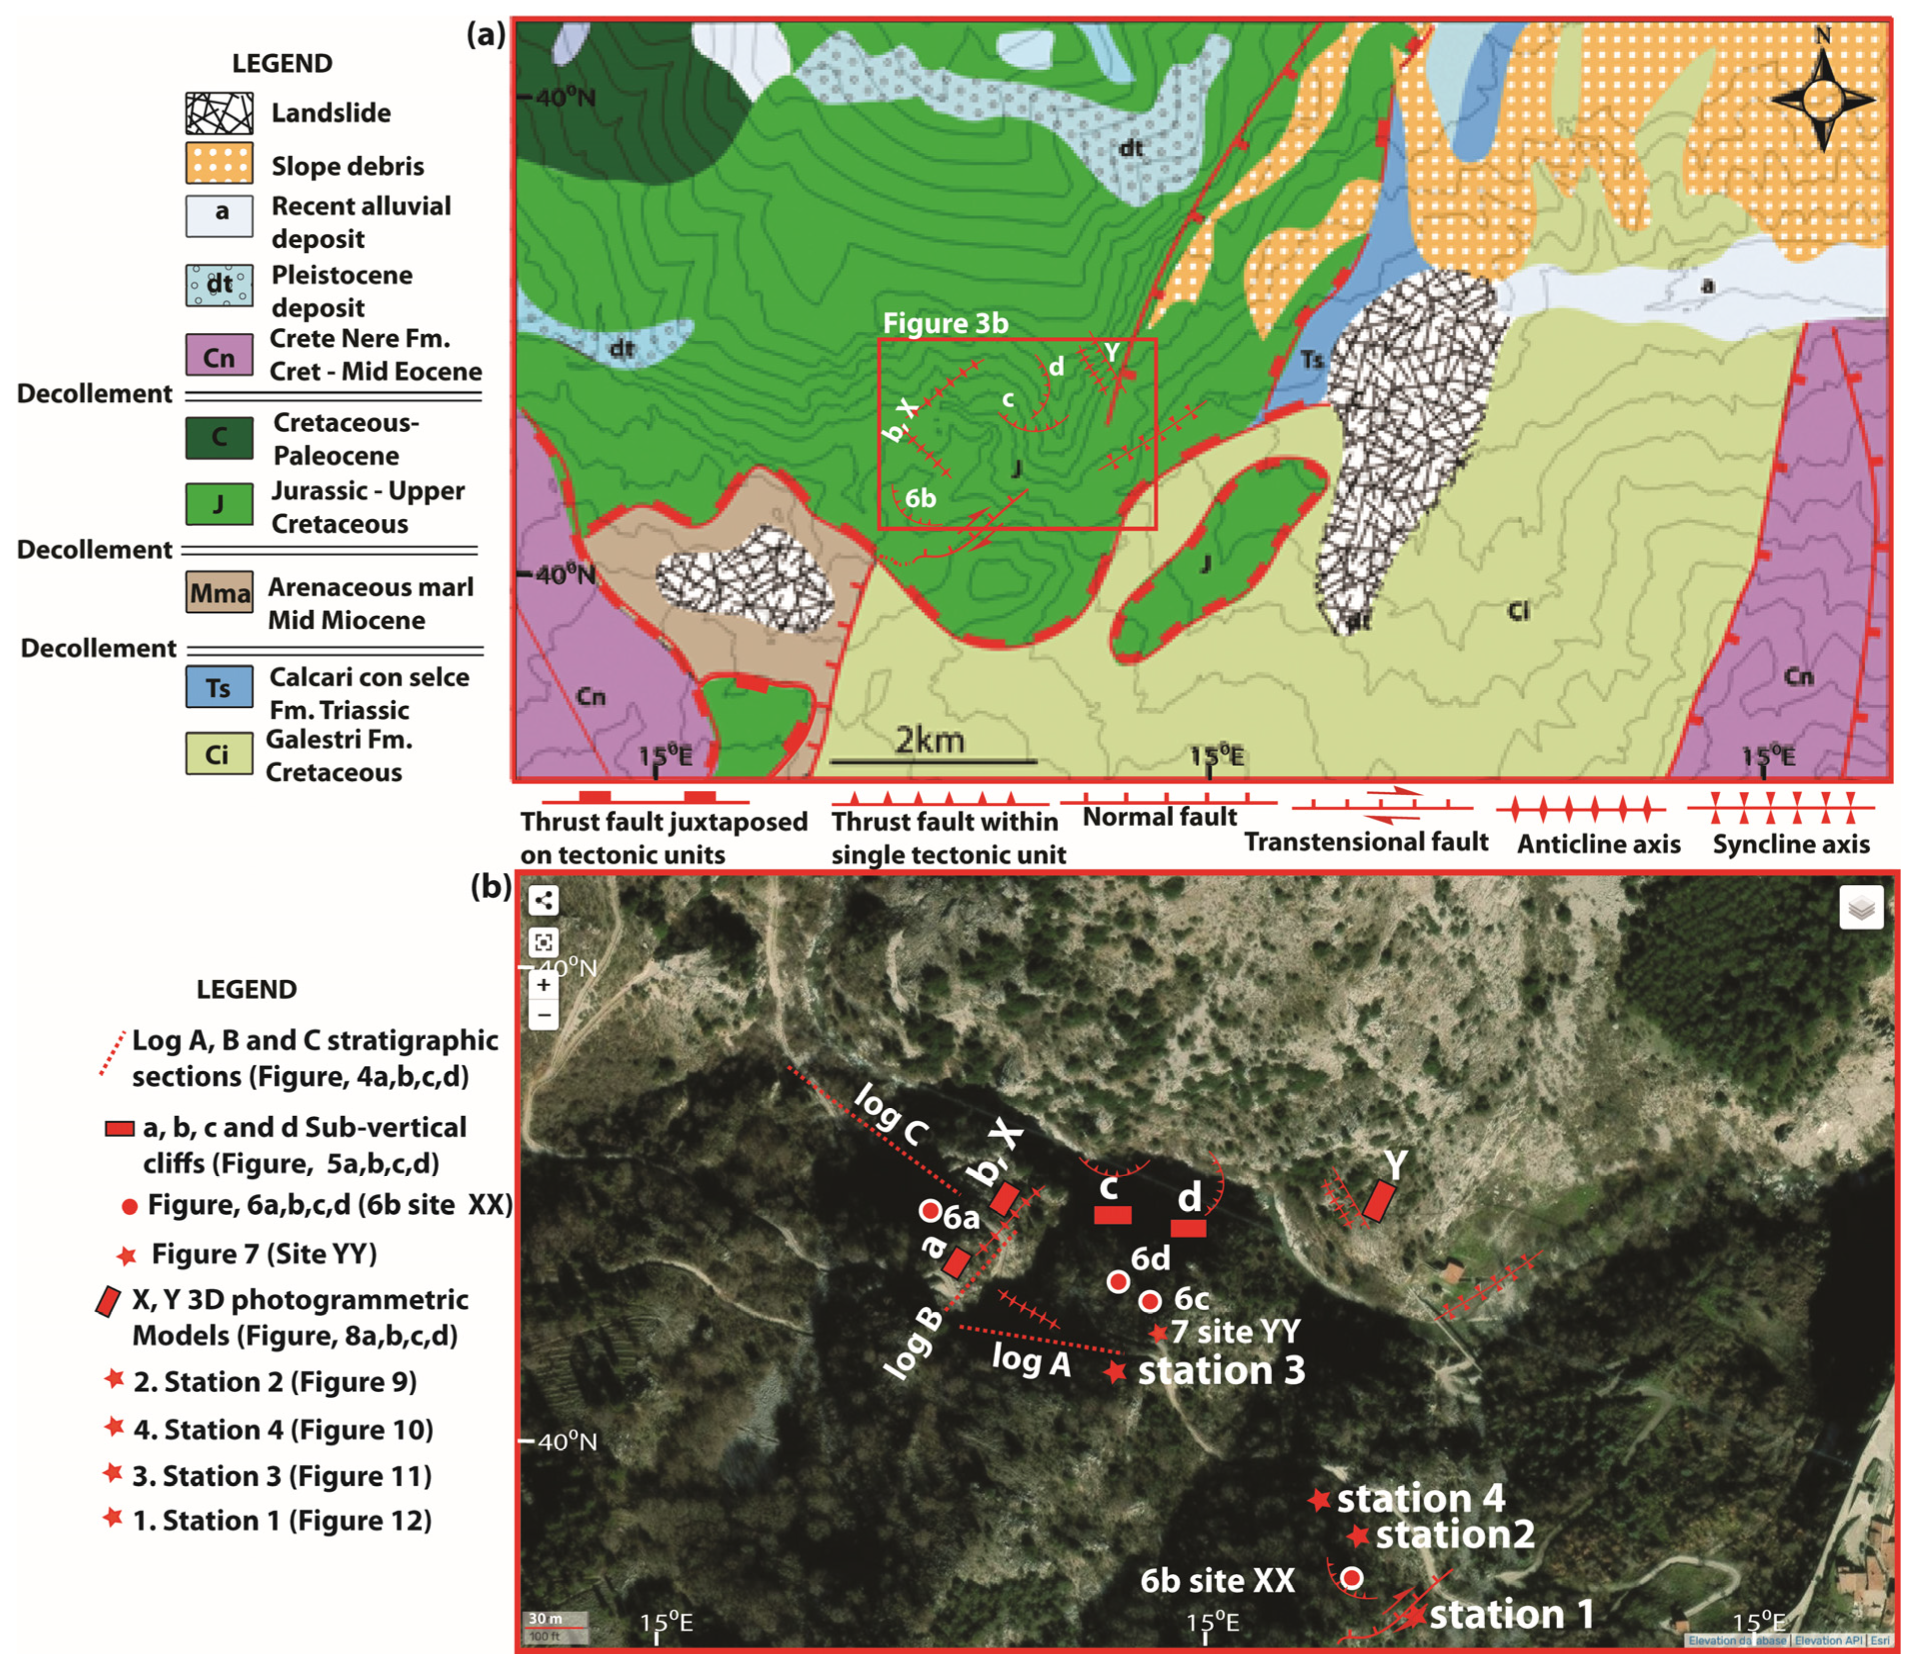
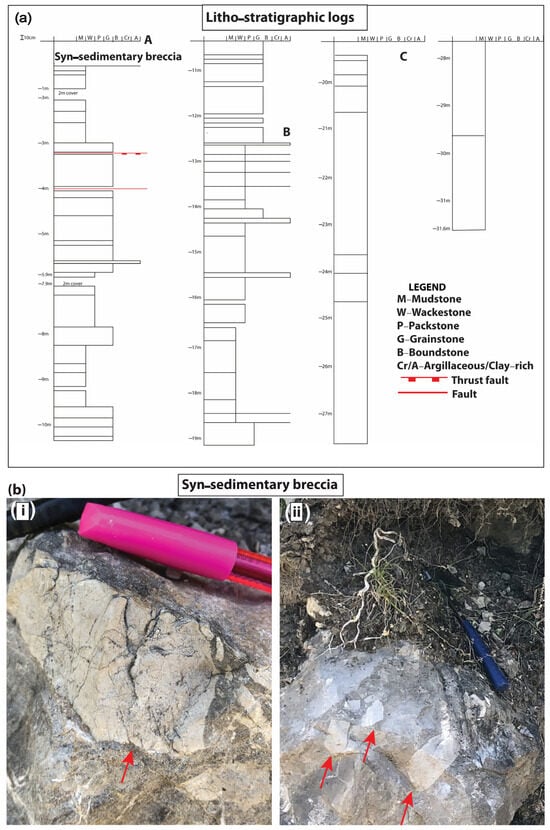
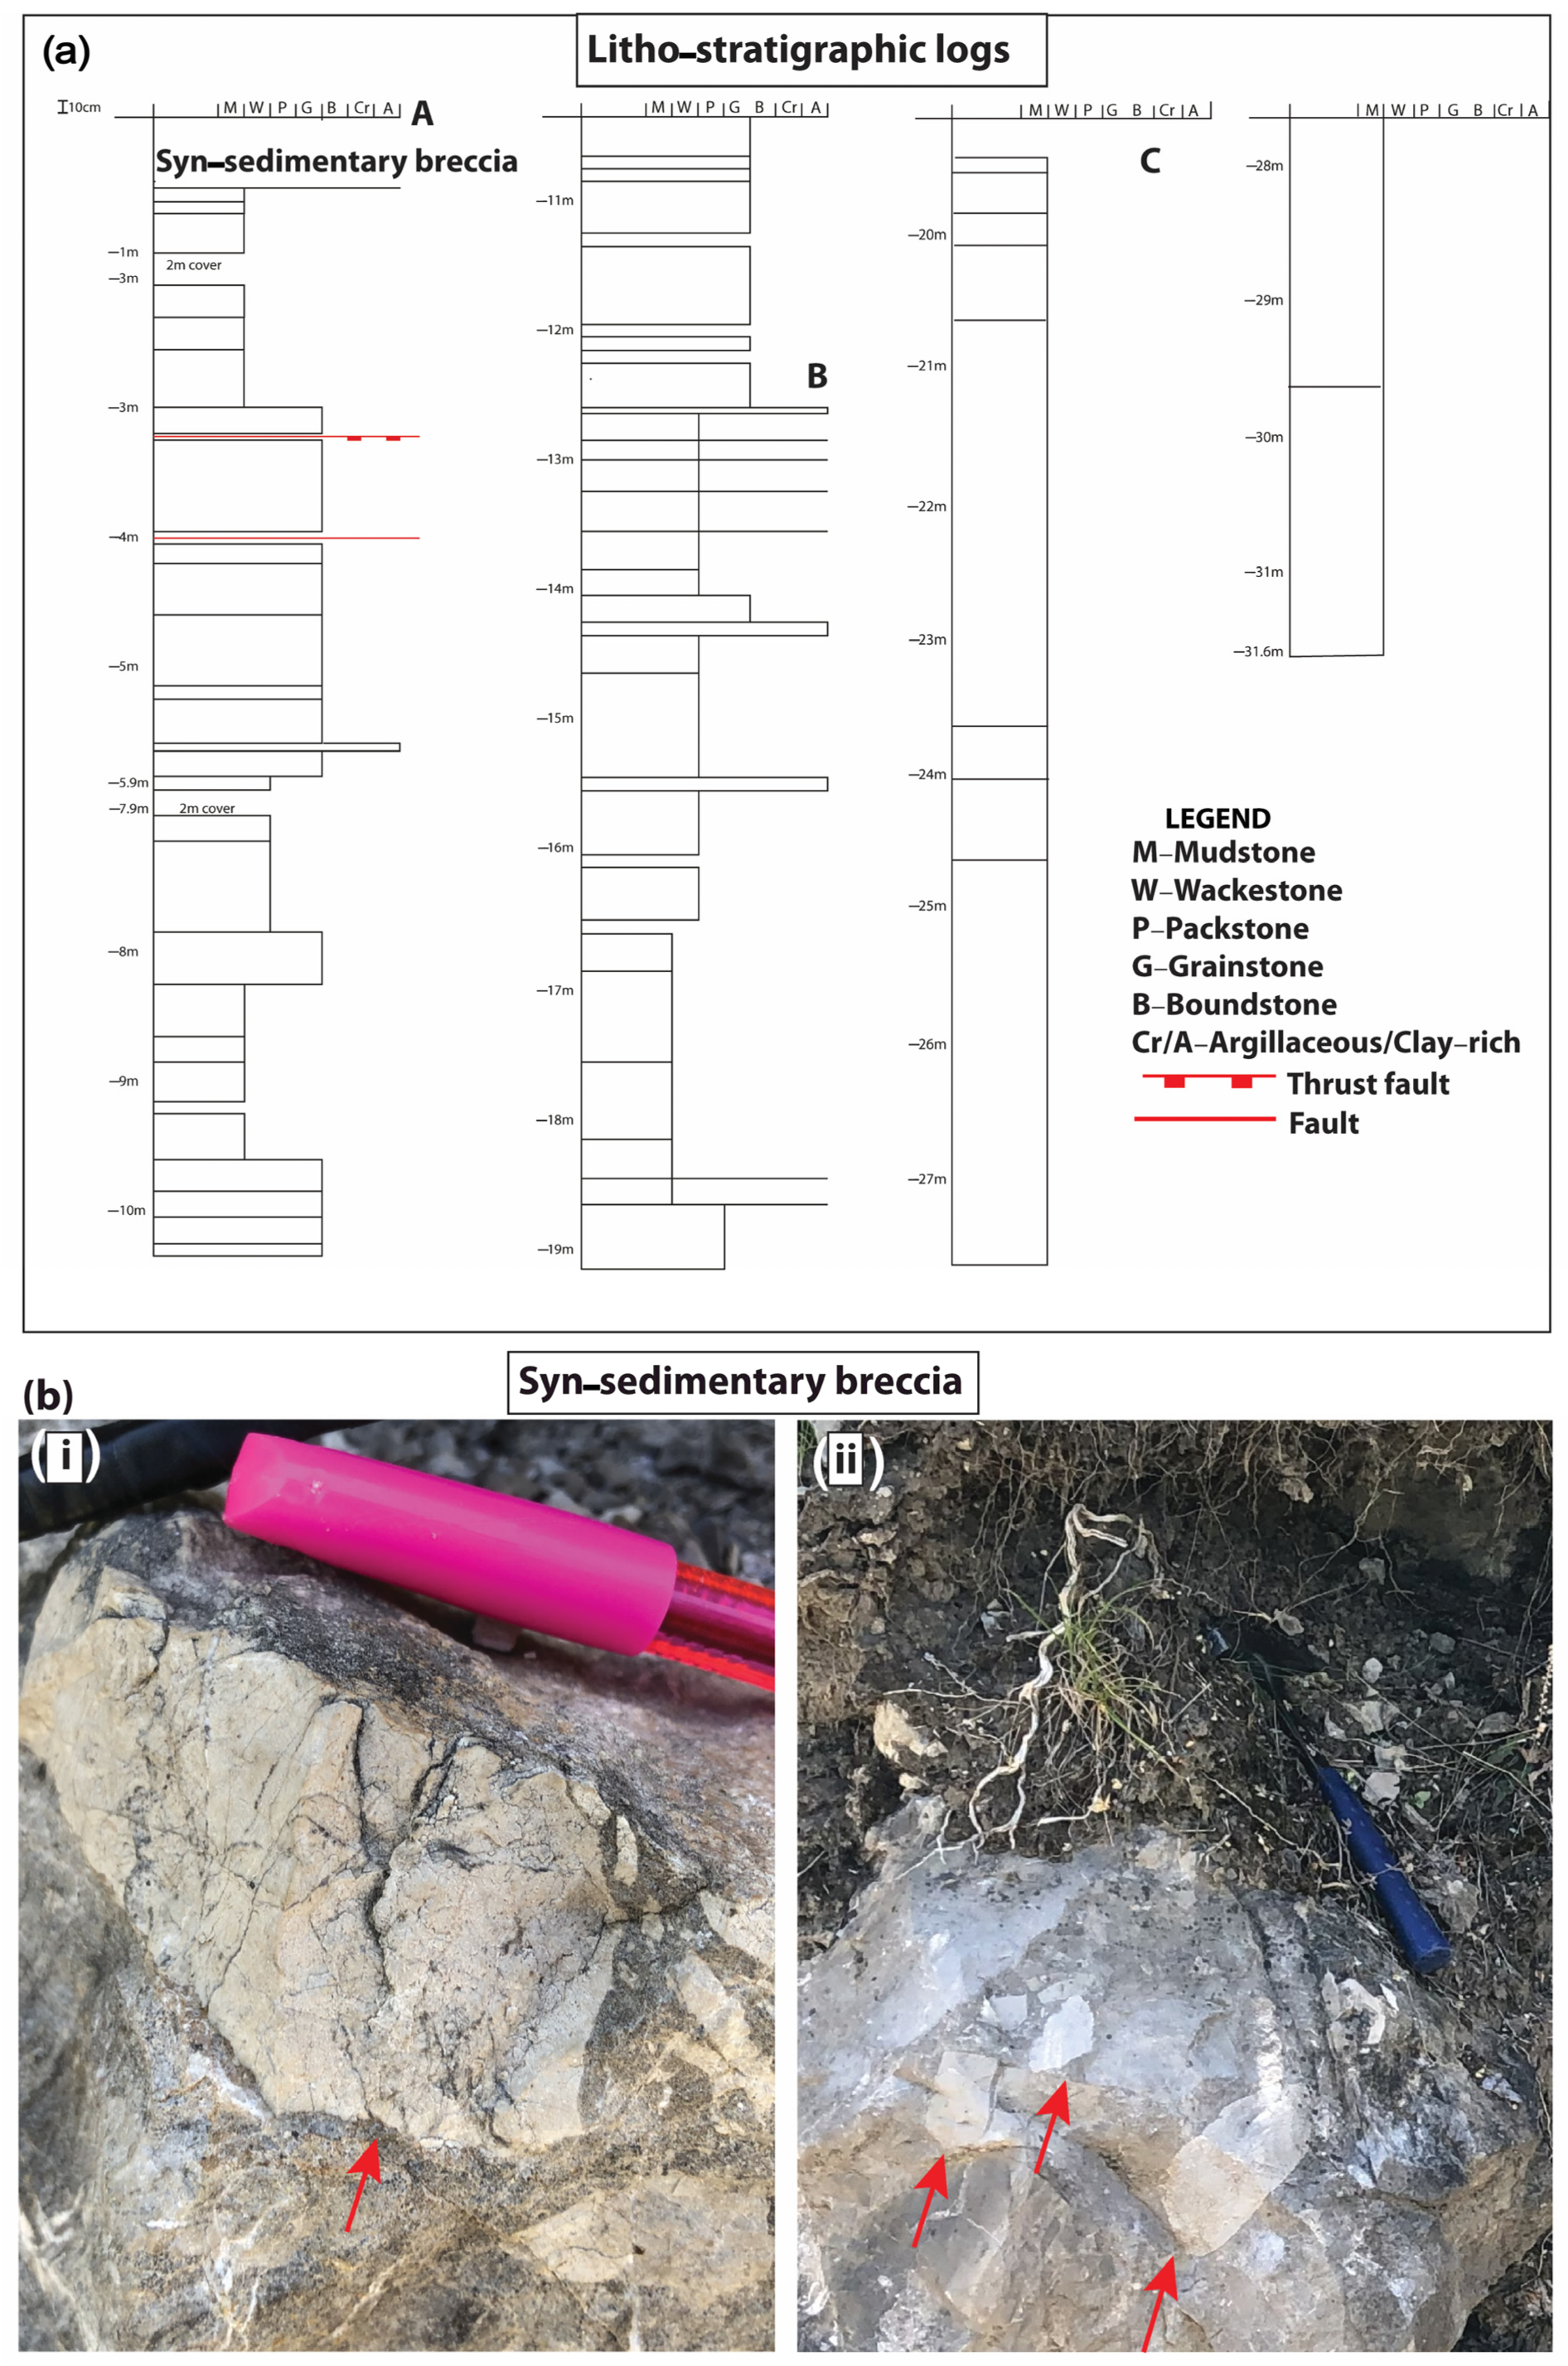
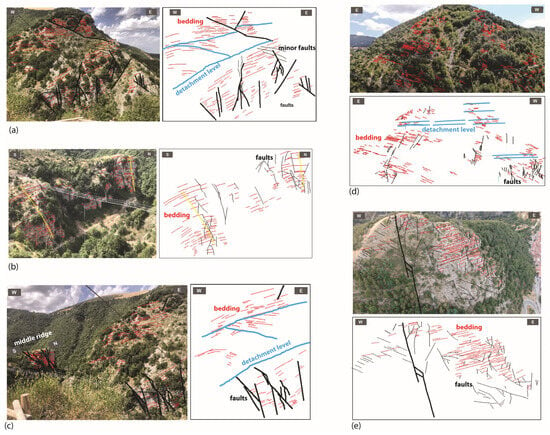
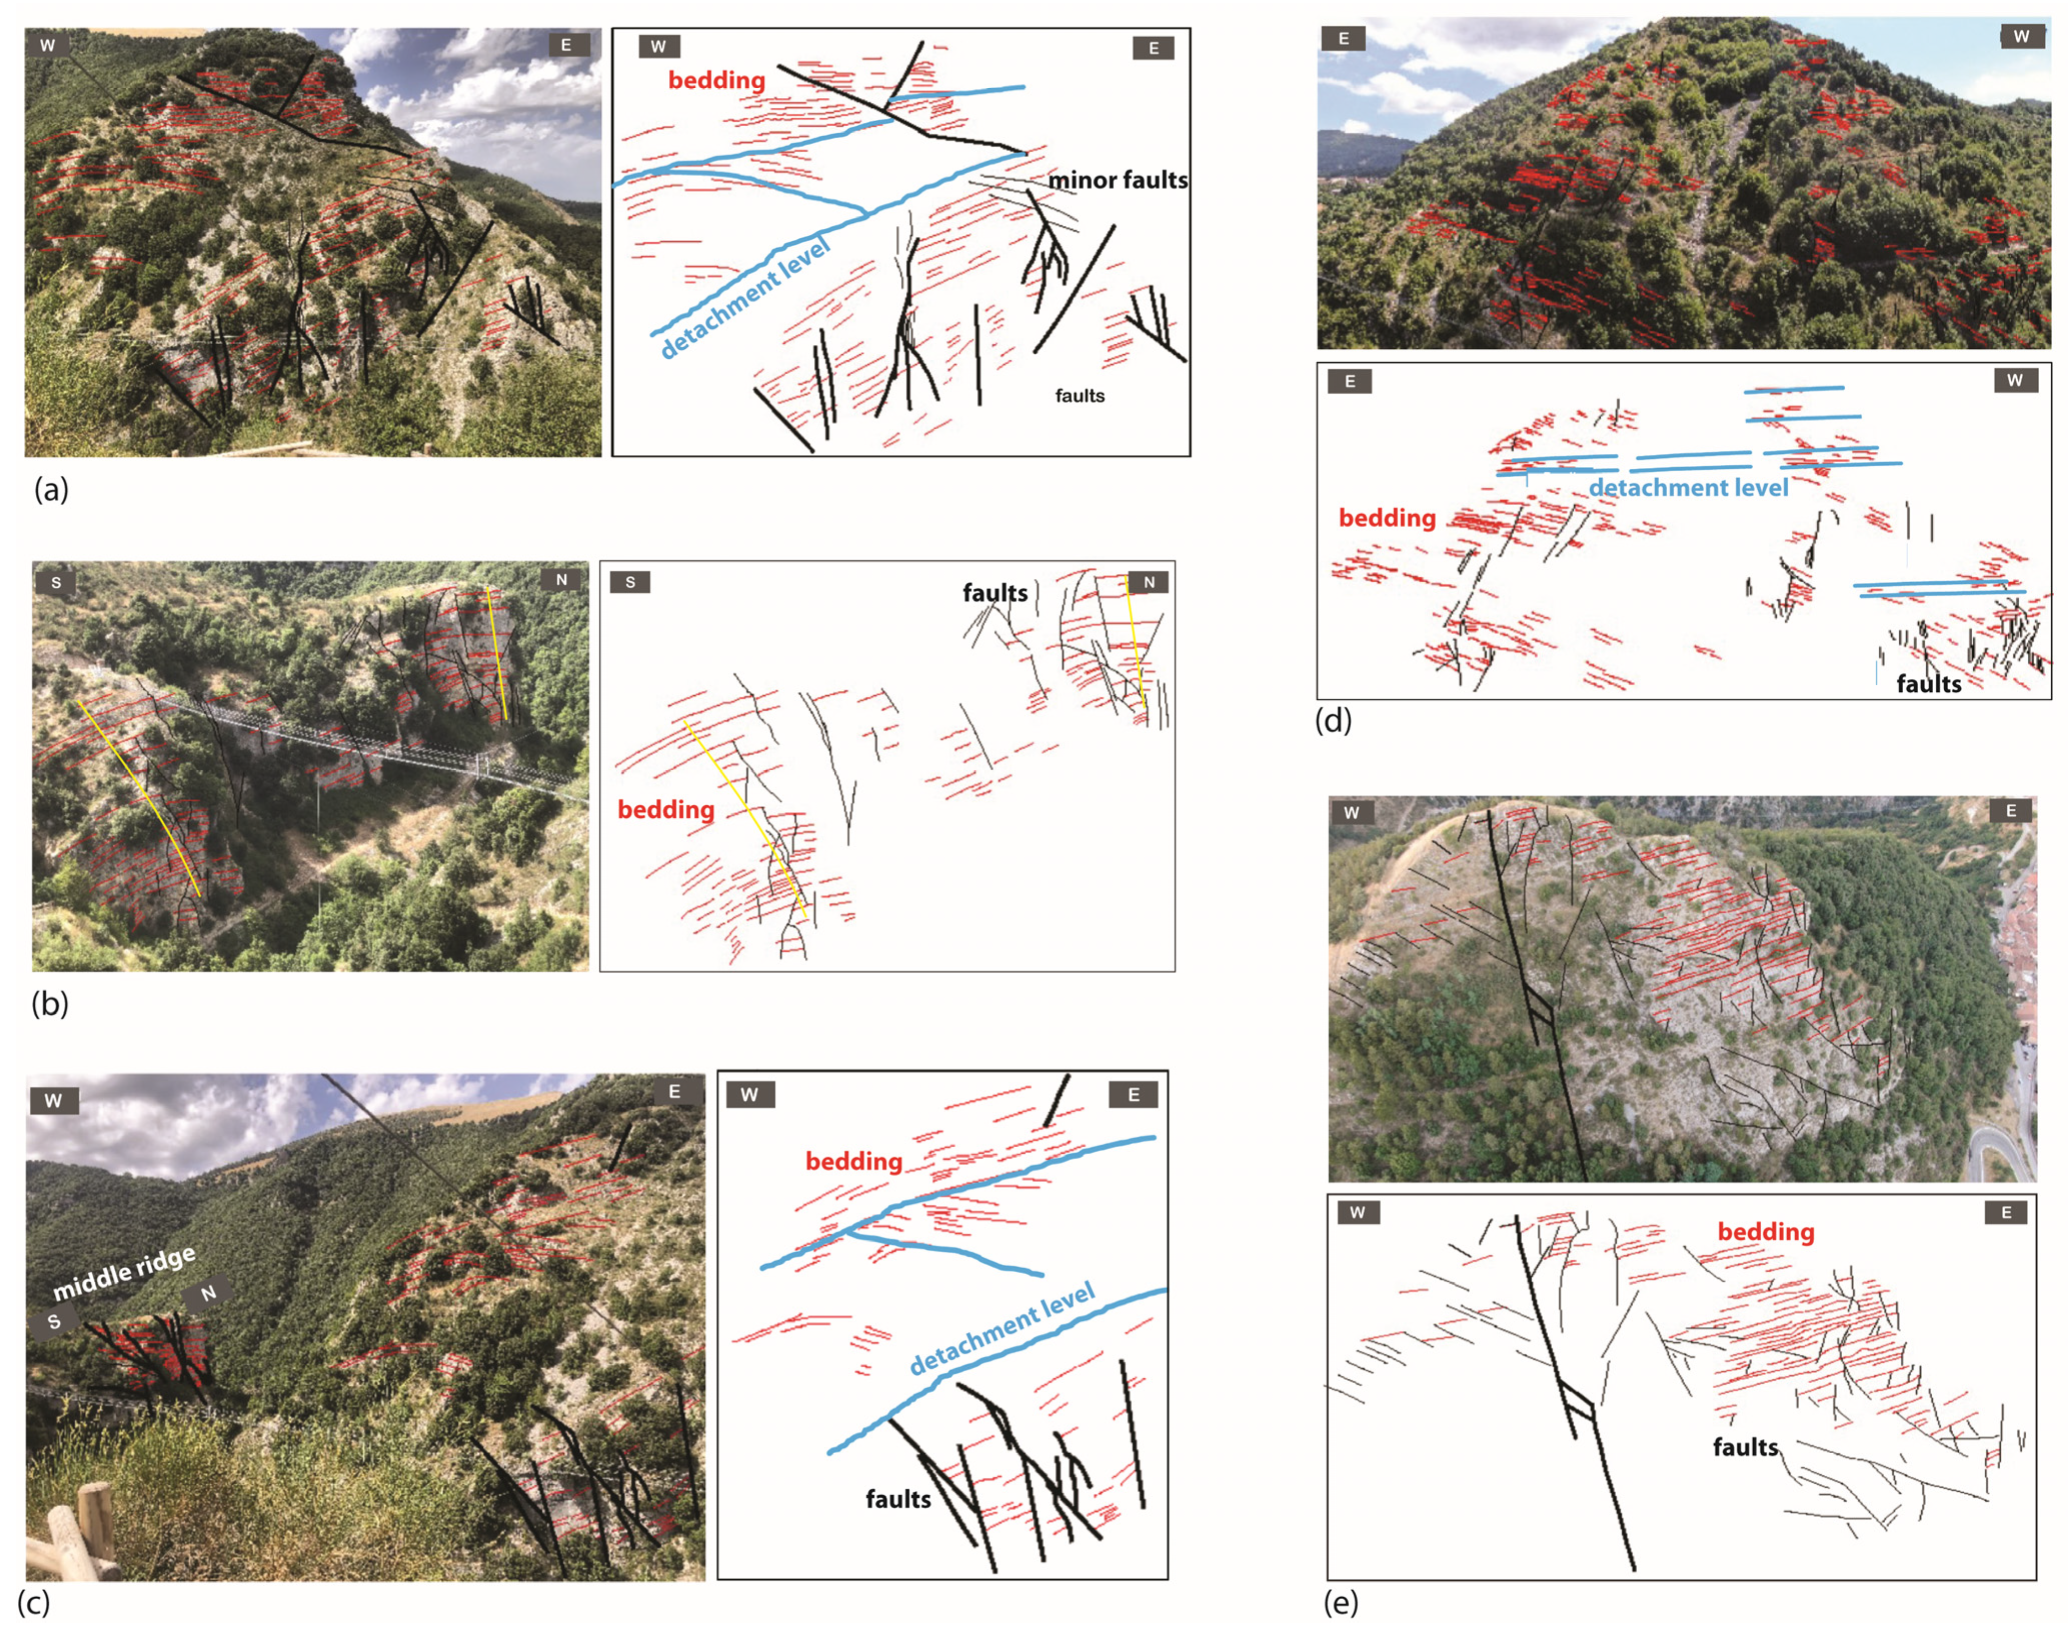
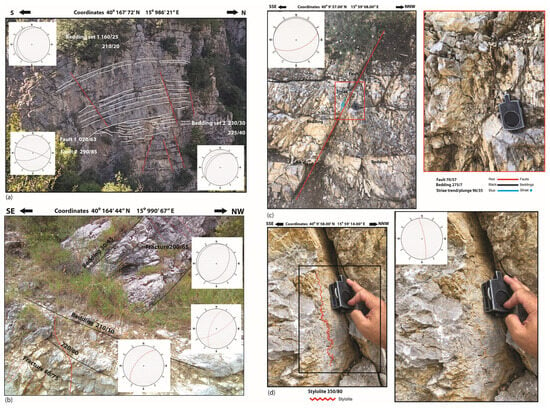
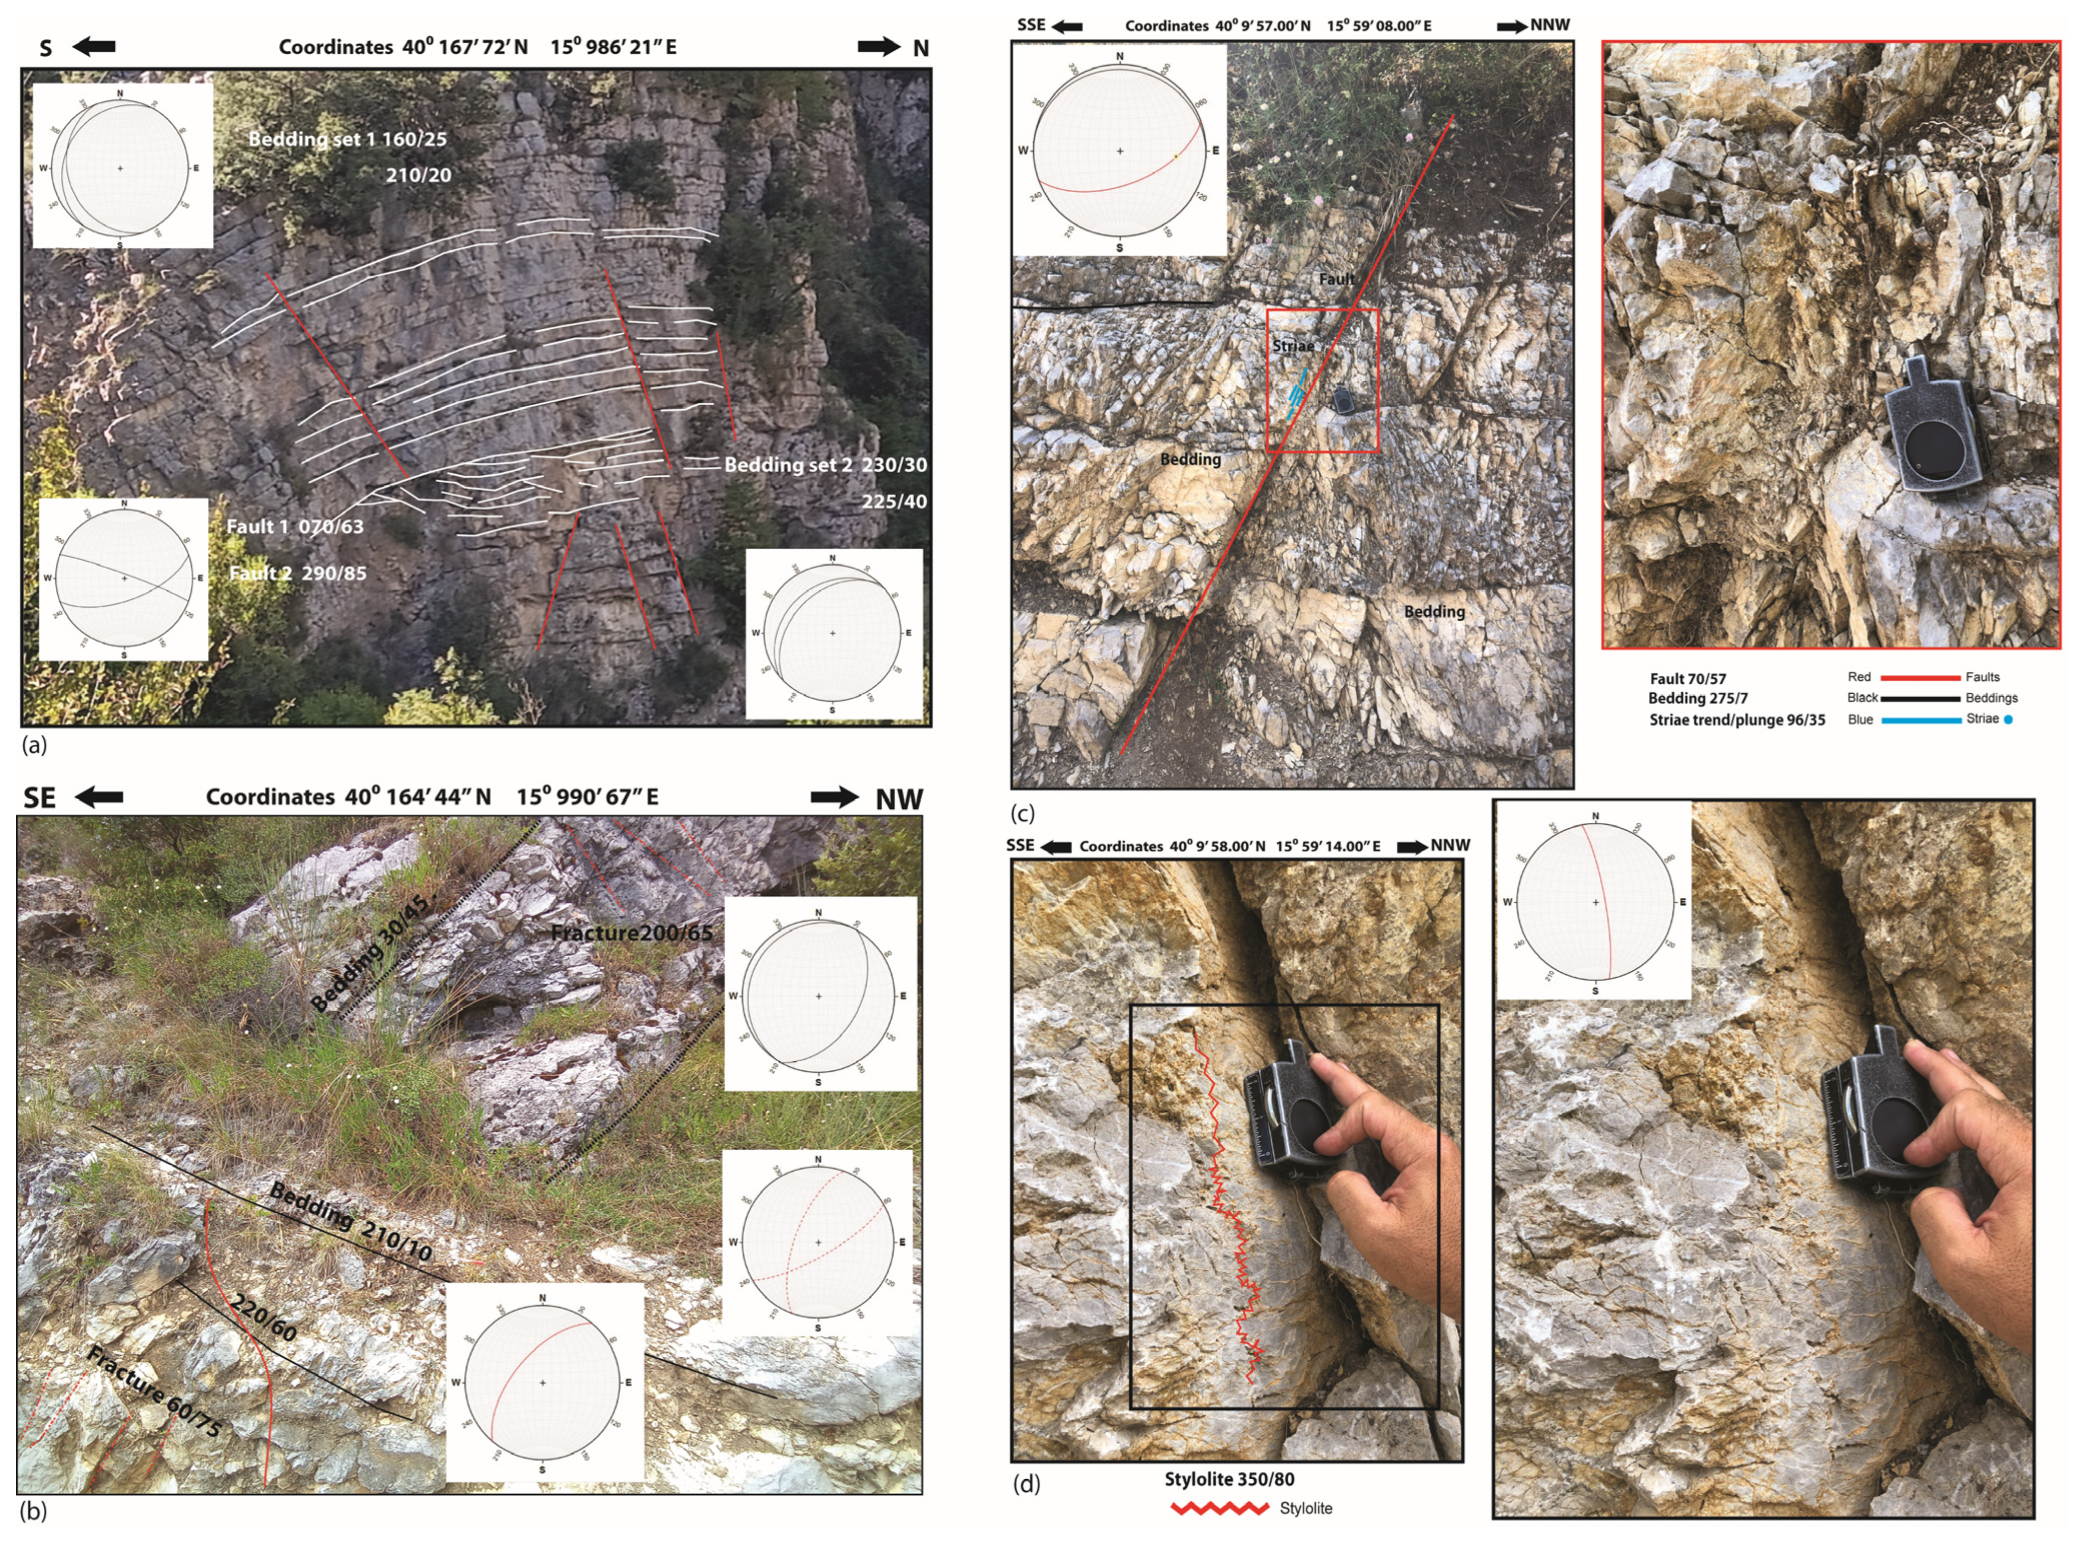
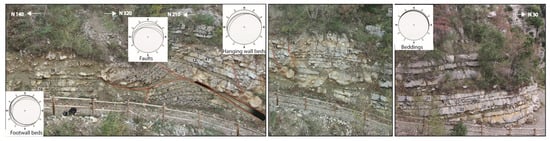
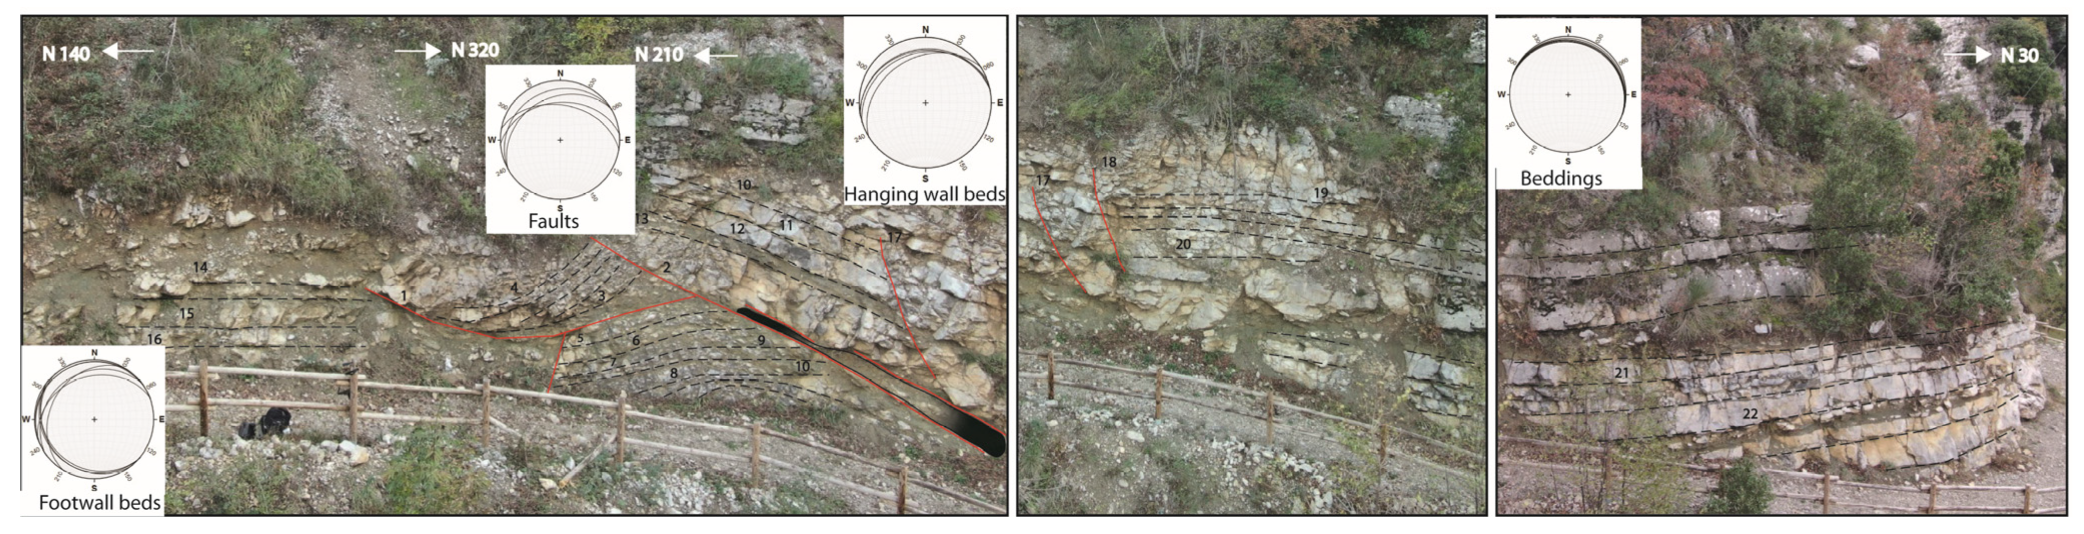
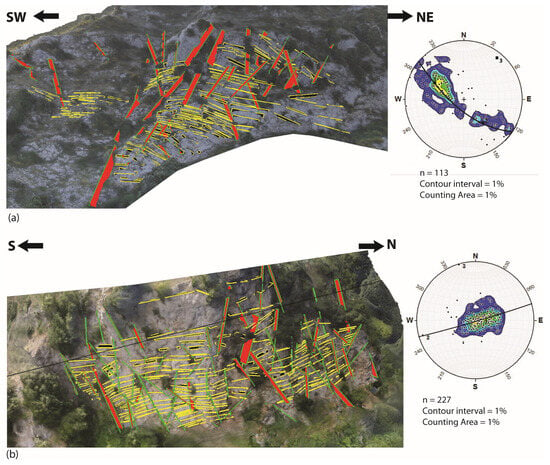
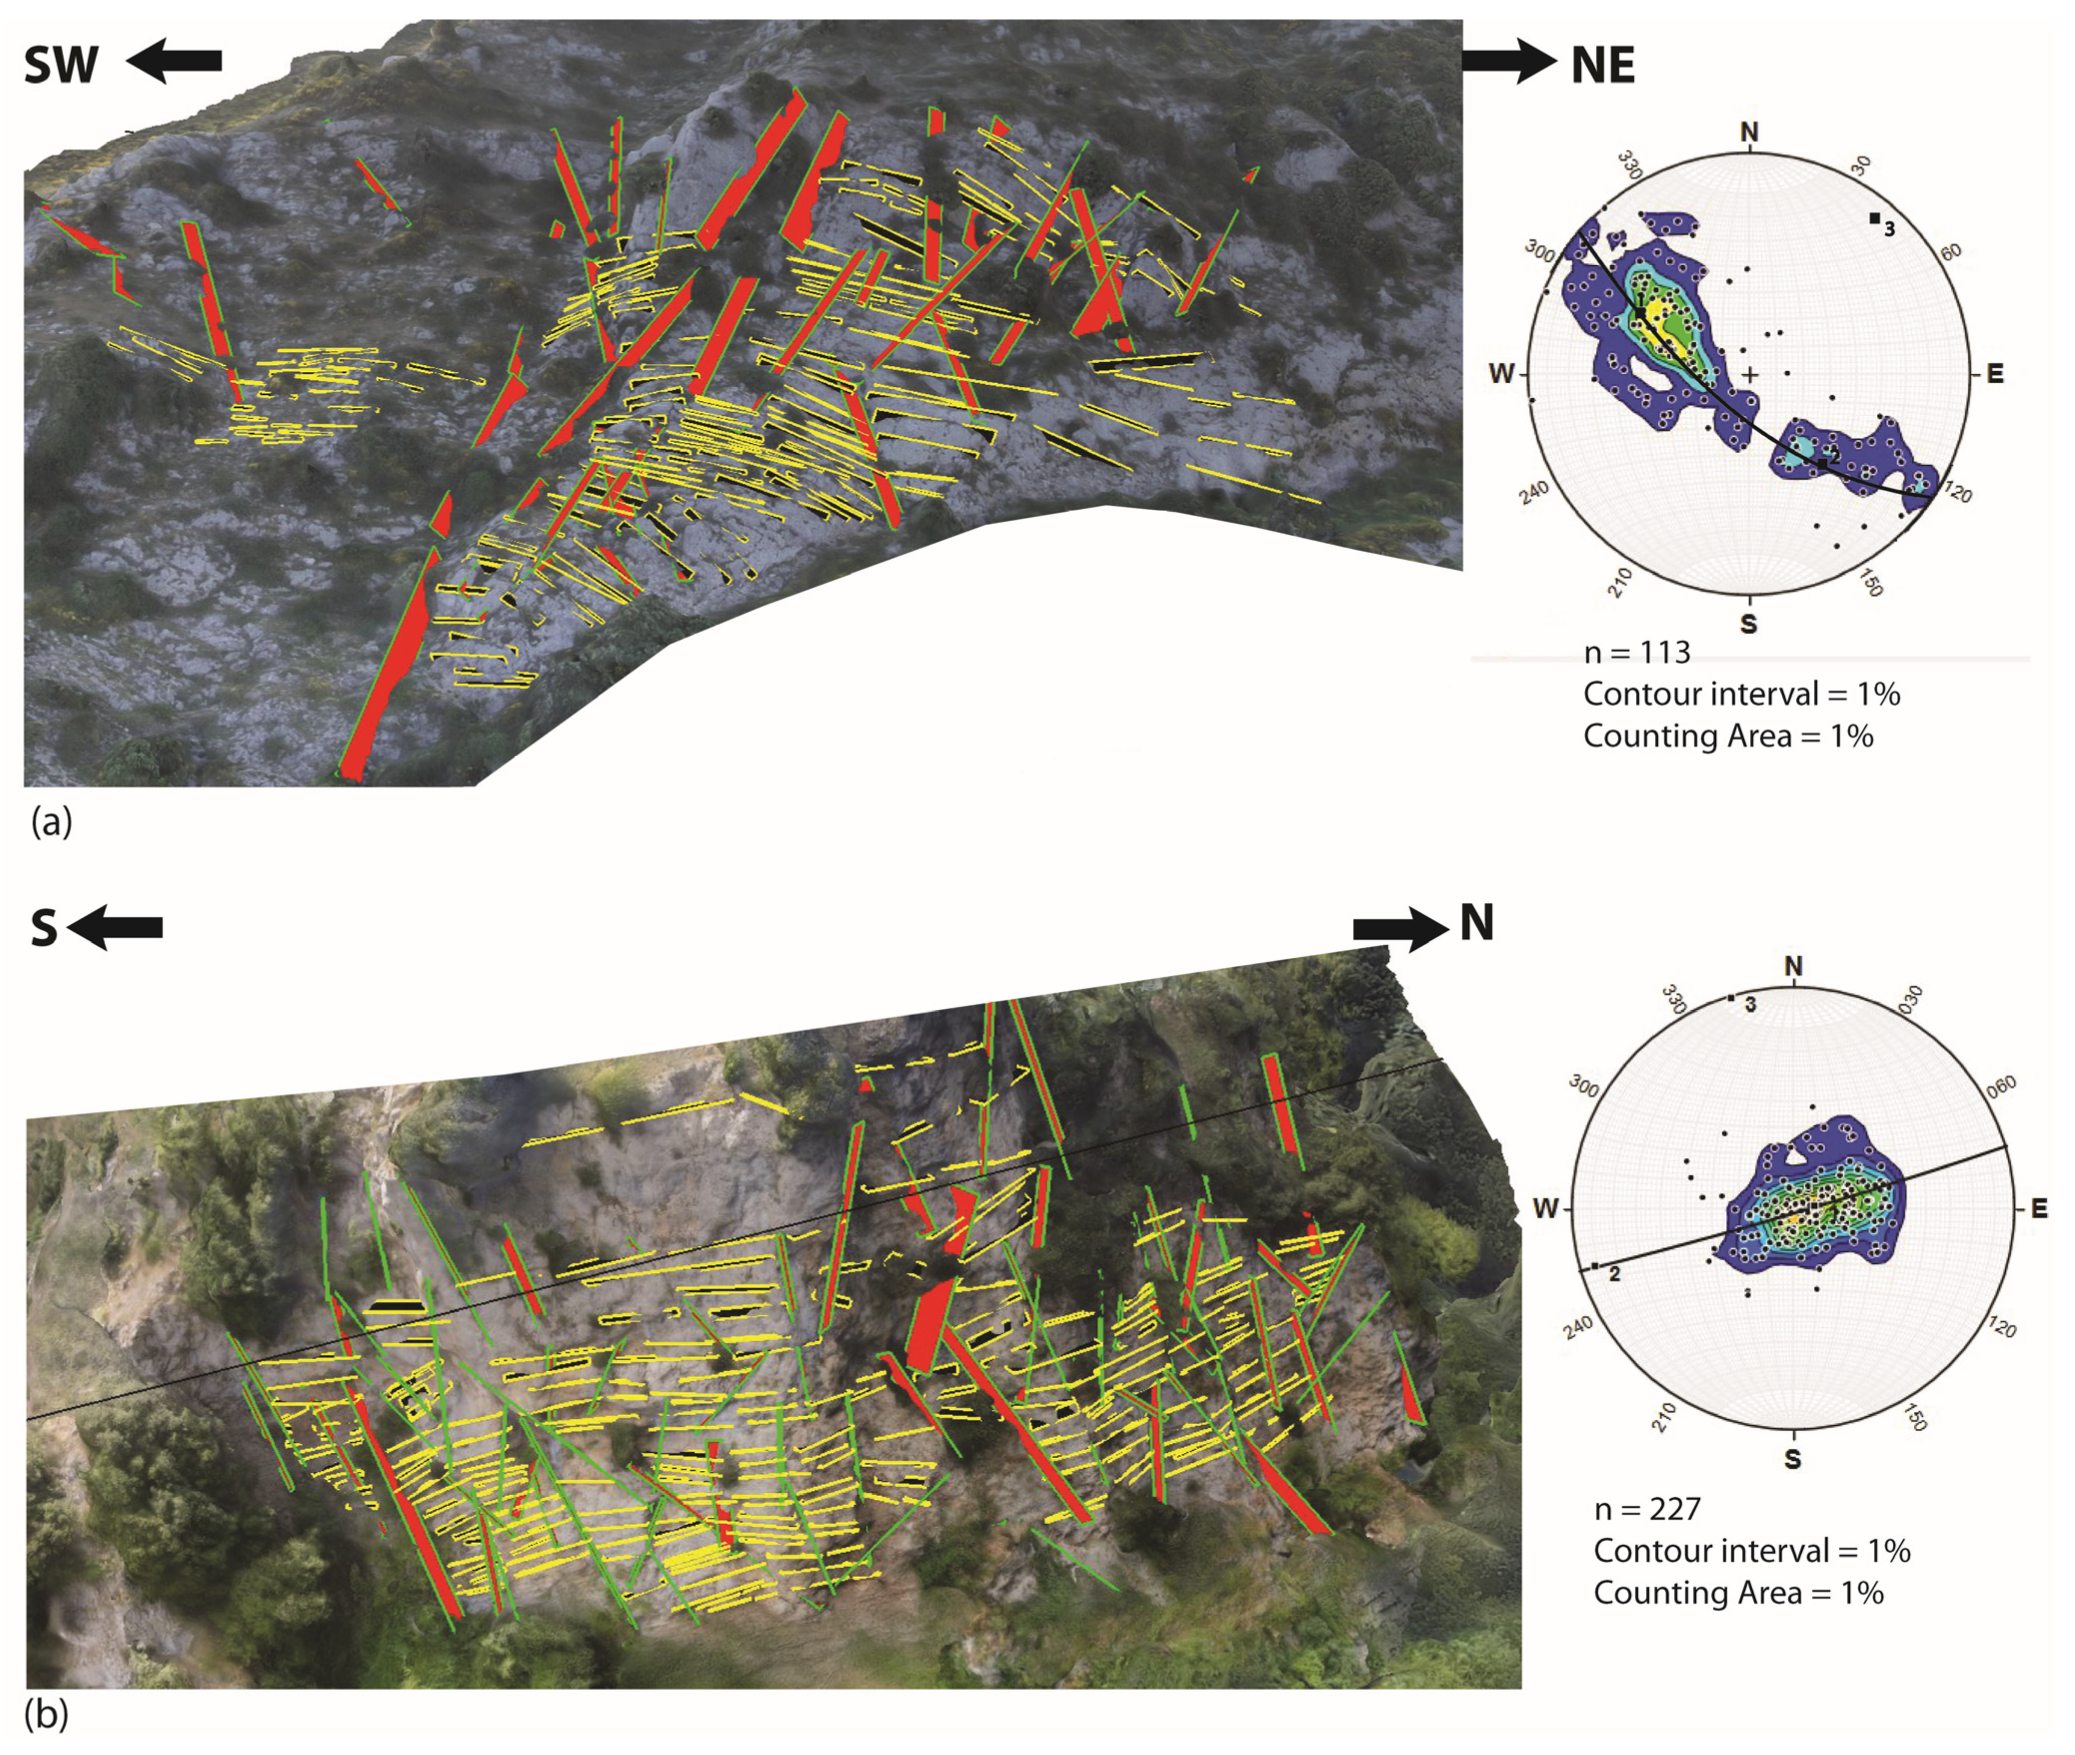
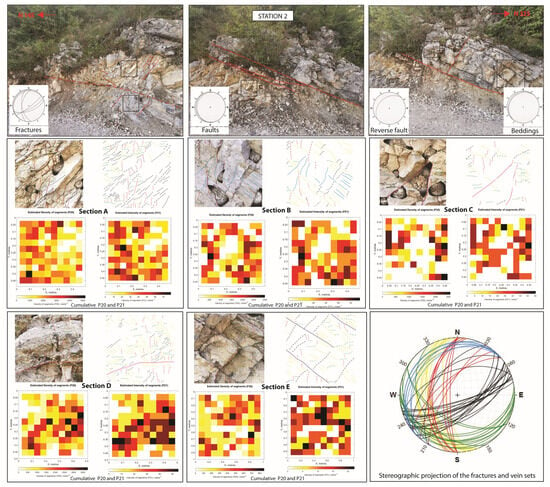
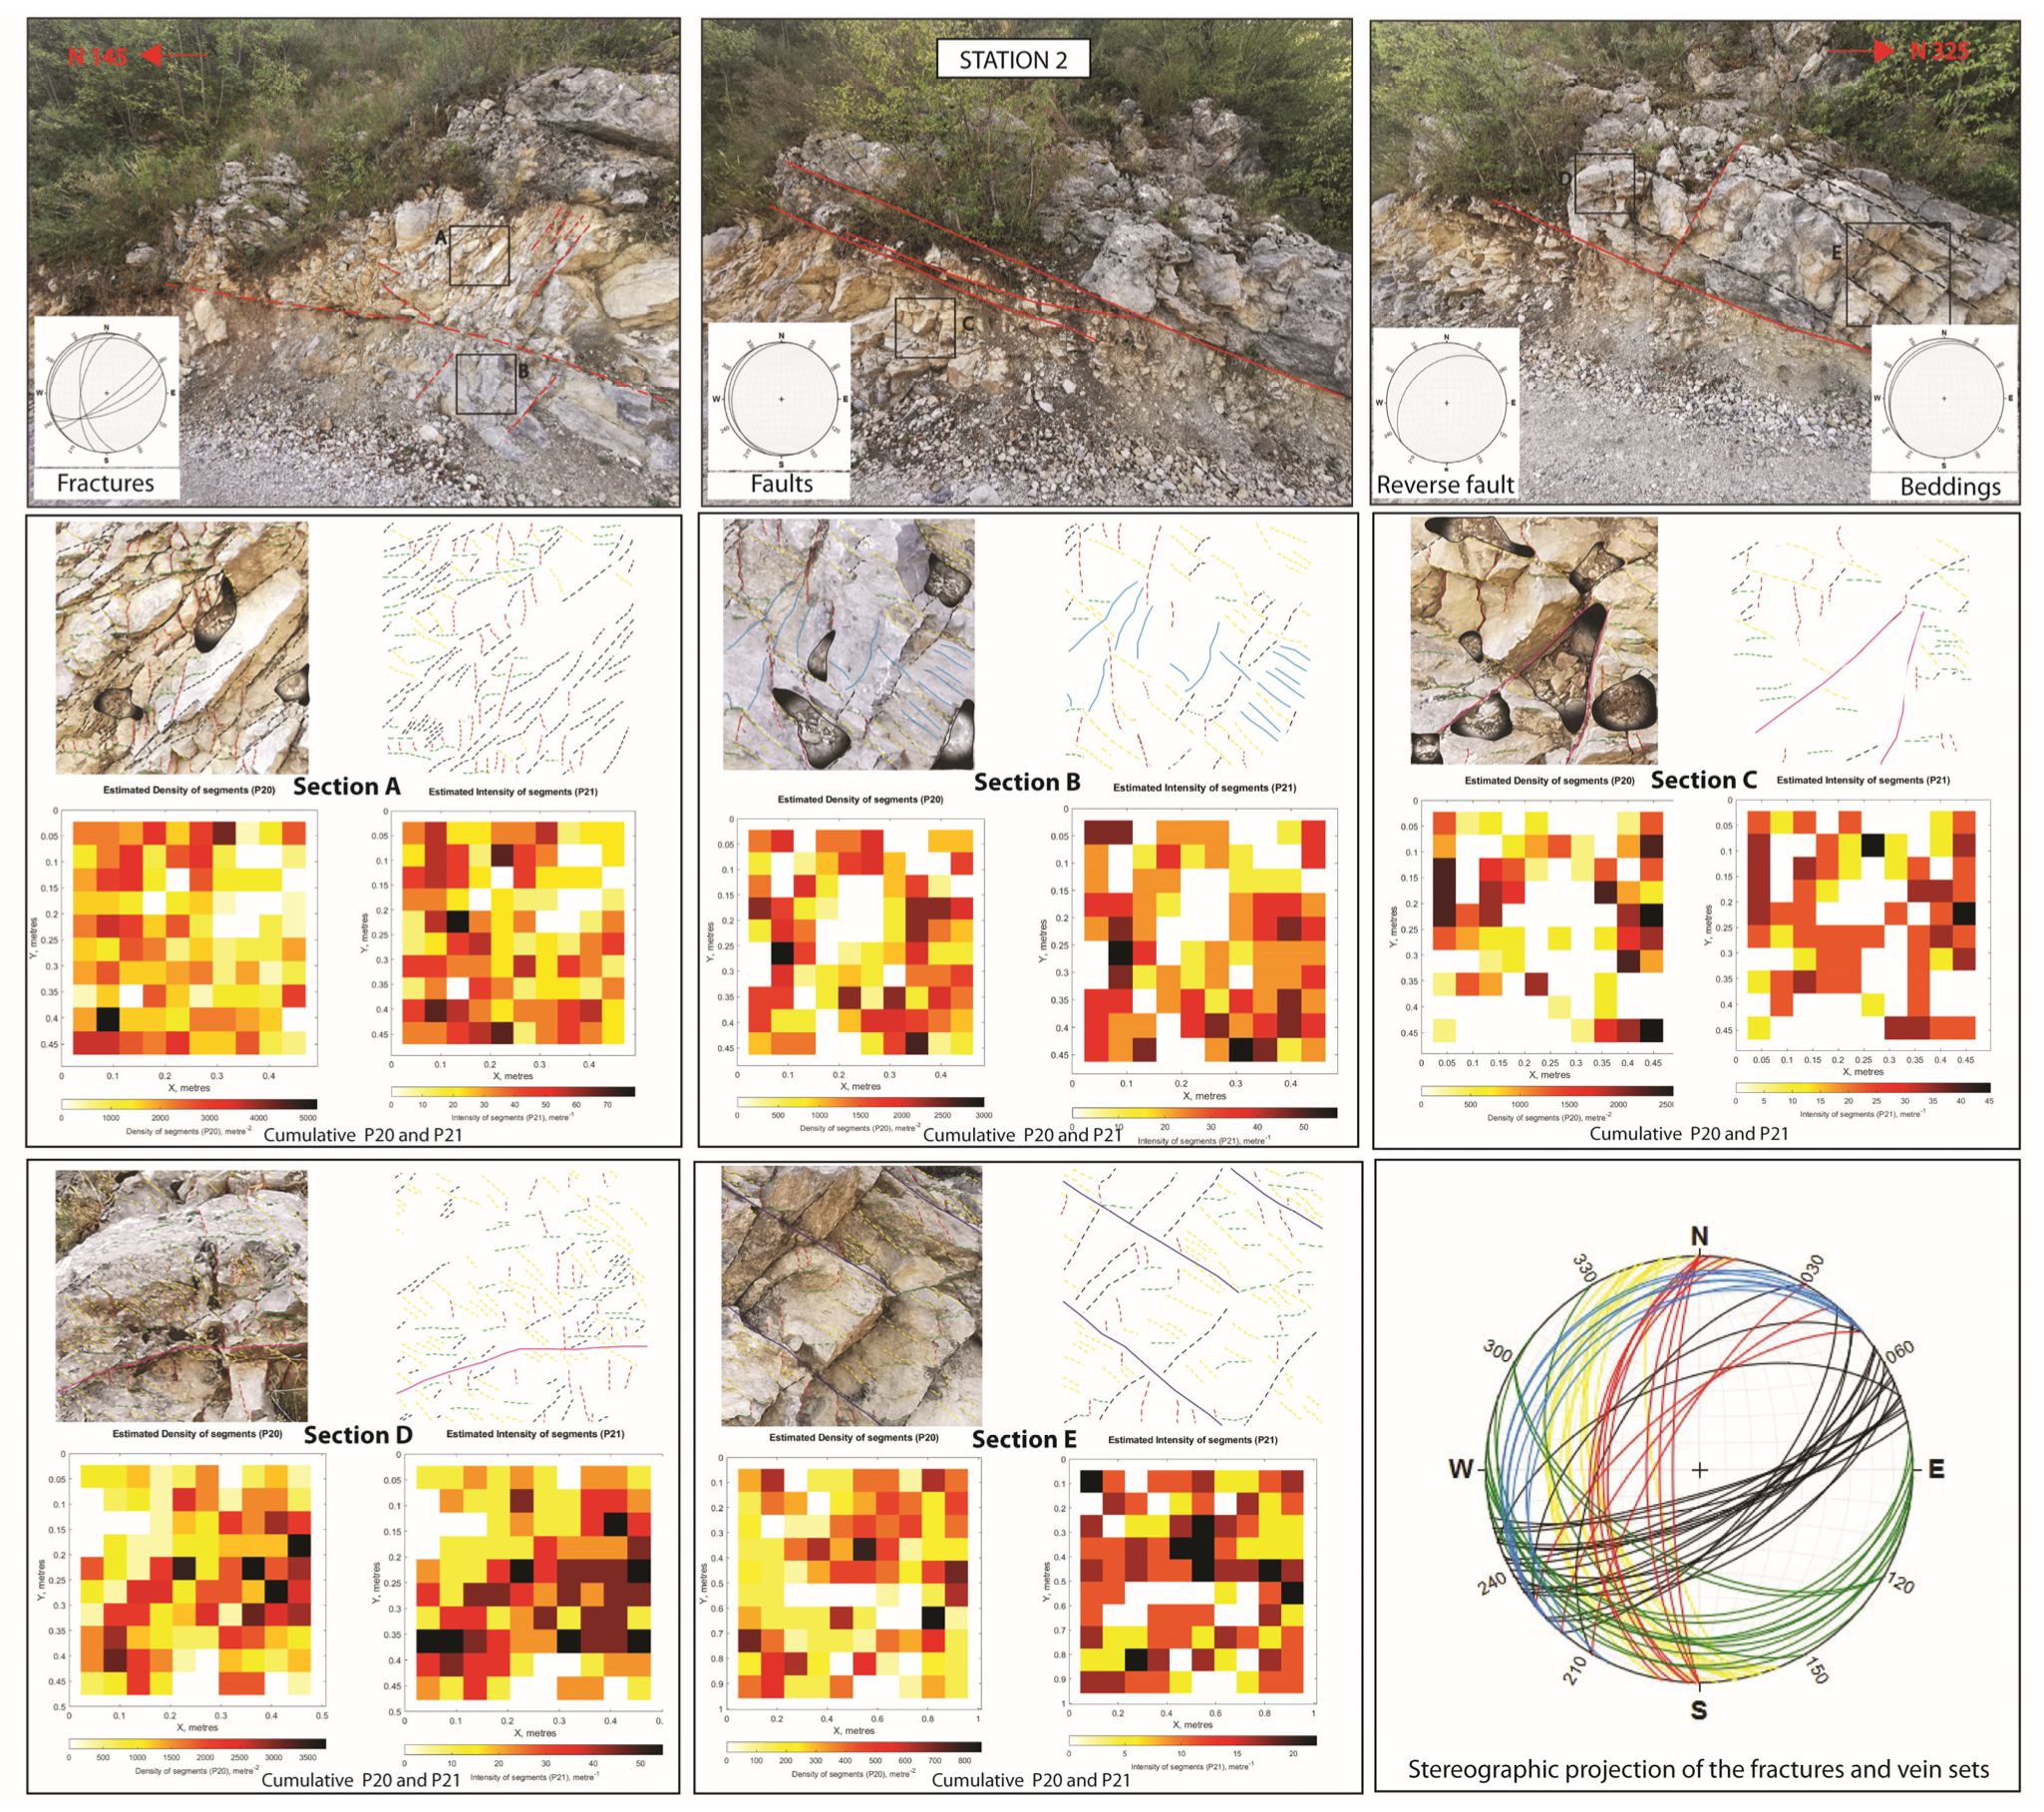
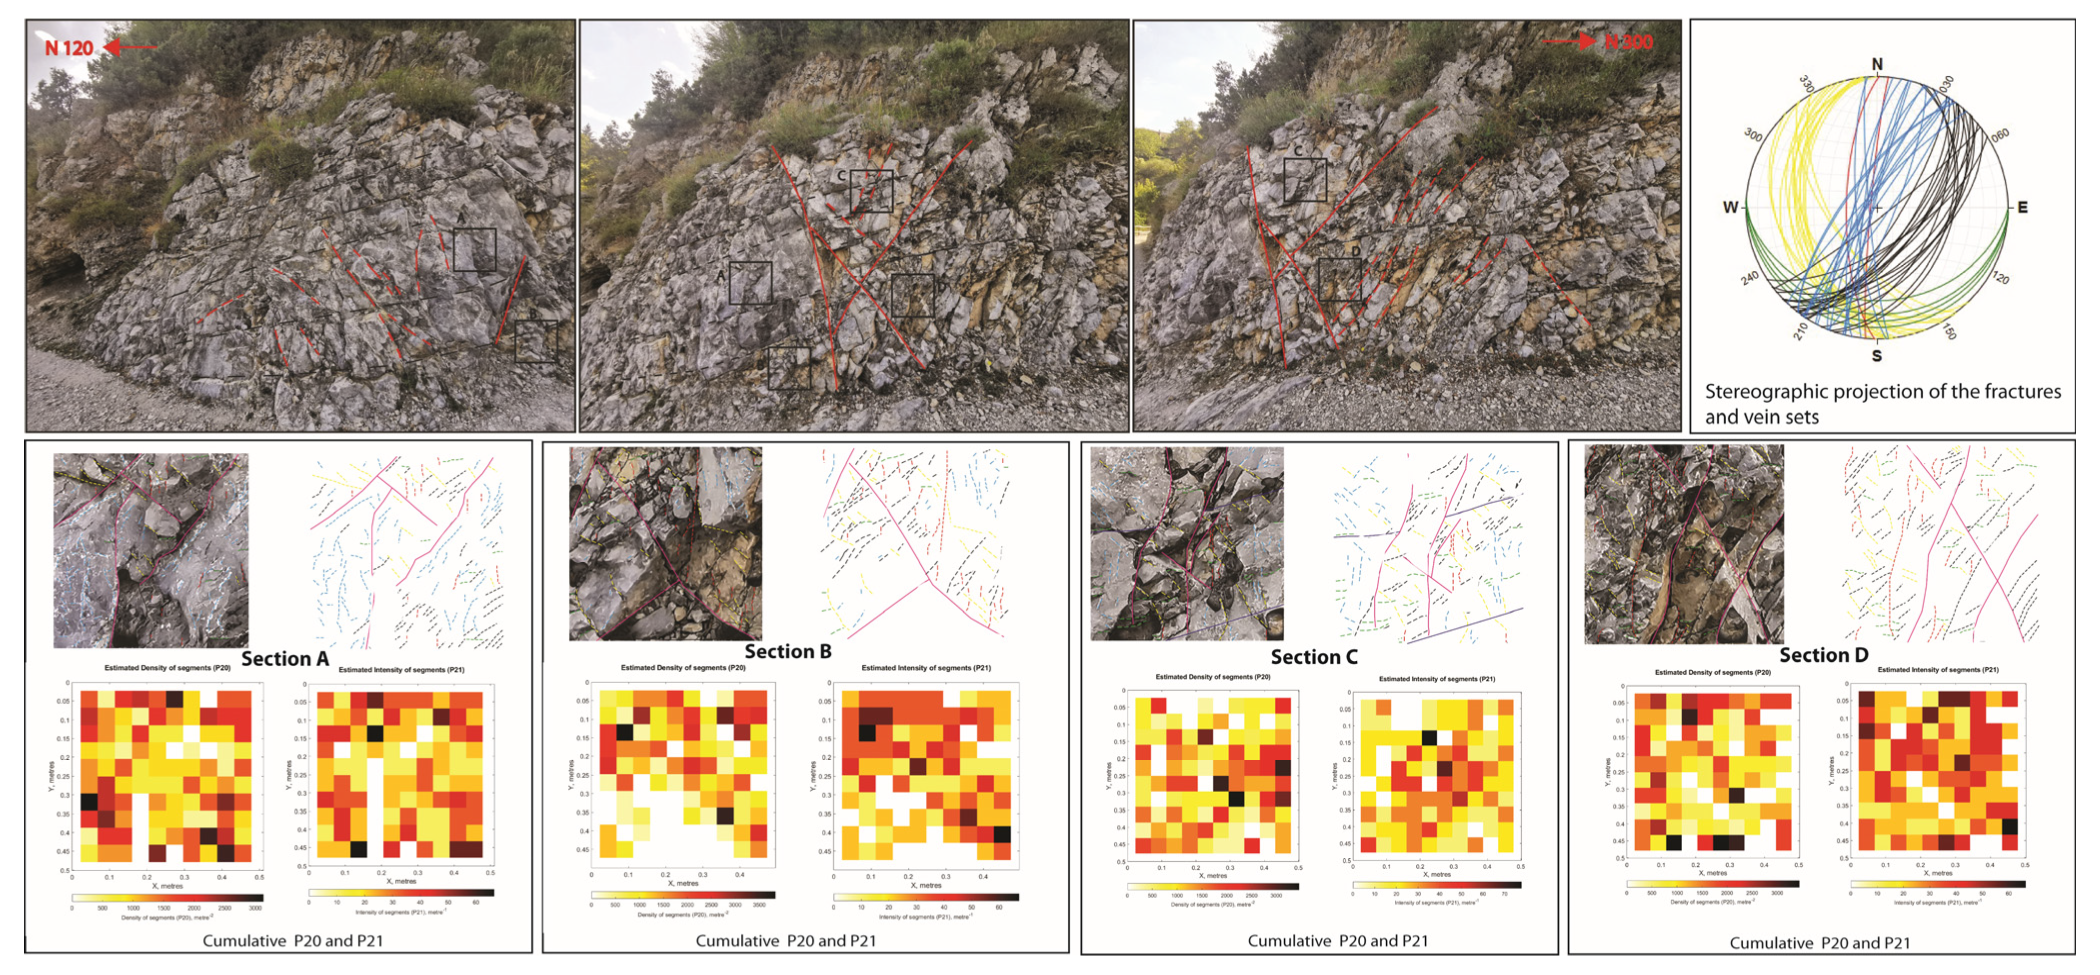
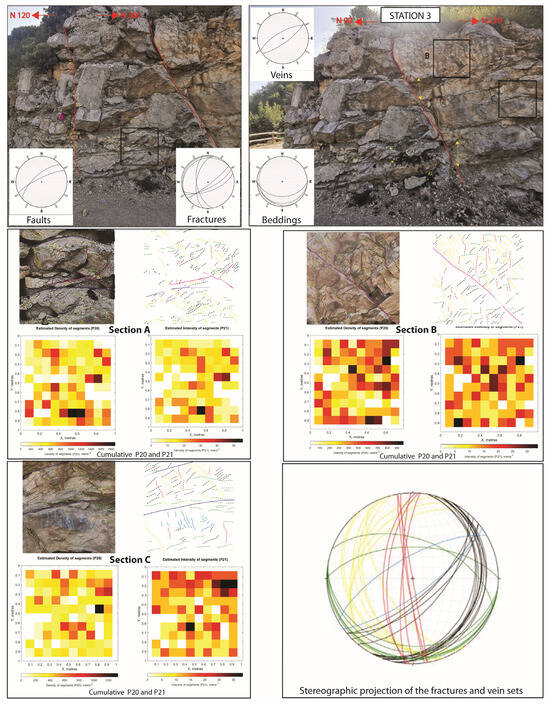
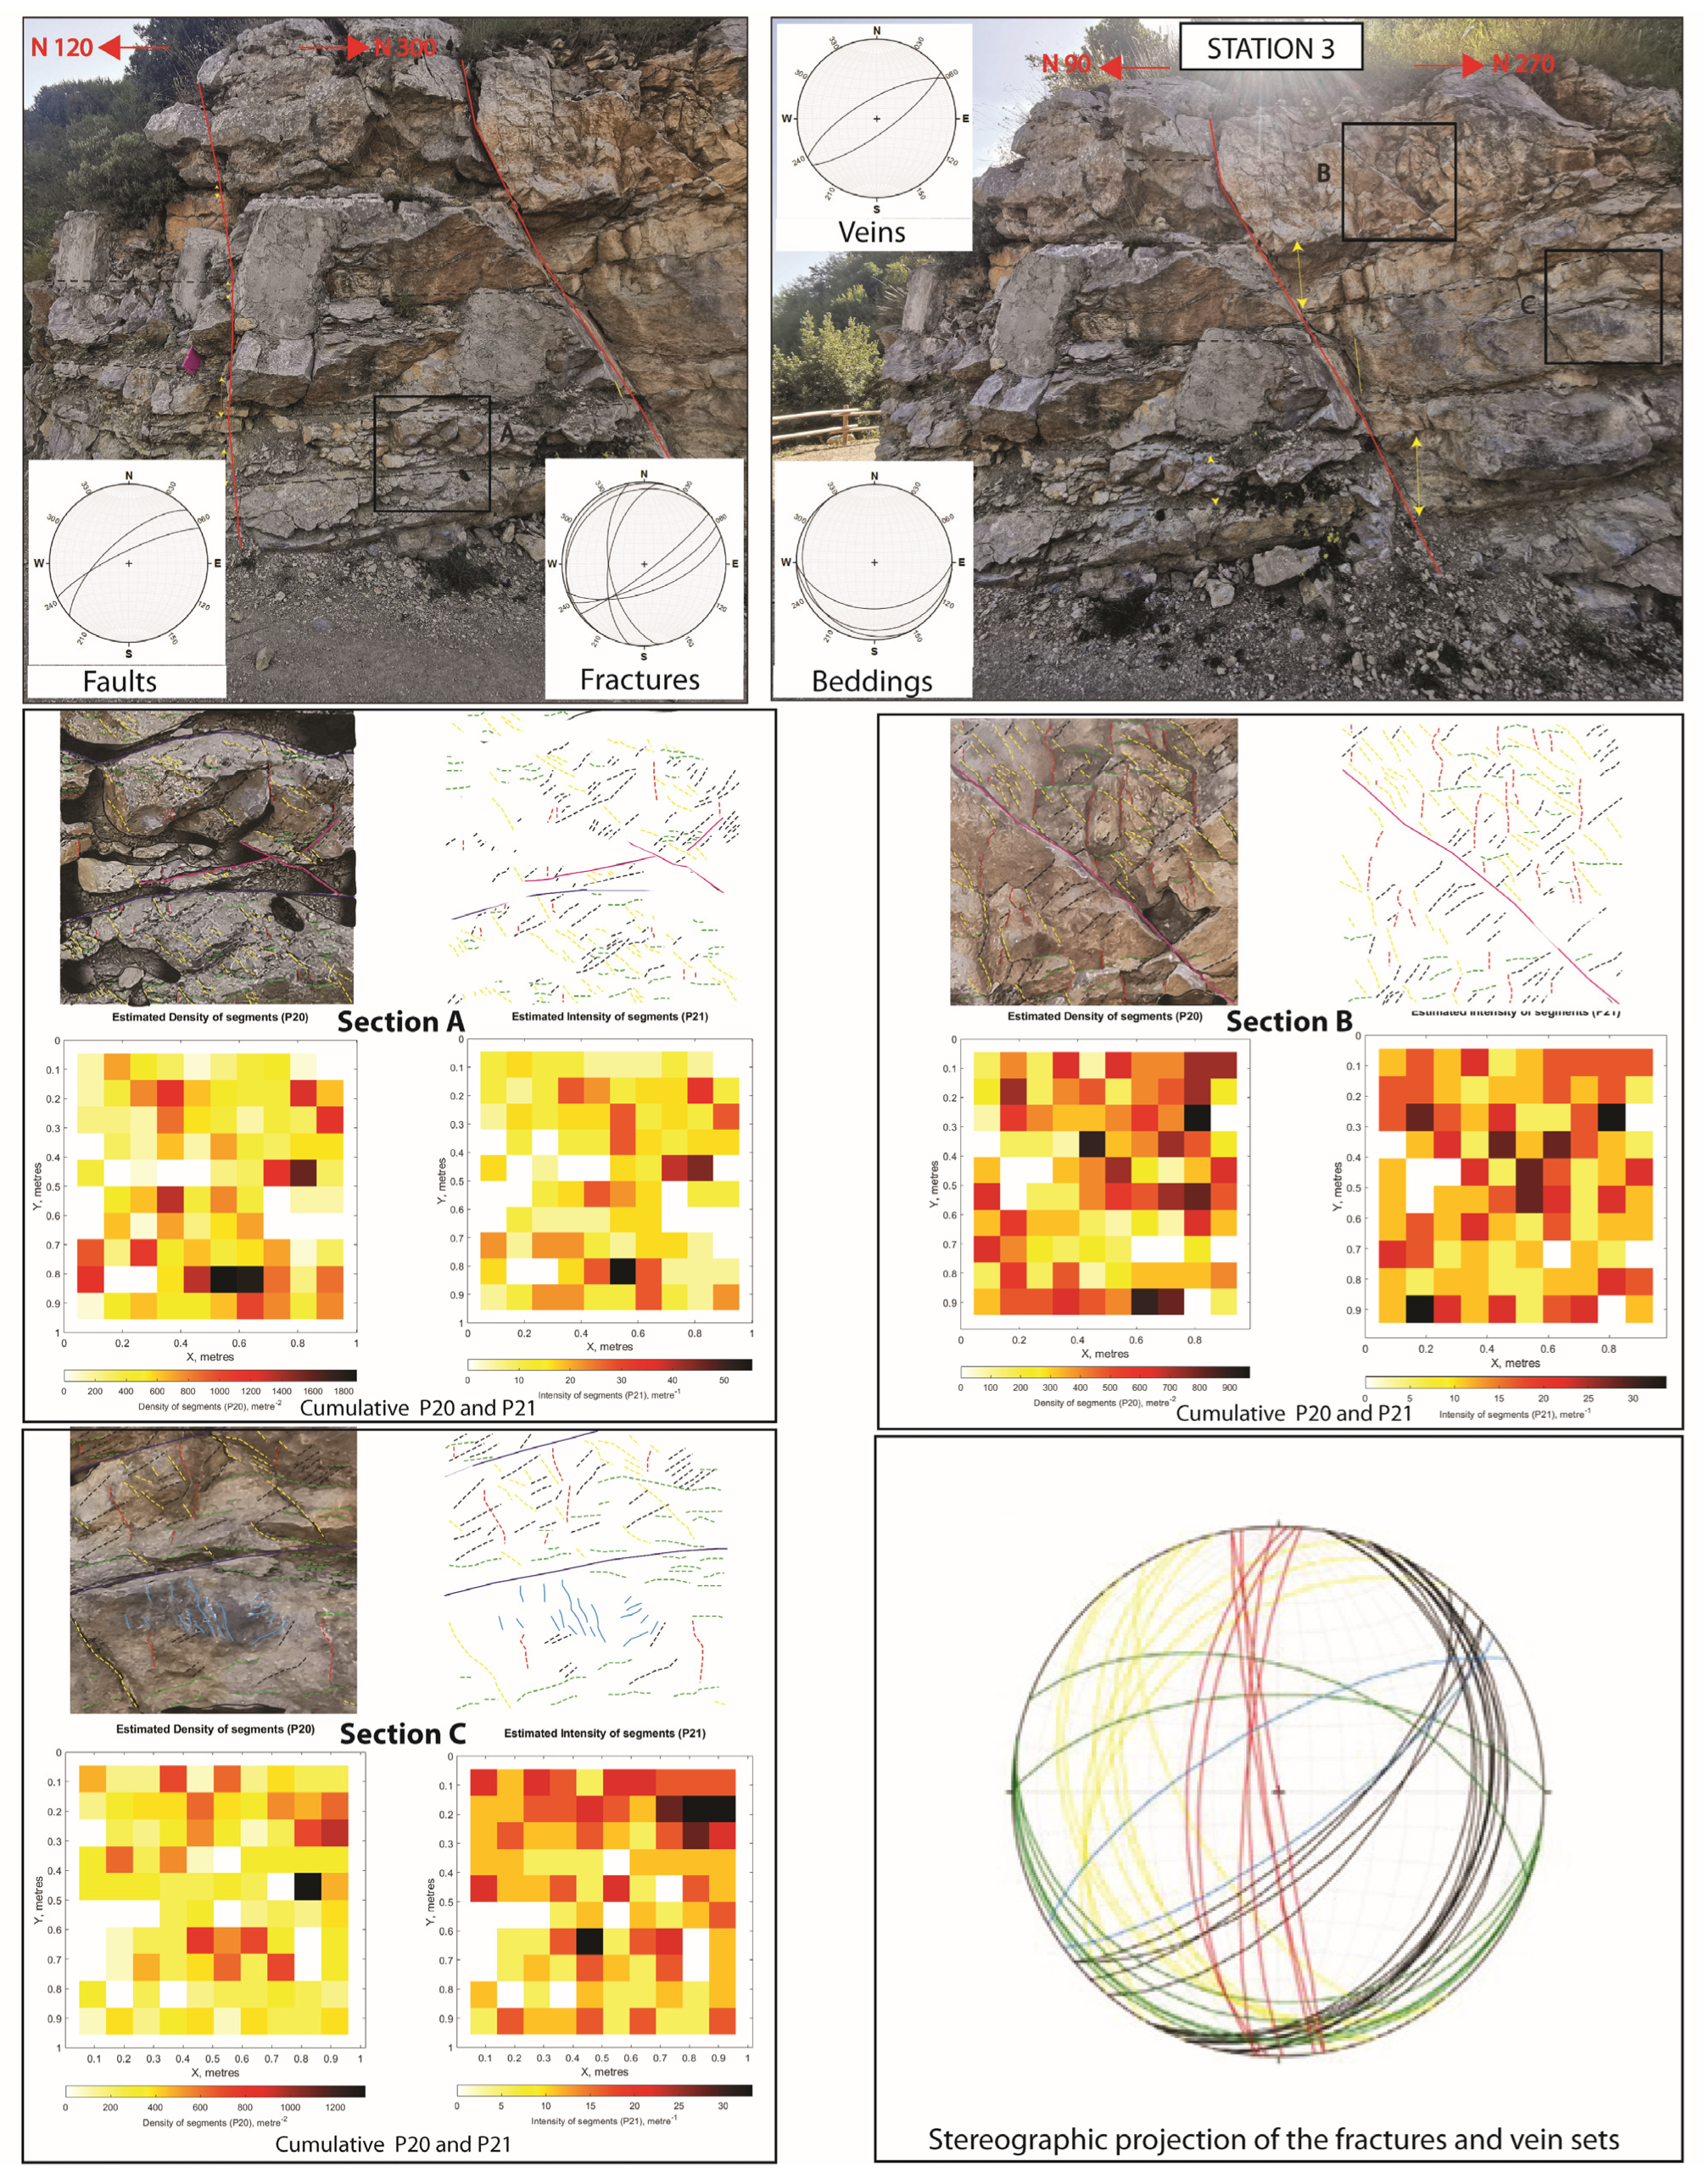
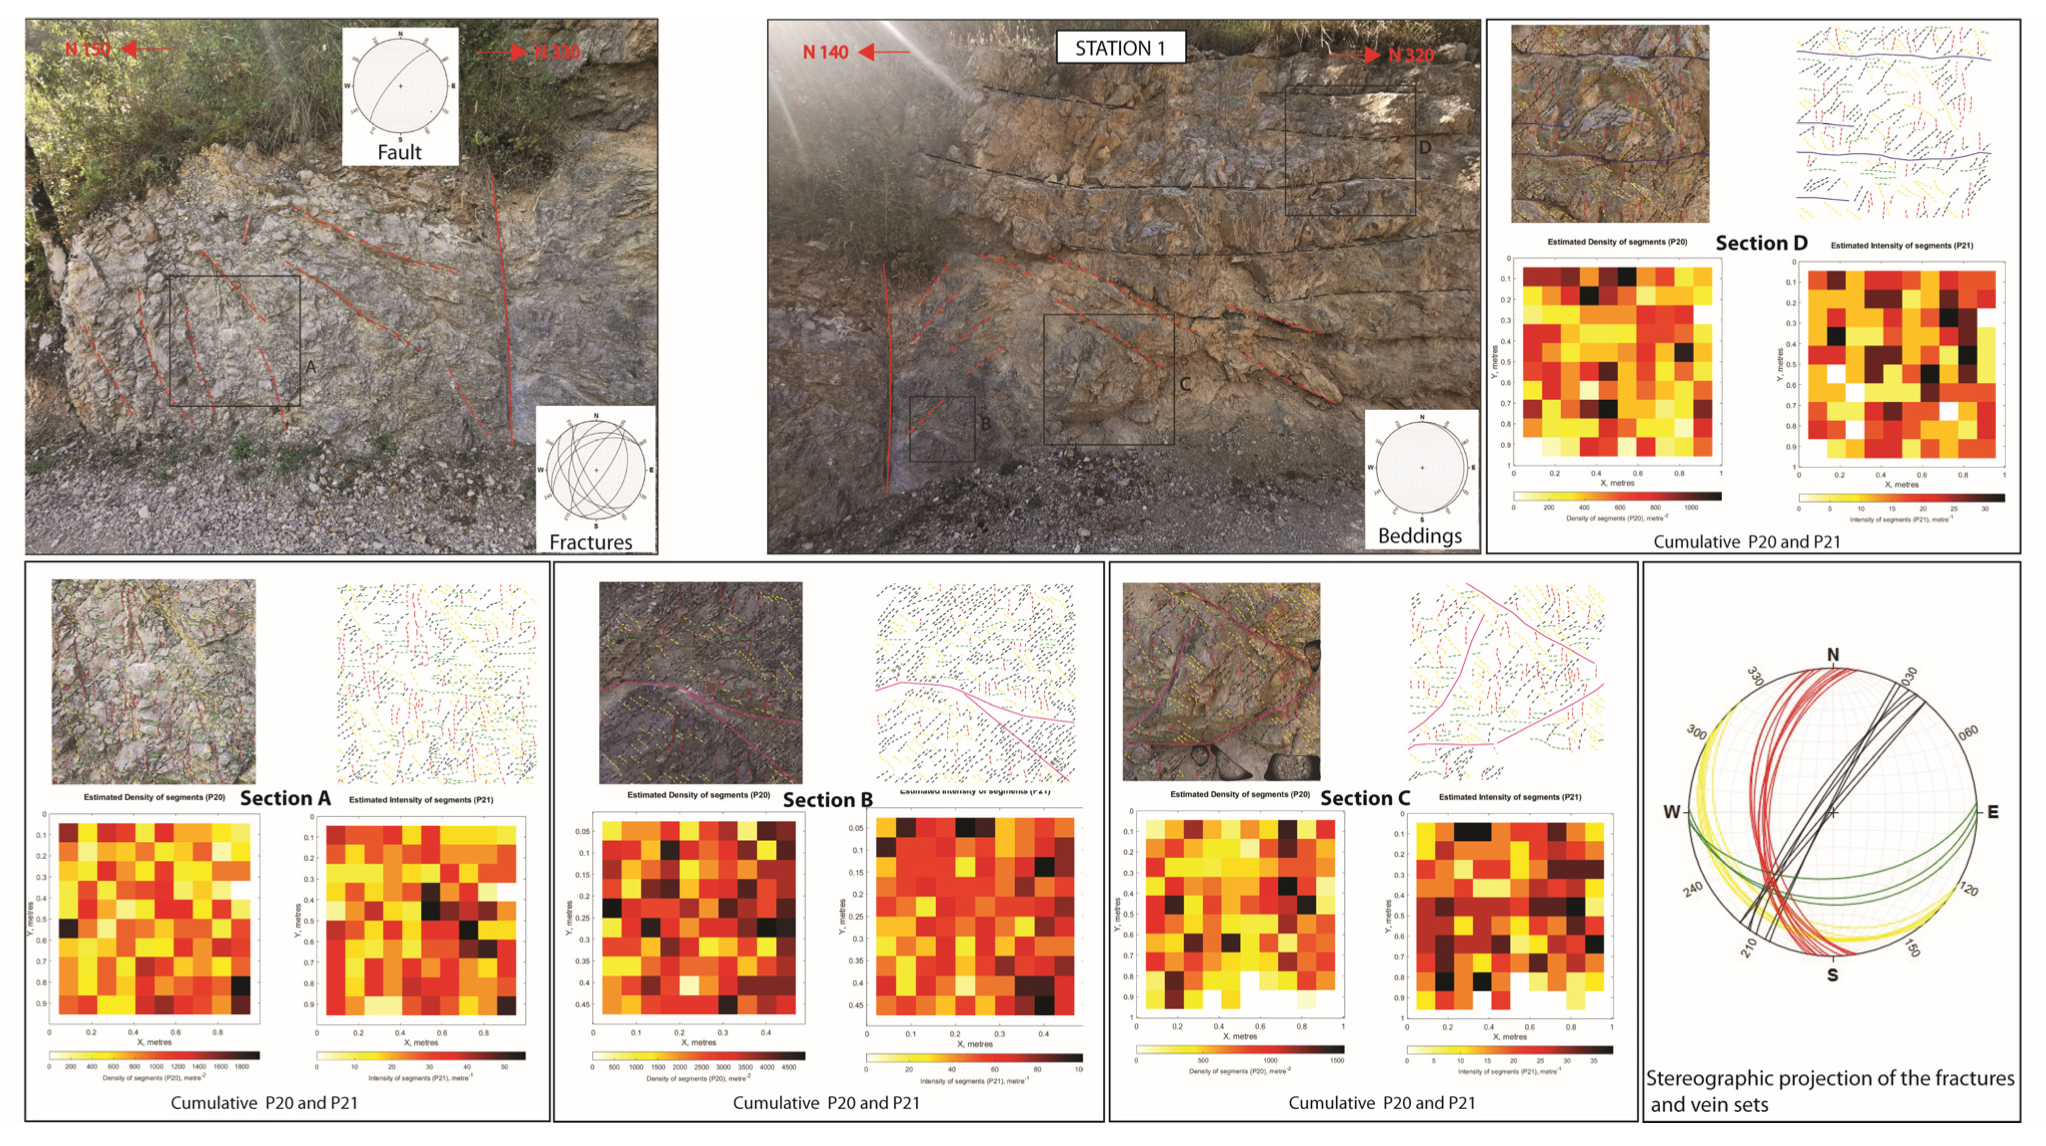
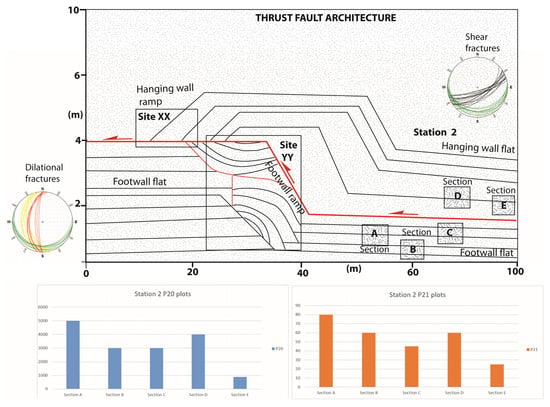
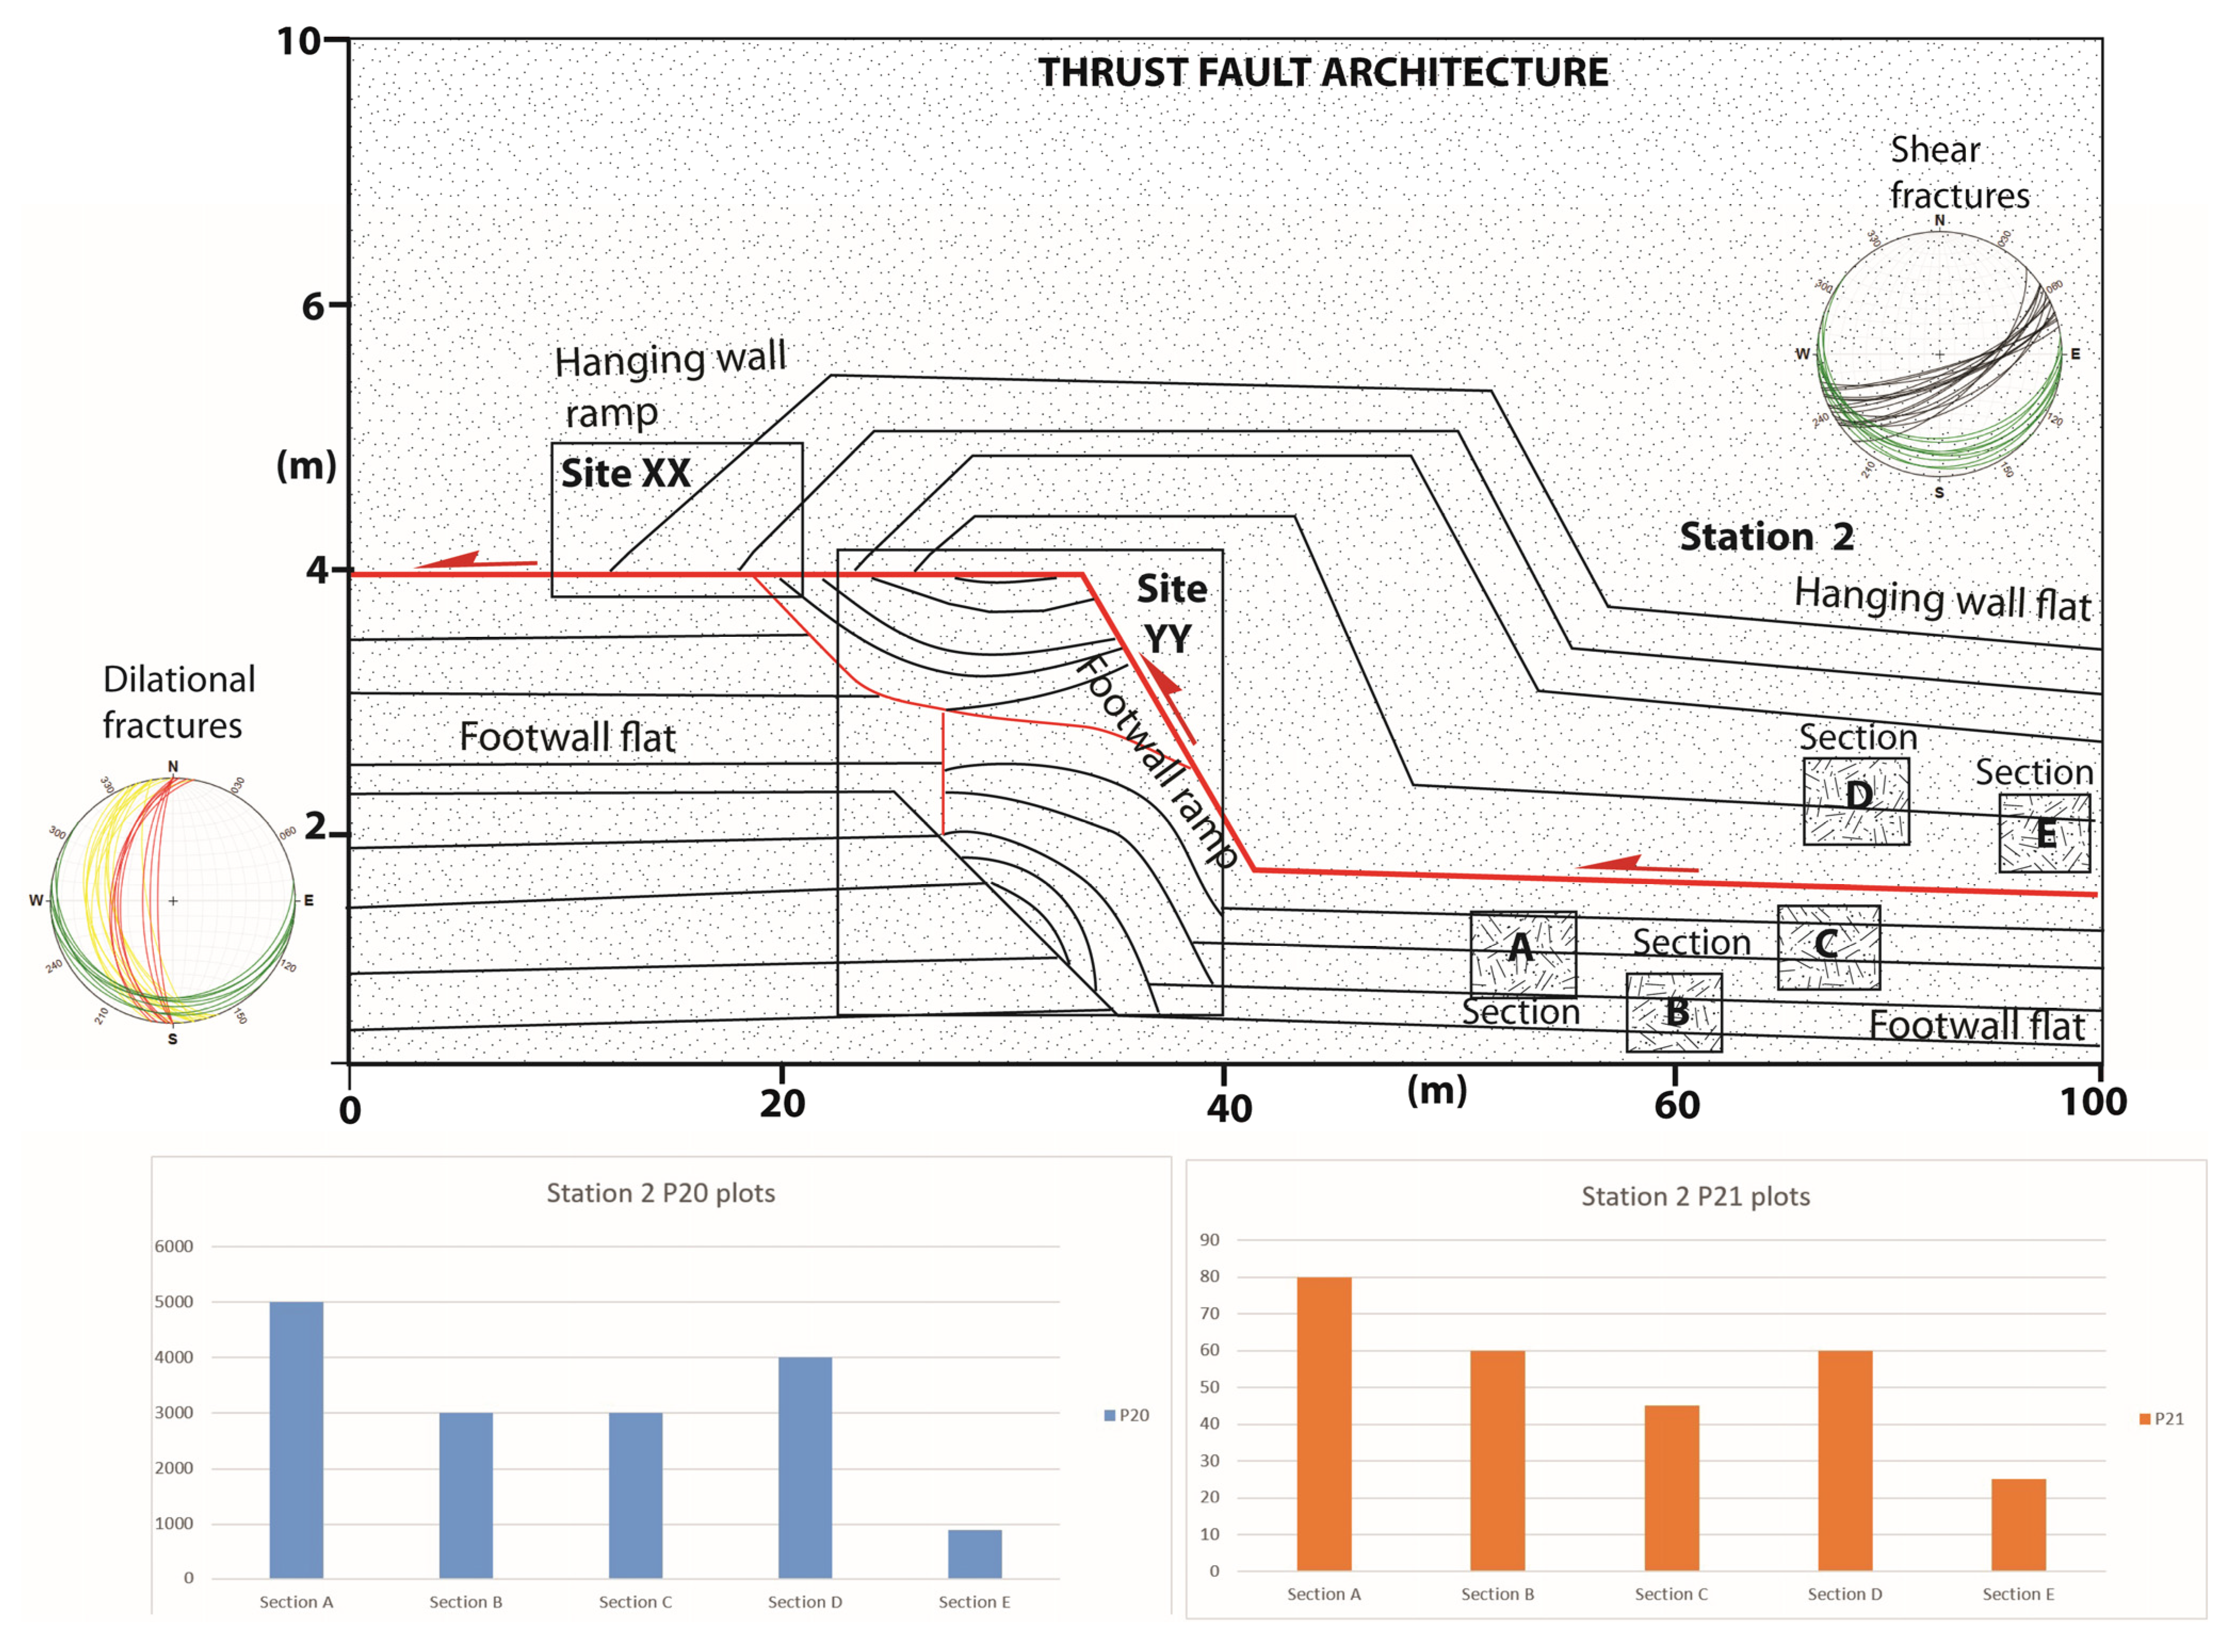
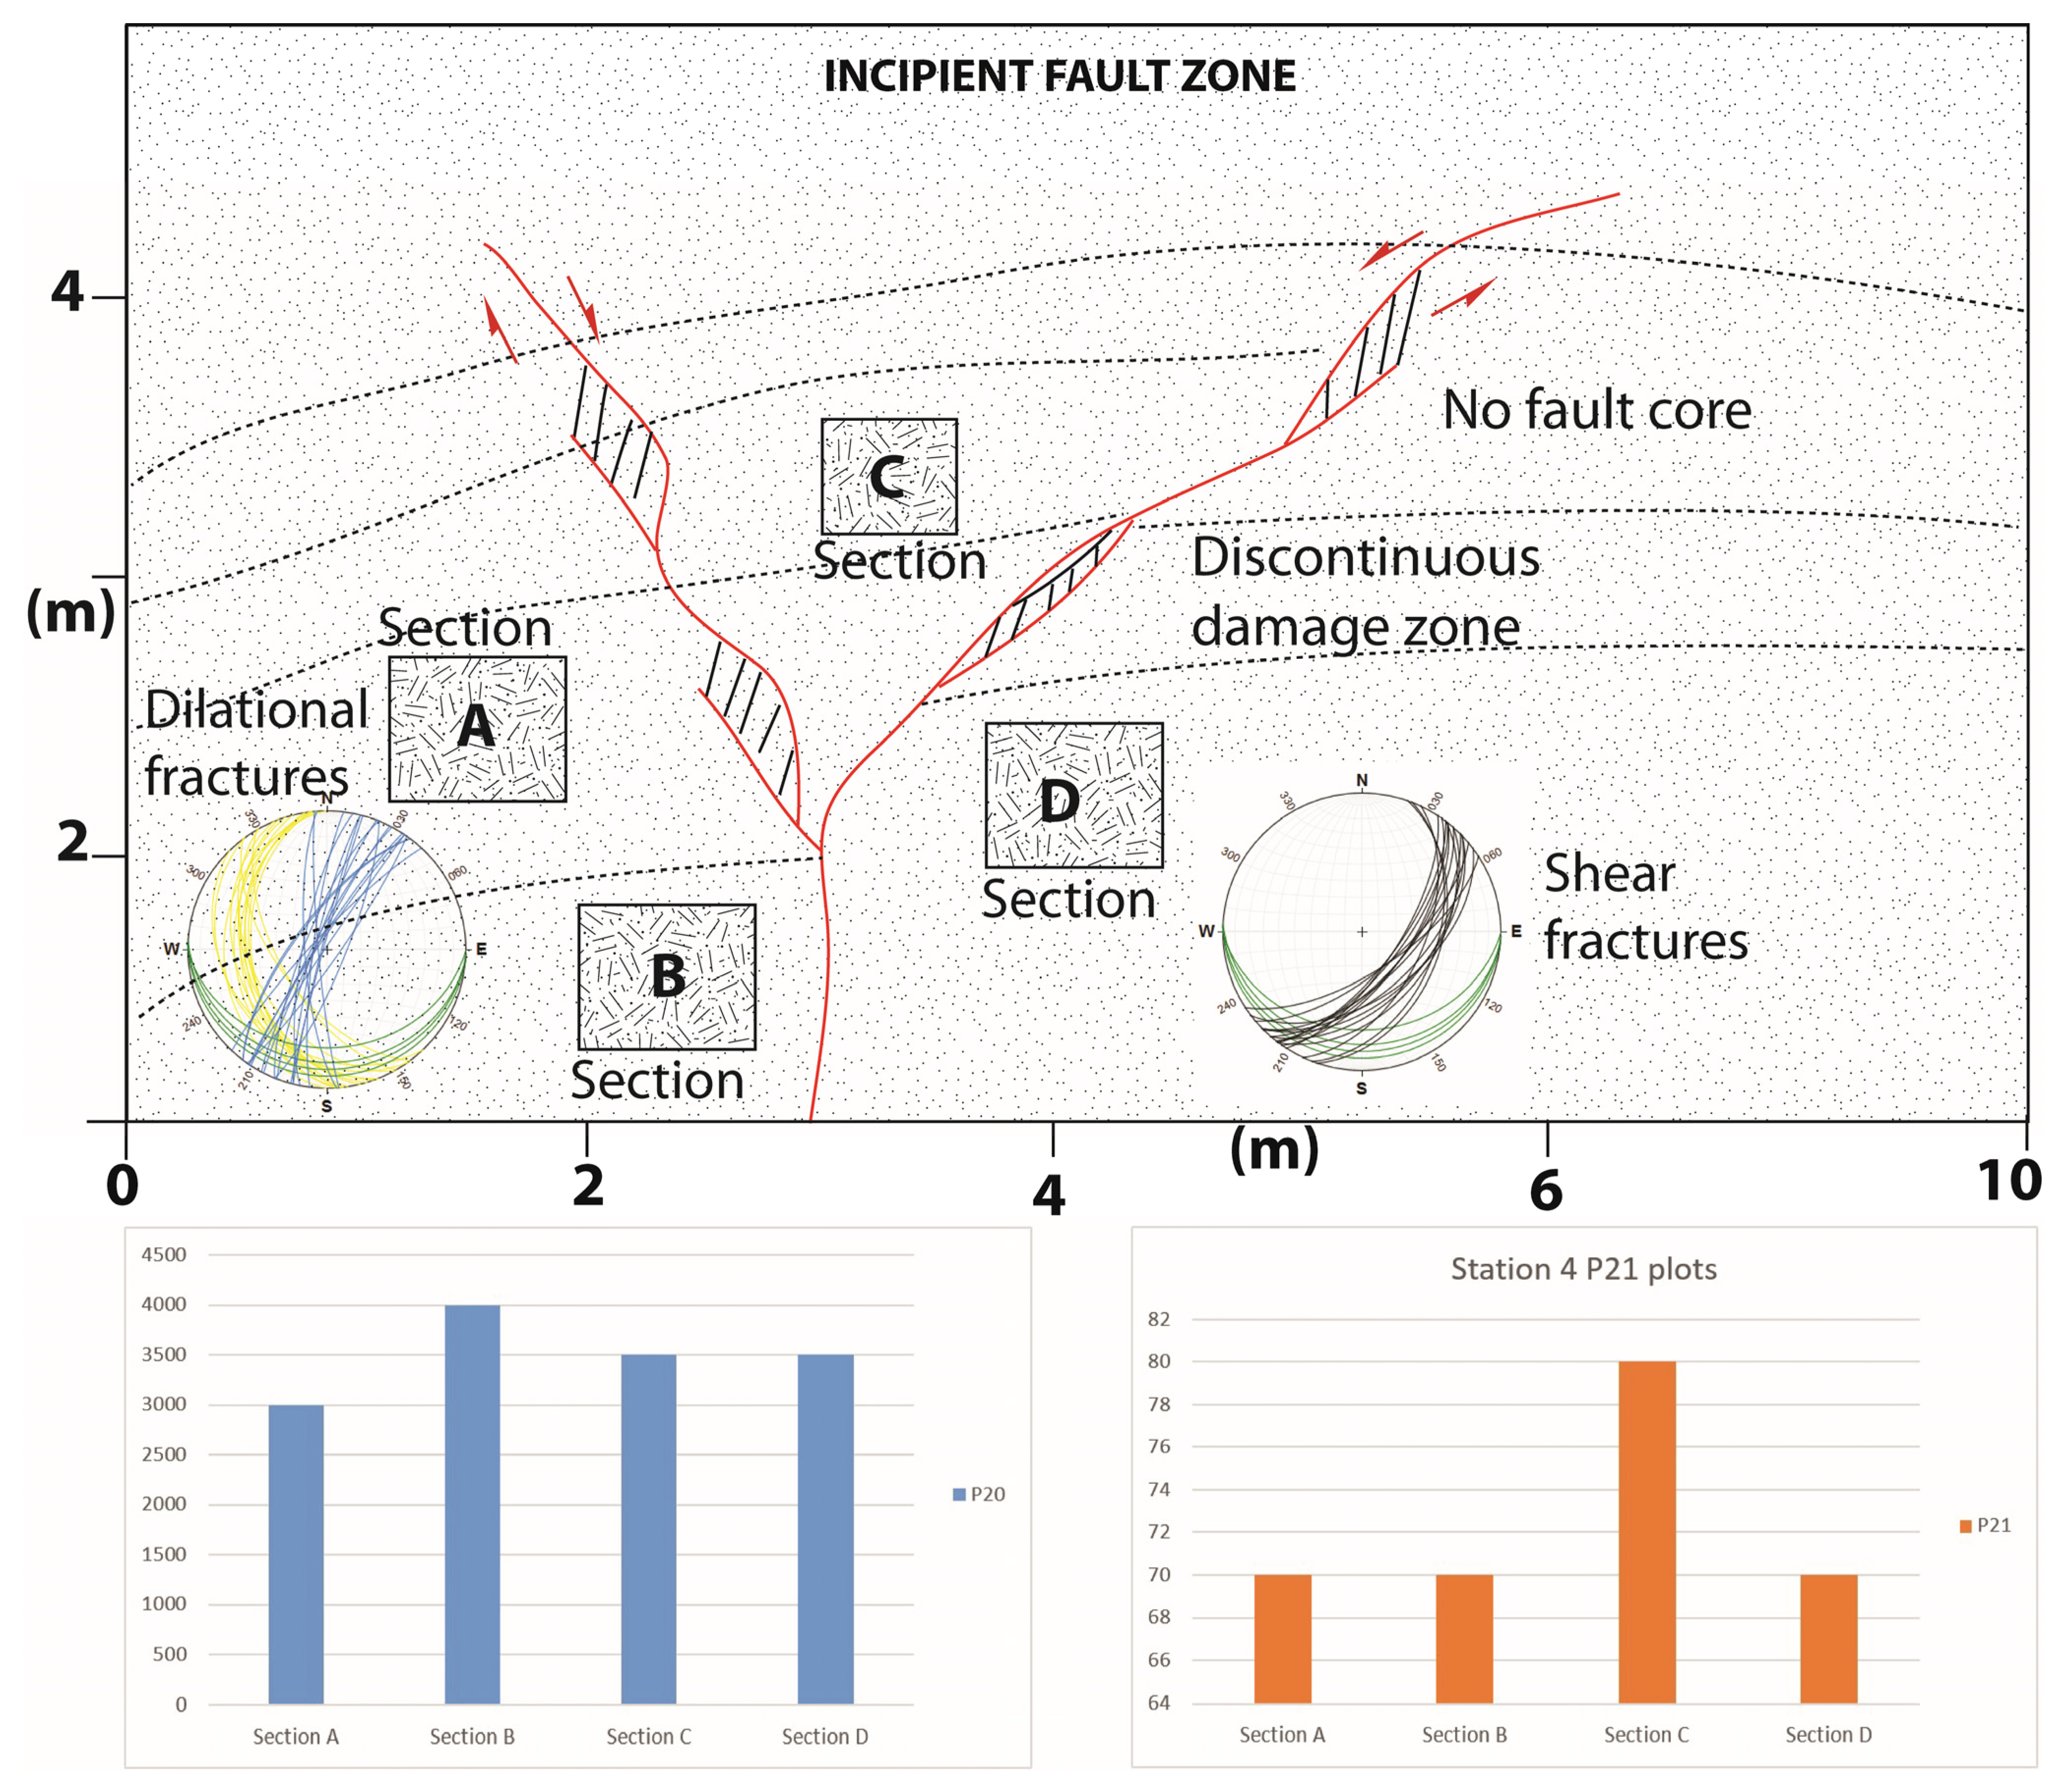
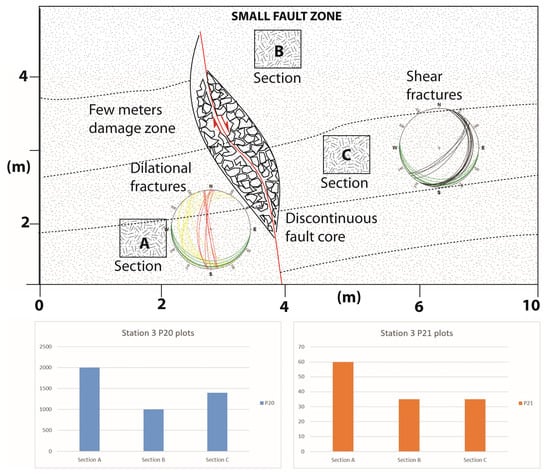
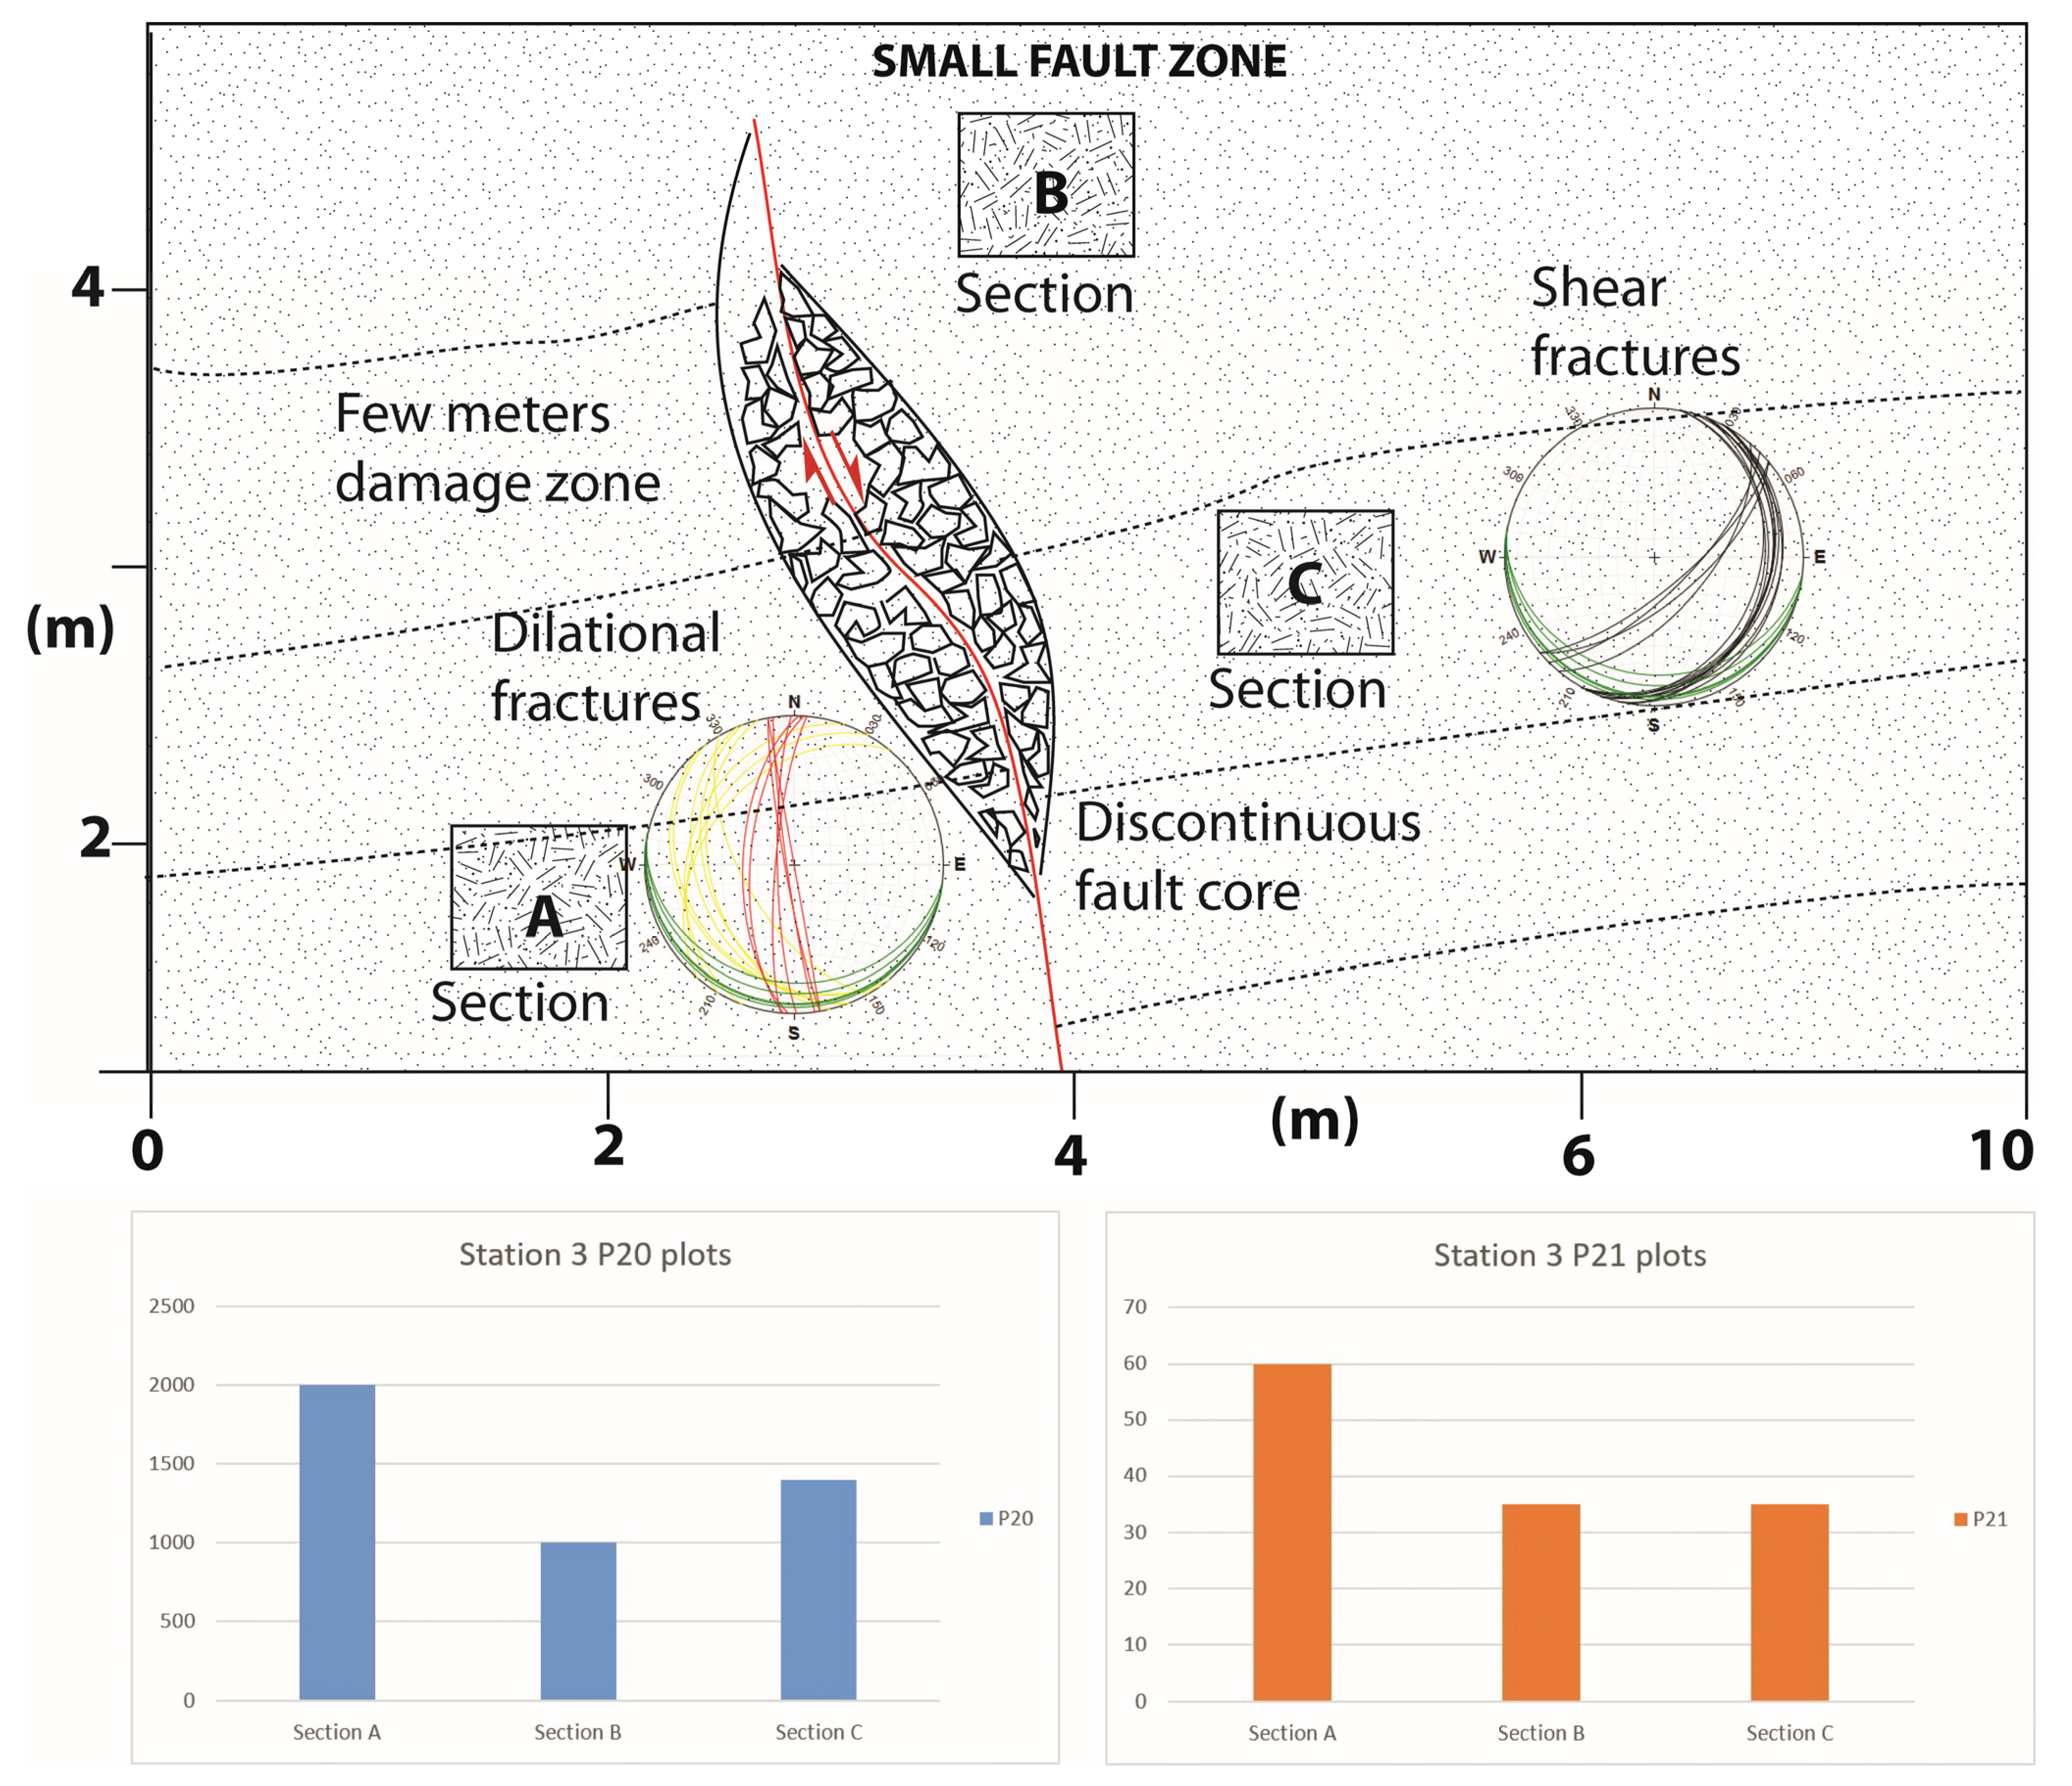
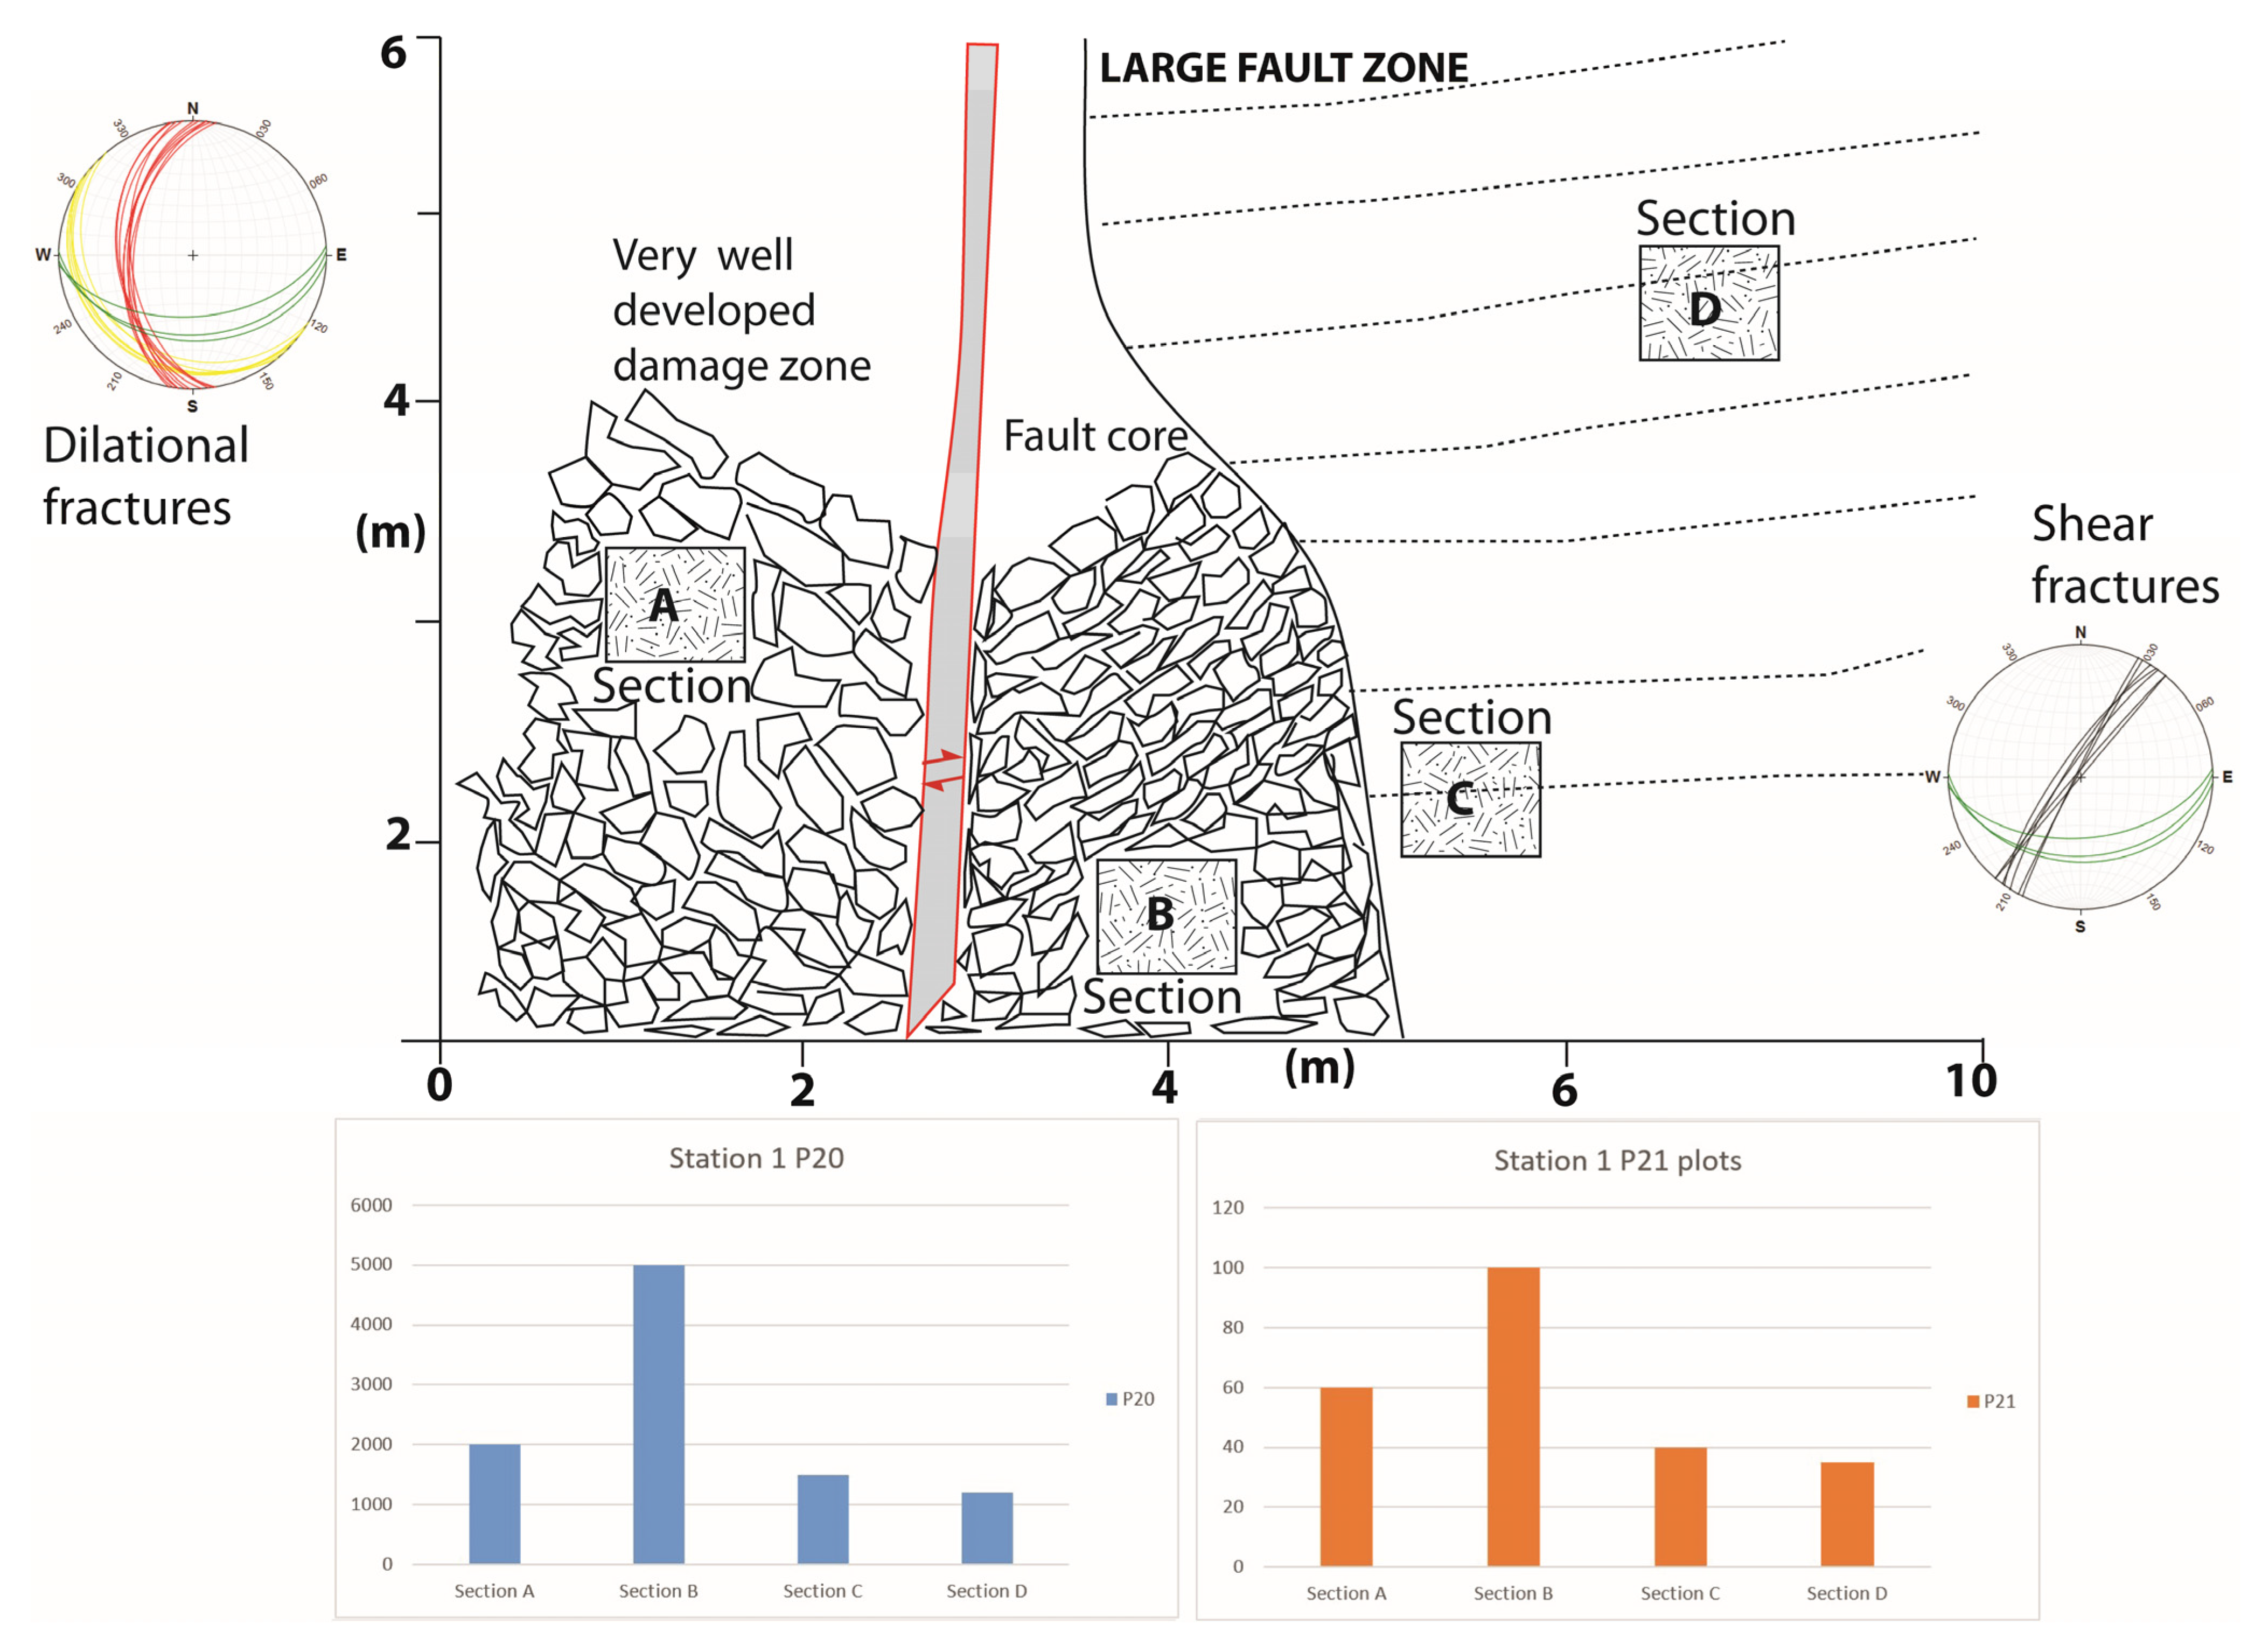

Disclaimer/Publisher’s Note: The statements, opinions and data contained in all publications are solely those of the individual author(s) and contributor(s) and not of MDPI and/or the editor(s). MDPI and/or the editor(s) disclaim responsibility for any injury to people or property resulting from any ideas, methods, instructions or products referred to in the content. |
© 2026 by the authors. Licensee MDPI, Basel, Switzerland. This article is an open access article distributed under the terms and conditions of the Creative Commons Attribution (CC BY) license.