1. Introduction
The public opening of caves containing rock art represents a major conservation challenge because the environmental equilibrium of subterranean systems is highly sensitive to external disturbances. Decorated caves commonly exhibit very stable microclimatic conditions resulting from the thermal inertia of the surrounding rock mass, the buffering capacity of the karst system, and limited ventilation with the external atmosphere [
1,
2,
3]. This stability has played a fundamental role in the long-term preservation of parietal art and associated archaeological deposits in the caves [
4]. However, the introduction of visitors into these environments may disrupt this natural equilibrium and trigger cascading weathering and biodeterioration processes that threaten both the natural and cultural heritage preserved in these fragile environments.
Human presence alters cave conditions through the release of heat, water vapor, carbon dioxide (CO
2), and suspended particles generated by respiration and presence [
5,
6,
7,
8]. The introduction of non-native microorganisms and the occurrence of microclimatic shifts are particularly concerning due to their far-reaching effects on the entire cave ecosystem [
9,
10,
11,
12]. These disturbances propagate through the cave atmosphere and interact with decorated surfaces through processes such as condensation, corrosion, particulate deposition, or microbial dispersion. Previous studies have demonstrated that environmental parameters such as air temperature, CO
2 concentration, relative humidity, and airborne particulate matter respond rapidly to anthropogenic activity and therefore constitute effective indicators for evaluating visitor impact [
13,
14,
15]. Because these variables are closely linked to condensation corrosion, mineral precipitation and microbial colonization, they directly influence the preservation of cave art and speleothems [
16]. Such processes have been identified as major drivers of biodeterioration and physicochemical alteration of rock art surfaces in decorated caves worldwide [
16,
17,
18]. Consequently, conservation of caves containing cultural heritage increasingly relies on preventive strategies based on the monitoring and interpretation of cave microclimates [
16,
19].
The preservation of highly stable microclimates, maintained by restricted air exchange with the external environment, has long been considered essential for achieving optimal conservation conditions in caves [
20]. Tourism therefore raises concerns for prehistoric rock painting caves, since even a limited influx of visitors can introduce nutrients and other environmental disturbances with unpredictable consequences in such confined settings. To evaluate a cave’s suitability for visitation while ensuring its long-term conservation requires a comprehensive, site-specific environmental study. Conventional studies evaluating the effects of visitor numbers on cave environmental conditions commonly focus on examining changes after extended periods of tourism activity. However, understanding the baseline environmental state of subterranean ecosystems prior to their exposure to tourism is crucial in distinguishing natural environmental fluctuations from anthropogenic impacts [
19]. The proposed framework consists of two critical stages. The first phase emphasizes comprehensive environmental monitoring spanning at least one full year under undisturbed conditions. A one-year observational period is deemed sufficient for identifying seasonal variations within cave ecosystems; however, extending this duration is preferable to effectively account for potential impacts on microclimatic systems caused by substantial inter-annual fluctuations in external climatic factors. The second phase involves conducting high-resolution monitoring during controlled experimental trials with visitor activity, allowing for precise evaluation of human-induced changes. To our knowledge, the existing body of literature presents a notable gap regarding studies that propose a sequential approach involving clearly delineated methodological phases, such as those described in the research design of this study. Pioneering studies [
1,
21] serve as foundational examples of employing this dual-phase methodology.
The Santián Cave (Cantabria, northern Spain) provides a suitable framework for this research approach focused on preventive conservation, since it was closed to the public for an extended period during the 1980s and 1990s, and local and regional authorities have expressed interest in including this cave within the cultural-tourism offerings at underground sites with archaeological heritage. First, we assessed the environmental dynamics of the subterranean karst system under undisturbed conditions by monitoring one full annual cycle to document seasonal variations in temperature, humidity, and gas composition of the cave atmosphere. Second, we quantified the cave atmosphere’s response to a controlled, predefined visitor load by measuring changes in air temperature, CO2 concentration and suspended particulate load during an experimental trial of visits. This study aimed to determine the most sensitive environmental variable to human disturbances, making it a dependable management indicator, and to explore if high-resolution monitoring can establish preliminary thresholds for public use. The findings will guide strategies that balance sustainable tourism with the long-term conservation of the cave ecosystem.
3. Results
3.1. Baseline Microclimatic Conditions of the Cave Prior to the Experimental Visits
Prior to the June 2023 experimental campaign, Santián Cave was monitored for a complete annual cycle under natural conditions and in the absence of tourist visitation, providing the reference framework required to distinguish natural microenvironmental variability from visitor-induced perturbation.
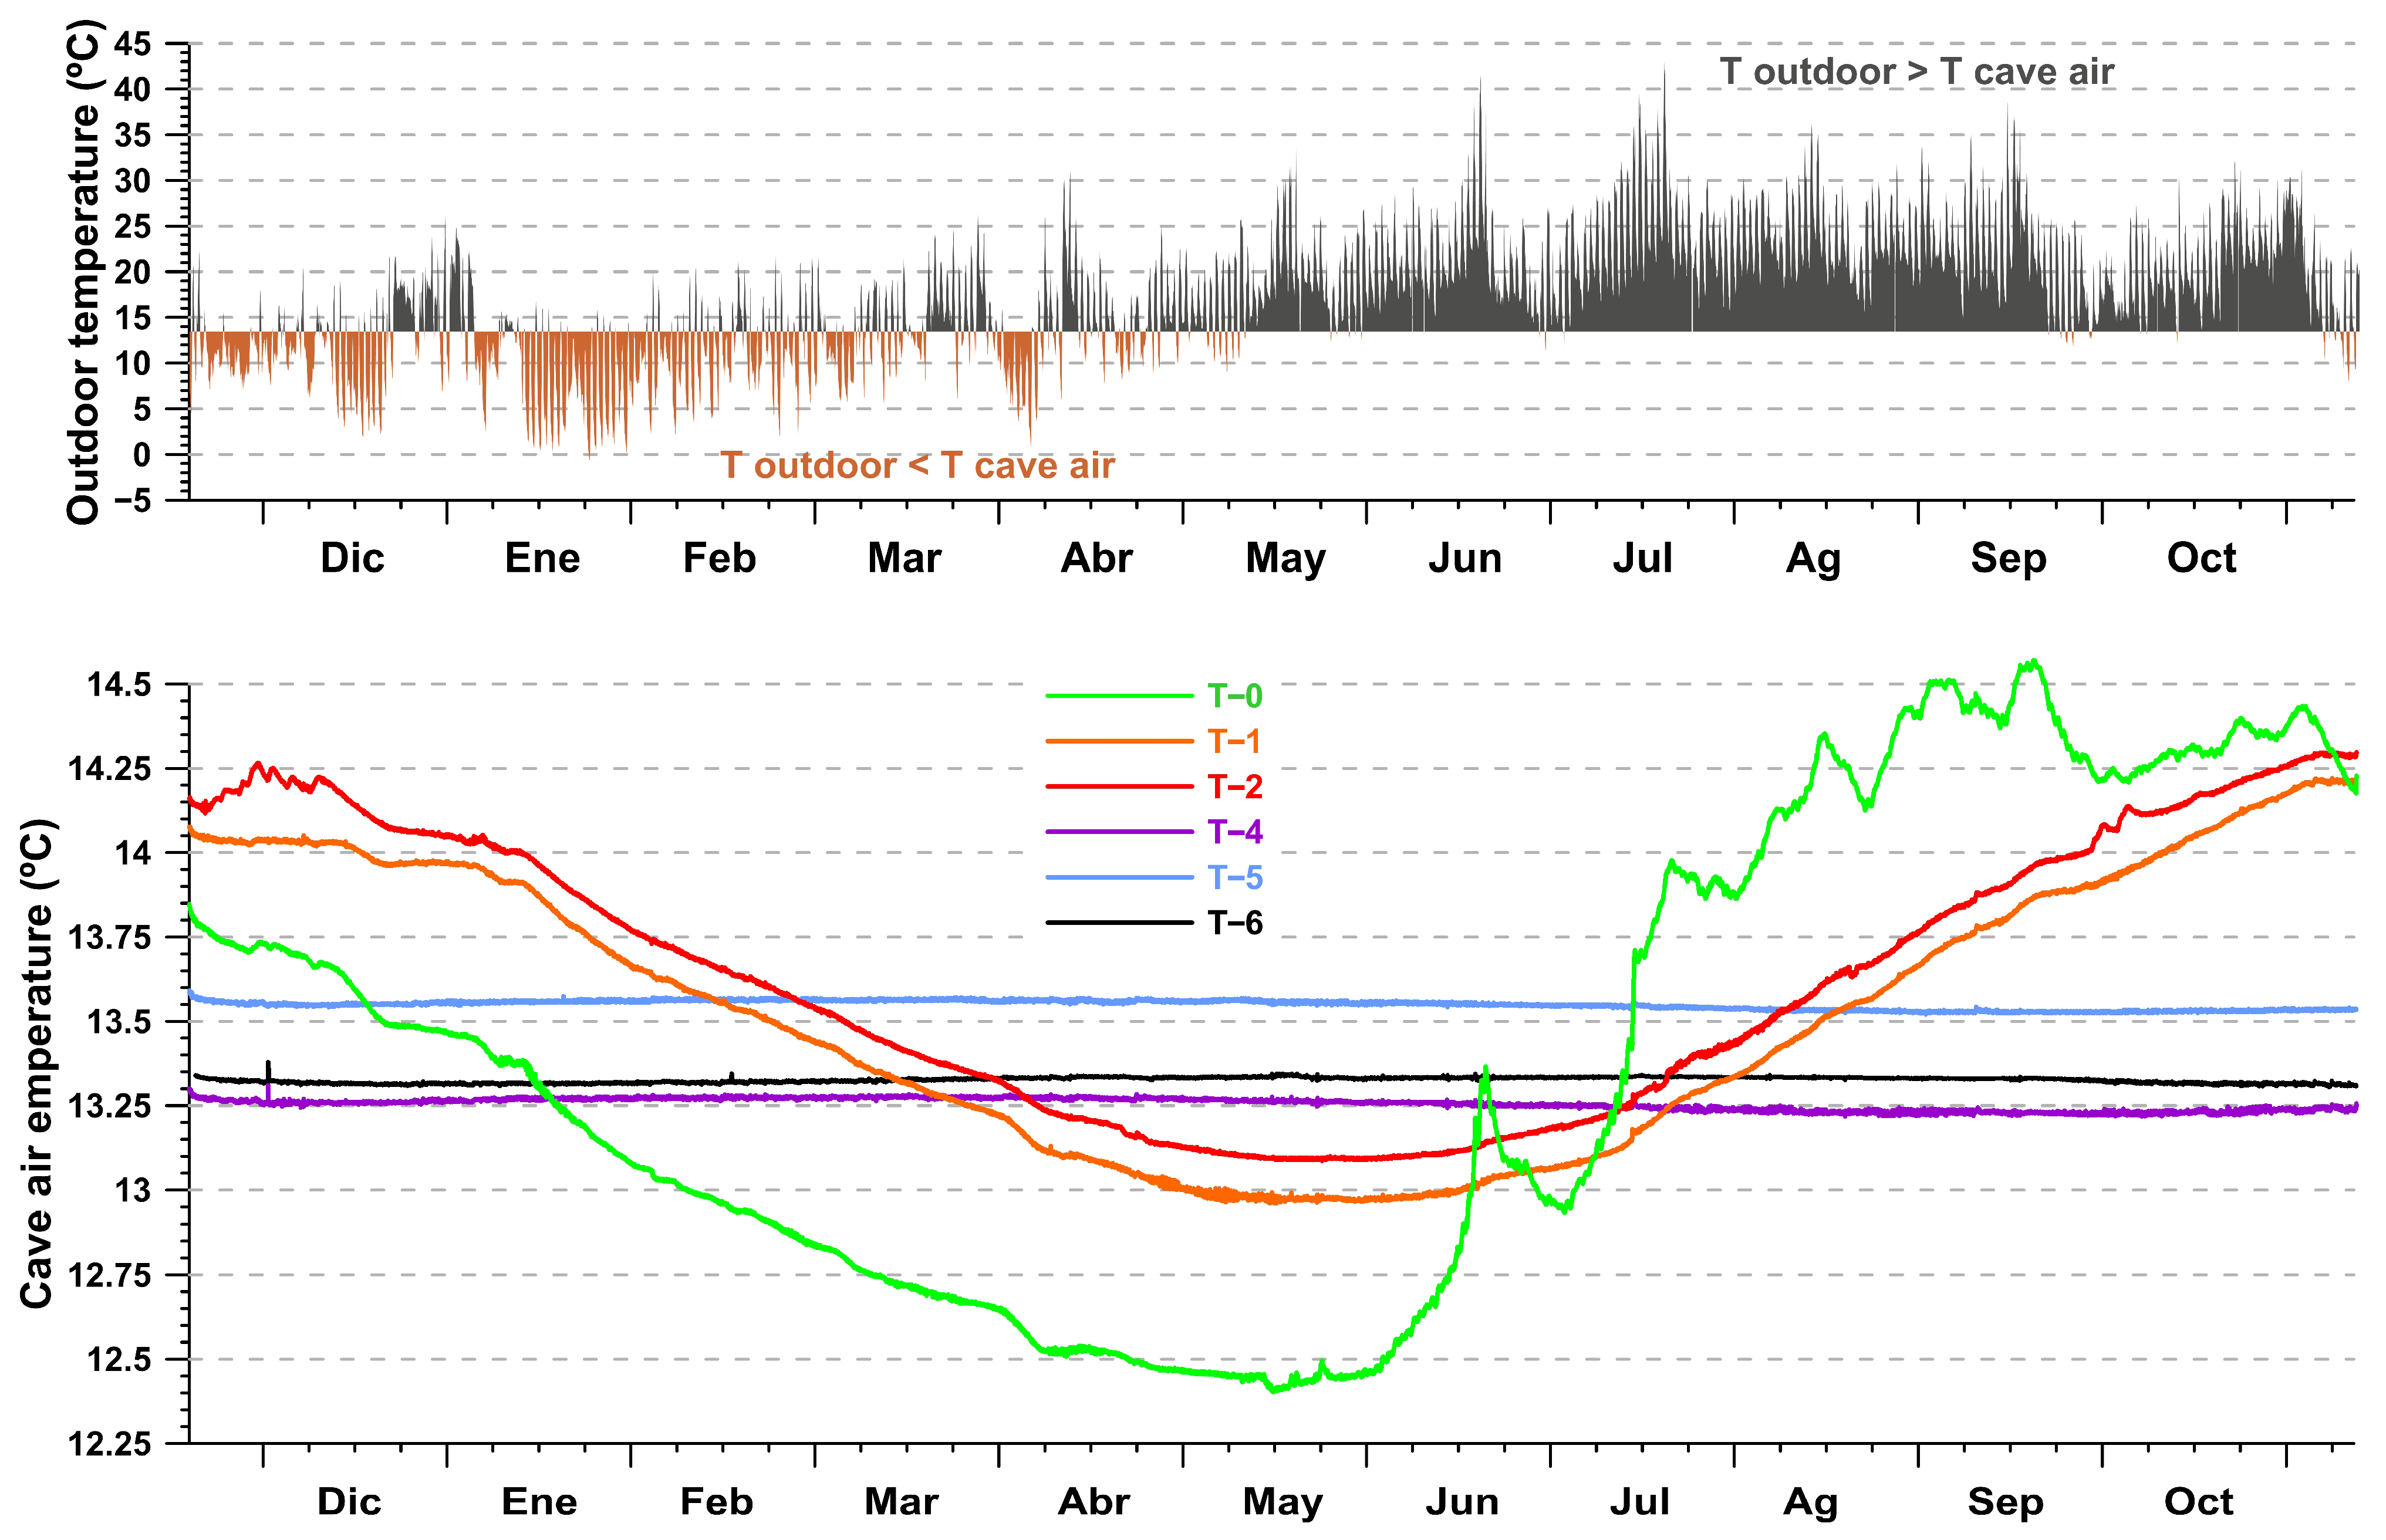
During the annual pre-experimental monitoring period, which spanned from 19 November 2021 to 7 November 2022, the external monitoring station recorded an average air temperature of 16.97 °C. The coldest month, February, experienced average temperatures below 9.4 °C, whereas the warmest months, July and August, reached a mean temperature of approximately 24 °C. Precipitation during this period totaled 974 mm and demonstrated a marked seasonal variability. The highest monthly precipitation was observed in December at 176 mm, while the lowest occurred in July with only 16 mm. These climatic values display some minor variations compared to the decade-long averages (2011–2020) recorded at the Guarnizo-Astillero weather station. During that period, the mean annual temperature was slightly lower at 16.53 °C, with January typically being the coldest month (11.1 °C) and July–August the warmest (22.5 °C). The average annual precipitation over the previous decade amounted to 995 mm, with August generally being the driest month (<40 mm) and the period from November to February characterized by higher precipitation levels exceeding 100 mm per month. These averaged climate parameters correspond to a warm temperate climate, fully humid with a temperate summer, which is classified as a “Cfb” type according to the Köppen–Geiger climate classification scheme [
25].
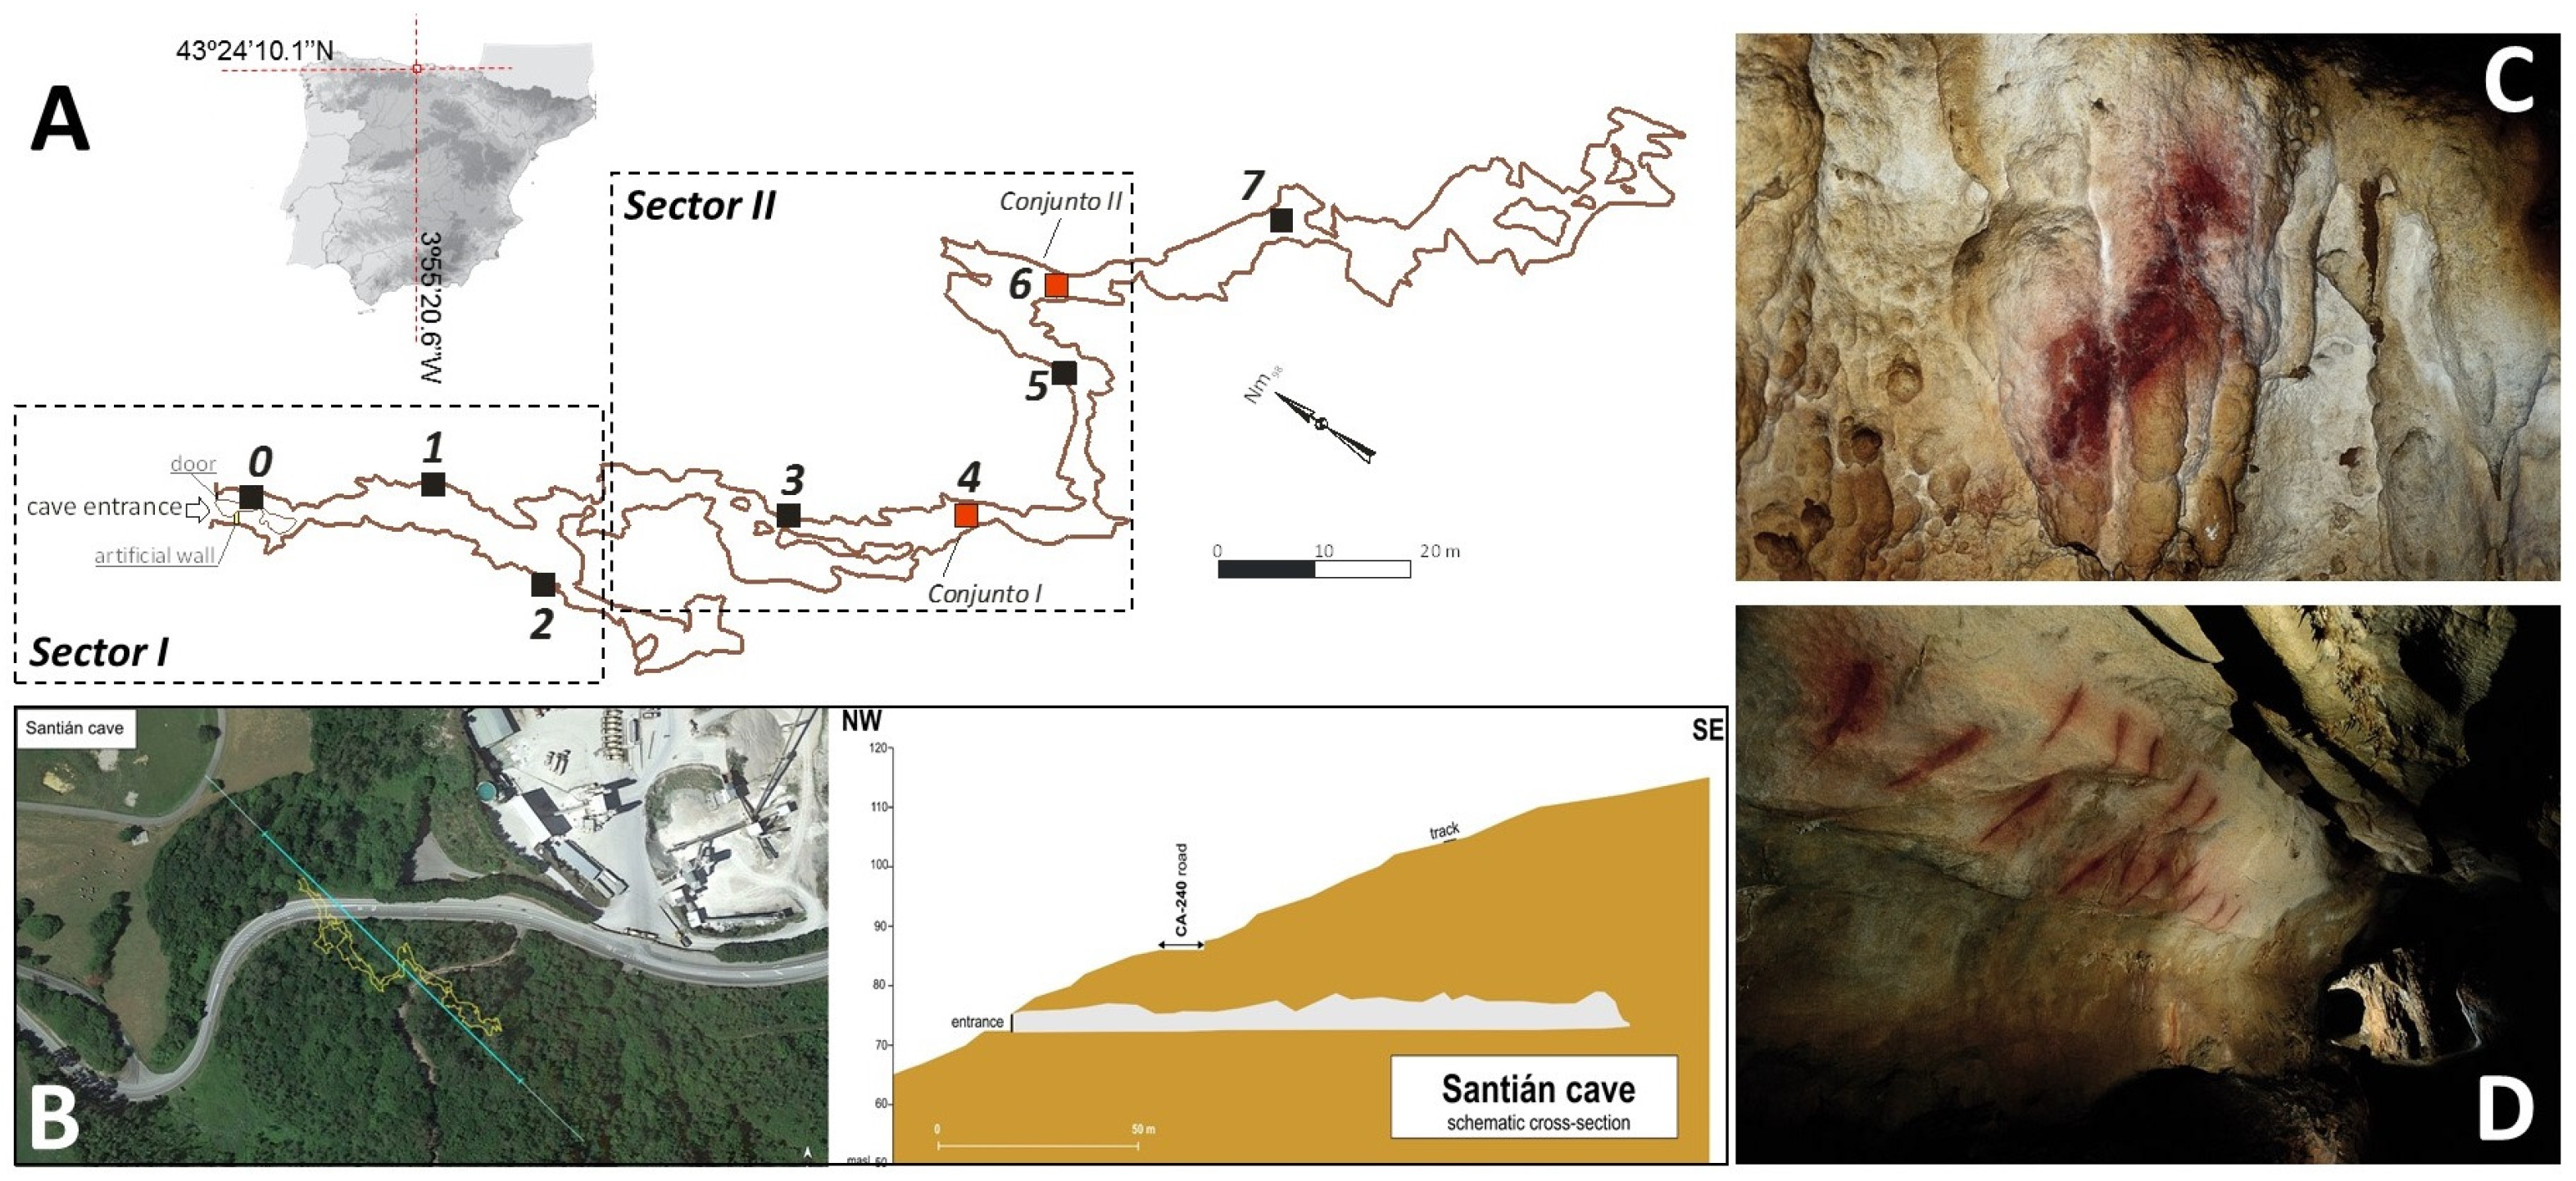
The baseline record shows that the cave atmosphere is strongly thermally buffered relative to the exterior. During the monitoring year, mean cave air temperature was 13.45 °C. Relative humidity remained at saturation throughout the cave and throughout the full monitoring period. However, the cave presented heterogeneous microclimatic conditions. In the baseline network (
Figure A1), the entrance-related first sector (Stations 0, 1 and 2) displayed a clearly stronger response to external forcing, with annual thermal amplitudes of 2.17, 1.26, and 1.21 °C, respectively. By contrast, the inner galleries hosting the main decorated sectors (Stations 4, 5 and 6) remained markedly more stable, with annual thermal amplitudes of only 0.04–0.07 °C. These measurements indicate that the most rock painting sensitive sectors of the cave also coincide with the most naturally stable atmospheric domains.
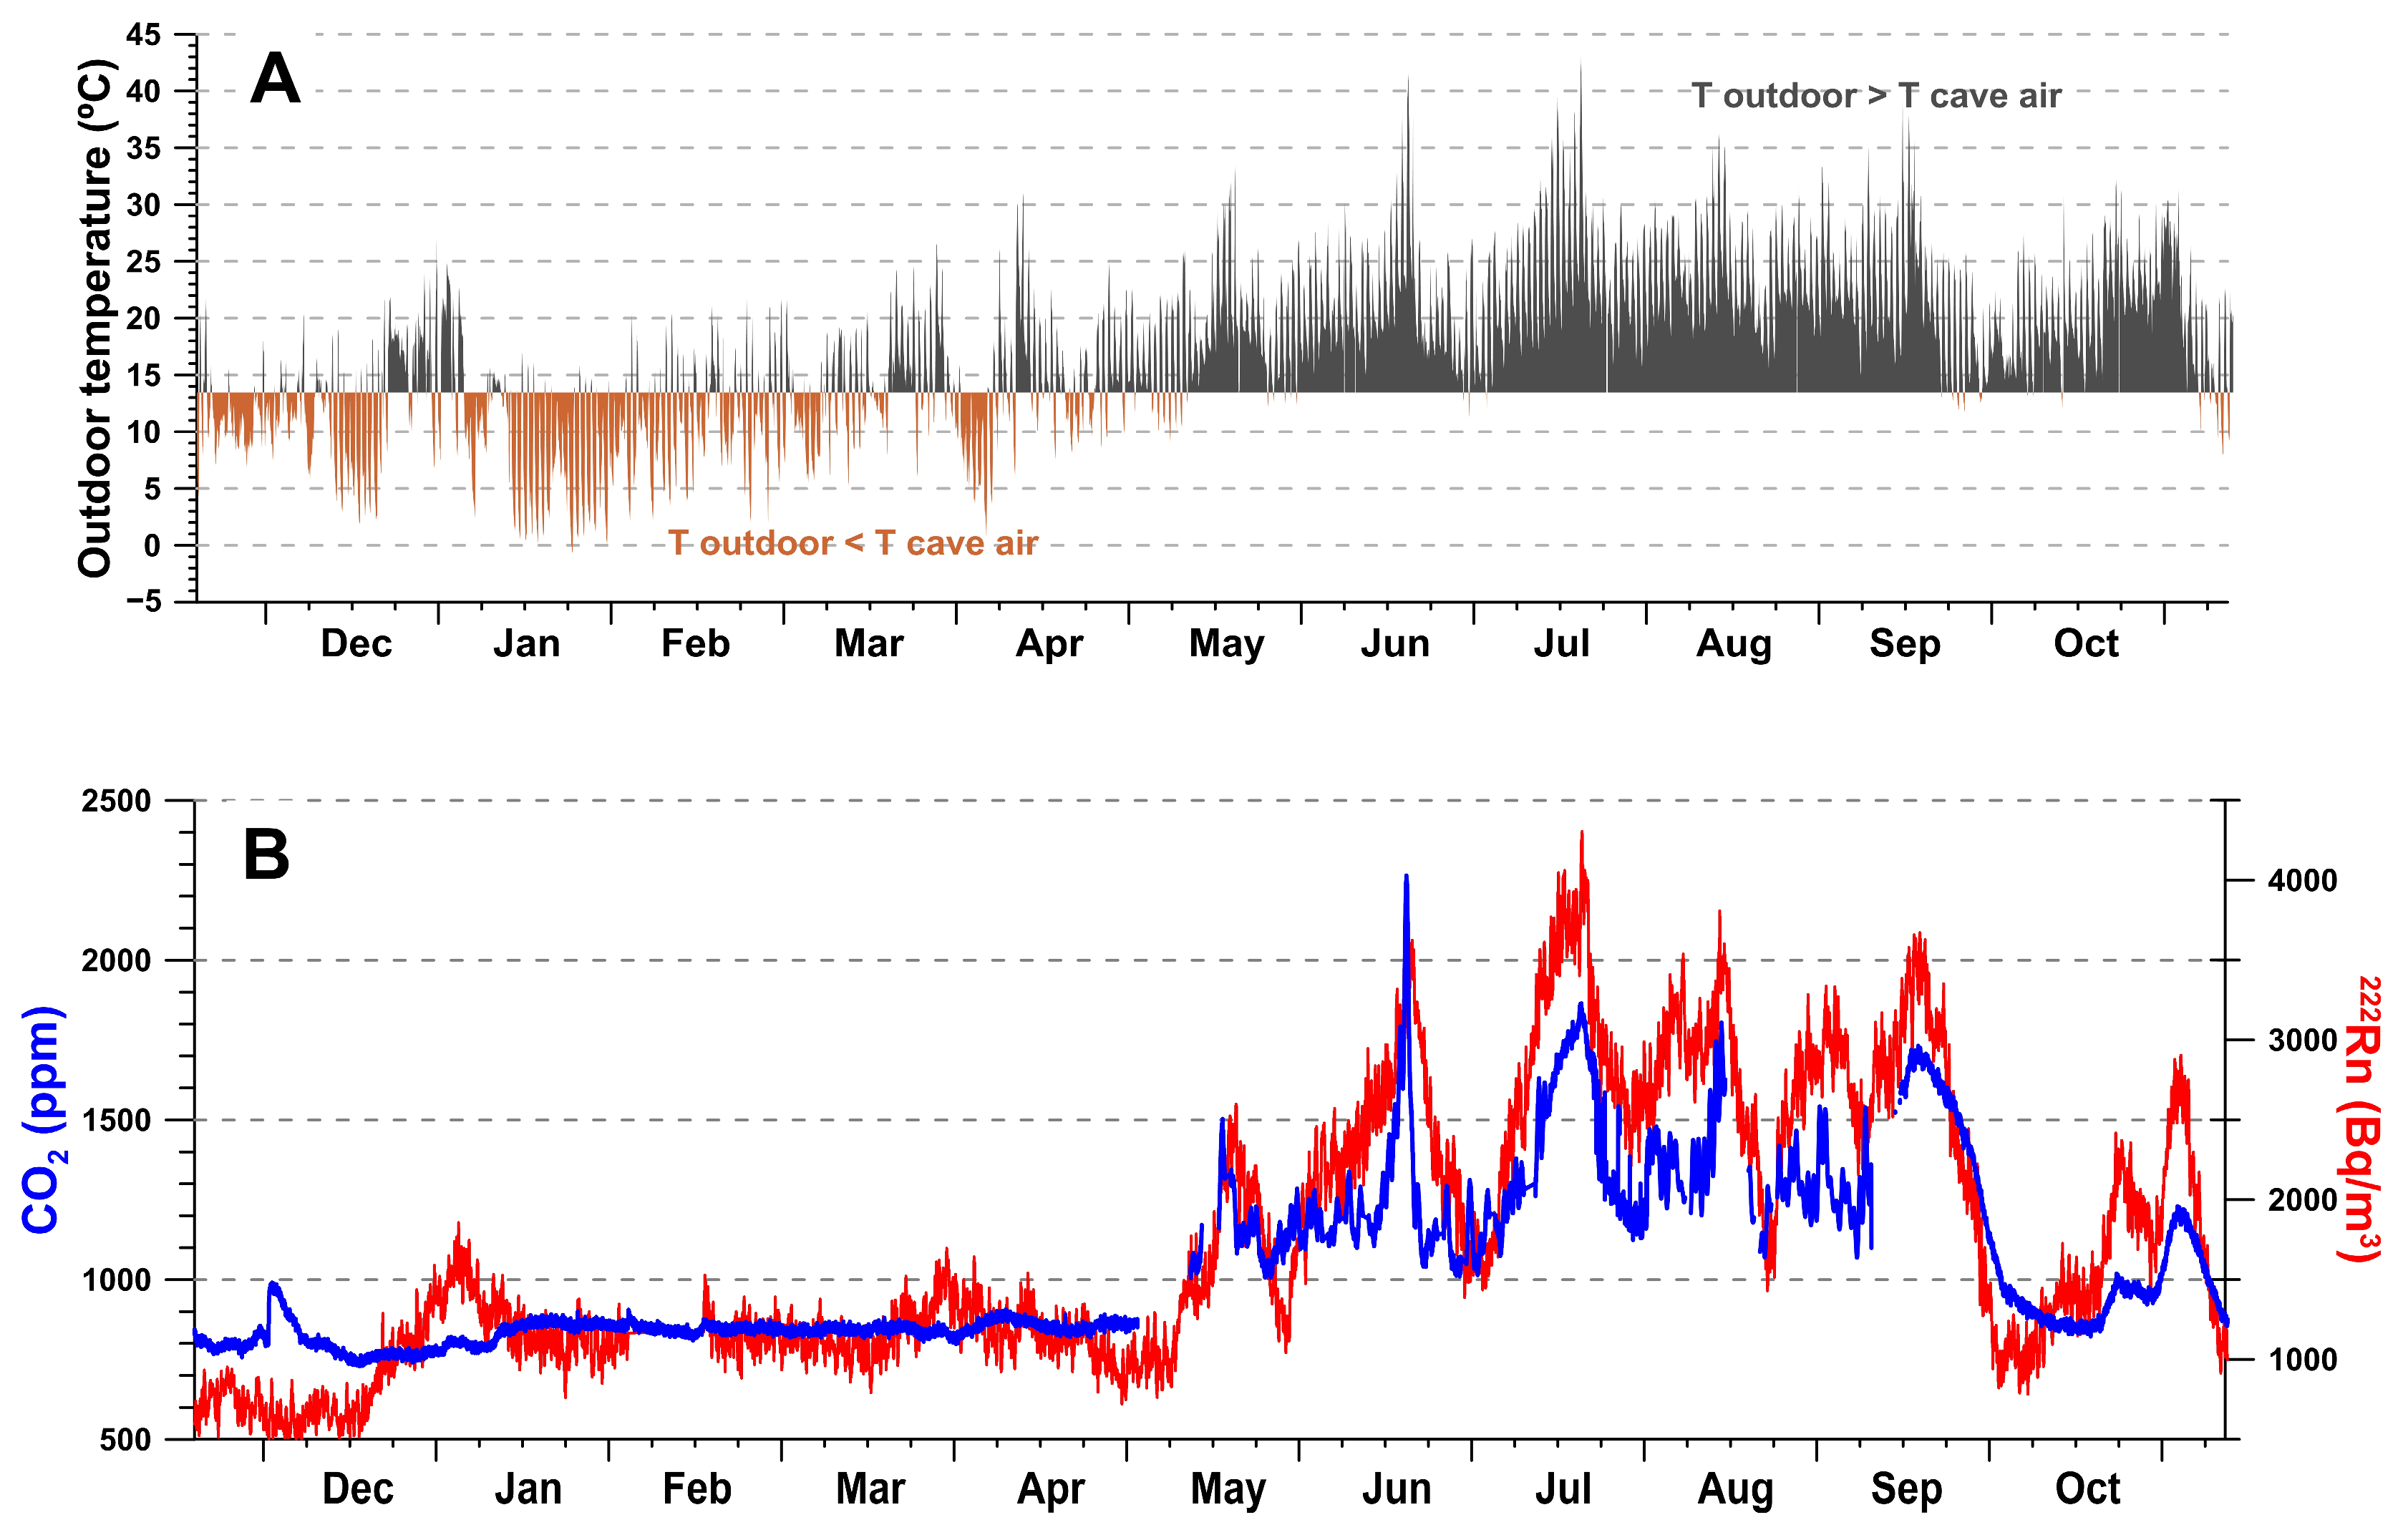
The gaseous baseline further indicates that the cave operates under two contrasting seasonal ventilation phases (
Figure 2). From November to April, when external air temperature remains below cave temperature, ventilation is more active and the cave atmosphere is more strongly influenced by the exterior. During this phase, CO
2 in the inner sector remained relatively stable, generally around 800–850 ppm, while radon concentrations were comparatively low. Therefore, both gases would serve as reliable indicators of the dilution of cave atmosphere with external air. From May onwards, as the external thermal regime exceeded cave temperature, the cave shifted towards a less ventilated and more confined state. This seasonal transition began in late May to early June, immediately before the experimental visitation campaign. During this reduced ventilation phase, monthly mean CO
2 at the main station increased to 1143 ppm in May, 1249 ppm in June, and 1405 ppm in July, accompanied by a marked increase in
222Rn, with monthly means of 1545, 2395, and 2870 Bq/m
3, respectively. The seasonal ventilation pattern is therefore interpreted from thermal gradients and gas-tracer behavior rather than from direct airflow measurements.
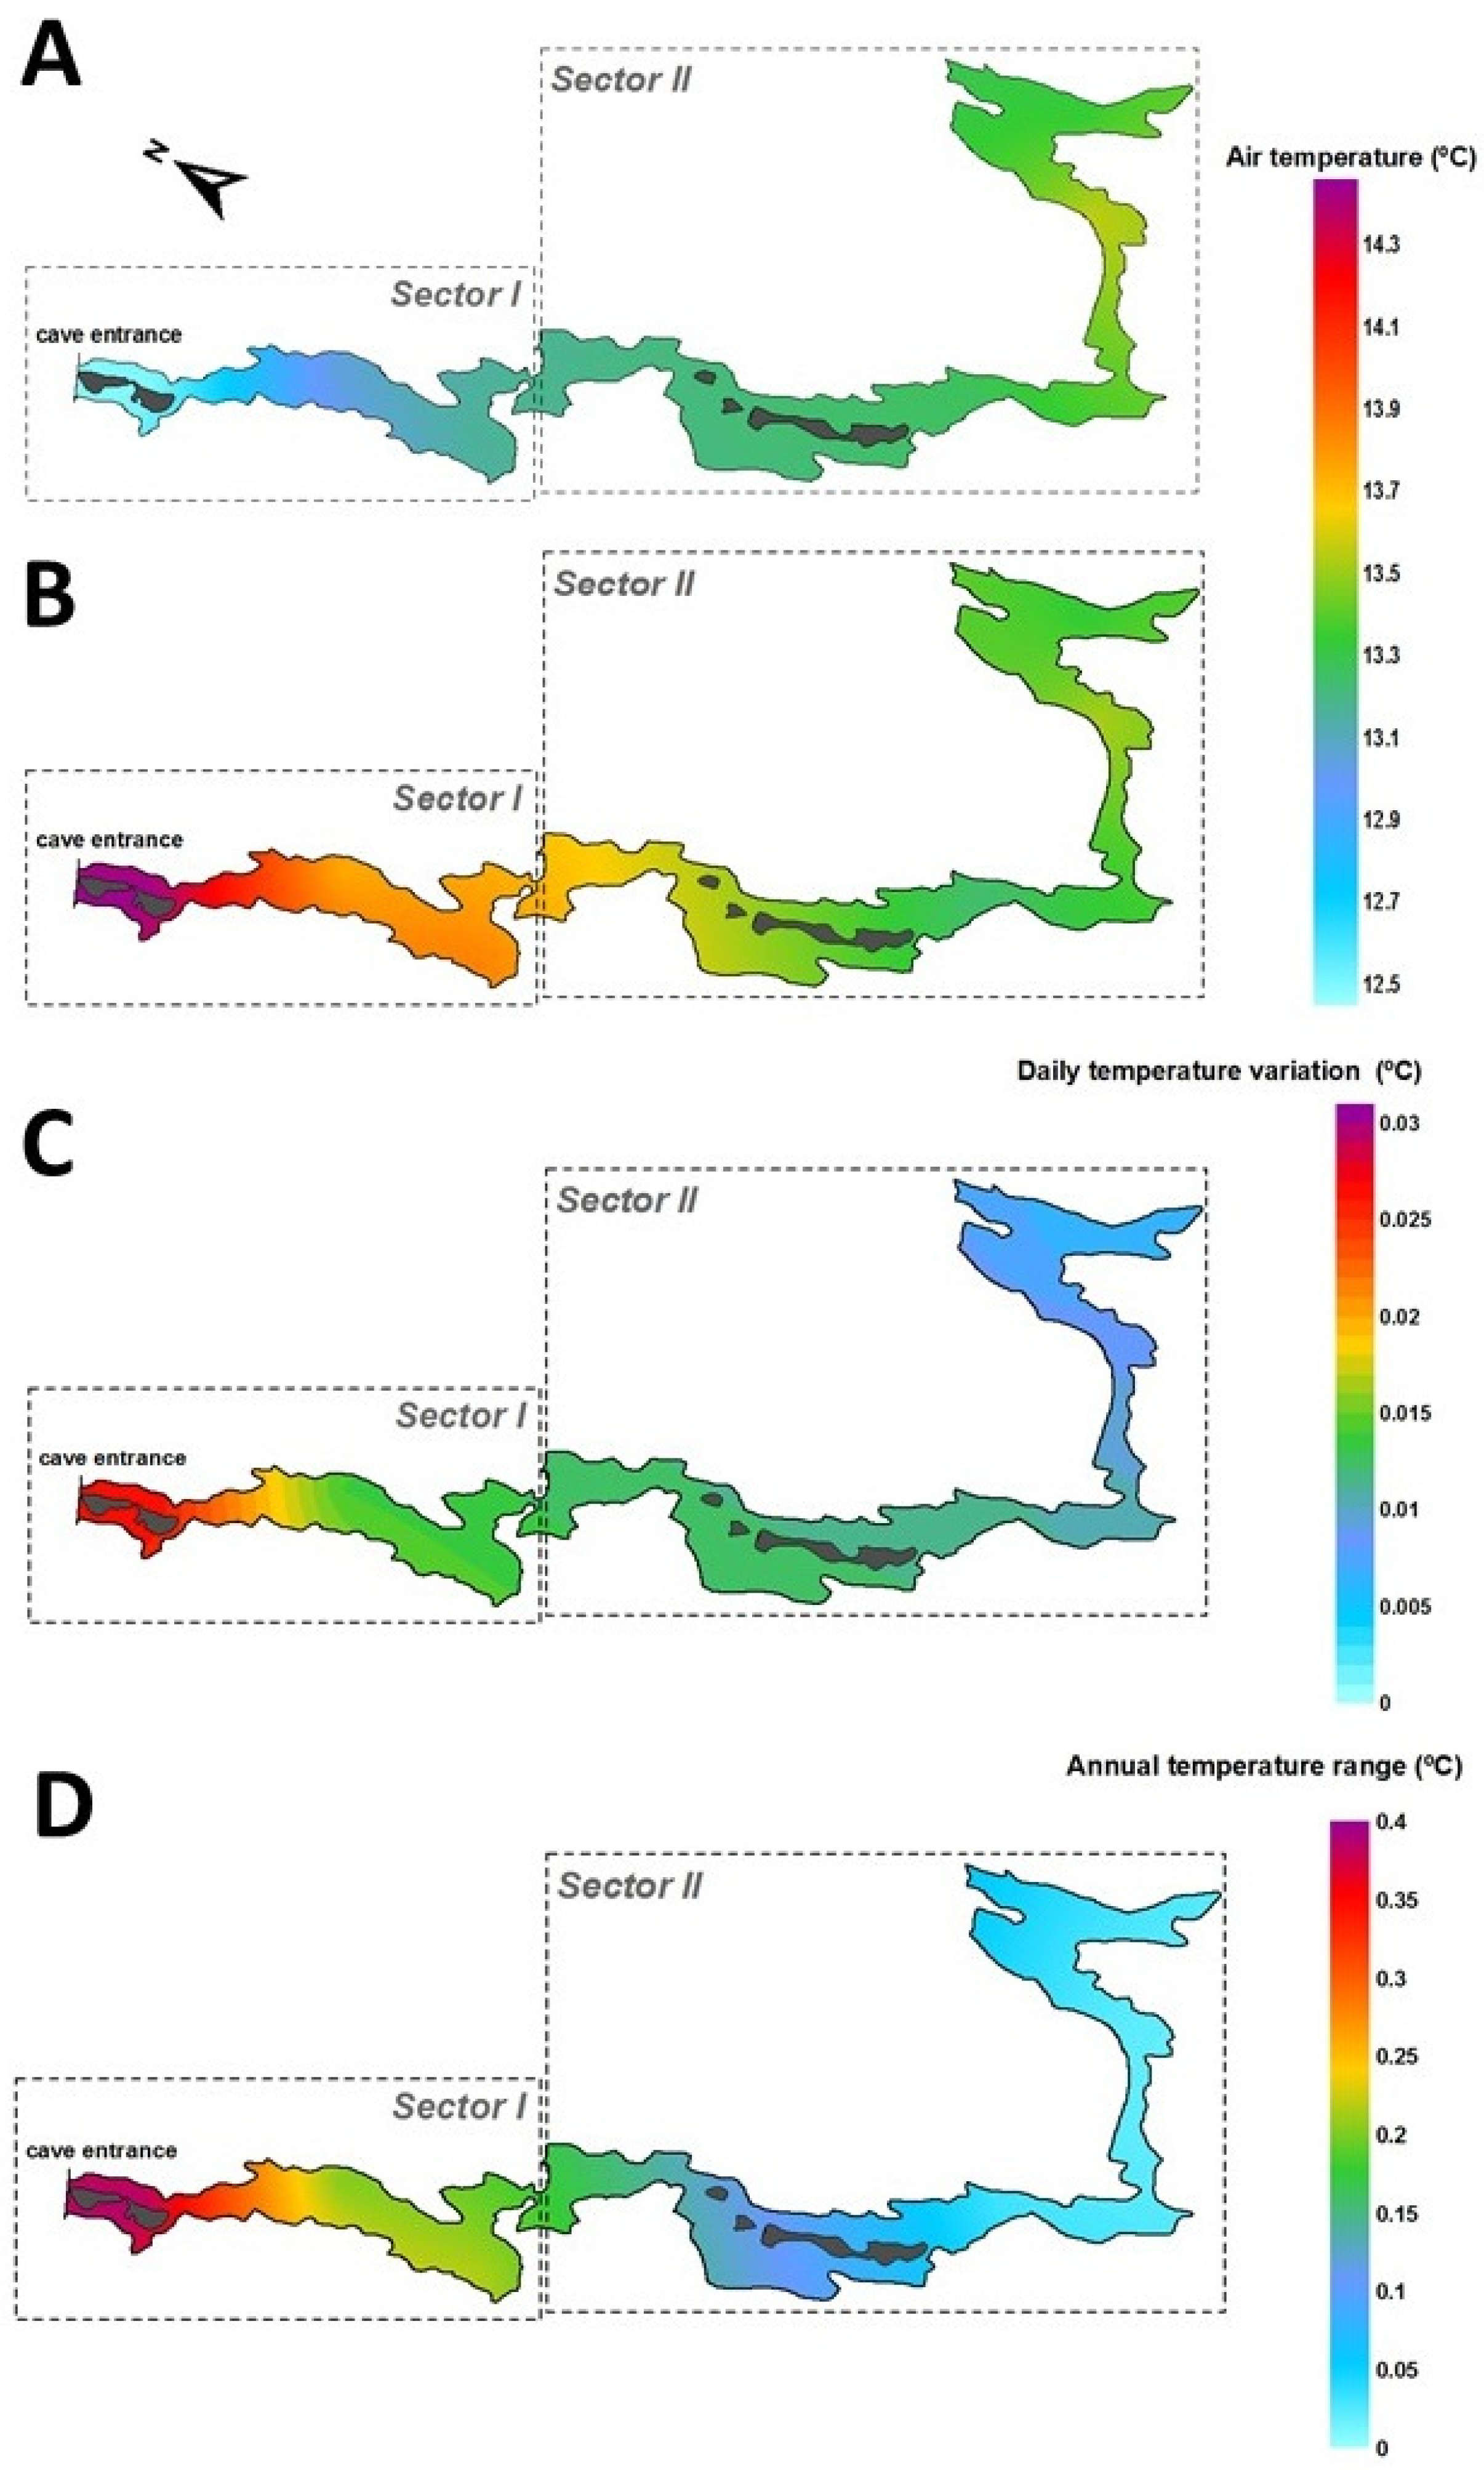
From an environmental perspective, Santián Cave exhibits marked internal spatial differentiation that is essential for interpreting its response to human visits. Sector I comprises the entrance-related passages and is characterized by a stronger external influence and wider thermal variability (
Figure 3). In contrast, Sector II includes the deeper accessible sectors of the cave, coinciding with the location of the main rock art ensembles.
3.2. Spatial Variability of the Thermal Response During the Experimental Visits
The results are presented according to the main environmental variables selected for impact assessment and emphasize both the spatial variability of the response and the cumulative effects associated with visit intensity and recovery time between groups.
The June 2023 experimental campaign took place during the seasonal phase of reduced cave ventilation previously identified from annual baseline monitoring. During this period, cave ventilation is less active and baseline CO
2 concentrations are relatively high, around 1100 ppm, relative to winter and spring values (
Figure 2), which may enhance the accumulation of visit-induced perturbations and reduce the rate of atmospheric-driven recovery between successive groups.
At the principal inner station (Station 6 in
Figure 1A), monthly mean CO
2 increased from 1143 ppm in May to 1249 ppm in June and 1405 ppm in July, indicating that the experimental visits were conducted under conditions favorable to gas accumulation in the cave atmosphere. This could, in principle, result in an incomplete recovery between successive short increments of CO
2 due to presence of visitors.
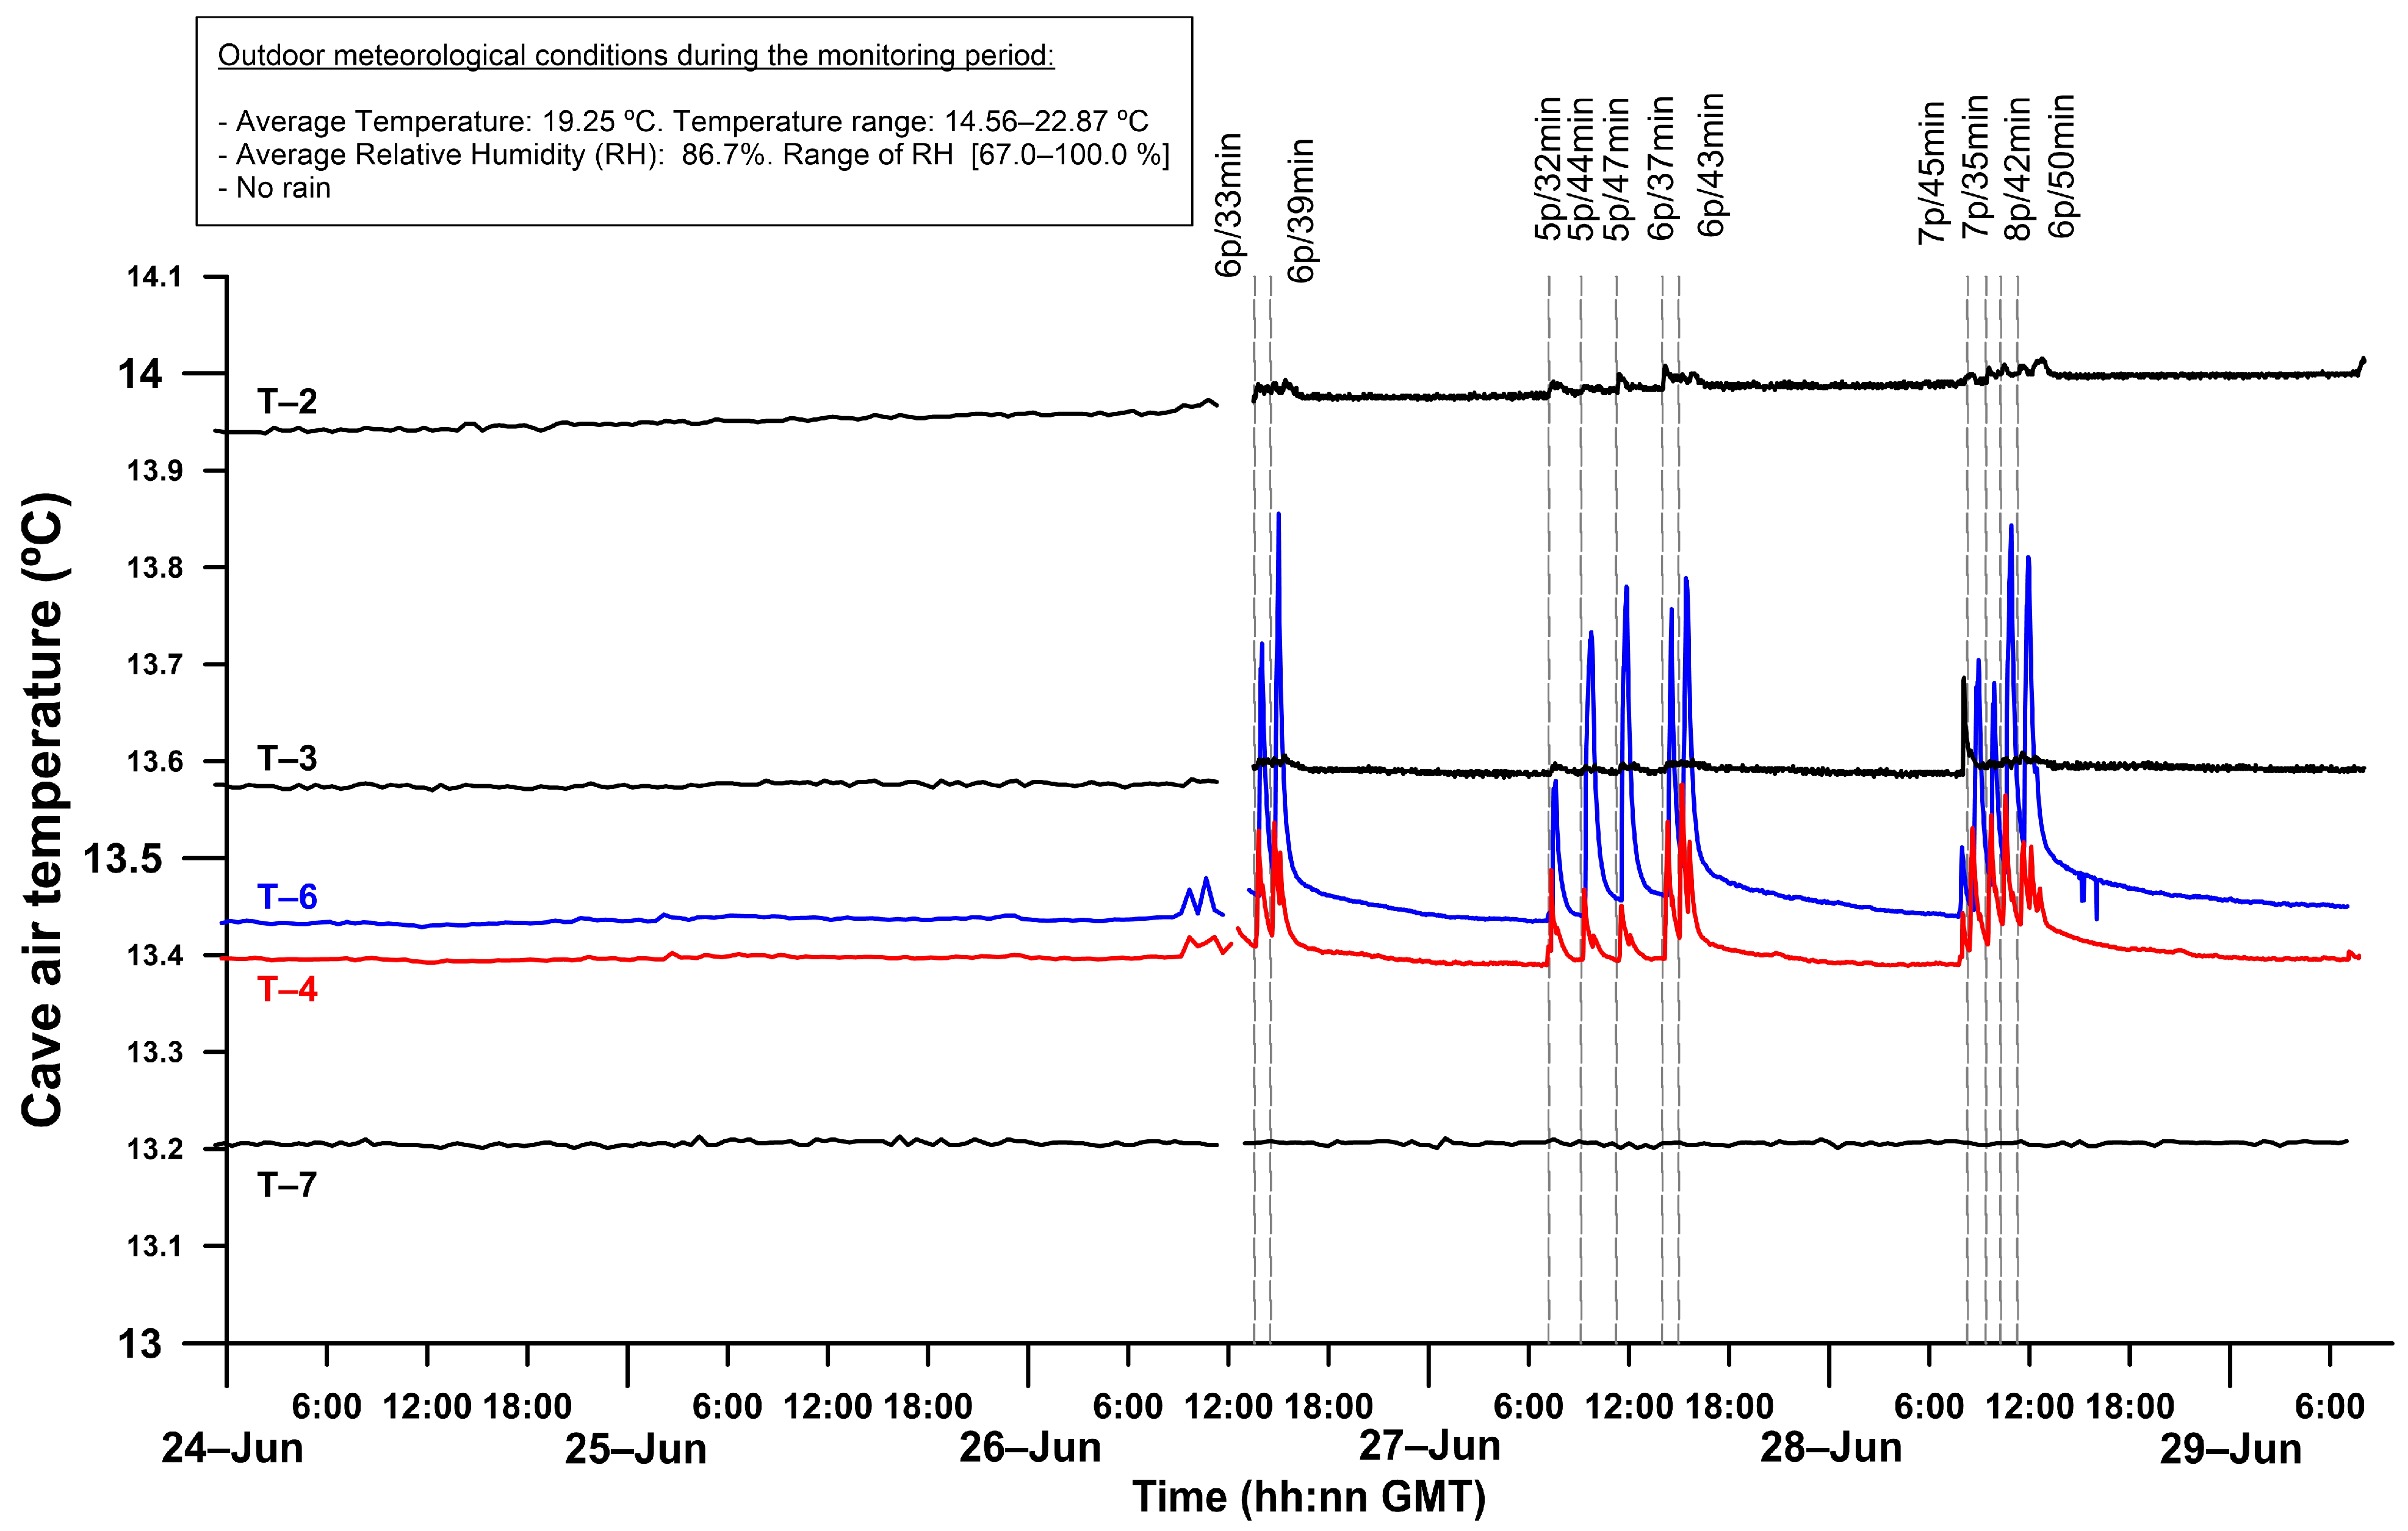
The thermal response showed a marked spatial contrast within the cave. At monitoring Stations 2 and 3, visitor transit produced only minor thermal perturbations of 0.01–0.02 °C, values only slightly above the natural fluctuations recorded during the preceding days (
Figure 4). In contrast, visitor permanence at the main control points associated with Conjunto I and Conjunto II generated clearly detectable thermal disturbances, the magnitude of which increased with both group size and duration of stay. By comparison, the monitored inner non-visitable gallery remained substantially more stable and showed no appreciable thermal changes during the sequence of experimental visits (
Figure 4).
In the vertical profiles of Conjunto I and Conjunto II, thermal anomalies were greater in the upper part of the monitored section than near the floor. Mean visit-related increases reached 0.11 °C in Conjunto I and 0.28 °C in Conjunto II, with maximum values of up to 0.37 °C during the first day of experimentation. These perturbations exceeded the characteristic natural variability previously established for these locations, with thermal amplitudes estimated at 0.07 °C for Conjunto I and 0.04 °C for Conjunto II, whereas those of the Sector I exceeded 1 °C. Recovery times were also consistently longer in Conjunto II, confirming the greater thermal sensitivity of the innermost sector.
3.3. Dynamics of CO2 and Airborne Particles During the Experimental Visits
The experimental campaign was conducted during the seasonal phase of reduced cave ventilation, when exchange with the exterior is limited and baseline CO2 concentrations were approximately 1100 ppm. Under these conditions, although natural summer variability may reach 100–200 ppm·day−1, a detailed analysis of the profiles in Conjunto I and Conjunto II revealed changes in the trend that were clearly associated with visitor presence near the monitoring stations.
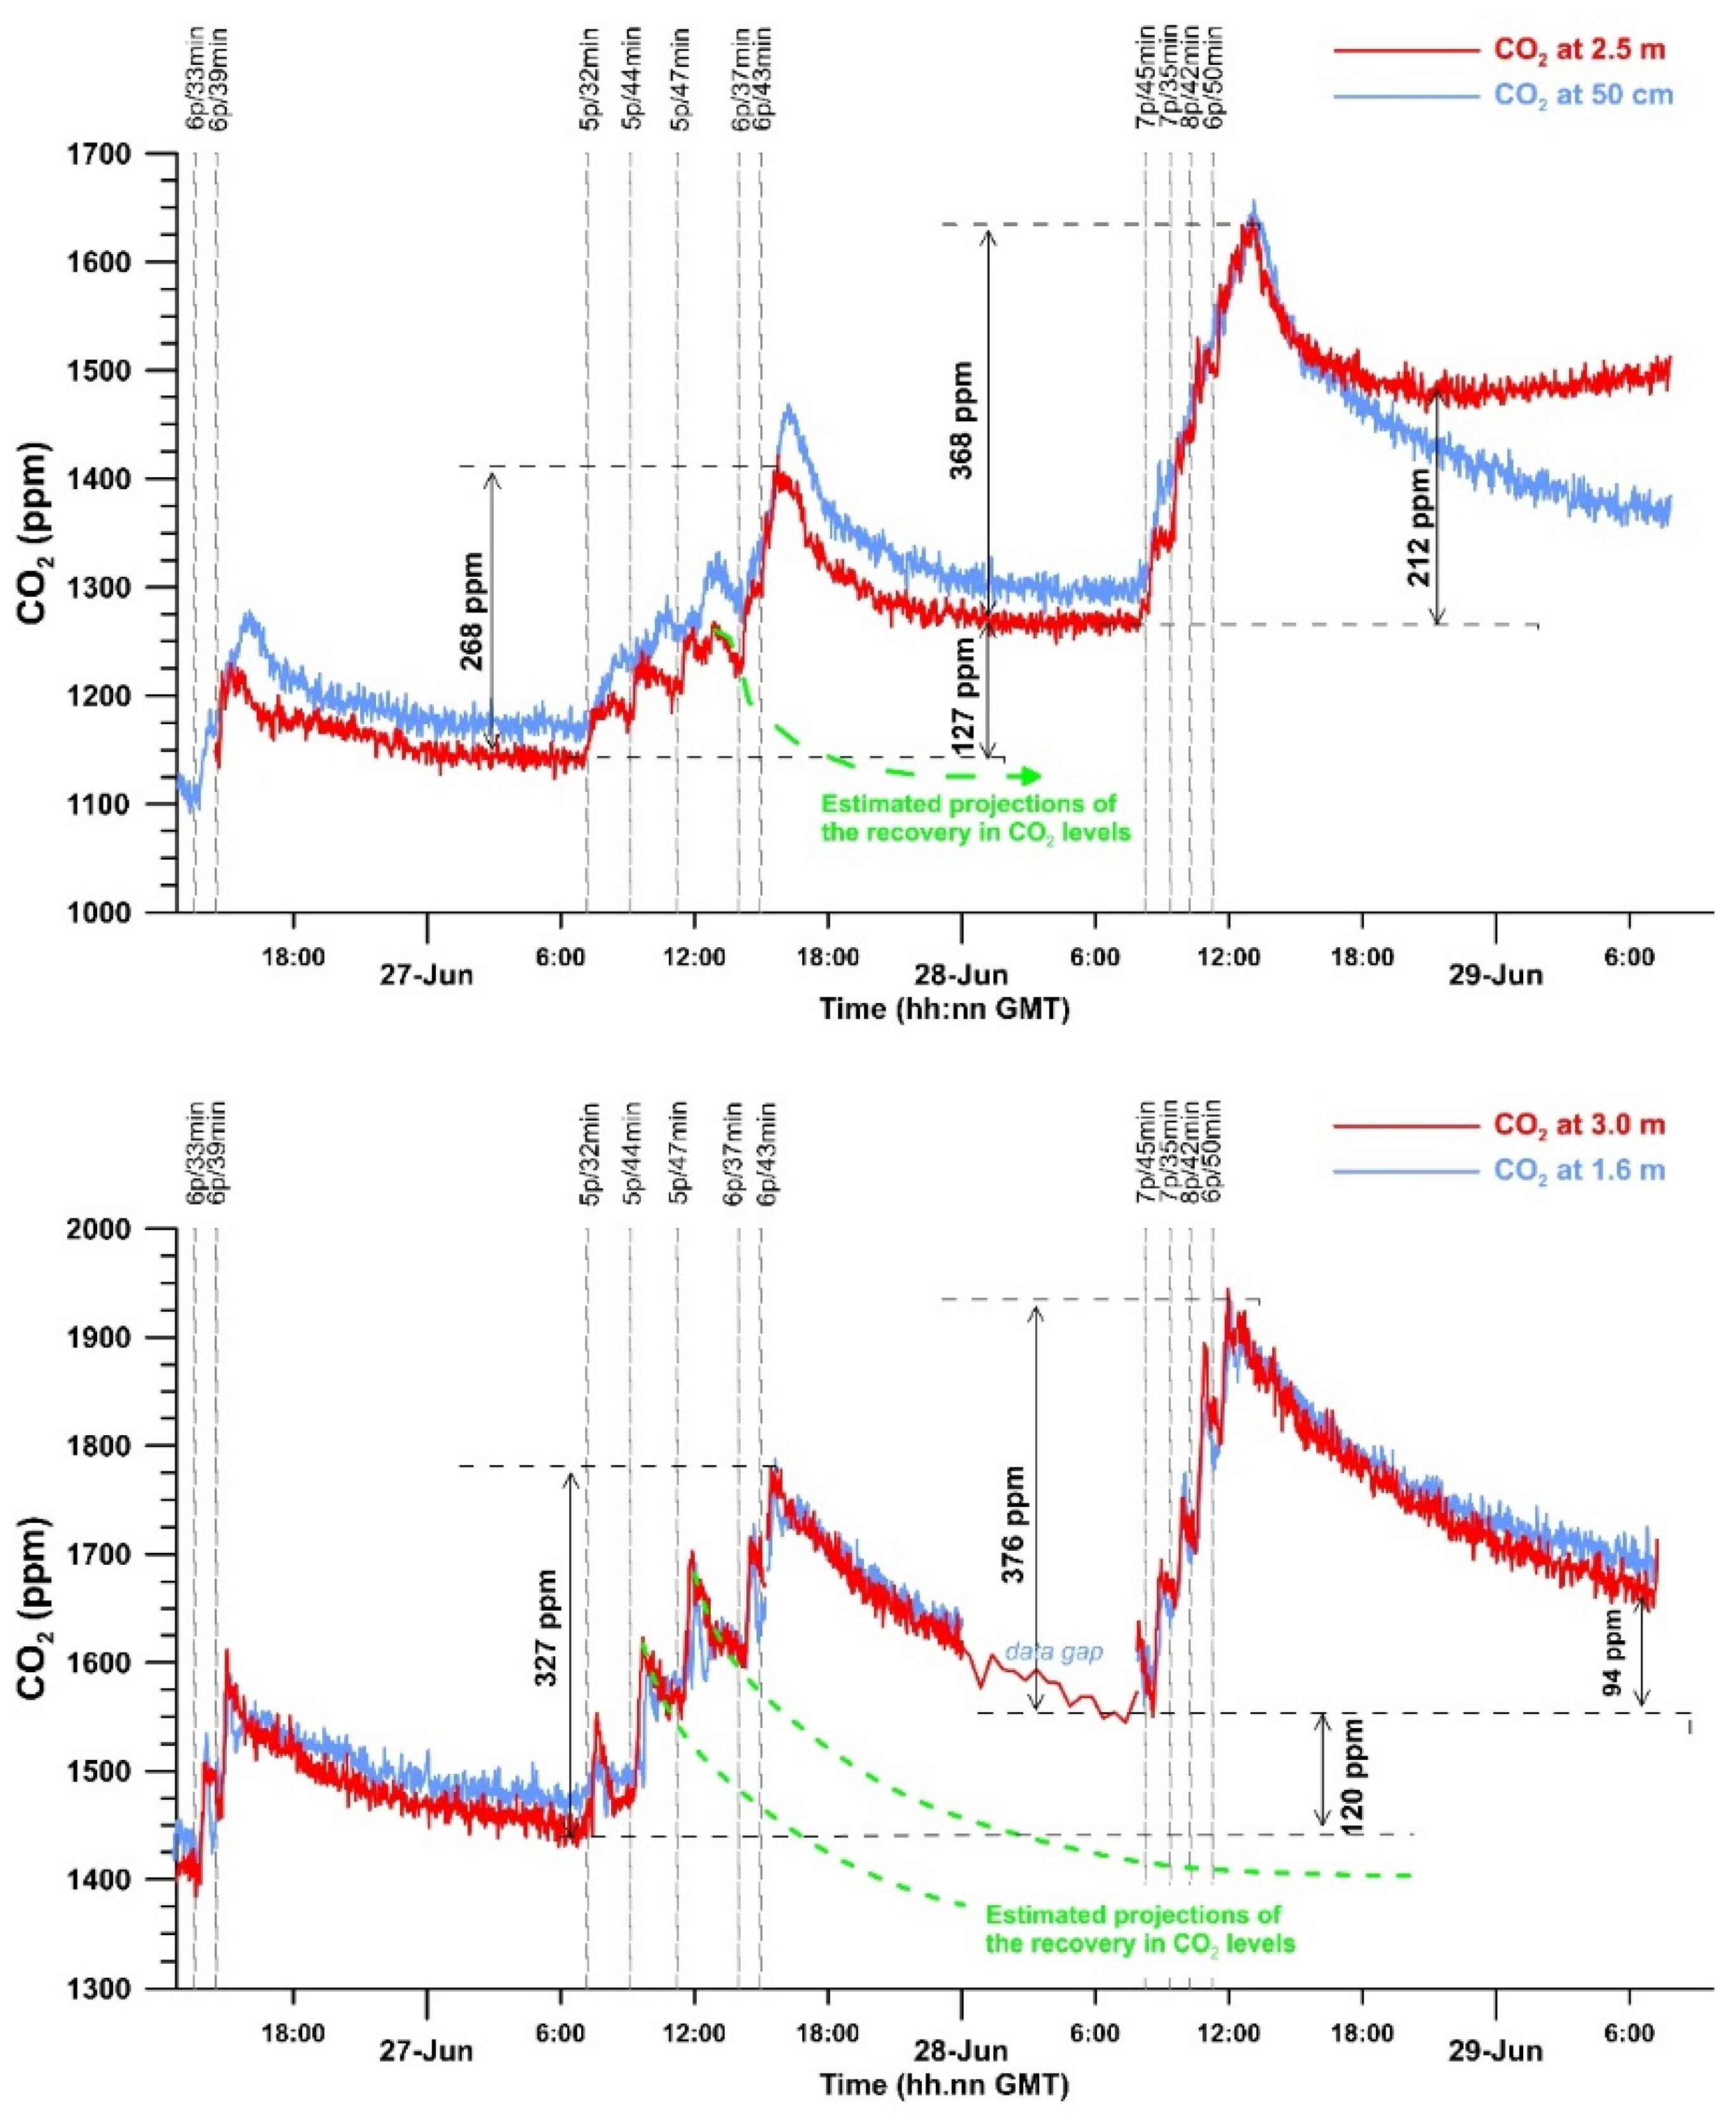
The cumulative daily CO
2 increase associated with the visit sequences reached 268 ppm and 368 ppm in the Conjunto I gallery on 27 and 28 June, respectively, and 327 ppm and 376 ppm in the Conjunto II chamber on the same days. Overnight recovery after each daily sequence was incomplete, resulting in residual accumulations of 127 and 212 ppm in Conjunto I, and 120 and 94 ppm in Conjunto II (
Figure 5).
These visit-induced increases were superimposed on a seasonally elevated background, as the annual baseline study showed that June corresponds to one of the highest CO2 phases of the year in the inner sector, with a monthly mean of 1249 ppm and a mean daily variation of 202 ppm at the principal station.
The vertical structure of CO2 was broadly comparable to the thermal pattern, although under pre-disturbance conditions concentrations were slightly higher near the floor. During repeated visits, the profile rapidly homogenized, and under the most intensive visit sequence, an inversion of the vertical gradient was recorded in Conjunto I at the end of the sequence of experimental visits.
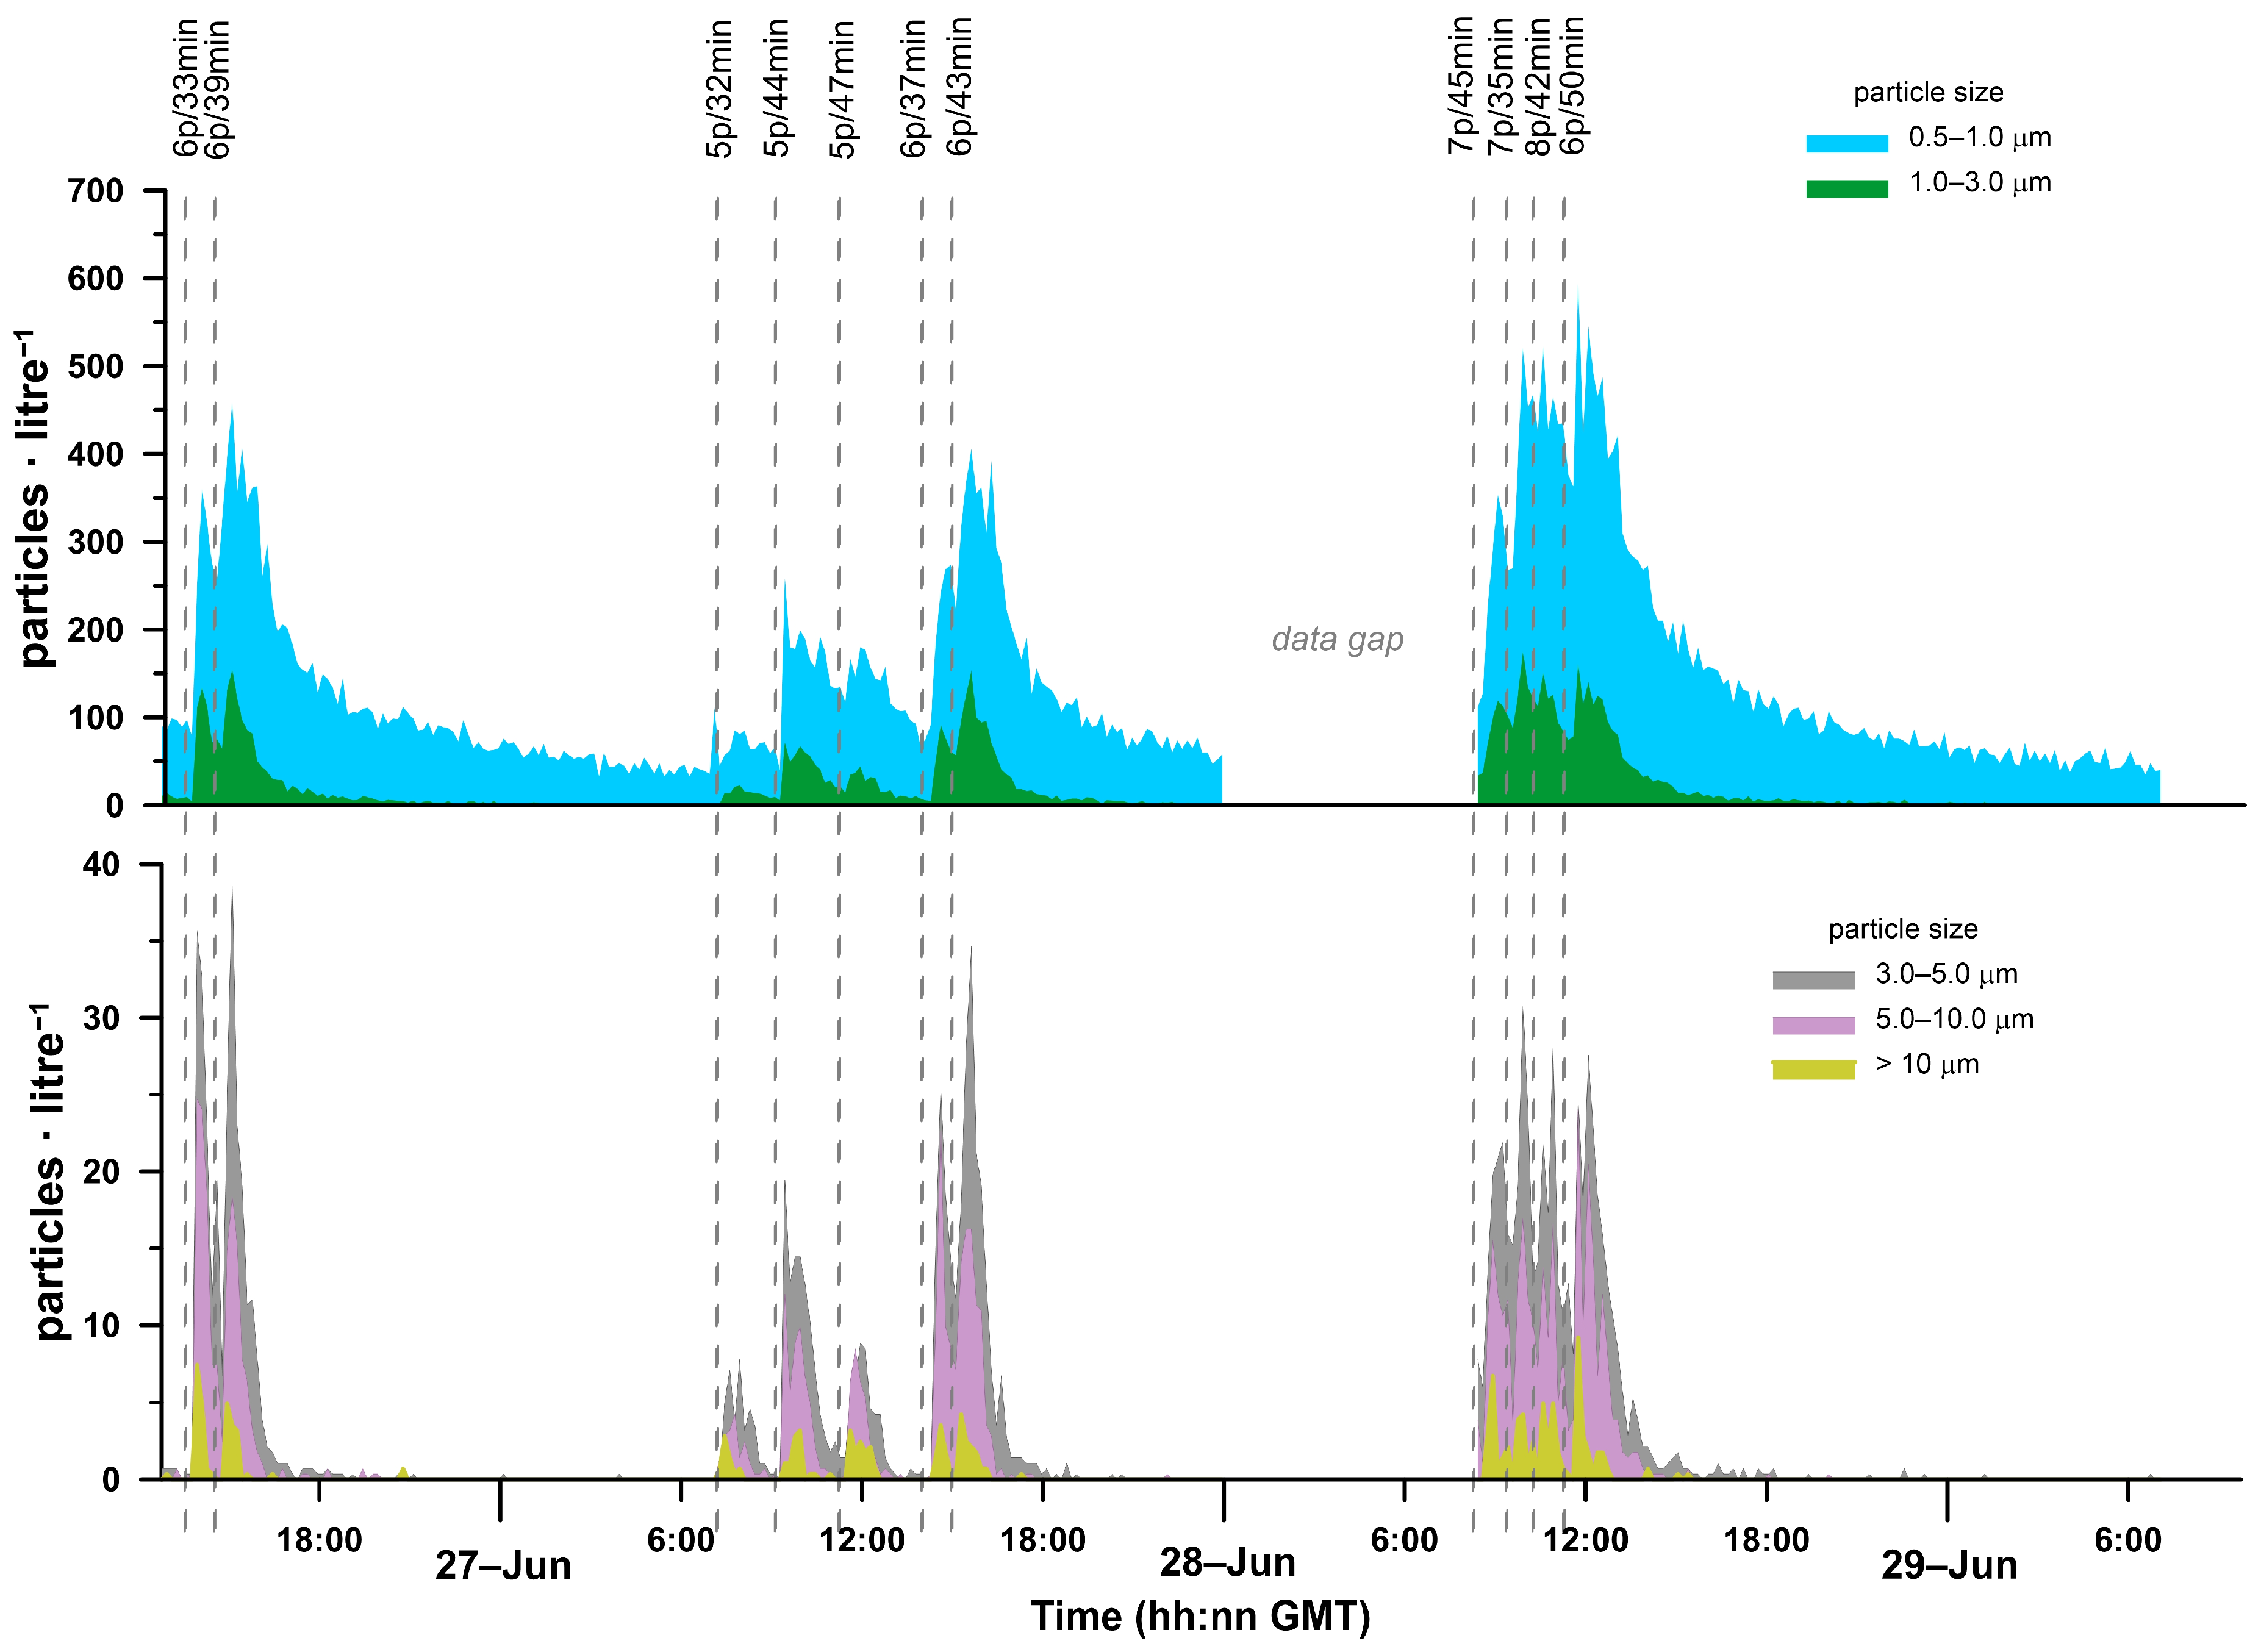
Jointly considering the particle fractions > 0.5 µm, the results showed a clear cumulative effect associated with consecutive groups and a marked increase in recovery time as visit intensity increased (
Figure 6). In addition, no previous no-visit time series of suspended particulate matter was available for the gallery of Conjunto II, which prevented a precise characterization of the natural background of this variable at the point of greatest patrimonial interest. Consequently, the particulate record is interpreted primarily in terms of relative changes associated with visitor presence, rather than against a fully constrained natural baseline.
During the morning of 27 June, when groups of five visitors entered at intervals of approximately 1 h, particle increases remained below 300 particles·L−1 and partial recovery was reached before the next group entered. In contrast, the consecutive entrance of two groups of six visitors during the afternoon raised the particle concentration to 561 particles·L−1, with recovery times still below 9 h, but clearly longer than those observed during the morning sequence of visits. The most intense response occurred on 28 June, when four consecutive groups of 6–8 visitors produced a maximum concentration of 686 particles·L−1 and a recovery time of 13.6 h.
In the absence of visits, the coarser particle fractions tended to decline rapidly, suggesting their relatively fast removal from the cave atmosphere. However, because no specific no-visit baseline record of suspended particles was available for Conjunto II, this behavior cannot be compared directly with a fully constrained natural background at the most sensitive monitoring point. The particulate record should therefore be interpreted primarily in terms of relative changes associated with visitor presence rather than as a complete characterization of natural particle dynamics.
4. Discussion
The present results show that the main conservation problem is not limited to the instantaneous increase in temperature, CO
2, or suspended particles associated with each visitor group. The critical issue is the progressive accumulation of disturbances when the cave atmosphere is not allowed sufficient time to recover its initial conditions. In Santián Cave, this pattern is reflected by the incomplete overnight recovery of CO
2, the persistence of thermal anomalies in Conjunto II, and the marked extension of particle recovery times during consecutive visit sequences. The significant anomalies observed in Conjunto II suggest that the innermost decorated area is particularly sensitive to human disturbance. This sensitivity arises from its confined nature and inherent stability within a very narrow natural thermal range. As a result, even minimal thermal or gaseous inputs from visitors can cause disproportionately large deviations from its baseline state. These deviations could have implications for conservation, similar to findings reported in other decorated caves [
3]. The importance of cumulative effects rather than isolated peaks has also been highlighted in other rock art caves. In La Garma Cave, human presence caused cumulative thermal perturbations and substantial resuspension of sediment particles in very stable sectors [
16]. In El Castillo and Covalanas, a large database of visitors impacts was assessed relative to the natural daily range of variation under increasing daily visitation intensities, allowing sustainable visitation ranges to be defined on a probabilistic basis [
26].
Among the variables analyzed in Santián Cave, CO2 concentration of cave air appears to be the most robust operational indicator for access regulation, since this parameter showed the clearest cumulative response at the daily scale and provided the most consistent signal for distinguishing between moderate and intensive visit regimes. CO2 recorded the clearest cumulative daily signal, showed incomplete recovery after the end of the visit sequences, and propagated with delay into aerodynamically connected sectors that were not directly occupied by visitors. This indicates that the anthropogenic disturbance extended beyond the immediate route of the tour.
The importance of CO
2 as a management variable has also been emphasized in other heritage caves. Temperature and CO
2 were identified as the principal variables for defining sustainable visitation thresholds in UNESCO caves with rock art [
26], and visitor-driven increases in CO
2 were likewise highlighted as a major conservation concern in the Ajanta caves [
27]. More generally, cave microclimate studies have stressed that sustainable use depends on adapting visitation to the natural response regime of each cave rather than applying uniform thresholds [
14,
28]. This site-specific approach is particularly important in decorated caves, where access regulation must be subordinated to preventive conservation criteria [
3].
The suspended particle record adds an additional preventive conservation dimension. In the Conjunto II gallery, the strongest particle anomalies occurred during the most intensive visit sequences and were associated with the longest recovery times. This behavior is consistent with results obtained in Škocjan Caves, where tourist visits produced immediate increases in particulate matter and microclimatic disturbance, with stronger effects under higher visitor loads and during summer conditions [
15]. In Santián, however, these implications must be stated cautiously. Although particle deposition on walls and ceilings, microbial transport, and related biodeterioration are plausible risks, the present study did not directly test the full causal chain linking resuspension to surface alteration. The particulate signal should therefore be interpreted as evidence of a credible conservation risk, rather than as direct proof of deterioration.
Taken together, the temperature, CO2, and suspended particle records converge on a consistent pattern. Groups of five visitors generated comparatively limited disturbances and allowed partial recovery when sufficient time elapsed between entries. By contrast, the succession of groups exceeding five visitors, and particularly the use of consecutive entries or visit sequences extending across morning and afternoon, increased both the magnitude of the perturbation and the time required the cave atmosphere to return towards pre-visit conditions. Based on these results, to prevent cumulative impacts on critical environmental parameters and minimize the potential effects outlined, any public access to the cave should be carefully managed according to these guidelines:
(1) Visits should only occur on non-consecutive days, leaving intervening days without access to allow for environmental recovery within the cave.
(2) On days when visits take place, a maximum of three groups of up to five individuals (including the guide) may enter, and these visits should be scheduled in the morning, with the last group entering no later than 14:00 local time.
(3) A minimum interval of two hours must be maintained between the start of each tour, aiming to promote partial restoration of microclimatic parameters while mitigating cumulative effects before the cave is accessed again.
The management implications derived from these findings should also be treated with caution, since the experiment with controlled visits was conducted during a single seasonal window characterized by reduced ventilation and elevated background CO
2, whereas the annual baseline study showed that Santián Cave operates under contrasting seasonal ventilation modes. The proposed access thresholds should therefore be regarded as preliminary and season-dependent, rather than as definitive carrying-capacity values. This cautious interpretation is consistent with previous work, which emphasizes that visitation limits in decorated caves must be based on site-specific baseline monitoring and progressively refined through repeated evaluation [
26,
27].
An additional aspect of major relevance for preventive conservation is the duration of recovery after visitor-induced perturbation. In cave environments where relative humidity remains close to saturation throughout the year, the persistence of thermal anomalies and elevated CO
2 concentrations increases the time available for biogeochemical alteration processes associated with environmental destabilization. From this perspective, the conservation risk is not determined only by the magnitude of each perturbation, but also by its duration and by the cumulative prolongation of altered atmospheric conditions. Repeated visits may generate a warmer and CO
2-enriched air mass that tends to accumulate in upper cave sectors, where some decorated panels are located, thereby increasing the likelihood of interaction between anthropogenic CO
2 and infiltrating or condensed water films on rock surfaces. Such processes may enhance the dissolution capacity of surface moisture and favor mechanisms such as microcorrosion of the rock support and the metabolic activation of microbial communities [
17,
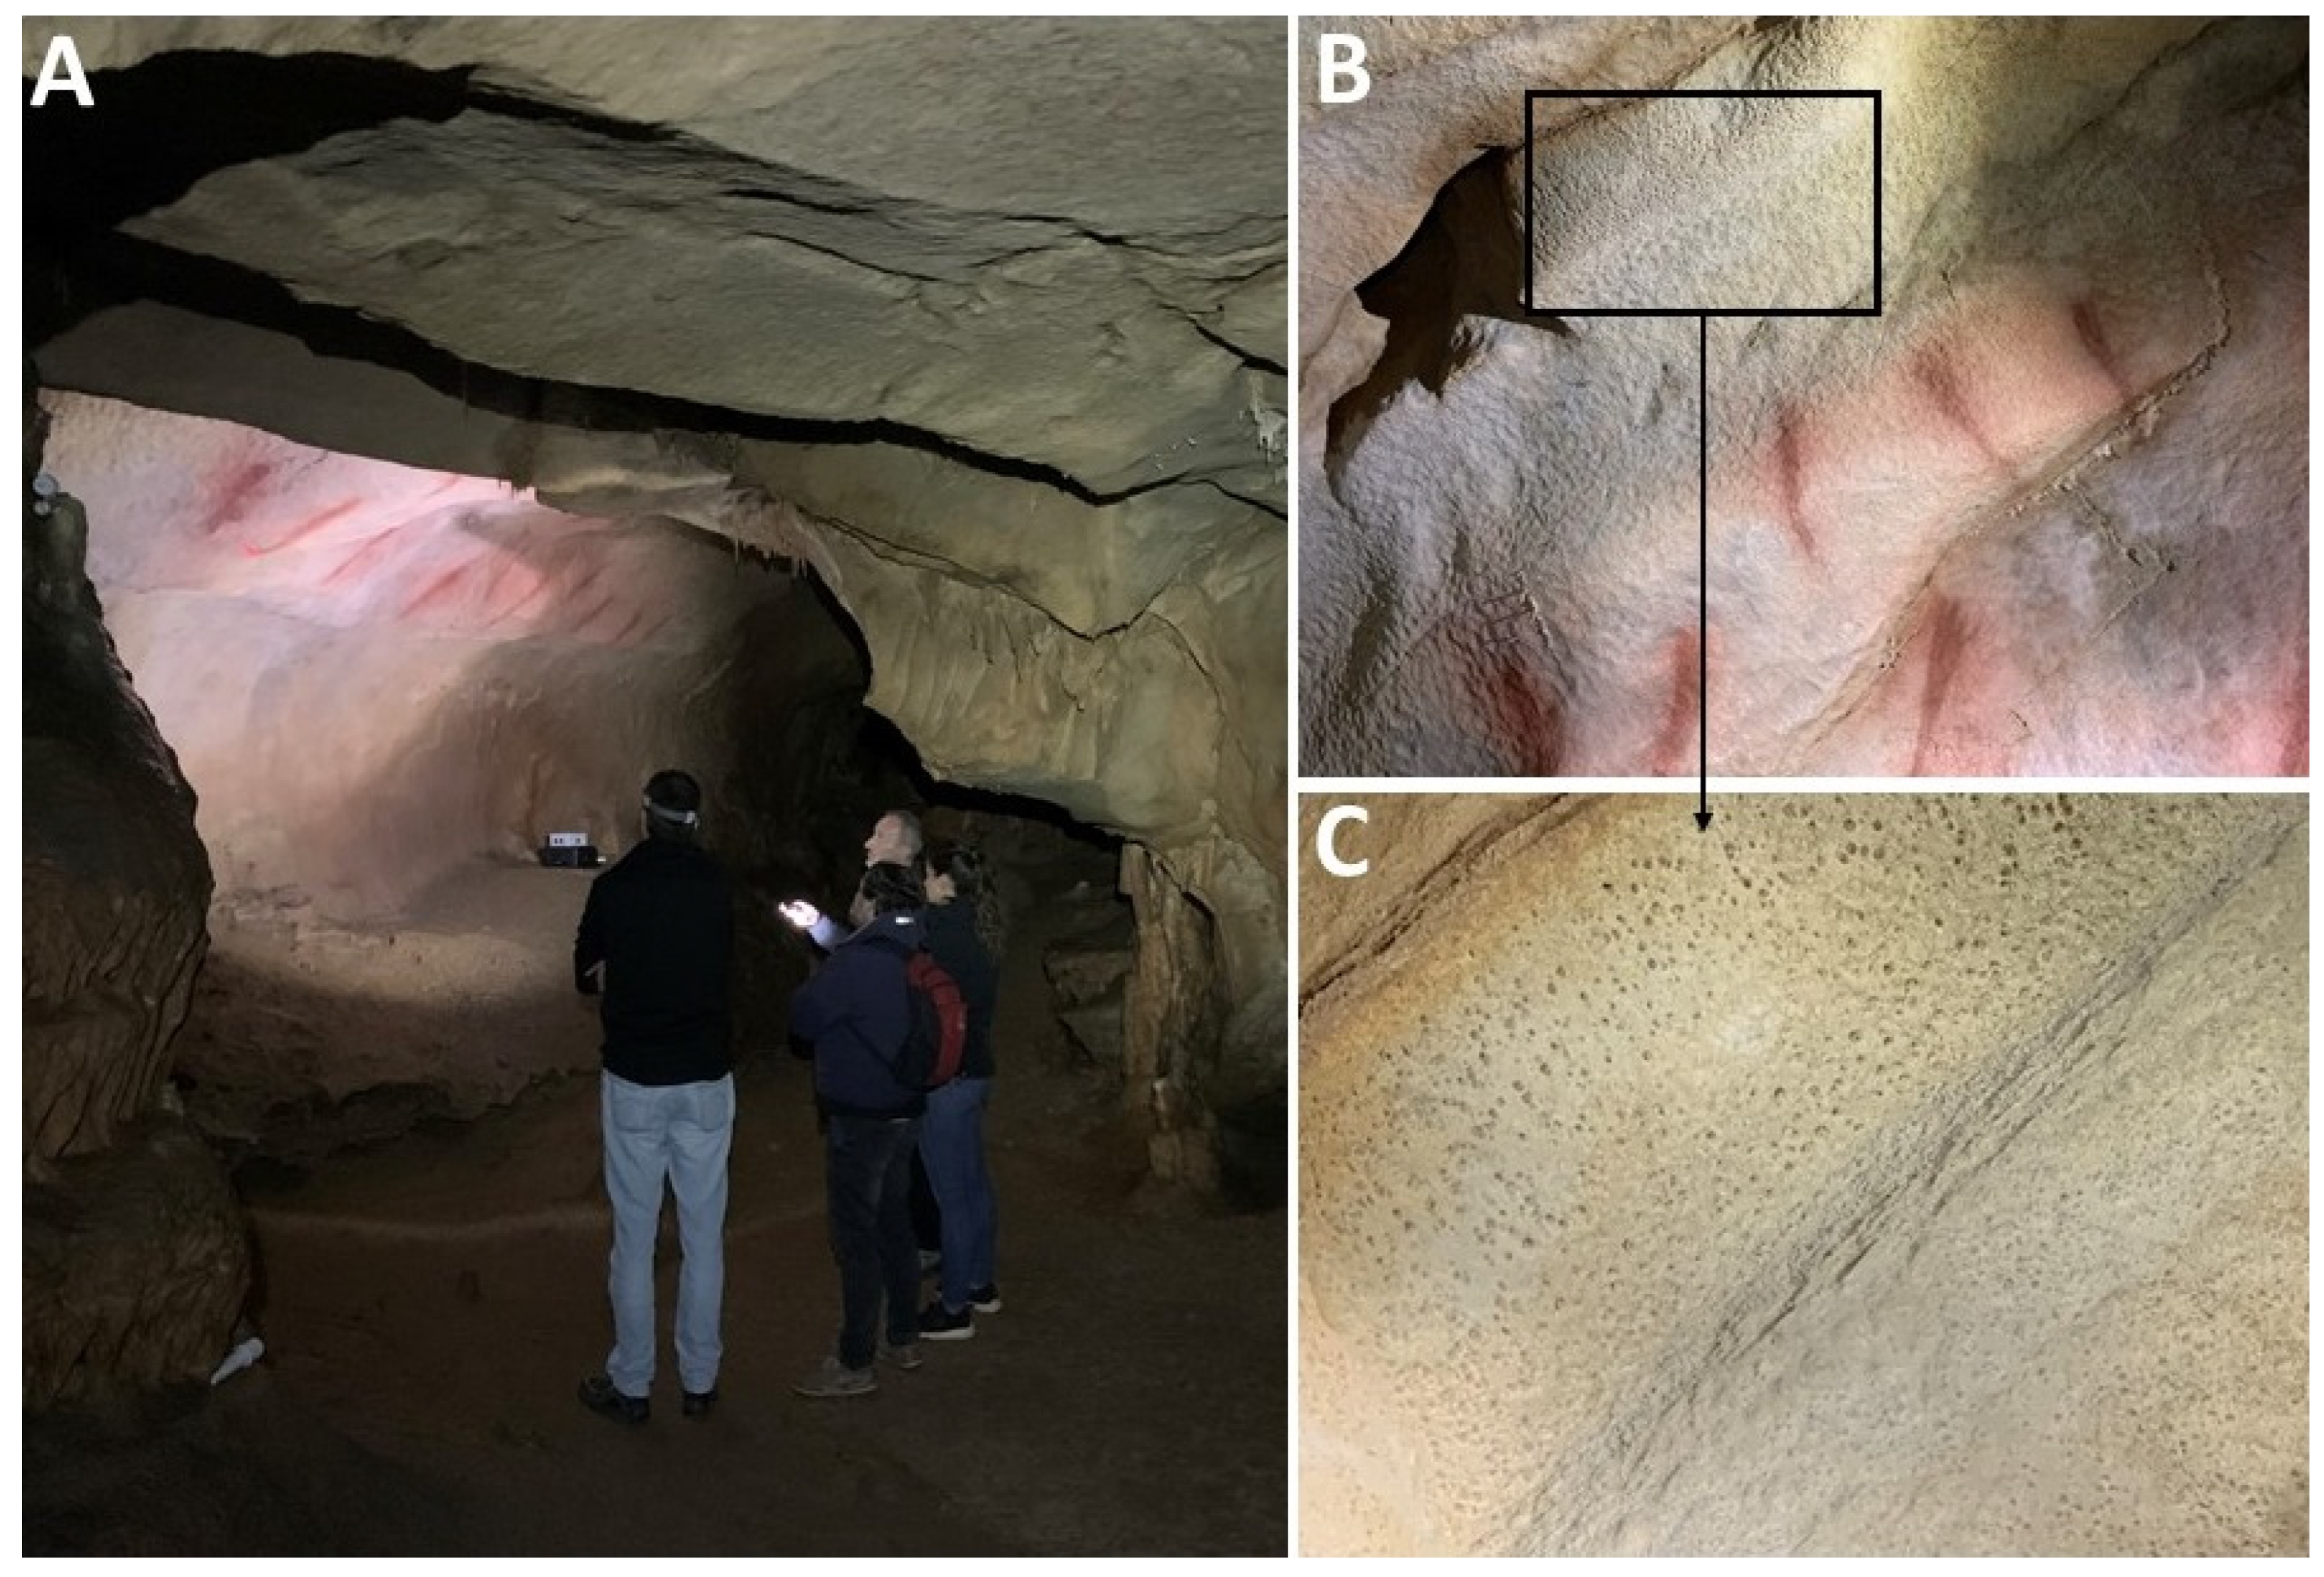
18] already present on the substrate or that are potentially able to colonize it (
Figure 7). In Santián Cave, these mechanisms should be regarded as plausible conservation risks rather than as processes directly demonstrated by the June 2023 campaign; however, their consideration reinforces the importance of recovery time as a critical management parameter in caves with rock art. Likewise, high-resolution atmospheric metrics—such as evaluations of carbon dioxide accumulation and thermal fluctuations—are utilized here as indirect risk indicators for preventive conservation, drawing on established findings within research on cave microclimate [
8,
17]. These metrics are considered inferential tools rather than definitive evidence of active surface weathering.
5. Conclusions
This study demonstrates that the microenvironmental response of Santián Cave to experimental visits is strongly heterogeneous and depends on both cave sector and visit sequence. Due to thermal inertia caused by changes in the outside environment, the entrance-related Sector I showed only minor thermal disturbances caused by visitors, whereas the inner decorated sector, especially Conjunto II, exhibited clearly detectable perturbations in temperature, CO2, and suspended particles. These responses exceeded the natural variability previously established for the inner sector and confirmed that the most environmentally stable areas are also the most sensitive to anthropogenic disturbance.
The results further show that the main conservation problem is not limited to the instantaneous effect of each visitor group but to the cumulative character of successive perturbations when recovery time is insufficient. This pattern was particularly evident for CO2, which displayed the clearest daily accumulation, incomplete overnight recovery, and delayed propagation into aerodynamically connected sectors. Under the tested conditions, CO2 and airborne particles were the most robust and sensitive operational indicators for short-term visitor management.
Suspended particles also responded sensitively to visit intensity, especially in the gallery of Conjunto II. Groups of five visitors separated by sufficient intervals generated comparatively limited particulate anomalies and allowed partial recovery before the next entry, whereas consecutive groups of 6–8 visitors produced much higher concentrations and markedly longer recovery times. Although the particulate record identifies a credible conservation risk, its interpretation remains provisional because no specific no-visit baseline was available for this variable in the most sensitive sector.
From a management perspective, the results indicate that visitation regimes based on small groups and adequate recovery intervals are more compatible with preventive conservation than consecutive entries involving more than five visitors. However, the carrying capacity thresholds derived from this study should be regarded as preliminary and season-dependent, because the experiment was conducted during a phase of reduced cave ventilation and elevated background CO
2. Further monitoring under other seasonal conditions is required before definitive access limits can be established, including a future multi-month, no-visit control window to fully map the natural particle dynamics in Conjunto II. The proposed guidelines are not intended as a fixed annual limit but rather as a cautious, worst-case scenario dynamic threshold designed specifically for the highly vulnerable summer stagnation period. Therefore, these guidelines regarding visitor frequency and visit durations within different cave sectors should undergo regular review if the cave is opened to the public. This will allow for adjustments to the daily visitor capacity as more data is collected on micro-climatic changes resulting from the predefined visiting schedules, which prioritize small, staggered groups over time. The adjustment of carrying capacity thresholds initially proposed must be based on the frequency distribution of the variations in each key microclimate parameter (particularly the CO
2 concentration of cave air), grouped according to the different increasing ranges of daily visits, such as they have been recently applied for other decorated caves opened to tourism [
26].




 ,
,