


Abstract
Rock fracture mechanics and the associated energy-release behavior play a key role in ensuring safe extraction in underground coal mining. Hydraulic fracturing generates prefabricated fracture networks in competent rock strata, thereby modifying fracture propagation patterns and reducing the failure resistance of the strata. In this study, standardized three-point bending tests were conducted to investigate the fracture behavior of pre-cracked sandstone specimens with different crack morphologies, quantities, and spacings. New crack initiation occurred mainly at the midspan in specimens containing horizontal prefabricated cracks, whereas inclined prefabricated cracks promoted crack initiation from the crack tips. Although horizontal crack length did not exhibit a clear monotonic effect on load-bearing capacity, the overall capacity decreased with increasing crack density or decreasing crack spacing. Vertical cracks further reduced load-bearing performance, particularly at relatively small crack spacings. The strain response exhibited a non-monotonic relationship with horizontal crack parameters, increasing first and then decreasing with increasing crack length and spacing, while showing a positive correlation with vertical crack spacing. Dissipated energy was negatively correlated with prefabricated crack angle, accounting for 92.65%, 89.10%, and 94.03% of the total input energy. With increasing crack length, the proportion of dissipated energy first increased and then decreased, with values of 92.65%, 90.77%, 92.52%, and 96.13%. Energy dissipation decreased with increasing horizontal crack spacing but increased with vertical crack spacing. Numerical simulations further showed that both horizontal and vertical fractures generated by ground fracturing promoted timely strata failure, while vertical fractures were more effective in facilitating overburden fracture propagation and reducing the bearing capacity of the rock strata and advance coal body by more than 13%. These findings provide a mechanistic basis for the control of thick and competent hard-roof strata.
1. Introduction
In underground coal mining, the high strength and large breaking step of hard roofs are key factors responsible for strong mine pressure and associated dynamic hazards [1]. In broader subsurface resource engineering, recent studies have increasingly emphasized quantitative analysis, optimization, and decision-support approaches for drilling, stimulation, and rock-mass response under complex geological conditions [2,3,4]. Researchers have systematically investigated the mechanisms of strong ground pressure and dynamic disasters induced by hard roofs from the perspectives of strength, energy, and stress [5,6,7,8,9].
To control roof-related hazards at the working face, various active pressure-relief techniques have been developed, including underground hydraulic fracturing [10], pressure relief by blasting [11], water-jet slotting [12], large-diameter pressure-relief boreholes [13], and coal-pillar softening by water injection [14]. Among these methods, ground fracturing weakens hard-roof strata on a regional scale by generating an artificial large-scale fracture network through surface fracturing wells [15], as shown in Figure 1. Compared with underground pre-fracturing, ground fracturing offers a wider control range, greater flexibility in target-layer selection, and no restriction imposed by seam height, and it has demonstrated favorable pressure-relief performance.
Figure 1.
Schematic illustration of ground fracturing technology.
After ground fracturing, a large-scale fracture network forms within the hard-roof strata, modifying the fracture structure of the rock mass and affecting stress redistribution in the overburden. To investigate the failure characteristics of fractured rock masses under such conditions, many researchers have conducted laboratory studies, among which three-point bending tests are widely used because they effectively characterize fracture toughness and fracture behavior. Previous studies, often combined with acoustic emission (AE) or digital image correlation (DIC) [16,17,18], have examined crack-mouth opening displacement, flexural strength, and fracture toughness [19,20,21,22,23] as well as crack propagation and damage evolution [24,25,26] in brittle and quasi-brittle materials. Related studies have also investigated damage and debonding behavior in structural materials under more complex loading states [27,28]. These studies provide an important methodological basis for investigating fractured rock masses under mining-related loading conditions. Nevertheless, most existing studies have focused on specific materials or individual crack parameters, and systematic analyses of how prefabricated crack morphology, quantity, and spacing jointly affect the fracture mechanical response of mining-related rock masses remain limited.
However, existing studies on hard-roof control by ground or hydraulic fracturing have mainly concentrated on engineering effectiveness and overburden structural responses [29,30,31,32], whereas systematic quantitative evidence on how fracture-network morphology, including orientation, quantity, and spacing, governs load-bearing degradation, strain localization, and energy dissipation remains insufficient [33,34,35,36]. In particular, although previous three-point bending studies have provided useful insights into crack propagation in brittle materials, the coupled influence of prefabricated crack geometry and spacing on the fracture mechanical response of mining-related rock masses has not been fully clarified. Moreover, although the effectiveness of ground fracturing has been demonstrated in engineering practice, the corresponding theoretical understanding of how large-scale fractures regulate rock-mass failure, energy dissipation, and stress transfer still lags behind practical applications.
From the perspective of fracture mechanics, crack orientation affects crack-tip stress concentration and the preferred propagation path, whereas crack spacing controls crack–crack interaction and the size of the intact ligament, thereby directly influencing failure strength, energy release, and weakening efficiency. This issue is particularly important for thick and competent roof strata, where large-scale fractures generated by ground fracturing can alter both energy accumulation and stress transfer during subsequent mining disturbance. Therefore, this study provides a systematic investigation of the fracture behavior of sandstone specimens containing prefabricated cracks under different crack configurations. The main contributions of this work are as follows: (1) identifying the distinct control mechanisms of crack geometry on fracture initiation and propagation; (2) quantifying the coupled evolution of load-bearing capacity, strain localization, and energy dissipation under multi-parameter crack networks; and (3) linking laboratory observations with mining-scale numerical simulations to interpret the weakening mechanism of ground fracturing for hard-roof control.
2. Experimental Design
Ground fracturing is an important hydraulic technique for hard-roof control in coal mines. Under in situ triaxial stress conditions, the resulting fracture network may contain horizontal, vertical, and inclined fractures. In the present laboratory design, horizontal prefabricated cracks were used to represent bedding-parallel or layer-parallel fracture morphologies that mainly reduce the effective thickness and breaking span of competent strata, whereas vertical prefabricated cracks were used to represent through-going or near-vertical fracture morphologies that tend to divide the intact rock mass into multiple structural blocks and promote fracture propagation. Accordingly, this study examines how fracture morphology and spacing influence the fracture behavior of rock specimens.
Three-point bending tests were conducted to evaluate resistance to crack initiation and propagation. Following the relevant testing standards, rectangular sandstone specimens (200 mm × 50 mm × 50 mm) containing prefabricated initial cracks were prepared. The single-variable test program included three levels of double horizontal-crack spacing (10, 20, and 30 mm), double vertical-crack spacing (10, 30, and 50 mm), triple horizontal-crack spacing (5, 10, and 15 mm), and triple vertical-crack spacing (10, 30, and 50 mm), as shown in Figure 2.
Figure 2.
Schematic diagram of different initial cracks of the specimen.
The sandstone used in the present study had a bulk density of 2.22 g/cm3, a porosity of about 16%, and a uniaxial compressive strength of 83 MPa. These properties provide a basic material reference for interpreting the fracture response observed in the three-point bending tests.
2.1. Test Equipment
Surface deformation data were obtained by non-contact optical measurement, which enabled real-time monitoring of the deformation process and crack development. Simultaneously, three-point bending tests were performed using an electronic universal testing machine, and the corresponding load and displacement data were recorded, as shown in Figure 3.
Figure 3.
Experimental setup for three-point bending and DIC monitoring.
The test system comprised three main components: a loading system, a digital image correlation (DIC) monitoring system, and a data analysis system. The tests were carried out using a DF13.305D/DF13.305T electronic universal testing machine. Loading was displacement-controlled at 0.01 mm/s, and the machine recorded data in real time at 9 Hz. A high-resolution digital camera was used in the DIC system to capture speckle images from the specimen surface throughout loading. The camera resolution was 4096 × 2168 pixels, and images were acquired at 300 fps. Two light sources were used to improve illumination and image quality, thereby enabling accurate three-dimensional surface-deformation measurements. The data collected by the loading and monitoring systems were subsequently processed to obtain the strain-field evolution during loading.
The XTDIC three-dimensional digital speckle strain measurement and analysis system employs industrial photogrammetry and digital image correlation (DIC) techniques. By analyzing a sequence of speckle images captured during deformation, the system rapidly determines the full-field three-dimensional coordinates, displacements, and strain data of the measured object. The system primarily consists of a measurement head, an acquisition control box, a mobile support frame, a computer, and stress–strain analysis software. Its operating principle combines DIC with binocular stereo-vision technology. First, a randomly distributed speckle pattern was applied to the specimen surface to serve as a deformation-information carrier. Two industrial cameras then captured real-time speckle images of the specimen at different deformation stages. Three-dimensional matching of surface deformation points was carried out using a graphical correlation algorithm, which enabled reconstruction of the three-dimensional spatial coordinates of the matched points. Based on these coordinates, the surface displacement and strain fields of the specimen were calculated.
2.2. Test Procedures
The three-point bending tests were conducted using a speckle-based strain-measurement system, a loading system, and a control system. These systems were time-synchronized throughout the tests to ensure that mechanical and optical data were recorded in a consistent temporal sequence. The main procedures were as follows:
(1) Specimen preparation: The specimen surface was cleaned to improve paint adhesion. A uniform white base coat was sprayed to increase image contrast. Speckles were then applied using a controlled dot-coating method to produce a high-quality random pattern for DIC analysis.
(2) Installation and calibration of the monitoring system: The cameras were leveled and rigidly fixed to reduce measurement uncertainty. All cables were connected to complete hardware–software integration and enable synchronized control. The focal plane was adjusted so that the specimen was centered within the field of view. Illumination was tuned to obtain sufficient speckle contrast for reliable DIC analysis. Finally, the image acquisition rate was set to 300 fps to capture the deformation response with adequate temporal resolution.
(3) Experimental setup and loading: The fixture was mounted on the testing machine and leveled to ensure proper alignment. The support span was set to 15 cm, and the specimen was placed horizontally on the supports. Using the control system, the loading head was positioned to lightly contact the top surface of the specimen. The displacement-controlled loading rate was set to 0.01 mm/s, and loading and image acquisition were started simultaneously to track the deformation and cracking process.
In the present study, each crack configuration was represented by one specimen in the current experimental matrix. Therefore, the reported load–displacement curves, strain-field evolution results, and energy values correspond to single-test results rather than averaged results, and should be interpreted as configuration-specific comparative observations rather than statistical averages. Representative specimen preparation and the test setup are shown in Figure 4.
Figure 4.
Specimen preparation and test setup. (a) Specimen with spot-coating; (b) test preparation.
3. Specimen Fracture Morphology and Strain Field Evolution
3.1. Specimen Fracture Morphology
The macroscopic deformation and fracture behavior of the sandstone specimens were mainly governed by two concurrent mechanisms: (1) structural failure developing along pre-existing weak cracks under applied loading, and (2) microcrack nucleation, propagation, and coalescence. In addition, the inherent anisotropy of the specimens, reflected by internal laminations and pre-existing fissures, influenced both the failure mode and the spatial evolution of damage.
Preliminary tests were first conducted on intact specimens without prefabricated cracks, and the corresponding fracture patterns are shown in Figure 5 (specimen 000). Under midpoint loading, stress concentration developed beneath the loading point, producing a typical bending response characterized by deflection and sagging. The mechanical response exhibited clear spatial variation: the maximum deflection and tensile demand occurred near the midspan, where final fracture was initiated, whereas the regions near the supports mainly controlled the boundary bending response. Under this stress state, cracking initiated in the middle region and then propagated transversely across the full specimen width.
Figure 5.
Fracture propagation paths of the first group of specimens.
The fracture behavior changed markedly with the inclination angle of the prefabricated cracks. As shown in Figure 5 (specimen 101), specimens containing horizontal prefabricated cracks exhibited new crack initiation at two locations: the upper cracks propagated from the midpoint of the prefabricated cracks, whereas the lower cracks initiated from the crack tips. This difference reflects the local stress-concentration pattern. The upper cracks were controlled mainly by stress concentration in the midspan tensile zone under central loading, whereas the lower cracks were driven by intensified stress at the prefabricated crack tips. For specimen 102, in which the prefabricated cracks were inclined at 45° to the vertical axis, stress concentration developed at both the upper and lower crack tips during loading. Consequently, vertical cracks propagated from both tips and ultimately produced the observed fracture pattern. For vertically oriented prefabricated cracks (specimen 103), crack alignment substantially reduced the tensile resistance of the specimen. Because the stress concentration direction at the crack tips was consistent with the loading direction, vertical crack initiation and propagation were facilitated and dominated the final failure mode.
Figure 6 shows the fracture propagation paths for the second set of specimens, in which horizontal prefabricated cracks with lengths of 35 mm, 45 mm, and 55 mm were introduced in specimens 201, 202, and 203, respectively. The results indicate that the propagation patterns of new cracks in the three specimens were generally similar, suggesting that the length of a single horizontal prefabricated crack does not markedly alter the overall fracture pattern. In all three specimens, the upper cracks mainly developed because of stress concentration at the loading point on the upper surface and the tendency of the specimen midsection to undergo tensile failure. Although the exact initiation positions varied slightly among specimens, crack propagation consistently started from the prefabricated horizontal crack surface and ultimately developed into a longitudinal fracture surface.
Figure 6.
Fracture propagation paths of the second group of specimens.
When the number of horizontal cracks increased, the corresponding crack propagation patterns are shown in Figure 7. The results indicate that increasing the number of prefabricated horizontal cracks does not fundamentally alter the overall fracture mode, and fracture development remains concentrated in the middle region of the specimen. The uppermost cracks, directly affected by the applied loading, mainly fractured in the central region. In contrast, the lowermost cracks propagated along the lowest prefabricated horizontal crack. Cracks located between adjacent prefabricated horizontal cracks tended to initiate near the midline of the prefabricated cracks and then develop into vertically penetrating fractures. This behavior is attributed to stress concentration in the region between adjacent prefabricated cracks, which modifies the overall internal stress distribution. As loading increased, localized stress concentration between neighboring cracks intensified and superposed in the midsection, making this region more susceptible to rupture. Although horizontal crack spacing affected the magnitude of stress concentration, it did not fundamentally change the fracture mechanism.
Figure 7.
Fracture propagation paths of specimens with horizontal prefabricated cracks.
Figure 8 shows that, once vertical prefabricated cracks were introduced, stress concentration readily developed at both tips of each crack. Under vertical loading, crack growth preferentially followed the prefabricated crack path, and the specimen ultimately fractured along this predetermined trajectory. As illustrated in Figure 8, the new crack in specimen 501 initiated from the right crack tip, whereas in the other specimens it initiated from the left tip. Because the two prefabricated cracks were arranged symmetrically, the stress concentration at the two tips was nearly identical. Nevertheless, the actual initiation side showed some variability during loading, which is likely related to inherent material heterogeneity.
Figure 8.
Fracture propagation paths of specimens with vertical prefabricated cracks.
For specimens containing three prefabricated vertical cracks, the crack propagation path varied with crack spacing. At smaller crack spacings, new cracks propagated vertically from both ends of the rightmost prefabricated crack. As the spacing increased, new cracks initiated vertically from the tip of the intermediate crack. In specimen 601, when the three prefabricated cracks were closely spaced, their stress-concentration zones interacted during loading, resulting in comparably high stress concentration at all crack tips. Under such conditions, secondary crack propagation could initiate from any prefabricated crack. With increasing spacing, the influence of the side cracks on the intermediate crack was reduced, causing the stress concentration at its tip to gradually exceed that at other locations. Consequently, the intermediate crack tip became the dominant initiation point for new crack propagation.
Based on the results from the six specimen groups, it can be concluded that once one or more prefabricated cracks were present, new cracks preferentially propagated from these discontinuities under increasing load. In specimens containing horizontal prefabricated cracks, crack initiation consistently occurred near the crack midpoint, where stress concentration was most pronounced. After the new crack penetrated the lowermost prefabricated crack, the subsequent propagation path exhibited positional variability, although initiation remained confined to the prefabricated crack region. When prefabricated cracks were inclined, new cracks preferentially initiated from the crack tips and propagated vertically because stress concentration peaked at these locations. For specimens containing one or more vertical prefabricated cracks, new cracks consistently initiated from the crack tips and propagated until complete specimen penetration occurred. In specimens with small prefabricated cracks, crack initiation could originate from either tip. However, in specimens with larger prefabricated cracks, propagation consistently initiated from the crack tip closest to the loading axis. When two cracks were equidistant from the loading axis, crack initiation preferentially occurred in the region with lower local resistance, indicating that crack-tip stress concentration and local material heterogeneity jointly controlled the initiation site.
3.2. Strain Field Evolution Analysis
The fracture process was continuously tracked using a digital image correlation (DIC) system. After post-processing, the surface strain fields were reconstructed and displayed as contour maps, allowing the evolution of strain localization to be followed throughout loading. For each specimen group, the strain field immediately before critical fracture was examined (Figure 9). In the early stage, the strain distribution remained relatively uniform in all specimens, whereas clear strain localization developed as loading progressed.
Figure 9.
Strain field of the first group of specimens.
At critical fracture in specimen 101, the localized zone was aligned with the crack propagation path, and the crack propagated vertically. The overall strain in the high-strain zone at the lower part of the specimen was 0.053%, and the maximum strain reached 0.180%. For specimen 102, strain localization concentrated around the crack-tip region and became pronounced before failure, with an overall high-strain value of 0.031% and a maximum of 0.092%. In specimen 103, localization mainly appeared in the vertical zone near the crack end; the overall high-strain value was 0.051%, and the maximum strain was 0.152%. Overall, prefabricated crack morphology strongly controls the development of strain localization: horizontal cracks have a relatively limited effect on strain concentration, whereas inclined and vertical cracks markedly accelerate fracture progression by intensifying stress concentration at crack tips.
Figure 10 compares the strain fields of specimens containing a single horizontal prefabricated crack with lengths of 35 mm, 45 mm, and 55 mm. In all cases, elevated strain developed in the vicinity of the prefabricated crack, whereas the crack-free regions remained comparatively uniform, indicating that deformation was concentrated around the cracked zone. Although the detailed strain patterns differed among specimens as crack length changed, the location of the high-strain zone was broadly consistent. For specimen 201, the overall strain in the high-strain region was 0.028%, with a maximum strain of 0.073%. Specimen 202 showed an overall strain of 0.097% and a maximum of 0.204%. For specimen 203, the overall strain was 0.034%, and the peak strain reached 0.087%. Overall, horizontal crack length had a limited effect on the position of strain localization, which remained concentrated in the middle-to-lower part of the specimen. Instead, the crack propagation path mainly affected the magnitude of strain, while the overall localization pattern remained similar.
Figure 10.
Strain field of the second group of specimens.
Figure 11 first shows the strain fields of specimens containing two horizontal prefabricated cracks with spacings of 10 mm, 20 mm, and 30 mm. In specimen 301, a distinct stress-concentration zone developed near the prefabricated cracks, where the strain values were relatively high and the strain distribution remained comparatively uniform. Specimen 302 also exhibited concentration around the prefabricated cracks; however, compared with specimen 301, the high-strain region was more extensive. In specimen 303, stress concentration near the prefabricated cracks was still evident, but the magnitude, shape, and spatial extent of the high-strain zone differed from those of specimens 301 and 302. The overall strain in the high-strain region was 0.030% for specimen 301, with a maximum of 0.070%; 0.057% for specimen 302, with a maximum of 0.316%; and 0.016% for specimen 303, with a maximum of 0.030%. Despite these differences, all three specimens exhibited clear stress concentration around the prefabricated cracks during loading. Changing the crack spacing altered the internal stress transmission path: closer spacing enhanced crack–crack interaction, whereas wider spacing led to a more dispersed stress distribution.
Figure 11.
Strain fields of specimens with horizontal prefabricated cracks.
Figure 11 also presents the strain fields of specimens containing three horizontal prefabricated cracks with spacings of 5 mm, 10 mm, and 15 mm. Under loading, all three specimens showed a similar spatial pattern: strain remained relatively low in the upper part of the specimen and became higher in the middle-to-lower region. This feature was more evident in specimens 402 and 403, where the lower region exhibited larger strain values and clearer stress concentration. These results indicate that crack spacing affects stress transmission and, consequently, the strain distribution within the specimen. When the spacing was smaller, interaction between adjacent cracks was stronger, promoting more localized stress concentration; accordingly, specimen 401 displayed the most pronounced localization. With larger spacings, crack–crack interaction weakened and the stress concentration became less distinct, as observed in specimen 403. Specimen 401 showed an overall strain of 0.053% in the high-strain zone and a maximum strain of 0.168%. The corresponding values for specimen 402 were 0.024% and 0.044%, and those for specimen 403 were 0.018% and 0.038%, respectively. Increasing the spacing between the three horizontal prefabricated cracks therefore led to a general reduction in the measured strain level of the specimen.
Figure 12 shows the strain fields of specimens containing two vertical prefabricated cracks with spacings of 10 mm, 30 mm, and 50 mm. Specimen 501 exhibited a pronounced strain-localization zone, whereas specimen 502 displayed a bimodal high-strain distribution. In specimen 503, the high-strain zones became more separated and formed a saddle-shaped distribution. This change is mainly related to the spacing between the vertical prefabricated cracks. In specimen 501, the cracks were closely spaced and interacted strongly, resulting in stress superposition and more pronounced localization. As the crack spacing increased, the mutual interference between cracks diminished, and stress concentration developed more independently around each crack under loading, resulting in a bimodal distribution pattern. The overall strain and maximum strain in the high-strain region were 0.059% and 0.085% for specimen 501, 0.068% and 0.207% for specimen 502, and 0.044% and 0.076% for specimen 503.
Figure 12.
Strain fields of specimens with vertical prefabricated cracks.
Figure 12 further presents the strain fields of specimens containing three vertical prefabricated cracks with spacings of 10 mm, 30 mm, and 50 mm. Similar to the specimens with two vertical cracks, different crack spacings produced different levels and locations of strain concentration. When the spacing was small, the mutual interaction and stress superposition among multiple cracks resulted in relatively concentrated strain distribution across the specimen. As the crack spacing increased, the strain became more likely to concentrate near each prefabricated crack. In specimen 601, the closely spaced cracks caused the high-strain zones near the three cracks to merge into an arched distribution. With increasing spacing, specimen 602 exhibited high-strain zones adjacent to each crack, forming a multi-arch pattern. In specimen 603, the larger spacing caused the high-strain zone to concentrate mainly around the middle prefabricated crack. The overall strain in the high-strain zone was 0.076%, with a peak strain of 0.108%, in specimen 601; 0.100%, with a peak of 0.193%, in specimen 602; and 0.110%, with a peak of 0.244%, in specimen 603. Overall, for specimens containing three vertical prefabricated cracks, the strain level increased with increasing crack spacing. Strain localization and fracture characteristics were therefore strongly governed by the spatial configuration of vertical cracks, and the strain-concentration zones consistently coincided with the prefabricated cracks. When the cracks were centrally positioned, strain concentration developed in the midsection. As crack spacing increased, the extent of the concentration zone changed accordingly. At the largest spacing considered (50 mm), strain concentration became confined primarily to the central crack.
In all tests, the specimens deformed progressively. Before macroscopic fracture, the strain maps showed clear partitioning: strain localization developed around the prefabricated cracks, whereas the remaining regions maintained relatively low strain. Both the intensity and the extent of the localized zone varied with crack configuration. As the angle between the prefabricated cracks and the horizontal direction increased, the average strain in the high-strain zone first decreased and then increased. For horizontal prefabricated cracks, the high-strain-zone strain increased and then decreased with increasing crack length and crack spacing. For vertical prefabricated cracks, the average strain decreased with larger crack spacing in Group 4 but increased with crack spacing in Group 5. These results confirm that crack orientation governs both the failure path and strain localization: specimens with horizontal cracks mainly fractured through the midspan, with localization concentrated in the middle-to-lower region, whereas specimens with vertical cracks fractured along the prefabricated cracks, with localization confined to their vicinity, thereby accelerating failure by reducing the apparent fracture resistance. These strain-localization patterns further suggest that prefabricated cracks act as preferred sites of local stress concentration and energy release, and that the final failure mode is governed by the combined effects of crack-tip driving force and intact-ligament integrity.
4. Mechanical Response of Fractured Specimens
4.1. Load–Displacement Characteristics
The load–displacement curves of each specimen group were obtained from the three-point bending tests and are summarized in Figure 13. Because each crack configuration was represented by one specimen in the current experimental matrix, the mechanical responses are interpreted comparatively rather than statistically. Accordingly, all curves and values discussed below correspond to individual tests rather than averaged responses. To facilitate cross-configuration evaluation, the peak load and energy-related parameters are discussed not only in terms of their absolute values, but also through normalized comparisons and percentage-change descriptions relative to the reference conditions. Moreover, the interpretation of the observed trends does not rely on a single scalar parameter alone; instead, it is jointly supported by the consistency among load–displacement responses, fracture morphology, DIC-based strain localization, and numerical simulation results.
Figure 13.
Load–displacement curves of specimens. (a) curves of the first group specimens; (b) curves of the second group specimens; (c) curves of the third group of specimens; (d) curves of the fourth group of specimens; (e) curves of the fifth group of specimens; (f) curves of the sixth group of specimens.
Figure 13a compares the intact specimen (without prefabricated cracks) with specimens containing prefabricated cracks at different inclination angles. The intact specimen exhibited the highest load-bearing capacity, with a peak load of 7.80 kN. The peak loads of specimens 101, 102, and 103 decreased successively to 5.72 kN, 4.49 kN, and 3.47 kN, respectively, indicating a clear reduction in load-bearing capacity as the crack inclination angle increased relative to the horizontal direction. This strength degradation can be interpreted through two coupled effects. First, as the crack orientation approached the direction of the principal tensile stress, tensile-dominated failure became easier to activate. Second, increasing the crack angle altered the crack-tip stress concentration pattern, leading to stronger local stress intensification. Together, these effects promoted faster crack growth and earlier loss of load-bearing capacity. A normalized comparison relative to the intact specimen further highlights the weakening effect of crack inclination. The peak loads of specimens 101, 102, and 103 correspond to approximately 73.3%, 57.6%, and 44.5% of that of the intact specimen, representing reductions of 26.7%, 42.4%, and 55.5%, respectively. This percentage-based comparison shows that the weakening effect becomes progressively stronger as the crack orientation approaches the vertical direction.
Figure 13b shows the responses of the second group containing a single horizontal prefabricated crack of different lengths. The measured peak loads of specimens 201, 202, and 203 were 6.44 kN, 6.73 kN, and 5.74 kN, respectively, whereas specimen 101 (25 mm) reached 5.72 kN. Overall, the load-bearing capacity first increased and then decreased with increasing crack length. When the crack length increased from 25 mm to 45 mm, stress redistribution temporarily improved the peak load. When the crack length further increased to 55 mm, layered deformation became more pronounced and structural integrity was reduced. Under this condition, crack-tip stress concentration became sufficiently strong to trigger unstable crack propagation, and the apparent fracture resistance of the specimen was more readily overcome. Once unstable growth initiated, the crack rapidly penetrated the specimen, and the load-bearing capacity dropped to its minimum level.
Figure 13c presents the load–displacement curves of specimens containing two horizontal prefabricated cracks. Compared with the single-crack cases, the dual-crack specimens showed a lower overall load-bearing capacity, indicating progressive strength degradation with increasing crack quantity. When the crack spacing increased from 10 mm to 30 mm, the peak load decreased from 5.69 kN to 5.14 kN and then to 4.73 kN. This trend reflects the structural partitioning effect of the two cracks, which effectively divide the specimen into three load-bearing segments. At smaller spacing, the upper and lower segments retain relatively higher integrity and thus support a higher overall capacity. With more even spacing, the three segments share the load less efficiently, and the overall structural performance becomes weaker.
Introducing three horizontal prefabricated cracks further partitioned the specimen into four segments and led to an additional loss of capacity, as shown in Figure 13d. Increasing the crack spacing from 5 mm to 15 mm reduced the peak load from 5.38 kN (specimen 401) to 4.91 kN (specimen 402) and 4.68 kN (specimen 403), although the peak loads remained within a similar range. This response indicates that multiple horizontal cracks reduce the load-bearing efficiency of each segment. Under loading, stress intensification accumulates at the crack tips, making these configurations more susceptible to premature failure.
When vertical prefabricated cracks were introduced, the load-bearing performance was markedly lower than that of specimens containing horizontal cracks. Figure 13e shows the load–displacement responses of specimens containing two vertical prefabricated cracks. As crack spacing increased, the maximum load increased from 3.36 kN (specimen 501) to 3.88 kN (specimen 502) and 4.12 kN (specimen 503). This trend is consistent with the stress state under three-point bending, in which the midspan region experiences the highest tensile stress and is therefore most susceptible to fracture. At a small spacing (10 mm), the two cracks interacted strongly, producing pronounced stress concentration between them. In addition, stress superposition under loading promoted localized damage, thereby reducing the peak load. When the spacing increased to 30–50 mm, crack–crack interaction weakened and the concentrated stress became more dispersed, allowing the specimen to sustain a higher load. From the perspective of crack propagation, closely spaced cracks accelerate failure because the high-stress zone between them promotes coalescence. At larger spacings, the influence of one crack on the other decreases and the cracks can propagate more independently. Moreover, the wider spacing effectively separates the specimen into three regions with higher structural integrity, which further contributes to the improved load-bearing capacity.
As shown in Figure 13f, introducing three vertical prefabricated cracks further reduced the load-bearing capacity. However, increasing the crack spacing from 10 mm to 30 mm led to a gradual increase in the maximum load, from 3.30 kN (specimen 601) to 3.49 kN (specimen 602) and 3.59 kN (specimen 603). This trend is consistent with the response of specimens containing two vertical prefabricated cracks. At a crack spacing of 10 mm, the proximity of the cracks resulted in concentrated and superimposed stress at the crack tips, promoting secondary crack propagation and leading to lower load-bearing capacity. As the crack spacing increased, the stress superposition between cracks diminished. The specimen was effectively divided into four relatively intact load-bearing segments, which contributed to a marginal improvement in load-bearing capacity. However, because a vertical prefabricated crack was located in the middle of the specimen, close to the loading point, stress concentration remained high in this region and the specimen remained highly susceptible to fracture. Consequently, the improvement in bearing capacity with increasing crack spacing was limited.
The analysis reveals shape-dependent influences of prefabricated cracks on load-bearing capacity. Horizontal crack length has a limited effect on specimen capacity, whereas increasing crack quantity progressively reduces load-bearing performance. Furthermore, increasing horizontal crack spacing corresponds to a decrease in load-bearing capacity. Prefabricated vertical cracks markedly reduce load-bearing capacity, and the reduction becomes more pronounced when a crack is located near the loading point. Increasing the spacing between vertical cracks provides only a slight recovery in peak load, implying that fracture placement can be optimized to balance weakening efficiency and controlled failure.
4.2. Energy Evolution Characteristics
During the tests, energy conversion proceeded in two stages: an elastic–plastic loading stage and a rapid failure stage. During loading, the external work input was stored mainly as strain energy associated with bending deformation, whereas thermal dissipation was negligible. Once the specimen reached its ultimate strength, the accumulated strain energy was released through three main pathways: (1) energy consumed by crack formation through the creation of new fracture surfaces; (2) kinetic energy transferred to ejected fragments; and (3) energy carried by stress waves propagating through the remaining intact regions, which drove continued deformation until final failure. The residual energy was dissipated during the subsequent deformation and breakage of the specimen [37].
Specifically, the total input energy is determined from the area under the load–deflection curve during loading, whereas the elastic strain energy during the bending phase is obtained analytically from the corresponding mechanical formulation.
(1) Calculation of elastic strain energy
For rectangular cross-section sandstone specimens subjected to three-point bending, the strain energy can be calculated using the following equation:
where F represents the applied load, L is the specimen span, E denotes the flexural modulus, and I is the moment of inertia. In the present three-point bending tests, the displacement of the loading indenter at maximum load is treated as the specimen deflection f. The corresponding load–deflection relationship is illustrated in Figure 14.
Figure 14.
Schematic illustration of the load–deflection relationship. (a) Schematic diagram of load-deflection; (b) Schematic diagram of input energy.
For rectangular specimens, where represents the slope of the load-deflection curve [38].
Based on mechanics of materials, the moment of inertia I is given by:
From the above equations, the strain energy U can be obtained analytically. The area under the load–deflection curve represents the total input energy. The dissipated energy is then calculated as the difference between the total input energy and the strain energy. In the present calculations, all quantities were used in a consistent unit system, so that the resulting energy values are expressed in joules (J). In particular, the unit of the load–deflection area is kN·mm, which is dimensionally equivalent to J (1 kN·mm = 1 J). The final results are summarized in Table 1.
Table 1.
Energy Evolution of Specimens.
(2) Energy Evolution Characteristics
Furthermore, this study analyzes the evolution characteristics of total input energy, strain energy, and dissipated energy in specimens with different prefabricated crack configurations. To facilitate comparison among different crack configurations, the energy parameters are interpreted not only in terms of their absolute values, but also in terms of their relative variation with respect to the intact specimen. Accordingly, normalized input energy and normalized dissipated energy are provided in Table 1 to support relative comparison of weakening intensity among different crack configurations.
Figure 15 summarizes the evolution characteristics of total input energy, strain energy, and dissipated energy for the six specimen groups. As the prefabricated crack approached vertical orientation, failure occurred under lower loads, leading to reduced total input energy. The reduction in strain energy can be attributed to the increase in crack angle, which weakens the overall stiffness of the specimen and modifies its effective load-bearing cross-section. As the crack orientation became closer to the vertical direction, more pronounced local deformation developed under lower loading levels, thereby shortening the elastic stage and limiting strain-energy storage before failure. Dissipated energy was mainly associated with the formation of new crack surfaces and the overcoming of frictional resistance. With increasing crack inclination, the crack propagation path became simpler and the newly formed fracture-surface-area decreased, thereby reducing energy dissipation. At the same time, the weakening of interfacial friction and related dissipation mechanisms further contributed to the reduction in dissipated energy. The dissipated energy accounted for 92.65%, 89.10%, and 94.03% of the total input energy for the three crack-angle configurations. This trend is also reflected by the normalized energy parameters in Table 1, where both normalized input energy and normalized dissipated energy decrease markedly with increasing crack inclination, indicating a progressive reduction in the specimen’s energy-storage and energy-dissipation capacity.
Figure 15.
Energy evolution characteristics of specimens. (a) Energy evolution of first group specimens; (b) Energy evolution of second group specimens; (c) Energy evolution of third group specimens; (d) Energy evolution of fourth group specimens; (e) Energy evolution of fifth group specimens; (f) Energy evolution of sixth group specimens.
As crack length increased, the total input energy and dissipated energy changed non-monotonically, showing a decrease–increase–decrease pattern, whereas strain energy followed a single-peaked trend. With a short crack length of 25 mm, the specimen retained relatively high structural integrity and therefore required a comparatively high energy input to trigger crack growth. Increasing the crack length to 35 mm reduced crack-propagation resistance, leading to lower input and dissipated energies. At 45 mm, the longer propagation path and the accompanying microcrack development increased the resistance that had to be overcome, and both input and dissipated energies increased accordingly. With further increases in crack length, the specimen approached overall failure, the load-bearing capacity dropped, and both energy absorption and dissipation decreased rapidly. The strain-energy response is consistent with this progression: specimens with crack lengths in the 25–35 mm range retained better load-bearing capacity and could still undergo elastic deformation, allowing strain energy to accumulate; once the crack length exceeded 35 mm, structural integrity degraded and elastic energy storage weakened, causing a reduction in strain energy. The dissipated energy accounted for 92.65%, 90.77%, 92.52%, and 96.13% of the total input energy for the corresponding crack lengths.
For specimens containing two horizontal prefabricated cracks, increasing crack spacing led to simultaneous reductions in total input energy, strain energy, and dissipated energy. A larger spacing reduced the overall structural stability of the specimen, so that, under the same loading condition, failure occurred with less external work input. The lower deformation resistance also limited strain-energy storage. Because dissipation mainly occurs during damage development, specimens with larger crack spacing reached failure with lower energy expenditure, resulting in reduced dissipated energy. The dissipated energy proportions were 81.01%, 90.94%, and 93.19% of the total input energy, respectively.
For specimens containing three horizontal prefabricated cracks, increasing the spacing also led to reductions in total input energy, strain energy, and dissipated energy. As the crack spacing increased, the load-bearing path of the specimen became more discontinuous, and structural instability developed earlier during loading. The dissipated energy accounted for 92.26%, 92.32%, and 91.85% of the total input energy for the three spacing configurations, respectively.
For specimens containing two prefabricated vertical cracks, increasing the crack spacing increased the total input energy, strain energy, and dissipated energy. This trend is consistent with the higher load-bearing capacity at larger spacings: more external work was required to drive the specimen to failure, and more strain energy could be accumulated before fracture. The dissipated energy proportions were 88.57%, 88.84%, and 90.10% of the total input energy, respectively.
For specimens containing three prefabricated vertical cracks, increasing the crack spacing produced only a slight increase in total input energy, strain energy, and dissipated energy, and the variations were not pronounced. The near-constancy of these energy measures is associated with the crack arrangement: the centrally located prefabricated vertical crack, which is closest to the loading point, dominates the failure process and largely controls the overall energy response. The dissipated energy accounted for 89.88%, 89.17%, and 89.06% of the total input energy for the three specimen groups, respectively.
Overall, increasing crack inclination leads to a marked reduction in total input energy, strain energy, and dissipated energy by altering the effective load-bearing cross-section and local deformation behavior. Increasing crack length produces non-monotonic energy evolution. Increasing horizontal crack spacing degrades structural stability and monotonically decreases all three energy components. By contrast, increasing vertical crack spacing reduces crack interaction, preserves a wider intact ligament, and improves the specimen’s energy-storage capacity before failure.
4.3. Mechanistic Discussion of Fracture Evolution and Energy Response
The experimental results show that the fracture response of the specimens is jointly controlled by crack geometry, local stress concentration, and the integrity of the remaining load-bearing ligament. Under three-point bending, tensile stress is concentrated near the midspan. When horizontal prefabricated cracks are present, the remaining ligament still retains a relatively symmetric load-bearing path, and crack initiation is therefore governed mainly by the tensile zone around the midspan. By contrast, for inclined and vertical cracks, local stress concentration near the crack tips becomes more dominant, causing crack initiation to shift toward the crack tips and altering the subsequent propagation path. From a fracture-mechanics perspective, this shift reflects the competition between bending-induced tensile stress at the specimen midspan and local crack-tip stress concentration around prefabricated discontinuities.
Crack number and crack spacing further regulate the interaction among neighboring cracks. When multiple cracks are closely spaced, their local stress fields tend to overlap, which promotes interaction, earlier coalescence, and faster loss of load-bearing capacity. In horizontal-crack configurations, increasing crack number or reducing the effective spacing segments the specimen into smaller load-bearing units and weakens the integrity of the remaining ligament. In vertical-crack configurations, closely spaced cracks generate stronger local stress concentration near the loading region, which accelerates local damage and limits strain-energy storage. By contrast, larger crack spacing weakens crack interaction, preserves a larger intact ligament, and allows the specimen to sustain a higher load before unstable propagation occurs.
This difference in energy evolution can also be understood from the perspective of structural integrity. In horizontal-crack configurations, increasing crack spacing enlarges the segmented span of the remaining load-bearing units and weakens the continuity of the specimen under midspan bending, so unstable failure occurs earlier and the external work input decreases accordingly. In vertical-crack configurations, however, increasing crack spacing reduces crack interaction and preserves a wider intact ligament, thereby improving the integrity of the remaining load-bearing structure. As a result, the specimen can sustain a higher load and accumulate more strain energy before unstable fracture occurs.
The energy results are consistent with these fracture and strain observations. Lower load-bearing capacity is accompanied by lower input energy and lower strain-energy storage, whereas the dissipated energy reflects the combined effects of new fracture-surface formation and frictional resistance during crack propagation. Accordingly, unstable propagation occurs once the local driving force exceeds the resistance provided by the remaining ligament, and the stored elastic energy is released mainly through fracture-surface formation, crack coalescence, and frictional dissipation during failure. Therefore, the weakening effect of prefabricated cracks depends not only on crack orientation or crack number, but also on how crack geometry modifies local interaction, ligament integrity, and the release of stored energy during failure. Taken together, the fracture morphology, strain localization, load–displacement response, and energy evolution indicate that crack interaction is a key mechanism controlling the weakening efficiency of prefabricated cracks in hard-roof strata.
5. Rock Fracture and Stress Evolution Affected by Ground Fracturing
5.1. Numerical Model
Based on the laboratory investigations presented in Section 2, Section 3 and Section 4, the fracture characteristics and energy-dissipation behavior of sandstone specimens containing prefabricated cracks were clarified at the specimen scale. On this basis, mining-scale numerical simulations were carried out to investigate the fracture characteristics of overlying strata and the evolution of advance abutment pressure under different prefabricated fracture configurations. PFC was employed for this purpose [39].
Figure 16 shows a reference specimen-scale PFC model and a qualitative comparison between the experimentally observed and numerically simulated crack-propagation paths. The numerical parameters were determined with reference to the laboratory observations presented in Section 2, Section 3 and Section 4, the engineering geological conditions of the study area, and the coal–rock mechanical data obtained from the 8218 working face of Tashan Coal Mine. Because the laboratory-derived properties are macroscopic material properties whereas the PFC input parameters are microscopic contact parameters, the relationship between them is not a direct one-to-one assignment. Instead, the laboratory observations and site-specific mechanical data were used to constrain the feasible parameter ranges during iterative calibration. A specimen-scale three-point bending PFC reference model consistent with the laboratory configuration was first established to support parameter calibration and result interpretation. In addition to the representative specimen-scale comparison shown in Figure 16, specimen-scale PFC simulations were also carried out for the other crack configurations considered in the comparative analysis under the same calibrated microparameter framework. Parameter selection was primarily constrained by the crack-initiation location, the dominant crack-propagation path, and the relative weakening tendency under different prefabricated crack configurations. The validation of the specimen-scale simulations was based on the consistency between the simulated and experimental crack-initiation positions, crack-propagation paths, and comparative weakening trends. As shown in Figure 16, the simulated crack-propagation pattern is qualitatively consistent with the laboratory-observed fracture path. On this basis, the mining-scale simulations are discussed together with the experimental results to analyze fracture development and abutment-stress evolution under different prefabricated fracture configurations.
Figure 16.
Specimen-scale PFC reference model and qualitative comparison of experimental and simulated crack propagation paths. (a) Specimen-scale PFC reference model; (b) qualitative comparison of experimental and simulated crack propagation paths.
The numerical model has dimensions of 400 m × 130 m, with protective coal pillars of approximately 100 m reserved on both sides. The initial in situ stress field was established by servo-controlled boundary loading, in which the lateral walls were used to apply the horizontal stress and the upper and lower walls were used to apply the vertical stress. After the target stress state was reached, the wall velocities and displacements were reset, and the model was further equilibrated before excavation. During excavation, the model boundaries remained constrained, and the bottom boundary was kept fixed to prevent rigid-body displacement. The coal seam was excavated in steps of 40 m and divided into five mining sections, giving a cumulative excavation length of 200 m. Horizontal and vertical prefabricated fractures were introduced into the fracturing target layer (FTL). The vertical fracture planes were 13 m high and arranged along the working face at intervals of 30 m, whereas the horizontal fracture plane was positioned at the center of the FTL. The unfractured case was designated as Model i, the vertically fractured case as Model ii, and the horizontally fractured case as Model iii. The geometric configuration of the mining-scale PFC model, including the coal seam, the fracturing target layer (FTL), and the vertical and horizontal prefabricated fracture layouts, is shown in Figure 17. The lithology-dependent mechanical and contact parameters assigned to the coal seam and the surrounding strata in the numerical simulations are listed in Table 2.
Figure 17.
Mining-scale numerical model and prefabricated fracture layouts in the fracturing target layer (FTL). (a) Model with vertical fracture; (b) model with horizontal fracture.
Table 2.
Model parameters.
5.2. Fracture Characteristics of Overlying Strata
Figure 18 illustrates the development of the overlying fracture network under different prefabricated fracture layouts. In the unfractured model (Figure 18a), fractures gradually develop upward with working-face advance. When the face advances to 120 m, the fracture height reaches approximately 57 m; when it advances to 200 m, the fractures extend vertically through the FTL, indicating the first large-scale breakage of the hard strata.
Figure 18.
Development characteristics of the overlying fracture network. (a) Fracture network in unfractured model i; (b) fracture network with prefabricated vertical fracture in model ii; (c) fracture network with prefabricated horizontal fracture in model iii.
In the model with prefabricated vertical fractures (Figure 18b), the fracture pattern is initially similar to that of the unfractured case. However, as mining advances to 160 m, numerous new fractures develop within the FTL and connect with the goaf fracture zone. The overall fracture field becomes more concentrated and exhibits a trapezoidal expansion pattern, indicating that the prefabricated vertical fractures promote earlier breakage of the FTL and modify the upward propagation of overburden fractures. As the working face continues to advance, the fracture development becomes more localized and the periodic fracture characteristics of the overlying strata become more pronounced.
In the model with a prefabricated horizontal fracture (Figure 18c), fractures develop toward the FTL and initiate in its lower part when the face advances to 160 m. The horizontal fracture introduces a distinct stratification effect, causing the upper and lower hard strata to fracture in a relatively independent manner.
The numerical results indicate that, in Model i, the hard stratum retains strong load-bearing integrity, which markedly limits the upward propagation of fractures. Fracture development is dominated by the horizontal direction, whereas vertical propagation remains relatively slow. After the hard roof collapses, the fracture-affected zone expands noticeably. In Model ii, prefabricated vertical fractures divide the hard stratum into block-like structural units. As mining advances, these blocks progressively deform and collapse, the overlying fractures develop more extensively, and the load-bearing capacity of the FTL is markedly reduced. In Model iii, the prefabricated horizontal fracture introduces a layering effect into the hard stratum. Compared with prefabricated vertical fractures, the horizontally fractured stratum better preserves a layered load-bearing structure and therefore retains a certain degree of stability.
5.3. Stress Evolution
Stress monitoring points were arranged in both the FTL and the coal seam. In the FTL, monitoring points were arranged from the position corresponding to the open-off cut of the working face, with a spacing of 8 m over a total length of 200 m. In the coal seam, monitoring points were arranged along the entire excavation length with a spacing of 2 m. Based on these monitoring layouts, the distribution characteristics of abutment stress in the FTL and in the advance coal body within the 160 m excavation range of the working face were obtained, as shown in Figure 19 and Figure 20.
Figure 19.
Abutment-stress evolution in the FTL during excavation. (a) The first section of excavation; (b) the second section of excavation; (c) the third section of excavation; (d) the fourth section of excavation.
Figure 20.
Abutment-stress distribution in the advance coal body during excavation. (a) the first section of excavation; (b) the second section of excavation; (c) the third section of excavation; (d) the fourth section of excavation. (e) the fifth section of excavation.
Figure 19 shows that the abutment stress in the FTL differs markedly before and after fracturing. During excavation segments 1–3, the FTL has not yet undergone obvious large-scale breakage, and the overall abutment-stress distribution remains broadly similar among the three models. However, the peak stress in the unfractured strata is consistently higher than that in the fractured models, indicating that prefabricated fractures reduce the load-bearing capacity of the hard strata and weaken stress concentration ahead of the working face.
In excavation segment 1, when the working face advances to 40 m, the peak stress in the FTL is 13.8 MPa in Model i, 13.3 MPa in Model ii, and 12.8 MPa in Model iii, all at a horizontal distance of approximately 70 m from the working face. In excavation segment 2, when the working face advances to 80 m, the peak stress in the FTL of Model i is approximately 13.6 MPa at a horizontal distance of about 100 m from the working face. The corresponding peak stress in the horizontally fractured model is approximately 12.7 MPa, also at a distance of about 100 m, whereas that in Model ii is approximately 12.4 MPa at a distance of about 92 m. In excavation segment 3, when the working face advances to 120 m, the FTL in Model ii begins to break, and its stress peak decreases to approximately 13.1 MPa. At this stage, the abutment stress in the FTL is 14.7 MPa in Model i and 14.0 MPa in Model iii. In excavation segment 4, when the working face advances to 160 m, the FTL in Model i remains unbroken, resulting in high bearing stress, with the peak abutment stress reaching 17.1 MPa at a horizontal distance of 172 m from the working face. By contrast, in Models ii and iii, the FTL breaks and the corresponding bearing stresses decrease to 13.9 MPa and 14.7 MPa, respectively. These results indicate that ground fracturing significantly reduces the bearing performance of hard strata and alters both the breaking step and the magnitude of the bearing stress.
Figure 20 shows the distribution of abutment stress in the advance coal body during excavation. During mining segments 1–3, the overlying FTL has not yet undergone obvious large-scale breakage, and the abutment-stress distribution is broadly similar among the three models. However, from segment 1 to segment 3, the stress peak in the advance coal body of Model i increases gradually compared with those in Models ii and iii. When mining reaches segment 4, the FTLs in Models ii and iii have already broken, whereas the FTL in Model i remains intact. At this stage, the abutment-stress peak in the advance coal body of Model i reaches 19.7 MPa at a distance of 18.3 m from the coal wall, whereas the corresponding peaks in Models ii and iii are approximately 17.1 MPa and 17.3 MPa, located 36.4 m and 32.7 m ahead of the working face, respectively. This indicates that fracturing reduces the abutment stress in the advance coal body by more than 13% and shifts the stress peak farther away from the working face.
When mining reaches segment 5, the FTL in Model i also breaks. At this stage, because the large overhanging span of the hard strata is reduced, the abutment stress in the advance coal body decreases from 19.7 MPa to 15.3 MPa, corresponding to a reduction of 22.3%, and the distance from the stress peak to the coal wall decreases to 10.9 m. In Models ii and iii, the FTL collapses progressively with mining, and the stress distribution in the advance coal body remains similar, with peak values of approximately 13.0 MPa. Overall, prefabricated fractures in the FTL weaken the bearing capacity of the hard strata, promote earlier roof breakage, and reduce the stress concentration transferred to the coal body ahead of the working face.
5.4. Engineering Implications for Ground Fracturing Design
The present results provide a mechanistic basis for optimizing ground fracturing design in hard-roof strata. Crack orientation governs the weakening mode of the target strata. Horizontal fractures mainly reduce the effective thickness and breaking span of competent rock layers, whereas vertical fractures divide the intact strata into multiple rock blocks and more effectively promote overburden fracture propagation. Crack spacing governs crack interaction and the size of the intact rock bridge, thereby affecting the degree of load-bearing degradation and weakening efficiency. Within the scope of the present study, a denser fracture network generally corresponds to stronger weakening; however, the final fracture spacing in field applications should be optimized together with in situ stress conditions, target-layer occurrence, and construction feasibility.
From the perspective of strong mine pressure control, the key role of ground fracturing is to weaken the integrity and bearing capacity of the hard roof in advance, so that the overlying strata can break in a more timely and controlled manner during mining, thereby reducing stress concentration and dynamic loading ahead of the working face. The present numerical results show that both horizontal and vertical fractures are beneficial for timely strata rupture, while vertical fractures exhibit a slightly better pressure-relief effect and reduce the bearing capacity of the rock strata and the advance coal body by more than 13%.
In practical engineering, fracture-network design should be optimized according to geological structure, in situ stress regime, and the target pressure-relief objective. When the engineering objective is to divide the hard roof into multiple structural blocks and promote more extensive overburden fracture propagation, vertical-fracture-dominated layouts may be more advantageous. By contrast, when the objective is to reduce the effective thickness and breaking span of a single competent stratum, horizontal-fracture-dominated layouts may be more suitable. Nevertheless, due to the scale difference between laboratory specimens and field rock masses, the present study mainly provides mechanism-based and trend-based guidance for field applications, whereas the final engineering parameters still need to be optimized through site-specific geological analysis and field verification.
The present results are broadly consistent with previous studies on hard-roof control by ground or hydraulic fracturing, which have shown that large-scale fracturing can weaken competent roof strata, shorten the breaking span, and promote timely overburden failure during mining. However, earlier studies have focused mainly on engineering effectiveness and overburden structural responses, whereas the present work further provides mechanism-based evidence, from both specimen-scale tests and mining-scale simulations, on how fracture-network orientation and spacing govern crack propagation, load-bearing degradation, strain localization, energy dissipation, and stress transfer.
6. Conclusions
(1) The morphology of prefabricated cracks directly controlled the fracture characteristics of the specimens. In specimens containing horizontal prefabricated cracks, fracture initiation consistently occurred near the midpoint of the prefabricated cracks. When inclined prefabricated cracks were introduced, new fractures tended to initiate at the crack tips and propagate predominantly in the vertical direction. For specimens containing vertical prefabricated cracks, fracture initiation consistently occurred at the crack tips, followed by through-specimen propagation. These results confirm that crack geometry governs both the location of fracture initiation and the preferred propagation path.
(2) Prior to fracture, the strain fields exhibited clear zoning characteristics: high-strain zones were localized near the prefabricated cracks, whereas other regions maintained relatively low strain levels. The overall strain level within the high-strain zone first decreased and then increased as the angle between the prefabricated cracks and the horizontal direction increased. For specimens containing horizontal prefabricated cracks, the overall high-strain level first increased and then decreased with increasing crack length and crack spacing, whereas it increased with larger vertical crack spacing.
(3) The energy analysis indicates that dissipated energy accounted for more than 80% of the total input energy. The dissipated energy exhibited a negative correlation with the inclination angle of the prefabricated cracks, accounting for 92.65%, 89.10%, and 94.03% of the input energy, respectively. With increasing prefabricated crack length, the dissipated-energy proportion first increased and then decreased, reaching 92.65%, 90.77%, 92.52%, and 96.13% of the input energy. Dissipated energy showed a negative correlation with horizontal crack spacing but a positive correlation with vertical crack spacing.
(4) Both vertical and horizontal fractures generated by ground fracturing promote timely rupture of hard strata. Vertical fractures divide the intact strata into multiple rock segments and transform the failure mode of the hard roof into the rotational displacement of multiple rock blocks, whereas horizontal fractures divide the intact strata into two layers and reduce the breaking step by decreasing the effective thickness of the strata. Vertical fractures are more favorable for promoting overburden fracture development and are slightly more effective in reducing the bearing capacity of the rock strata and the abutment stress of the advance coal body, with a reduction exceeding 13%. These findings provide mechanism-based support for the prevention and control of strong mine pressure in thick and competent roof strata. They also provide mechanism-based guidance for optimizing crack orientation and fracture-network density in ground fracturing operations for hard-roof strata, and are therefore of practical significance for strong mine pressure control in field applications.
Author Contributions
Conceptualization, R.G. and X.H.; methodology, R.G., W.G., and C.Z.; software, C.Z. and X.H.; validation, R.G., X.H., and W.G.; formal analysis, C.Z. and W.G.; investigation, R.G. and X.H.; resources, R.G. and G.F.; data curation, C.Z. and X.H.; writing—original draft preparation, X.H., C.Z., and W.G.; writing—review and editing, R.G. and C.Z.; visualization, C.Z., X.Z., and H.G.; supervision, R.G. and G.F.; project administration, R.G.; funding acquisition, R.G. All authors have read and agreed to the published version of the manuscript.
Funding
This research was funded by the National Natural Science Foundation of China, grant number 52274135; Shanxi Provincial Science and Technology Department, grant number 202203021224006; Shanxi Provincial Key Research and Development Project, grant number 202202090301011; and China Association for Science and Technology, grant number YESS20220245.
Data Availability Statement
The original contributions presented in this study are included in the article. Further inquiries can be directed to the corresponding author.
Conflicts of Interest
The authors declare no conflicts of interest.
References
- Kang, H.; Wang, B.; Gao, F.; Zhang, Y.; Fan, Z.; Li, S.; Xu, X.; Chen, P. Current status and prospects of coal mining science and technology in China. GeoEnergy Commun. 2025, 1, 3. [Google Scholar] [CrossRef] [Scilit]
- Yang, Y.; Huang, F.; Kang, S. Mechanism of Penetration Rate Improvement in Hot Dry Rock Under the Coupling of Impact Load and Confining Pressure Release. Reserv. Sci. 2026, 2, 52–64. [Google Scholar] [CrossRef] [Scilit]
- Hu, Y.; Yang, Y. A Comparative Study on Drag Reduction Methods for Continental Shale Drilling in the Fuxing Block, Southeastern Sichuan Basin. Reserv. Sci. 2026, 2, 81–96. [Google Scholar] [CrossRef] [Scilit]
- Ali, J.; Ansari, U.; Ali, F.; Javed, T.; Hullio, I.A. Application of Machine Learning for Effective Screening of Enhanced Oil Recovery Methods. Reserv. Sci. 2026, 2, 65–80. [Google Scholar] [CrossRef] [Scilit]
- Deng, G.; Xie, H.; Gao, M.; Xie, J.; Li, C.; He, Z. Fracture mechanisms of competent overburden under high stress conditions: A case study. Rock Mech. Rock Eng. 2022, 56, 1759–1777. [Google Scholar] [CrossRef] [Scilit]
- Jun, X.; Yunpei, L.; Quanle, Z.; Lei, L.; Xuelong, L. Elimination of coal and gas outburst risk of low-permeability coal seam using high-pressure water jet slotting technology: A case study in Shihuatian Coal Mine in Guizhou Province, China. Energy Sci. Eng. 2019, 7, 1394–1404. [Google Scholar] [CrossRef] [Scilit]
- Li, J.; Gao, F.; Lou, J.; Huang, Z.; Zhang, Z.; Yang, J.; Xi, C.; Le, F. Failure evolution mechanisms and coupled static-dynamic loading of multiple thick hard strata in 10 m ultra-large mining height. Eng. Fail. Anal. 2026, 188, 110626. [Google Scholar] [CrossRef] [Scilit]
- Dai, L.P.; Zhao, X.; Pan, Y.S.; Wang, A.W.; Gao, Y.N.; Zhu, C.Q.; Ren, H. Revisiting the strainburst intensity of roadways in coal mines: Theory and case study. J. Rock Mech. Geotech. Eng. 2026. [Google Scholar] [CrossRef] [Scilit]
- Dai, L.P.; Zhao, X.; Ju, M.H.; Pan, Y.S.; Wang, A.W.; Xu, L.M.; Tian, Z.T. Determination of critical stress for rockburst warning: A model incorporating borehole-sensor interaction and its validation. Int. J. Rock Mech. Min. Sci. 2026, 201, 106464. [Google Scholar] [CrossRef] [Scilit]
- Wei, C.; Zhang, B.; Li, S.; Fan, Z.; Li, C. Interaction between hydraulic fracture and pre-existing fracture under pulse hydraulic fracturing. SPE Prod. Oper. 2021, 36, 553–571. [Google Scholar] [CrossRef] [Scilit]
- Xu, X.; He, M.; Gao, Y. Study on mining pressure law and pressure relief control under influence of key layer. Mining, Met. Explor. 2021, 38, 1985–1996. [Google Scholar] [CrossRef] [Scilit]
- Lu, J.; Xiao, J.; Zhou, H.; Zhang, C.; Ma, X.; Hou, C.; Cui, J. A prediction model of effective high-pressure water jet auxiliary groove spacing for hard-rock pick cutting. Rock Mech. Rock Eng. 2025, 58, 7835–7856. [Google Scholar] [CrossRef] [Scilit]
- Yang, Z.; Liu, X.; Fan, C.; Li, S.; Wang, X.; Liu, L. Study on numerical simulation of large-diameter borehole pressure relief in deep high-gas soft coal seams. ACS Omega 2024, 9, 24864–24879. [Google Scholar] [CrossRef] [Scilit] [PubMed]
- Wang, L.; Chen, X.; Wang, D.; An, F. Study on the influence of water injection pressure on water absorption process and water injection effect of coal. Greenh. Gases Sci. Technol. 2023, 13, 369–378. [Google Scholar] [CrossRef] [Scilit]
- Yu, B.; Gao, R.; Xia, B.W.; Kuang, T.J. Ground fracturing technology and application of hard roof in large space. J. China Coal Soc. 2021, 46, 800–811. [Google Scholar] [CrossRef]
- Liu, M.; Lu, J.; Lou, B. Research on Kaiser effect of acoustic emission in concrete subjected to bending after freeze-thaw. J. Build. Eng. 2023, 78, 107713. [Google Scholar] [CrossRef] [Scilit]
- Xu, W.; Chen, Y.; Miao, H.; Zhang, L. An experimental study on fracture characteristics of high-performance fiber-reinforced cement composites through combined acoustic emission and digital image correlation. J. Build. Eng. 2025, 103, 112110. [Google Scholar] [CrossRef] [Scilit]
- Gao, F.; Yang, L.; Lu, Z.; Wu, R.; Liu, W.; Xi, C. Real-time forecasting of brittle rock failure: A robust acoustic emission approach validated on a large experimental dataset. GeoEnergy Commun. 2026, 2, 1. [Google Scholar] [CrossRef] [Scilit]
- Zamanzadeh, Z.; Lourenço, L.; Barros, J. Recycled Steel Fibre Reinforced Concrete failing in bending and in shear. Constr. Build. Mater. 2015, 85, 195–207. [Google Scholar] [CrossRef] [Scilit]
- Najafi, M.; Ahmadi, H.; Liaghat, G. Investigation on the flexural properties of sandwich beams with auxetic core. J. Braz. Soc. Mech. Sci. Eng. 2022, 44, 61. [Google Scholar] [CrossRef] [Scilit]
- Wang, X.; Chen, J.; Liu, Y.; Sheng, M.; Long, W.; Luo, Q.; Feng, G.; Xing, F. Experimental study on bending fatigue properties of microcapsule self-healing cementitious composites. J. Build. Eng. 2025, 101, 111873. [Google Scholar] [CrossRef] [Scilit]
- Lee, J.; Lopez, M.M. An experimental study on fracture energy of plain concrete. Int. J. Concr. Struct. Mater. 2014, 8, 129–139. [Google Scholar] [CrossRef] [Scilit]
- Koval, G.; Le, B.D.; Chazallon, C. Discrete element model for quasi-brittle rupture under tensile and compressive loading. Int. J. Numer. Anal. Methods Géoméch. 2016, 40, 2339–2352. [Google Scholar] [CrossRef] [Scilit]
- Ma, H.; Su, W.; Cheng, P.; Xu, S.; Lv, M. Fracture propagation characteristics of pre-cracked red clay in roadbed filling under three-point bending. Theor. Appl. Fract. Mech. 2024, 133, 104582. [Google Scholar] [CrossRef] [Scilit]
- Lu, D.; Song, Z.; Wang, G.; Du, X. Viscoelastic peridynamic fracture analysis for concrete beam with initial crack under impact. Theor. Appl. Fract. Mech. 2023, 124, 103757. [Google Scholar] [CrossRef] [Scilit]
- Li, B.; Tian, Y.; Tian, J.; Zuo, S.; Chen, S. Bending-damaged fracture criterion and numerical implementation of limestone beam under three-point bending test. Front. Earth Sci. 2023, 11, 1147129. [Google Scholar] [CrossRef] [Scilit]
- Wu, P.; Wan, X.; Lu, Q.; Zhang, Y. Study on Mechanical Properties of Steel Fiber-Reinforced Geopolymer Concrete under Multi-Axial Loads. Buildings 2024, 14, 2780. [Google Scholar] [CrossRef] [Scilit]
- Krueger, R. Testing and Analysis of Composite Skin/Stringer Debonding under Multi-Axial Loading. Compos. Mater. 2000, 34, 1263–1300. [Google Scholar] [CrossRef]
- Yu, B.; Gao, R.; Kuang, T.; Huo, B.; Meng, X. Engineering study on fracturing high-level hard rock strata by ground hydraulic action. Tunn. Undergr. Space Technol. 2019, 86, 156–164. [Google Scholar] [CrossRef] [Scilit]
- Gao, R.; Kuang, T.; Zhang, Y.; Zhang, W.; Quan, C. Controlling mine pressure by subjecting high-level hard rock strata to ground fracturing. Int. J. Coal Sci. Technol. 2021, 8, 1336–1350. [Google Scholar] [CrossRef] [Scilit]
- Gao, R.; Bai, D.; Yu, B.; Tai, Y.; Meng, X.; Zhang, W. Ground fracturing of multi-strata for strong ground pressure control in extra-thick coal seams with hard roofs: Numerical simulation and case study. Eng. Fract. Mech. 2024, 303, 110129. [Google Scholar] [CrossRef] [Scilit]
- Gao, R.; Kuang, T.; Meng, X.; Huo, B. Effects of Ground Fracturing with Horizontal Fracture Plane on Rock Breakage Characteristics and Mine Pressure Control. Rock Mech. Rock Eng. 2020, 54, 3229–3243. [Google Scholar] [CrossRef] [Scilit]
- Jiang, F.X.; Wang, B.; Zhai, M.H.; Guo, X.S.; Huang, G.W.; Huang, J.R. Field tests on fixed-point hydraulic fracture with extra-high pressure in coal seam for rock burst prevention. CJGE 2015, 37, 526–531. [Google Scholar] [CrossRef]
- Pan, J.F.; Kang, H.P.; Yan, Y.D.; Ma, X.H.; Ma, W.T.; Lu, C.; Lu, D.Z.; Xu, G.; Feng, M.H.; Xia, Y.X.; et al. The method, mechanism and application of preventing rock burst by artificial liberation layer of roof. J. China Coal Soc. 2023, 48, 636–648. [Google Scholar] [CrossRef]
- Ma, Y.Z.; Gao, Y.T.; Sitao, S.T.Z.; Pan, J.F.; Xia, K.W.; Zhang, X.F.; Jiang, F.X.; Liu, J.H.; Wang, B.; Chen, Y.; et al. Mechanism and evaluation method of rock burst prevention in coal mines using surface hydraulic fracturing. China Coal Soc. 2024, 49, 4390–4405. [Google Scholar] [CrossRef]
- Shang, X.G.; Zhu, S.T.; Jiang, F.X.; Zhang, X.F.; Wang, C.Y.; Wang, C.; Xie, H.D.; Yan, X.Y.; Liu, J.H.; Wei, Q.D. Experimental study on the prevention and control of mine earthquake by high pressure water fracturing of huge thick strata in vertical shaft. China Coal Soc. 2021, 46, 639–650. [Google Scholar] [CrossRef]
- Xie, H.P.; Ju, Y.; Li, L.Y.; Peng, R.D. Energy mechanism of deformation and failure of rock masses. Chin. J. Rock Mech. Eng. 2008, 27, 1729–1740. [Google Scholar] [CrossRef]
- Theotokoglou, E.; Tourlomousis, I. Crack kinking in sandwich structures under three-point bending. Theor. Appl. Fract. Mech. 2010, 53, 158–164. [Google Scholar] [CrossRef] [Scilit]
- Yu, B.; Li, Y.; Peng, M.X.; Gao, R.; Yang, W.L.; Li, M.; Tai, Y.; Shang, Z.Y.; Ding, J.; Miao, W.D.; et al. Load-bearing characteristics of clamped coal and ground inclined-borehole hydraulic fracturing method for rockburst control in steeply inclined coal seams. J. China Coal Soc. 2025, 50, 2773−2788. [Google Scholar] [CrossRef]
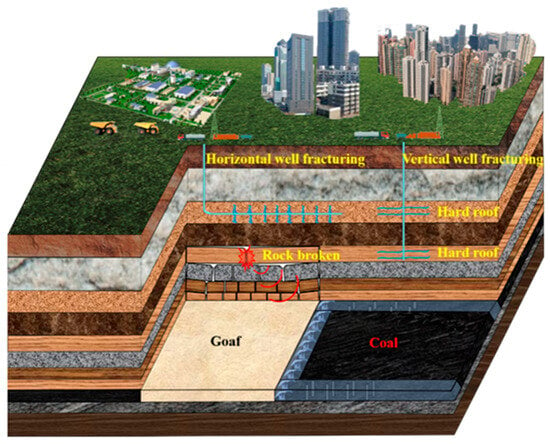
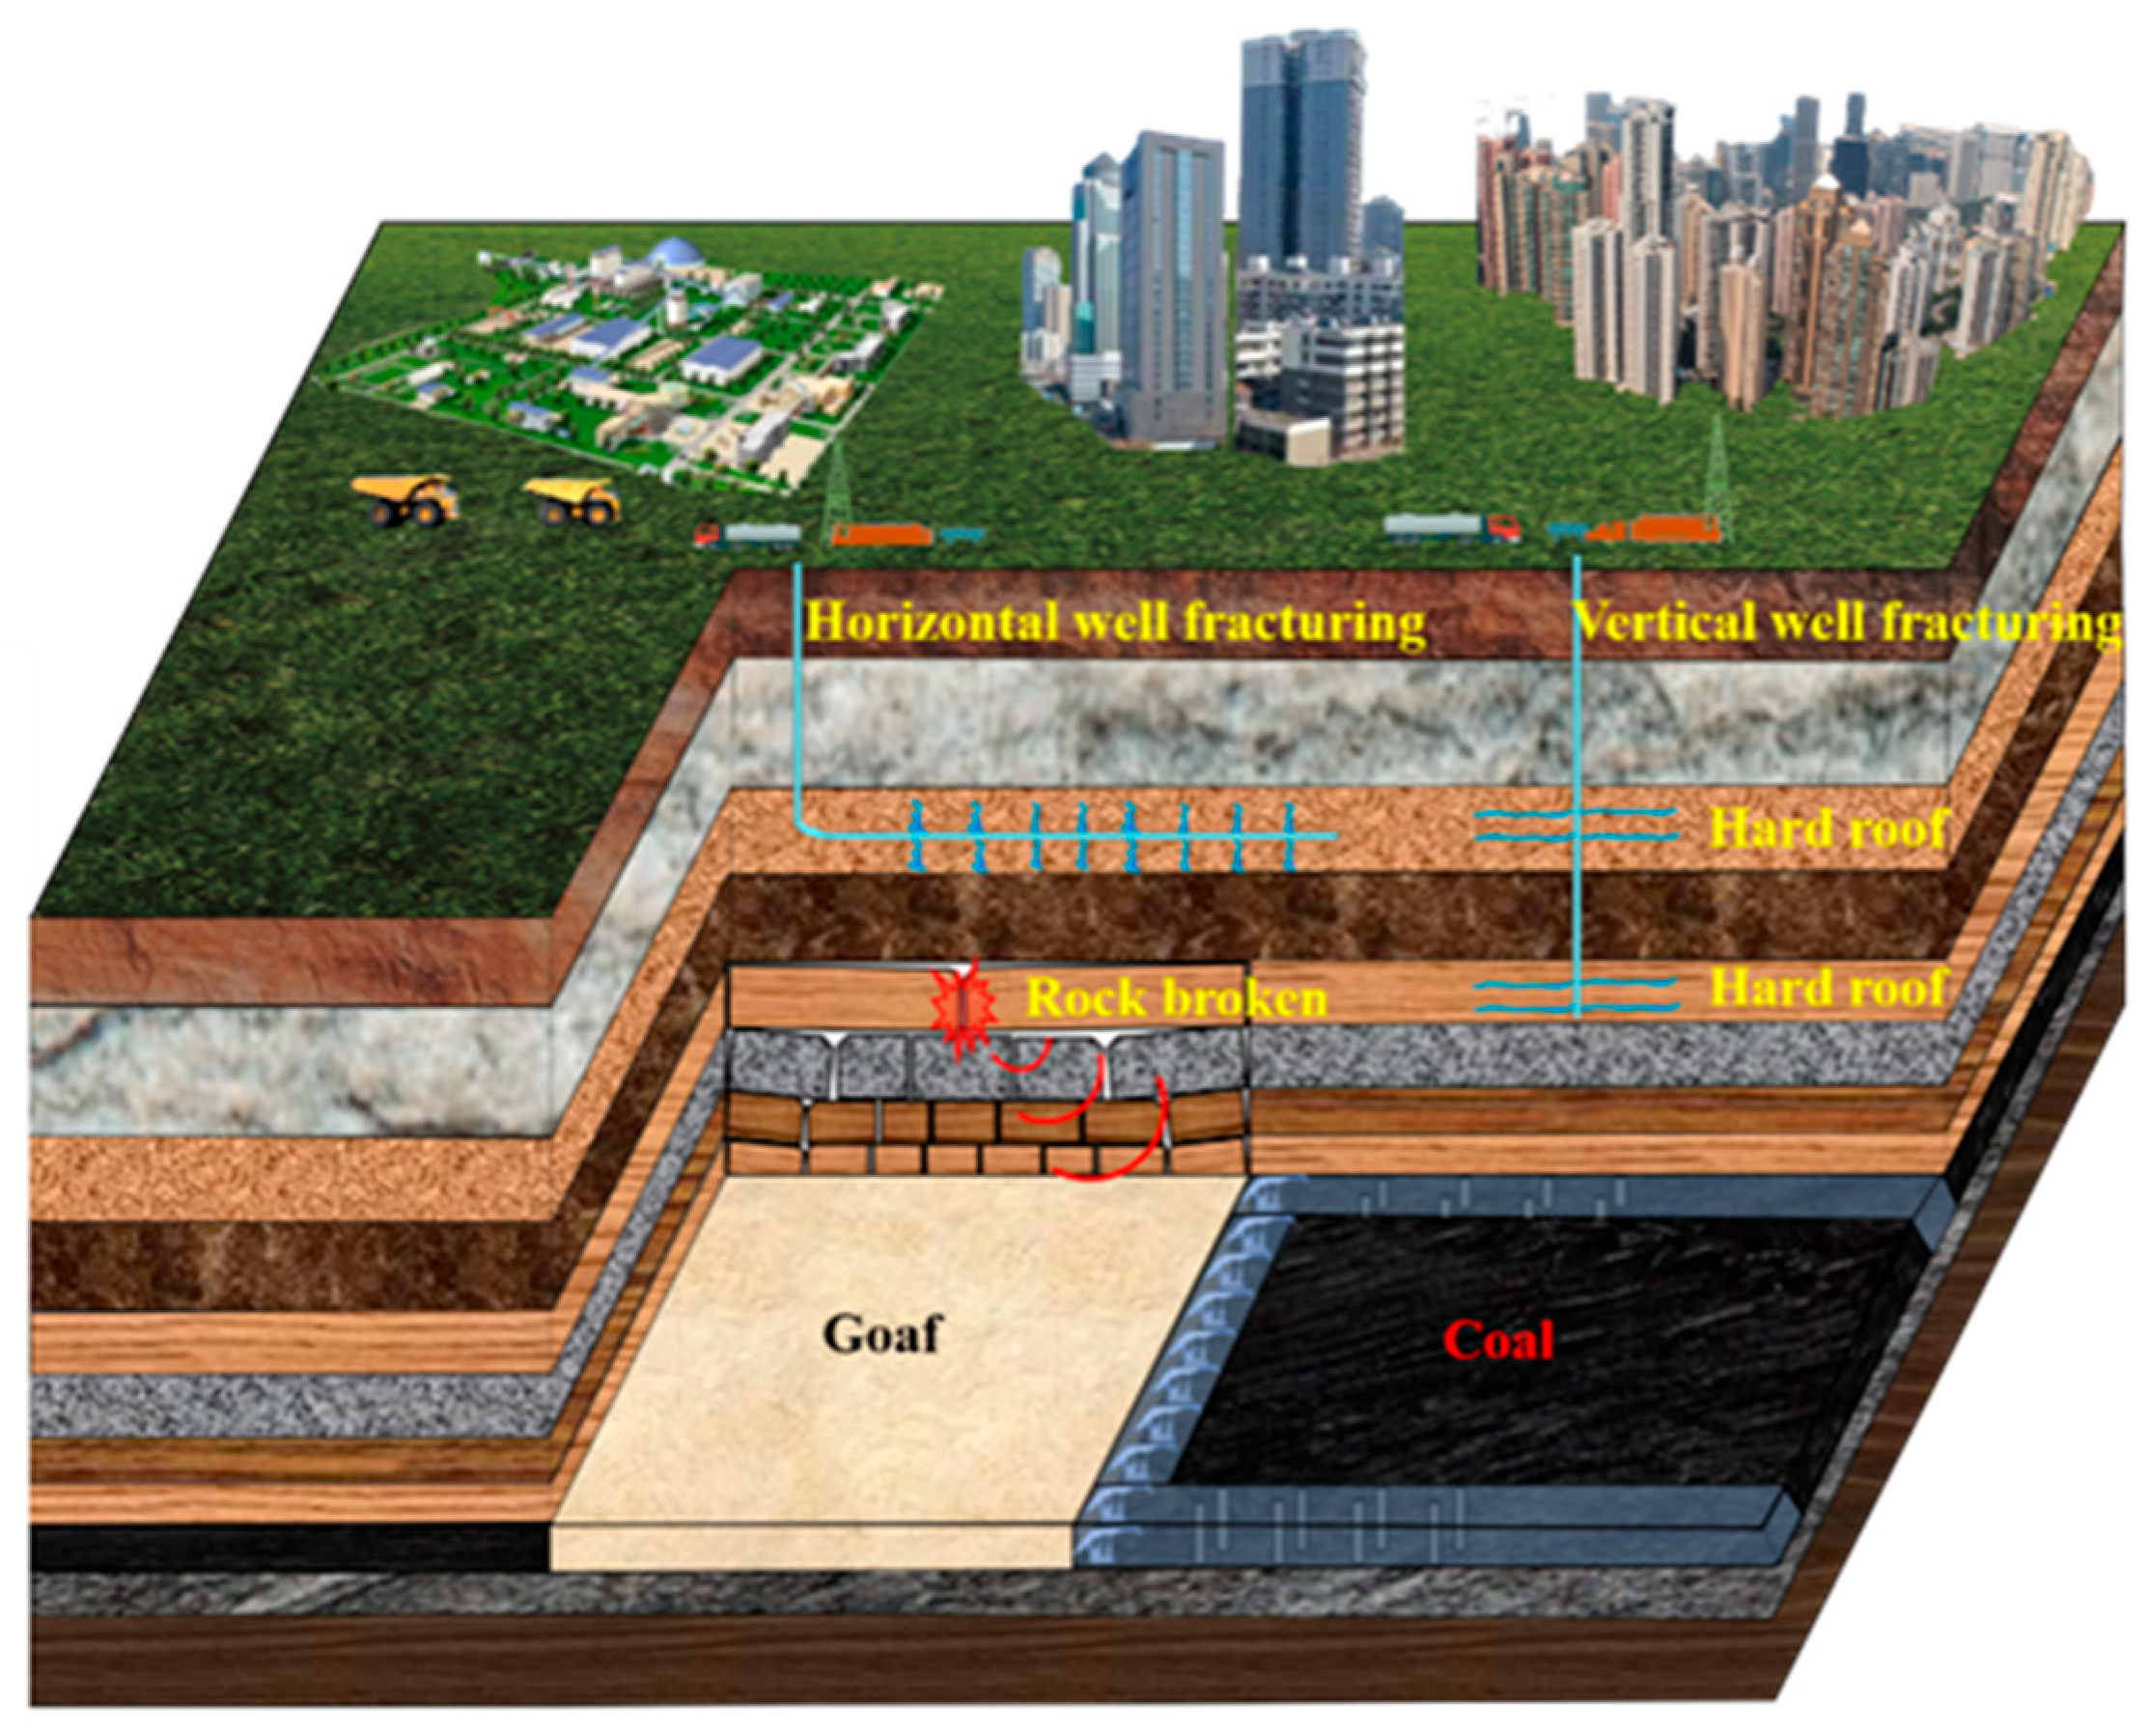
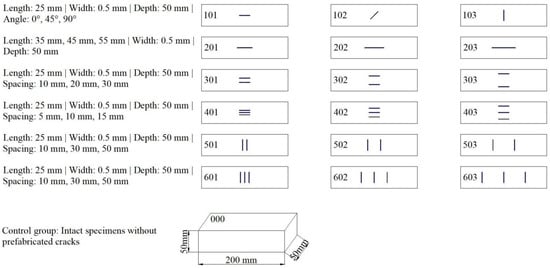
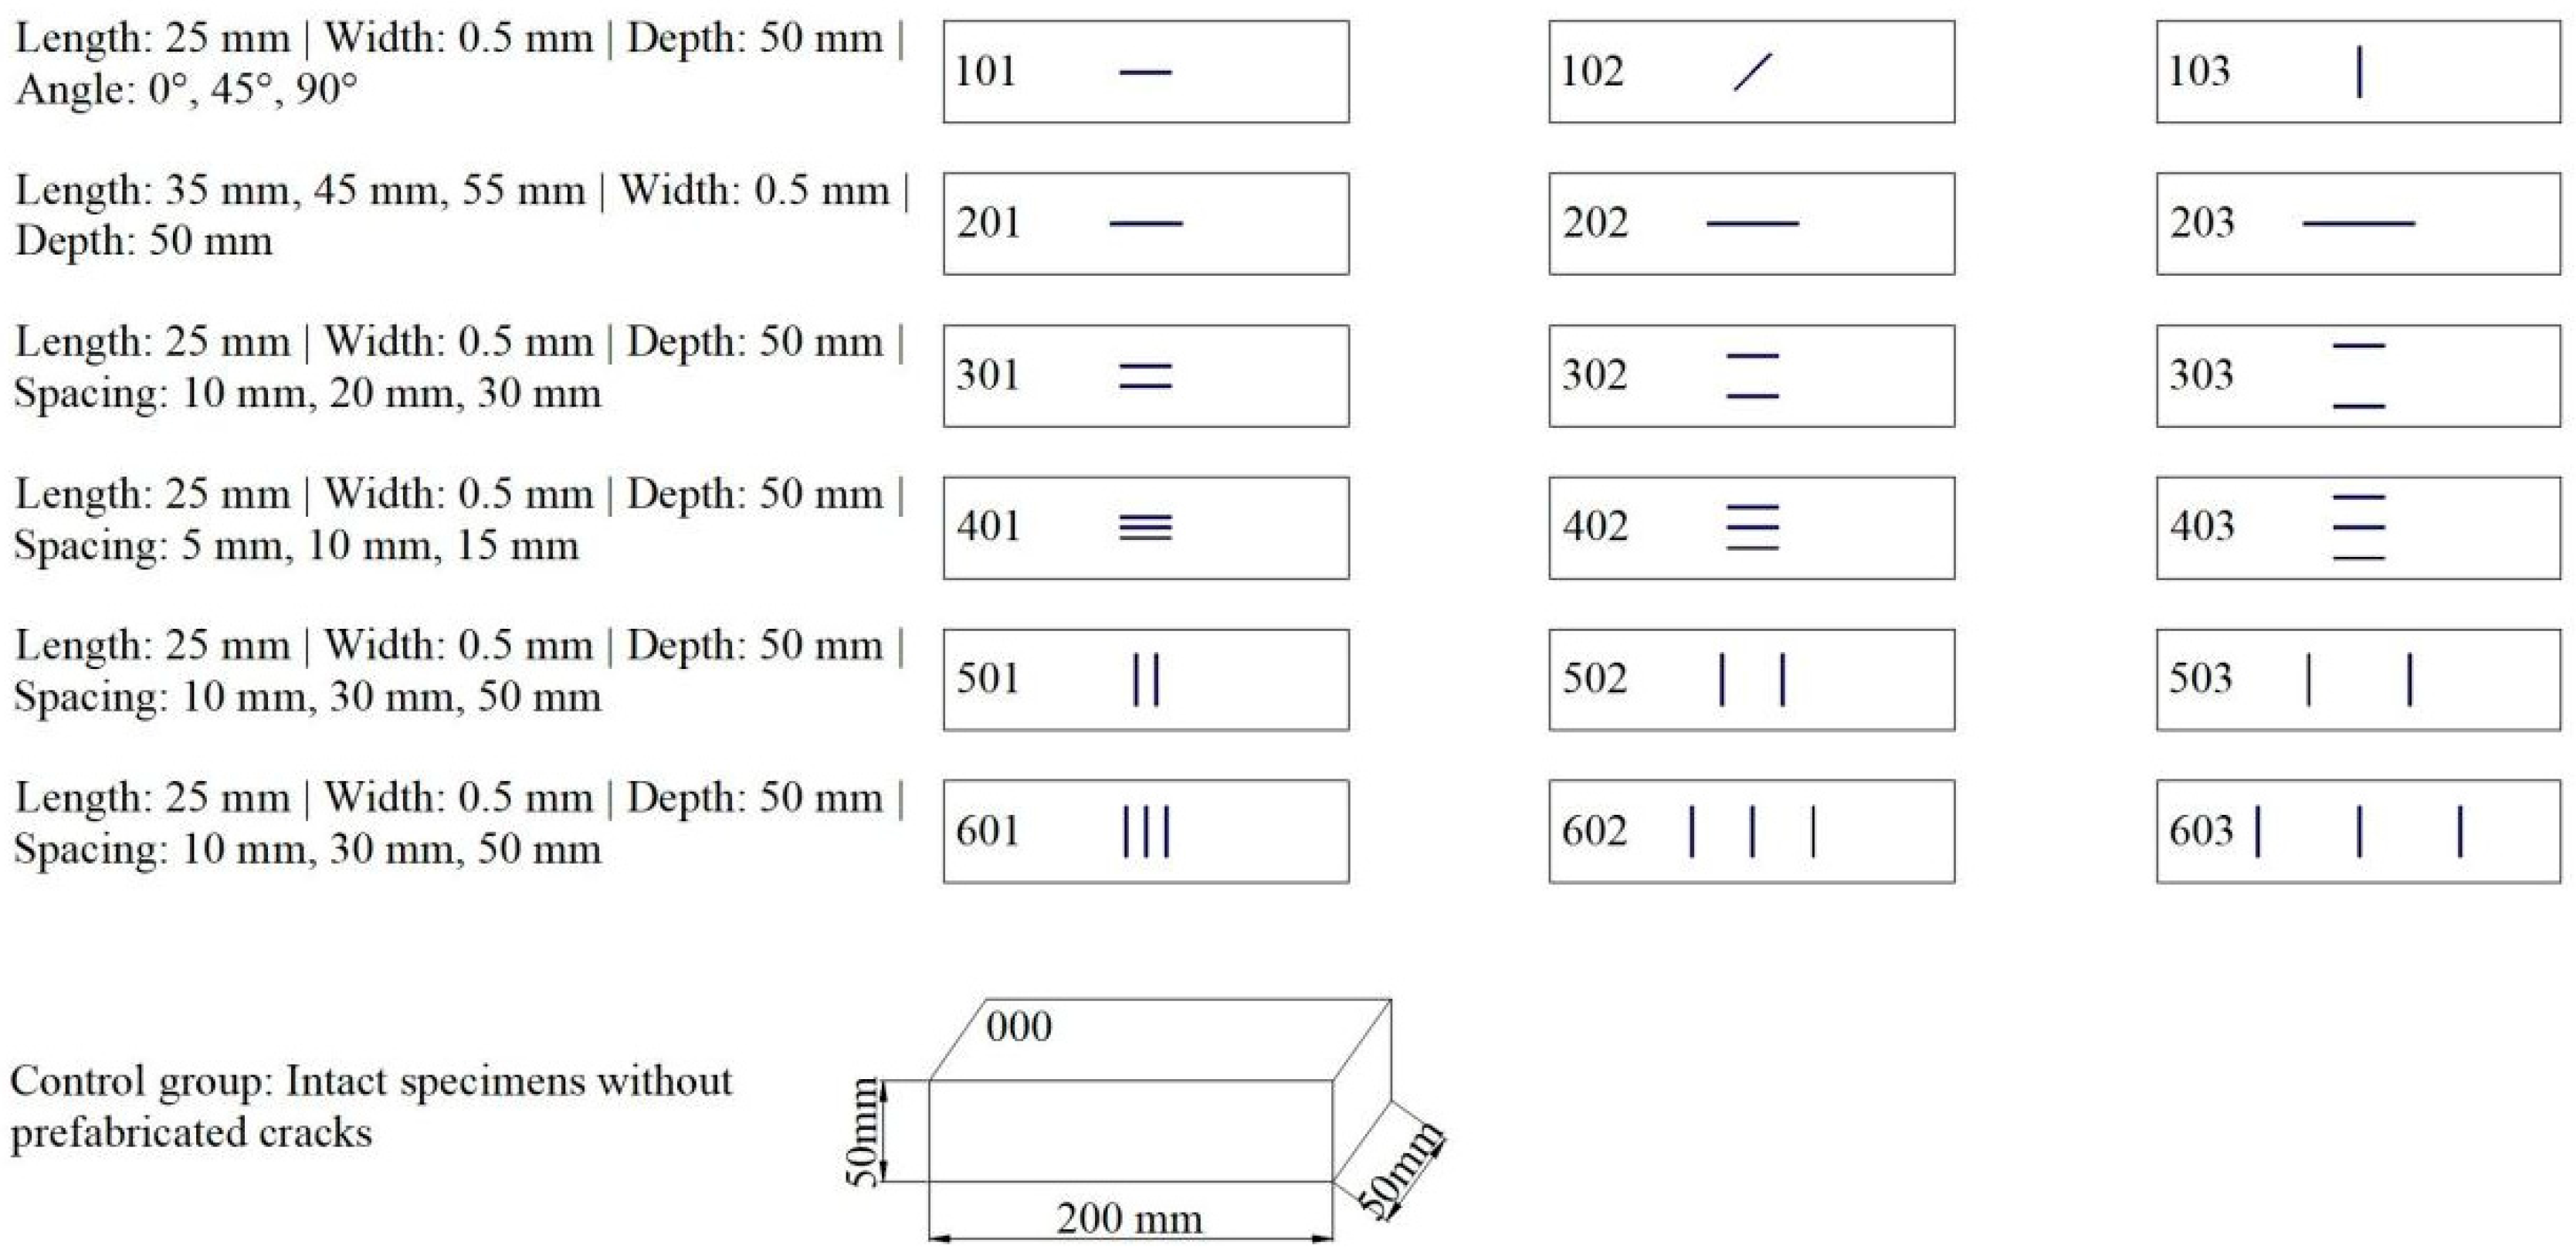
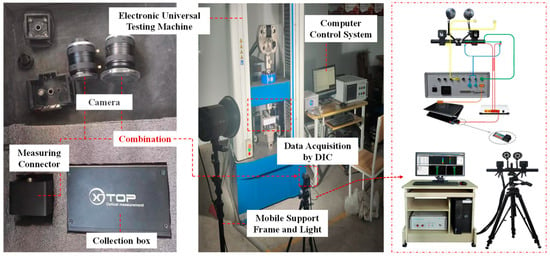
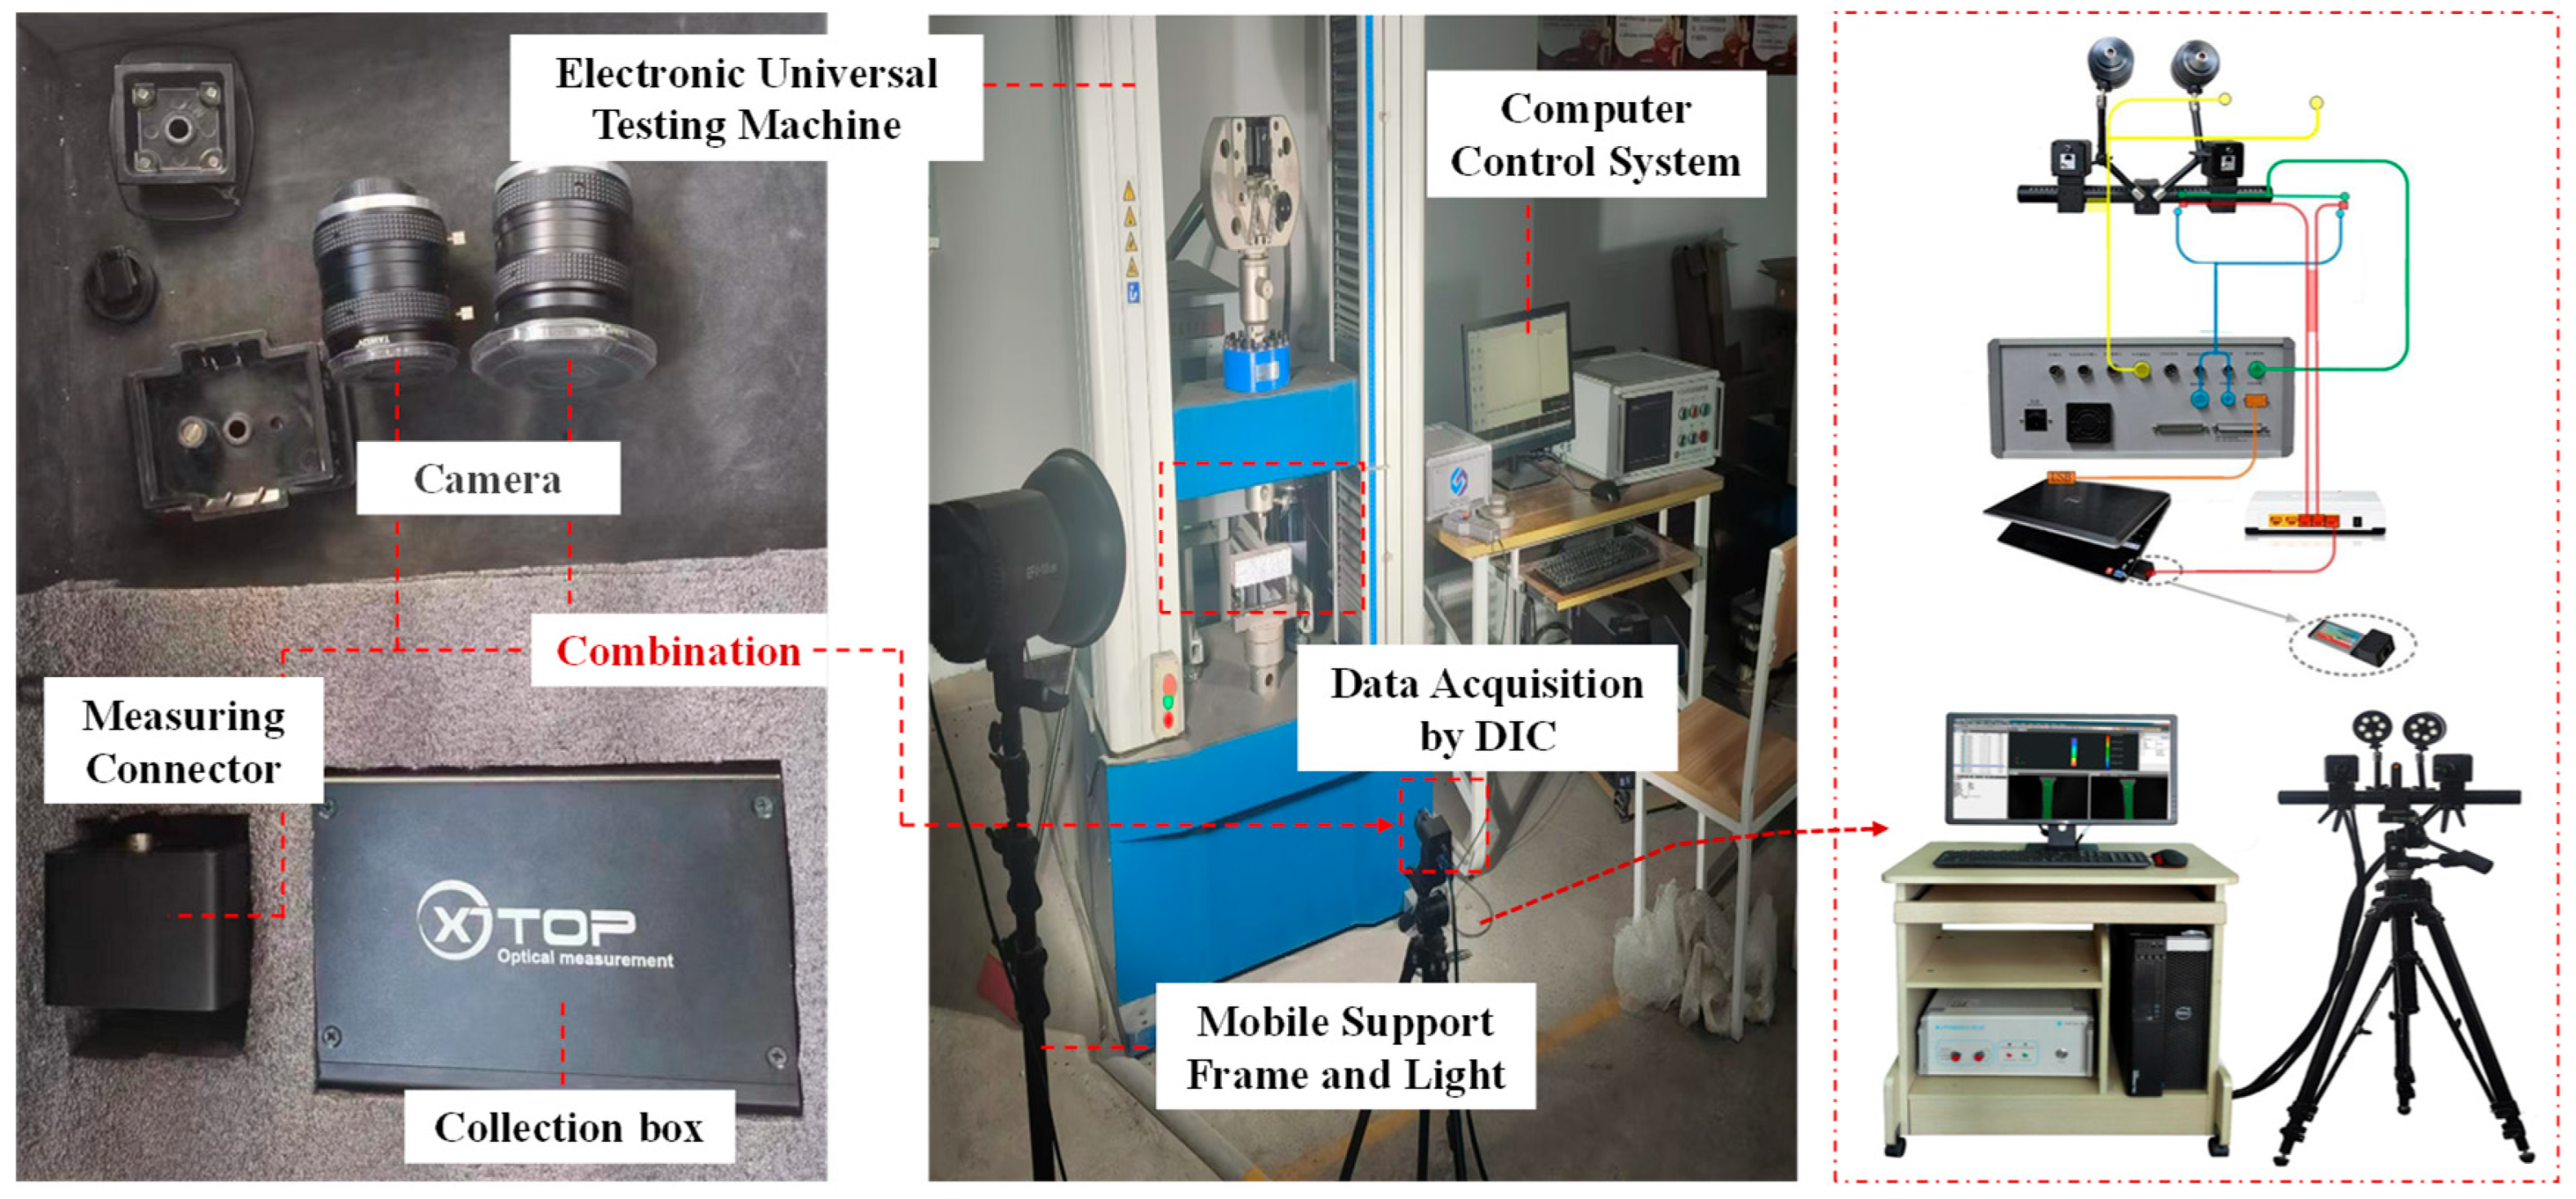
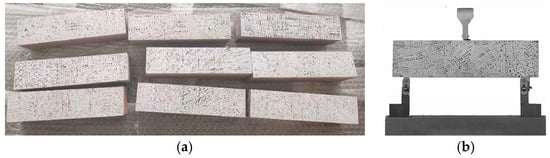
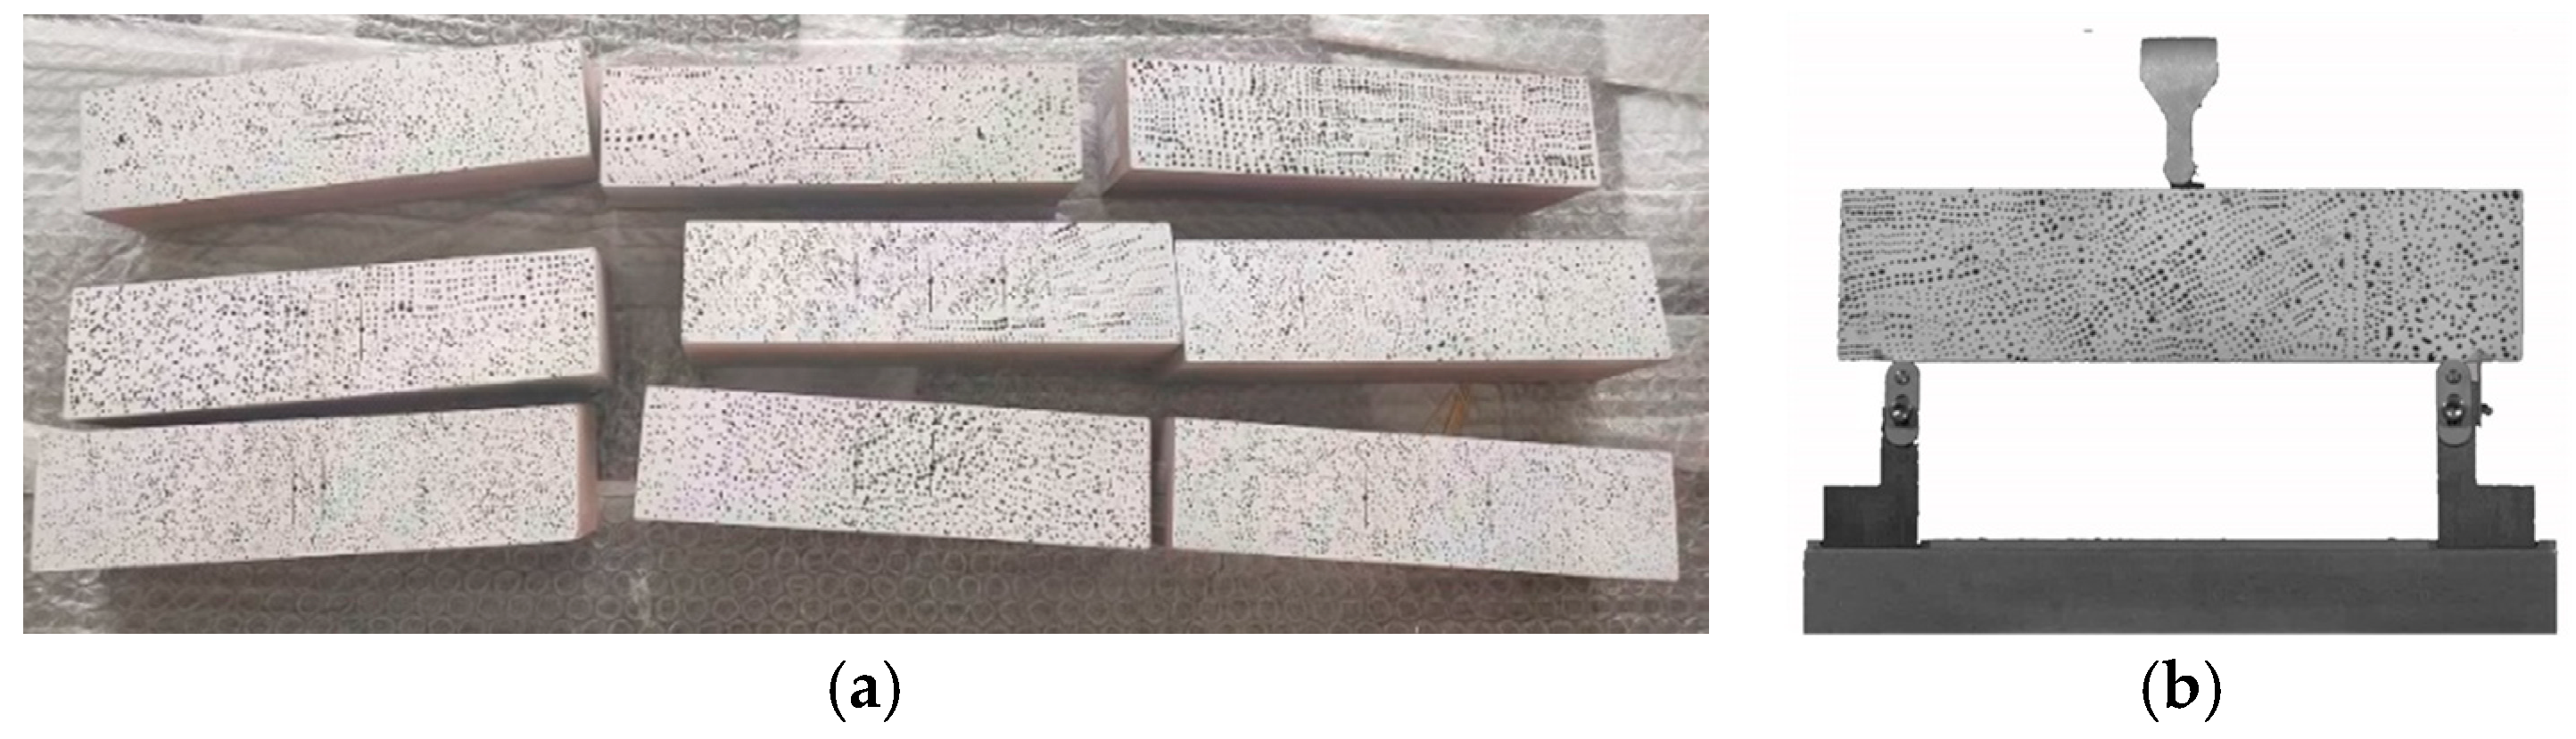
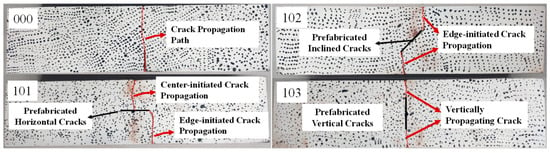
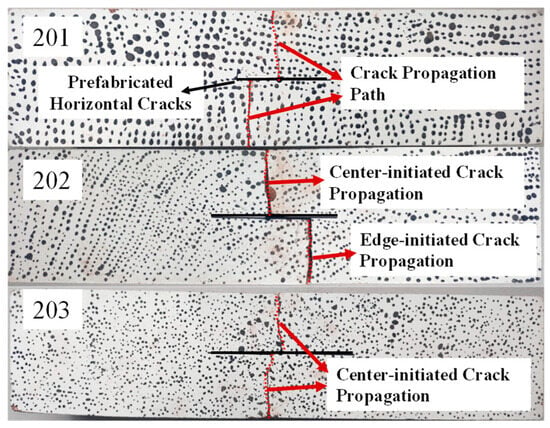
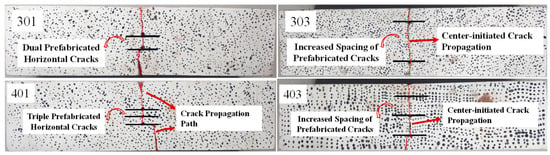
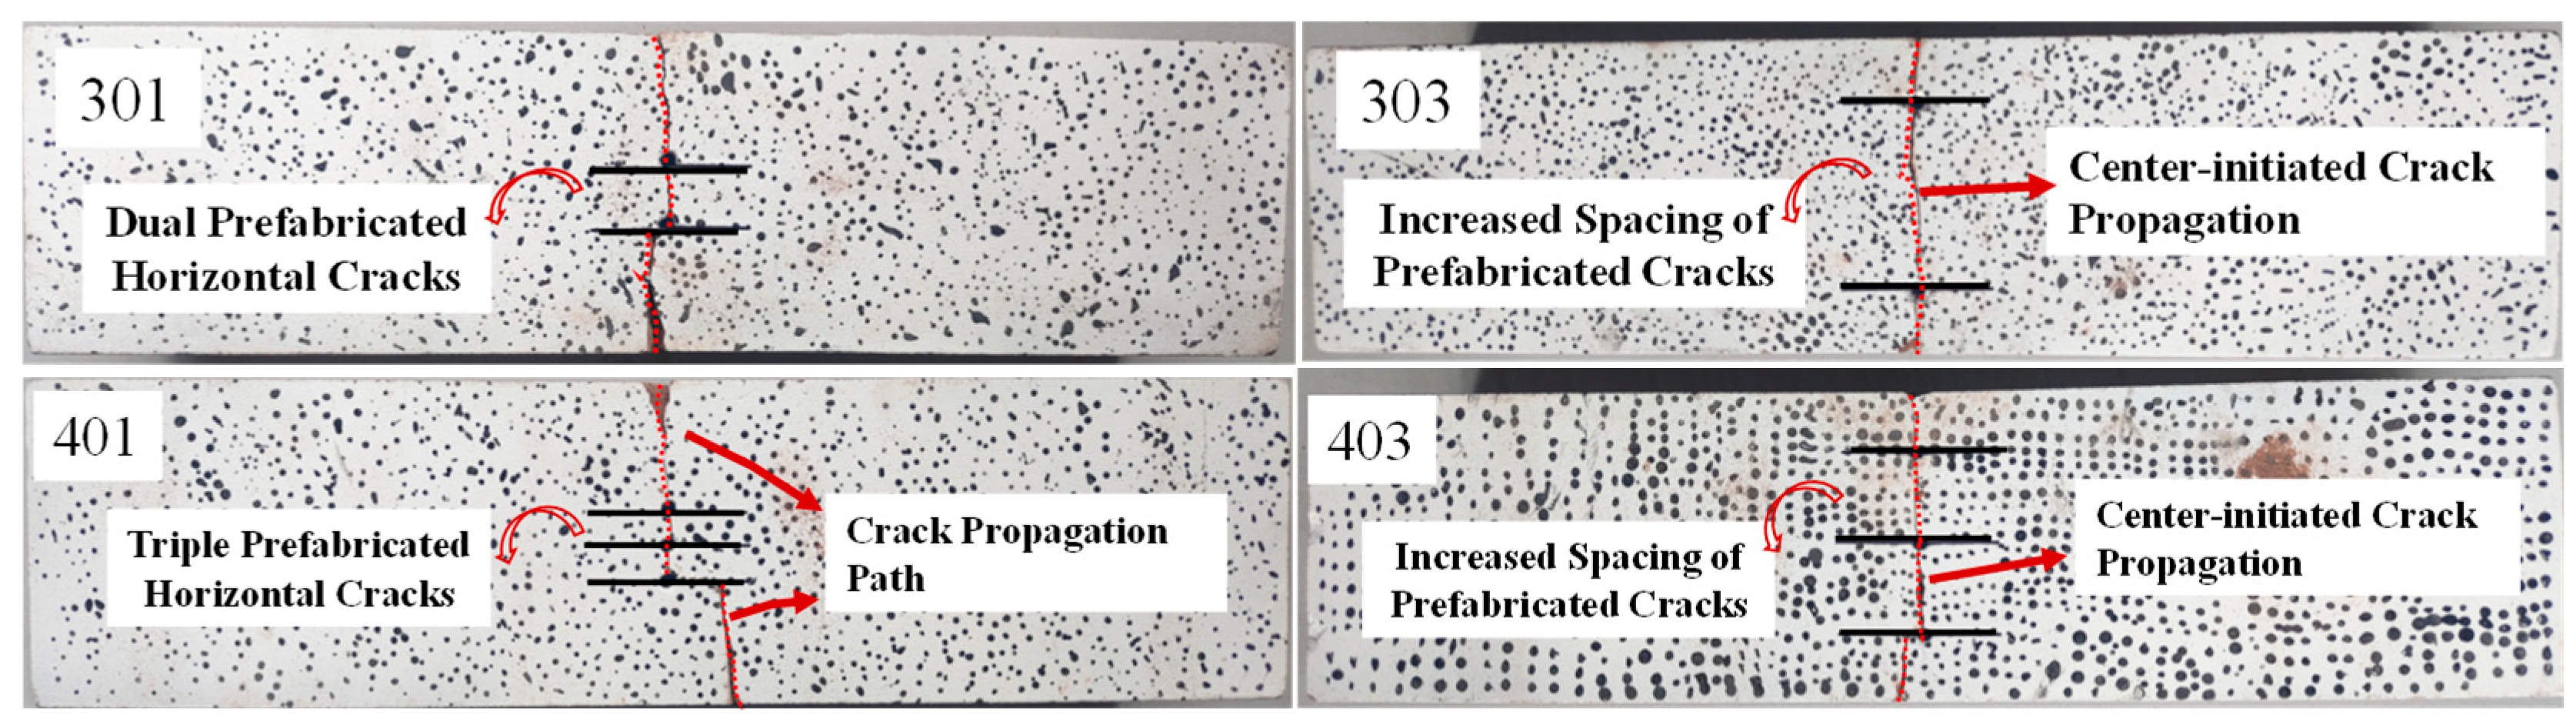
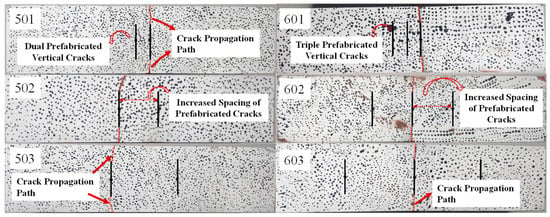
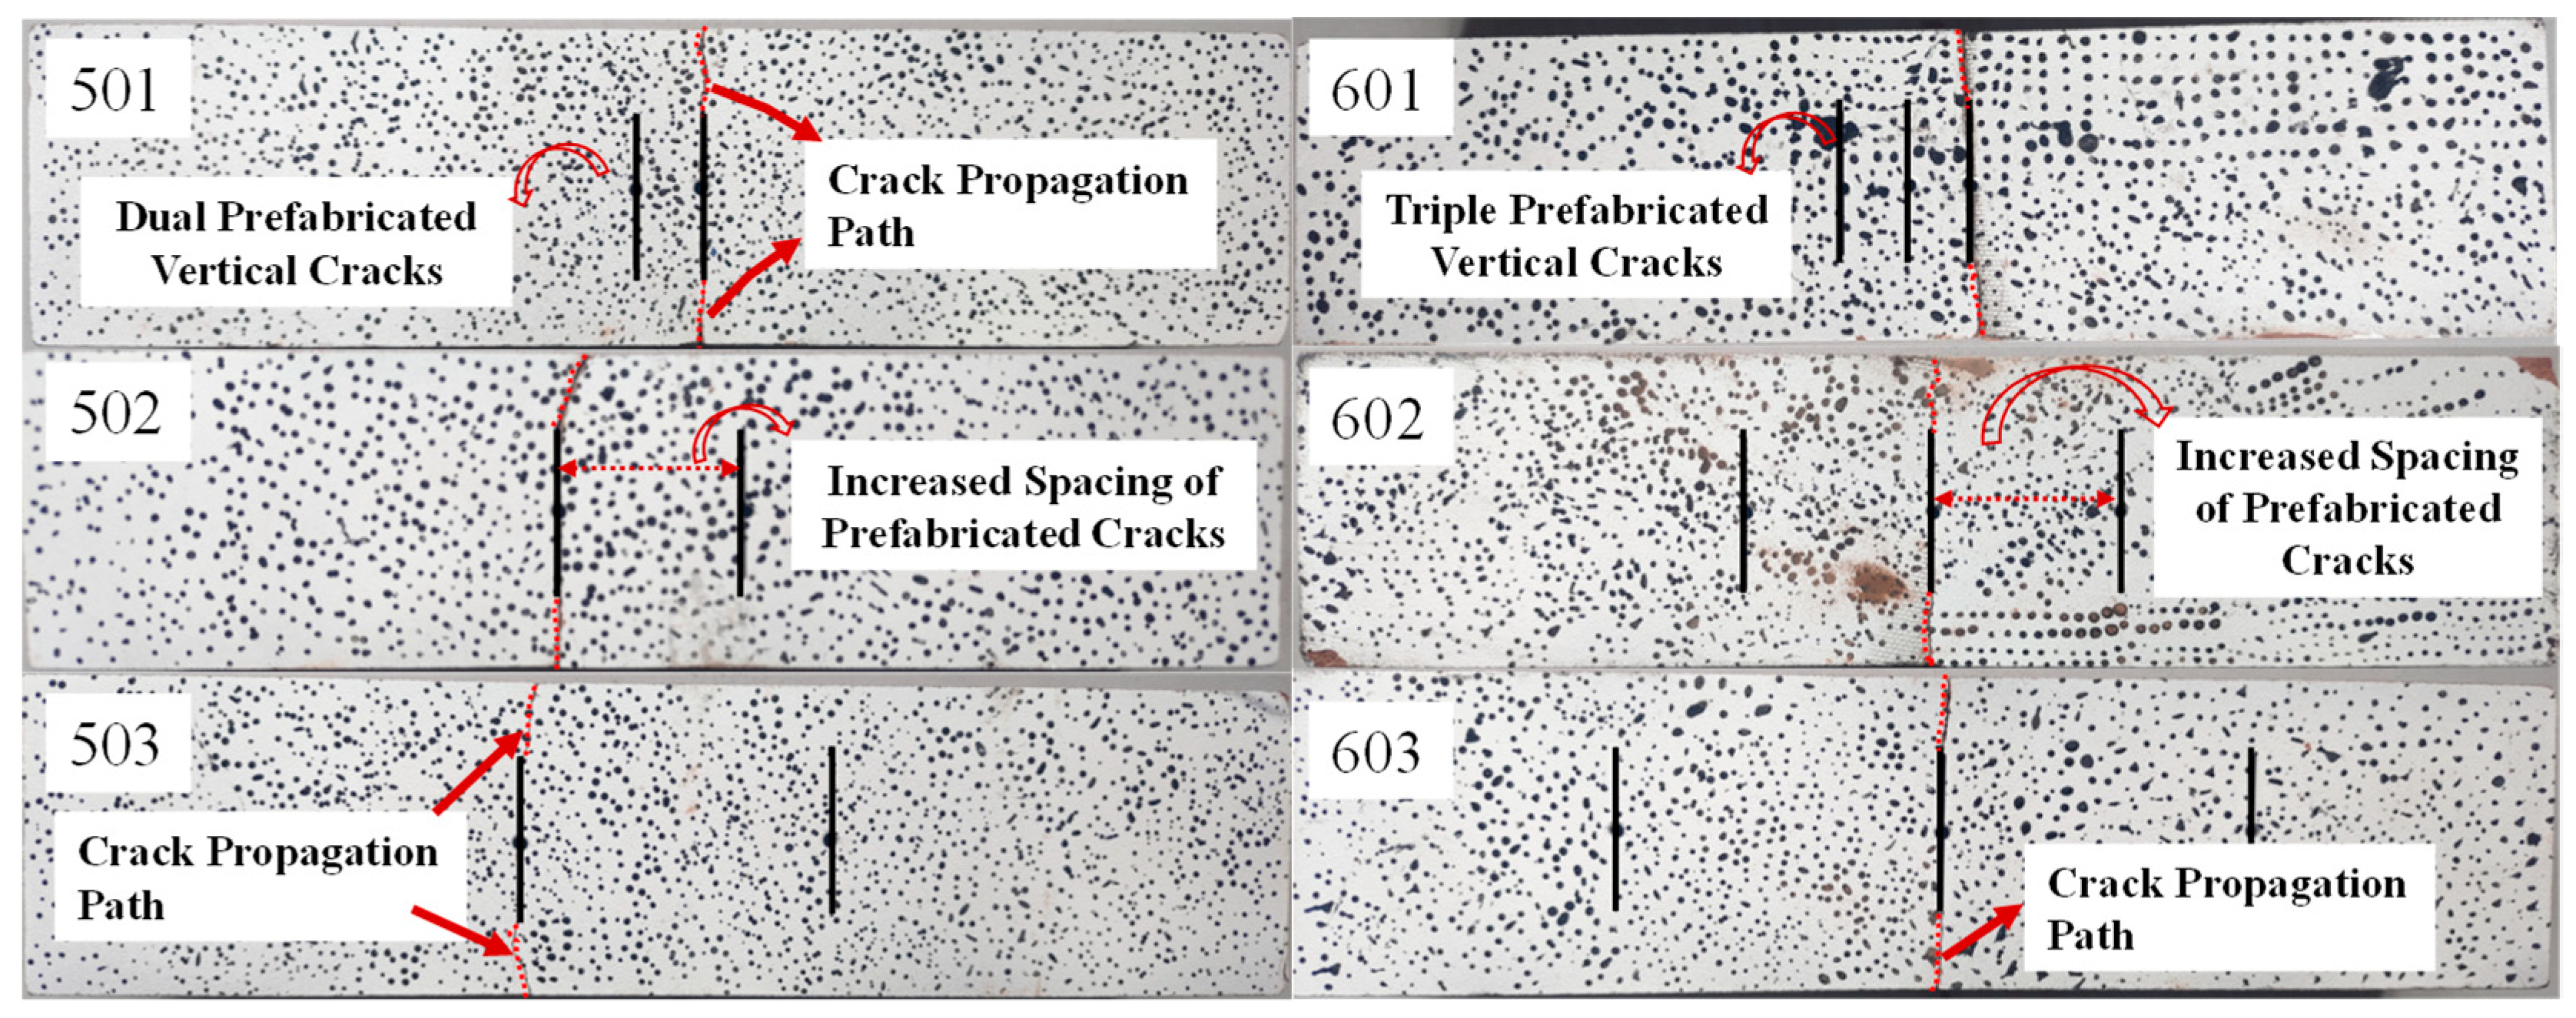
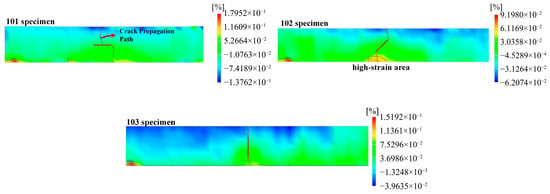
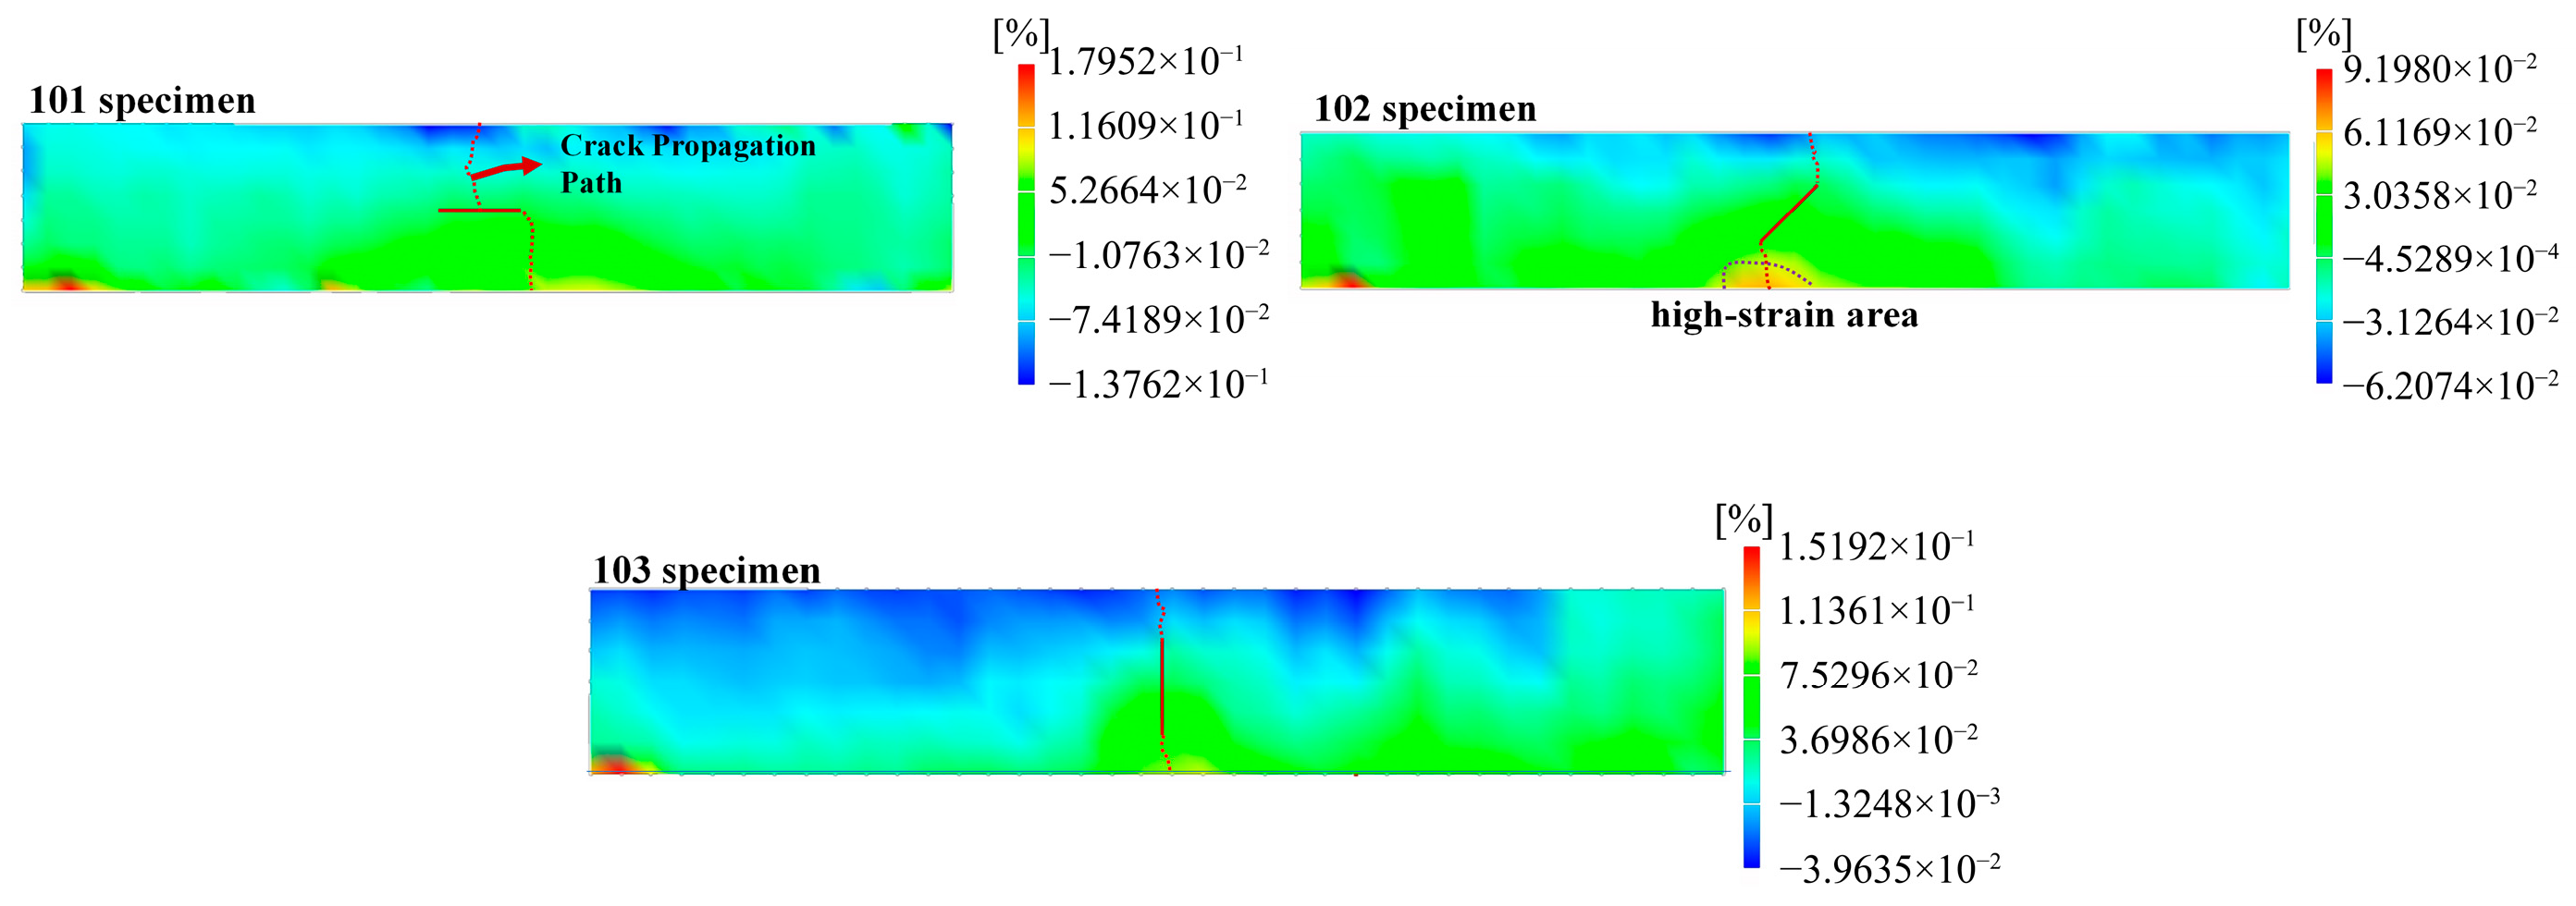
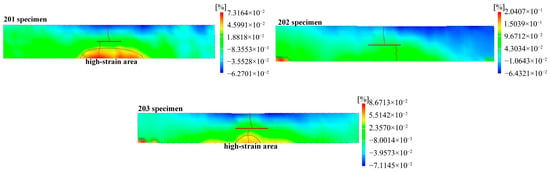
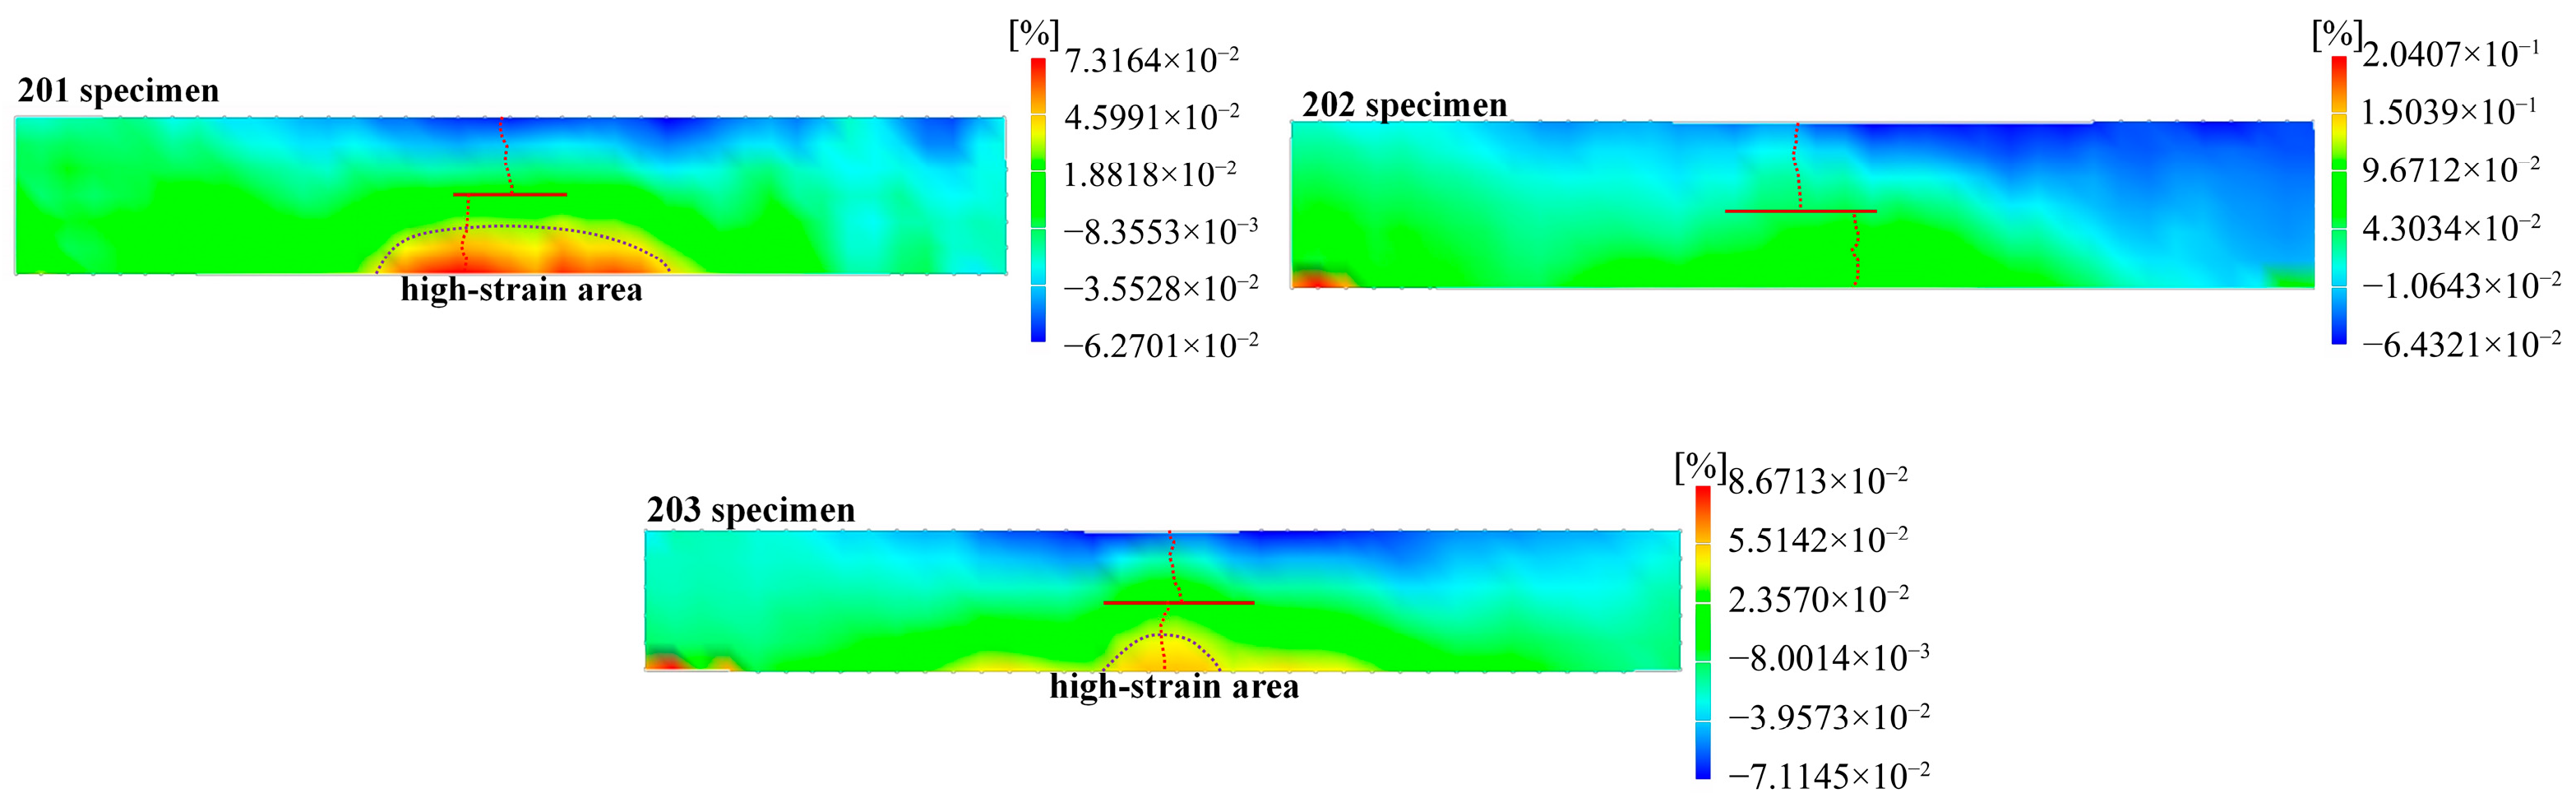
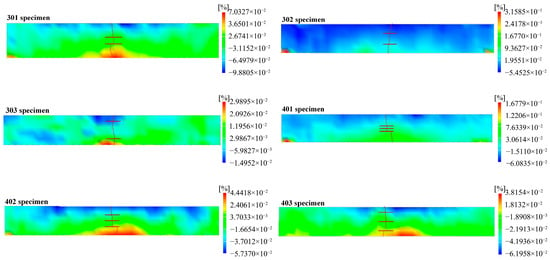
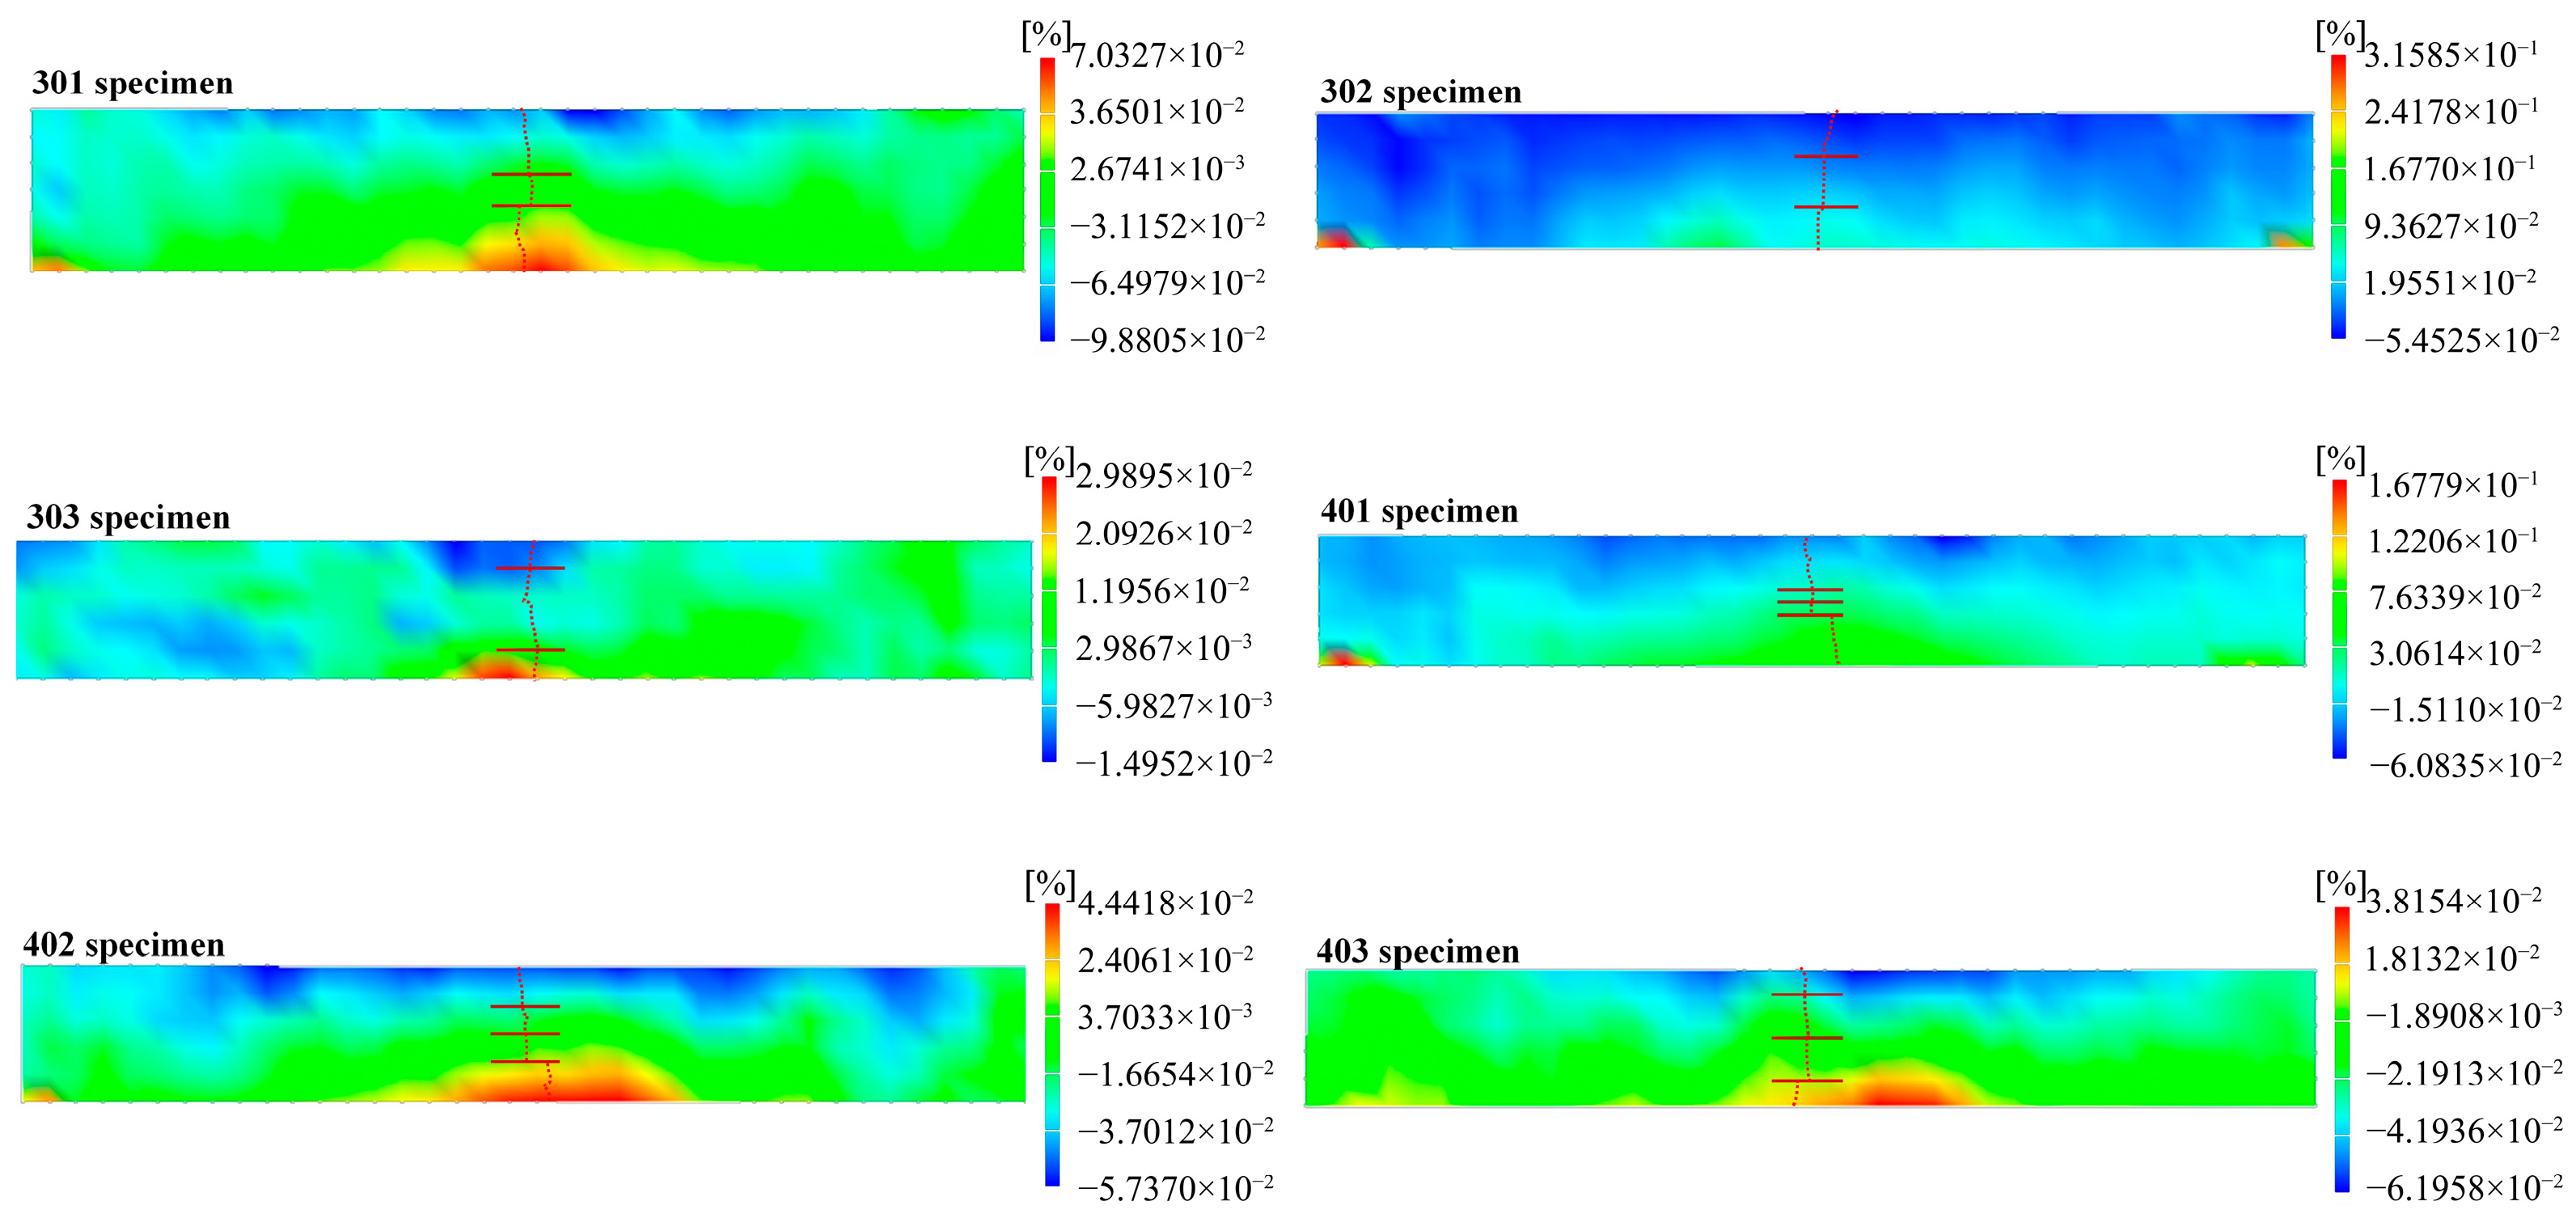
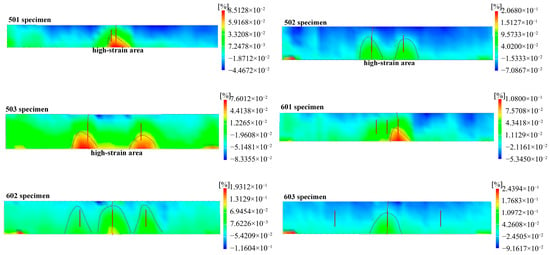
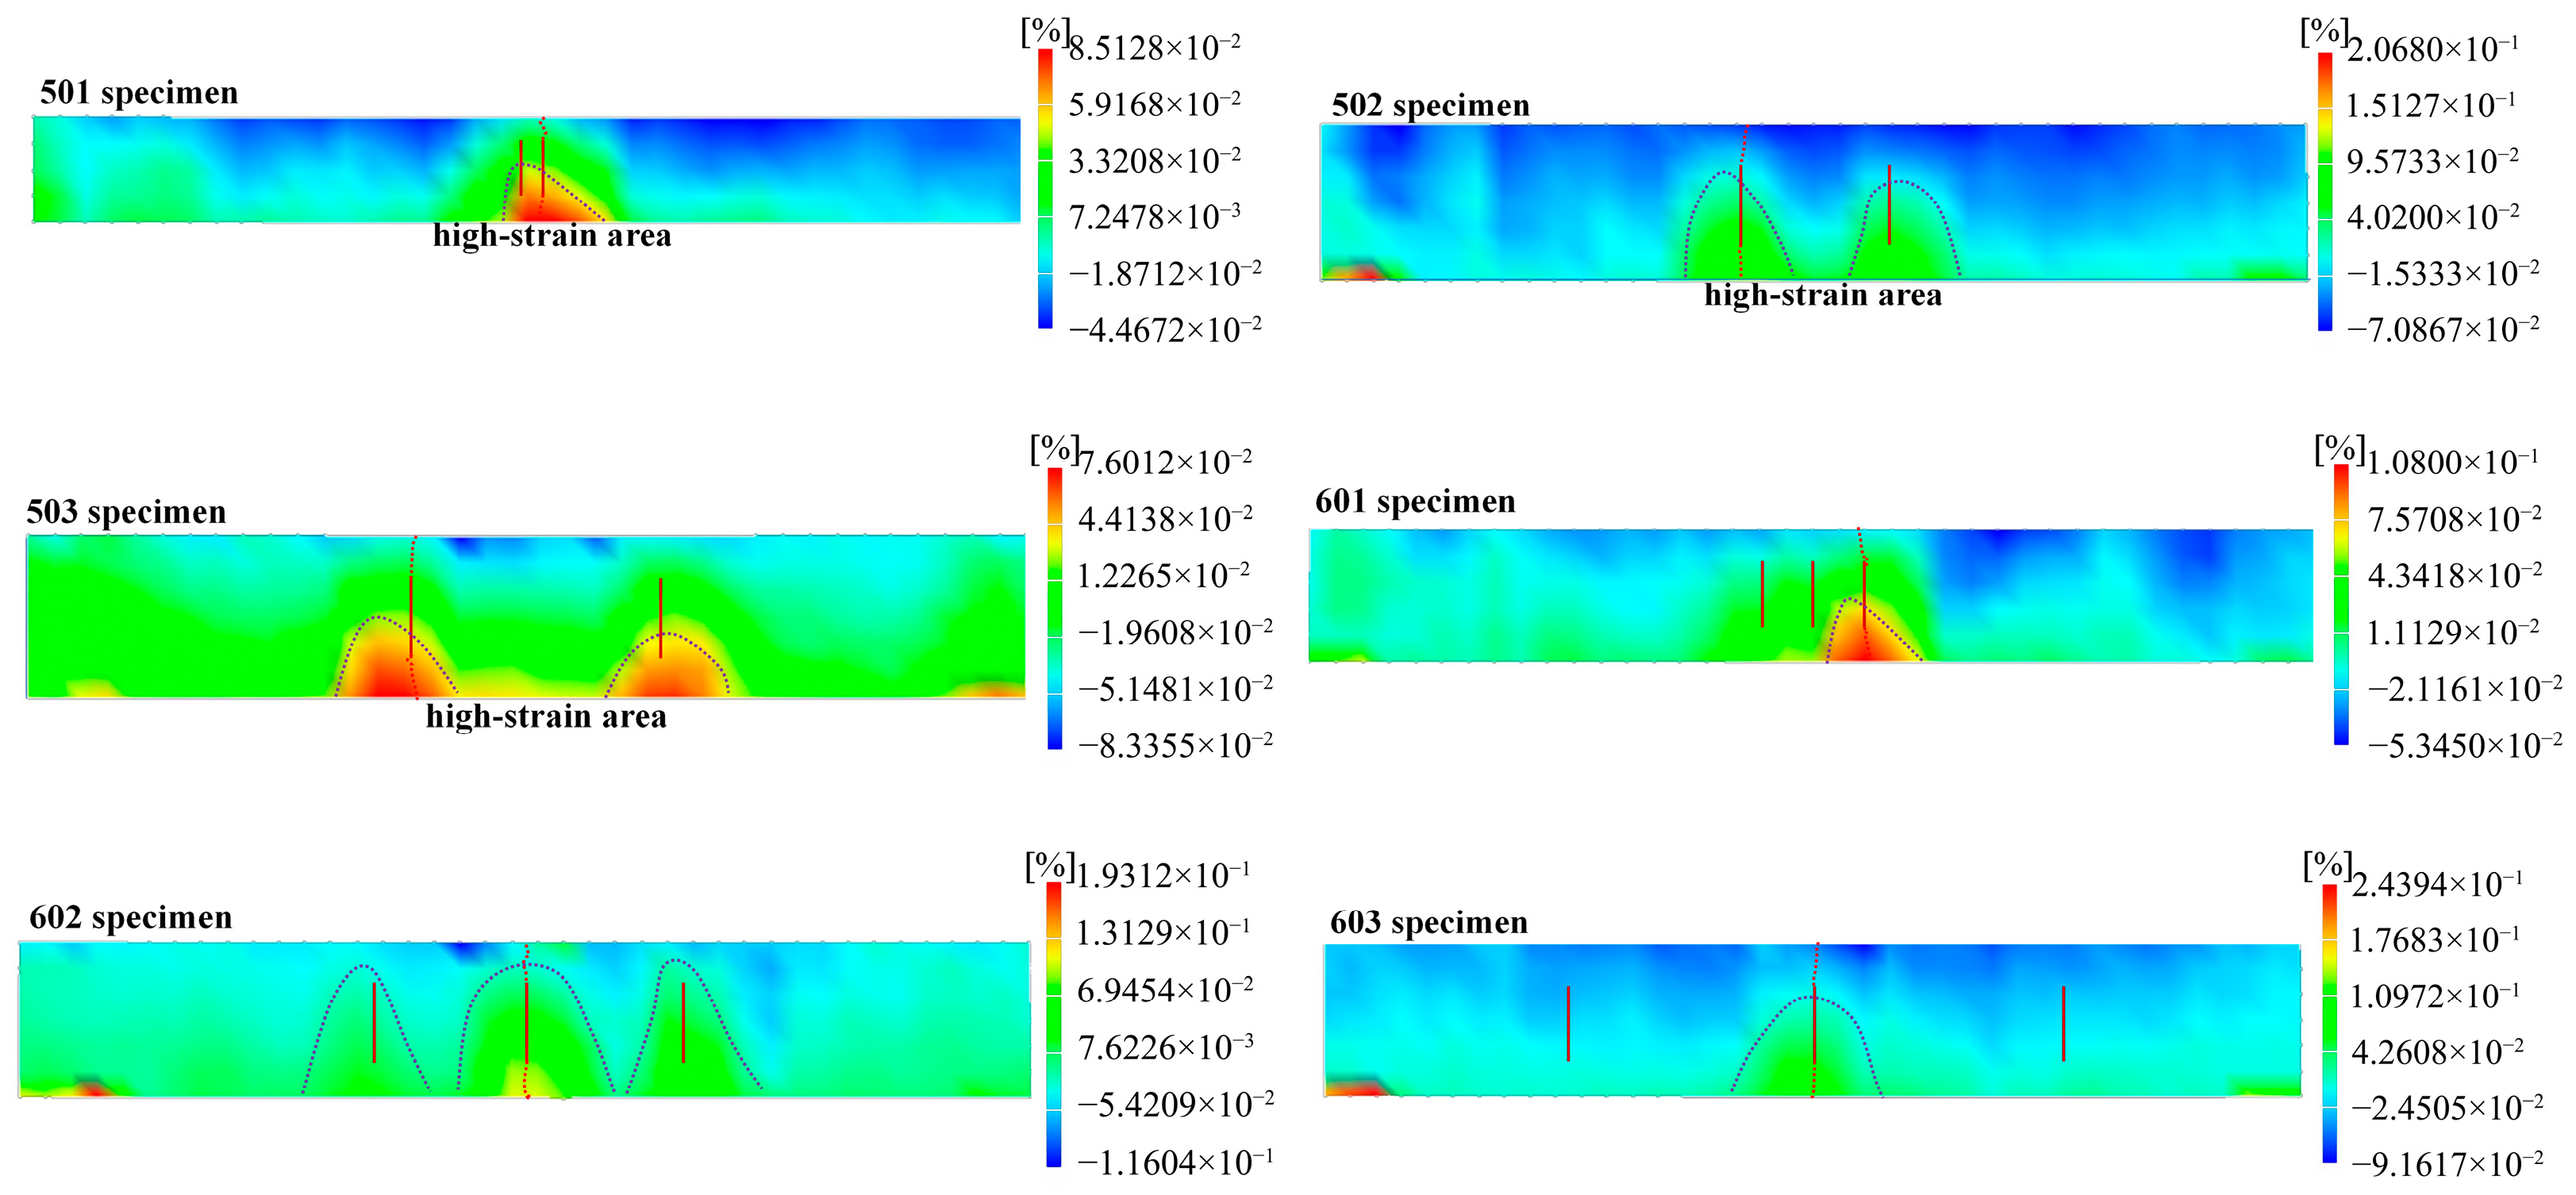
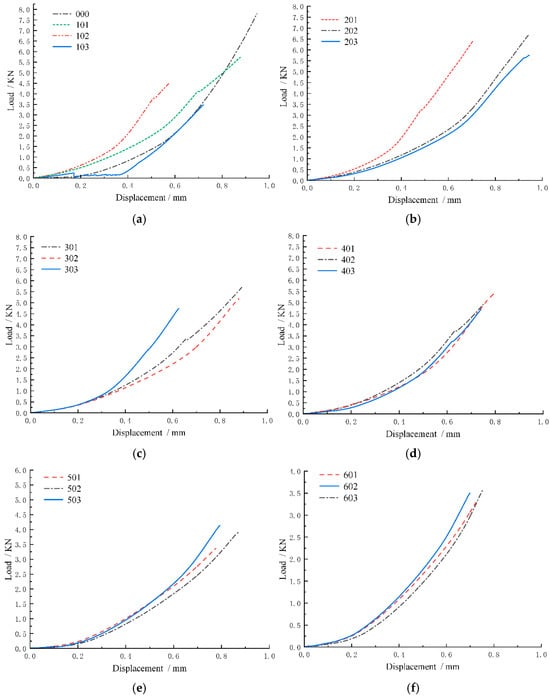
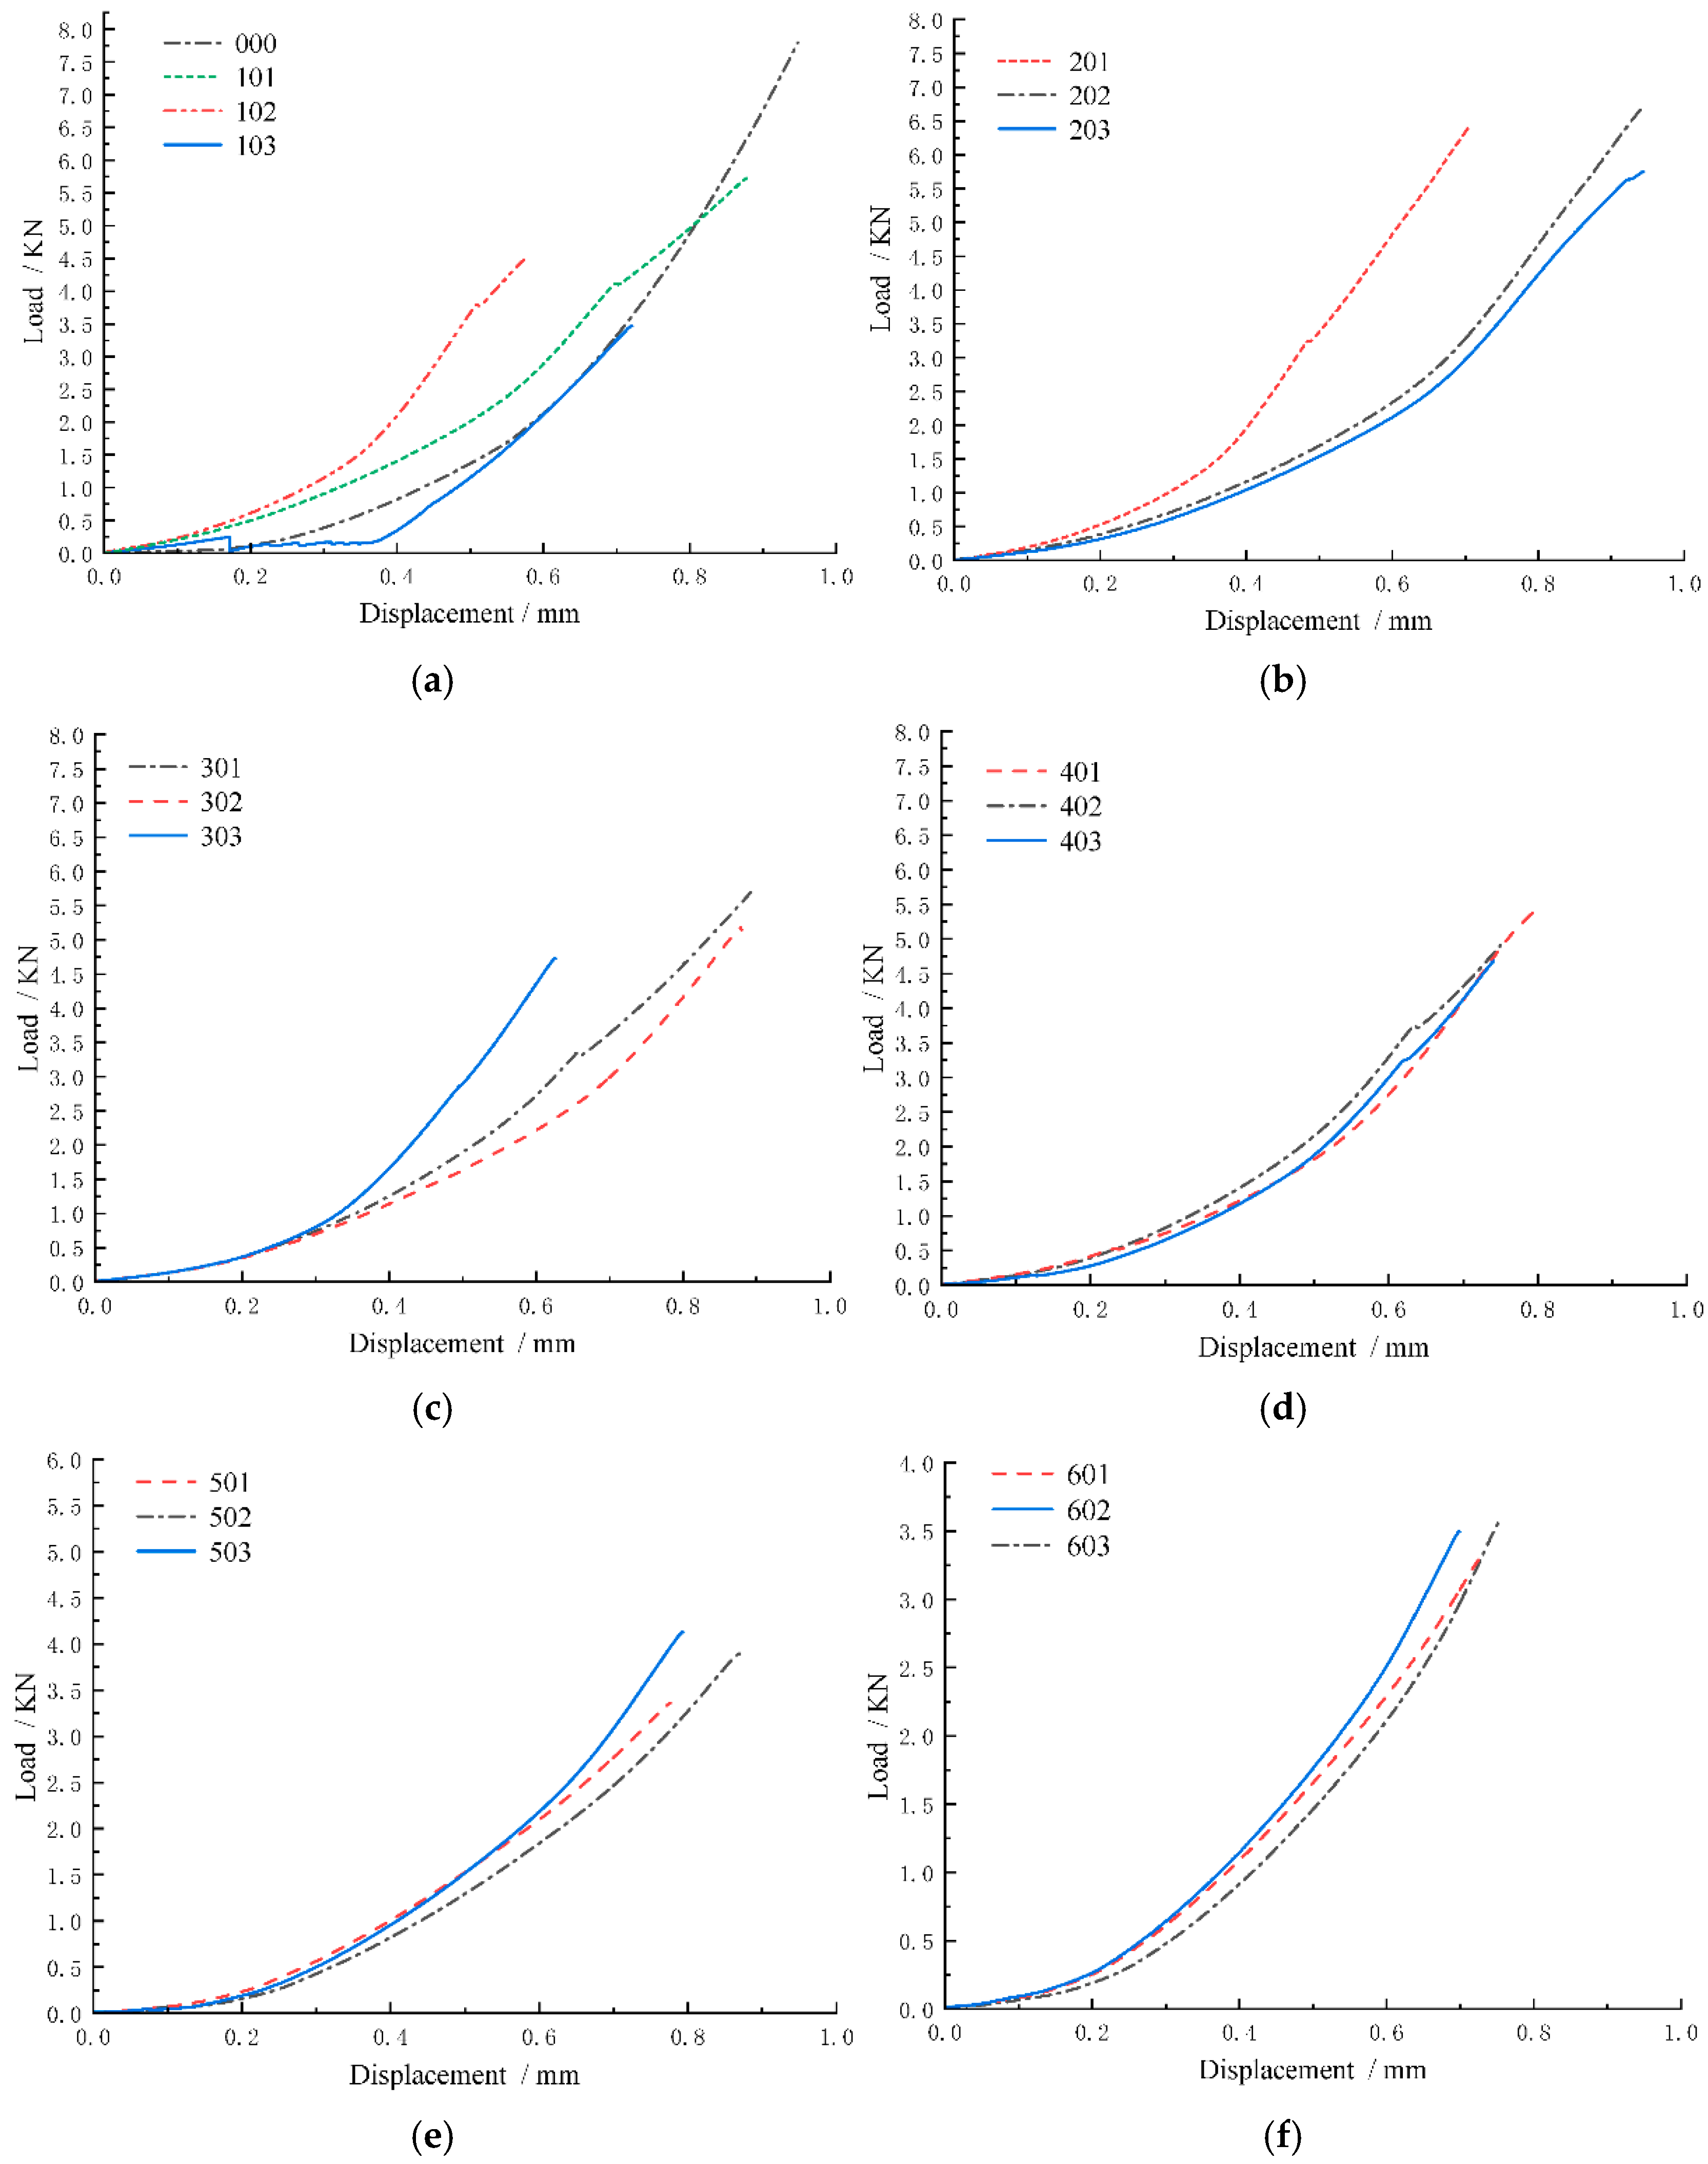
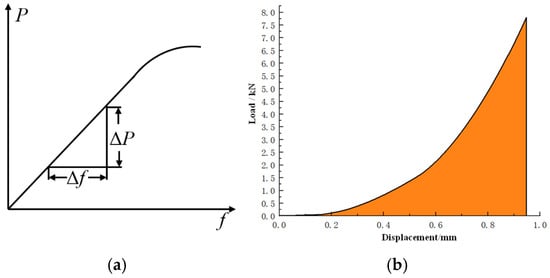
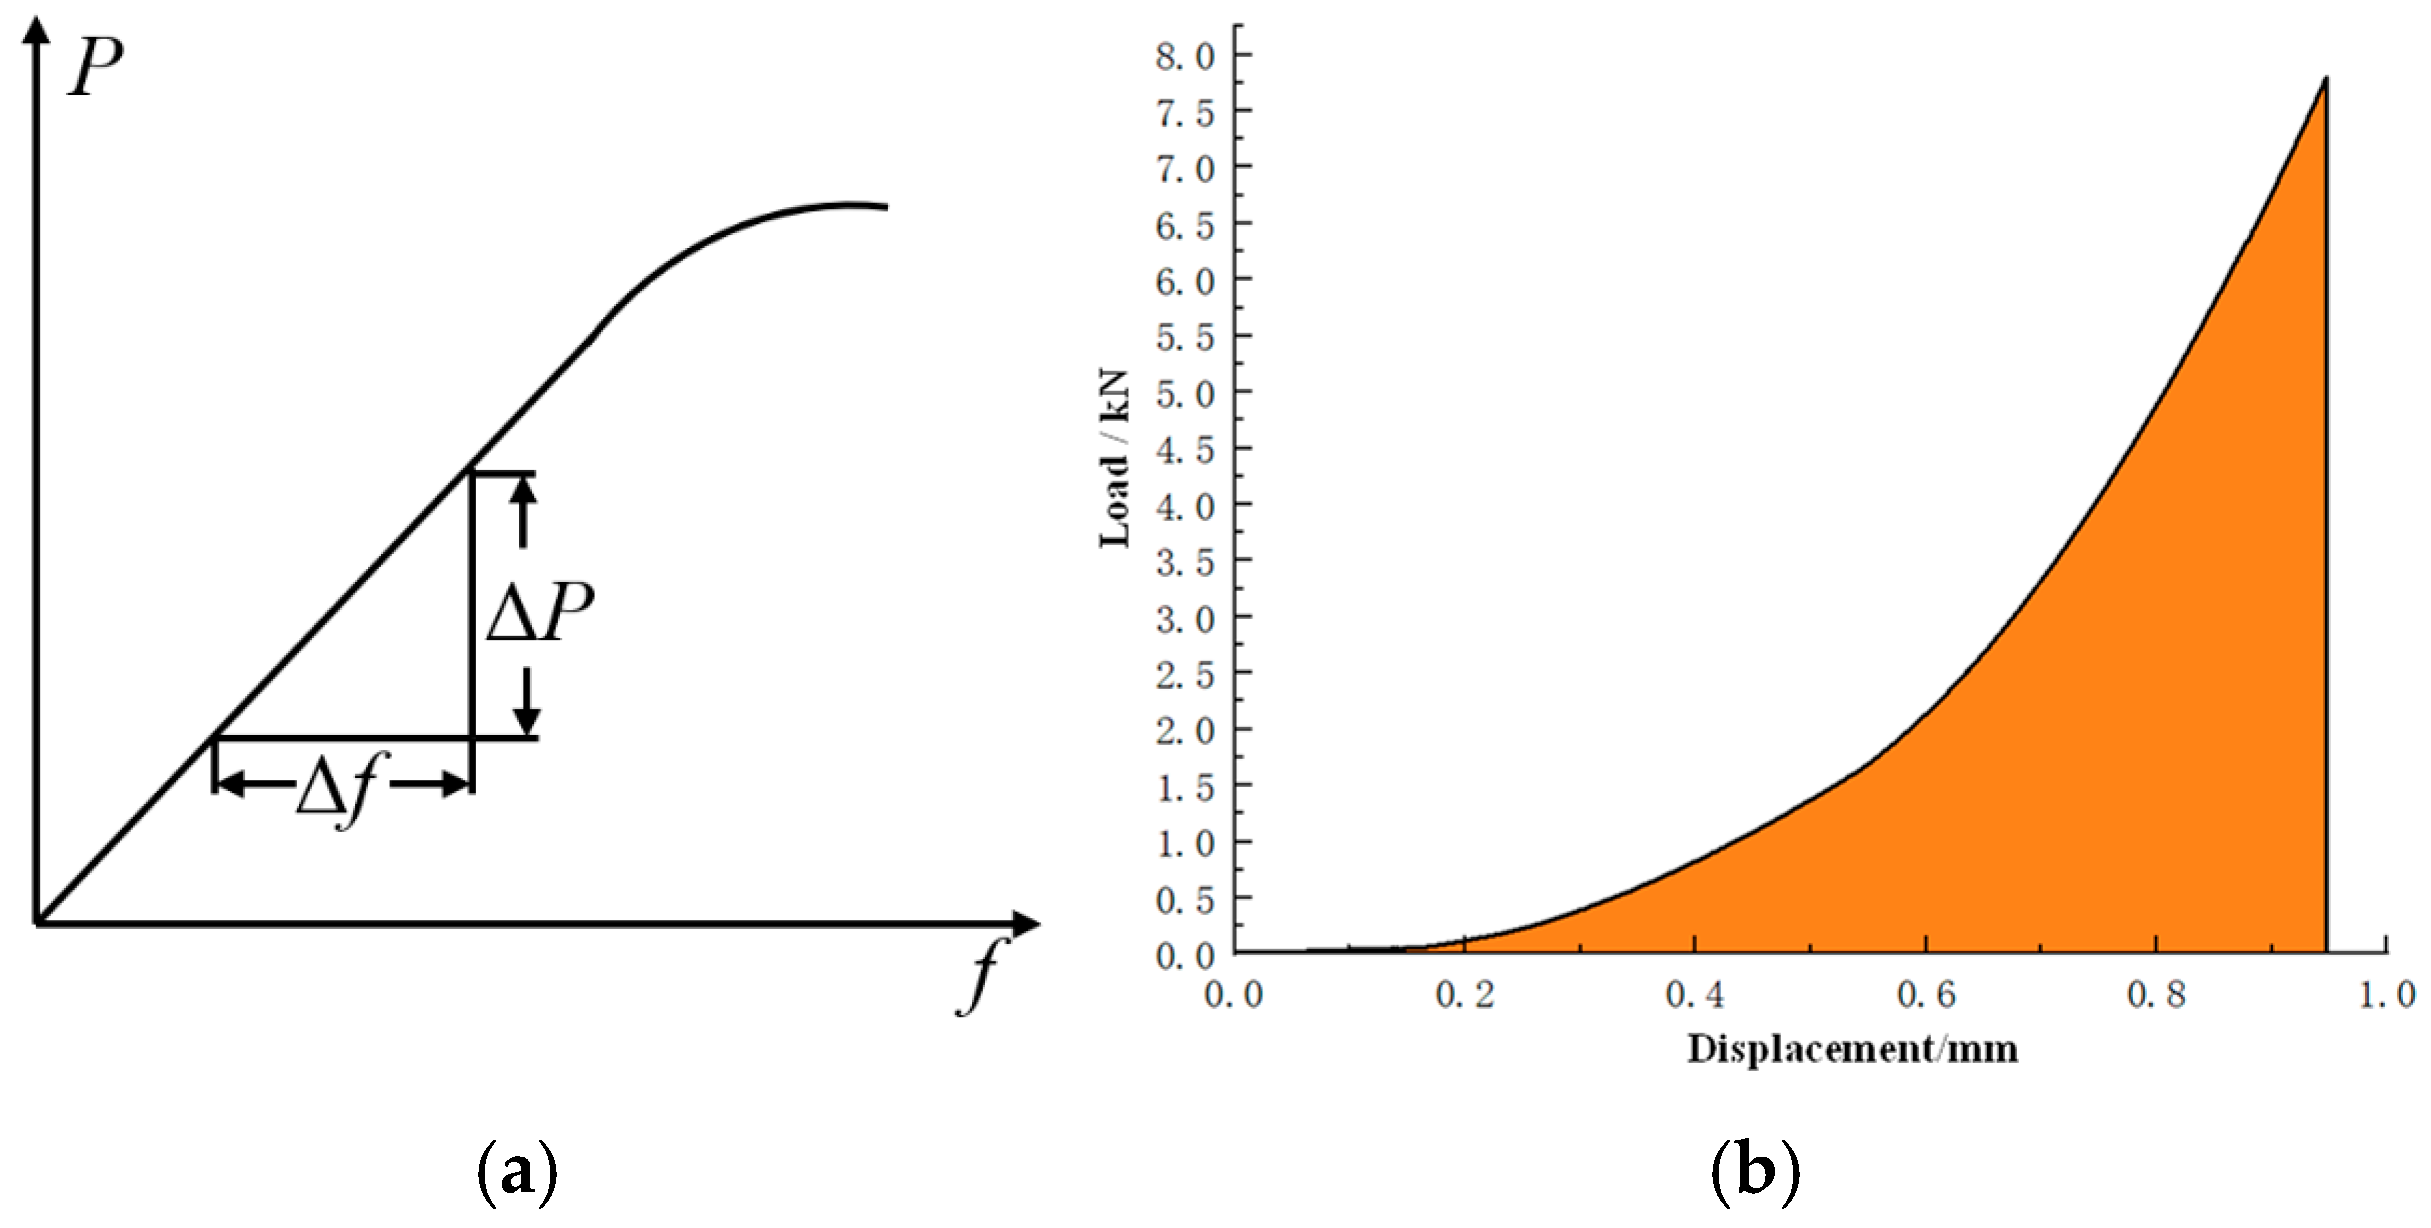
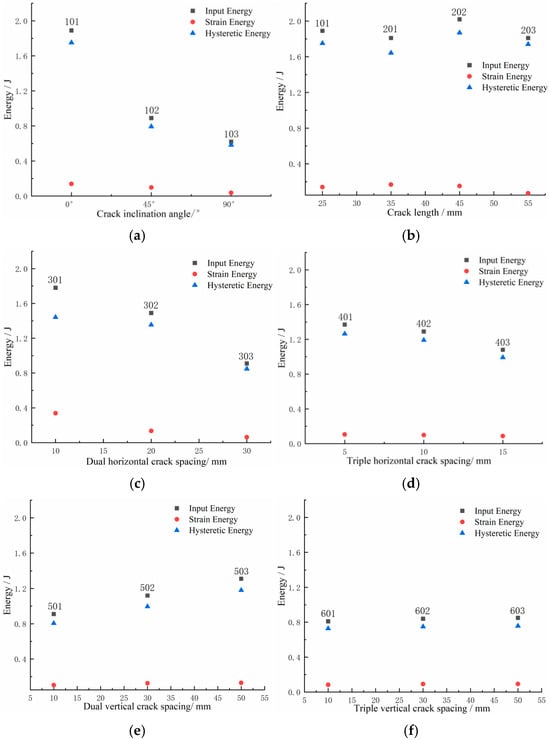
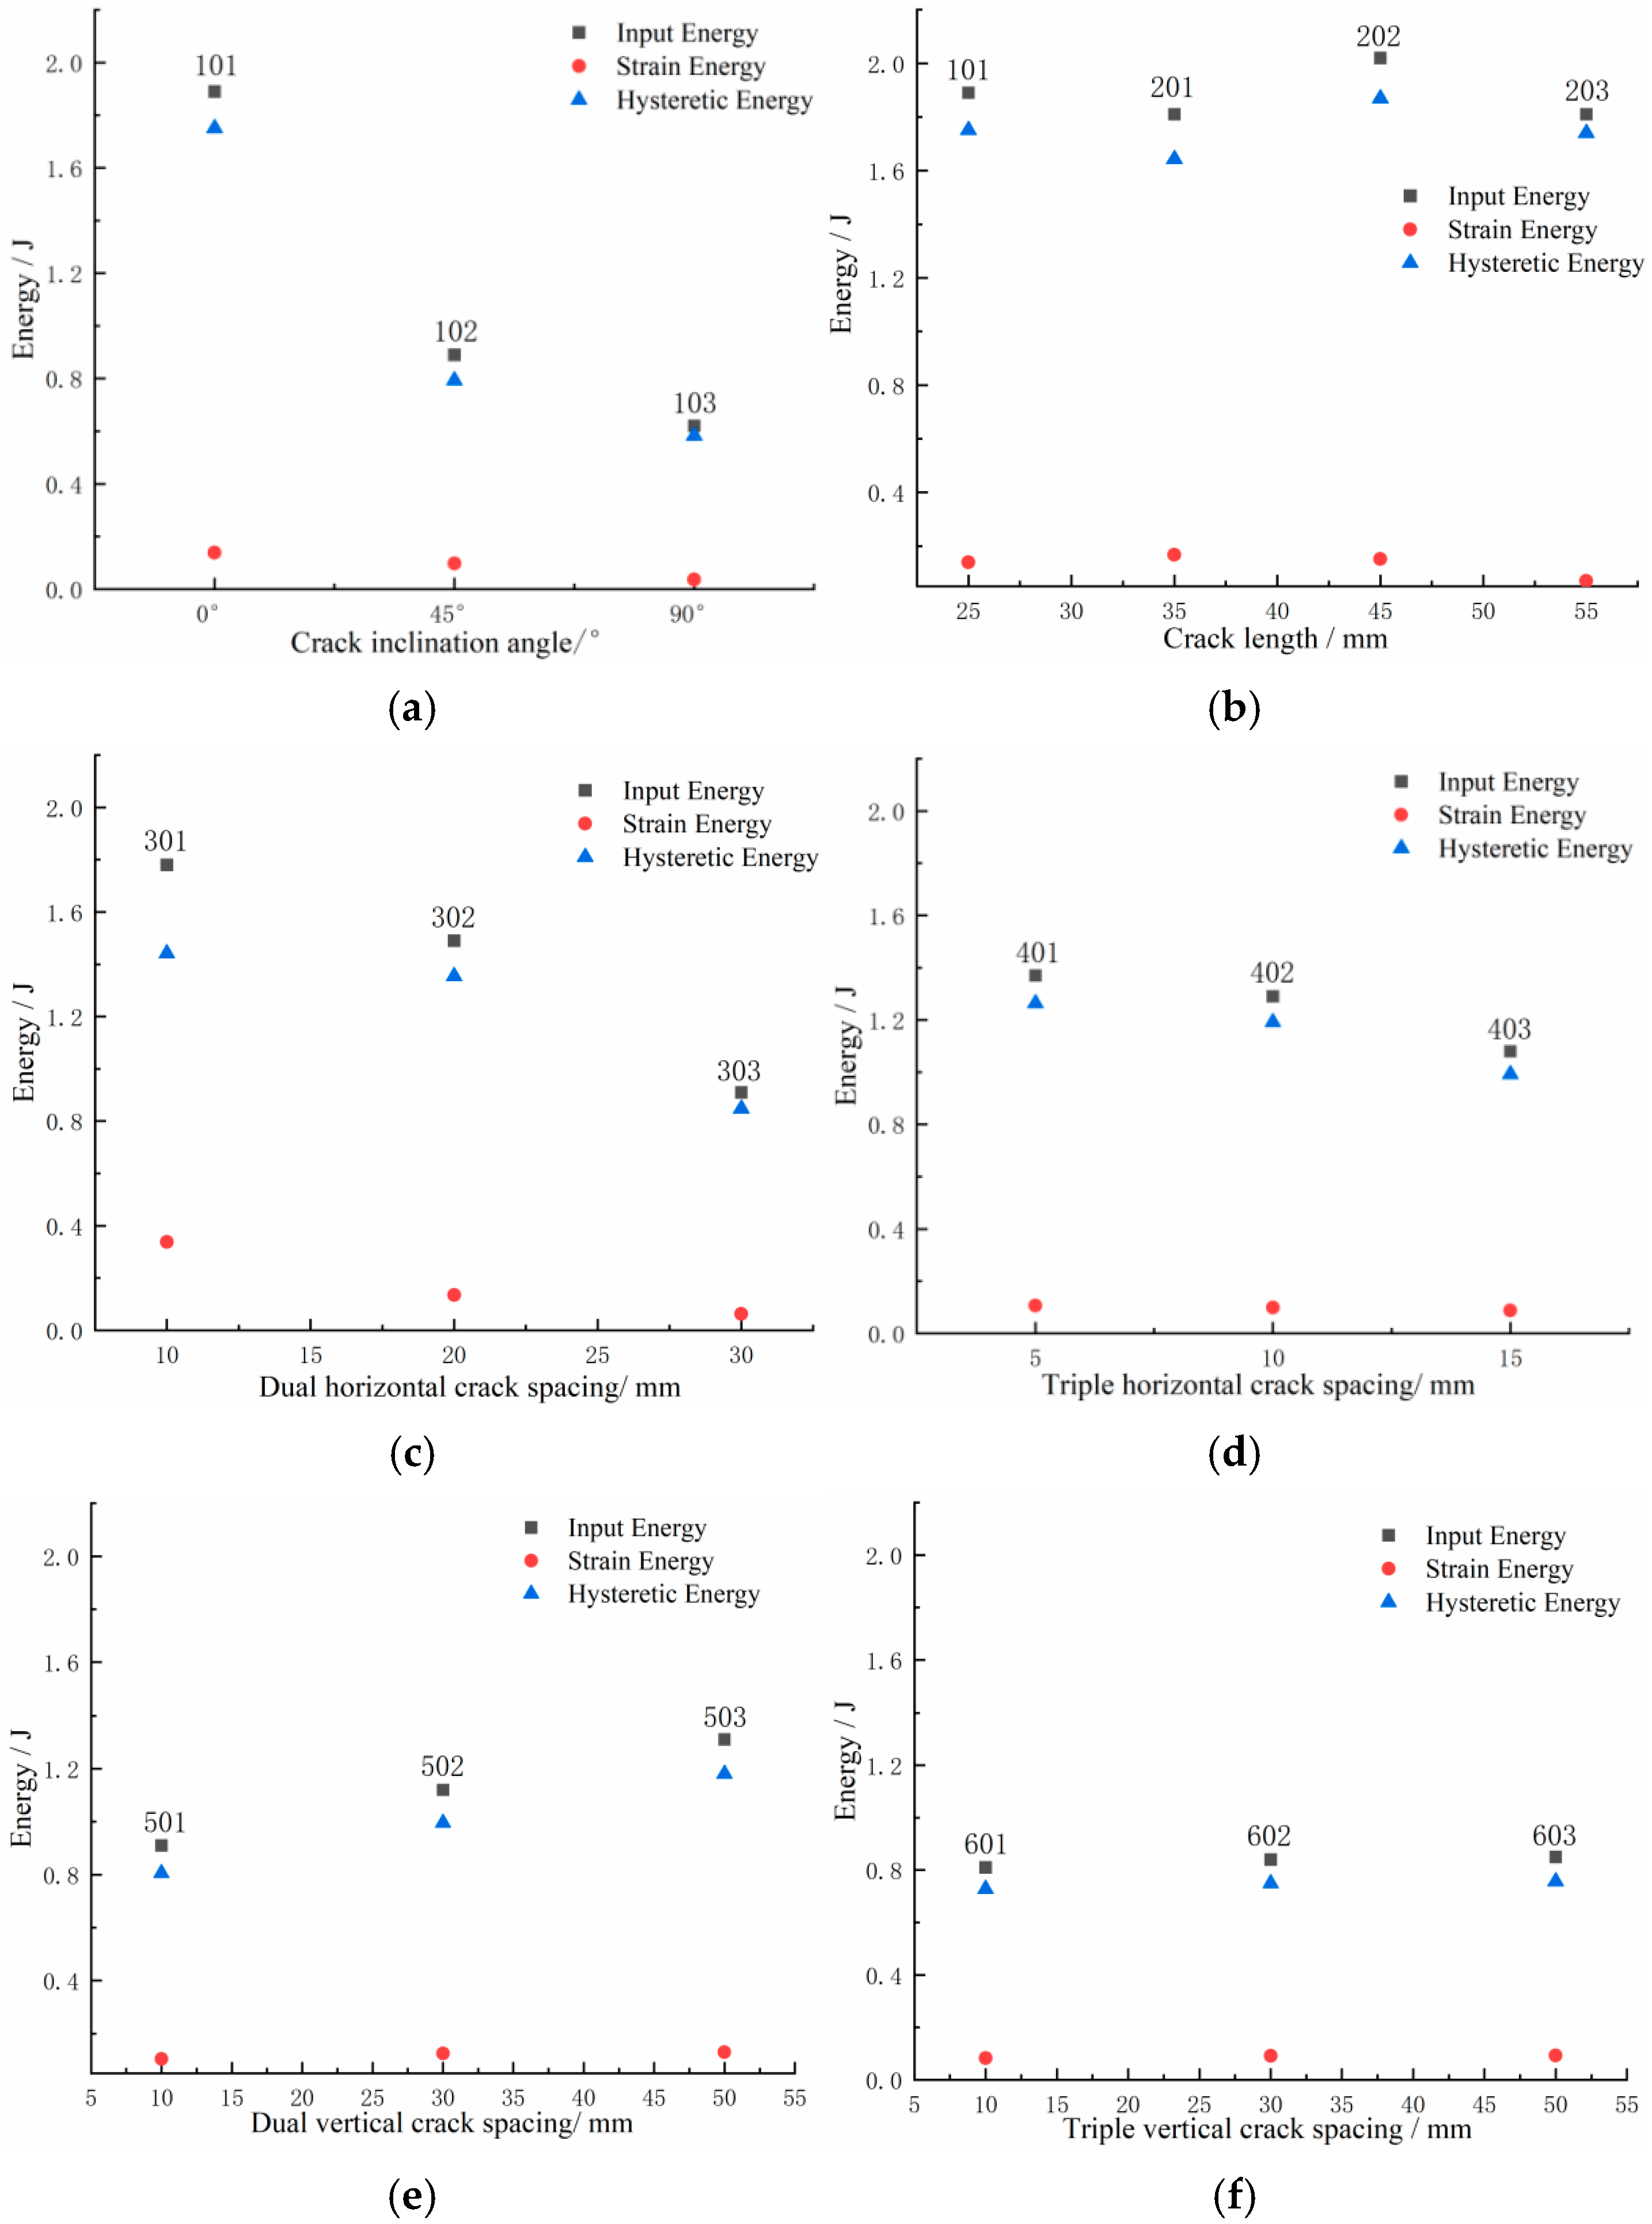
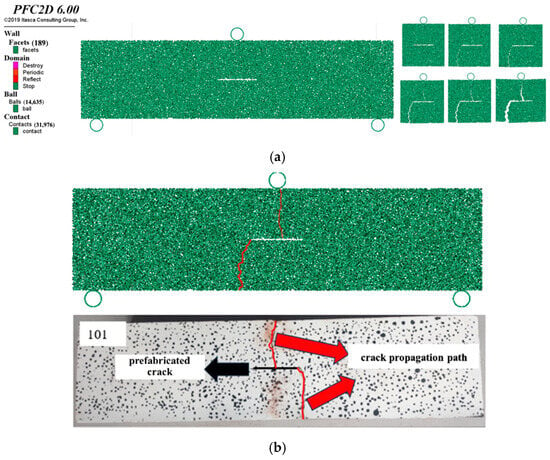
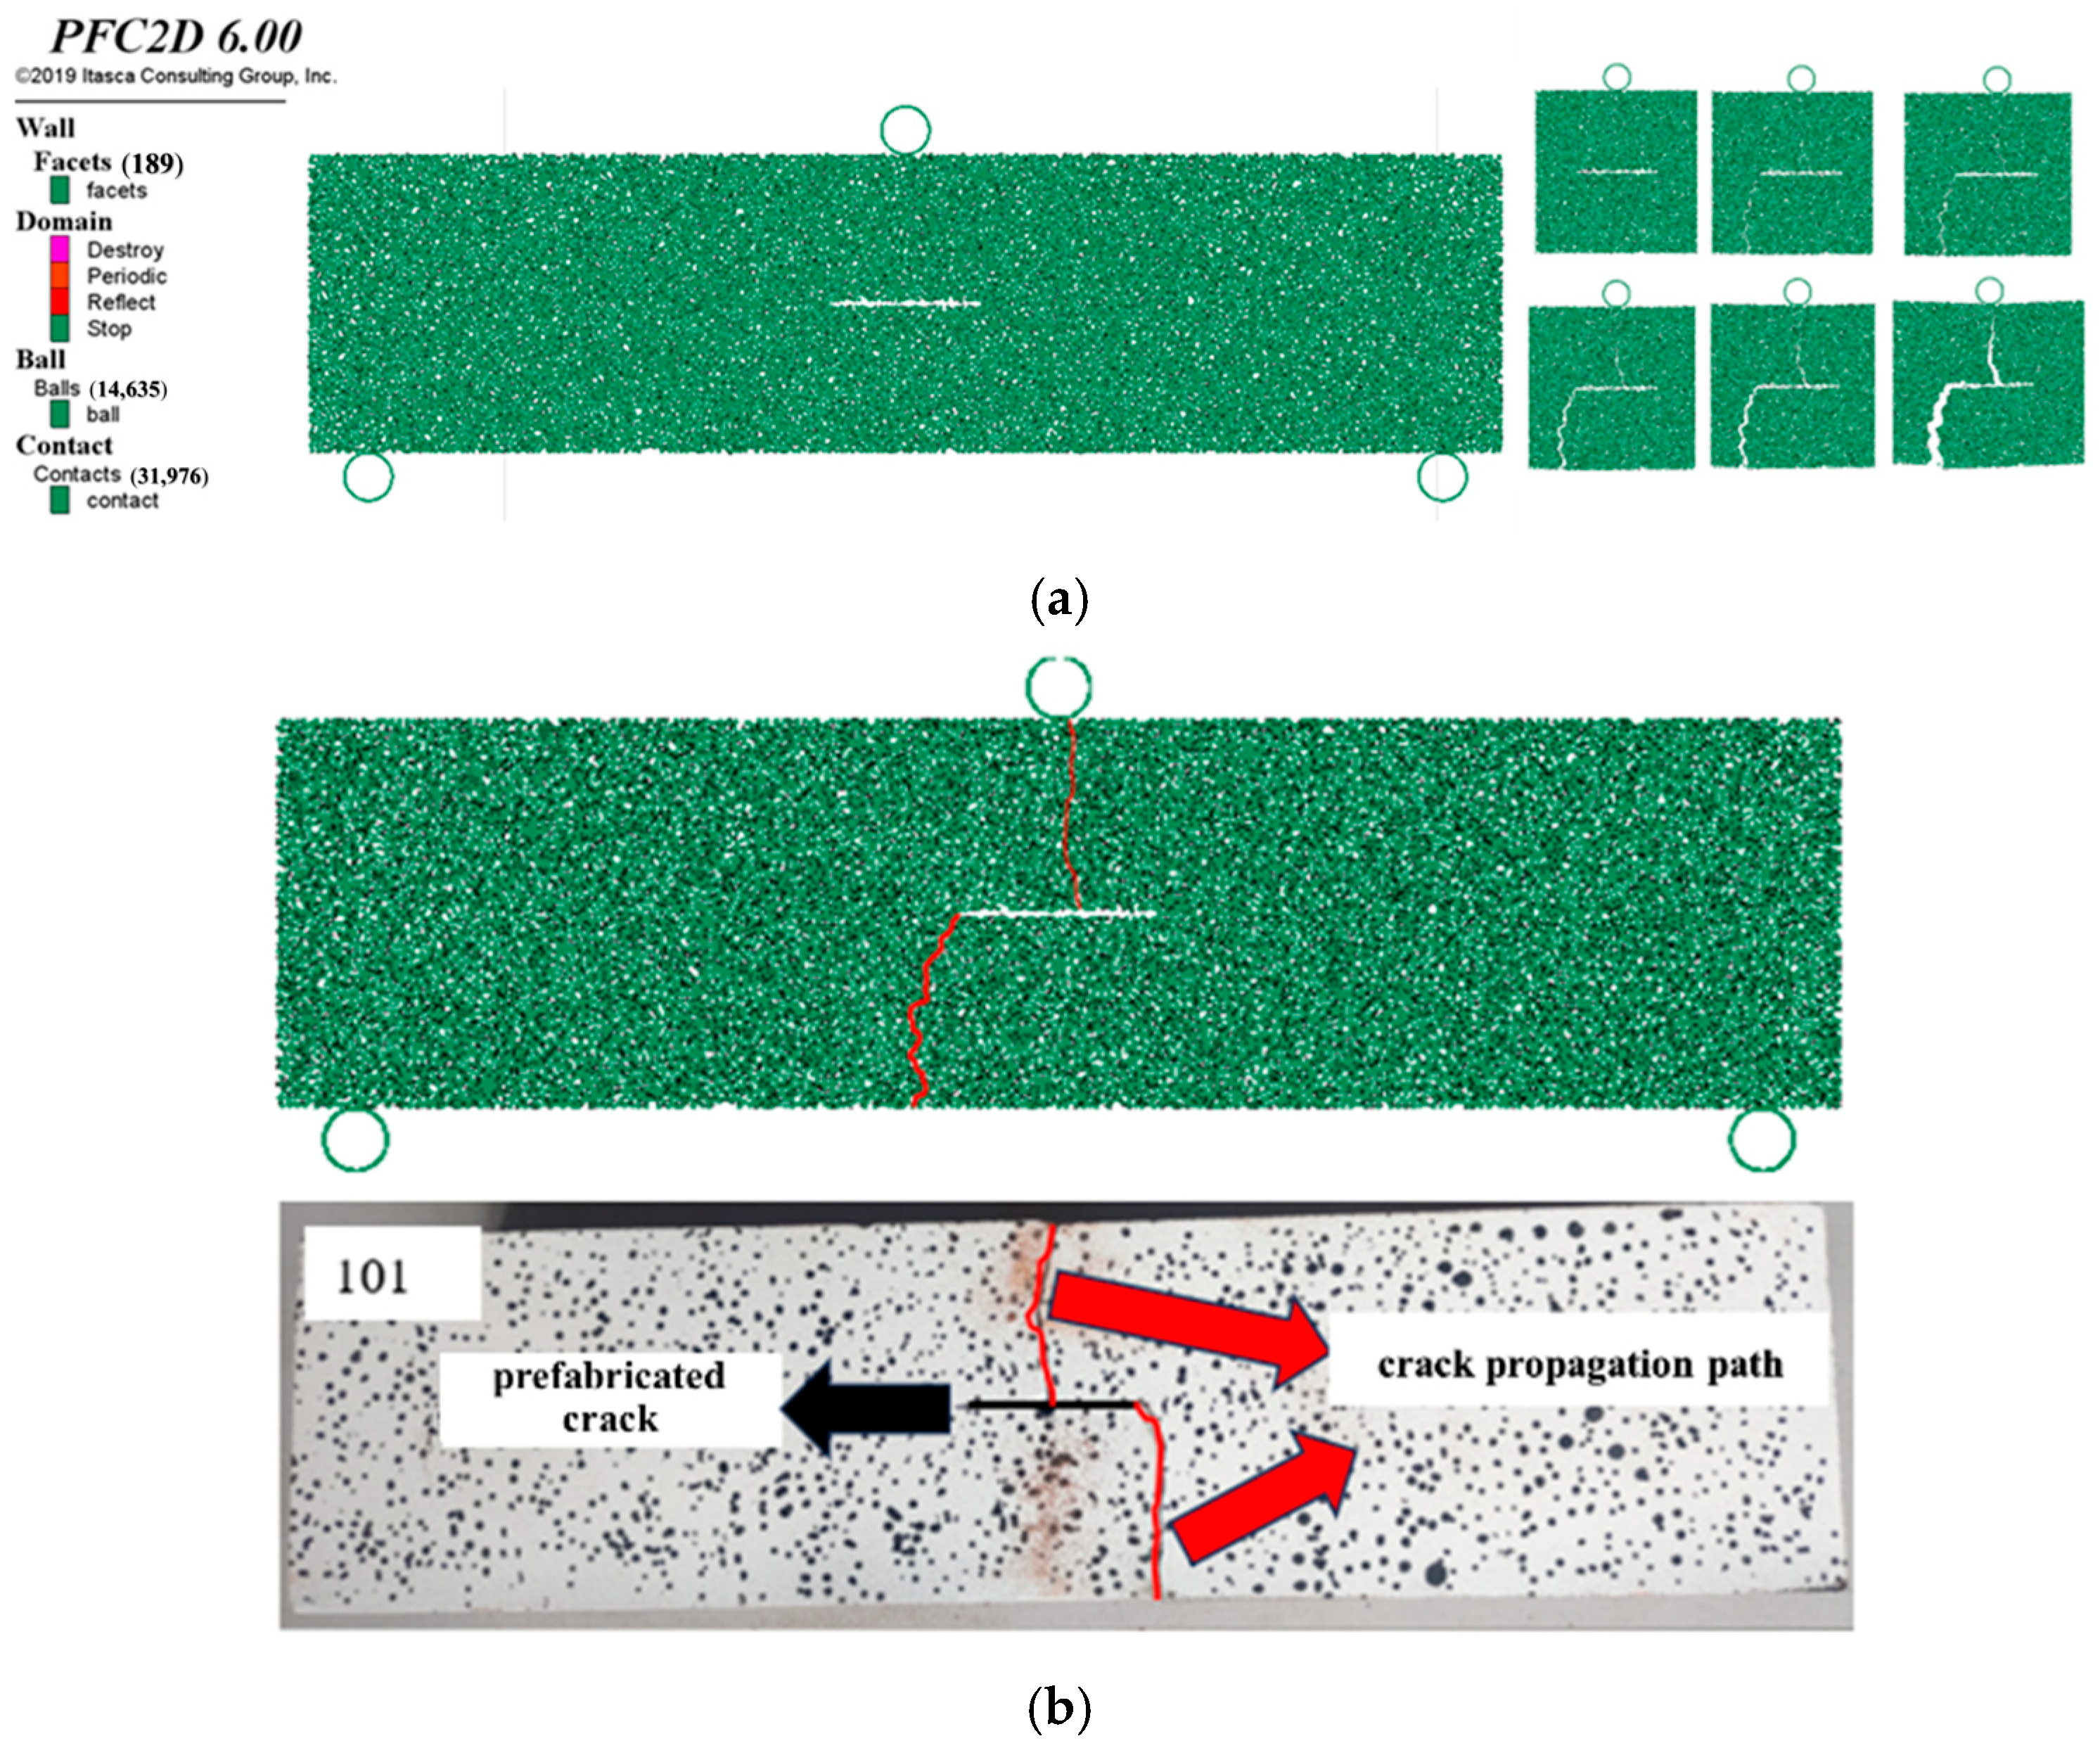
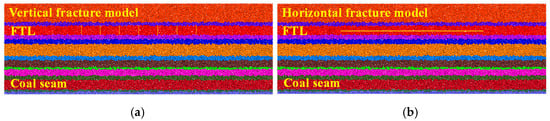
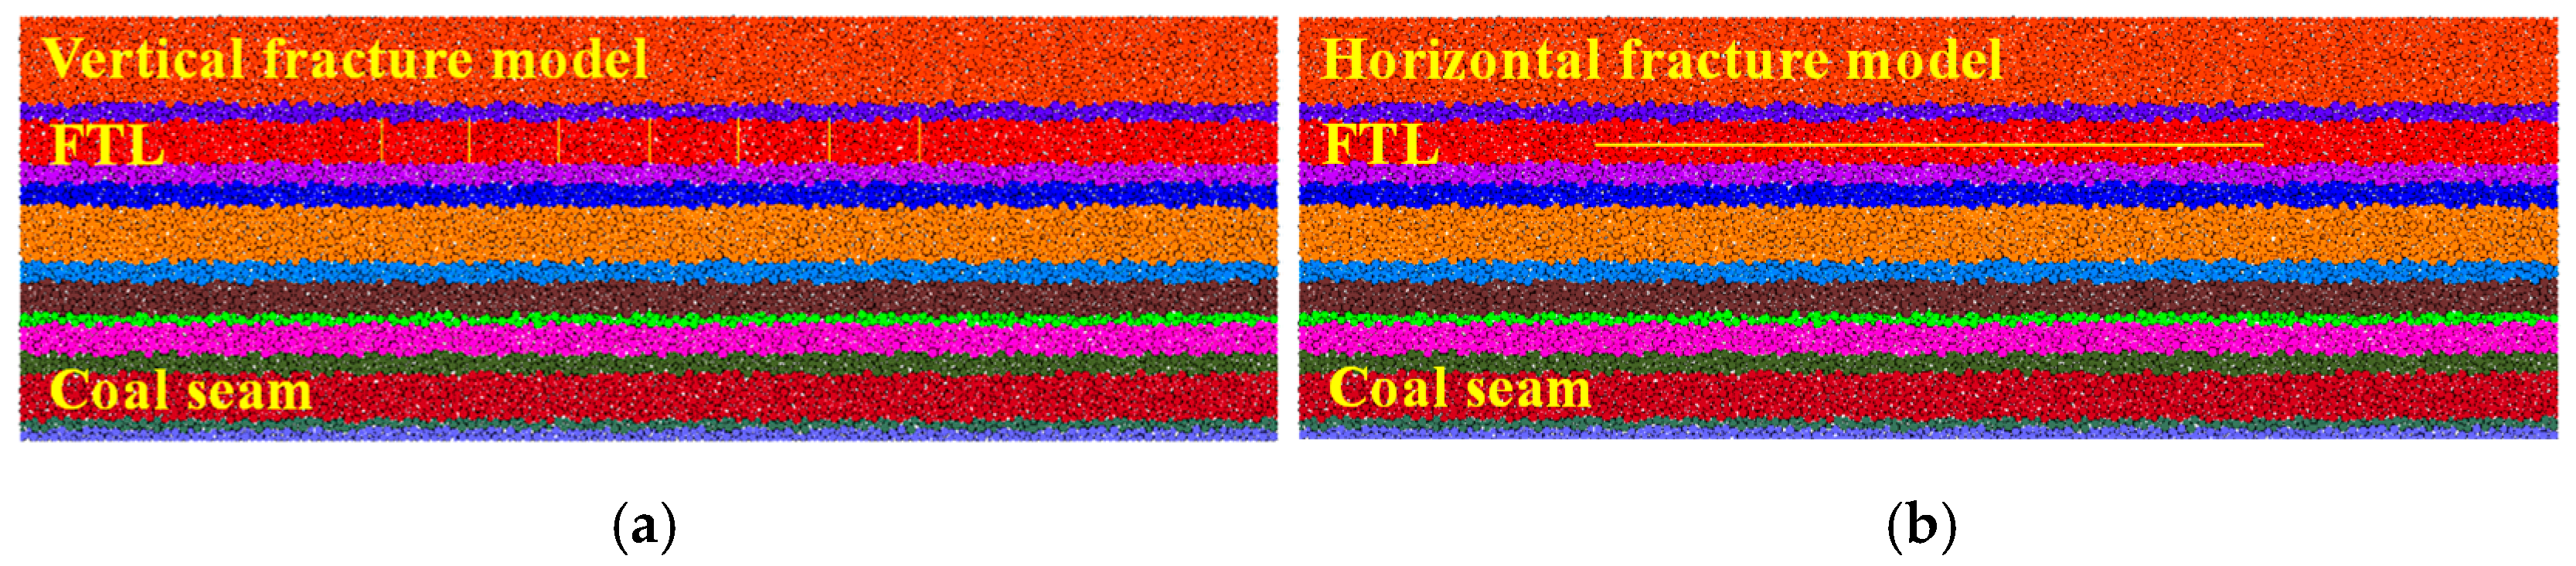
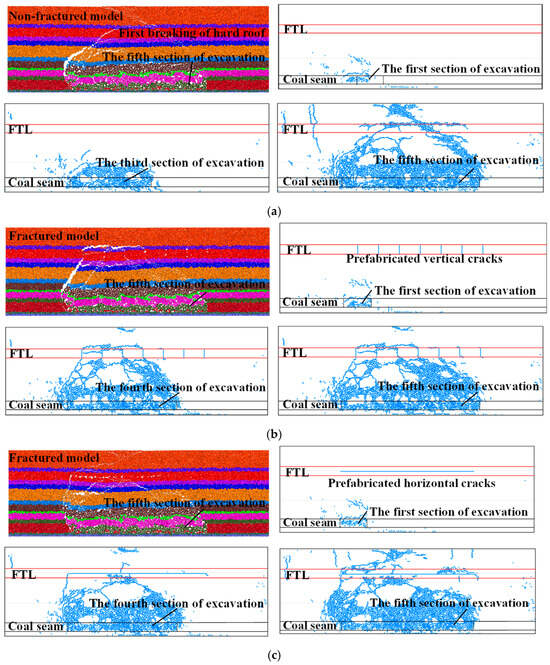
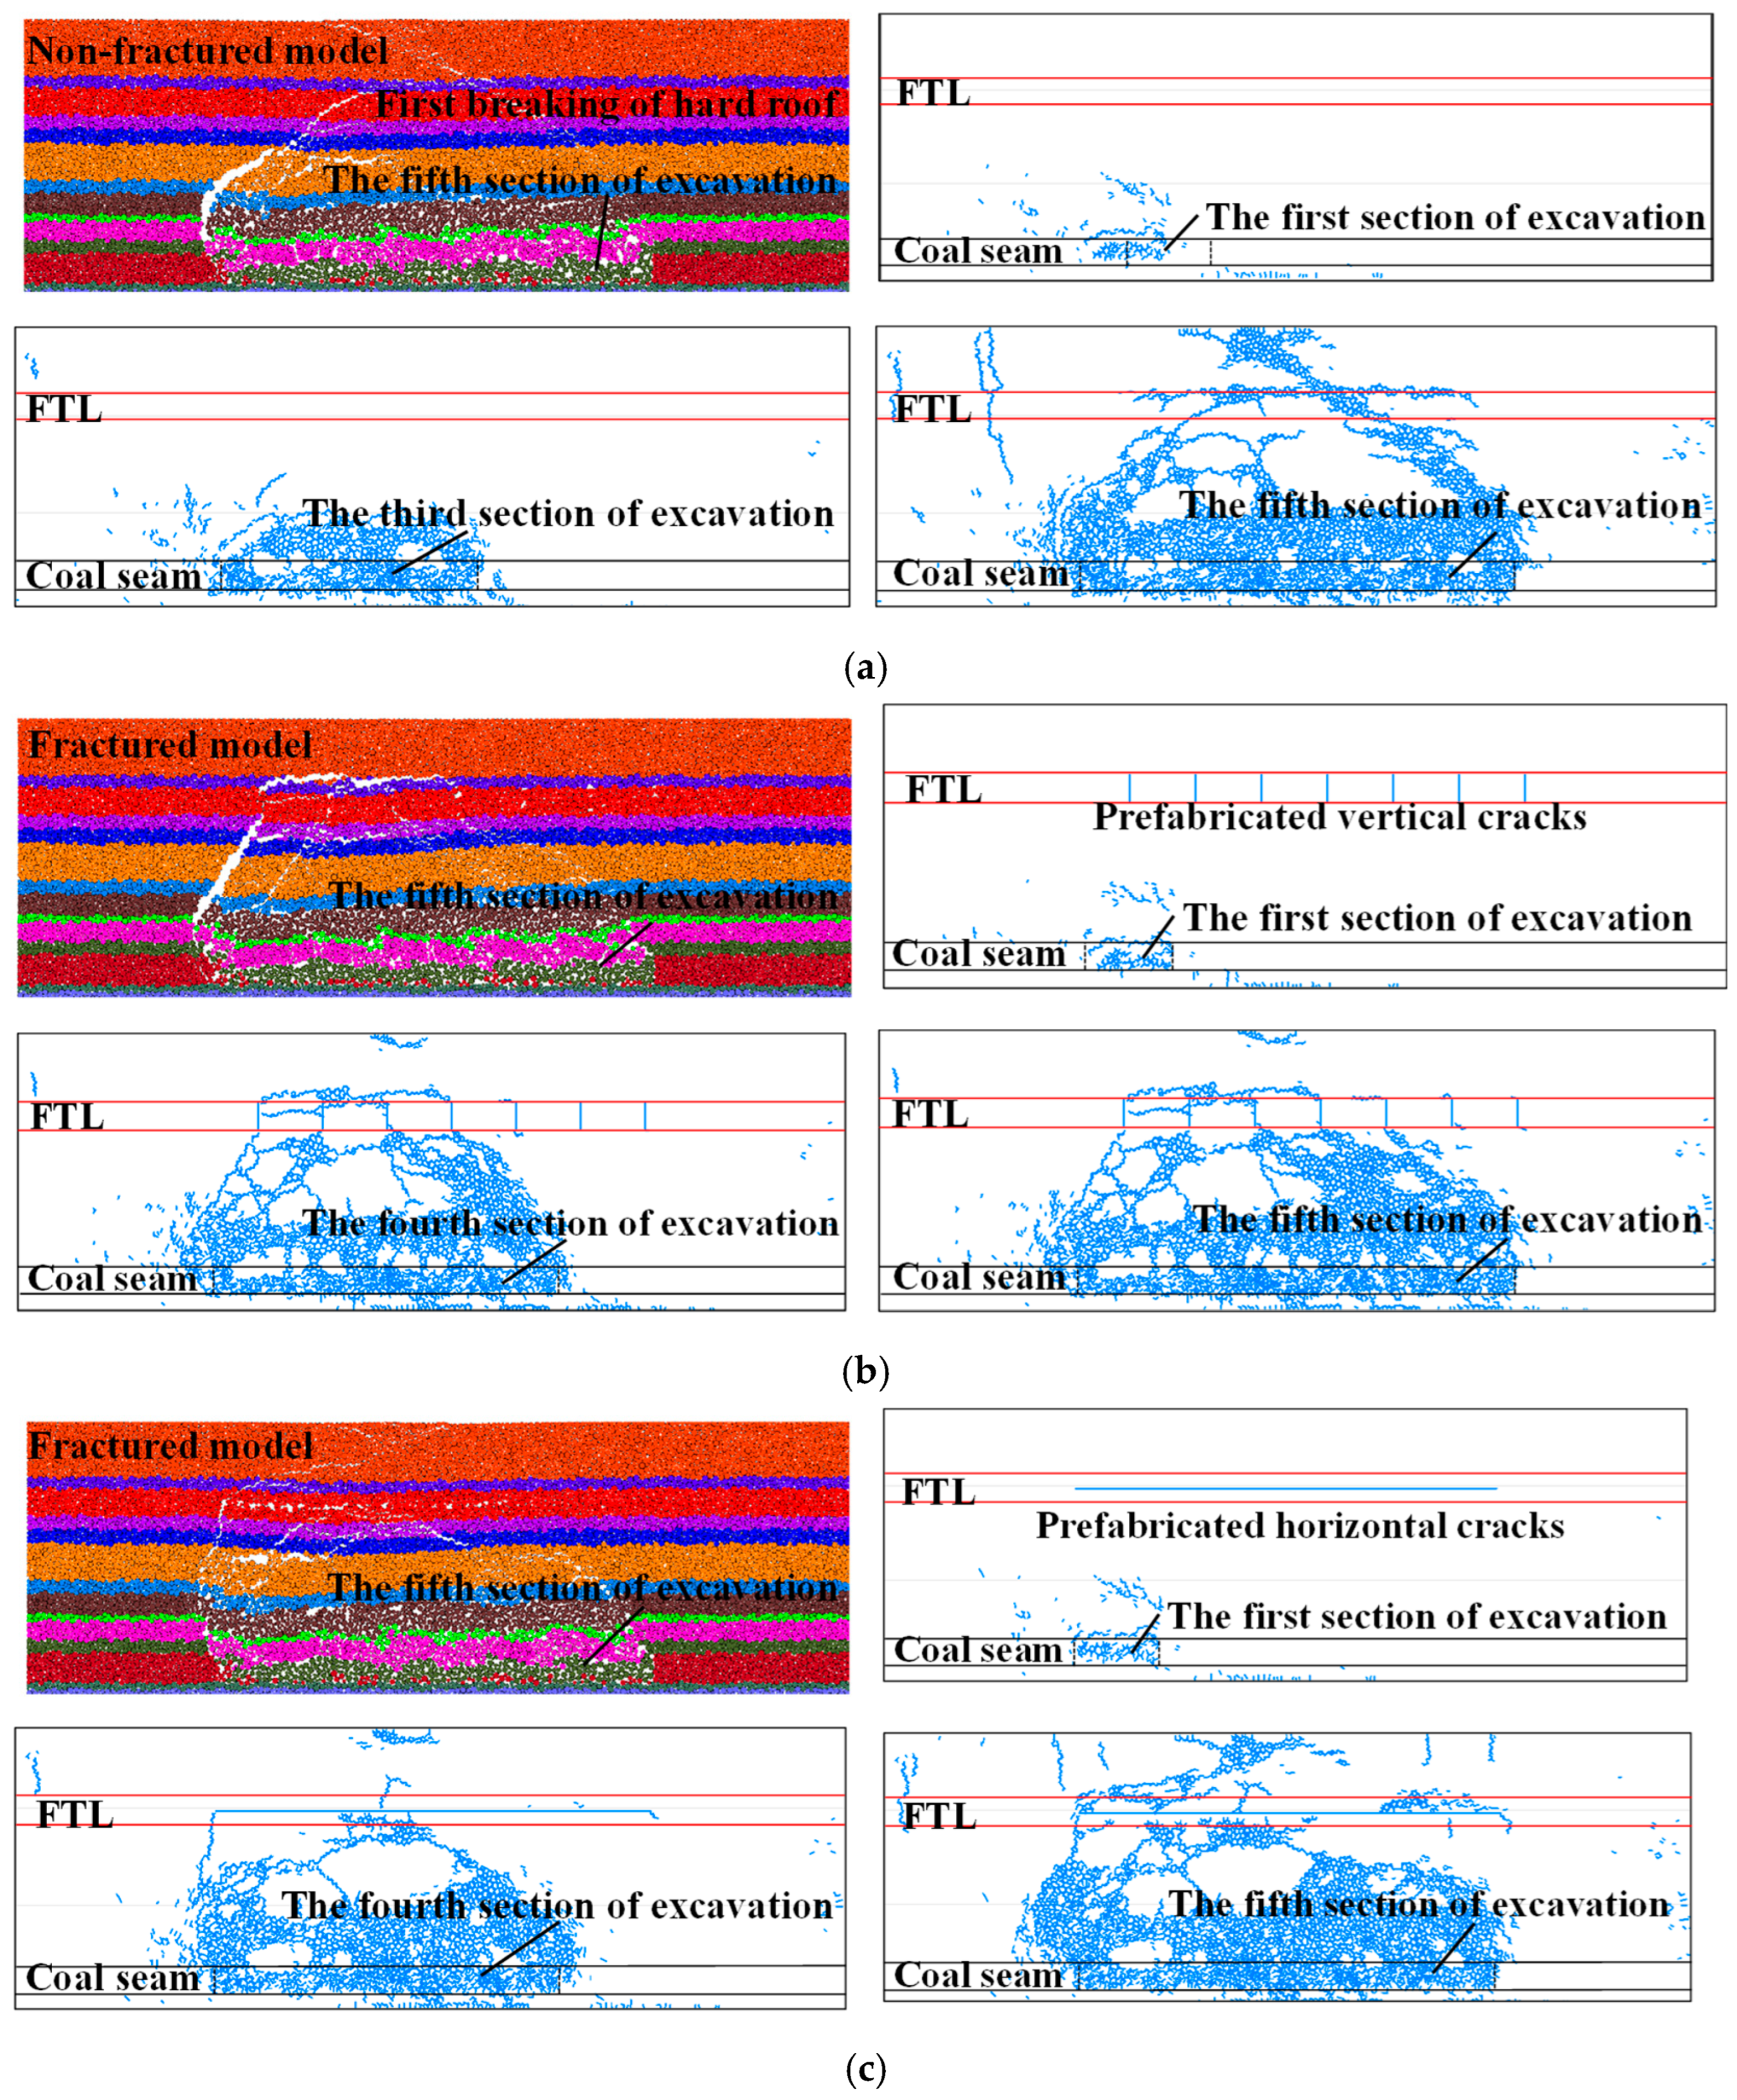
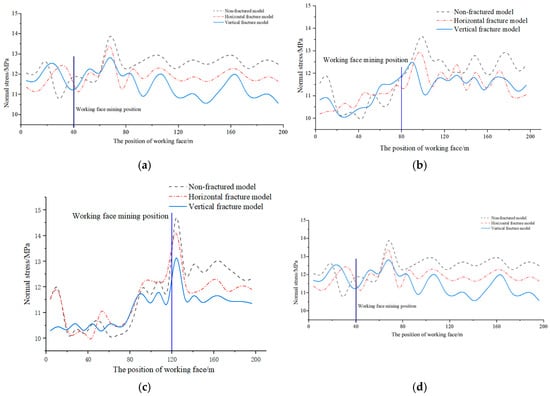
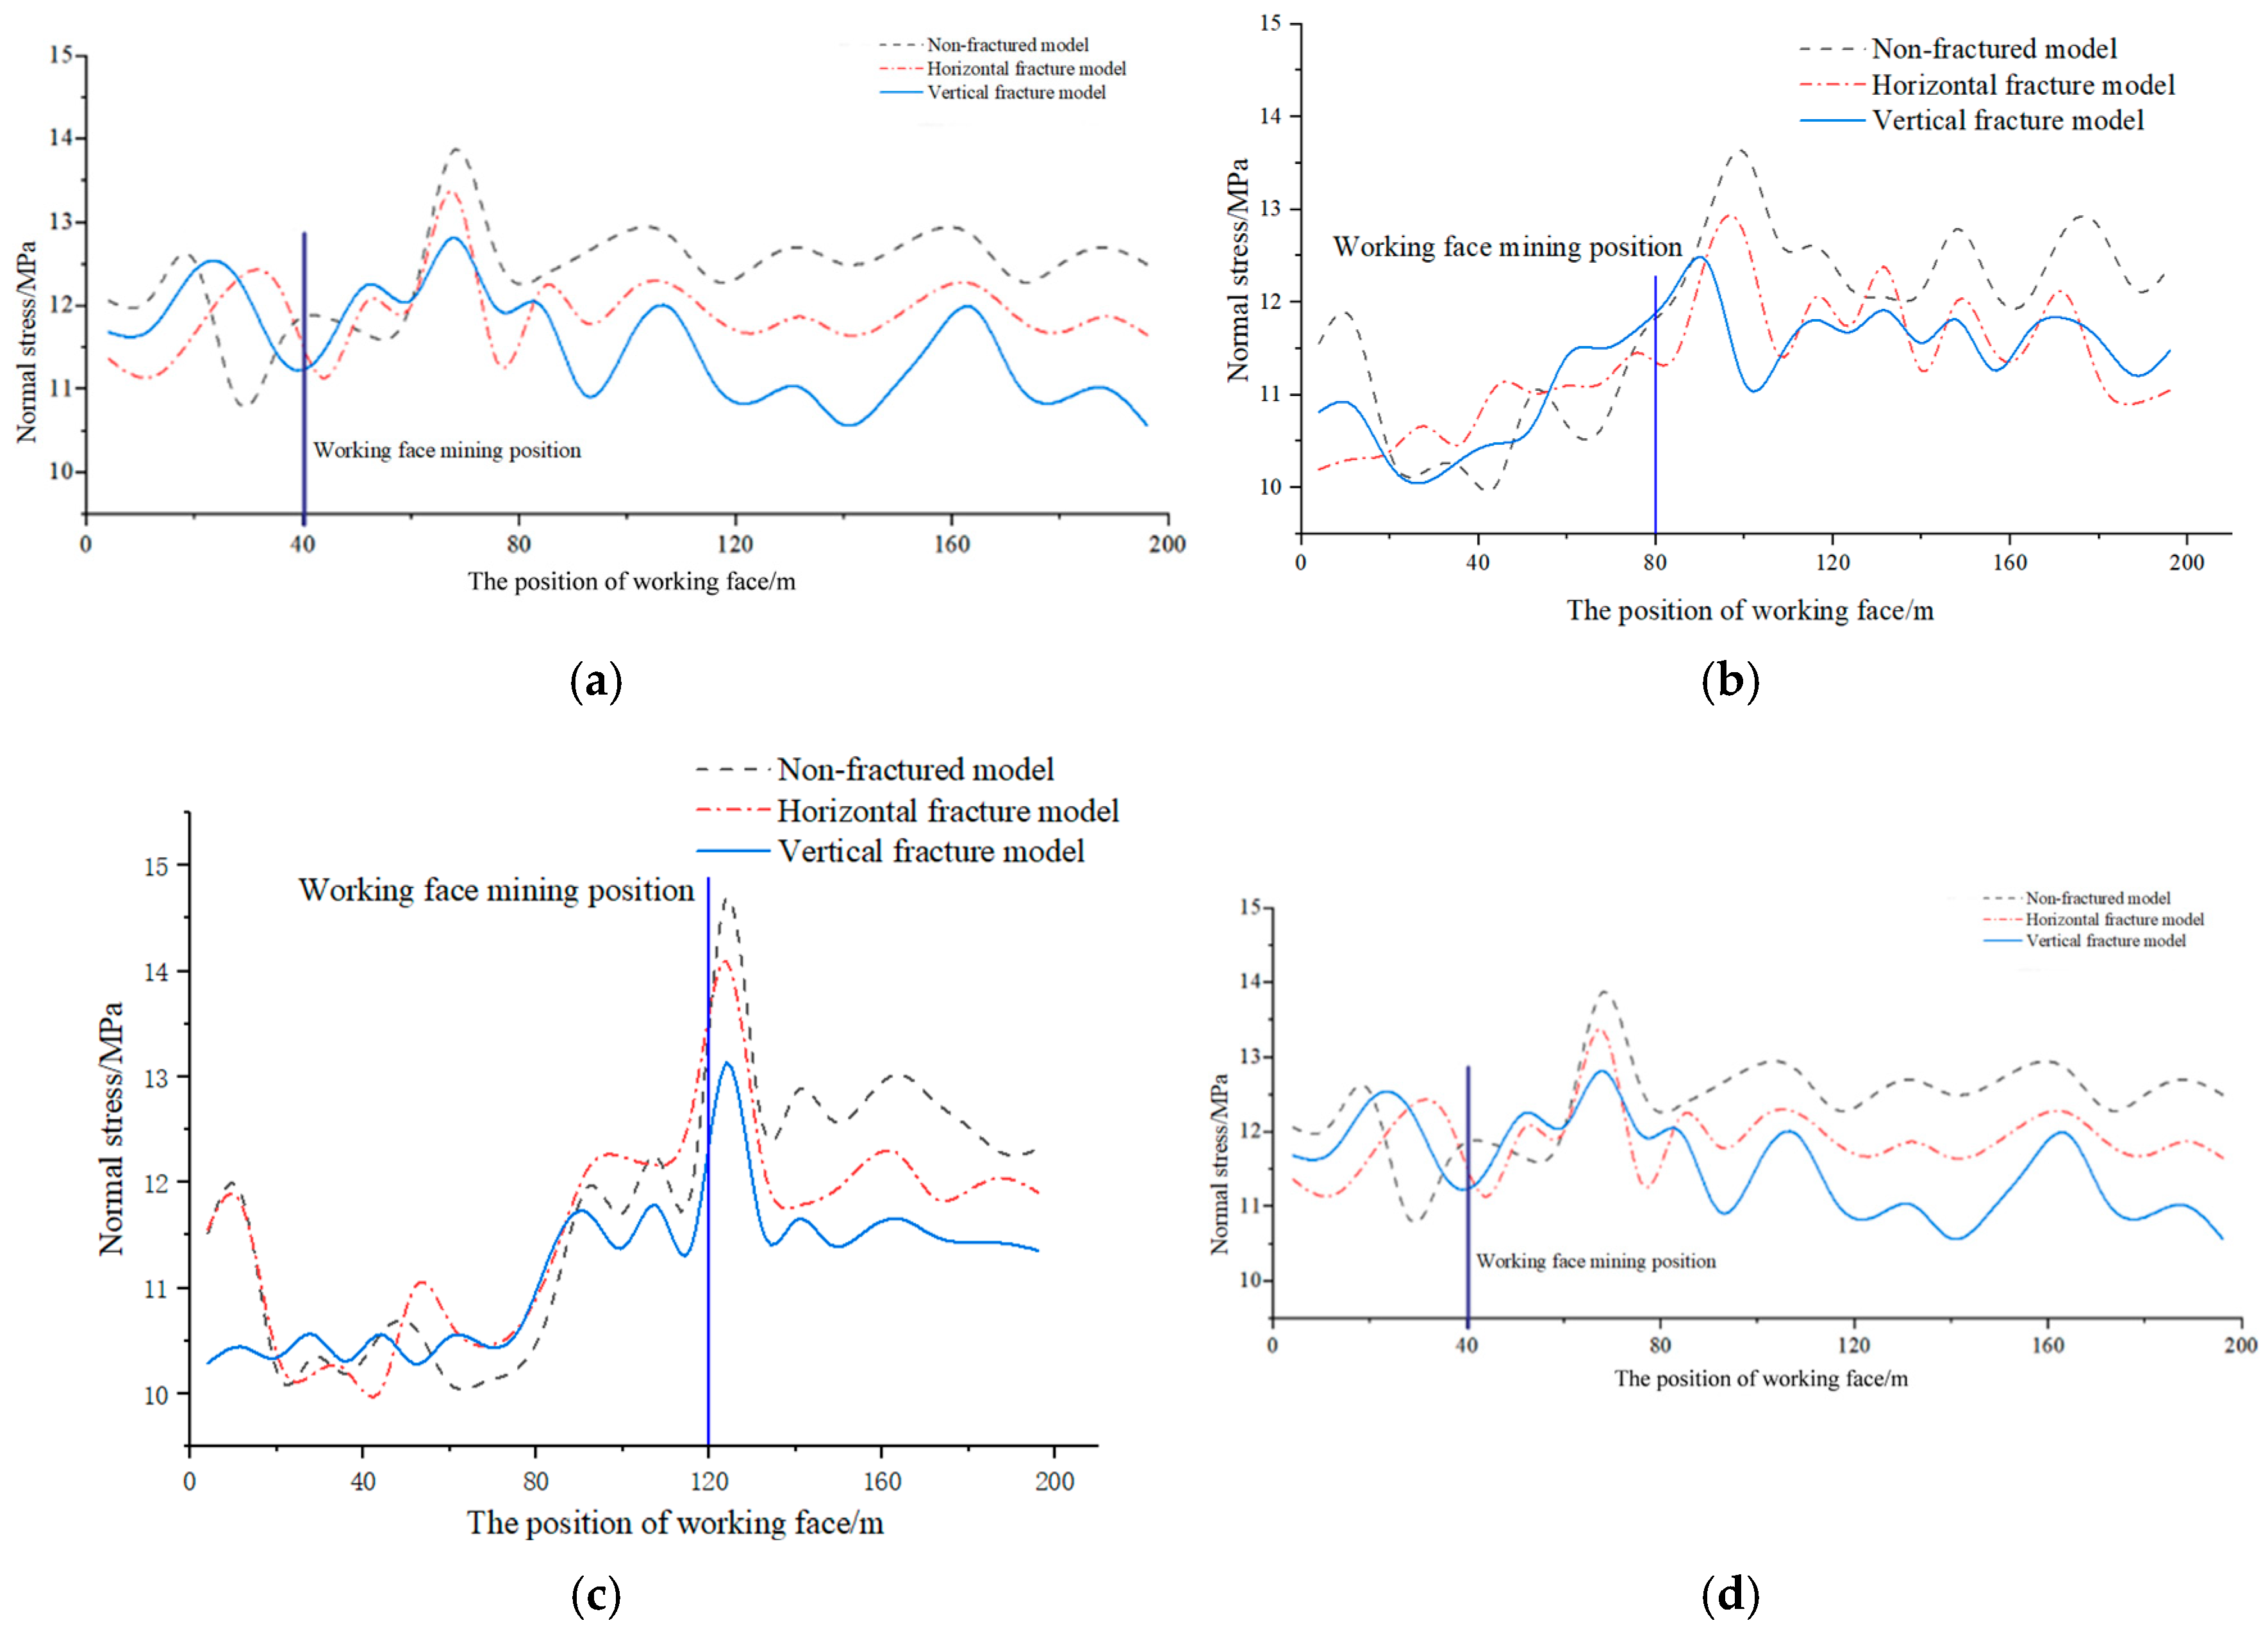
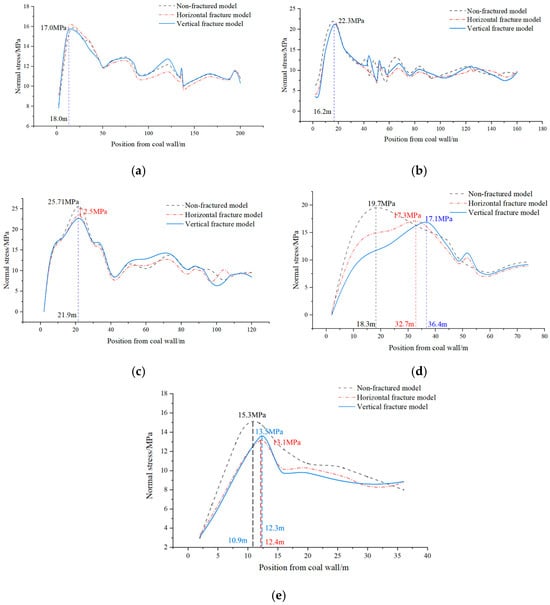
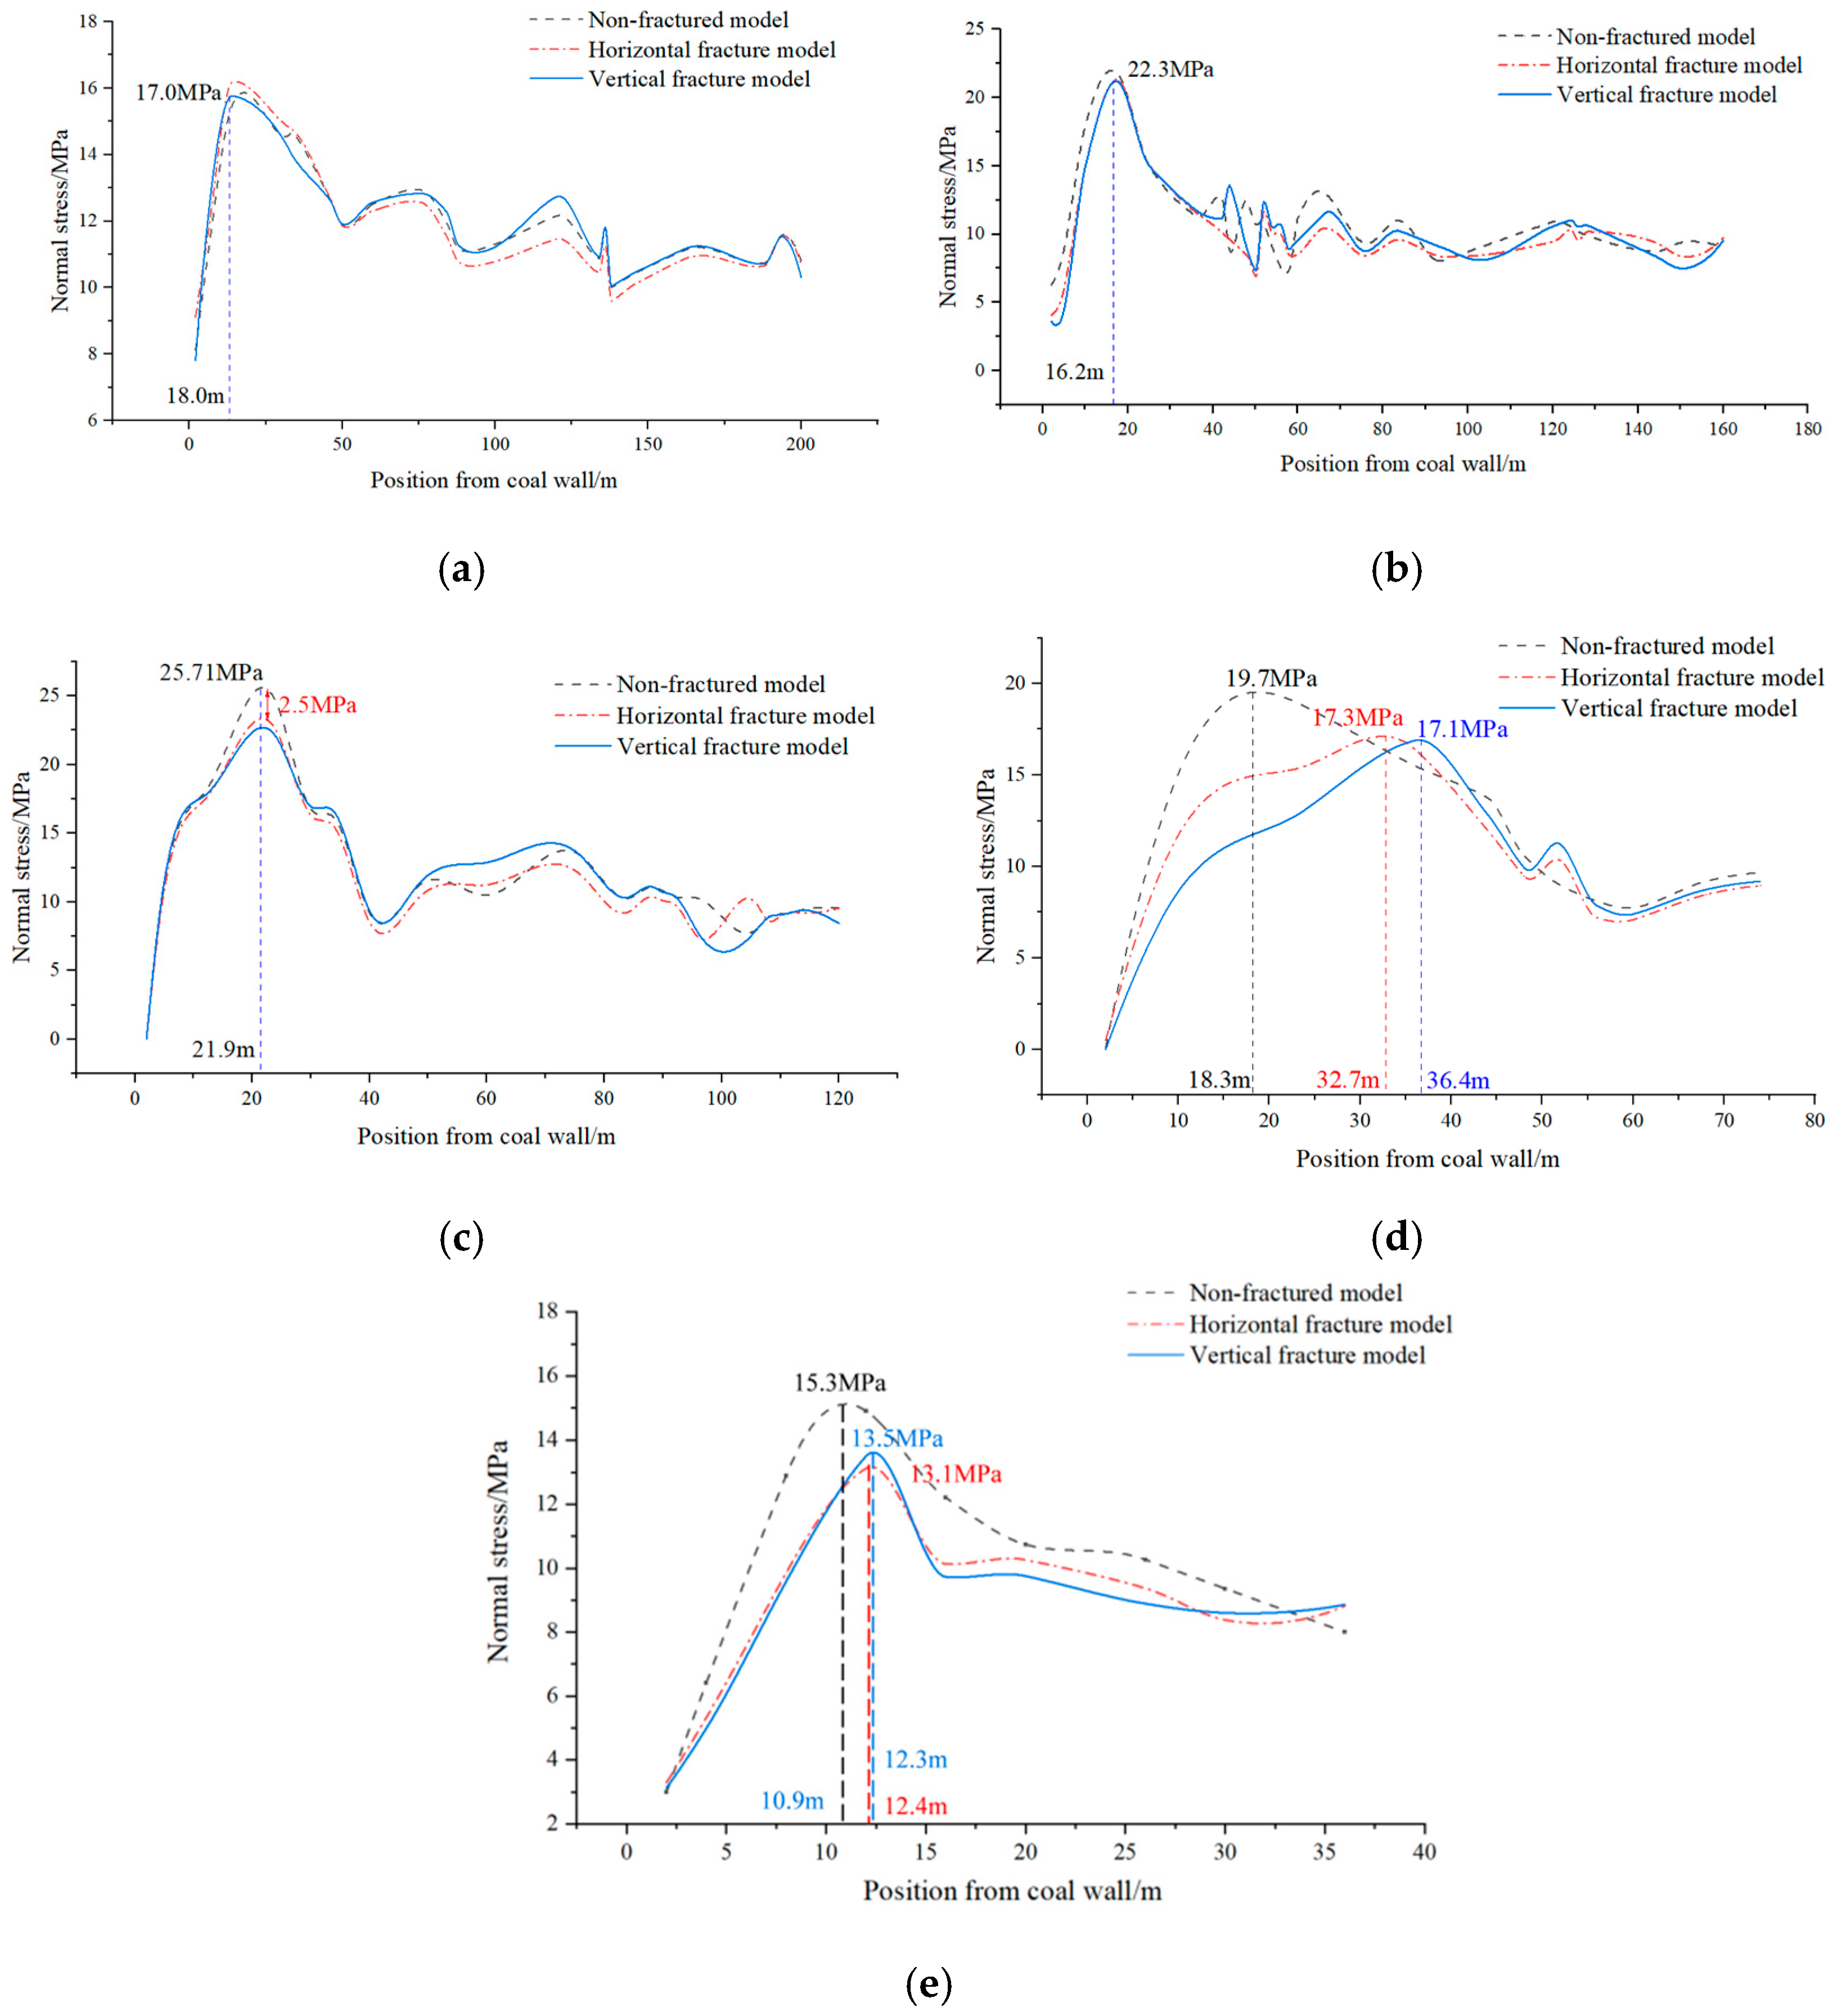

Disclaimer/Publisher’s Note: The statements, opinions and data contained in all publications are solely those of the individual author(s) and contributor(s) and not of MDPI and/or the editor(s). MDPI and/or the editor(s) disclaim responsibility for any injury to people or property resulting from any ideas, methods, instructions or products referred to in the content. |
© 2026 by the authors. Licensee MDPI, Basel, Switzerland. This article is an open access article distributed under the terms and conditions of the Creative Commons Attribution (CC BY) license.